Research Discussion Paper - Reserve Bank of Australia Discussion Paper ... David Wakeling and...
41
Research Discussion Paper Why Do Companies Hold Cash? Gianni La Cava and Callan Windsor RDP 2016-03
Transcript of Research Discussion Paper - Reserve Bank of Australia Discussion Paper ... David Wakeling and...

Research Discussion Paper
Why Do Companies Hold Cash?
Gianni La Cava and Callan Windsor
RDP 2016-03

Figures in this publication were generated using Mathematica.
The contents of this publication shall not be reproduced, sold or distributed without the prior consent of the Reserve Bank of Australia and, where applicable, the prior consent of the external source concerned. Requests for consent should be sent to the Secretary of the Bank at the email address shown above.
ISSN 1448-5109 (Online)
The Discussion Paper series is intended to make the results of the current economic research within the Reserve Bank available to other economists. Its aim is to present preliminary results of research so as to encourage discussion and comment. Views expressed in this paper are those of the authors and not necessarily those of the Reserve Bank. Use of any results from this paper should clearly attribute the work to the authors and not to the Reserve Bank of Australia.
Enquiries:
Phone: +61 2 9551 9830 Facsimile: +61 2 9551 8033 Email: [email protected] Website: http://www.rba.gov.au
Why Do Companies Hold Cash?
Gianni La Cava* and Callan Windsor**
Research Discussion Paper 2016-03
May 2016
*Economic Research Department **International Department Reserve Bank of Australia
We would like to thank Rose Kenney for assistance with the Dun and Bradstreet database. We
would also like to thank Andrew Ainsworth, Jarkko Jääskelä, Christopher Kent, Tom Rosewall,
John Simon, David Wakeling and seminar participants at the Reserve Bank of Australia for useful
comments and suggestions. The views expressed in this paper are those of the authors and do not
necessarily reflect the views of the Reserve Bank of Australia. The authors are solely responsible
for any errors.
Authors: lacavag and windsorc at domain rba.gov.au
Media Office: [email protected]
Abstract
Over the past quarter century, Australian companies have been increasingly holding assets in the
form of currency and deposits, or ‘cash’, rather than investing in other productive assets. This
reflects a global trend and raises the question of whether Australian companies now hold ‘too
much’ cash.
Despite Australian non-financial companies holding high levels of cash by international standards,
we find little evidence that the increase has been ‘excessive’. Instead, we find that the rise in
corporate cash is mostly due to changes over time in observable company characteristics,
including an apparent increase in the growth opportunities of publicly listed companies (as proxied
by Tobin’s Q). We also find some evidence of ‘cohort effects’ as Australian companies are more
likely to be ‘born’, or come into existence, today in industries that have relatively high levels of
cash, such as information technology, pharmaceuticals and biotechnology.
We also find evidence that public companies hold more cash than private companies, on average.
This is consistent with agency conflicts between owners and managers playing a role in corporate
decisions to hold cash.
Overall, we find that, in the face of financing frictions, some Australian companies have speculative
and precautionary motives for holding cash. It follows that high levels of corporate cash do not
necessarily indicate a weak outlook for corporate investment but might, in some cases, actually
imply more investment opportunities.
JEL Classification Numbers: G30, G32
Keywords: cash, private companies, financing frictions, agency costs

Table of Contents
1. Introduction 1
2. Institutional Background 6
3. Identification 8
3.1 Comparing Public and Private Company Cash 8
3.2 The Secular Rise in Publicly Listed Company Cash 12
4. Data 12
4.1 The Dun and Bradstreet Database 13
4.2 The Morningstar Database 15
5. Stylised Facts 15
6. Results 17
6.1 The Determinants of Corporate Cash 17
6.2 The Determinants of Listed Company Cash Holdings over Time 19
6.3 Are Australian Company Cash Holdings ‘Abnormal’? 20
6.4 Cohort Effects on Cash Holdings of Listed Companies 22
7. Extensions and Robustness Tests 23
7.1 The Cash Flow Sensitivity of Corporate Cash 23
7.2 Comparing Private and Public Company Cash Holdings Using Propensity Score Matching 25
8. Conclusion 26
Appendix A: Tax Minimisation and Cash Management Behaviour of Multinational Companies 27
Appendix B: Corporate Cash and Asset Concentration 28
Appendix C: Estimates of Sample Selection Bias 29
Appendix D: Comparing Public and Private Company Cash: Hausman-Taylor Estimates 31
References 33


1. Introduction
By international standards, Australian non-financial companies hold relatively high levels of
currency and deposits, or ‘cash’. Australian publicly listed companies rank second within the
Organisation for Economic Co-operation and Development (OECD) in their inclination to hold cash
relative to other assets (Figure 1).
Figure 1: Non-financial Corporate Cash
Share of total assets, 1990–2014 average
Sources: Authors’ calculations; Compustat; Compustat Global
Company-level analysis indicates that Australia’s relatively high OECD ranking persists even when
controlling for differences across countries in industry composition, average company size, growth,
and earnings volatility. On this basis, Australia still ranks within the top five OECD countries
(Figure 2).
0 5 10 15 20 25 %
IcelandSloveniaPortugal
ChileMexicoGreece
SpainCzech RepublicSlovak Republic
TurkeyPoland
NZHungary
ItalyEstonia
NetherlandsAustria
LuxembourgFinland
BelgiumSouth Korea
FranceGermanyDenmark
SwitzerlandUK
JapanNorwayIreland
SwedenCanada
USAustralia
Israel

2
Figure 2: Non-financial Corporate Cash – Conditional Estimates
Share of total assets, 1990–2014 average
Notes: Based on conditional estimates from a regression with control variables that include size, growth, earnings volatility,
industry and year fixed effects; the estimates shown reflect the baseline industry, which is manufacturing, in the baseline
year of 2014 and assuming a company of average size, growth, and earnings volatility; changes to the baseline will change
the average level of cash holdings, but not the relative ranking of countries
Sources: Authors’ calculations; Compustat; Compustat Global
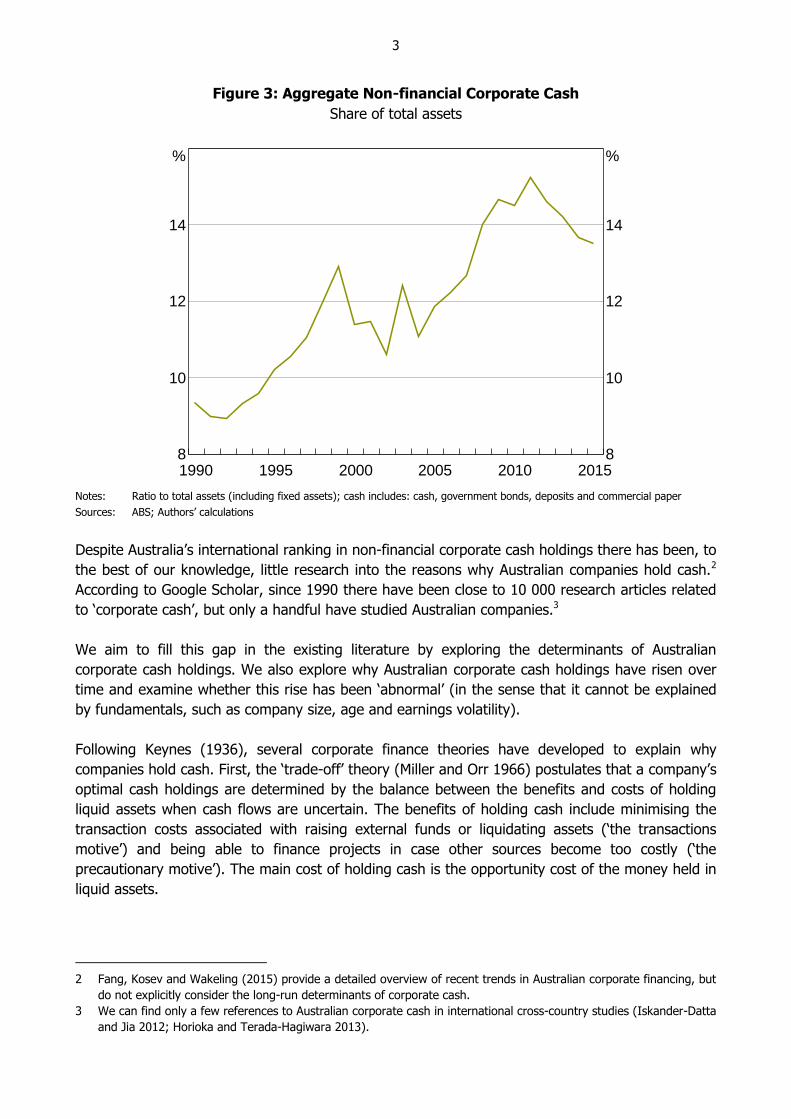
There has also been a secular rise in corporate cash in Australia over the past quarter century. The
Australian Bureau of Statistics financial accounts indicate that, in aggregate, the cash-to-assets
ratio (hereafter, ‘cash ratio’) for non-financial corporations rose from 9½ per cent in 1990 to
13½ per cent in 2015 (Figure 3).1 Company-level analysis indicates that the rise in cash has been
broad-based across industries. Moreover, the trend increase in corporate cash holdings in Australia
has outpaced that of the OECD average.
1 The aggregate financial accounts estimates of the cash ratio are much lower than that based on the listed public
company data shown in Figure 1. This is because the financial accounts measure is an asset-weighted average,
whereas the company-level average is unweighted. As smaller companies tend to hold higher levels of cash relative
to assets, the unweighted average is therefore much higher. The financial accounts also include private companies
and unlisted public companies, which typically hold lower shares of cash than listed public companies.
0 5 10 15 20 25 %
IcelandChile
PolandCzech Republic
GreecePortugalHungary
NZTurkey
SloveniaSlovak Republic
MexicoCanadaEstonia
ItalyFinland
SpainSweden
NetherlandsSouth Korea
UKLuxembourg
AustriaDenmarkGermany
BelgiumNorwayFrance
USAustralia
SwitzerlandIrelandJapanIsrael
3
Figure 3: Aggregate Non-financial Corporate Cash
Share of total assets
Notes: Ratio to total assets (including fixed assets); cash includes: cash, government bonds, deposits and commercial paper
Sources: ABS; Authors’ calculations
Despite Australia’s international ranking in non-financial corporate cash holdings there has been, to
the best of our knowledge, little research into the reasons why Australian companies hold cash.2
According to Google Scholar, since 1990 there have been close to 10 000 research articles related
to ‘corporate cash’, but only a handful have studied Australian companies.3
We aim to fill this gap in the existing literature by exploring the determinants of Australian
corporate cash holdings. We also explore why Australian corporate cash holdings have risen over
time and examine whether this rise has been ‘abnormal’ (in the sense that it cannot be explained
by fundamentals, such as company size, age and earnings volatility).
Following Keynes (1936), several corporate finance theories have developed to explain why
companies hold cash. First, the ‘trade-off’ theory (Miller and Orr 1966) postulates that a company’s
optimal cash holdings are determined by the balance between the benefits and costs of holding
liquid assets when cash flows are uncertain. The benefits of holding cash include minimising the
transaction costs associated with raising external funds or liquidating assets (‘the transactions
motive’) and being able to finance projects in case other sources become too costly (‘the
precautionary motive’). The main cost of holding cash is the opportunity cost of the money held in
liquid assets.
2 Fang, Kosev and Wakeling (2015) provide a detailed overview of recent trends in Australian corporate financing, but
do not explicitly consider the long-run determinants of corporate cash.
3 We can find only a few references to Australian corporate cash in international cross-country studies (Iskander-Datta
and Jia 2012; Horioka and Terada-Hagiwara 2013).
20102005200019951990 20158
10
12
14
%
8
10
12
14
%

4
Second, the ‘pecking order’ (or ‘financing hierarchy’) theory (Myers and Majluf 1984) states that to
minimise asymmetric information costs, companies should finance their investment first with
internal cash then with debt and finally with equity. This theory suggests that companies use cash
as a buffer between retained earnings and investment needs.
Third, the ‘free cash flow’ (or ‘managerial excess’) theory (Jensen 1986) argues that business
managers are prone to pursue their own interest over the interests of owners and creditors, and
hence have an incentive to divert resources to activities that personally benefit them. By holding
cash, managers increase the amount of assets under their control and gain discretionary power
over the company’s investment decisions.
We will refer to the first two theories under the broad heading of the ‘financing frictions
hypothesis’. Under both theories, companies hold cash as a buffer against being financially
constrained (either now or in the future). We will refer to the third theory as the ‘agency costs
hypothesis’.4 The financing frictions and agency costs hypotheses are not necessarily competing
hypotheses; in fact, the two hypotheses are perfectly compatible with each other. Our aim is to
gauge the weight of evidence for each hypothesis in explaining why Australian companies hold
cash.
These hypotheses are tested using longitudinal information on a large sample of both private and
public companies from a database provided by Dun and Bradstreet (D&B). There are important
differences between private and public companies that are likely to help shed light on cash
management behaviour. Public companies can raise capital from the general public and can have
an unlimited number of shareholders. In contrast, private companies cannot raise funds from the
public because disclosure is required.5 The organisational differences between private and public
companies are used to directly test the two main hypotheses for holding cash:
1. Financing frictions hypothesis: public companies have greater access to external finance
than private companies and should hold less cash, on average.
2. Agency costs hypothesis: public companies typically have greater separation of ownership
and management than private companies and should hold more cash, on average.
To understand the determinants of the trend increase in cash holdings over the past quarter
century, we turn to a separate source of company-level information from Morningstar. We focus
on publicly listed companies as the existing evidence suggests that the rise in cash holdings has
been largely concentrated among publicly listed companies and long-run panel data are only
available for listed companies.
4 Agency costs usually refer to the conflicts between a public company’s shareholders and managers. In a public
company, agency costs occur when the company’s management (or ‘agent’) puts their own interests above those of
shareholders (or ‘principals’). In the case of cash holdings, agency costs can include the costs incurred if the
manager uses cash to overinvest in negative net present value projects or the costs involved in aligning the
incentives of managers with shareholders through appropriate remuneration packages.
5 There are certain specific circumstances when private companies can raise funds without disclosure, for example,
when it is a personal offer made to investors that do not need disclosure because of their financial capacity. This
notwithstanding, there are still binding limits to the number of shareholders.

5
Our main contribution to the existing literature is to provide the first detailed analysis of why
Australian companies hold cash. A large (and growing) body of international research has analysed
the determinants of company cash holdings for the United States (Opler et al 1999; Dittmar and
Mahrt-Smith 2007; Foley et al 2007; Harford, Mansi and Maxwell 2008; Bates, Kahle and
Stulz 2009), the United Kingdom (Ozkan and Ozkan 2004), Japan (Pinkowitz and
Williamson 2001), east Asia (Horioka and Terada-Hagiwara 2013) and Europe (Riddick and
Whited 2009).
The rise in US corporate cash holdings has been described as a ‘puzzle’ (Pinkowitz, Stulz and
Williamson 2013).6 But, as the international comparison suggests, Australian companies hold more
cash than US companies, on average, and this has become increasingly apparent over time. So the
Australian ‘corporate cash puzzle’ seems worthy of investigation.7
A common feature of the existing literature is a focus on publicly listed companies, largely due to
data availability. But the literature is increasingly examining the behaviour of public and private
companies, as the necessary micro data become available. Recent studies have compared the cash
management behaviour of public and private companies for the United States (Gao, Harford and
Li 2013; Asker, Farre-Mensa and Ljungqvist 2011), the United Kingdom (Gogineni, Linn, and
Yadav 2012) and Europe (Akguc and Choi 2013). We contribute to this expanding literature by
comparing the cash management behaviour of public and private companies in Australia.
The other contribution of our paper is to provide an empirical assessment of the investment and
financing decisions of private companies in Australia. Private companies are a large and
underexplored part of the Australian economy. In Australia, 99 out of 100 companies are privately
held and account for over 40 per cent of total corporate assets and sales and about one-third of
corporate profits. By considering the behaviour of both public and private companies, our results
are likely to be representative of the corporate cash management practices of companies in the
economy.
An understanding of corporate cash holdings is important from a policy perspective. First,
increases in aggregate corporate cash holdings might be important for understanding the current
state of corporate profitability, risk and growth. If companies have a precautionary saving motive
and are ‘hoarding’ cash rather than investing or paying out dividends, then this might be evidence
that companies expect the economy to slow. Alternatively, if companies have a speculative motive
for holding cash, then an increase in cash might be evidence that some companies expect
economic conditions to improve in the future.
6 Another popular explanation for why US companies hold cash concerns repatriation taxes (Foley et al 2007; Sánchez
and Yurdagul 2013). However, empirical evidence in favour of the repatriation tax motive for US companies appears
mixed. And importantly, the Australian taxation system does not appear to provide Australian companies with an
incentive to hold cash in the same way as the US taxation system may do for US companies (see Appendix A for
more details).
7 Media reports frequently point to the very high levels of cash held by the largest US companies, such as Apple,
Google and Microsoft. Similar to the United States, corporate cash is highly concentrated in Australia. However, the
degree of concentration has declined over time. This suggests that the secular rise in corporate cash holdings in
Australia is not due to a few very large companies, but is a more broad-based phenomenon. We explore this in more
detail in Appendix B.

6
Second, how companies allocate their financial resources is important to monetary policy to the
extent that companies build up stockpiles of cash, which affect the transmission of balance sheet
(and cash flow) shocks to corporate investment. We find evidence consistent with companies
holding cash to buffer against potential shocks. These precautionary holdings of cash might help
companies to avoid financing constraints and thereby lower the sensitivity of investment to
monetary policy shocks, though we leave such an investigation to future research.8
To understand the policy implications of high cash holdings it is important to first understand why
companies hold cash and to identify the extent to which those holdings of cash are ‘excessive’.
This is our main focus; we leave a more detailed exploration of the links between monetary policy,
interest rates and corporate cash to future research.
To preview our main results, we find that:
1. Public companies hold more cash, on average, than private companies, suggesting that agency
costs play some role in determining cash holdings.
2. The trend increase in the cash holdings of publicly listed companies can be largely explained by
changes in observable company characteristics. In particular, relative to their counterparts of
25 years ago, publicly listed companies today have better growth opportunities (as measured
by Tobin’s Q) and are more likely to operate in ‘risky’ industries (with relatively high earnings
volatility), and these characteristics are correlated with higher levels of corporate cash. This
suggests that financing frictions are important too, and that some companies have
precautionary and speculative motives for holding cash.
3. By historical standards, cash holdings of Australian publicly listed companies are not ‘excessive’
after accounting for observable company characteristics.
2. Institutional Background
There are differences in the organisational structure of private and public companies.9 For our
purposes, the most important differences are:
1. Public companies have more financing channels: public companies can raise equity from
the general public via share offers with prospectuses, while private companies cannot.
8 Alternatively, high levels of cash might make the economy more sensitive to monetary policy. Adão and Silva (2015)
suggest that high levels of cash might make the economy more sensitive to monetary policy because it lowers the
speed at which the real interest rate adjusts back to its equilbrium level. The real effects occur because companies
use their cash in different ways, according to their cash holdings at the time of the shock. Companies with little cash
adapt faster to the shock while companies with large cash holdings take longer to adapt. The different reaction in
spending makes the price level move slowly after an increase in the nominal interest rate. Therefore, monetary
policy has a more protracted effect on the economy.
9 Public and private companies are distinguished by their ownership structure and their disclosure requirements. There
are also differences between companies (incorporated businesses) and unincorporated businesses. Companies have
a separate legal identity and are owned by shareholders, who have limited liability for business debts. In contrast,
unincorporated businesses are not separate legal entities, so their owners are personally liable for any business
debts incurred. Unincorporated businesses include sole proprietors, partnerships and trusts. The aggregate financial
accounts data indicate that unincorporated business cash holdings have been rising over time (relative to GDP),
though not as much as company cash holdings.
7
2. Public companies have a more dispersed ownership structure: public companies have
no limit on the number of shareholders, while private companies must have no more than
50 non-employee shareholders.
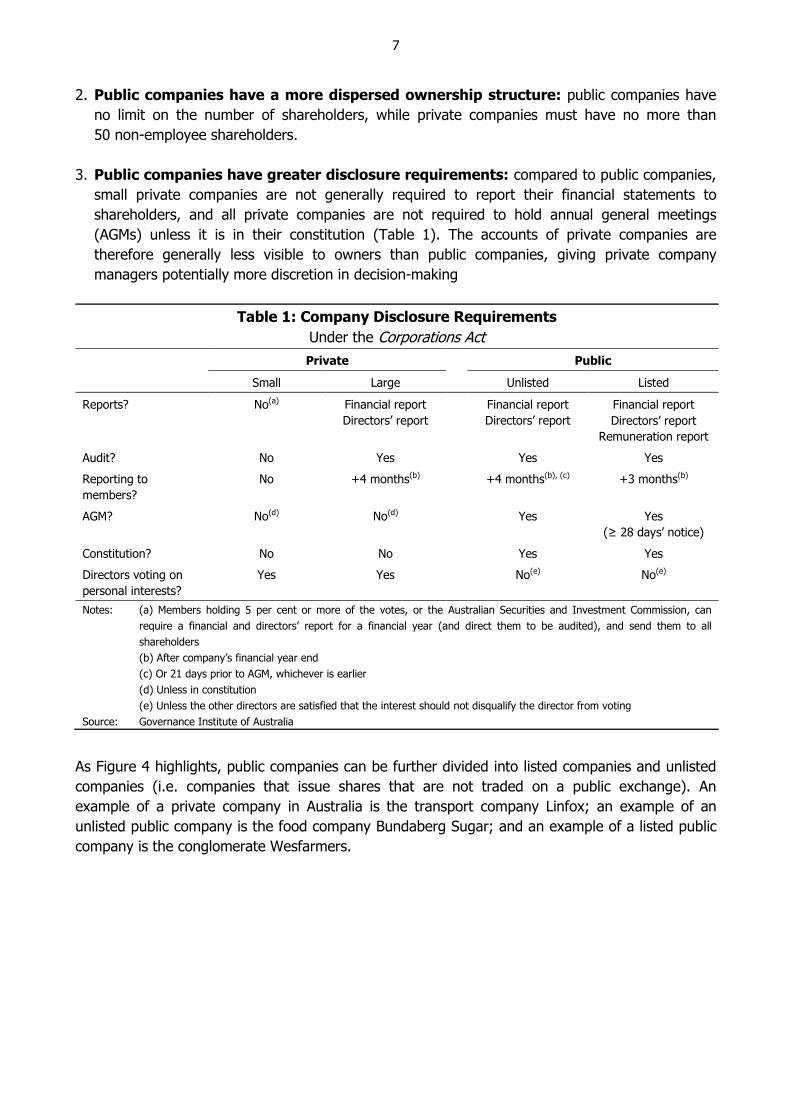
3. Public companies have greater disclosure requirements: compared to public companies,
small private companies are not generally required to report their financial statements to
shareholders, and all private companies are not required to hold annual general meetings
(AGMs) unless it is in their constitution (Table 1). The accounts of private companies are
therefore generally less visible to owners than public companies, giving private company
managers potentially more discretion in decision-making
Table 1: Company Disclosure Requirements
Under the Corporations Act
Private Public
Small Large Unlisted Listed
Reports? No(a) Financial report
Directors’ report
Financial report
Directors’ report
Financial report
Directors’ report
Remuneration report
Audit? No Yes Yes Yes
Reporting to
members?
No +4 months(b) +4 months(b), (c) +3 months(b)
AGM? No(d) No(d) Yes Yes
(≥ 28 days’ notice)
Constitution? No No Yes Yes
Directors voting on
personal interests?
Yes Yes No(e) No(e)
Notes: (a) Members holding 5 per cent or more of the votes, or the Australian Securities and Investment Commission, can
require a financial and directors’ report for a financial year (and direct them to be audited), and send them to all
shareholders
(b) After company’s financial year end
(c) Or 21 days prior to AGM, whichever is earlier
(d) Unless in constitution
(e) Unless the other directors are satisfied that the interest should not disqualify the director from voting
Source: Governance Institute of Australia
As Figure 4 highlights, public companies can be further divided into listed companies and unlisted
companies (i.e. companies that issue shares that are not traded on a public exchange). An
example of a private company in Australia is the transport company Linfox; an example of an
unlisted public company is the food company Bundaberg Sugar; and an example of a listed public
company is the conglomerate Wesfarmers.

8
Figure 4: Public and Private Companies in the Databases
Under the Corporations Act
Source: Governance Institute of Australia
3. Identification
We take two separate approaches to identify the determinants of company cash in Australia. First,
we compare the cash management behaviour of public and private companies. This allows us to
directly test the relative importance of the financing frictions and agency costs hypotheses.
Second, we focus on the long-run cash management behaviour of publicly listed companies. This
provides further insight into the drivers of the secular rise in aggregate cash and allows us to
examine whether the long-run rise is in line with fundamentals or not.
3.1 Comparing Public and Private Company Cash
To the extent that private companies disclose less financial information than public companies, the
lower transparency of private companies is likely to be associated with greater asymmetric
information, and hence more costly external finance for private companies (Table 1). This, in turn,
implies that private companies may face higher financing frictions than public companies, and
hence have a higher precautionary (and speculative) demand for cash.
This give rise to our first hypothesis:
H1: Private companies should have higher levels of cash, on average, than public companies if
there are financing frictions, all else equal.
Agency costs occur when corporate managers and shareholders have conflicting interests. Private
companies should have fewer agency conflicts than public companies; they have more
concentrated ownership structures and are typically more reliant on debt creation to fund
investments. A greater reliance on debt effectively forces private companies to pay out future cash
flows in interest and principal repayments and gives managers less discretion in the use of funds
(Jensen 1986). Higher agency costs among public companies – resulting from a separation of
ownership and control – could encourage the financial managers of public companies to hold more

9
cash and to accumulate more cash in good times. Such behaviour would enable these companies
to exercise more discretion in financing future investments.
This give rise to our second hypothesis:
H2: Private companies should have lower levels of cash, on average, than public companies if
agency costs affect corporate cash policies, all else equal.
In the presence of agency costs and financing frictions it is unclear whether public or private
companies should hold more cash. But, the finding that the cash holdings of public companies are
higher and/or more sensitive to cash flows compared to private companies provides evidence in
support of agency costs.
Our modelling approach and hypotheses are similar to that of Gao et al (2013) for the
United States.10 Although Gao et al focus on the level of cash holdings across public and private
companies in the United States, in our extensions we also examine the sensitivity of cash holdings
to cash flows across public and private companies.
To begin, we estimate the following company-level panel regression model:11
it i it i itCASH PUBLIC CONTROLS (1)
where the dependent variable is the cash-to-assets ratio (CASHit) of company i in year t. We
define ‘cash’ as the stock of currency, deposits and other liquid securities, such as government
bonds. This definition captures all financial instruments that a company can use to buffer against
adverse shocks or to respond quickly to new investment opportunities.
The key explanatory variable in Equation (1) is a dummy variable (PUBLICi), which is equal to
one if company i is public and is equal to zero if the company is private. This dummy variable
captures the average difference in cash holdings for public and private companies, conditional on
other observable company characteristics.
Our choice of control variables (CONTROLSit) is guided by theory and previous studies (Gao
et al 2013). We include the following, which are all normalised by total assets except company size
and age:12
10 Other studies have also examined the effect of agency costs on public companies’ liquid asset holdings by exploiting
variation in agency conflicts across different types of corporate governance, but with mixed results. Dittmar
et al (2003) study cash holdings across different economies and find that in places where investor protection is
lower companies hold more cash. On the other hand, Harford et al (2008) find that companies with more
entrenched managers actually hold comparatively less cash than otherwise similar companies.
11 All of the results are robust to the inclusion of time fixed effects that control for the overall business cycle. For
simplicity, they are excluded from the notation here.
12 As robustness, however, we employed several alternative definitions, including taking the natural logarithm of the
variables and normalising them by total assets less cash. The results (available upon request) are not affected in a
material way when using these alternatives.
10
Company size (SIZE): measured as the natural logarithm of real assets. This captures the
transactions demand for cash; there are economies of scale in cash holdings such that larger
companies tend to use cash more efficiently.
Company age (AGE): measured as the difference between the current reporting year and the
year of registration. This should partly reflect financing frictions as younger companies are
typically less well known and therefore more likely to find it difficult to raise external funds from
creditors.
Cash flow (CASHFLOW): measured as earnings before interest, tax, depreciation and
amortisation. This potentially captures financing frictions as financially constrained companies
will be more sensitive to cash flows. It may also capture agency costs if managers aim to
increase their decision-making control by saving cash out of earnings.
Industry cash flow risk (RISK): measured as a rolling standard deviation of cash flows divided
by assets and averaged across industries.13 This captures the precautionary demand for cash as
companies operating in riskier industries are more likely to hold cash.
Leverage (LEVERAGE): measured as total debt divided by assets. According to the financing
hierarchy, cash (internal finance) is a cheaper alternative to debt in financing investment,
implying a negative correlation between cash and leverage.
Capital spending (CAPEX): measured as spending on property, plant and equipment. This
captures the precautionary demand for cash, as companies with large capital spending
commitments face larger costs if financing conditions deteriorate, so we would expect a positive
correlation with cash holdings.14
Net working capital (WORKINGCAPITAL): measured as the stock of inventories and short-
term receivables outstanding. Inventories and trade credit should be negatively correlated with
cash to the extent that they are substitutable forms of liquidity.
As Gao et al (2013) recognise, sample selection is likely to be an issue in modelling cash holdings
because companies are not randomly assigned to being either public or private. Rather, the
decision to be a public company might be correlated with unobserved company characteristics that
determine the level of cash holdings.
To the extent that the choice to be public is determined by company characteristics that are fixed
over time, we control for this endogenous sample selection through the inclusion of company fixed
effects (i) in Equation (1). The company fixed effect controls for unobserved time-invariant
company characteristics that explain why some companies hold more cash than others on average
(e.g. the company’s business model or its level of risk aversion).
13 The variable RISK is constructed in two steps. First, for each company, a rolling standard deviation of cash flows
(net cash flows from operating activities) to assets is calculated using the previous two years of data. Second, for
each year, these company-specific measures of cash flow risk are averaged by industry.
14 If capital spending creates assets that can be used as collateral, then capital spending could increase the borrowing
capacity of the company and reduce the demand for cash.

11
However, the inclusion of the company fixed effect creates an issue in estimation as it will be
perfectly collinear with the dummy variable for whether a company is public or not. To circumvent
this, we estimate a ‘correlated random effects’ (CRE) model (Mundlak 1978; Chamberlain 1982).
Given the model is not commonly used, particularly in the corporate finance literature, it is useful
to provide a detailed outline. Suppose the true model is:
it i it i itCASH PUBLIC X (2)
where Xit is a set of time-varying explanatory variables, PUBLICi is the time-invariant explanatory
variable (of most interest here) and i is the unobserved fixed effect. Assume:
, 0it it iE X PUBLIC
, 0i it iE X PUBLIC
we can explicitly model the non-zero correlation between the unobserved fixed effect and the
observed explanatory variables. Given the fixed effect only varies in the cross-section, if it is
correlated with Xit in period t, then it will be correlated with Xis in period s (where s ≠ t). In this
case, we need to model its correlation with the explanatory variables that do vary over time
(e.g. SIZE). Assuming that the relationship is linear:
1 1 2 2 3 3,i it i i i i T iT iE X PUBLIC X X X X PUBLIC
Furthermore, if we assume that the correlation between the fixed effect and the explanatory
variables is the same in each period (i.e. that 1 = 2 = 3 = ) then the above reduces to:
,i it i i iE X PUBLIC X PUBLIC
where /i t it iX X T is the temporal mean of the explanatory variable X and Ti is the total
number of observations for company i (this can vary by company because of the unbalanced
nature of the panel).
Now define a new (unobserved) fixed effect, i i i iX PUBLIC . Therefore:
, , 0i it i i it i i iE X PUBLIC E X PUBLIC X PUBLIC
By construction, this new fixed effect is not correlated with any explanatory variables. Equation (2)
can be rewritten as:
it i it i i it
it
CASH PUBLIC X X

12
where it i it is the new error term. This modified model satisfies the assumption that the
explanatory variables and the company fixed effect are uncorrelated (i.e. 0i itE X ).15 So we
can run random effects on this model and obtain a consistent estimate of the effect of the binary
indicator for whether the company is public or not.16
3.2 The Secular Rise in Publicly Listed Company Cash
We follow a more standard approach to examine the determinants of the long-run trend in
corporate cash holdings (Opler et al 1999; Bates et al 2009). The model is estimated on a sample
of publicly listed companies covering the period from 1990 to 2014. The regression model is
specified as:
it it i t itCASH CONTROLS (3)
where the variables are defined similarly to Equation (1). In particular, the dependent variable is
the cash-to-assets ratio (CASHit) for each listed company in each year. The set of control variables
(CONTROLSit) includes a slightly broader range of variables than before as listed companies
provide more detailed balance sheet information. In addition to the control variables listed earlier,
we include two explanatory variables that are designed to capture growth opportunities (but are
only available for listed companies):
Market-to-book ratio or Tobin’s Q (TQ): companies with greater investment opportunities are
thought to value cash more since it is costly for these companies to be financially constrained.
Tobin’s Q is measured as the company’s market value (shares outstanding share price)
divided by the book value of net assets. A company’s book value is assumed to capture the
value of its existing assets, while the market value captures both the value of its existing assets
and its growth opportunities.17
Research and development expenditure-to-assets ratio (R&D): we expect a positive correlation
with cash holdings as research and development spending is typically correlated with growth
opportunities and company-level risk.
4. Data
To examine corporate cash holding behaviour we utilise two unique sources of Australian
company-level panel data that cover both public and private companies and are provided by D&B
and Morningstar.
15 As noted, this model relies on the assumption that the correlation between the fixed effect and each of the
explanatory variables does not change over time. If the correlation did vary over time, a key assumption of the CRE
model would be violated. To address this possibility, we also estimate a Hausman-Taylor (HT) model in Appendix D.
16 In this example, the binary variable PUBLICi has a direct effect (captured by ) and an indirect effect (captured by
) on cash holdings.
17 We recognise that the literature is divided as to whether Tobin’s Q is a good measure of corporate performance.
Some studies suggest that it is an appropriate indicator after correcting for measurement error (Erickson and
Whited 2012), while others suggest it is not a good measure (Dybvig and Warachka 2015). We have experimented
with an alternative measure of growth performance based on current sales growth and our key results are
unaffected.

13
4.1 The Dun and Bradstreet Database
In the D&B data there are around 4 000 private companies and 1 400 unlisted public companies
(those with shares that are not traded on a public exchange), and the annual data cover a 10-year
sample window from 2005 to 2014.18
The D&B sample of companies is based on its primary business as a credit bureau. Companies in
the database are likely to be those that apply for credit, and D&B can most easily obtain financial
information on relatively large private and unlisted public companies, which are required to file
their financial reports with the Australian Securities and Investment Commission (Table 1). As a
result, compared to the population of all private and unlisted public companies in Australia, the
sample is biased towards larger companies, though it does still have some coverage of very small
companies (those with revenue less than $0.5 million).
The slant towards larger companies that want to borrow does not necessarily undermine the
motivation for our work. In fact, it is not clear how this will bias our results (see Appendix C).
Moreover, the selection criteria and variables of interest included in the database are consistent
across public and private companies, which allows us to make direct comparisons.
In the unbalanced D&B panel of private and public companies, about 75 per cent of companies are
observed for two years or more; 50 per cent of companies are observed for three years or more;
and 25 per cent of companies are observed for five years or more.
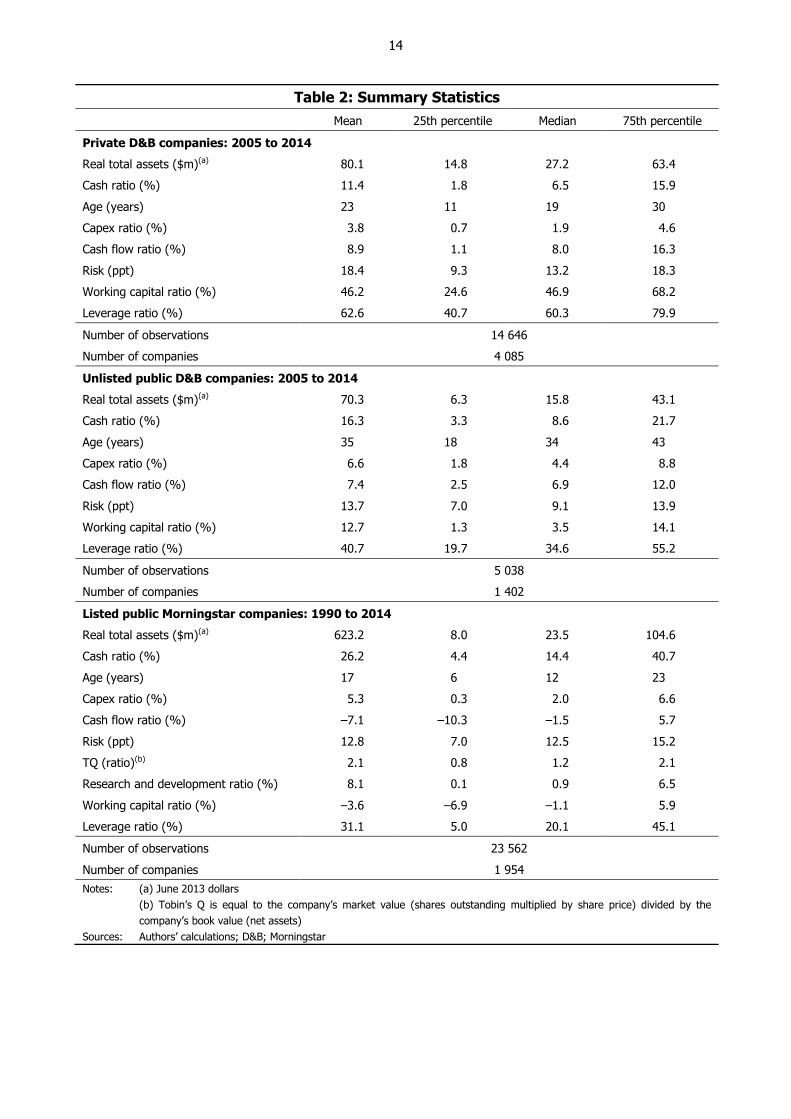
Summary statistics for the D&B data are presented in the first two blocks of Table 2. Unlisted
public companies are smaller than private companies, on average, though for both groups of
companies holdings of total assets are unevenly distributed, with the mean level of assets above
the 75th percentile of the distribution.
Table 2 shows that cash ratios are higher for unlisted public companies compared to private
companies and that unlisted public companies tend to be older than private companies. Likewise,
capital spending as a share of total assets is generally larger for unlisted public companies.
The ratio of cash flows (or earnings) to assets is quite similar across public and private
companies.19 Cash flows are more volatile for private companies as measured by the standard
deviation in company-level cash flows (averaged across industries). The ratio of working capital
(measured as the stock of inventories and short-term receivables outstanding) to assets is
substantially larger for private companies. Finally, private companies are more leveraged as they
are more reliant on debt, while public companies are able to tap public equity markets.
18 In this paper, financial companies are excluded because they may carry cash to meet capital requirements that are
unrelated to the reasons investigated in this paper. Likewise, utilities companies are dropped because their cash
holdings – in part – may be determined by regulations. In most cases the data used are financial year-ended;
however, in some instances companies report calendar year-ended figures, or annual figures ended in other months.
19 It may seem surprising that the cash flow-to-assets ratio for listed public companies is negative, on average.
However, this appears to reflect a relatively large share of Australian listed companies that are small mining
exploration companies that typically report losses. The high share of companies reporting losses can also be
observed in Australian Taxation Office data on company profitability.
14
Table 2: Summary Statistics
Mean 25th percentile Median 75th percentile
Private D&B companies: 2005 to 2014
Real total assets ($m)(a) 80.1 14.8 27.2 63.4
Cash ratio (%) 11.4 1.8 6.5 15.9
Age (years) 23 11 19 30
Capex ratio (%) 3.8 0.7 1.9 4.6
Cash flow ratio (%) 8.9 1.1 8.0 16.3
Risk (ppt) 18.4 9.3 13.2 18.3
Working capital ratio (%) 46.2 24.6 46.9 68.2
Leverage ratio (%) 62.6 40.7 60.3 79.9
Number of observations 14 646
Number of companies 4 085
Unlisted public D&B companies: 2005 to 2014
Real total assets ($m)(a) 70.3 6.3 15.8 43.1
Cash ratio (%) 16.3 3.3 8.6 21.7
Age (years) 35 18 34 43
Capex ratio (%) 6.6 1.8 4.4 8.8
Cash flow ratio (%) 7.4 2.5 6.9 12.0
Risk (ppt) 13.7 7.0 9.1 13.9
Working capital ratio (%) 12.7 1.3 3.5 14.1
Leverage ratio (%) 40.7 19.7 34.6 55.2
Number of observations 5 038
Number of companies 1 402
Listed public Morningstar companies: 1990 to 2014
Real total assets ($m)(a) 623.2 8.0 23.5 104.6
Cash ratio (%) 26.2 4.4 14.4 40.7
Age (years) 17 6 12 23
Capex ratio (%) 5.3 0.3 2.0 6.6
Cash flow ratio (%) –7.1 –10.3 –1.5 5.7
Risk (ppt) 12.8 7.0 12.5 15.2
TQ (ratio)(b) 2.1 0.8 1.2 2.1
Research and development ratio (%) 8.1 0.1 0.9 6.5
Working capital ratio (%) –3.6 –6.9 –1.1 5.9
Leverage ratio (%) 31.1 5.0 20.1 45.1
Number of observations 23 562
Number of companies 1 954
Notes: (a) June 2013 dollars
(b) Tobin’s Q is equal to the company’s market value (shares outstanding multiplied by share price) divided by the
company’s book value (net assets)
Sources: Authors’ calculations; D&B; Morningstar

15
4.2 The Morningstar Database
For the longer-run analysis, we use detailed financial statement information for Australian publicly
listed companies provided by Morningstar. This database covers a narrower sample of companies
(at around 2 000 companies) than the D&B database, but a much longer sample window of
1990–2014. This allows us to better gauge the determinants of the long-run trend increase in
corporate cash holdings.
About 75 per cent of companies are observed for 7 years or more; 50 per cent of companies are
observed for 11 years or more; and 25 per cent of companies are observed for 17 years or more.
While it is difficult to make direct comparisons between the listed public companies and unlisted
public companies as some of the data definitions vary across databases (see Appendix C),
generally speaking listed public companies are much larger than their unlisted counterparts
(Table 2, third block). The cash ratios of listed public companies are also larger than unlisted
public companies.
5. Stylised Facts
In this section we document some stylised facts about Australian corporate cash holdings. We use
both company-level databases to examine the associations between corporate cash holdings and
various company-level characteristics, with a particular focus on three key characteristics: the size,
‘riskiness’ and ‘age’ of the company. Because private and unlisted public companies are directly
comparable within the same database, we also look for any interesting differences between the
cash management behaviour of unlisted public versus private companies.
Trends in the cash-to-assets ratio of unlisted public, private and listed public companies are
provided in the top panel of Figure 5. Since the mid 2000s, the unlisted public company cash ratio
has been broadly unchanged, while for private companies, it appears that the cash ratio has been
edging higher. Interestingly, the global financial crisis did not have a discernible effect on
corporate cash holdings, at least in aggregate.
Looking at the longer-term trend for listed public companies, the mean cash ratio peaked in 2007
at 36 per cent, about three times higher than the trough in 1990.20 Since 2012, however, listed
public companies’ cash holdings have decreased relative to total assets.
To examine the role of size we split companies into quartiles based on their real assets (Figure 5,
second panel). Small companies tend to hold relatively more cash than large companies, on
average. This is true regardless of whether they are a public (unlisted or listed) or private
company. For example, within unlisted public companies, the cash ratio of the smallest companies
is over 30 percentage points higher than the cash ratio of the largest companies, on average.
Similarly, the mean cash ratio of the smallest private companies is over 20 percentage points
higher than that of the largest private companies. These differences are, at least in part, explained
by the fact that larger companies – and in particular, larger public companies – are more likely to
have a credit rating and an established reputation in debt markets, thereby making it cheaper to
20 The mean plotted here is an unweighted mean across all companies. The asset-weighted cash ratio exhibits a less-
pronounced run up, peaking at 10 per cent in 2009, 4 percentage points higher than the trough in 1994.

16
tap outside funds.21 This points to some preliminary evidence in favour of the financing frictions
hypothesis.
Industry risk also appears to be important to average cash holdings, which is consistent with the
presence of financing frictions and a precautionary saving motive (Figure 5, third panel).
Companies in industries with riskier cash flows typically hold more cash (where RISK is measured
using a rolling standard deviation of the cash flow-to-assets ratio). This is generally true for all
company types. Also consistent with the precautionary saving motive, it appears that younger
public companies tend to hold more cash than their older counterparts. However, the relationship
between age and cash is noticeably weaker for private companies.
Figure 5: Cash Ratios
Notes: For each company type (unlisted public, private and listed public), size quartiles are constructed from the real total asset
distribution, deflated by the GDP deflator; risk groups are constructed for each year from the company type’s cash flow risk
distribution
Sources: Authors’ calculations; D&B; Morningstar
21 They are also more likely to have lines of credit, thereby making them less reliant on liquid asset holdings. For
example, Sufi (2009) finds that size is a strong predictor of the use of credit lines among US companies.
15
30
%
15
30
%
Aggre
gate
trends
Median
Mean
Listed public companiesPrivate
companies
Unlisted public
companies
20
40
%
20
40
%
By
com
pany
siz
e
Smallest quartile
Largest quartile
2nd
3rd
15
30
%
15
30
%
By
earn
ings
risk
Above median
Below median
2009 2014 2009 2014 1994 1999 2004 2009 20140
15
30
%
0
15
30
%
By
com
pany
age
0–14 years
15–29 years30–45 years
17
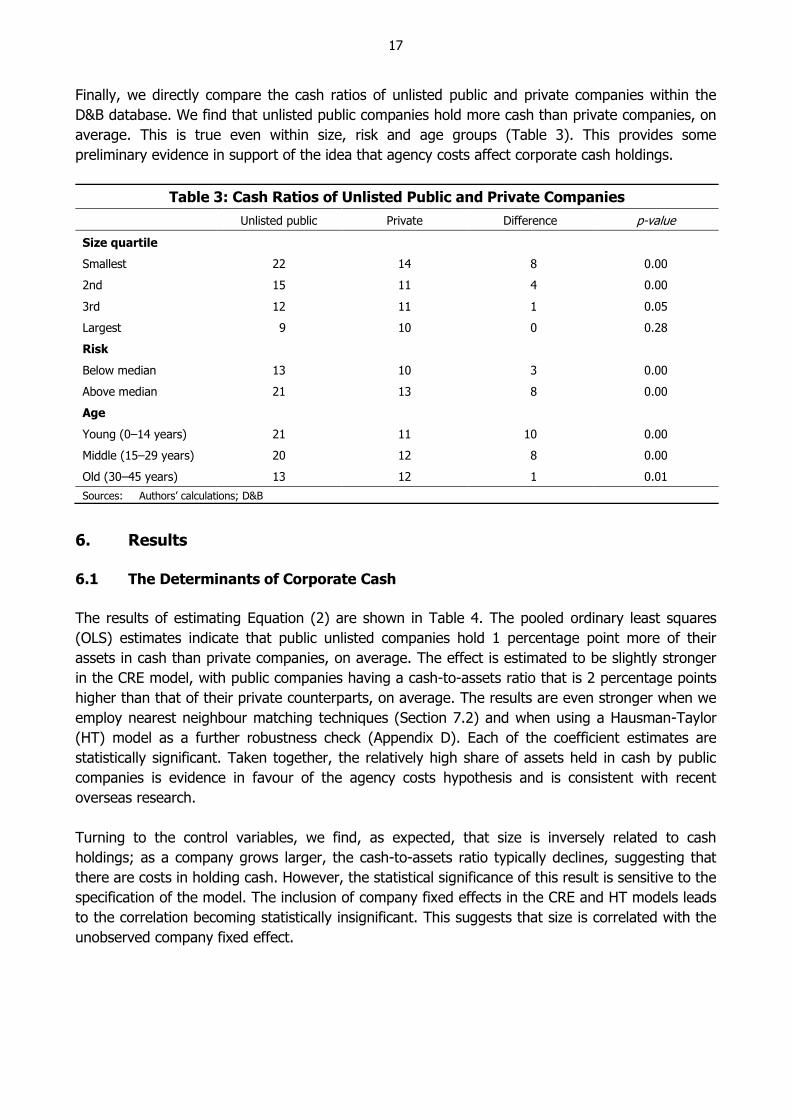
Finally, we directly compare the cash ratios of unlisted public and private companies within the
D&B database. We find that unlisted public companies hold more cash than private companies, on
average. This is true even within size, risk and age groups (Table 3). This provides some
preliminary evidence in support of the idea that agency costs affect corporate cash holdings.
Table 3: Cash Ratios of Unlisted Public and Private Companies
Unlisted public Private Difference p-value
Size quartile
Smallest 22 14 8 0.00
2nd 15 11 4 0.00
3rd 12 11 1 0.05
Largest 9 10 0 0.28
Risk
Below median 13 10 3 0.00
Above median 21 13 8 0.00
Age
Young (0–14 years) 21 11 10 0.00
Middle (15–29 years) 20 12 8 0.00
Old (30–45 years) 13 12 1 0.01
Sources: Authors’ calculations; D&B
6. Results
6.1 The Determinants of Corporate Cash
The results of estimating Equation (2) are shown in Table 4. The pooled ordinary least squares
(OLS) estimates indicate that public unlisted companies hold 1 percentage point more of their
assets in cash than private companies, on average. The effect is estimated to be slightly stronger
in the CRE model, with public companies having a cash-to-assets ratio that is 2 percentage points
higher than that of their private counterparts, on average. The results are even stronger when we
employ nearest neighbour matching techniques (Section 7.2) and when using a Hausman-Taylor
(HT) model as a further robustness check (Appendix D). Each of the coefficient estimates are
statistically significant. Taken together, the relatively high share of assets held in cash by public
companies is evidence in favour of the agency costs hypothesis and is consistent with recent
overseas research.
Turning to the control variables, we find, as expected, that size is inversely related to cash
holdings; as a company grows larger, the cash-to-assets ratio typically declines, suggesting that
there are costs in holding cash. However, the statistical significance of this result is sensitive to the
specification of the model. The inclusion of company fixed effects in the CRE and HT models leads
to the correlation becoming statistically insignificant. This suggests that size is correlated with the
unobserved company fixed effect.

18
Table 4: The Role of Company Characteristics
Public and private companies
OLS CRE
Unlisted public () 0.01*** 0.02***
SIZE –0.02*** –0.00
AGE –0.00*** –0.00**
CAPEX –0.44*** –0.18***
CASHFLOW 0.13*** 0.12***
RISK 0.05*** –0.00
WORKINGCAPITAL –0.11*** –0.13***
LEVERAGE –0.04*** –0.03***
Number of observations 20 381 20 381
R2 0.14
Within R2 0.13
Company fixed effects No Yes
Notes: Sample includes all company-year observations with non-missing values for the independent variables; outliers excluded;
robust standard errors clustered at the industry level used to accommodate within-industry serial correlation; ***, **,
and * denote significance at the 1, 5 and 10 per cent level, respectively
Sources: Authors’ calculations; D&B
The negative coefficient estimates on age indicate that companies typically reduce their cash
holdings as they become older, on average. This might point to the presence of financing frictions
for younger companies. However, the economic effect of age is relatively small – an increase in
age of 10 years is associated with cash holdings falling by around ½ to 1 percentage point relative
to assets, on average.
Industry-level risk is positively associated with cash holdings, though the effect is only statistically
and economically significant in the pooled OLS specification. This suggests that most of the
company-level risk is idiosyncratic and absorbed by the company fixed effects. We also find
evidence that working capital is a substitute for cash, with a one standard deviation increase in the
share of assets devoted to working capital being associated with a 3 percentage point decline in
average cash holdings.22 Also, higher levels of capital spending and leverage are associated with
lower levels of corporate cash, on average.
Finally, the positive correlation between cash flow and cash holdings across all models is consistent
with the ‘pecking order’ theory of financing sources, with companies saving at least some of the
cash flow generated by their operations as a potential source of future internal funding. For every
1 percentage point increase in cash flows as a share of assets, companies save around 13 basis
points in cash.
22 This finding is consistent with the theory outlined by Gao (2013) who suggests that improvements in inventory
management, such as the adoption of just-in-time technology, have reduced inventory holdings and increased cash
holdings over time.
19
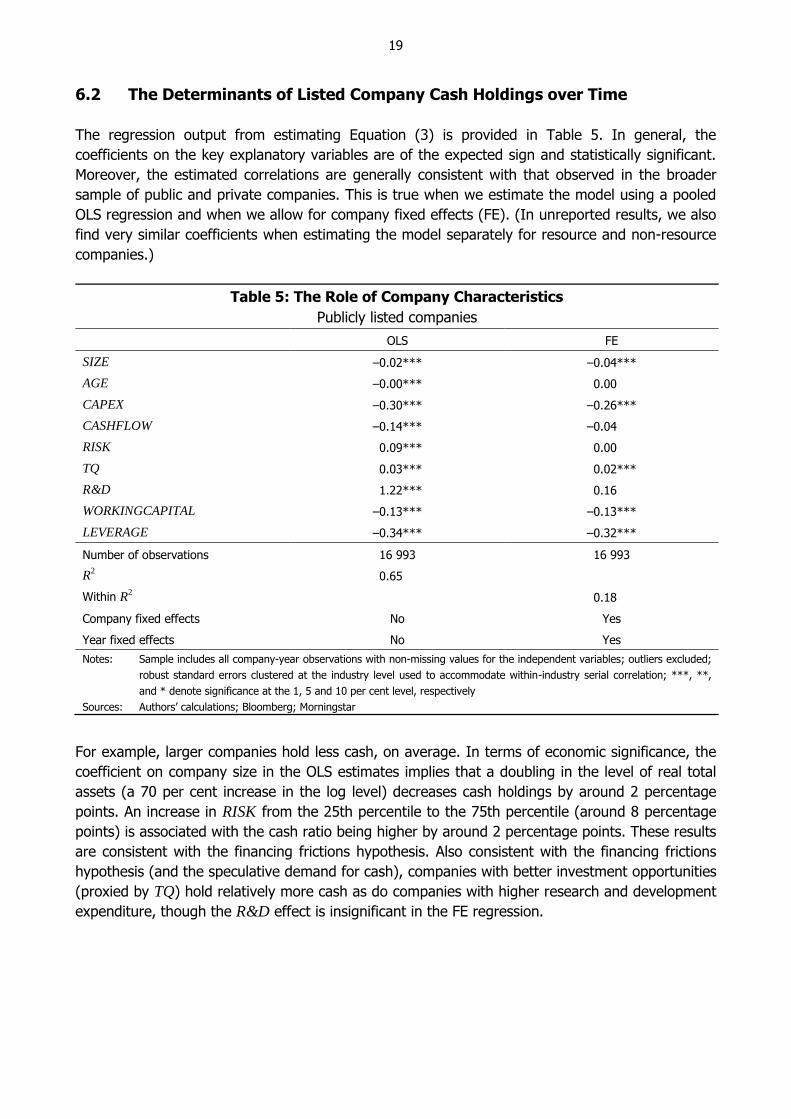
6.2 The Determinants of Listed Company Cash Holdings over Time
The regression output from estimating Equation (3) is provided in Table 5. In general, the
coefficients on the key explanatory variables are of the expected sign and statistically significant.
Moreover, the estimated correlations are generally consistent with that observed in the broader
sample of public and private companies. This is true when we estimate the model using a pooled
OLS regression and when we allow for company fixed effects (FE). (In unreported results, we also
find very similar coefficients when estimating the model separately for resource and non-resource
companies.)
Table 5: The Role of Company Characteristics
Publicly listed companies
OLS FE
SIZE –0.02*** –0.04***
AGE –0.00*** 0.00
CAPEX –0.30*** –0.26***
CASHFLOW –0.14*** –0.04
RISK 0.09*** 0.00
TQ 0.03*** 0.02***
R&D 1.22*** 0.16
WORKINGCAPITAL –0.13*** –0.13***
LEVERAGE –0.34*** –0.32***
Number of observations 16 993 16 993
R2 0.65
Within R2 0.18
Company fixed effects No Yes
Year fixed effects No Yes
Notes: Sample includes all company-year observations with non-missing values for the independent variables; outliers excluded;
robust standard errors clustered at the industry level used to accommodate within-industry serial correlation; ***, **,
and * denote significance at the 1, 5 and 10 per cent level, respectively
Sources: Authors’ calculations; Bloomberg; Morningstar
For example, larger companies hold less cash, on average. In terms of economic significance, the
coefficient on company size in the OLS estimates implies that a doubling in the level of real total
assets (a 70 per cent increase in the log level) decreases cash holdings by around 2 percentage
points. An increase in RISK from the 25th percentile to the 75th percentile (around 8 percentage
points) is associated with the cash ratio being higher by around 2 percentage points. These results
are consistent with the financing frictions hypothesis. Also consistent with the financing frictions
hypothesis (and the speculative demand for cash), companies with better investment opportunities
(proxied by TQ) hold relatively more cash as do companies with higher research and development
expenditure, though the R&D effect is insignificant in the FE regression.

20
6.3 Are Australian Company Cash Holdings ‘Abnormal’?
To examine whether Australian corporate holdings of cash are ‘abnormal’ we compare the
observed cash-to-assets ratio each period to ‘fundamental’ in-sample determinants of corporate
cash. Any differences between actual and fundamental cash holdings provide a gauge of how
much cash holdings are out of line with fundamentals, or abnormal. We do this by comparing the
estimated year dummies ( ˆt ) (the ‘conditional cash ratio’) to the observed mean of cash holdings
each year (the ‘unconditional cash ratio’). Any differences in the trends for these estimates are due
to variation over time in observed company-level characteristics.
Figure 6 plots the unconditional cash ratio against the conditional cash ratio (i.e. the time dummies
from Equation (3) as estimated in column 2 of Table 5). The secular increase in the conditional
cash ratio is far less pronounced than for the unconditional cash ratio, suggesting that much of the
increase in the cash ratio can be explained by changes in company characteristics. Across all
companies, the trough-to-peak increase in cash holdings over 1990 to 2008 is around 30 per cent
based on the conditional estimates, which is much smaller than the 200 per cent increase based
on the unconditional estimates. At its peak the unconditional cash ratio is over three standard
deviations above the conditional estimates. This indicates that we can explain much of the ‘puzzle’
of the secular rise in corporate cash through changes in the observable factors that drive corporate
decisions to hold cash.
Figure 6: Cash Ratios
Publicly listed companies, 1991 = 100
Sources: Authors’ calculations; Bloomberg; Morningstar
The largest contributors to the secular rise in cash are better growth opportunities (as measured
by Tobin’s Q), which are positively associated with cash holdings, and, to a lesser extent, changes
in leverage that occurred over the early 1990s and throughout the 2000s (Figure 7). Other factors,
such as changes in the average company size and age, played less of a role.
2009200419991994 201450
100
150
200
250
300
index
50
100
150
200
250
300
index
Conditional cash ratio
Cash ratio
95 per cent
confidence interval

21
Figure 7: Change in Cash Ratio
Fitted contribution to change
Sources: Authors’ calculations; Bloomberg; Morningstar
It is not clear what has driven these underlying trends, but the dynamic of Tobin’s Q seems to
follow the evolution of corporate profitability (IMF 2014). The positive correlation between our
estimates of Tobin’s Q and corporate cash holdings suggests that some companies have a
speculative motive for holding cash; these companies hold cash in expectation of investment
opportunities arising in the future. In other words, high corporate cash might not be symptomatic
of a weak corporate outlook but actually evidence of expected strength in the economy.
Likewise, aggregate trends in corporate leverage also tend to follow the investment cycle as well
as shifts in the use of different forms of external funding, which in turn are affected by the
differential between the (real) cost of debt and equity (Fang et al 2015). This notwithstanding,
there are many factors that could affect company-level leverage (Shuetrim, Lowe and
Morling 1993); a more detailed analysis of the determinants of long-run changes in Australian
corporate leverage, and other characteristics, is left to future research.
There are some periods in which the model is less able to explain trends in cash holdings. For
instance, the model under-predicts cash holdings in the mid 2000s and over-predicts cash in the
1991
to1995
1995
to1999
1999
to2003
2003
to2007
2007
to2011
2011
to2015
-10
-5
0
5
10
ppt
-10
-5
0
5
10
ppt
Actual change
Company size Age Capex Risk Tobin’s Q (investment opportunities)
R&D Cash flow Working capital Leverage

22
period since 2011. This might reflect factors related to the terms of trade boom and bust that are
difficult to capture in the observed data (e.g. changes in corporate uncertainty).23
6.4 Cohort Effects on Cash Holdings of Listed Companies
In considering the long-run trend in corporate cash holdings, we can also examine whether
companies that have listed more recently on the stock exchange hold more cash than companies
that listed earlier. These ‘cohort effects’ can be estimated because we have information on each
listed company’s initial public offering (IPO).
Previous international research indicates that such cohort effects are important in explaining the
rise in average cash holdings among public companies (Begenau and Palazzo 2015). The cohort
effects are associated with an increased propensity for riskier companies to list and a trend toward
industries with more risky business models (e.g. information technology, pharmaceuticals and
biotechnology) (Brown and Kapadia 2007). For Australian companies, the increase in aggregate
cash holdings over the mid to late 2000s may have been similarly affected by a trend in listing
toward small mining exploration companies during the Australian mining boom.
To construct the cohort estimates we take an unweighted average of the company fixed effects
estimated in Equation (3) for each cohort based on its IPO date. These fixed effects essentially
capture any unobserved characteristics that the company posesses when it lists and that persist
over time. We group companies into cohorts based on five-year windows, with the most recent
cohort being based on companies that listed between 2010 and 2014.
The cohort estimates are displayed in Figure 8. The results indicate that recent cohorts hold much
higher levels of cash than earlier cohorts. For example, the cash ratio of companies that have
listed since 2010 is about 30 per cent higher than the corresponding cash ratio for companies that
listed in the late 1980s. These estimates are obtained from the fixed effects in Equation (3) and so
are conditional estimates that control for differences between cohorts in other observed
characteristics (e.g. size, investment opportunities and leverage).
The trend in the aggregate cash ratio is, at least in part, due to differences in latent factors
between companies that list today compared to companies that listed several decades ago. One
explanation for this is that companies in recent cohorts are more reliant on intangible capital in
their production technology, such as ‘knowledge workers’, relative to companies in older cohorts.
Such capital may be harder to pledge as collateral to raise debt financing, thereby increasing
companies’ precautionary demand for cash (Falato, Kadyrzhanova and Sim 2013).24
23 The conditional time trend is quite strongly associated with the ‘net opportunity cost of cash’ – measured as the
return on business deposits less the cost of borrowing. This suggests that the ‘economy wide’ opportunity cost of
allocating assets to cash might also play a role in explaining the secular trend in corporate cash holdings.
24 The cohort estimates may also be affected by sample survivorship bias. In unreported results, we find that there is a
positive correlation between cash holdings and the probability of failure. This suggests that surviving companies
have lower cash holdings than the average company in their own cohort. This, in turn, implies that some of the
observed increase in cash holdings across cohorts might be due to survivorship bias.

23
Figure 8: Cash Ratios
By cohort, ‘Before 1955’ = 100
Note: Estimated as the average of the company fixed effects from Equation (3) by listing cohort
Sources Authors’ calculations; Bloomberg; Morningstar
7. Extensions and Robustness Tests
7.1 The Cash Flow Sensitivity of Corporate Cash
In this section we further examine the role of agency costs and financing frictions in determining
corporate cash holdings by extending the literature that looks at the ‘cash flow sensitivity’ of cash
(Almeida, Campello and Weisbach 2004). Almeida et al focus primarily on the role of financing
frictions. They develop a model to show that financially constrained companies have a positive
propensity to save their cash flows due to their restricted access to external capital markets, while
unconstrained companies do not. They test their model by examining how US public companies
adjust their cash holdings in response to shocks to cash flows (referred to as the cash flow
sensitivity of cash).
We apply their framework to the Australian data and broaden their analysis to incorporate agency
costs by comparing the cash flow sensitivity of cash for private companies to that of public
companies. Public companies may be more likely than private companies to accumulate cash out
of cash flows during good times because they face higher agency costs. Similar to before, in the
presence of agency costs and financing frictions, it is unclear whether the cash holdings of public
or private companies should be more sensitive to shocks to cash flows. But, the finding that the
cash holdings of public companies are relatively more (less) sensitive to cash flows provides
evidence in support of agency costs (financing frictions).
Befo
re1955
1955
to1959
1960
to1964
1965
to1969
1970
to1974
1975
to1979
1980
to1984
1985
to1989
1990
to1994
1995
to1999
2000
to2004
2005
to2009
2010
to2014
90
100
110
120
130
index
90
100
110
120
130
index

24
To examine the cash flow sensitivity of cash we make a slight adjustment to the company-level
model estimated in Equation (1). In particular, rather than look at the correlation between the
level of cash (to assets) and cash flows, we now look at the correlation between the change in
cash holdings and cash flows (Almeida et al 2004; Bao, Chan and Zhang 2012). Moreover, we
estimate the model separately for private companies (j = PRIV) and unlisted public companies
(j = PUB):
j j j j j
it it it i itCASH CASHFLOW CONTROLS (4)
We are particularly interested in differences in the estimated coefficient on the variable
CASHFLOW (). If companies respond to positive cash flow shocks by raising the rate at which
they save cash out of cash flows then we would expect the coefficient estimate to be positive
( > 0). Furthermore, if agency costs matter, then public companies should have a significantly
higher propensity to accumulate cash out of cash flows ( PUB PRIV ). Alternatively, if financing
frictions matter, the sensitivity to cash flow should be greater for private companies
( PRIV PUB ).
The results presented in Table 6 shows that both private and unlisted public companies have a
positive propensity to save cash out of cash flows. This suggests that both financing frictions and
agency costs could motivate companies to accumulate cash out of earnings in good times.
Moreover, we find that the coefficient on cash flow is nearly twice as large for public companies as
for private companies. And a nested regression that combines the two samples reveals that this
difference is statistically significant. This provides further evidence in favour of the agency costs
hypothesis.
Table 6: The Role of Company Characteristics
Public and private companies, fixed effects model
Unlisted public Private
SIZE –0.01 0.02**
AGE –0.00 –0.00***
CAPEX –0.41*** –0.31***
CASHFLOW 0.34*** 0.19***
RISK 0.02 –0.01
WORKINGCAPITAL –0.07*** –0.12***
LEVERAGE 0.02 0.04***
Number of observations 3 522 9 757
Within R2 0.22 0.17
Company fixed effects Yes Yes
Notes: Sample includes all company-year observations with non-missing values for the independent variables; outliers excluded;
robust standard errors clustered at the industry level used to accommodate within-industry serial correlation; ***, **,
and * denote significance at the 1, 5 and 10 per cent level, respectively
Sources: Authors’ calculations; D&B
25
7.2 Comparing Private and Public Company Cash Holdings Using Propensity Score Matching
To control for potential sample selection issues, we also employ matching techniques to examine
differences in the level of cash ratios across public and private companies.
In an ideal world, these selection concerns would be overcome by designing an experiment that
assigns companies randomly to being either public or private. But, the choice to go public is
confounded with a number of company characteristics that are likely to be correlated with the level
of cash holdings (Brav 2009). As such, we implement propensity score matching to compare the
cash holdings of public and private companies after matching them on observable company
characteristics.
Specifically, we use ‘nearest neighbour’ matching that uses an average of the cash ratio from the
‘nearest’ private companies to impute an estimated counterfactual cash ratio for each public
company. The set of nearest private companies is obtained by estimating the ‘distance’ between
pairs of observations with regard to a set of company characteristics. A public company’s nearest
private company(s) is obtained using a weighted function of the covariates for each observation.
In this application the Mahalanobis distance is used, where the weights are based on the inverse
of the covariates’ variance-covariance matrix. The difference between observed cash holdings and
the imputed counterfactual level of cash holdings for each public company then yields an estimate
of the selection effect.
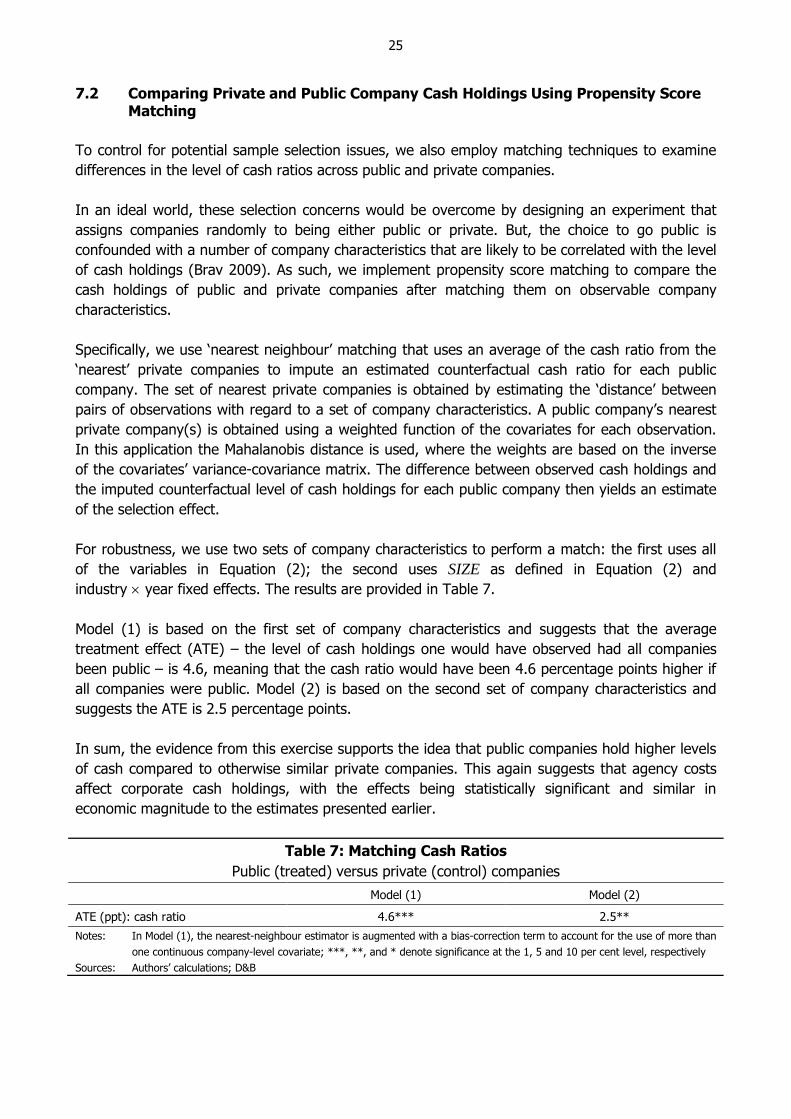
For robustness, we use two sets of company characteristics to perform a match: the first uses all
of the variables in Equation (2); the second uses SIZE as defined in Equation (2) and
industry year fixed effects. The results are provided in Table 7.
Model (1) is based on the first set of company characteristics and suggests that the average
treatment effect (ATE) – the level of cash holdings one would have observed had all companies
been public – is 4.6, meaning that the cash ratio would have been 4.6 percentage points higher if
all companies were public. Model (2) is based on the second set of company characteristics and
suggests the ATE is 2.5 percentage points.
In sum, the evidence from this exercise supports the idea that public companies hold higher levels
of cash compared to otherwise similar private companies. This again suggests that agency costs
affect corporate cash holdings, with the effects being statistically significant and similar in
economic magnitude to the estimates presented earlier.
Table 7: Matching Cash Ratios
Public (treated) versus private (control) companies
Model (1) Model (2)
ATE (ppt): cash ratio 4.6*** 2.5**
Notes: In Model (1), the nearest-neighbour estimator is augmented with a bias-correction term to account for the use of more than
one continuous company-level covariate; ***, **, and * denote significance at the 1, 5 and 10 per cent level, respectively
Sources: Authors’ calculations; D&B

26
8. Conclusion
Our analysis of corporate cash holdings in Australia indicates that public companies hold more cash
than otherwise similar private companies, on average, and their cash holdings are more sensitive
to cash flows. These findings suggest that agency costs play some role in determining cash
holdings in Australia.
We also find that the trend increase in cash holdings of public companies over recent decades is
largely explained by changes in observable company characteristics. In particular, relative to their
counterparts of 25 years ago, publicly listed companies today have better investment opportunities
(as measured by Tobin’s Q) and are more likely to operate in industries with more volatile profits –
such as information technology, pharmaceuticals and biotechnology – and these characteristics are
correlated with higher levels of corporate cash. After accounting for these factors, our estimates
indicate that, by historical standards, corporate cash holdings of Australian publicly listed
companies are not unusually high.
Overall, we find that, in the face of financing frictions, some companies have precautionary and
speculative motives for holding cash. To the extent that the speculative motive matters, high levels
of corporate cash could be taken as evidence that economic conditions are expected to improve in
the future, rather than being a sign of perceived weakness in the economy.

27
Appendix A: Tax Minimisation and Cash Management Behaviour of
Multinational Companies
Media reports and academic research have suggested that the high cash holdings of US companies
can be explained by the nature of the US corporate tax system and, in particular, the repatriation
taxes that apply to multinational companies. However, there are reasons to suspect that this
hypothesis does not explain the high cash holdings of Australian companies.
Broadly speaking, under both the US and Australian corporate tax systems, multinational
companies pay taxes based on their worldwide income. In effect, the tax paid on foreign-sourced
revenue is determined by the difference between the taxes actually paid abroad and the taxes that
would be paid if the revenue had been generated domestically. However, there is an important
difference in the timing of when these taxes are paid. In the United States, taxation takes place
when earnings are repatriated (i.e. returned from overseas), while in Australia, taxation applies
when earnings are earned. (That is, assessable foreign income needs to be included on the
company’s Australian tax return. The way in which an Australian company deals with the issue of
‘double taxation’ largely depends on the foreign jurisdiction within which the company operates.)
This tax structure provides some incentive to US companies to keep foreign earnings abroad in
order to minimise their tax. These funds will tend to be held in cash in times of limited foreign
investment opportunities.25 Australian companies have less incentive to do this.
Despite the media attention, the academic literature is mixed on the effect of repatriation taxes on
cash holdings, even for the United States. Foley et al (2007) looked at the contribution of
repatriation taxes towards corporate cash holdings and found that companies that are subject to
higher repatriation taxes hold significantly more cash. But, this finding was challenged by Bates
et al (2009). The authors were able to identify companies with foreign pre-tax income and found
no evidence that cash holdings increase more for companies with foreign pre-tax income.
Pinkowitz et al (2013) also found limited evidence for the tax repatriation hypothesis. They
compared US multinationals to other US companies and showed that the multinationals did not
experience a greater increase in cash holdings. They also showed that the 2009 US corporate tax
holidays – designed to temporarily reduce the tax cost of repatriation – did not reduce the cash
holdings of multinationals.
While the repatriation tax motive may not apply in Australia, more broadly, Australian companies
may still have incentives to accumulate cash reserves offshore for tax minimisation purposes. To
examine this, we compared the conditional cash ratios of companies identified as having the
lowest average annual effective tax rates (low tax companies) to the cash ratios of all other
publicly listed companies in the Morningstar sample. The results (available upon request) suggest
that the cash ratios of these two company groups were very similar, which suggests that tax
avoidance is not a significant determinant of aggregate cash holdings in Australia.
25 US companies may also have a tendency to hold these funds in liquid instruments to give them flexibility to respond
to changes to tax legislation that would enable them to repatriate their earnings, such as the US corporate tax
holidays that were enacted in 2004.

28
Appendix B: Corporate Cash and Asset Concentration
This appendix explores the concentration of corporate cash and total asset holdings in Australia
(Figure B1). We consider a range of different indicators of concentration (or ‘inequality’) in cash
holdings.
Figure B1: Corporate Cash and Asset Concentration
Note: Log levels of real cash holdings and real total assets are used
Sources: Authors’ calculations; Morningstar
Our findings indicate that some of the high concentration of cash simply reflects the fact that the
distribution of company size is highly skewed, with a few large companies and many small
companies; that is, not only is cash very concentrated, but all other types of assets too. For
example, the share of cash held by the top 1 per cent of companies by assets is quite similar to
the share of assets held by the same top 1 per cent (although the Gini coefficient and the ratio of
the 75th percentile to 25th percentile suggest that cash is more unevenly distributed across
companies than total assets).
More importantly, all the indicators show that the concentration of cash holdings has declined over
time. Indeed, unlike the situation in the United States, where as of year-end 2013, the largest
1 per cent held 36 per cent of total cash, up 9 percentage points over the last five years, we find
that the largest 1 per cent of Australian companies have been holding a decreasing share of cash
(and total assets). In 2004, for example, the largest 1 per cent of companies held 33 per cent of
cash, whereas the latest estimates show they now hold 27 per cent. This suggests that the secular
rise in cash is not due to just the behaviour of the largest companies in Australia.
Gini coefficient
0.30
0.35
0.40
ratio
Total assets
p75/p25
2.5
3.0
3.5
%
Cash
Top 1% share
2004199420
30
40
50
% Top 10% share
20041994 201460
70
80
90
%

29
Appendix C: Estimates of Sample Selection Bias
The D&B company database is not a census of companies. Rather, the sample of companies may
be biased given that companies are typically selected into the database because they have applied
to D&B for a credit report. It follows that sample selection bias could be a problem if the cash
management behaviour of companies that apply for credit is different to those companies that do
not.
To gauge the importance of this bias, we match the sample of publicly listed companies in the
D&B database to the sample of publicly listed companies in the Morningstar database. We then
look for differences in the sample composition and, more importantly, differences in cash
management behaviour that could affect our main results. This test relies on two key assumptions:
1) the Morningstar companies are assumed to be representative of the population of listed
companies; and 2) the selection rules for companies appearing in the D&B database are the same
for listed and unlisted companies.
Summary statistics of the two separate samples are shown in Table C1.
Table C1: Summary Statistics for Publicly Listed Companies
2005 to 2014
D&B Morningstar
Mean Median Mean Median
Size 3.6 3.3 3.4 3.1
Cash ratio (%) 22.9 11.9 27.5 16.2
Age (years) 19 13 17 12
Growth (%) 10.5 6.1 12.3 7.1
Number of observations 10 619 13 957
Number of companies 1 830 1 900
Note: Size measured as the natural logarithm of total assets and growth measured as the annual change in the logarithm of
total sales
Sources: Authors’ calculations; D&B; Morningstar
Morningstar listed companies are very similar to their D&B counterparts in terms of size, age and
sales growth, on average. The only notable difference is that Morningstar companies appear to
have slightly higher cash-to-asset ratios on average. To more formally test for selection bias, and
differences between the two samples, we estimate the following regression model:
ijt i ijt i ijt j t ijtCASH MORNING X MORNING X
where the dependent variable is the cash-to-assets ratio of company i in industry j in year t. Our
key explanatory variable is a dummy variable (MORNING) that is equal to one if the listed
company is in the Morningstar database and is zero otherwise. The estimated coefficient on this
dummy variable captures the mean difference in cash holdings between the Morningstar and D&B
companies. It therefore directly captures any selection bias inherent in the D&B database, to the
extent that the Morningstar database is representative of the population of Australian companies.
We also include a set of control variables (X), including size, age and sales growth, as well as

30
industry dummies () and year dummies (). We also interact the dummy MORNING with each of
the control variables to gauge whether the relationship between cash holdings and its
determinants varies across the two samples.
As Table C2 highlights, the cash-to-assets ratio of Morningstar companies is larger than that of
comparable D&B companies by about 5 percentage points on average (column (1)). However, this
result disappears when we control for observed company characteristics (column (2)). The
sensitivity of cash holdings to sales growth varies across the two samples, but otherwise there are
no significant differences between the two samples. This gives us some comfort that our results
are not particularly sensitive to sample selection bias.
Table C2: Sample Selection Bias Estimates
(1) (2)
MORNING 0.05*** –0.017
SIZE –0.04***
AGE –0.00
GROWTH 0.01***
MORNINGSIZE 0.00
MORNINGAGE 0.00
MORNINGGROWTH –0.02***
Constant 0.23*** 0.38***
Number of observations 24 576 14 264
Within R2 0.01 0.21
Industry fixed effects Yes Yes
Notes: Robust standard errors clustered at the company level used to accommodate within-company serial correlation; ***, **,
and * denote significance at the 1, 5 and 10 per cent level, respectively
Sources: Authors’ calculations; D&B; Morningstar

31
Appendix D: Comparing Public and Private Company Cash: Hausman-Taylor
Estimates
The CRE model assumes that the correlation between the fixed effect in Equation (1) and each of
the explanatory variables does not change over time. But it is possible, for instance, that a
company’s (unobserved) willingness to take risk (as captured by the fixed effect) is correlated
more with past shocks to cash flow than with current shocks (perhaps because a company’s
management learned from its past ‘mistakes’). In this case, the correlation would vary over time.
To address this possibility, we also estimate an HT model.
This model provides an alternative way in which to estimate the effect of time-invariant variables,
such as the PUBLIC dummy, while also allowing for an unobserved fixed effect in corporate cash
decisions.
Given the HT model is non-standard it is helpful to sketch out the model in some detail. The model
relies on the assumption that the unobserved fixed effect is correlated with some explanatory
variables, but not others.26
We re-write Equation (2), but partition the time-varying explanatory variables Xit into two sub-sets
– a sub-set that is assumed to be correlated with the fixed effect (X1it) and one that is
uncorrelated with the fixed effect (X2it):
1 1 2 2it i it it i itCASH PUBLIC X X
where all the other variables are as before. Assume:
1 , 0i it iE X PUBLIC
2 0i itE X
We can obtain consistent estimates of the effects of the time-varying explanatory variables, 1 and
2, using a standard fixed effects estimator that relies on differences from the ‘temporal’ mean:
1 1 1 2 2 2it i it i it i it iCASH CASH X X X X
where 1 1 /i t itX X T is the temporal mean of the explanatory variables that are assumed to be
correlated with the fixed effect (i) and 2 2 /i t itX X T is the equivalent mean for the
explanatory variables that are uncorrelated with the fixed effect. By assumption, the temporal
mean ( 2iX ) can act as an instrument for the PUBLIC dummy and produce an unbiased estimate
of its causal effect ().
The model is estimated in two steps, with the last step similar to a 2-stage least squares
regression model. In the first step, the model is estimated using the FE estimator. From this we
26 Under the random effects model, the fixed effect is assumed to be uncorrelated with any explanatory variables.
Under the fixed effects model, the fixed effect is assumed to be correlated with all the explanatory variables.
32
obtain the residuals, which capture the variation in cash holdings that are not due to either the
fixed effect or the time-varying observable characteristics (e.g. size, age, cash flow, etc). In the
second step, we regress the estimated residuals on an instrumented PUBLIC dummy. The
PUBLIC dummy is instrumented using the temporal means of the variables that are assumed to
be uncorrelated with the fixed effect. Because we only have one time-invariant explanatory
variable of interest (PUBLIC), we only require one ‘exogenous’ variable at this stage. In this
instance, we choose AGE as an instrument for the PUBLIC dummy, as all other variables are
likely to be governed by explicit company-level choices, which could be correlated with the
unobserved company-level decision to hold cash (captured by the fixed effect).27
Turning to the results, relative to the CRE estimates presented in Table 4, the results are even
stronger in the HT model, with a significant difference between public and private companies’
cash-to-assets ratios of 10 percentage points. This provides complimentary evidence in favour of
agency costs playing a role in the determination of corporate cash polices.
27 The variable AGE also appears to be reasonably well correlated with the PUBLIC dummy (correlation of 0.3),
thereby allaying some concerns over weak instrumentation.

33
References
Adão B and AC Silva (2015), ‘The Effect of Firm Cash Holdings on Monetary Policy’, Unpublished
manuscript, Banco de Portugal, March.
Akguc S and JJ Choi (2013), ‘Cash Holdings in Private and Public Firms: Evidence from Europe’, Paper
presented at The University of Sydney Business School seminar, Sydney, 21 May.
Almeida H, M Campello and MS Weisbach (2004), ‘The Cash Flow Sensitivity of Cash’, The Journal of
Finance, 59(4), pp 1777–1804.
Asker J, J Farre-Mensa and A Ljungqvist (2011), ‘Comparing the Investment Behavior of Public and
Private Firms’, NBER Working Paper No 17394.
Bao D, KC Chan and W Zhang (2012), ‘Asymmetric Cash Flow Sensitivity of Cash Holdings’, Journal of
Corporate Finance, 18(4), pp 690–700.
Bates TW, KM Kahle and RM Stulz (2009), ‘Why Do U.S. Firms Hold So Much More Cash than They
Used To?’, The Journal of Finance, 64(5), pp 1985–2021.
Begenau J and B Palazzo (2015), ‘Firm Selection and Corporate Cash Holdings’, Paper presented at the
2015 Meeting of the Society for Economic Dynamics, Warsaw, 25–27 June.
Brav O (2009), ‘Access to Capital, Capital Structure, and the Funding of the Firm’, The Journal of Finance,
64(1), pp 263–308.
Brown G and N Kapadia (2007), ‘Firm-Specific Risk and Equity Market Development’, Journal of Financial
Economics, 84(2), pp 358–388.
Chamberlain G (1982), ‘Multivariate Regression Models for Panel Data’, Journal of Econometrics, 18(1),
pp 5–46.
Dittmar A and J Mahrt-Smith (2007), ‘Corporate Governance and the Value of Cash Holdings’, Journal
of Financial Economics, 83(3), pp 599–634.
Dittmar A, J Mahrt-Smith and H Servaes (2003), ‘International Corporate Governance and Corporate
Cash Holdings’, The Journal of Financial and Quantitative Analysis, 38(1), pp 111–133.
Dybvig PH and M Warachka (2015), ‘Tobin’s q Does Not Measure Firm Performance: Theory, Empirics,
and Alternatives’, Unpublished manuscript, March.
Erickson T and TM Whited (2012), ‘Treating Measurement Error in Tobin’s q ’, The Review of Financial
Studies, 25(4), pp 1286–1329.
Falato A, D Kadyrzhanova and JW Sim (2013), ‘Rising Intangible Capital, Shrinking Debt Capacity, and
the US Corporate Savings Glut’, Board of Governors of the Federal Reserve System Finance and Economics
Discussion Series No 2013-67.
Fang A, M Kosev and D Wakeling (2015), ‘Trends in Australian Corporate Financing’, RBA Bulletin,
December, pp 29–38.

34
Foley CF, JC Hartzell, S Titman and G Twite (2007), ‘Why Do Firms Hold so Much Cash? A Tax-Based
Explanation’, Journal of Financial Economics, 86(3), pp 579–607.
Gao H, J Harford and K Li (2013), ‘Determinants of Corporate Cash Policy: Insights from Private Firms’,
Journal of Financial Economics, 109(3), pp 623–639.
Gao X (2013), ‘Corporate Cash Hoarding: The Role of Just-In-Time Adoption’, Unpublished manuscript,
National University of Singapore.
Gogineni S, SC Linn and PK Yadav (2012), ‘Evidence on the Determinants of Cash Holdings by Private
and Public Companies’, Paper presented at the 2012 FMA (Financial Management Association International)
European Conference, Istanbul, 6–8 June.
Harford J, SA Mansi and WF Maxwell (2008), ‘Corporate Governance and Firm Cash Holdings in the
US’, Journal of Financial Economics, 87(3), pp 535–555.
Horioka CY and A Terada-Hagiwara (2013), ‘Corporate Cash Holding in Asia’, NBER Working Paper
No 19688.
IMF (International Monetary Fund) (2014), ‘Perspectives on Global Real Interest Rates’, World
Economic Outlook: Recovery Strengthens, Remains Uneven, World Economic and Financial Surveys,
International Monetary Fund, Washington DC, pp 81–112.
Iskander-Datta ME and Y Jia (2012), ‘Cross-Country Analysis of Secular Cash Trends’, Journal of
Banking & Finance, 36(3), pp 898–912.
Jensen MC (1986), ‘Agency Costs of Free Cash Flow, Corporate Finance, and Takeovers’, The American
Economic Review, 76(2), pp 323–329.
Keynes JM (1936), The General Theory of Employment Interest and Money, Macmillan and Co, Limited,
London.
Miller MH and D Orr (1966), ‘A Model of the Demand for Money by Firms’, The Quarterly Journal of
Economics, 80(3), pp 413–435.
Mundlak Y (1978), ‘On the Pooling of Time Series and Cross Section Data’, Econometrica, 46(1),
pp 69–85.
Myers SC and NS Majluf (1984), ‘Corporate Financing and Investment Decisions When Firms Have
Information That Investors Do Not Have’, Journal of Financial Economics, 13(2), pp 187–221.
Opler T, L Pinkowitz, RM Stulz and R Williamson (1999), ‘The Determinants and Implications of
Corporate Cash Holdings’, Journal of Financial Economics, 52(1), pp 3–46.
Ozkan A and N Ozkan (2004), ‘Corporate Cash Holdings: An Empirical Investigation of UK Companies’,
Journal of Banking & Finance, 28(9), pp 2103–2134.
Pinkowitz L, RM Stulz and R Williamson (2013), ‘Is There a U.S. High Cash Holdings Puzzle after the
Financial Crisis?’, The Ohio State University, Charles A. Dice Center for Research in Financial Economics
Working Paper No 2013-7.

35
Pinkowitz L and R Williamson (2001), ‘Bank Power and Cash Holdings: Evidence from Japan’, The
Review of Financial Studies, 14(4), pp 1059–1082.
Riddick LA and TM Whited (2009), ‘The Corporate Propensity to Save’, The Journal of Finance, 64(4),
pp 1729–1766.
Shuetrim G, P Lowe and S Morling (1993), ‘The Determinants of Corporate Leverage: A Panel Data
Analysis’, RBA Research Discussion Paper No 9313.
Sánchez JM and E Yurdagul (2013), ‘Why Are Corporations Holding so Much Cash?’, The Regional
Economist, January, pp 4–8.
Sufi A (2009), ‘Bank Lines of Credit in Corporate Finance: An Empirical Analysis’, The Review of Financial
Studies, 22(3), pp 1057–1088.