Research, Demand & Environment Chapter 5. Class: June 1st Sorzal: Group in-class exercise Lecture...
75
Research, Demand & Environment Chapter 5
-
Upload
juniper-harvey -
Category
Documents
-
view
214 -
download
0
Transcript of Research, Demand & Environment Chapter 5. Class: June 1st Sorzal: Group in-class exercise Lecture...

Research, Demand & Environment
Chapter 5

Class: June 1st
• Sorzal: Group in-class exercise
• Lecture and discussion: Marketing Research
• Break
• Article Discussion: Mismanagement of Loyalty/Wal-Mart/How Global Brands Compete/Video: Stealth Marketing

The Role of Marketing Research
• What do we want information on?
• How can we use it?
• What are the advantages of research?
Marketing Research: the process of planning, collecting, and analyzing data relevant to a marketing decision.

Roles of Marketing Research
• Descriptive: gathering & presenting factual statements
• Diagnostic: explaining data
• Predictive: attempting to estimate the results of a planned marketing decision

Purposes of Research
• Planning– Segmentation: what kinds of people buy our
products? Where do they live? How much do they earn? How many are there?
– Demand estimation: Are the markets for our products increasing or decreasing? Are there promising markets that we have not yet reached?
– Environmental Assessment: Are the channels of distribution for our product changing? What should our Internet presence be?
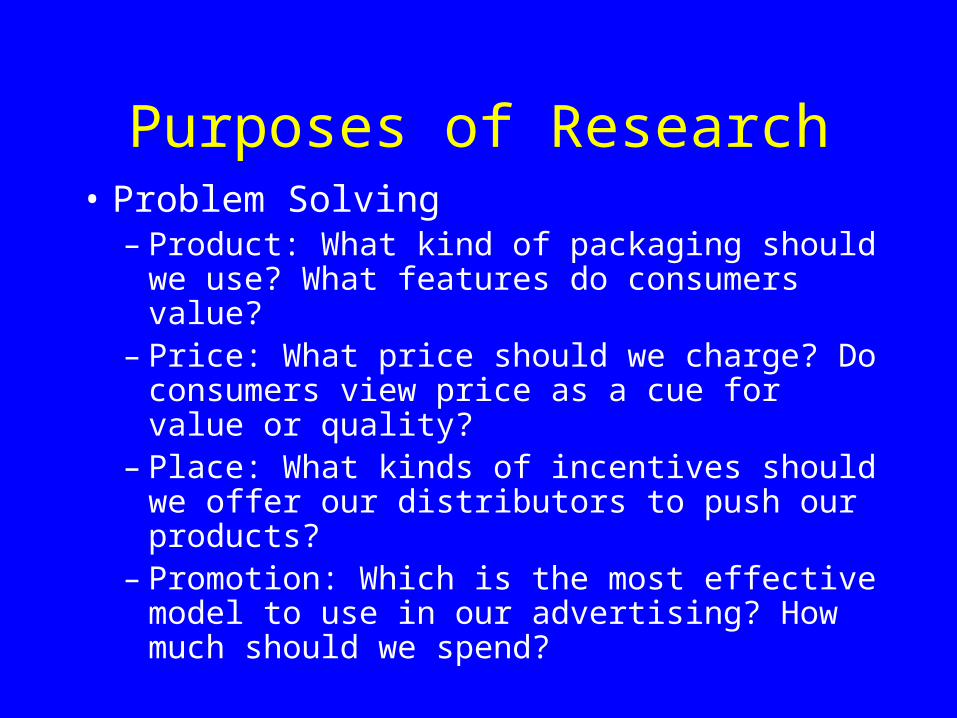
Purposes of Research• Problem Solving
– Product: What kind of packaging should we use? What features do consumers value?
– Price: What price should we charge? Do consumers view price as a cue for value or quality?
– Place: What kinds of incentives should we offer our distributors to push our products?
– Promotion: Which is the most effective model to use in our advertising? How much should we spend?

Purposes of Research
• Control– What is our market share overall? By
customer type? Geographic area?– Are customers satisfied with our products?
How is our record for customer service? Do customer service levels vary by market?
– What is our reputation in the community?
Difficulties with Research
• Take it seriously
• Make a decision like they would in “real life”
• Honest answers
• Response rates

Are you on the A List?

The Marketing Research Process
CollectCollectDataData
CollectCollectDataData
SpecifySpecifySamplingSamplingProcedureProcedure
SpecifySpecifySamplingSamplingProcedureProcedure
Plan Design/Plan Design/Primary DataPrimary DataPlan Design/Plan Design/Primary DataPrimary Data
DefineDefineProblemProblemDefineDefine
ProblemProblem
AnalyzeAnalyzeDataData
AnalyzeAnalyzeDataData
Prepare/Prepare/PresentPresentReportReport
Prepare/Prepare/PresentPresentReportReport
Follow UpFollow UpFollow UpFollow Up
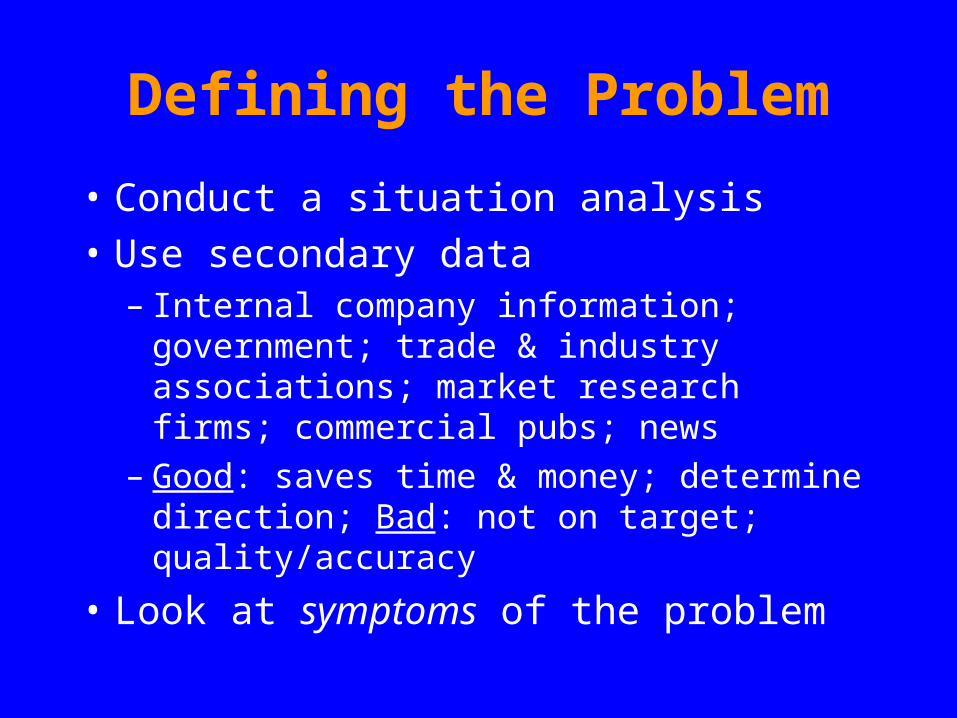
Defining the Problem
• Conduct a situation analysis
• Use secondary data– Internal company information; government;
trade & industry associations; market research firms; commercial pubs; news
– Good: saves time & money; determine direction; Bad: not on target; quality/accuracy
• Look at symptoms of the problem

Areas to Consider for Problems• Company analysis
– Sales & profits; internal information; external information; library
• Product & Brand analysis– How does the product match w/ c’s needs
and wants? How is it perceived? Brand personality?
• Competitive analysis– Identify options; perceptual maps

Some tools
• Simmons Study of Media and Markets (SRMB) and Media Mark Research (MMR) – reports on the usage of brand in 800 categories
• VALS – used for segmenting consumers

Age Influences on ConsumptionAge Influences on Consumption4-1
18-24 25-34 35-44 45-54 55-64 65+ProductsTequila 156 174 115 57 64 5Scotch 44 66 98 143 119 137Laptop/notebook 94 115 124 139 98 15Doctor visits 74 88 91 107 110 135
ActivitiesBarbecuing 69 116 139 130 82 32Aerobics 171 140 118 99 28 18Cruise ship 60 80 95 114 144 121Volunteer work 75 96 117 121 97 82
100 = Average level of use, purchase, or consumptionSource: Mediamark Spring 1997 (New York: Mediamark Research, Inc., 1997).

Age Influences on ConsumptionAge Influences on Consumption4-1 (II)
18-24 25-34 35-44 45-54 55-64 65+ShoppingMontgomery Ward 91 87 106 94 117 110The Gap 217 140 85 82 52 26Dominos Pizza 161 132 124 80 52 30Marie Callenders 77 80 105 135 110 96
MediaReader’s Digest 64 75 96 109 119 144Rolling Stone 290 158 93 46 14 2MTV 286 153 81 42 22 16CNN 73 93 99 114 117 107
100 = Average level of use, purchase, or consumptionSource: Mediamark Spring 1997 (New York: Mediamark Research, Inc., 1997).

Occupational Influences on Consumption
Occupational Influences on Consumption4-2
Technical/Administration/ Clerical/ Precision/Managerial Sales Craft
ProductsDomestic beer 98 72 185Luggage 136 106 84Cigarettes 87 83 165Diet colas 128 111 89Laptop/notebook 234 143 56
ActivitiesSailing 299 67 105Archery 91 82 239Dining out 147 118 98Lottery 105 101 131
100 = Average level of use, purchase, or consumptionSource: Mediamark Spring 1997 (New York: Mediamark Research, Inc., 1997).

Occupational Influences on Consumption
Occupational Influences on Consumption4-2 (II)
Technical/Administration/ Clerical/ Precision/Managerial Sales Craft
ShoppingWal-Mart 94 102 1,009Ann Taylor 245 131 33Olive Garden 123 122 77Bonanza 53 100 109
MediaPlayboy 85 96 230Outside 193 94 58Jazz radio 189 126 66Country radio 96 109 126
100 = Average level of use, purchase, or consumptionSource: Mediamark Spring 1997 (New York: Mediamark Research Inc., 1997).

Education Level Influences on Consumption
Education Level Influences on Consumption4-3
Graduated Did NotGraduated Attended High GraduateCollege College School High School
ProductsChampagne 143 117 86 53Chewing Tobacco 56 98 114 134Laptop/notebook 227 118 52 16Heavy video rental 73 125 112 74
ActivitiesTennis 188 129 54 41Lottery 78 100 120 91Hunting (with rifle) 88 102 118 77Cook for fun 131 119 83 69
100 = Average level of use, purchase, or consumptionSource: Mediamark Spring 1997 (New York: Mediamark Research Inc., 1997).

Education Level Influences on Consumption
Education Level Influences on Consumption4-3 (II)
Graduated Did NotGraduated Attended High GraduateCollege College School High School
ShoppingVenture 87 98 104 110Banana Republic 174 131 62 39Church’s Fried Chicken 59 90 107 48TGI Friday’s 152 125 78 46
MediaNational Enquirer 46 107 127 112National Geographic 148 113 77 61The Nashville Network 62 97 123 106BRAVO 146 130 82 40
100 = Average level of use, purchase, or consumptionSource: Mediamark Spring 1997 (New York: Mediamark Research Inc., 1997).

VALS2 Lifestyle SystemVALS2 Lifestyle System12-5
Principle
Fulfilled
Believer
Status
Achiever
Striver
Action
Experiencer
Maker
Actualizer
Struggler
Abundant resources
Minimal resources
Source: SRI International.

VALS2 Segment Activities 2nd Media Use*
VALS2 Segment Activities 2nd Media Use*12-6
Act
ual
izer
Fu
lfill
ed
Bel
ieve
r
Ach
ieve
r
Str
iver
Exp
erie
nce
r
Mak
er
Str
ug
gle
r
Barbecue outdoors 125 93 82 118 111 109 123 50Do gardening 155 129 118 109 68 54 104 80Do gourmet cooking 217 117 96 103 53 133 86 47Drink coffee daily 120 119 126 88 87 55 91 116Drink herbal tea 171 125 89 117 71 115 81 68Drink domestic beer 141 88 73 101 87 157 123 50Drink imported beer 238 93 41 130 58 216 88 12Do activities with kids 155 129 57 141 112 89 116 32Play team sports 114 73 69 104 110 172 135 34Do cultural activities 293 63 67 96 45 154 63 14Exercise 145 114 69 123 94 143 102 39Do home repairs 161 113 85 82 53 88 171 58
* Figures under each segment are the index for each segment (100 = Base rate usage).
Segment
Source: SRI International.
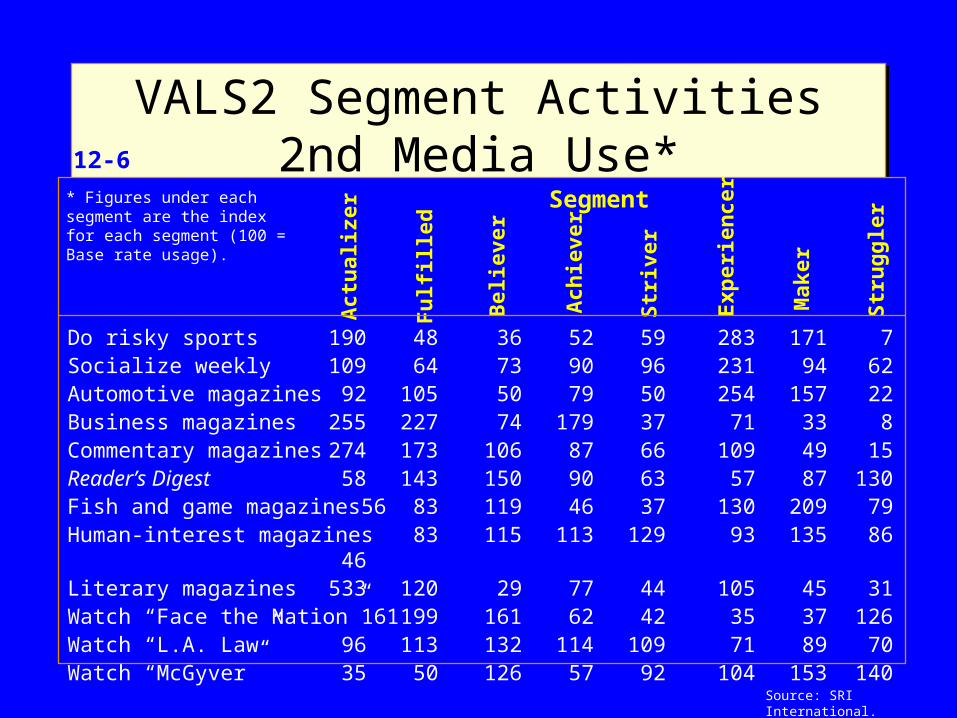
VALS2 Segment Activities 2nd Media Use*
VALS2 Segment Activities 2nd Media Use*12-6 (II)
Act
ual
izer
Fu
lfill
ed
Bel
ieve
r
Ach
ieve
r
Str
iver
Exp
erie
nce
r
Mak
er
Str
ug
gle
r
Do risky sports 190 48 36 52 59 283 171 7Socialize weekly 109 64 73 90 96 231 94 62Automotive magazines 92 105 50 79 50 254 157 22Business magazines 255 227 74 179 37 71 33 8Commentary magazines 274 173 106 87 66 109 49 15Reader’s Digest 58 143 150 90 63 57 87 130Fish and game magazines 56 83 119 46 37 130 209 79Human-interest magazines 83 115 113 129 93 135 86 46Literary magazines 533 120 29 77 44 105 45 31Watch “Face the Nation” 161 199 161 62 42 35 37 126Watch “L.A. Law” 96 113 132 114 109 71 89 70Watch “McGyver” 35 50 126 57 92 104 153 140
* Figures under each segment are the index for each segment (100 = Base rate usage).
Segment
Source: SRI International.

Research Plan/Design
• Specifies research questions to be answered, how & when the data is gathered & analysis
• Primary data– Good: answers specific question; data is
current; source is known; Bad: expensive; quality declines if long interviews; response issues

Research Methods
• Quantitative Measures (Surveys)
• Qualitative Measures – (In-Depth,Focus Group)
• Which is better? – One is words, one is numbers.– One is confirmatory, one is exploratory.– What does the research call for?

Qualitative Research
• In- depth interviews
• One on one– Unstructured interviewing
• (core concept)
– Semi-structured interviewing• Small number of questions
– Standard open-ended– Key informant interview
Things to consider
• Role of interviewer is key!
• Motivate/Put at ease/No bias/Rehearse
• Pacing- according to respondent/ don’t but in
• Opening = Establish the tone
• Middle game = protocol questions and additional probing/ ask why?/ elaborate
• Wrap Up = sense of closure
• Questions: Broad and few

Focus Groups
• Subjects should be recruited with little priming!
• Role of the moderator is make or break!– Training is crucial/Rehearse– Keep the group focused on subject at hand.– Understand what it is you’re measuring.– Tailor moderator style to the group.– Keep the discussion flowing.
Types of questions
• Open-ended
• Clear and easy to understand- no bias
• Sequenced from easy to hard.
• Ordered from least to most personal
• Sessions should be recorded/ notes taken by another individual out of view of group.
Surveys
• What are you measuring?– Determine question content, scope, purpose– Choose a response format– Word the question to get at area of interest
Ordering and placement of questions crucial!Opening questionsSensitive questions (disclaimer)

Survey checklist
• Start with easy questions.
• Threatening, personal questions near end
• When switching topics – transition
• Avoid response tendency bias
Survey Question Issues• Specificity is the key.
• What types of questions asked?
• Question complexity (break it up).
• Do you need screening questions?
• Bias – no leading questions
• Is the question necessary?
• Are several questions needed?
• Can the question be misunderstood?– What kind of headache remedy do you use?

Open-Ended Response Format
• Unprobed:– Unaided awareness: “List some competing
brands of toothpaste.– Store choice: “What grocery store receives the
majority of your household’s purchases?
• Probed: – “Can you think of anymore brands?– “Are there anymore stores where you shop?

Closed-Ended Response Format
• Dichotomous: Only two choices– Good for qualifying items, screening questions
• Multiple category: More than two choices

Who is your major wholesaler?
Affiliated Foods (1)
Topco (2)
Fleming Foods (3)
Other (4)
Closed-ended item that is nominally coded.

Measuring Attitude ComponentsCognitive Component (Measuring Beliefs about Specific
Attributes Using the Semantic Differential Scale)
Diet CokeStrong taste —— —— —— —— —— —— —— Mild taste
Low priced —— —— —— —— —— —— —— High priced
Caffeine free —— —— —— —— —— —— —— High in caffeine
Distinctive in —— —— —— —— —— —— —— Similar in taste totaste most
© The McGraw-Hill Companies, Inc., 1998

Measuring Attitude ComponentsAffective Component (Measuring Feelings about Specific
Attributes Using Likert Scales)
Neither Agree
Strongly nor StronglyAgree Agree Disagree Disagree Disagree
I like the taste of Diet Coke. —— —— —— —— ——
Diet Coke is overpriced. —— —— —— —— ——
Caffeine is bad for your health. —— —— —— —— ——
I like Diet Coke. —— —— —— —— ——

Measuring Attitude ComponentsBehavioral Component (Measuring Actions or Intended Actions)
The last soft drink I consumed was a ___________________.
I usually drink________________soft drinks.
What is the likelihood you will buy Diet Coke Definitely will buy
the next time you purchase a soft drink? Probably will buy
Might buy
Probably will not buy
Definitely will not buy

VALIDITY AND RELIABILITY OF MEASUREMENTS
• Validity: Accuracy– Conceptual Issue– Face Validity– Predictive Validity
• Reliability: Consistency– Proportion of statistical error– Test-Retest– Inter-Item Correlation
• Increasing the number of questions (items) can increase both the validity and reliability of a scale.
Types of Research: Observation
• People watching people– Mystery shoppers– Focus groups
• People watching activities– Audits; “The Science of Shopping”
• Machines watching people– Traffic counters– Passive people meters
Types of Research: Other types
• Projective techniques
• Association tests
• Experiments
• Test marketing
• Other techniques (response latency, galvanic skin tests)

Research in Context
Purpose:
Data → Information → Insight → Inspiration
The Raw StuffWhat we gather. Basis for describing:•the marketplace, •target consumer and •their behavior

Research in Context
Purpose:
Data → Information → Insight → Inspiration
•Analysis•When data is analyzed, simplified and reported•Charts•Tables•Graphs•T-tests, p-values
Traditional stopping place

Missing?
“The intuitive mind is a sacred gift and the rational mind is a faithful servant. We have created a society that honors the servant and has forgotten the gift.” - Albert Einstein

Research in Context
Purpose:
Data → Information → Insight → Inspiration
What It Is•Not facts
•Obvious facts are already known
•Patterns•Implications•Creative interpretation of information
Desirable Characteristics•Simple/clear•Actionable•Managerial Relevance

Research in Context
Purpose:
Data → Information → Insight → Inspiration
Inspire Who?•Creative
•Create an ad that consumers will respond to.
•Consumers•To respond to ad, and act on it.
Inspire what?•Action!

Get at the “Truth”• Socially Desirable Responding
– “If he wants me to criticize…”– “I’m not affected by advertising.”
• Political Correctness– Moral high ground
• Don’t know why or what– Don’t count on respondents to know.
• Hotel Gym:– 70% “Very Important”– 17% actually use ‘em.

Get at the “Truth”
• Don’t “ASK”– “Most important characteristic of disability
insurance?”– How can we get you to drink more milk?
• Who asked
• Watch body language (leaning forward; eyes open & laughing)
• Where asked– “Natural Habitat”

The Story of Porsche – using qualitative techniques
• Porsche – 1986 over 30,000 sold; 1993 less than 4000 (model change, recession, price increase…) Is it the 80s car???
• Research Part I (a) – Nonusers & thought bubbles• Part I (b) More qualitative data – 1000 people
interviewed; 200 people had bad things to say.

Porsche continued…
• Research Part II: What is your dream car? Draw your ultimate dream car. 8-10 year olds say….
• Sports car, red, Porsche, check out the detail….
Porsche continued…
• Research Part III: Luxury car owners – “Draw the way you feel about your car”
• BMW, Mercedes, Infiniti and Lexus:– In driveways– Outside looking in– Hood ornaments– Airbags– Luxurious leather seats– Hifi systems– Enjoyment- owning and being cocooned.
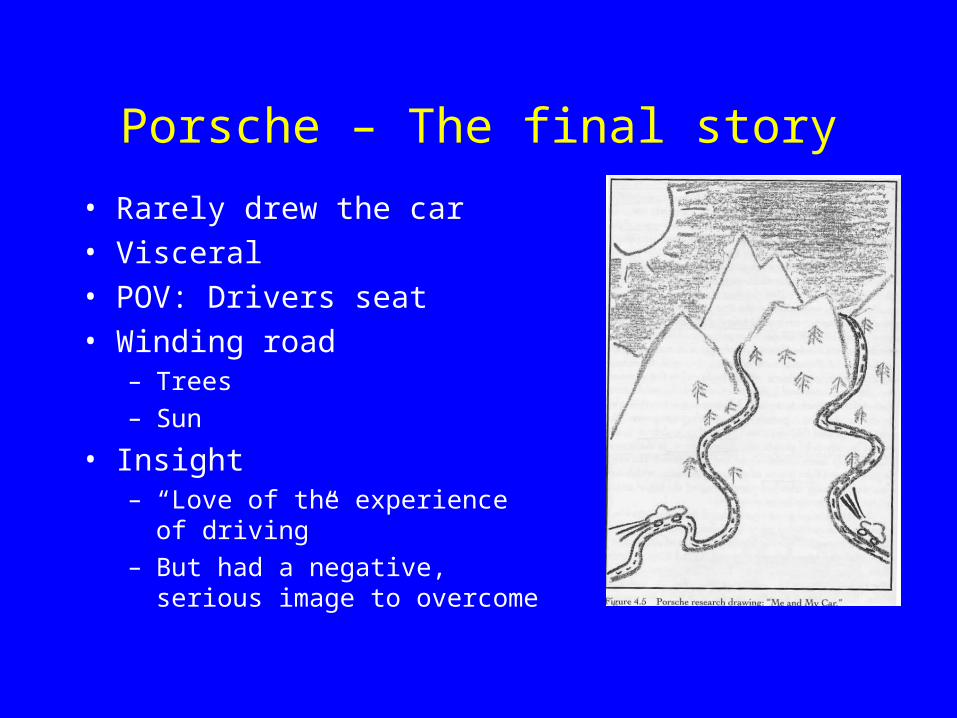
Porsche – The final story
• Rarely drew the car• Visceral• POV: Drivers seat• Winding road
– Trees– Sun
• Insight– “Love of the experience of
driving”– But had a negative, serious
image to overcome

The Story of Cuervo Gold
• Qualitative/objective– Rated tequila and Cuervo– Mapped: “Good drinks”, “Fun times”, “Real
people”
• Created over 30 campaigns– Tested quantitatively in malls at 10 am– Who is in the mall at 10 am?
• Could not get all three

Problem??• Ignored the subjective• In focus groups:
– Laughter– Sideways glances– Bury faces– Stories– “Imagine a party where they were answering the
door to arriving guests each of whom was toting a 6 pack of beer. Imagine one guest arrives carrying a bottle of Cuervo. What does that signify?”

The Story of New Coke• 1950s
– Pepsi defined Coke– Started the Pepsi Generation
• 1975– Sugar crisis
• Pepsi Challenge– Coke’s response: “The Real Thing”, “Coke is
it”
• Initial research problem/question– Why are we hemorrhaging market share?

Focus Groups
• “Why aren’t you drinking as much Coke as you used to?”
• “But I’m drinking as much as I need. I drink it when I’m thirsty, and I drink it when it’s hot. I drink it when I’m eating a hamburger.”
Focus Groups
• “What would it take for you to drink more..”
• “Nothing.”
Open-ended questions
• “What do you think of Coke?”
• And yet we still lose market share….
• “Coke is a part of my life. It’s the one that understands my feelings. It’s the one that’s been around for a long time.”

New Coke: The Research
• “…We ourselves had fallen for Pepsi’s point– that taste was the only thing that mattered.”
- Sergio Zyman
• New Formulas– Blind taste tests– New formulations against Pepsi, Old Coke

More Research
• “What would you do if we gave you a product that tasted better than Pepsi, but still was Coke.”
• “Would you like that?”
• “I would buy it.”
• “Sure I would like it.”

New Coke Launch
• Introduced w/ great fanfare in 1985.
• Such a huge success that…– Coca-Cola Classic
reintroduced 77 days later.
• Where’d they go wrong?

“The Question”
• “If we took away Coca-Cola and gave you New Coke, would you accept it?”
• Instead, understood out later:– “Well, yeah, we do like the taste [of New Coke] but
we just remembered that’s not the only reason we buy Coke. We buy Coke for the totality of the product and that includes the fact that it’s old and familiar and we feel comfortable with it.”
• Did they know this ahead of time?
YES!
• Remember…– “Coke is a part of my life. It’s the one that
understands my feelings. It’s the one that’s been around for a long time.”

Wrong (narrow) focus
• “Shoppers don’t buy blind.”– Blind Taste Tests– Bought Pepsi’s Line
• How would Pepsi have done if the taste tests weren’t blind?
– Coke’s poor problem definition• Bought into the conventional wisdom

Collect Data & Report
• Use field service firm for collection
• Report includes: objectives, explanation of research design, summary of major findings, conclusions with recommendations

The Impact of the Internet• Use it for data collection, focus groups,
chat rooms, web clicks
• Makes it easier & faster; shift response for customer needs; follow up studies easier and slashes labor & time intensive activities
• Improve participation and personalization

Forecasting Demand
• Market demand – total volume that would be bought by a defined customer group in a defined geographical area in a defined time period in a defined marketing environment under a defined marketing program.
• Company Demand• Sales Forecast

Estimating Demand
• Forecasting– Survey of buying intention, composite of
sales force opinions, expert opinions, past sales analysis, market test method

External Environment
DemographicsDemographics
SocialChangeSocial
Change
EconomicConditionsEconomicConditions
Political & Legal FactorsPolitical &
Legal Factors
TechnologyTechnology
CompetitionCompetition
EnvironmentalScanning
Target Market
ProductDistributionPromotion
Price
ProductDistributionPromotion
Price
External Environment is not controllable Ever-Changing
Marketplace