RESEARCH Comparing mechanistic and empirical model ...
12
RESEARCH PAPER Comparing mechanistic and empirical model projections of crop suitability and productivity: implications for ecological forecasting L. D. Estes 1 *†, B. A. Bradley 2 †, H. Beukes 3 , D. G. Hole 4 , M. Lau 1 , M. G. Oppenheimer 1 , R. Schulze 5 , M. A. Tadross 6 and W. R. Turner 4 1 STEP Program, Woodrow Wilson School, Princeton University, Princeton, NJ 08540, USA, 2 Environmental Conservation, University of Massachusetts, Amherst, MA 01003, USA, 3 Institute for Soil, Climate, and Water, Agricultural Research Council, Stellenbosch 2599, South Africa, 4 Betty and Gordon Moore Center for Ecosystem Science and Economics, Conservation International, Arlington, VA 22202, USA, 5 School of Bioresources Engineering and Environmental Hydrology, University of KwaZulu-Natal, Pietermaritzburg 3209, South Africa, 6 Climate Systems Analysis Group, University of Cape Town, Rondebosch 7701, South Africa ABSTRACT Aim Intercomparison of mechanistic and empirical models is an important step towards improving projections of potential species distribution and abundance. We aim to compare suitability and productivity estimates for a well-understood crop species to evaluate the strengths and weaknesses of mechanistic versus empirical modelling. Location South Africa. Methods We compared four habitat suitability models for dryland maize based on climate and soil predictors. Two were created using maximum entropy (MAXENT), the first based on national crop distribution points and the second based only on locations with high productivity. The third approach used a gener- alized additive model (GAM) trained with continuous productivity data derived from the satellite normalized difference vegetation index (NDVI). The fourth model was a mechanistic crop growth model (DSSAT) made spatially explicit.We tested model accuracy by comparing the results with observed productivity derived from MODIS NDVI and with observed suitability based on the current spatial distribution of maize crop fields. Results The GAM and DSSAT results were linearly correlated to NDVI-measured yield (R 2 = 0.75 and 0.37, respectively). MAXENT suitability values were not lin- early related to yield (R 2 = 0.08); however, a MAXENT model based on occurrences of high-productivity maize was linearly related to yield (R 2 = 0.62). All models produced crop suitability maps of similarly good accuracy (Kappa = 0.73–75). Main conclusions These findings suggest that empirical models can achieve the same or better accuracy as mechanistic models for predicting both suitability (i.e. species range) and productivity (i.e. species abundance). While MAXENT could not predict productivity across the species range when trained on all occurrences, it could when trained with a high-productivity subset, suggesting that ecological niche models can be adjusted to better correlate with species abundance. Keywords Abundance, ecological niche model, empirical model, habitat suitability model, intercomparison, maize, mechanistic model, South Africa, species distribution model. *Correspondence: Lyndon D. Estes, Princeton University, Science, Technology, and Environmental Policy Program, Woodrow Wilson School, Princeton, NJ, USA. E-mail: [email protected] †Equal contributors. INTRODUCTION Understanding the habitat needs of species, and projecting their future distributions, is a major research focus in ecology (Guisan & Zimmermann, 2000). Climate change is projected to alter the distribution and abundance of species (MA, 2005), and may lead to numerous extinctions (Thomas et al., 2004). Predictive habitat models are thus needed for applications ranging from Global Ecology and Biogeography, (Global Ecol. Biogeogr.) (2013) 22, 1007–1018 © 2013 John Wiley & Sons Ltd DOI: 10.1111/geb.12034 http://wileyonlinelibrary.com/journal/geb 1007
Transcript of RESEARCH Comparing mechanistic and empirical model ...
RESEARCHPAPER
Comparing mechanistic and empiricalmodel projections of crop suitabilityand productivity: implications forecological forecastingL. D. Estes1*†, B. A. Bradley2†, H. Beukes3, D. G. Hole4, M. Lau1,
M. G. Oppenheimer1, R. Schulze5, M. A. Tadross6 and W. R. Turner4
1STEP Program, Woodrow Wilson School,
Princeton University, Princeton, NJ 08540,
USA, 2Environmental Conservation, University
of Massachusetts, Amherst, MA 01003, USA,3Institute for Soil, Climate, and Water,
Agricultural Research Council, Stellenbosch
2599, South Africa, 4Betty and Gordon Moore
Center for Ecosystem Science and Economics,
Conservation International, Arlington,
VA 22202, USA, 5School of Bioresources
Engineering and Environmental Hydrology,
University of KwaZulu-Natal,
Pietermaritzburg 3209, South Africa, 6Climate
Systems Analysis Group, University of Cape
Town, Rondebosch 7701, South Africa
ABSTRACT
Aim Intercomparison of mechanistic and empirical models is an important steptowards improving projections of potential species distribution and abundance. Weaim to compare suitability and productivity estimates for a well-understood cropspecies to evaluate the strengths and weaknesses of mechanistic versus empiricalmodelling.
Location South Africa.
Methods We compared four habitat suitability models for dryland maize basedon climate and soil predictors. Two were created using maximum entropy(MAXENT), the first based on national crop distribution points and the secondbased only on locations with high productivity. The third approach used a gener-alized additive model (GAM) trained with continuous productivity data derivedfrom the satellite normalized difference vegetation index (NDVI). The fourthmodel was a mechanistic crop growth model (DSSAT) made spatially explicit. Wetested model accuracy by comparing the results with observed productivity derivedfrom MODIS NDVI and with observed suitability based on the current spatialdistribution of maize crop fields.
Results The GAM and DSSAT results were linearly correlated to NDVI-measuredyield (R2 = 0.75 and 0.37, respectively). MAXENT suitability values were not lin-early related to yield (R2 = 0.08); however, a MAXENT model based on occurrencesof high-productivity maize was linearly related to yield (R2 = 0.62). All modelsproduced crop suitability maps of similarly good accuracy (Kappa = 0.73–75).
Main conclusions These findings suggest that empirical models can achieve thesame or better accuracy as mechanistic models for predicting both suitability (i.e.species range) and productivity (i.e. species abundance). While MAXENT couldnot predict productivity across the species range when trained on all occurrences,it could when trained with a high-productivity subset, suggesting that ecologicalniche models can be adjusted to better correlate with species abundance.
KeywordsAbundance, ecological niche model, empirical model, habitat suitability model,intercomparison, maize, mechanistic model, South Africa, species distributionmodel.
*Correspondence: Lyndon D. Estes, PrincetonUniversity, Science, Technology, andEnvironmental Policy Program, WoodrowWilson School, Princeton, NJ, USA.E-mail: [email protected]†Equal contributors.
INTRODUCTION
Understanding the habitat needs of species, and projecting their
future distributions, is a major research focus in ecology (Guisan
& Zimmermann, 2000). Climate change is projected to alter the
distribution and abundance of species (MA, 2005), and may lead
to numerous extinctions (Thomas et al., 2004). Predictive
habitat models are thus needed for applications ranging from
bs_bs_banner
Global Ecology and Biogeography, (Global Ecol. Biogeogr.) (2013) 22, 1007–1018
© 2013 John Wiley & Sons Ltd DOI: 10.1111/geb.12034http://wileyonlinelibrary.com/journal/geb 1007
biodiversity conservation planning (Kremen et al., 2008) to
invasive species risk management (Thuiller et al., 2005).
Similarly, the agricultural impact of climate change is also a
prominent research field (Rosenzweig et al., 2007). Projections
of shifting agricultural zones (Ramankutty et al., 2002) and
reduced crop yield (Parry et al., 2004; Lobell et al., 2008) indi-
cate that agricultural change will affect human development
goals. Despite similar challenges, the ecological and agricultural
disciplines have taken different approaches to modelling distri-
bution and abundance (or yield, in the case of crops) under
climate change. Agricultural change studies are often based on
mechanistic modelling, while ecological projections typically
rely on empirical modelling.
In mechanistic modelling, productivity (crop yield) is
determined by equations representing a crop’s physiological
responses to environmental variables (see Jones et al., 2003, and
Keating et al., 2003, for two widely used examples). However,
such models require a high degree of environmental detail, so
input data can be difficult to acquire across broad, environmen-
tally diverse regions.
Mechanistic models in ecology are uncommon because the
necessary physiological information is rarely available. Further,
natural communities are influenced by complex interspecific
interactions, population dynamics and dispersal pathways,
which make mechanistic models even more challenging to
develop. Mechanistic models developed for ecosystems typically
focus on a single mechanism of species establishment or persist-
ence, such as succession (e.g. LANDIS; He et al., 1996). Alterna-
tively, ecological models might include multiple mechanisms by
characterizing plant functional types rather than particular
species (Cramer et al., 2001).
Identifying current and/or future habitat for particular
species usually relies on empirical models (also termed biocli-
matic envelope, niche, habitat suitability and species distribu-
tion models) to project changes in distribution (Guisan &
Zimmermann, 2000; Pearson & Dawson, 2003; Franklin, 2010).
In empirical models, correlations between species distributions
and abiotic predictors such as climate are used to assess habitat
suitability. Although predictor variables are often selected based
on knowledge of a species’ physiology, they may also be chosen
based on empirical best fit without a specific link to physiology.
Empirical models have therefore been criticized for their lack of
mechanistic representation of abiotic or biotic interactions
(Dormann, 2007).
Uncertainty associated with all types of ecological projections
has prompted calls for greater integration and comparison of
modelling approaches. Recommendations for integration typi-
cally involve comparing outputs from multiple empirical
models in an ensemble (Araújo & New, 2007) or combining
empirical with mechanistic models of species dispersal, distur-
bance or population (Keith et al., 2008; Franklin, 2010; Huntley
et al., 2010). Calls for more comparison have been echoed by
agricultural impact modellers, who are concerned about bias
introduced by model-specific representations of key physiologi-
cal processes (Tubiello et al., 2007). However, despite the clear
need for integrated model development, few studies have com-
bined empirical and mechanistic models due to the challenges of
developing the various approaches for species or ecosystems
(Keith et al., 2008; Morin & Thuiller, 2009).
Crop modelling provides a unique opportunity to compare
mechanistic and empirical suitability models. Well-tested
mechanistic crop models are available (Jones et al., 2003;
Keating et al., 2003) and can be applied spatially. Distributional
information for crop fields and crop type are also available, and
provide a reasonable approximation of bioclimatic needs for
empirical modelling provided crops are not irrigated.
Here, we created four distinct models for maize suitability and
productivity in South Africa. Three models were empirical, one
based on maximum entropy (MAXENT; Phillips et al., 2006)
trained on maize distribution data, the second based on
MAXENT but trained only on high-productivity maize loca-
tions, and the third based on generalized additive models
(GAMs). The fourth was the mechanistic ‘decision support
system for agrotechnology transfer cropping system’ model
(DSSAT; Jones et al., 2003). Matching input climate and soil
variables as closely as possible, we compared the models’ pre-
dictions of habitat suitability and crop productivity. This
comparison provided further insight into the strengths and
weaknesses of mechanistic and empirical modelling approaches.
DATA AND METHODS
Background
The characteristics of our study area and target crop species are
advantageous for comparing empirical and mechanistic model-
ling approaches. South Africa has a large, diverse agricultural
sector (Byrnes, 1996), in which maize is the most widely grown
and consumed crop, providing 41% of calories in the South
African diet (FAO, 2009). Dryland maize accounts for 88–90%
of South Africa’s maize hectarage (Byrnes, 1996; FAO, 2009),
and is grown wherever environmental conditions and land use
allow it, suggesting that maize approximates its climatic niche
within South Africa. This niche corresponds with the summer
rainfall (October–April) region where precipitation exceeds c.
425 mm year–1, and to a lesser extent on South Africa’s eastern
and south-eastern margins where rainfall is more evenly distrib-
uted throughout the year (Fig. 1).
Mechanistic model
The mechanistic model we chose for this study was the CERES
maize module of version 4.5.0.47 of DSSAT (Jones et al., 2003).
DSSAT integrates modules for soil processes, soil–plant–
atmosphere interactions, daily weather and management into a
model that simulates one season’s crop growth on a single
homogeneous field of arbitrary size. DSSAT can be imple-
mented spatially by geographically indexing fields, and has been
previously used for regional (Jones & Thornton, 2003) and
South Africa-specific climate impact assessments (du Toit et al.,
2000; Walker & Schulze, 2008).
L. D. Estes et al.
Global Ecology and Biogeography, 22, 1007–1018, © 2013 John Wiley & Sons Ltd1008

Predictor variables
We obtained weather data (precipitation, minimum/maximum
temperature and solar radiation) from the South African
quinary catchment database, which provides daily weather
records for 5838 polygons defining the watersheds of South
Africa, Lesotho and Swaziland (Schulze & Horan, 2010). We
obtained soil data by merging the South Africa land-type
memoirs (SIRI, 1987) with topographic data used to identify
landforms. We also created new interpolations of soil organic
carbon based on regional soil profiles collected by the Agricul-
tural Research Council. Appendix S1 in the Supporting Infor-
mation describes the soil parameters and associated methods.
To map the individual fields to be simulated by DSSAT, we
merged the quinary catchments and mapped landforms to
define 107,140 unique climate–soil combinations each with an
average area of 11 km2.
The required DSSAT management parameters are row
spacing, planting density, planting date and fertilization
amount. Using management data reported from national maize
cultivar trials conducted from 2005–09 (Ma’ali et al., 2006–
2009), we estimated these parameters using linear relation-
ships between the reported values and mean annual rainfall
(Appendix S2).
Mechanistic model calibration
DSSAT simulates cultivar-specific plant–environment interac-
tions using a set of genetic coefficients that require calibration to
local conditions. We used coefficients representing a generic
short–medium season maize cultivar that were developed for a
previous South Africa-focused study (du Toit et al., 2000).
We ran DSSAT for each season between 1979 and 1999,
re-initializing the model every season. Planting occurred auto-
matically within a period beginning 14 days before the estimated
planting date (Appendix S2) and ending on 15 January, as soon
as the top 25 cm of soil had �70% plant available moisture
content. We applied 32 kg ha–1 of N fertilizer (the mean from the
trial reports) at planting.
Empirical models
We developed maize models using two approaches widely used
in ecology, the GAM and MAXENT (Phillips et al., 2006).
MAXENT relies on presence-only data to develop the species–
environment relationship, while GAMs are fitted to categorical
or continuous response variables. Several ecological processes
that add uncertainty to empirical results are minimized in the
case of crops, including biotic interactions (maize farms are
managed monocultures) and constraints to migration (humans
plant maize almost wherever it can grow) (Morin & Thuiller,
2009), although fertilizer application and diverse management
practices introduce new sources of error.
Predictor variables
Unlike DSSAT’s daily time step, empirical models are typically
based on climatological predictors drawn from interpolated
Figure 1 South African maizedistribution and average precipitation.The map shows mean annual rainfall(mm), the percentage of annualprecipitation falling between Octoberand March (black isolines) and thedistribution of the 25,199 ProducerIndependent Cropping Estimate System(PICES) observations of dryland maizeused in the study (brown points). Theinset, which corresponds to the blacksquare in the main map, shows thespatio-temporal distribution of PICESpoints in relation to digitized crop fieldboundaries within a 20 km ¥ 20 kmneighbourhood. Point colours correspondto the year of maize observation asfollows: green, 2006; blue, 2007; red,2008; white, 2009.
Crop model intercomparison
Global Ecology and Biogeography, 22, 1007–1018, © 2013 John Wiley & Sons Ltd 1009
datasets (e.g. WorldClim, Hijmans et al., 2005), which provide
monthly precipitation and temperature estimates for the late
1900s. To be consistent with both typical ecological approaches
and the mechanistic model, we used interpolated monthly
climate records for South Africa for the time period 1979–99
calculated from the daily quinary catchment data (Schulze &
Horan, 2010). We calculated TMin and TMax for the coldest and
hottest months of the maize growing season (October to April)
and total precipitation for the same interval. These variables are
consistent with the DSSAT modelling timeframe and provide
important climatic predictors for maize growth.
In addition to climate variables, we included soil depth and
topsoil organic carbon, which were shown to significantly
improve the accuracy of MAXENT-derived maize suitability
maps for the study area (Bradley et al., 2012). All predictor vari-
ables were standardized to a grid with 1-km resolution.
However, climate and soil values still reflected a mean climate–
soil unit size of 11 km2.
Dependent variables
We used two independent sets of remotely sensed data to esti-
mate maize distribution and maize productivity (yield). Maize
distribution was obtained from the Producer Independent
Cropping Estimate System (PICES) surveys commissioned by
South Africa’s National Department of Agriculture (SiQ, 2007).
PICES is an annual, countrywide aerial survey that provides
crop area estimates used in calculating national agricultural pro-
duction (see Appendix S2).
Spatial maize productivity (yield) data were unavailable for
South Africa, so we estimated yields by integrating time series of
250-m resolution, 16-day composite normalized difference veg-
etation index (NDVI) data collected by the Moderate Resolution
Imaging Spectrometer (MODIS; http://lpdaac.usgs.gov), which
we extracted using PICES points. Following Paruelo & Lauen-
roth (1998), we calculated NDVI integrals (hereafter NDVIINT)
of time series corresponding to PICES points. To obtain pure
maize NDVI signals, we excluded points where much of the
MODIS pixel fell outside the field, resulting in 14,736 points
with associated yearly NDVIINT values. Appendix S2 contains
further details of the NDVIINT methodology and its justification.
To evaluate the effectiveness of NDVIINT as a proxy for South
African maize yield, we analysed correlations between provincial
maize yield estimates for 2006–09 (Crop Estimates Committee,
2011) and yearly NDVIINT values aggregated to these scales.
For the MAXENT model, we aggregated the PICES points and
their associated NDVIINT values to a 1-km resolution in order to
minimize spatial autocorrelation, resulting in 11,390 maize dis-
tribution points. To create binary suitability models (see Suit-
ability), we also created a maize ‘absence’ dataset by randomly
selecting 11,390 points from outside the maize-growing region
(identified by a convex hull around presence points).
For the GAM model, we used continuous NDVIINT values as
the response variable. To minimize potential errors due to (1)
the temporal mismatch between our climatic data (1979–99)
and the NDVI data (2006–09), and (2) location-specific, inter-
annual variability in NDVI, we required that input NDVIINT
values be averaged over at least three of the four observation
years. To meet this requirement, and because the spatial distri-
bution of PICES points varied by year, we averaged the NDVIINT
values across both space and time, which required a coarser
resolution than the 1-km aggregation used for MAXENT. We
used a 20-km resolution for aggregation, which was the
minimum size needed to spatially represent the maize growing
region and temporally represent at least three growing seasons
per grid cell, resulting in 436 averages of the original set of
NDVIINT values.
Empirical model calibration
We fitted a MAXENT model (MAXENT version 3.3.3) using the
1-km aggregated PICES observations and the entire country of
South Africa as potential sampling for pseudo-absence loca-
tions. We refer to this model at MAXENTFULL.
Because MAXENT (and other empirical models based on
presence or presence/absence) is designed to model suitability or
likelihood of occurrence, not productivity, we also created a
subset of the distribution points corresponding to the top
10% of 1-km aggregated NDVIINT values to determine whether
this high-productivity subset could produce suitability results
that were better correlated to productivity. We hypothesized
that an empirical model of ‘suitability for high productivity’
would be better correlated to maize productivity measured
throughout the country. We fitted the MAXENT model to
the high-productivity subset using all of South Africa as poten-
tial pseudo-absence locations (including present but low-
productivity maize occurrences). We refer to this model as
MAXENTGT90.
We used R (R Core Development Team, 2011) to fit the
GAM to a random selection of half of the 436 20-km NDVIINT
values, and used the second half to assess model accuracy. Asso-
ciated predictor variables were aggregated to the same 20-km
resolution.
Model comparison
Productivity
To test how well each model predicted crop productivity (yield),
we used simple regressions to assess the relationships between
NDVIINT and each model’s output values. DSSAT simulated
yields were first averaged over the 20-year simulation period for
each location, and then aggregated to the 20-km resolution used
to construct the GAM. Both MAXENTFULL and MAXENTGT90
models were also aggregated to the 20-km resolution for com-
parison to NDVIINT. Regressions for DSSAT and both MAXENT
models against NDVI were performed using all 436 observa-
tions, while separate regressions of the GAM predicted NDVIINT
values were made for the training and test datasets (each with
218 observations). A schematic representation of the compara-
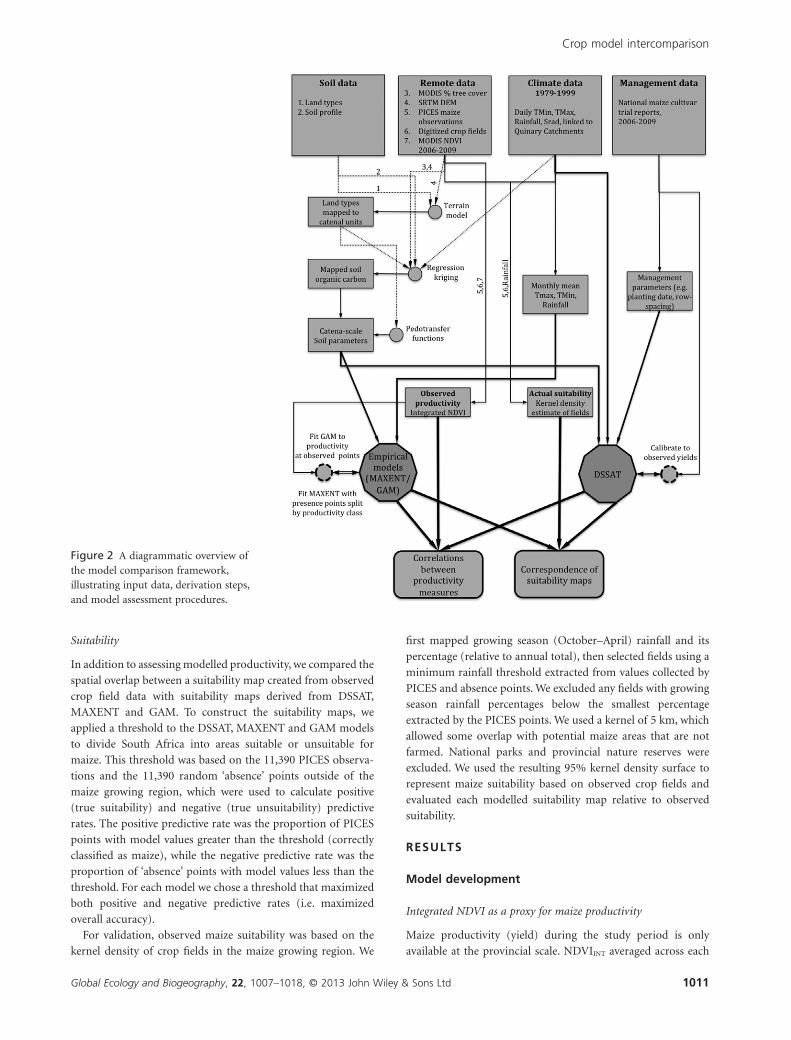
tive modelling methodology is shown in Fig. 2.
L. D. Estes et al.
Global Ecology and Biogeography, 22, 1007–1018, © 2013 John Wiley & Sons Ltd1010
Suitability
In addition to assessing modelled productivity, we compared the
spatial overlap between a suitability map created from observed
crop field data with suitability maps derived from DSSAT,
MAXENT and GAM. To construct the suitability maps, we
applied a threshold to the DSSAT, MAXENT and GAM models
to divide South Africa into areas suitable or unsuitable for
maize. This threshold was based on the 11,390 PICES observa-
tions and the 11,390 random ‘absence’ points outside of the
maize growing region, which were used to calculate positive
(true suitability) and negative (true unsuitability) predictive
rates. The positive predictive rate was the proportion of PICES
points with model values greater than the threshold (correctly
classified as maize), while the negative predictive rate was the
proportion of ‘absence’ points with model values less than the
threshold. For each model we chose a threshold that maximized
both positive and negative predictive rates (i.e. maximized
overall accuracy).
For validation, observed maize suitability was based on the
kernel density of crop fields in the maize growing region. We
first mapped growing season (October–April) rainfall and its
percentage (relative to annual total), then selected fields using a
minimum rainfall threshold extracted from values collected by
PICES and absence points. We excluded any fields with growing
season rainfall percentages below the smallest percentage
extracted by the PICES points. We used a kernel of 5 km, which
allowed some overlap with potential maize areas that are not
farmed. National parks and provincial nature reserves were
excluded. We used the resulting 95% kernel density surface to
represent maize suitability based on observed crop fields and
evaluated each modelled suitability map relative to observed
suitability.
RESULTS
Model development
Integrated NDVI as a proxy for maize productivity
Maize productivity (yield) during the study period is only
available at the provincial scale. NDVIINT averaged across each
Figure 2 A diagrammatic overview ofthe model comparison framework,illustrating input data, derivation steps,and model assessment procedures.
Crop model intercomparison
Global Ecology and Biogeography, 22, 1007–1018, © 2013 John Wiley & Sons Ltd 1011

province explained 67% of the variance in measured provincial
maize yield (R2 = 0.67, RMSE = 0.19). If each of the four years is
treated independently, R2 = 0.59 with RMSE = 0.17 (Fig. 3).
Empirical model fits
The GAM model fit used 22 degrees of freedom and explained
72% of variance, with each of the smoothing terms being highly
significant (P < 0.001) (Appendix S3 describes the GAM in
further detail).
The MAXENT model fit to all maize occurrences (MAXENT-
FULL) relied primarily on growing season precipitation (56% of
model contribution), followed by soil depth (15%), soil organic
carbon (13%), growing season maximum temperature (9%)
and growing season minimum temperature (7%). MAXENTFULL
had an overall area under the curve (AUC) statistic of 0.78 (with
the country of South Africa as total potential predicted area).
The MAXENT model fit to the high-productivity maize points
(MAXENTGT90; the top 10% of NDVIINT) was even more
strongly influenced by precipitation (72% of model contribu-
tion), followed by growing season maximum temperature
(10%), soil depth (9%), growing season minimum temperature
(6%) and soil organic carbon (3%). MAXENTGT90 had an overall
AUC statistic of 0.91 (with the country of South Africa, includ-
ing maize occurrences in the bottom 90th percentile as total
potential predicted area).
Productivity comparison
DSSAT yield had a weak correlation to maize productivity
(based on NDVIINT), with an R2 of 0.37 (Table 1). DSSAT yields
skewed towards lower values and had higher variance at high
NDVIINT values (Fig. 4a), but alternative model specifications
did not appreciably increase correlations (Appendix S3). The
GAM model output was the best predictor of NDVIINT. GAM
predictions showed a linear correlation to NDVIINT with an R2 of
0.75 and a correspondence of near 1:1 (Fig. 4b, Table 1). The
MAXENTFULL model output is a poor predictor of maize yield,
with an R2 of 0.08. MAXENTFULL output has a high variance at
low productivity values and does not show a positive relation-
ship to NDVIINT (Fig. 4c). However, when the MAXENT model
is trained on high-productivity occurrence points, the predic-
tion of productivity improves dramatically. The MAXENTGT90
model shows a strong positive linear relationship with NDVIINT
with an R2 of 0.62 (Fig. 4d, Table 1).
Suitability comparison
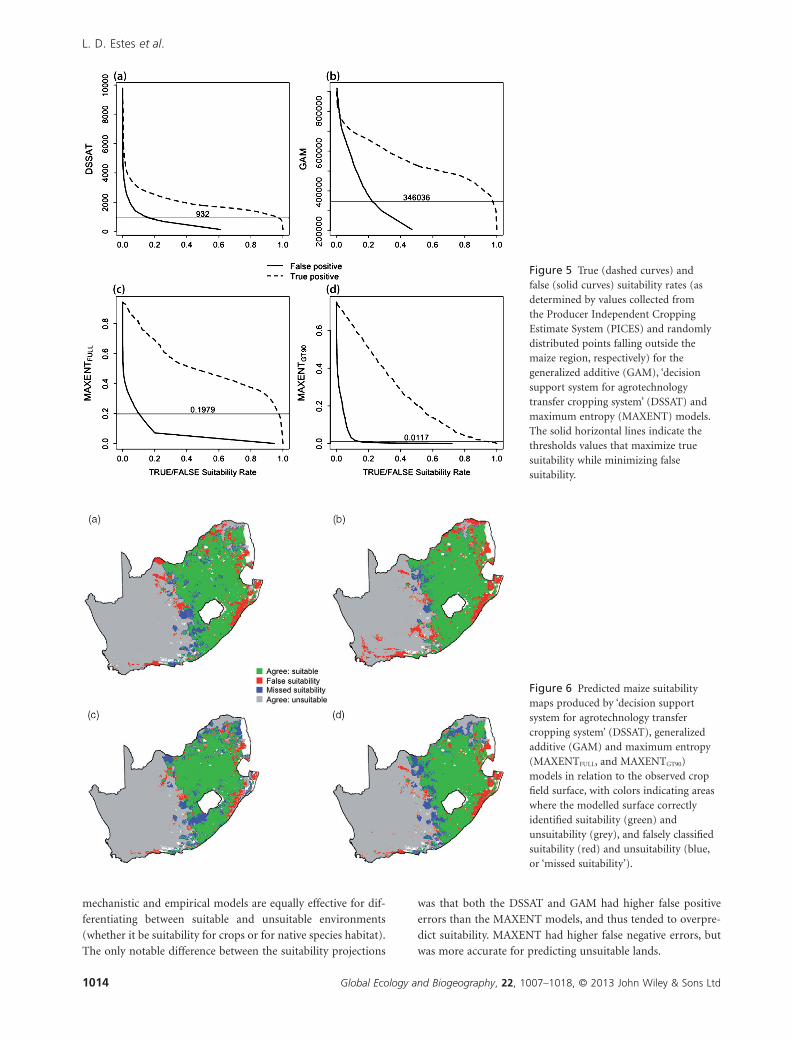
We created suitability maps using threshold model values that
maximized true suitability and minimized false negative rates
relative to the PICES and randomly selected absence points
(Fig. 5). For DSSAT, a best-fit threshold of 932 kg ha–1 encom-
passed 97.5% of maize points and 16.6% of non-maize points
for an overall accuracy of 90%. For GAM, a threshold of 346,036
encompassed 97.5% of maize points and 22.3% of non-maize
points for an overall accuracy of 88%. For MAXENTFULL, a
threshold of 0.198 encompassed 97.5% of maize points and
10.2% of non-maize points for an overall accuracy of 94%. For
MAXENTGT90, a threshold of 0.0117 encompassed 92.5% of
maize points and 13.8% of non-maize points for an overall
accuracy of 89% (Fig. 5).
The observed suitability map based on kernel density of crop
fields classified a total of 498,000 km2 as suitable for dryland
maize. The crop fields map was subset using an October–April
rainfall threshold of > 367.3 mm and a minimum seasonal rain-
fall percentage of 55%. These criteria corresponded with previ-
ously identified minimum precipitation requirements for maize
(Walker & Schulze, 2008).
All four suitability maps showed similar levels of overall accu-
racy when compared with the observed crop field surface
(Fig. 6), but varied in their sensitivity (proportion of correctly
classified suitable area) and specificity (proportion of correctly
classified unsuitable area; Table 1). The DSSAT model identified
a total of 516,000 km2 as suitable for dryland maize, of which
429,000 km2 (the true positive area) overlapped with observed
crop fields. DSSAT’s sensitivity and specificity were 0.88 and
0.87, and its overall performance, assessed with the Kappa sta-
tistic, was very good (K = 0.75; Fielding & Bell, 2002). The GAM
predicted 584,000 km2 to be suitable for dryland maize, and had
the largest overlap (462,000 km2) with the observed field surface,
and thus the highest sensitivity (0.94). The 122,000 km2 the
GAM incorrectly classified as suitable was the largest false posi-
tive area, thus GAM’s specificity (0.82) was lowest, but GAM’s
overall performance was also very good (K = 0.74).
The MAXENTFULL model found 456,000 km2 to be suitable
for dryland maize. Its true positive area (399,000 km2), and thus
sensitivity (0.81), was the lowest overall. The false positive area
Figure 3 Maize yields (kg ha–1) as calculated fromMODIS-detected normalized difference vegetation index (NDVI)integrals (NDVIINT). Each point represents annual yield for aprovince in a given year (2006–09). Both variables werestandardized to a 0–1 scale (i.e. rescaled against their ranges).
L. D. Estes et al.
Global Ecology and Biogeography, 22, 1007–1018, © 2013 John Wiley & Sons Ltd1012

of MAXENTFULL was also the lowest overall (57,000 km2), its
specificity (0.92) was highest and its overall performance was
very good (K = 0.74). The MAXENTGT90 model identified
479,000 km2 as suitable for maize, of which 408,000 km2 over-
lapped with the observed surface (sensitivity = 0.83). The false
positive area with MAXENTGT90 was 71,000 km2, and its Kappa
value was 0.73.
DISCUSSION
Modelled suitability
All four models were equally successful in predicting overall
crop suitability, and their differences in overall performance
were negligible (K = 0.73–0.75; Table 1). This suggests that
Table 1 Summary of productivity and suitability accuracy metrics for all four models.
DSSAT GAM MAXENTFULL MAXENTGT90
Productivity R2 0.37 0.74 (calibration dataset) 0.10 (polynomial model) 0.62
0.75 (validation dataset) 0.08 (linear model)
Suitability True positive (TP)* 429 462 399 408
False positive (FP)* 87 122 57 71
False negative (FN)* 59 29 92 83
True negative (TN)* 600 568 632 618
Sensitivity (TP/TP + FN) 0.88 0.94 0.81 0.83
Specificity (TN/FP + TN) 0.87 0.82 0.92 0.90
TP + FP/TP + FP + TN + FN† 0.88 0.87 0.87 0.87
K‡ 0.75 0.74 0.74 0.73
DSSAT, ‘decision support system for agrotechnology transfer cropping system’ model; GAM, generalized additive model; MAXENT, maximum entropymodel.*Values are km2/1000.†Classification accuracy.‡Kappa statistic (Fielding & Bell, 2002).
Figure 4 Comparison of model-basedcrop yield predictions to integratednormalized difference vegetation index(NDVI) (a proxy for yield) within 436 20km ¥ 20 km grid cells. The fit of thegeneralized additive model (GAM)includes both training and test data; allother models are compared in a singleregression using all locations. NDVIINT,normalized difference vegetation indexintegrals; MAXENT, maximum entropy;DSSAT, ‘decision support system foragrotechnology transfer cropping system’model.
Crop model intercomparison
Global Ecology and Biogeography, 22, 1007–1018, © 2013 John Wiley & Sons Ltd 1013
mechanistic and empirical models are equally effective for dif-
ferentiating between suitable and unsuitable environments
(whether it be suitability for crops or for native species habitat).
The only notable difference between the suitability projections
was that both the DSSAT and GAM had higher false positive
errors than the MAXENT models, and thus tended to overpre-
dict suitability. MAXENT had higher false negative errors, but
was more accurate for predicting unsuitable lands.
Figure 5 True (dashed curves) andfalse (solid curves) suitability rates (asdetermined by values collected fromthe Producer Independent CroppingEstimate System (PICES) and randomlydistributed points falling outside themaize region, respectively) for thegeneralized additive (GAM), ‘decisionsupport system for agrotechnologytransfer cropping system’ (DSSAT) andmaximum entropy (MAXENT) models.The solid horizontal lines indicate thethresholds values that maximize truesuitability while minimizing falsesuitability.
Figure 6 Predicted maize suitabilitymaps produced by ‘decision supportsystem for agrotechnology transfercropping system’ (DSSAT), generalizedadditive (GAM) and maximum entropy(MAXENTFULL, and MAXENTGT90)models in relation to the observed cropfield surface, with colors indicating areaswhere the modelled surface correctlyidentified suitability (green) andunsuitability (grey), and falsely classifiedsuitability (red) and unsuitability (blue,or ‘missed suitability’).
L. D. Estes et al.
Global Ecology and Biogeography, 22, 1007–1018, © 2013 John Wiley & Sons Ltd1014

Empirical modelling thus appears to be a better choice for
mapping suitability/unsuitability in this study area, since it
had comparable accuracy while requiring less research effort
(MAXENT and GAM are free and relatively easy to implement).
Since empirical models generally perform well when predicting
species distributions in other systems (Elith et al., 2006), this
finding may also be applicable to natural ecosystems (but see the
discussion on model caveats below).
Modelled productivity
The first step to assessing modelled abundance is acquiring data
that measure continuous abundance (or, in this case, productiv-
ity). The productivity dataset (NDVIINT) used to evaluate our
modelled results in itself assumes a linear correlation between
remotely sensed phenology and crop yield. This assumed corre-
lation was necessary due to the lack of spatially explicit crop
yield measurements in South Africa. However, maize yield is
reported at the provincial level, and spatially averaged NDVIINT
for each year in the 2006–09 time period shows a reasonable
correlation with provincial maize yield (Fig. 3). Much of the
error in this relationship is probably due to the coarse spatial
scale used for comparison and to the inclusion of irrigated pro-
duction in reported provincial yields.
Previous studies have found strong relationships (R2 up to
0.88) between NDVIINT and crop yield (Wang et al., 2005). In
this study, by using digitized crop fields and PICES observa-
tions, we were able to confine our NDVI data to maize fields
more effectively than these previous studies, which relied on
coarser imagery and did not have the same ancillary data to
confirm the locations of maize fields. The NDVI-derived
proxies should provide a good approximation of South African
maize productivity.
The significant correlation between DSSAT predicted yields
and NDVIINT measured yields show that DSSAT captured the
underlying spatial trends in variations in dryland maize yield.
However, the relatively weak correlation (R2 = 0.37) shows that
there were still substantial discrepancies between these two data-
sets (Fig. 4a). Given the numerous potential errors related to our
input data, model calibration, initial values and scales of com-
parison, combined with DSSAT’s large data requirements (in
terms of both number and quality), and the fact that it was not
trained with NDVIINT (unlike the empirical models), the lower
accuracy reported here was not unexpected. For instance,
DSSAT’s right-skewed statistical distribution was partially due
to yield overestimates in several higher rainfall areas, which were
probably caused by errors in the soil data that overestimated soil
water availability, depth and nutrient availability. The temporal
mismatch between the NDVI data and the model simulation
period probably lowered the correlation. Despite these sources
of error, DSSAT provided a reasonable approximation of NDVI-
measured crop yield.
For ecological modellers, the aforementioned list of potential
sources of error highlights a major problem with comprehen-
sive mechanistic models. Namely, spatially explicit predictor
variables are very challenging to acquire. The spatial data used
to inform DSSAT in this research are arguably as good as can be
found anywhere in developed countries, and much better
than in developing countries. Problems with applying local
relationships across landscapes or regions are not a surprise,
but a drop from a local correlation of R2 = 0.88 (reported by
Wafula, 1995, in Kenya) to a regional correlation of R2 = 0.37
gives an estimate of the magnitude of the problem in a
best-case scenario.
An empirical prediction of productivity based on continu-
ous values of productivity using GAM produces a strong fit
(R2 = 0.75; Fig. 4b). This finding is consistent with Kulhanek
et al. (2011), who found that abundance of fish species could
be predicted with good accuracy based on continuous abun-
dance information. Unfortunately, continuous abundance data
are a rare commodity in ecological studies, with the notable
exception of bird counts (Huntley et al., 2012). As a result,
knowing that continuous abundance data can predict abun-
dance is useful, but may not help in the vast majority of cases
where only occurrence data are available. It does, however,
highlight a strong need for the collection of species abun-
dance data that can be used to forecast current and future
abundance.
Abundance data are critical because occurrences alone are
poor predictors of abundance. In this example, MAXENT
models based on maize occurrence data do a poor job of pre-
dicting crop productivity. A linear fit between MAXENT suit-
ability (‘gain’) and NDVIINT productivity had an R2 value of
only 0.08 (Fig. 4c), and the slope of the line was negative
(higher suitability values are actually better predictors of low
crop yield). Although it is often assumed that higher predicted
suitabilities will equate to higher species abundance (Vander-
wal et al., 2009), our results coupled with previous studies
(Pearce & Ferrier, 2001; Nielsen et al., 2005; Jiménez-Valverde
et al., 2009; Vanderwal et al., 2009) suggest that empirical
models based on species occurrence records are at best unreli-
able predictors of abundance.
However, empirical models based on occurrence have repeat-
edly been shown to be good predictors of occurrence (e.g. Elith
et al., 2006). Hence, we hypothesized that empirical models
based on occurrences where the species is abundant could predict
continuous abundance across the species range. When the maize
occurrence data were subset into the top 10% of abundance
points, the MAXENT model was strongly correlated to produc-
tivity (R2 = 0.62) and the relationship was primarily linear
(Fig. 4d). This correlation is not as strong as that of the GAM,
but it is much better than that of the mechanistic model. By
selecting high-abundance locations from occurrence data,
empirical distribution models may in some cases be nearly as
effective at predicting continuous abundance as a model based
on continuous abundance values. Identifying species abundance
points from occurrence data requires an extra analytical step for
ecological modellers, but is not nearly as demanding as collect-
ing continuous abundance data or developing mechanistic
models. This delineation of a high-abundance subset may even
be possible based on expert knowledge (Bradley & Marvin,
2011).
Crop model intercomparison
Global Ecology and Biogeography, 22, 1007–1018, © 2013 John Wiley & Sons Ltd 1015
Important caveats
Although the empirical models outperform the mechanistic
model in terms of predicting productivity and produce compa-
rable results for suitability, this relative performance may not
hold for forecasting productivity/suitability (or abundance/
distribution) under changed environmental conditions. Climate
change, for example, is likely to produce novel climatic condi-
tions (Williams & Jackson, 2007) beyond the range upon which
empirical models are trained. Similarly, rising atmospheric CO2
and its fertilization effects on plants is often unaccounted for in
empirical models. Under both no-analogue climate and higher
CO2 conditions, mechanistic models may ultimately be the
superior choice. Hence, for forecasting of either abundance or
distribution onto altered environmental conditions, we recom-
mend the inclusion of mechanistic models where possible
(Morin & Thuiller, 2009). We also suggest that further efforts be
made to improve the ability of empirical models to account for
altered environmental conditions (e.g. by adjusting climatic pre-
dictors using relationships derived from plant-CO2 enrichment
experiments).
Crop yield versus species abundance
Although this analysis was performed for crop yields, the results
are applicable to ecological forecasting of abundance. Models
forecasting abundance shifts are much less common than
models of distribution shifts (Huntley et al., 2012) even though
species abundance has a much greater impact on ecosystems
(Leibold, 1995). Further, rapid changes in abundance within a
species range will often result from the direct effect of climatic
factors on species demography (e.g. Altwegg & Anderson, 2009)
and will usually be detectable before any shift in range becomes
apparent. The current focus of ecology on understanding distri-
butional shifts under global change may therefore be overlook-
ing important impacts on species abundance (Huntley et al.,
2012). A number of studies have found that empirical models
based on species distribution are either poor predictors of
species abundance [e.g. R2 = 0.12 for 69 cross-taxa species in
Queensland, Australia (VanDerWal et al., 2009); significant rela-
tionships for only 9 out of 48 arthropods in the Azores
(Jiménez-Valverde et al., 2009)], or exhibit a nonlinear, step
function type of relationship (Pearce & Ferrier, 2001; Nielsen
et al., 2005). Hence, either mechanistic models or some varia-
tion of empirical modelling that includes abundance data are
needed to forecast abundance.
CONCLUSIONS
This study builds on previous comparisons of empirical and
mechanistic models (Hijmans & Graham, 2006; Morin & Thu-
iller, 2009) by examining the abilities of these two model classes
to predict both suitability and productivity. By focusing on a
well-understood agricultural species for which abundant data
were available, we created a more direct comparison between
these two model classes. These findings reinforce previous work
demonstrating the robustness of empirical models (Elith et al.,
2006; Hijmans & Graham, 2006) in terms of defining a single
classification of suitability, and should further reassure ecolo-
gists that habitat suitability modelling can be effective where
input data are sufficiently representative. Similarly, agricultural
modellers should be interested to see the performance of models
that are seldom applied in their field (but see Evans et al., 2010),
but may provide a reasonable check on the reliability of mecha-
nistic model results.
When modelling species abundance, our results and others
(Pearce & Ferrier, 2001; Nielsen et al., 2005; Jiménez-Valverde
et al., 2009; Vanderwal et al., 2009) suggest that interpretations
of higher MAXENT (or any occurrence-based empirical model)
suitability values as supporting greater abundance should be
treated with caution. However, we showed that a subset of high-
abundance points in an occurrence-based empirical model may
create an effective approximation of abundance. Similarly,
empirical models based on continuous abundance effectively
predict abundance (Kulhanek et al., 2011). Both the empirical
model based on the high-abundance points and that based on
continuous abundance outperformed the mechanistic model.
These results suggest the potential for broader inference of
both suitability and abundance from empirical modelling
approaches.
ACKNOWLEDGEMENTS
We gratefully acknowledge funding from the Princeton Envi-
ronmental Institute’s Grand Challenges Program. We thank
South Africa’s Department of Agriculture (Anneliza Collet and
Rona Beukes), the Agricultural Research Council (Terry Newby
and Dave Turner), GeoTerraImage (Fanie Ferreira and Mark
Thompson), Tracks4Africa (GeoTerraImage), the University of
Florida (Greg Kiker), the United States Department of Agricul-
ture (Curt Reynolds), SiQ (Eugene du Preez) and the DSSAT
development team for providing data and advice.
REFERENCES
Altwegg, R. & Anderson, M.D. (2009) Rainfall in arid zones:
possible effects of climate change on the population ecology
of blue cranes. Functional Ecology, 23, 1014–1021.
Araújo, M.B. & New, M. (2007) Ensemble forecasting of species
distributions. Trends in Ecology and Evolution, 22, 42–47.
Bradley, B.A. & Marvin, D.C. (2011) Using expert knowledge to
satisfy data needs: mapping invasive plant distributions in the
western United States. Western North American Naturalist, 71,
302–315.
Bradley, B.A., Estes, L.D., Hole, D.G., Holness, S., Oppenheimer,
M., Turner, W.R., Beukes, H., Schulze, R.E., Tadross, M.A. &
Wilcove, D.S. (2012) Predicting how adaptation to climate
change could affect ecological conservation: secondary
impacts of shifting agricultural suitability. Diversity and Dis-
tributions, 18, 425–437.
Byrnes, R.M. (1996) South Africa: a country study. Federal
Research Division, Library of Congress, Washington, DC.
L. D. Estes et al.
Global Ecology and Biogeography, 22, 1007–1018, © 2013 John Wiley & Sons Ltd1016
Cramer, W., Bondeau, A., Woodward, F.I., Prentice, I.C., Betts,
R.A., Brovkin, V., Cox, P.M., Fisher, V., Foley, J.A., Friend,
A.D., Kucharik, C., Lomas, M.R., Ramankutty, N., Sitch, S.,
Smith, B., White, A. & Young-Molling, C. (2001) Global
response of terrestrial ecosystem structure and function to
CO2 and climate change: results from six dynamic global veg-
etation models. Global Change Biology, 7, 357–373.
Crop Estimates Committee (2011) Crop estimates. Department
of Agriculture, Forestry and Fisheries. Pretoria, South Africa.
Dormann, C.F. (2007) Promising the future? Global change pro-
jections of species distributions. Basic and Applied Ecology, 8,
387–397.
Elith, J.H., Graham, C.P., Anderson, R. et al. (2006) Novel
methods improve prediction of species’ distributions from
occurrence data. Ecography, 29, 129–151.
Evans, J.M., Fletcher, R.J. & Alavalapati, J. (2010) Using species
distribution models to identify suitable areas for biofuel feed-
stock production. GCB Bioenergy, 2, 63–78.
FAO (2009) FAO Statistical Yearbook 2009. Food and Agricul-
tural Organization of the United Nations. Available at: http://
www.fao.org (accessed 27 May 2010).
Fielding, A.H. & Bell, J.F. (2002) A review of methods for the
assessment of prediction errors in conservation presence/
absence models. Environmental Conservation, 24, 38–49.
Franklin, J. (2010) Moving beyond static species distribution
models in support of conservation biogeography. Diversity
and Distributions, 16, 321–330.
Guisan, A. & Zimmermann, N.E. (2000) Predictive habitat dis-
tribution models in ecology. Ecological Modelling, 135, 147–
186.
He, H.S., Mladenoff, D.J. & Boeder, J. (1996) LANDIS, a spatially
explicit model of forest landscape disturbance, management,
and succession—LANDIS 2.0 users’ guide. Department of
Forest Ecology and Management, University of Wisconsin-
Madison, Madison, WI, USA.
Hijmans, R.J. & Graham, C.H. (2006) The ability of
climate envelope models to predict the effect of climate
change on species distributions. Global Change Biology, 12,
2272–2281.
Hijmans, R.J., Cameron, S.E., Parra, J.L., Jones, P.G. & Jarvis, A.
(2005) Very high resolution interpolated climate surfaces for
global land areas. International Journal of Climatology, 25,
1965–1978.
Huntley, B., Barnard, P., Altwegg, R., Chambers, L., Coetzee,
B.W.T., Gibson, L., Hockey, P.A.R., Hole, D.G., Midgley, G.F.,
Underhill, L.G. & Willis, S.G. (2010) Beyond bioclimatic enve-
lopes: dynamic species’ range and abundance modelling in the
context of climatic change. Ecography, 33, 621–626.
Huntley, B., Altwegg, R., Barnard, P., Collingham, Y.C. & Hole,
D.G. (2012) Modelling relationships between species spatial
abundance patterns and climate. Global Ecology and Biogeog-
raphy, 21, 668–681.
Jiménez-Valverde, A., Diniz, F., de Azevedo, E.B. & Borges, P.A.V.
(2009) Species distribution models do not account for abun-
dance: the case of arthropods on Terceira Island. Annales Zoo-
logici Fennici, 46, 451–464.
Jones, J.W., Hoogenboom, G., Porter, C.H., Boote, K.J., Batch-
elor, W.D., Hunt, L.A., Wilkens, P.W., Singh, U., Gijsman, A.J.
& Ritchie, J.T. (2003) The DSSAT cropping system model.
European Journal of Agronomy, 18, 235–265.
Jones, P.G. & Thornton, P.K. (2003) The potential impacts of
climate change on maize production in Africa and Latin
America in 2055. Global Environmental Change, 13, 51–59.
Keating, B.A., Carberry, P.S., Hammer, G.L. et al. (2003) An
overview of APSIM, a model designed for farming systems
simulation. European Journal of Agronomy, 18, 267–288.
Keith, D.A., Akçakaya, H.R., Thuiller, W., Midgley, G.F., Pearson,
R.G., Phillips, S.J., Regan, H.M., Araújo, M.B. & Rebelo, T.G.
(2008) Predicting extinction risks under climate change: cou-
pling stochastic population models with dynamic bioclimatic
habitat models. Biology Letters, 4, 560 -563.
Kremen, C., Cameron, A., Moilanen, A. et al. (2008) Aligning
conservation priorities across taxa in Madagascar with high-
resolution planning tools. Science, 320, 222 -226.
Kulhanek, S.A., Leung, B. & Ricciardi, A. (2011) Using ecological
niche models to predict the abundance and impact of invasive
species: application to the common carp. Ecological Applica-
tions, 21, 203–213.
Leibold, M.A. (1995) The niche concept revisited – mechanistic
models and community context. Ecology, 76, 1371–1382.
Lobell, D.B., Burke, M.B., Tebaldi, C., Mastrandrea, M.D., Falcon,
W.P. & Naylor, R.L. (2008) Prioritizing climate change adapta-
tion needs for food security in 2030. Science, 319, 607–610.
MA (2005) Millennium ecosystem assessment: Ecosystems and
human well-being – synthesis. Island Press, Washington, DC.
Available at: http://www.MAweb.org (accessed 24 February
2011).
Ma’ali, S.H., Bruwer, D.de.V. & Prinsloo, M.A. (2006–2009)
Eastern area (2005/2006; 2006/2007; 2007/2008; 2008/2009).
ARC Grain Crops Institute, Potchefstroom, South Africa.
Morin, X. & Thuiller, W. (2009) Comparing niche-and process-
based models to reduce prediction uncertainty in species
range shifts under climate change. Ecology, 90, 1301–1313.
Nielsen, S.E., Johnson, C.J., Heard, D.C. & Boyce, M.S. (2005)
Can models of presence–absence be used to scale abundance?
Two case studies considering extremes in life history. Ecogra-
phy, 28, 197–208.
Parry, M.L., Rosenzweig, C., Iglesias, A., Livermore, M. &
Fischer, G. (2004) Effects of climate change on global food
production under SRES emissions and socio-economic sce-
narios. Global Environmental Change, 14, 53–67.
Paruelo, J.M. & Lauenroth, W.K. (1998) Interannual variability
of NDVI and its relationship to climate for North American
shrublands and grasslands. Journal of Biogeography, 25, 721–
733.
Pearce, J. & Ferrier, S. (2001) The practical value of modelling
relative abundance of species for regional conservation plan-
ning: a case study. Biological Conservation, 98, 33–43.
Pearson, R.G. & Dawson, T.P. (2003) Predicting the impacts of
climate change on the distribution of species: are bioclimate
envelope models useful? Global Ecology and Biogeography, 12,
361–371.
Crop model intercomparison
Global Ecology and Biogeography, 22, 1007–1018, © 2013 John Wiley & Sons Ltd 1017
Phillips, S.J., Anderson, R.P. & Schapire, R.E. (2006) Maximum
entropy modelling of species geographic distributions. Eco-
logical Modelling, 190, 231–259.
R Core Development Team (2011) R: a language and environ-
ment for statistical computing. R Foundation for Statistical
Computing, Vienna, Austria. Available at: http://www.
R-project.org (accessed 21 January 2012).
Ramankutty, N., Foley, J.A., Norman, J. & McSweeney, K. (2002)
The global distribution of cultivable lands: current patterns
and sensitivity to possible climate change. Global Ecology and
Biogeography, 11, 377–392.
Rosenzweig, C., Casassa, G., Karoly, D.J., Imeson, A., Liu, C.,
Menzel, A., Rawlins, S., Root, T.L., Seguin, B. & Tryjanowski, P.
(2007) Assessment of observed changes and responses in
natural and managed systems. Climate change 2007: impacts,
adaptation and vulnerability. Contribution of Working Group II
to the Fourth Assessment Report of the Intergovernmental Panel
on Climate Change (ed. by M.L. Parry, O.F. Canziani, J.P.
Palutikof, P.J. van der Linden and C.E. Hanson), pp. 79–131.
Cambridge University Press, Cambridge, UK.
Schulze, R.E. & Horan, M.J.C. (2010) Methods 1: delineation of
South Africa, Lesotho and Swaziland into quinary catch-
ments. Methodological approaches to assessing eco-hydrological
responses to climate change in South Africa (ed. by R.E. Schulze,
B.C. Hewitson, K.R. Barichievy, M.A. Tadross, R.P. Kunz, M.J.
Horan and T.G. Lumsden), pp. 63–74. WRC Report 1562/1/
10. Water Research Commission, Pretoria, South Africa.
SiQ (2007) Point frame sampling: producer independent crop
estimate system (PICES). Available at: http://www.siq.co.za
(accessed 11 February 2011).
SIRI (1987) Land type series. Memoirs on the agricultural natural
resources of South Africa. Soil and Irrigation Research Institute,
Department of Agriculture and Water Supply, Pretoria, South
Africa.
Thomas, C.D., Cameron, A., Green, R.E., Bakkenes, M., Beau-
mont, L.J., Collingham, Y.C., Erasmus, B.F.N., de Siqueira,
M.F., Grainger, A., Hannah, L., Hughes, L., Huntley, B., van
Jaarsveld, A.S., Midgley, G.F., Miles, L., Ortega-Huerta, M.A.,
Townsend Peterson, A., Phillips, O.L. & Williams, S.E. (2004)
Extinction risk from climate change. Nature, 427, 145–148.
Thuiller, W., Richardson, D.M., Pyšek, P., Midgley, G.F., Hughes,
G.O. & Rouget, M. (2005) Niche-based modelling as a tool for
predicting the risk of alien plant invasions at a global scale.
Global Change Biology, 11, 2234–2250.
du Toit, A.S., Prinsloo, M.A., Durand, W. & Kiker, G. (2000)
Vulnerability of maize production to climate change and
adaptation assessment in South Africa. Climate Change
Impacts in Southern Africa Report to the National Climate
Change Committee. Department of Environmental Affairs
and Tourism, Pretoria, South Africa.
Tubiello, F.N., Soussana, J.-F. & Howden, S.M. (2007) Crop and
pasture response to climate change. Proceedings of the
National Academy of Sciences USA, 104, 19686–19690.
VanDerWal, J., Shoo, L.P., Johnson, C.N. & Williams, S.E. (2009)
Abundance and the environmental niche: environmental suit-
ability estimated from niche models predicts the upper limit
of local abundance. The American Naturalist, 174, 282–291.
Wafula, B.M. (1995) Applications of crop simulation in agricul-
tural extension and research in Kenya. Agricultural Systems,
49, 399–412.
Walker, N.J. & Schulze, R.E. (2008) Climate change impacts on
agro-ecosystem sustainability across three climate regions in
the maize belt of South Africa. Agriculture, Ecosystems and
Environment, 124, 114–124.
Wang, J., Rich, P.M., Price, K.P. & Kettle, W.D. (2005) Relations
between NDVI, grassland production, and crop yield in the
central great plains. Geocarto International, 20, 5–11.
Williams, J.W. & Jackson, S.T. (2007) Novel climates, no-analog
communities, and ecological surprises. Frontiers in Ecology
and the Environment, 5, 475–482.
SUPPORTING INFORMATION
Additional supporting information may be found in the online
version of this article at the publisher’s web-site.
Appendix S1 Soil data.
Appendix S2 Further details on model development methods.
Appendix S3 Further details of model fitting and validation.
BIOSKETCHES
Lyndon Estes is an Associate Research Scholar in the
Woodrow Wilson School at Princeton University. He
studies how human factors such as climate change and
habitat transformation act and interact to change
terrestrial ecosystems and species.
Bethany Bradley is an assistant professor of
environmental conservation at the University of
Massachusetts, Amherst. She is interested in how global
change affects species distribution, and the implications
for biological conservation.
Author contributions: B.A.B., L.D.E. and M.G.O.
conceived the study. H.B. developed the spatial soils
database. R.S. and his lab developed the climatic
database. L.D.E. derived additional necessary data
inputs with help from M.L. L.D.E. and B.A.B.
performed model analysis, with help from M.L. L.D.E.
and B.A.B. wrote the manuscript with help from
D.G.H., M.G.O., M.A.T. and W.R.T.
Editor: Niklaus Zimmermann
L. D. Estes et al.
Global Ecology and Biogeography, 22, 1007–1018, © 2013 John Wiley & Sons Ltd1018