Research Article Vestas V90-3MW Wind Turbine Gearbox...
19
Research Article Vestas V90-3MW Wind Turbine Gearbox Health Assessment Using a Vibration-Based Condition Monitoring System A. Romero, 1,2 Y. Lage, 1 S. Soua, 1 B. Wang, 2 and T.-H. Gan 1,2 1 Condition and Structural Health Monitoring, TWI Ltd, Cambridge CB21 6AL, UK 2 School of Engineering and Design, Brunel University, Uxbridge UB8 3PH, UK Correspondence should be addressed to A. Romero; antonio.romero@affiliate.twi.co.uk Received 15 March 2016; Revised 20 June 2016; Accepted 11 July 2016 Academic Editor: Lu Chen Copyright © 2016 A. Romero et al. is is an open access article distributed under the Creative Commons Attribution License, which permits unrestricted use, distribution, and reproduction in any medium, provided the original work is properly cited. Reliable monitoring for the early fault diagnosis of gearbox faults is of great concern for the wind industry. is paper presents a novel approach for health condition monitoring (CM) and fault diagnosis in wind turbine gearboxes using vibration analysis. is methodology is based on a machine learning algorithm that generates a baseline for the identification of deviations from the normal operation conditions of the turbine and the intrinsic characteristic-scale decomposition (ICD) method for fault type recognition. Outliers picked up during the baseline stage are decomposed by the ICD method to obtain the product components which reveal the fault information. e new methodology proposed for gear and bearing defect identification was validated by laboratory and field trials, comparing well with the methods reviewed in the literature. 1. Introduction Despite the current global economic situation the wind turbine industry is still growing worldwide [1]. However, the wind turbine industry experiences premature turbine com- ponent failures, which leads to increase in the operation and maintenance (O&M) costs and loss of productivity due to turbine downtime [2, 3]. e O&M costs constitute a sizeable share of the total annual costs of a wind turbine. For a new turbine, O&M costs may easily make up 20%–25% of the total levelised cost per kWh produced over the lifetime of the turbine [4]. Unpredictable failure of certain wind turbine components, such as turbine blades, tower, gearbox, genera- tor, braking system, and yaw system, can lead to substantially higher maintenance costs and reduced availability of wind turbines. As a result, O&M costs are attracting greater atten- tion, as there is a need for the industry to reduce the turbine downtime, increase reliability, and decrease the cost of the energy (COE). Wind turbine gearboxes tend to fail more prematurely than those in any other applications. Gearboxes do not always achieve their desired 20-year design life, failing prematurely from 2 to 11 years. Although it is well documented in literature that the failure rate of mechanical components is lower in comparison with the electrical subsystems, mechanical fail- ures still create unplanned maintenance, long turbine down- times due to gearbox replacement, and rebuild which increases the warranty reserves. Based on the data compiled in the Wind Stats Newsletter which covers from 2003 to 2009, gearboxes are the subsystem that causes the highest downtimes (Figure 1) [5, 6]. Wind industry is experiencing higher gearbox failure rates than other due to underestima- tion of true operating loads, unexpected overloads due to unusual operating conditions, defective design of gearbox components, and poor maintenance, all of which have clear effects on gearbox reliability. From the O&M point of view, the main concerns are the following: high replacement costs aſter failure, high costs of the removal and reinstallation works because a crane is needed, and high revenue losses due to the long downtime [7]. All the previous factors trigger an increase in the cost of the energy as previously stated. In order to decrease this cost, turbine uptime has to be increased, a goal which can be reached by improving gearboxes reliability [8–13]. For this reason, the Vestas V90 gearbox is the main targeted subsystem of this paper. Hindawi Publishing Corporation Shock and Vibration Volume 2016, Article ID 6423587, 18 pages http://dx.doi.org/10.1155/2016/6423587
Transcript of Research Article Vestas V90-3MW Wind Turbine Gearbox...

Research ArticleVestas V90-3MW Wind Turbine Gearbox Health AssessmentUsing a Vibration-Based Condition Monitoring System
A Romero12 Y Lage1 S Soua1 B Wang2 and T-H Gan12
1Condition and Structural Health Monitoring TWI Ltd Cambridge CB21 6AL UK2School of Engineering and Design Brunel University Uxbridge UB8 3PH UK
Correspondence should be addressed to A Romero antonioromeroaffiliatetwicouk
Received 15 March 2016 Revised 20 June 2016 Accepted 11 July 2016
Academic Editor Lu Chen
Copyright copy 2016 A Romero et al This is an open access article distributed under the Creative Commons Attribution Licensewhich permits unrestricted use distribution and reproduction in any medium provided the original work is properly cited
Reliable monitoring for the early fault diagnosis of gearbox faults is of great concern for the wind industry This paper presents anovel approach for health condition monitoring (CM) and fault diagnosis in wind turbine gearboxes using vibration analysis Thismethodology is based on amachine learning algorithm that generates a baseline for the identification of deviations from the normaloperation conditions of the turbine and the intrinsic characteristic-scale decomposition (ICD) method for fault type recognitionOutliers picked up during the baseline stage are decomposed by the ICD method to obtain the product components which revealthe fault information The new methodology proposed for gear and bearing defect identification was validated by laboratory andfield trials comparing well with the methods reviewed in the literature
1 Introduction
Despite the current global economic situation the windturbine industry is still growing worldwide [1] However thewind turbine industry experiences premature turbine com-ponent failures which leads to increase in the operation andmaintenance (OampM) costs and loss of productivity due toturbine downtime [2 3]The OampM costs constitute a sizeableshare of the total annual costs of a wind turbine For a newturbine OampM costs may easily make up 20ndash25 of thetotal levelised cost per kWh produced over the lifetime ofthe turbine [4] Unpredictable failure of certain wind turbinecomponents such as turbine blades tower gearbox genera-tor braking system and yaw system can lead to substantiallyhigher maintenance costs and reduced availability of windturbines As a result OampM costs are attracting greater atten-tion as there is a need for the industry to reduce the turbinedowntime increase reliability and decrease the cost of theenergy (COE)
Wind turbine gearboxes tend to fail more prematurelythan those in any other applications Gearboxes do not alwaysachieve their desired 20-year design life failing prematurelyfrom 2 to 11 years Although it is well documented in literature
that the failure rate of mechanical components is lower incomparison with the electrical subsystems mechanical fail-ures still create unplanned maintenance long turbine down-times due to gearbox replacement and rebuild whichincreases the warranty reserves Based on the data compiledin the Wind Stats Newsletter which covers from 2003 to2009 gearboxes are the subsystem that causes the highestdowntimes (Figure 1) [5 6] Wind industry is experiencinghigher gearbox failure rates than other due to underestima-tion of true operating loads unexpected overloads due tounusual operating conditions defective design of gearboxcomponents and poor maintenance all of which have cleareffects on gearbox reliability From the OampM point of viewthe main concerns are the following high replacement costsafter failure high costs of the removal and reinstallationworks because a crane is needed and high revenue losses dueto the long downtime [7] All the previous factors trigger anincrease in the cost of the energy as previously stated In orderto decrease this cost turbine uptime has to be increased agoal which can be reached by improving gearboxes reliability[8ndash13] For this reason the Vestas V90 gearbox is the maintargeted subsystem of this paper
Hindawi Publishing CorporationShock and VibrationVolume 2016 Article ID 6423587 18 pageshttpdxdoiorg10115520166423587
2 Shock and Vibration
0 2 4 6 8 10 12 14 16Rotor
Air brakeMech brakePitch adjust
Main shaftbearingGearbox
GeneratorYaw system
Wind vaneanemometerElec controls
Elec systemHydraulics
Sensors
Downtime (hours) times104
Figure 1 Wind Stats 2003ndash2009 aggregated downtime per turbinesubsystem
Vibration-basedmonitoring of all drive train componentsis the most developed and widely applied condition mon-itoring technique by far [14ndash17] A survey carried out bythe UK Supergen Wind Energy Technologies Consortium[18] shows that 14 out of 20 commercially available windturbine conditionmonitoring system (CMS) provide gearboxvibrationmonitoring Another survey carried out byDurhamUniversity [19] shows that 27 out of 36 widely available CMSare based on drivetrain vibration analysis Oil-based analysisCMS are also used for gearbox monitoring purposes Thistechnology is in an early development stage as regards sensortechnology and the validation of its capabilities for faultdetection [20] Acoustic Emission is becoming a typicaldrivetrain CM practice A recent study on wind turbine CMshows a design of a new continuous condition monitoringsystem with automated warnings based on a combination ofvibration and AE analysis [21 22] AE can detect faults earlierthan vibration [23 24] but implementation is more compli-cated due to equipment noise which reduces the quality of theoutput signals [25] SCADA systems are also used for con-dition monitoring of wind turbines although they are not astandalone solutionThey store 10minute-average data whichis valuable to help other CMS achieve better fault detectionperformances [7]
The technique applied in this paper is vibration analysisusing accelerometers mounted in specific locations on themachine The reason vibration analysis is used instead of oneof the aforementioned methods is the advantages this tech-nique offers In comparison to oil analysis vibration analysiscan detect failures inside and outside the gearbox and canbe used for online monitoring without incurring high costs[16] Additionally small defects generate intense vibrationsignatures which are detectable by the accelerometer How-ever they do not necessarily cause changes in the chemicalcomposition [26]
Themajority of existing commercially available vibration-based CMS use time domain frequency domain or time-frequency analysis methods Vibrations in the time domainhave been widely studied Statistical and parameter-basedmethods have shown to be useful indictors of the systemcondition [27] Minimum and maximum value peak to peakvalue root mean square (RMS) kurtosis skewness crestfactor are all examples of time domain features Comparisons
between the pristine status and the current have been carriedout using trend analysis [28] Features reflect componentdeterioration only when working under changeless oper-ating conditions Time synchronous averaging (TSA) andplanet separation methods resample the vibration data syn-chronously with the shaft rotation for the sake of extractingperiodicwaveform fromnoisy data [29] Amplitude demodu-lation has proven to be appropriate for detecting defects thatproduce impacting [9] Most of the commercially availablevibration-basedCMS focus on the frequency domain analysisbased on Fast Fourier Transform (FFT) [30ndash32] order anal-ysis cepstrum analysis [33] envelope analysis and so forthwhich demonstrated to be effective at detecting gear faultsFFT is suitable for analysing steady-state or quasi-steadyvibrations with slowly varying frequencies [34 35]ThereforeFFT is not appropriate for wind turbine monitoring due totheir stochastic operation behavior (variable aerodynamicloads and extreme environmental conditions which makethe running speed change continuously) Vibrations comingfrom the wind turbinersquos gear or bearing are considered asnonstationary and nonlinear To deal with nonstationary andnonlinear signals time-frequencymethods such as the Short-Time Fourier Transform (STFT) [36] Wigner-Ville distribu-tion (WVD) [37] or wavelet transform (WT) are required[38 39] Wavelet analysis is probably the most populartechnique Continuous wavelet transform discrete wavelettransform and harmonic wavelet transform have been val-idated as methods for wind turbine condition monitoring[40ndash43] Wavelet transform methods have the drawback thatthe basic functions of the decompositions are fixed and donot necessarily match the varying nature of the signals [44]Signal decomposition methods have been applied to thepractical gear and rolling bearing fault diagnosis EmpiricalMode Decomposition (EMD) has been presented as a moreadvanced condition monitoring technique to ensure the highavailability of wind turbines [45] The main downsides ofEMD include the use of cubic spline to interpolate the localextrema of the signal which experiences end effect modemixing overshoot and undershoot problems [46 47] LocalMeanDecomposition (LMD) is an improved version of EMDwhich also suffers frommodemixing distorted componentsand time consuming decomposition LMD can be moreeffective than EMD in capturing local features of the nonlin-ear and nonstationary signals [48] The Intrinsic Time-scaleDecomposition (ITD) method overcomes the limitations ofEMD listed earlier as well as those previously mentionedand is associated with more classical approaches such asFourier and wavelets [49] ITD decompose the nonstationarysignal into a sum of proper rotation components (PRs) whichare not real monocomponentsThis causes erroneous instan-taneous characteristics
The existing work has some limitations Most of the exist-ingmethods applied for fault detection in rotatingmachineryare signal processing based and they consist of finding thefaulty peak in the frequency spectrum Fault detection iscarried out by comparison of the pristine and faulty frequencyspectrum which is sensitive to noise methodology [30]The task of identifying faulty peaks has to be done offlinewhich falls into higher costs of labour and computational
Shock and Vibration 3
complexity In addition offline analysis of the data gathereddoes not provide any benefit as faults are identified after theyoccurred As is well known practical vibrations are non-linear and nonstationary due to the complexity of rotatingmachinery systems [48] Fast Fourier Transform (FFT) didnot show good result when it was applied to that type ofcomplex vibrations Nonadaptive time-frequency methodsdo not provide with a meaningful interpretation either [50ndash52] Consequently a novel methodology for automated faultdiagnosis in rotating machinery is needed to avoid loss oftime in planning and carrying out unnecessary operationandmaintenance (OampM) tasks reducemachinery downtimeincrease reliability and reduce the cost of energy (COE)
The algorithms and methodology presented in this paperhighlight some of the limitations of vibration analysis whenit is applied for fault diagnosis The approach uses a com-bination of time and time-frequency adaptive techniquesto develop an automated solution for condition monitoringof wind turbines which contributes to the state of the artAutomation is a must in industrial applications such as windturbine monitoring to reduce the manual inspection of dataThese algorithms are based on unsupervised learning thatuses statistical process control (SPC) charts for defining thehealthy status of the machinery Signals considered as faultyare processed using the intrinsic characteristic-scale decom-position (ICD) method ICD is a relatively novel adaptivemethod which has been first proposed by Li et al [53] WithICD any nonlinear and nonstationary signal can be decom-posed into a collection of product components (PCs) Theenvelope spectrum of these PCs can identify the faultyfrequencies in a gearbox This proposed methodology isexplained in this paper
2 Novel Software Concept for FaultDetection in Wind Turbines
The application of vibration analysis is well developed in thefield of rotating machinery In spite of the fact that industrialmachinery ismonitored using vibration analysis the industrystill experiences premature failures Failure in machineryimplies an increase of the downtime and subsequently anincrease of the cost of the energy (COE)The current systemsused to have full remote control of the individual wind tur-bines or even an entire wind farm health are SCADA (Super-visory Control AndData Acquisition) which offer full remotecontrol and supervision of individual wind turbines SCADAsystems give an overview of all the relevant features to moni-tor any health changes of wind turbines such as temperaturepitch angle electrical parameters and rotor speedThese datagathering systems provide real time and historical informa-tion The real time and historical data are compared to assesswhether or not there is a failure arising or happening
A new methodology which combines operating andvibration data for condition monitoring of wind turbines inrotating machinery is showcased in this paper The aim is topropose a novel solution that helps thewind industry improvethe reliability and availability of wind turbinesThe objectives
to reach with the development and implementation of thisnovel methodology are as follows
(i) Establishment of a baseline representative of thehealthy status of the wind turbine
(ii) Setting of operational limits of the machine beingstudied
(iii) Identification of deviations (outliers) from the base-line which could be indicative of machinery failure ormalfunctions which are being developed within it
(iv) Application of a time-frequency domain techniquefor discarding any false alarm and identifying thesource of defect if any
(v) Database creation for condition monitoring manage-ment purposes
The algorithm developed to reach the aforementioned objec-tives can be split into the following four modules baselinegeneration forcing frequencies calculation intrinsic-scaledecomposition (ICD) and data base
Figure 2 depicts the flow chart novel methodology forcondition monitoring of wind turbines gearboxes proposedin this paper The algorithm is recognized as two lines whichwork in parallel coming together in a single endpoint Theproposed method starts gathering vibration data and takes10-minute averages of the speed of the low speed shaft (LSS)and power output continuouslyThen vibrational data passesthrough a signal conditioning stage and the rotor speed isused for calculating the forcing frequencies of the machinebeing studied It is important to know the speed of the LSS assome wind turbines and other pieces of rotating machinerywork at different speedsThus themethod selected for storingthe data gathered is based on bins which are related to thespeed of the LSS at the time the measurement is taken Thenumber of bins is selected by the operator whereas the binwidth is established according to the maximum speed of themachine and the number of bins previously mentioned
Research in the laboratory was carried out to select thefeature that depicts better and more reliable changes in theoperational status of gearboxes Counts parameter rootmeansquare (RMS) peak value and crest factor were studied Peakvalue showed an increasewith the onset of defect in gearboxesbut sometimes that feature was badly affected by single noisespikes For that reason peak value and crest factor wereconsiderednot reliable indicators of defect Counts parameterwas not considered reliable either as it has a strong depen-dence on the threshold value selected for its calculation RMSlevels increasedwith the increase of defect within the gearboxstudied and results were not affected by single noise spikesas much as the peak value Therefore RMS was selected asthe feature to be binned Depending on the application dif-ferent features might contain more relevant information forprocessing with monitoring systems [54] Then the methoddepicted in Figure 2 is able to generate a baseline represen-tative of the normal operation conditions of a wind turbinegearbox and use that baseline to assess the current health ofthe gearbox At this stage deviations from the baselinemay ormay not be an indication of defect Accordingly a novel time-frequency domain technique is applied to the data which
4 Shock and Vibration
No
Yes
Nofalse alarm
Yesgearbox defect
Operation parametersData acquisitionvibration analysis
(CMS)
Signal conditioning
Preprocessing stage
Binning process
Big data management
Rotor speed (rpm) Power output (kW)
Nacelle power-speed curves
1st evaluation of nacelle
Continue WTmonitoring
Outliers
Intrinsic characteristic-scaledecomposition (ICD)
False alarms or fault
defect
Forcing frequencies calculation
Baseline
Identification of deviations
Fault descriptionrisk
actions
Data base
Peak =
Figure 2 Flow chart of a novel condition monitoring algorithm for gearbox fault detection
is causing deviations that is to the outliers The techniquewhich is called intrinsic characteristic-scale decomposition(Figure 4) demodulates the signals until the faulty frequencyis easy to identify The output of the ICD is compared withthe forcing frequencies previously calculated to concludewhether or not there is a defect If there is a match betweenthe ICD and the frequencies calculated the source of defectis identified and the information is recorded in a database toevaluate the risk and the actions which need to be taken Onthe other hand if there is no match the outlier is consideredas a false alarm and the monitoring process continues
The main parts within the algorithm described in Fig-ure 2 the baseline generation and the demodulation tech-nique (ICD) are explained extensively in this section
21 Identification ofDeviations fromNormalOperationCondi-tions Based on a Baseline The baseline is a statistical processcontrol that can be used when a large number of similar files
are being produced such as data coming from the windturbineWind turbinemonitoring is subject to variabilityThevariability present when a process is running well is calledshort term or inherent variability and is usually measured bythe standard deviation The vibration signatures files gener-ated will have a target value When defects appear this valueincreases or decreases depending on the feature selected forthe baseline generationThismethod falls within themachinelearning field of research It is classified as an unsupervisedparametric learningmethod [55] because the source of defectis unknown and it is based on the statistical representation ofvibration features It acts as a unary classification that is itestablishes discrimination criteria by learning from a trainingset in order to identify whether the data belongs to pristinecondition of the method or to a novel class
The purpose of generating a baseline with the wind tur-bine data is to produce an alarmwhen the process values havemoved away from the target A second purpose is to generate
Shock and Vibration 5
HealthyWarning
Alarm
Start
Data acquisition (vibration cards)
SCADA(rotor speed
power output)
Raw data conditioning Bin selection
Feature extraction Cluster data in the bin
Convergence No convergence
Baseline
Monitoring using the new data stored
More data is required
MAn =sumn
i=1fi
n
times 100
Stop criteriaEMA slope asymp 0
EMAj =
10038161003816100381610038161003816MAjminus1 minus MAj10038161003816100381610038161003816
MAjminus1
Figure 3 Flow chart for the baseline generation algorithm
a signal when item to item variability has increased In eithercase appropriate action must be taken by a machine operatoror an engineer Statistics can only give the signal the onaction relies on other skills Setting the alarm limits basedon statistics enables all alarm levels on a complex machinesuch as wind turbine with many transducers to be calculatedin seconds instead of taking many hours to view the dataand set the levels manually Thus the monitoring processcan be carried out more economically Automation of thealarm setting process can greatly improve the efficiency of themonitoring process Figure 3 shows amore detailed flow chart
of the baseline generation method After having binned thefeatures extracted in the suitable bin according to the rotorspeed the method needs to establish when the data availableis enough to determine the normal operation limits of thewind turbine gearbox Obviously the more data the better toestablish reliable alarm limits However it entails spendingmore time learning from the machine which is not the bestpractice when early fault detection is a goal Therefore acompromise between reliability and time efficiency is neededA convergence criterion to ensure that the normal operationlimits are calculated using the minimum number of files is
6 Shock and Vibration
EndYes
No
Compute interpolation(cubic spline)
m11(t)a11(t)
Start x(t)
Extract extrema (120591k xk)
mk = (Xk + Ak)2
ai = abs(Xk + Ak)2
Compute
s11(t) = ℎ11(t)a11(t)
Compute
Save
Compute
PC1(t) =
lim aij(t) = 1
Calculate Ak values
ℎ11(t) = x(t) minus m11(t)
a1(t) s1n(t)
a1(t) PC1(t)
Is ui(t) monotonic
u1(t) = x(t) minus PC1(t)
a1(t) = a11(t) a12 (t) middot middot middot a1n(t)
Figure 4 Flow chart of the ICD method
presented in this paper In this way the wind turbine gearboxhealth can start to be assessed as soon as possible Due todifferent variability of the data in different bins the numberof files requiredwill vary for each binTherefore convergenceis studied separately in every single bin
Theprocess starts calculating themoving average (MA) ofthe data stored in the bin being studied MA is a trustworthyparameter which indicates when the addition of more datawill not have any effect on the calculation of the alarm limitsThe moving average error (EMA) between consecutive filesis calculated and it establishes the termination conditionsConsidering the coordinates of the last EMA value calculated(119909119899 119910119899) and another one calculated earlier (119909
119899minus119898+1 119910119899minus119898+1
)where 119898 indicates the number of EMA points includedbetween the last two the slope of the straight-line connectingboth can be figured The slope is not calculated using thelast two measurements as that would be more a short termconvergence indicator rather than a medium or long termconvergence indicator Slope can be calculated using
120574 = 119886 tan(119910119899minus 119910119899minus119898+1
119909119899minus 119909119899minus119898+1
) (1)
The stopping criterion is satisfied when 120574 asymp 0∘ which meansthat the straight-line between two measurements properlyspaced in time is nearly horizontal In that case it can beensured that the variability of the EMA when new data isadded to that specific bin is that low that the normal operationlimits can be established reliably Limits allow determining
whether or not the process is under controlThe purpose is toprovide a representative vibration level across a range of rotorspeeds for improving the reliability of wind turbine gear-boxes and thereby help define appropriate vibration limits Ifthe limits are too far from the target value small deviationsfrom the target value may go undetected but if the limitsare too close to the target value there will be a large numberof false alarms (meaning there will be a signal for actionwhen the process mean is on target and no action is neces-sary) The baseline is generated using the mean (120583) of thevalues required according to the stopping criterion previouslyexplained and their standard deviation (120590) Two kinds oflimits are established warning limits and action limits Beforeconstructing the control chart the probability level (120572) valuefor thewarning and alarm limits has to be selected Accordingto the literature related to statistical process control (SPC)charts [56 57] it has been convenient to set thewarning limitsso that if the mean is on target 95 of sample means liewithin them Limits are calculated as the mean plusminus 119901times the standard deviation of the data stored in a specificbin The action limits are set so that 998 of samples liewithin them when the mean is on target Given the value of120572 the number of standard deviations (119901) used for the calcu-lation of the upper control limits (UCL) and lower controllimits (LCL) is extracted from the 119905 distribution table usingan input value equal to 1 minus 1205722 Therefore for the warninglimits119901 is 196 whichmeans that only 5 of the values shouldbe outside the limits if the features under study are in thesame condition as when the signature was calculated For
Shock and Vibration 7
the action limits 119901 is 309 The warning and action limits aredefined as follows
Warning Limits = 120583 plusmn 196120590
Alarm Limits = 120583 plusmn 309120590(2)
The standard deviation will be an estimation of the true valueand 95 and 998 are figures which have been selectedaccording to the literature For these reasons and for simplic-ity the limits are often set at
Warning Limits = 120583 plusmn 2120590
Alarm Limits = 120583 plusmn 3120590(3)
In this specific case the target value is not known and it willdepend on the gearbox which is being monitored When thishappens the data clustered within each bin is taken and thesample mean is used as a target value One should clarify thatthis is accomplish just when the process is running satisfac-tory
Finally the new data gathered is plotted in front of thelimits previously determined to evaluate the health of thegearbox New RMS values falling out of the limits are a clearindication of a process out of target Nevertheless it does notnecessarilymean that is due to amalfunction or defect withinthe turbine The classification process to distinguish betweenfaults and false alarms is carried out by the module describedin the following section Three areas can be distinguishedin the baseline plot Zone A is define as the area where theturbine operates free of fault Zone B is the area between thewarning and alarm limits and whereminor faults will appearand Zone C is the area above the alarm limit and where acutefault to danger will be localized
On the other hand if the termination criterion is notsatisfied in a bin more data is required and the whole processneeds to continue
22 Gearbox Fault Diagnosis for Wind Turbines Based on ICDFrequency Spectrum The time series of abnormal events aresubjected to a time-frequency signal processing techniquewhich is suitable for nonlinear and nonstationary vibrationssuch as faulty gearbox signals In a defective gear or rollingelement the resonance frequency is excited and it is modu-lated by the transient impulse with defective frequency Theintrinsic characteristic-scale decomposition method (ICD)decomposes the nonstationary signal into a series of productcomponents (PCs) so it is possible to diagnose gearbox androlling elements defects This method is needed in order todemodulate the feature and extract the fault frequency bycarrying out envelope spectrum analysis of the first few PCsTherefore the output of this module will be the frequencyspectrum of the first enveloped PCs which can identify thefaulty frequencies in gearbox and rolling elements success-fully This method has been effectively applied by Li et al[53] for faulty frequencies identification The results demon-strate that ICD can get accurate monocomponents when themethod is applied to broken tooth detection in gears or innerrace defects detection in bearings
Table 1 Specifications of the testrsquos rig gearbox
Ratio 15 1Pinion teeth 18Gear teeth 27Forcing frequencies OrdersInput frequency (119891in) 1xOutput frequency (119891out) 067xGear mesh frequency (GMF) 18x
Once the spectrum of the enveloped PCs is obtained theremaining peaks in the FFT are compared with the forcingfrequencies of the gearbox If any of the frequency calculatedcorrelates to any peak in the envelope spectrum comingfrom the ICD method the false alarm hypothesis would bediscarded and the source of defect would be identified Onthe contrary if there is a lack of correlation between the the-oretical values and the envelope spectrum the outlier beinganalysed is considered as a false alarm
3 Laboratory Trials on a Test Rig
Experiments were conducted at laboratory scale to validatethe methodology above explained In this section the layoutand results obtained after applying the algorithm describedin Figure 2 are presented
31 Laboratory Experiments Set-Up To verify the effective-ness of the proposed methodology a couple of case studieswere conducted at laboratory scale at the Machinery FaultSimulator from Spectraquest IncThe aim was to recreate thestochastic behaviour of wind turbines by gathering data atdifferent speeds so the results of this experiment can be usefulfor showcasing the applicability of the method to field trialsin a wind turbine gearbox
The test rig utilized for the purpose of dataset collectionis shown in Figure 5(a) It consists of a 075 kW variable fre-quency drive (VFD) which controls the motor shown in Fig-ure 5(a) In the first experiment the motor is connected overthe universal joint shaft to the single stage gearbox with spiralbevel gears One of the two gears is shown in Figure 5(b)Figure 6 depicts a diagram of the gearbox The specificationsof the gearbox are shown in Table 1 Vibrations generated bythis subsystem are measured in the radial direction using aCTC AC150-1 accelerometer mounted vertically on the caseIt is an industrial type IEPE accelerometer whose sensitivity is100mVg and its frequency range goes from 1Hz until 10 kHzInput shaft speed ismeasuredwith a noncontacting proximityprobe
Two gearboxes were tested The first gearbox was freeof faults whereas the second one was in faulty conditionsFigure 5(b) shows the faulty gear from the second gearboxwhich is missing a tooth Tests were performed in bothgearboxes at variable speeds between 25Hz and 45Hz usinga 5Hz step
For the second experiment the motor is connected to a914 cm shaft supported by one Rexnord ER12K ball bearingwhich is mounted on a stand as shown in Figure 7 Damage
8 Shock and Vibration
Load
Gearbox
Motor
Accelerometer
Tachometer
(a)
Brokentooth
(b)
Figure 5 Layout of the test rig (a) sensor attachment and (b) the faulty gear with a broken tooth
Zin = 18120596in
Zin = 27120596out
Figure 6 Diagram of the test rigrsquos gearbox
is introduced by replacing a healthy bearing by a predamagedspecimenThe damage cases include ball spalling inner raceand outer race Li et al [53] applied the ICD method to abearing with inner race defect In order to make a contribu-tion to the current knowledge a bearing with an outer racedefect was utilized for the experiments In this way the ICDmethod can be validated for another type of roller bearingfault The forcing frequency (BPFO) can be calculated intro-ducing the parameters defined in Table 2 into the followingequation
BPFO = (119873119887
2
)(1 minus
119873119887
119889119901
cos (120572)) (4)
The value of the abovementioned forcing frequency ex-pressed in orders is 3044x where 119909 is the rotating frequencyat the gearbox input
32 Results Analysis The results from the laboratory exper-iments performed in a test rig gearbox are presented inFigure 8 First of all healthy data was gathered to establishthe normal operation condition limits The system decidesautonomously when the data gathered is enough for estab-lishing these limits based on the convergence criteria previ-ously described
Convergence plots for each bin are shown in Figure 8These plots reveal the effect of adding a new measurement tothe current data The convergence criteria marks with a lightblue dotted line when the learning process is finished in each
Table 2 Specifications of the testrsquos rig bearings
MB ER12K bearing RexnordOuter diameter119863 (mm) 47Inner diameter 119889 (mm) 19Pitch diameter 119889
119901(mm) 335
Ball diameter 119889119861(mm) 79
Outer ring width 119861 (mm) 158Number of ball119873
1198878
Contact angle 120572 (∘) 0
Bearing Bearing stand
Accelerometer
Drive shaft
(914 cm)
Figure 7 Experimental set-up with a faulty bearing
bin which does not generally happen simultaneously in allthe binsThenumber of files needed to determine the baselinelimits reliably is depicted in Table 3 Following on warningand alarm limits are calculated and plotted as dark and lightblue lines respectively (Figure 9)
A new set of 50 measurements was gathered for each binwhen the gearbox was working in pristine conditions Thisnew set of data validates the capabilities of the normal oper-ation limits calculated The RMS values extracted from thevibration signals are plotted as dark blue points in Figure 9Since the data was acquired in healthy conditions featuresshould fall within the limits revealing that the gearboxstatus has not changed The effectiveness of the baseline isevaluated by calculating the percentage of data that is within
Shock and Vibration 9
0 20 40 60 80 1000
02
04
06
08
1
File number File number
File number
EMA
()
0 20 40 60 80 1000
02
04
06
08
1
EMA
()
0 20 40 60 80 1000
02
04
06
08
File number
File number
EMA
()
0 20 40 60 80 1000
02
04
06
08
EMA
()
0 20 40 60 80 1000
02
04
06
08
1
EMA
()
Bin 5ndash45Hz
Bin 4ndash40HzBin 3ndash35Hz
Bin 2ndash30HzBin 1ndash25Hz
Figure 8 Vibration data convergence
Table 3 Number of files for the baseline generation and effective-ness probed with an additional set of data
Bin 1 Bin 2 Bin 3 Bin 4 Bin 5Rotationspeed (Hz) 25 30 35 40 45
Number offiles 84 58 72 77 48
Number ofoutliers 0 0 2 1 2
Data withinthe limits () 100 100 96 98 96
the limitsThere are 2 outliers out of 50 in bins 3 and 5whereasthere is just one in bin 4 The algorithm assesses the gearboxas healthy for bins 1 and 2 in all casesThe outliers are locatedbetween the alarm and the warning limits Therefore thequality of the current results has to be assessed according tothe 95 probability factor defined in the previous section ofthis paper It can be concluded that the results are promisingas the percentage of data lying within the limits is higher than95
The healthy gearbox was replaced by the one with abroken tooth and new sets of 50measurements were taken foreach bin The extracted RMS values are plotted as light blue
20 25 30 35 40 45 5015
2
25
3
35
4
45
Rotating speed (Hz)
Faulty data
Healthy data
RMS
acce
lera
tion
(ms
2)
Figure 9 Baseline of the test rig operating at variable speed usingthe RMS value of the acceleration
points in Figure 9 As can be seen the new values aredeviated from the targeted mean The deviation in bin 1 isnot big and it can even be seen that one of the points fallsbetween the upper alarm and warning limits However forhigher speeds all the points are outliers In addition positivecorrelation between the deviation from the targeted meanand the rotation speed has been noted In conclusion thebaseline algorithm is experimentally demonstrated to be able
10 Shock and Vibration
50 100 150 200 250 300 350 400 450 500 550 6000
100020003000400050006000
Frequency (Hz)
6 ite
ratio
ns
PSD PC1(t)Po
wer
spec
tra d
ensit
y
GMF
Sidebands Sidebands
fin
fout
(a)
50 100 150 200 250 300 350 400 450 500 550 600Frequency (Hz)
5 ite
ratio
ns
0100200300400500600700800900
PSD PC2(t)
Pow
er sp
ectr
a den
sity
SidebandsSidebands
GMF
fin
fout
(b)
50 100 150 200 250 300 350 400 450 500 550 600Frequency (Hz)
7 ite
ratio
ns
05
10152025303540
PSD PC3(t)
Pow
er sp
ectr
a den
sity
Sidebands
Sidebands
GMF
fin
fout
(c)
50 100 150 200 250 300 350 400 450 500 550 600Frequency (Hz)
10 it
erat
ions
02468
1012
Pow
er sp
ectr
a den
sity PSD PC4(t)
GMF
fout
(d)
Figure 10 Envelope spectra of the obtained components from ICD (gearbox) (a) PC1(t) (b) PC2 (c) PC3(t) and (d) PC4(t)
to distinguish between the healthy and the faulty condition ofa gearbox successfully
To verify the effectiveness of the ICD method revealingthe source of defect the algorithm is applied to one of theoutliers falling in bin 2 That file was gathered when thevariable frequency drive was running at 30Hz in faulty con-ditions (Figure 5(b)) Given that the broken tooth was in thepinion which is mounted on the output shaft the frequencyof interest is the rotational frequency of the output shaft(119891out = 201Hz)
When the gear is operating with a localized fault thevibration gathered can be classified as a multicomponent sig-nal amplitude-modulated (AM) and frequency-modulated(FM) It is not easy to find out which gear is faulty by simplyperforming the FFT Therefore further analysis in the time-frequency domain is required The ICD algorithm is utilizedto analyse the vibration signal coming from a gear in brokentooth fault condition Firstly the ICD method is applied todecompose the vibration signal in products The decomposi-tion process gives four PCs Secondly the PCs are envelopedand the frequency spectrum is performed to find the faultfrequency Results shown in Figure 10 are obtained after con-ducting the envelope spectrum analysis of the four PCs Asseen from Figures 10(a) 10(b) and 10(c) corresponding tothe envelope spectrum of PC1(t) PC2(t) and PC3(t) thereare obvious spectrum lines of the faulty frequency (119891out =201Hz) and the gear mesh frequency (GMF = 540Hz) andsidebands around it spaced a distance equal to the faulty fre-quency (4998Hz 5199Hz 5601 and 5802Hz) The ampli-tude of the fault peak is lower than the amplitude of the peakrelated to the rotating speed It can be confusing as someonecould think that the defective gear is the one at the input ofthe gearbox when it is the opposite As shown in Figure 10the spectrum of the enveloped signal is cleaner with each new
iteration of the method but it stills keeping the frequency ofinterest (119891out) Figure 10(d) shows the spectrum of the last PCderived from the ICD method This is the clearest PC spec-trum since the number of peaks has been sufficiently reducedand there is a peak which is bigger than the rest This peaklocated at 201 Hz brings to light the source of defect whichis a broken tooth at the pinion In the light of the results theICD method simplifies the defect identification process andconsequently easing the automation of this type of processes
Bearings are another important source of failure withingearboxes Vibrations coming from bearings are AM-FMmulticomponent signals which do not show the source ofdefect clearly The features of the fault are modulated andits extraction is complicated Therefore the ICD method isapplied to showcase its fault detection capabilities in othergearbox components In this case the aim is to detect anouter race defect in a roller ball bearing As demodulation isneeded the signal is decomposed and the fault type identifi-cation is carried out by applying envelope spectra Figure 11(a)shows the frequency spectrum of an outer race defect signalbefore any demodulation is applied The rotation speed was20Hz at the acquisition moment As can be seen the govern-ing frequency is the running speed set up in the VFD (119891
1=
20Hz) The faulty feature can be identified in the spectra inspite of the fact that its amplitude is much lower (BPFO =6089Hz) In addition a clearest indication of the sourceof defect is needed due to the fact that the BPFO could beconfused with the third harmonic of the rotating speed ICDis applied to this fault signal and the decomposed productsare shown in Figures 11(b) and 11(c) After two iterations theBPFO becomes noticeable being the peak with the highestamplitude of the frequency spectrum (Figure 11(b))The ICDhas demonstrated to be effective identifying outer race defectsin bearings
Shock and Vibration 11
100 200 300 400 500 600 700 800 900 10000
50100150200250300350400450
Frequency (Hz)
Pow
er sp
ectr
a den
sity PSD raw data
BPFO
fl
(a)
Pow
er sp
ectr
a den
sity
100 200 300 400 500 600 700 800 900 100005
1015202530
Frequency (Hz)
PSD PC1(t)
BPFO
fl
7 ite
ratio
ns
(b)Po
wer
spec
tra d
ensit
y
100 200 300 400 500 600 700 800 900 10000
20406080
100120140
Frequency (Hz)
PSD PC2(t)BPFO
fl
9 ite
ratio
ns
(c)
Figure 11 PSD of the raw signal and envelope spectra of the obtained components from ICD (bearing) (a) PSD raw data (b) PC1(t) and (c)PC2(t)
4 Field Trials on a Vestas V90-3MWWind Turbine
Experiments were conducted in a Vestas V90-3MW windturbine to validate themethodology above explained on fieldIn this section the set-up in the wind turbine gearbox andresults obtained after applying the algorithmdescribed in Fig-ure 2 are presentedThe aimof the experiments is to assess thehealth of the gearbox and if there is any sign of defect identifythe source
41 Experimental Set-Up and Gearbox Analysis The windturbine selected for accomplishing the field trials was a VestasV90-3MW which consist of a drive train (generator mainshaft and gearbox) control system three blades yaw systemand the tower Hereafter the wind turbine monitoring set-up is described It consists of a set of three accelerometersa data acquisition system (DAQ) referred to as CMS whichwas located in the inside of the nacelle and a data server (CMSserver) located in the inside of the nacelle as well The rota-tional speed signature (rpm) and power output (kW) whichare recorded as an average of the last tenminutes are suppliedby the wind turbine operator
The CMS utilizes vibration analysis for monitoring thegearbox of the wind turbine which consists of two planetarygear stages and one helical gear stage as shown in Figure 12It is located in the middle of the wind turbine drive Windturbine gearboxes are used to increase the rotor speed to aspeed suitable for the generation of electricity and operateunder varying load conditions Therefore there is a lowspeed shaft (connected to the blades) and high speed shaft(connected to the generator) which are related through thegearbox (ratio 1045582) Detailed information of this gear-box is provided inTable 4Thefirst stage is planetary inwhich
Table 4 Vestas V90-3MW gear teeth information
Gear stage Number of gear teethRing geargear Planet Sunpinion
Planetary stage I 87 33 18Planetary stage II 99 40 18Helical stage III 91 33
Table 5 Rotational frequencies for each stage
Gear stage Frequency (orders)Planet carriergear Planet Sunpinion
Planetary stage I 1x 159x 58xPlanetary stage II 58x 85x 379xHelical stage III 379x 1045x
the planetary carrier (fixed by the ring gear) is the inputTable 4 The first stage is planetary in which the planetarycarrier (fixed by the ring gear) is the input and the sun gearis the output terminal The second stage is equal to the firststage The transmission ratio will not be the same as thenumber of teeth is different The third stage consists of a gearwhich is connected to the output of the previous stage and apinion The pinion is at the output of the gearbox and deter-mines the speed of the high speed shaft (HSS) The forcingfrequencies to take into account when analysing gearbox datain the frequency domain are the rotational frequencies of thegears and the gear mesh frequencyThese values are depictedin Tables 5 and 6 respectively
For the application of vibration analysis to the windturbine gearbox three 3-axis piezoelectric accelerometers(Metra KS943 100mVg) with integrated built-in preampli-fiers (IEPE standard) were used Furthermore there is a need
12 Shock and Vibration
Table 6 Forcing frequencies for each stage
Gear mesh frequency (GMF) Frequency (orders)GMF stage I 10491xGMF stage II 68198xGMF stage III 344776x
LSS
HSS
Planetarystage I
Planetarystage II
Helicalstage III
ZRG1
ZRG1
ZRG2
ZRG2
ZP1
ZP1
ZP2
ZS1
ZS2
ZG
ZP
ZP2
120596input
120596output
120596P1
120596S2
120596S1
120596P2
Figure 12 Sketch of the Vestas V90-3MW gearbox configuration
for converters for each acceleration channel and a power sup-ply of 24V Because the frequency range used is below 1 kHzthe sensors could bemagnetically attached to the gearbox sur-face Special magnets which are available as accessories forthis type of sensors were used The IEPE converters providethe data acquisition card with the voltage output of the 3-axisof each sensor which is proportional to the vibration mea-sured by the transducers The accelerometers were attachedto the gearbox as shown in Figure 13 VIB1 first planetarystage VIB2 second planetary stage and VIB3 helical stageFigure 13(b) shows the position of the sensor with respect tothe global axis of the machine
42 Results Analysis The results from the field trials per-formed in a Vestas V90-3MW wind turbine between Mayand October 2015 are presented in Figure 14 A preliminarystudy based on the power curve for the Vestas V90 and thechanges experienced by the features (RMS) extracted overtime is presented Then the baseline and ICD algorithms areapplied to the field trials data for the health assessment of themonitored turbine
The power curve for the Vestas V90-3MW which showsthe wind turbinersquos power output versus the rotor speed is
shown in Figure 14This is a performance indicator which canbe used as first preventive maintenance indication that some-thing is wrong When a failure in the turbine occurs powerdeviates from the normal power curve In Figure 14 Mayand October power curves are superposed and no deviationsare noticed Therefore this indicator designates no presenceof malfunction at first sight
Figure 15 depicts the clustering of the data features using abinning process based on the rotor speedmeasured at the lowspeed shaft (16 rpm maximum) Figure 15 shows the numberof files stored in each bin Considering rotor speed as thebinning parameter the number of files increases from bin18 to bin 30 which means that the rotor speed varied mostlybetween 10 rpmand 16 rpmduring themonths the systemwasinstalled in the wind turbine The shape of the distributionmakes sense bearing in mind that turbines operate at highspeed for power generation purposes
To get a better idea of how the data looks like andhave a second performance indicator before the algorithmis applied the RMS of the vibrations collected within themonths ofMay andOctober are plotted in Figure 16 It gives agood overview of how the RMS changes versus time per binThe RMS does not show large variations with time Howeverthere are a couple of peaks which are of interest These peaksare located in the first two bins and in the last one The peaksrecorded at low rotor speeds occurred atmid-August whereasthe one captured at higher speeds happened at the beginningof September and its RMS value is around 8ms2 Furtherresearch revealed that those files which have higher RMSvalues were corrupted
Following on the baseline generation process and thehealth assessment based on its limits is presented During thesix months the field trials were taking place the operator didnot carry out any maintenance actions so it is assumed thatthe machinery is in a healthy status and the data collected isvery valuable for the generation of a baseline This baselinewill mark the limits of normal operation conditions for thisparticular turbine The baseline will be a useful tool for windturbine operators so themaintenance actions are only carriedout when deviations from the target value are noticed andverified as defect initiation worsening or malfunction of thegearbox
The convergence criterion is applied to all the bins Theresults are depicted just for bin 30 though Figure 17 showshow the EMA gets lower with every RMS value added tobin 30 The EMA in this bin starts dropping very fast fromthe beginning and converge after some measurement due tothe fact that the EMA is close to 0 The stopping criterionstipulates the minimum number of files as 34 (dotted line inFigure 17)
Figure 18 depicts the baseline obtained after calculatingtheminimumnumber of data necessary to establish the alarmandwarning limits reliably in each binThis baseline is uniquefor this turbine and is suitable for monitoring at low or highrotor speeds covering the wind turbine through all its oper-ational range The number of files utilized for calculating thelimits varies depending on the result obtained after evaluatingthe convergence criteria (see values in Table 7) The results
Shock and Vibration 13
Table7Con
vergence
perb
in
Binnu
mber
12
34
56
78
910
1112
1314
1516
1718
1920
2122
2324
2526
2728
2930
Con
vergence
Pointsused
forb
aseline
4131
4145
4537
75
125
109
59
710
919
98143
4769
5556
3935
3139
2730
Baselin
efin
ished
June
July
June
July
June
June
June
June
June
May
May
14 Shock and Vibration
VIB1
VIB2
VIB3
(a)
VIB1
VIB2
VIB3
x
x
x
x
y
y
y
y
z
z
z
x
x
y
y
z
z
z
(b)
Figure 13 Sensors attachment on the gearbox (a) set-up and (b) global (red) and local (blue) axis
0 2 4 6 8 10 12 14 16 18minus500
0
500
1000
1500
2000
2500
3000
3500
Rotor speed (rpm)
Pow
er o
utpu
t (kW
)
May 2015October 2015
Power curve vestas V90-3MW
Figure 14 Scatter plot with power output as function of the rotorspeed
0 5 10 15 20 25 300
200
400
600
800
1000
1200
1400
1600Data distribution rotor speed (rpm)
Bin number
Num
ber o
f file
s
Figure 15 Distribution of the wind turbine data gathered using 30bins
10
8
6
4
2
0Oct 2015
Sep 2015Aug 2015
Jul 2015Jun 2015
May 2015Time 0
510
1520
2530
35
Bin number
RMS
acce
lera
tion
(ms
2)
Figure 16 Variation on the RMS value of the acceleration per bin
0 200 400 600 800 1000 1200 1400 1600
0
5
10
15
20
25
30
Number of files
Mov
ing
aver
age e
rror
()
Figure 17 Convergence in bin 30
point out that convergence was not reached in all the binsAccording to the results the fact of not reaching the conver-gence criterion in some bins is associated directly with thenumber of data clustered in them As commented previouslyin the paper the number of events recorded at low speed isvery low The method does not converge in the low speedbins where there is not convergence of the method It can be
Shock and Vibration 15
0 5 10 15 20 25 30minus4
minus2
0
2
4
6
8
10
Bin number
RMS
acce
lera
tion
(ms
2)
+warning limitBin mean
minuswarning limit
+action limitminusaction limit
Figure 18 Baseline and targeted mean for a Vestas V90-3MWwindturbine
noticed that the number of data clustered in them is less than70 files It does not mean that provisional values cannot begiven to the limits It means that more data is required inorder to average the current value more and set the limits ina more confident way At high rotor speeds the baseline hasbeen properly defined reaching the convergence in all thebins apart from bin 22 (which only contains 69 files) Mostof the bins converged in June although some of them did itearlier (May) and others a bit later (July) Therefore it canbe concluded that a period of three months was necessary todefine the baseline complying with the convergence criteria
Figure 18 depicts the warning and action limits whichdefine zones A B and C along with the targeted mean of theRMS values of the acceleration signals stored in each bin
After defining the baseline the machine goes into themonitoring stage The data gathered after satisfying the con-vergence criterion is plotted along with the limits in Figure 19to evaluate their deviation from the targetedmean In this fig-ure the limits still have the same values but there are two setsof data presented in different colours The blue colour pointsout that convergence was not reached in those bins On theother hand the green colour indicates the convergence withinthose bins and the points represent the data gathered afterthe baseline was defined The results depicted in Figure 19are very promising specially bearing in mind that this data istotally independent of the data previously used for the limitsestablishment The new data consist of more than 2000RMSvalueswhichmostly fall within the limitsThere are some out-liers though The percentage of outliers between the warningand alarm limits has been estimated 0 in bin 20 2 in bin21 16 in bin 26 and 25 in bin 30 Since it was chosen toadd 2 times the standard deviation to the mean as a warningstrategy a 5 of the data within each bin can fall outside thelimits The percentages are good as they are lower than a 5There are points above the alarm limits as well For instancethat happens in bins 19 29 and 30The percentage of outliers
0 5 10 15 20 25 30minus4
minus2
0
2
4
6
8
10
Bin number
Data gathered from May 2015 until October 2015Data gathered since the baseline definition until October 2015
RMS
acce
lera
tion
(ms
2)
Figure 19 Monitoring using a 3-month established baseline
in those bins is 04 03 and 012 Since it was chosen toadd 3 times the standard deviation to the mean as a warningstrategy a 02 of the data within each bin can fall outsidethe limits The resulting percentage is good for bin 30 as it islower than 02 For the other two bins the percentages areacceptable as they are slightly bigger than 02Therefore theresults shown in Figures 18 and 19 are a good tool for describ-ing the acceptable levels of vibration of the wind turbinegearbox regarding the rotor speed of the wind turbine
Outliers need to be further studied to find out the rootcause of the deviations One outlier per bin was analysedusing the ICD method and the forcing frequencies werecalculated according to the gearbox information provided inTable 6 The demodulation of the signal was carried out insix iterations which are shown in Figure 20 After PC1(t) wasobtained the envelope spectrum of the signal shows the gearmesh frequency at the 3rd stage This is the only peak thatmatches with the forcing frequencies theoretically calculatedIn the following stages of the demodulation the peak disap-pearswhichmeans that it was not a fault featuremodulated byother frequencies PC2(t) PC3(t) PC4(t) PC5(t) andPC6(t)do not show explicit spectra lines of the fault frequencies ofthe gearsTherefore the ICDdoes not show indication of geardefects within the gearbox
5 Conclusions
This paper presents a novel approach for health conditionmonitoring and fault diagnosis in wind turbine gearboxesThe paper proposes baseline and ICD-based early faultdiagnosis methodologies which are tested on laboratory andwind turbine vibration signals
A baselinewhich represents the normal operation bound-aries of the test rig and a Vestas V90-3MW have beenproduced It is important to state that the resultant baselinefrom the laboratory trials has been validated and it hasbeen accomplished with two sets of independent data (onehealthy and another one from a gearboxwith a broken tooth)
16 Shock and Vibration
Frequency (Hz)
Pow
er sp
ectr
a den
sity PSD PC1(t)
200 400 600 800 1000 1200 1400 1600 1800 20000
001002003004005006007008009
01GMF stage III
6ite
ratio
ns
(a)
200 400 600 800 1000 1200 1400 1600 1800 20000123456789
Frequency (Hz)
Pow
er sp
ectr
a den
sity PSD PC2(t)times10minus3
8ite
ratio
ns
(b)
200 400 600 800 1000 1200 1400 1600 1800 200001234567
Frequency (Hz)
Pow
er sp
ectr
a den
sity PSD PC3(t)times10minus3
7ite
ratio
ns(c)
200 400 600 800 1000 1200 1400 1600 1800 200001234567
Frequency (Hz)
Pow
er sp
ectr
a den
sity PSD PC4(t)times10minus3
9ite
ratio
ns
(d)
200 400 600 800 1000 1200 1400 1600 1800 2000012345678
Frequency (Hz)
Powe
r spe
ctra
den
sity PSD PC5(t)times10minus3
11ite
ratio
ns
(e)
200 400 600 800 1000 1200 1400 1600 1800 20000
0002000400060008
0010012
Frequency (Hz)
Powe
r spe
ctra
den
sity PSD PC6(t)
11ite
ratio
ns
(f)
Figure 20 PSD of the envelope spectra of the obtained components from ICD (wind turbine data) (a) PC1(t) (b) PC2 (t) (c) PC3(t) (d)PC4(t) (e) PC5(t) and (f) PC6(t)
Deviations from the targetedmean appear when the faulty setof data is utilized The application of the baseline algorithmto the Vestas V90-3MW data establishes the range within themachine is running safely Some outliers were identified athigh running speeds which is not veryworrying as the outlierrate is lower or close to the value established by the proba-bility factor The validation expounds this methodology as agood practice for identifying those deviations which worriesmanufactures and wind turbine operators nowadays
The process carried out for classifying the outliers at thelaboratory demonstrates that the combination between theICD method and the envelope spectrum analysis is superblyefficient for broken tooth and outer race fault diagnosis TheICD method is experimentally demonstrated to be able toextract the early fault signature effectivelyThe algorithm wasused to process the wind turbine outliers as well Howeverthe demodulated signal does not show any defect featureThis result along with the output coming from the powercurve indicator and the information provided by the operatorregarding the health of the machinery exhibits the lack ofdefect in the gears within the gearbox subsystem Then theoutliers found at high speeds are considered false alarms
The application of the ICD method simplifies the defectidentification process due to the following two factors thenumber of peaks in the spectrum is lower and the sourceof defect is shown as the peak with the biggest amplitudeTherefore the ICDmethod eases the automation of the defectdetection processes carried out by CMSwhich allows lookingfor the source of defect in real time
Competing Interests
The authors declare that they have no competing interests
References
[1] S-W Choi K M Farinholt S G Taylor A Light-Marquezand G Park ldquoDamage identification of wind turbine bladesusing piezoelectric transducersrdquo Shock and Vibration vol 2014Article ID 430854 9 pages 2014
[2] S Sheng and P Veers Wind Turbine Drive Train ConditionMonitoringmdashAn Overview National Renewable Energy Labo-ratory Golden Colo USA 2011
[3] Y Gui Q K Han Z Li and F L Chu ldquoDetection and local-ization of tooth breakage fault on wind turbine planetary gear
Shock and Vibration 17
system considering gear manufacturing errorsrdquo Shock andVibration vol 2014 Article ID 692347 13 pages 2014
[4] R Moesgaard H Chandler P Barons and G Bakema WindEnergymdashThe Facts The Economics of Wind Power Earthscan2009
[5] S Sheng ldquoInvestigation of various wind turbine drivetraincondition monitoring techniquesrdquo in Proceedings of the WindTurbine Reliability Workshop Albuquerque NM USA August2011
[6] M Strączkiewicz and T Barszcz ldquoApplication of artificial neuralnetwork for damage detection in planetary gearbox of windturbinerdquo Shock and Vibration vol 2016 Article ID 4086324 12pages 2016
[7] Y Feng Y Qiu C J Crabtree H Long and P J Tavner ldquoMon-itoring wind turbine gearboxesrdquoWind Energy vol 16 no 5 pp728ndash740 2013
[8] S ShengWind Turbine Drivetrain ConditionMonitoring PowerPoint Presentation NRELNWTC New York NY USA 2011
[9] F P Garcıa Marquez A M Tobias J M Pinar Perez and MPapaelias ldquoCondition monitoring of wind turbines techniquesand methodsrdquo Renewable Energy vol 46 pp 169ndash178 2012
[10] F P Garcia J M Pinar A Pliego and M Papaelias ldquoIdentifi-cation of critical components of wind turbines using FTA overthe timerdquo Renewable Energy vol 46 pp 169ndash178 2012
[11] Z Tian T Jin B Wu and F Ding ldquoCondition based mainte-nance optimization for wind power generation systems undercontinuous monitoringrdquo Renewable Energy vol 36 no 5 pp1502ndash1509 2011
[12] C C Ciang J-R Lee and H-J Bang ldquoStructural health moni-toring for a wind turbine system a review of damage detectionmethodsrdquo Measurement Science and Technology vol 19 no 12Article ID 122001 20 pages 2008
[13] A Kusiak and W Li ldquoThe prediction and diagnosis of windturbine faultsrdquo Renewable Energy vol 36 no 1 pp 16ndash23 2011
[14] D Yang H Li Y Hu J Zhao H Xiao and Y Lan ldquoVibrationcondition monitoring system for wind turbine bearings basedon noise suppression with multi-point data fusionrdquo RenewableEnergy vol 92 pp 104ndash116 2016
[15] B N Madsen Condition monitoring of wind turbines by electricsignature analysis [MS thesis] Technical University of Dene-mark Copenhagen Denmark 2011
[16] P Tchakoua R Wamkeue M Ouhrouche F Slaoui-HasnaouiT A Tameghe and G Ekemb ldquoWind turbine condition moni-toring state-of-the-art review new trends and future chal-lengesrdquo Energies vol 7 no 4 pp 2595ndash2630 2014
[17] Z Hameed Y S Hong Y M Cho S H Ahn and C K SongldquoConditionmonitoring and fault detection ofwind turbines andrelated algorithms a reviewrdquo Renewable and Sustainable EnergyReviews vol 13 no 1 pp 1ndash39 2009
[18] Noordzee Wind ldquoOperation Report 2009 Document NoOWEZ R 000 20101112rdquo November 2010 httpwwwnoord-zeewindnlwpcontentuploads201202OWEZ R 000 20101112Operations 2009pdf
[19] C J Crabtree D Zappala and P J Tavner ldquoSurvey of com-mercially available condition monitoring systems for windturbinesrdquo Tech Rep Durham University 2014
[20] A May D McMillan and S Thons ldquoEconomic analysis ofcondition monitoring systems for offshore wind turbine sub-systemsrdquo IET Renewable Power Generation vol 9 no 8 pp900ndash907 2015
[21] S Soua P Van Lieshout A Perera T-H Gan and B BridgeldquoDetermination of the combined vibrational and acoustic emis-sion signature of a wind turbine gearbox and generator shaftin service as a pre-requisite for effective condition monitoringrdquoRenewable Energy vol 51 pp 175ndash181 2013
[22] T Toutountzakis and D Mba ldquoObservations of acoustic emis-sion activity during gear defect diagnosisrdquo NDT amp E Interna-tional vol 36 no 7 pp 471ndash477 2003
[23] C Molina ldquoContributions to the analysis of vibration andacoustic emissions for the condition monitoring of epicyclicgearboxesrdquo 2010
[24] C K Tan P Irving and D Mba ldquoA comparative experimentalstudy on the diagnostic and prognostic capabilities of acousticsemission vibration and spectrometric oil analysis for spurgearsrdquo Mechanical Systems and Signal Processing vol 21 no 1pp 208ndash233 2007
[25] R Ahmad and S Kamaruddin ldquoAn overview of time-basedand condition-based maintenance in industrial applicationrdquoComputers and Industrial Engineering vol 63 no 1 pp 135ndash1492012
[26] R B RandallVibration-BasedConditionMonitoring IndustrialAerospace and Automotive Applications John Wiley amp SonsNew York NY USA 2011
[27] P Vecer M Kreidl and R Smid ldquoCondition indicators forgearbox condition monitoring systemsrdquo Acta Polytechnica vol45 no 6 pp 3ndash17 2005
[28] K FischerMaintenanceManagement ofWind Power Systems byMeans of Reliability-Centred Maintenance and Condition Mon-itoring Systems Chalmers University of Technology Gothen-burg Sweden 2012
[29] S Sheng ldquoWind turbine gearbox condition monitoring roundrobin studymdashvibration analysisrdquo Tech Rep National Renew-able Energy Laboratory Denver Colo USA 2012
[30] D F Shi L S Qu and N N Gindy ldquoGeneral interpolatedfast fourier transform a new tool for diagnosing large rotatingmachineryrdquo Journal of Vibration andAcoustics vol 127 no 4 pp351ndash361 2005
[31] M Inalpolat and A Kahraman ldquoA dynamic model to predictmodulation sidebands of a planetary gear set having manufac-turing errorsrdquo Journal of Sound and Vibration vol 329 no 4pp 371ndash393 2010
[32] M Inalpolat and A Kahraman ldquoA theoretical and experimentalinvestigation of modulation sidebands of planetary gear setsrdquoJournal of Sound and Vibration vol 323 no 3ndash5 pp 677ndash6962009
[33] M E Badaoui F Guillet and J Daniere ldquoNew applications ofthe real cepstrum to gear signals including definition of a robustfault indicatorrdquo Mechanical Systems and Signal Processing vol18 no 5 pp 1031ndash1046 2004
[34] Y Itoh T Imazu H Nakamura and T Yamazaki VibrationAnalysis Based on Time-Frequency Analysis with a DigitalFilter Application toNonlinear System Identification InternoiseMelbourne Australia 2014
[35] R Bajric N Zuber G A Skrimpas and N Mijatovic ldquoFeatureextraction using discrete wavelet transform for gear fault diag-nosis of wind turbine gearboxrdquo Shock and Vibration vol 2016Article ID 6748469 10 pages 2016
[36] L Cohen Time Frequency Analysis vol 778 Prentice Hall PTREnglewood Cliffs NJ USA 1995
18 Shock and Vibration
[37] W J Staszewski K Worden and G R Tomlinson ldquoTime-frequency analysis in gearbox fault detection using theWigner-Ville distribution and pattern recognitionrdquoMechanical Systemsand Signal Processing vol 11 no 5 pp 673ndash692 1997
[38] M Timusk M Lipsett and C K Mechefske ldquoFault detectionusing transientmachine signalsrdquoMechanical Systems and SignalProcessing vol 22 no 7 pp 1724ndash1749 2008
[39] W J Staszewski and G R Tomlinson ldquoApplication of thewavelet transform to fault detection in a spur gearrdquoMechanicalSystems and Signal Processing vol 8 no 3 pp 289ndash307 1994
[40] H-J Kou H-Q Yuan and X-Y Zhao ldquoApplication of waveletde-noising in fault diagnosis of wind turbine gearboxesrdquoAdvanced Materials Research vol 562-564 pp 1091ndash1094 2012
[41] F-C Zhou ldquoResearch on online monitoring of gear fault ofwind power gearbox based on undecimated wavelet transfor-mationrdquo Advanced Materials Research vol 383ndash390 pp 4928ndash4931 2012
[42] Y Lu J Tang andH Luo ldquoWind turbine gearbox fault detectionusingmultiple sensors with features level data fusionrdquo Journal ofEngineering for Gas Turbines and Power vol 134 no 4 ArticleID 042501 8 pages 2012
[43] S Yang W Li and C Wang ldquoThe intelligent fault diagnosisof wind turbine gearbox based on artificial neural networkrdquoin Proceedings of the International Conference on ConditionMonitoring and Diagnosis (CMD rsquo08) pp 1327ndash1330 BeijingChina April 2008
[44] I Antoniadou G Manson N Dervilis T Barszcz WStaszewski and K Worden ldquoCondition monitoring of a windturbine gearbox using the empirical mode decompositionmethod and outlier analysisrdquo in Proceedings of the 6th EuropeanWorkshop on Structural Health Monitoring (EWSHM rsquo12) pp1316ndash1323 July 2012
[45] W Yang R Court P J Tavner and C J Crabtree ldquoBivariateempirical mode decomposition and its contribution to windturbine condition monitoringrdquo Journal of Sound and Vibrationvol 330 no 15 pp 3766ndash3782 2011
[46] Y Kopsinis and SMcLaughlin ldquoInvestigation and performanceenhancement of the empirical mode decomposition methodbased on a heuristic search optimization approachrdquo IEEETransactions on Signal Processing vol 56 no 1 pp 1ndash13 2008
[47] GG PegramMC Peel andT AMcMahon ldquoEmpiricalmodedecomposition using rational splines an application to rainfalltime seriesrdquo Proceedings of the Royal Society of London Series AMathematical Physical and Engineering Sciences vol 464 no2094 pp 1483ndash1501 2008
[48] Y Wang Z He and Y Zi ldquoA comparative study on the localmean decomposition and empirical mode decomposition andtheir applications to rotating machinery health diagnosisrdquoJournal of Vibration and Acoustics vol 132 no 2 Article ID021010 2010
[49] M G Frei and I Osorio ldquoIntrinsic time-scale decompositiontime-frequency-energy analysis and real-time filtering of non-stationary signalsrdquo Proceedings of the Royal Society of London Avol 463 no 2078 pp 321ndash342 2007
[50] G T Zheng and P D McFadden ldquoA time-frequency distri-bution for analysis of signals with transient components andits application to vibration analysisrdquo Journal of Vibration andAcoustics vol 121 no 3 pp 328ndash333 1999
[51] D E Newland ldquoRidge and phase identification in the frequencyanalysis of transient signals by harmonic waveletsrdquo Journal ofVibration and Acoustics vol 121 no 2 pp 149ndash155 1999
[52] W-X Yang and P W Tse ldquoAn advanced strategy for detectingimpulses in mechanical signalsrdquo Journal of Vibration andAcoustics vol 127 no 3 pp 280ndash284 2005
[53] Y Li M Xu Y Wei and W Huang ldquoRotating machine faultdiagnosis based on intrinsic characteristic-scale decomposi-tionrdquoMechanism and Machine Theory vol 94 pp 9ndash27 2015
[54] R O Duda P E Hart and D G Stork Pattern ClassificationJohn Wiley amp Sons New York NY USA 2012
[55] C R Farrar and K Worden Structural Health Monitoring AMachine Learning Perspective John Wiley amp Sons New YorkNY USA 2012
[56] A Jessop statNotes Some Statistics for Management ProblemsU Durham University World Scientific 2016
[57] A Grous Applied Quality Control Fracture Mechanics vol 3John Wiley amp Sons New York NY USA 2013
International Journal of
AerospaceEngineeringHindawi Publishing Corporationhttpwwwhindawicom Volume 2014
RoboticsJournal of
Hindawi Publishing Corporationhttpwwwhindawicom Volume 2014
Hindawi Publishing Corporationhttpwwwhindawicom Volume 2014
Active and Passive Electronic Components
Control Scienceand Engineering
Journal of
Hindawi Publishing Corporationhttpwwwhindawicom Volume 2014
International Journal of
RotatingMachinery
Hindawi Publishing Corporationhttpwwwhindawicom Volume 2014
Hindawi Publishing Corporation httpwwwhindawicom
Journal ofEngineeringVolume 2014
Submit your manuscripts athttpwwwhindawicom
VLSI Design
Hindawi Publishing Corporationhttpwwwhindawicom Volume 2014
Hindawi Publishing Corporationhttpwwwhindawicom Volume 2014
Shock and Vibration
Hindawi Publishing Corporationhttpwwwhindawicom Volume 2014
Civil EngineeringAdvances in
Acoustics and VibrationAdvances in
Hindawi Publishing Corporationhttpwwwhindawicom Volume 2014
Hindawi Publishing Corporationhttpwwwhindawicom Volume 2014
Electrical and Computer Engineering
Journal of
Advances inOptoElectronics
Hindawi Publishing Corporation httpwwwhindawicom
Volume 2014
The Scientific World JournalHindawi Publishing Corporation httpwwwhindawicom Volume 2014
SensorsJournal of
Hindawi Publishing Corporationhttpwwwhindawicom Volume 2014
Modelling amp Simulation in EngineeringHindawi Publishing Corporation httpwwwhindawicom Volume 2014
Hindawi Publishing Corporationhttpwwwhindawicom Volume 2014
Chemical EngineeringInternational Journal of Antennas and
Propagation
International Journal of
Hindawi Publishing Corporationhttpwwwhindawicom Volume 2014
Hindawi Publishing Corporationhttpwwwhindawicom Volume 2014
Navigation and Observation
International Journal of
Hindawi Publishing Corporationhttpwwwhindawicom Volume 2014
DistributedSensor Networks
International Journal of
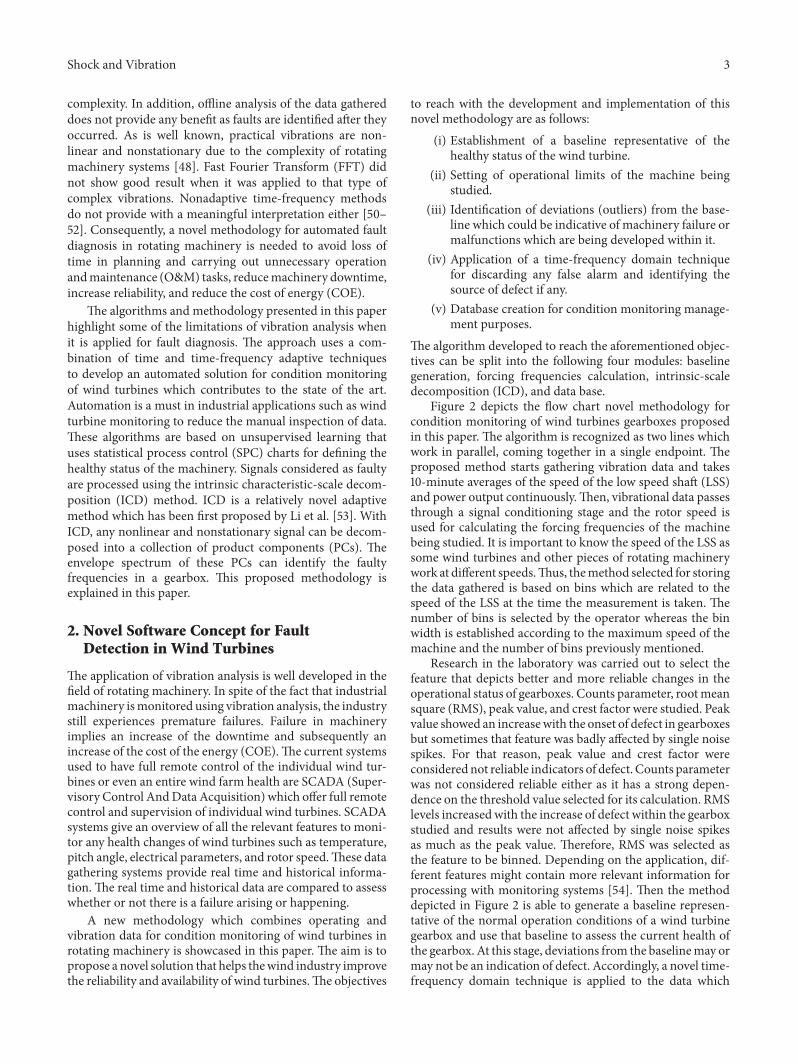

International Journal of
AerospaceEngineeringHindawi Publishing Corporationhttpwwwhindawicom Volume 2014
RoboticsJournal of
Hindawi Publishing Corporationhttpwwwhindawicom Volume 2014
Hindawi Publishing Corporationhttpwwwhindawicom Volume 2014
Active and Passive Electronic Components
Control Scienceand Engineering
Journal of
Hindawi Publishing Corporationhttpwwwhindawicom Volume 2014
International Journal of
RotatingMachinery
Hindawi Publishing Corporationhttpwwwhindawicom Volume 2014
Hindawi Publishing Corporation httpwwwhindawicom
Journal ofEngineeringVolume 2014
Submit your manuscripts athttpwwwhindawicom
VLSI Design
Hindawi Publishing Corporationhttpwwwhindawicom Volume 2014
Hindawi Publishing Corporationhttpwwwhindawicom Volume 2014
Shock and Vibration
Hindawi Publishing Corporationhttpwwwhindawicom Volume 2014
Civil EngineeringAdvances in
Acoustics and VibrationAdvances in
Hindawi Publishing Corporationhttpwwwhindawicom Volume 2014
Hindawi Publishing Corporationhttpwwwhindawicom Volume 2014
Electrical and Computer Engineering
Journal of
Advances inOptoElectronics
Hindawi Publishing Corporation httpwwwhindawicom
Volume 2014
The Scientific World JournalHindawi Publishing Corporation httpwwwhindawicom Volume 2014
SensorsJournal of
Hindawi Publishing Corporationhttpwwwhindawicom Volume 2014
Modelling amp Simulation in EngineeringHindawi Publishing Corporation httpwwwhindawicom Volume 2014
Hindawi Publishing Corporationhttpwwwhindawicom Volume 2014
Chemical EngineeringInternational Journal of Antennas and
Propagation
International Journal of
Hindawi Publishing Corporationhttpwwwhindawicom Volume 2014
Hindawi Publishing Corporationhttpwwwhindawicom Volume 2014
Navigation and Observation
International Journal of
Hindawi Publishing Corporationhttpwwwhindawicom Volume 2014
DistributedSensor Networks
International Journal of