Research Article The Bacteriomes of Ileal Mucosa and Cecal ...
13
Research Article The Bacteriomes of Ileal Mucosa and Cecal Content of Broiler Chickens and Turkeys as Revealed by Metagenomic Analysis Shan Wei, Michael Lilburn, and Zhongtang Yu Department of Animal Sciences, e Ohio State University, Columbus, OH 43210, USA Correspondence should be addressed to Zhongtang Yu; [email protected] Received 9 August 2016; Revised 7 November 2016; Accepted 27 November 2016 Academic Editor: Akira Hiraishi Copyright © 2016 Shan Wei et al. is is an open access article distributed under the Creative Commons Attribution License, which permits unrestricted use, distribution, and reproduction in any medium, provided the original work is properly cited. e gastrointestinal (GI) bacteriome of poultry is important in host nutrition and health, but its diversity and composition remain poorly characterized. In this study we phylogenetically characterized the bacteriome in the cecal contents and ileal mucosa of chickens and turkeys using metagenomics empowered by pyrosequencing technique. >95% coverage of bacterial diversity was achieved except for the turkey ileal mucosa. Collectively, 3,401 and 125 operational taxonomy units (OTU, defined at a 0.03 phylogenetic distance) in chicken, and 1,687 and 16 OTUs in turkey were identified from the cecal content and the ileal mucosa, respectively. Besides those previously reported, 39 and 50 additional genera of bacteria were identified in the chicken and turkey cecal bacteriome, respectively. Although the GI bacteriomes of the same region in both species exhibited greater similarity than the bacteriomes of different regions within each species, broiler chickens and turkeys harbor a distinct intestinal bacteriome. Such difference may suggest different dietary interventions for bacteriome modulation for enhanced nutrient utilization and gut health. e results may also be useful in developing prebiotics, probiotics, and analytical tools (e.g., phylochips). We also determined the variation in the number of OTUs and variability between two independent pyrosequencing runs and two data processing pipelines. 1. Introduction e poultry gastrointestinal (GI) tract harbors a dynamic microbial community consisting of a large number of species, primarily bacteria [1]. is bacterial community, or bacte- riome, plays a pivotal role in the overall health and perfor- mance of poultry. e GI bacteria can be roughly classified as either pathogenic or commensal organisms [2]. Pathogenic bacteria can harm the host by causing localized or systemic infections and intestinal lesions [3] while commensal bacteria can benefit the host by providing nutrients, metabolic facilita- tion, and competitive exclusion [4, 5]. A better understanding of the bacterial composition and activity as well as the under- lying mechanisms by which indigenous bacteria modulate the GI environment is needed to improve host health and feed utilization. For many years, studies aimed at understanding the poultry GI bacteriome relied on classical cultivation tech- niques. During the past two decades, however, the 16S rRNA gene has been used as a primary biomarker for bacterial identification in various environments including the GI tract of poultry. is technique overcomes the limitation of culture-dependent methodologies thus potentially allowing for the identification of all the GI bacteria irrespective of their culturability. Studies using individual 16S rRNA gene clone libraries have provided valuable insight into the diverse GI bacteriome of poultry by producing high- quality sequences. However, these studies were limited to relatively small numbers of sequences that were affordable to researchers. Consequently, a comprehensive study looking into the diversity and composition of the GI bacteriome in poultry was not possible until next-generation sequencing (NGS) becomes available. High-throughput NGS technologies have proven to be powerful tools for comprehensive analysis of complex bacte- riomes [6, 7]. NGS technologies can generate large amounts of sequencing data at a relatively low cost. It also allows for sequencing of environmental DNA without a prior cloning step thereby eliminating cloning bias [8, 9]. e unprece- dented sequencing capacity also allows for the identification of bacteria that are present in low abundance in a bacteriome. Although being replaced by other NGS technologies, the Hindawi Publishing Corporation International Journal of Microbiology Volume 2016, Article ID 4320412, 12 pages http://dx.doi.org/10.1155/2016/4320412
Transcript of Research Article The Bacteriomes of Ileal Mucosa and Cecal ...

Research ArticleThe Bacteriomes of Ileal Mucosa and Cecal Content of BroilerChickens and Turkeys as Revealed by Metagenomic Analysis
ShanWei, Michael Lilburn, and Zhongtang Yu
Department of Animal Sciences, The Ohio State University, Columbus, OH 43210, USA
Correspondence should be addressed to Zhongtang Yu; [email protected]
Received 9 August 2016; Revised 7 November 2016; Accepted 27 November 2016
Academic Editor: Akira Hiraishi
Copyright © 2016 Shan Wei et al.This is an open access article distributed under theCreative CommonsAttribution License, whichpermits unrestricted use, distribution, and reproduction in any medium, provided the original work is properly cited.
The gastrointestinal (GI) bacteriome of poultry is important in host nutrition and health, but its diversity and composition remainpoorly characterized. In this study we phylogenetically characterized the bacteriome in the cecal contents and ileal mucosa ofchickens and turkeys using metagenomics empowered by pyrosequencing technique. >95% coverage of bacterial diversity wasachieved except for the turkey ileal mucosa. Collectively, 3,401 and 125 operational taxonomy units (OTU, defined at a 0.03phylogenetic distance) in chicken, and 1,687 and 16 OTUs in turkey were identified from the cecal content and the ileal mucosa,respectively. Besides those previously reported, 39 and 50 additional genera of bacteria were identified in the chicken and turkeycecal bacteriome, respectively. Although the GI bacteriomes of the same region in both species exhibited greater similarity thanthe bacteriomes of different regions within each species, broiler chickens and turkeys harbor a distinct intestinal bacteriome. Suchdifference may suggest different dietary interventions for bacteriome modulation for enhanced nutrient utilization and gut health.The results may also be useful in developing prebiotics, probiotics, and analytical tools (e.g., phylochips). We also determined thevariation in the number of OTUs and variability between two independent pyrosequencing runs and two data processing pipelines.
1. Introduction
The poultry gastrointestinal (GI) tract harbors a dynamicmicrobial community consisting of a large number of species,primarily bacteria [1]. This bacterial community, or bacte-riome, plays a pivotal role in the overall health and perfor-mance of poultry.The GI bacteria can be roughly classified aseither pathogenic or commensal organisms [2]. Pathogenicbacteria can harm the host by causing localized or systemicinfections and intestinal lesions [3] while commensal bacteriacan benefit the host by providing nutrients,metabolic facilita-tion, and competitive exclusion [4, 5]. A better understandingof the bacterial composition and activity as well as the under-lyingmechanisms bywhich indigenous bacteriamodulate theGI environment is needed to improve host health and feedutilization.
For many years, studies aimed at understanding thepoultry GI bacteriome relied on classical cultivation tech-niques. During the past two decades, however, the 16S rRNAgene has been used as a primary biomarker for bacterialidentification in various environments including the GI
tract of poultry. This technique overcomes the limitation ofculture-dependent methodologies thus potentially allowingfor the identification of all the GI bacteria irrespectiveof their culturability. Studies using individual 16S rRNAgene clone libraries have provided valuable insight intothe diverse GI bacteriome of poultry by producing high-quality sequences. However, these studies were limited torelatively small numbers of sequences that were affordableto researchers. Consequently, a comprehensive study lookinginto the diversity and composition of the GI bacteriome inpoultry was not possible until next-generation sequencing(NGS) becomes available.
High-throughput NGS technologies have proven to bepowerful tools for comprehensive analysis of complex bacte-riomes [6, 7]. NGS technologies can generate large amountsof sequencing data at a relatively low cost. It also allows forsequencing of environmental DNA without a prior cloningstep thereby eliminating cloning bias [8, 9]. The unprece-dented sequencing capacity also allows for the identificationof bacteria that are present in low abundance in a bacteriome.Although being replaced by other NGS technologies, the
Hindawi Publishing CorporationInternational Journal of MicrobiologyVolume 2016, Article ID 4320412, 12 pageshttp://dx.doi.org/10.1155/2016/4320412

2 International Journal of Microbiology
Table 1: Barcoded degenerate primers used to produce the V3 amplicon libraries.
Forward B-A-D16-357F: GCCTCCCTCGCGCCATCAGACGCTCGACACWYCTACGGRDGGCWGCAGC-A-D16-357F: GCCTCCCTCGCGCCATCAGAGACGCACTCCWYCTACGGRDGGCWGCAGD-A-D16-357F: GCCTCCCTCGCGCCATCAGAGCACTGTAGCWYCTACGGRDGGCWGCAGE-A-D16-357F: GCCTCCCTCGCGCCATCAGATCAGACACGCWYCTACGGRDGGCWGCAG
Reverse B-D4-519R: GCCTTGCCAGCCCGCTCAGGTNTTACCGCGGCTGCTGThe unique barcode is underlined.
454 pyrosequencing technology is the first NGS technologythat has been widely used to analyze the GI bacteriomes ofhuman and animals as well as environmental bacteriomes[10–12]. However, to date, there are only a few studies thathave attempted to characterize the diversity and compositionof the GI bacteriome of chickens and turkeys [13–16]. Thesestudies only reported a relatively small number of sequencesper sample (<10,000 reads) resulting in low coverage and astill incomplete picture of the diversity within the poultry GIbacteriome.
It has been recognized that the 454 pyrosequencingtechnology generates sequencing errors, sequence artifacts,and chimeric sequences [18, 19]. Also, different 454 sequenceanalysis pipelines use different algorithms for sequencealignment, phylogenetic distance computation, and OTUclustering, leading to different results [18–22], includingover- or underestimation of diversity and species (OTUs)richness [23]. Moreover, little attention has been given tothe repeatability of the technology across different pyrose-quencing runs even though variability between runs canoccur [24]. Thus, the primary objective of this study wasto characterize the composition of the GI bacteriome incommercial poultry species, (chicken and turkey) using the454 pyrosequencing technique. The secondary objective wasto evaluate the repeatability of the technique and the effectsof different data processing pipelines.
2. Materials and Methods
2.1. Sample Collection. All animal protocols were approvedby the Ohio Agricultural Research and Development CenterAnimal Care and Use Committee.
Five broiler chickens were randomly chosen from each ofthree flocks at six weeks of age, and eight turkeys were chosenfrom one flock at 14 weeks of age. Both the chicken flocksand the turkey flock reared at the poultry Research Farmlocated at the Ohio Agricultural Research and DevelopmentCenter (OARDC), Wooster, Ohio. The chickens and turkeyswere fed standard corn-soybean-meal-based diets that metor exceeded the NRC requirements [25] for each species.Cecal contents were collected from each bird and pooled byspecies (the samples were pooled to reduce the number ofsamples while achieving high depth coverage per sample).The sequencing was done before Illumina sequencing wasavailable. Individual ileal mucosa samples were collectedfrom the region between Meckel’s diverticulum and theileocecal junction and pooledwithin species as described pre-viously [26]. Each composite sample was mixed to representeach species and each GI region.
2.2. DNA Extraction and PCR. Community DNA wasextracted from each of the four composite samples usingthe repeated bead-beating plus column purification method[27]. The V3 region (about 200 bp in length) of 16S rRNAgene in the metagenomic DNA was amplified with barcodeduniversal primer sets as listed in Table 1. Each forward primerconsists of three parts: a 19 nt degenerated universal primerfor bacterial 16S rRNA gene (357F), a 10 nt barcode, andthe pyrosequencing adapter A. The reverse primer consistedof an 18 nt degenerated universal primer for bacterial 16SrRNA gene (519R) and a 19 nt pyrosequencing adapter B.Thedegenerate bases on primers were introduced to expand theirinclusiveness.
For each PCR reaction, 400 ng of metagenomic DNAtemplate was added to a 49 𝜇L master mix that contained1x PCR buffer, 1.75mM MgCl2, 670 ng/𝜇L bovine serumalbumin, 200 𝜇M dNTP, 500 nM of each primer, and 0.625UPlatinum Taq DNA polymerase (Invitrogen Corporation,Carlsbad, CA). The PCR thermal program consisted of aninitial denaturation at 95∘C for 10min; 20 or 25 cycles (20cycles for cecal content samples and 25 cycles for ileal mucosasamples) of a 30 s denaturation step at 95∘C, a 35 s annealingstep at 55∘C, and a 35 s elongation step at 72∘C; and a finalextension step at 72∘C for 7 min, before a 4∘C hold.
The quality of the PCR products was examined usingagarose (1.2%) gel electrophoresis, and the expected PCRproducts of approximately 200 bp were gel purified using aQiagen Gel Purification Kit (Qiagen, Valencia, CA, USA).The concentration of the purified products was quantifiedusing a NanoDrop ND-1000 spectrophotometer (ThermoScientific, Wilmington, DE) and confirmed using a Quant-itKit (Invitrogen Corporation, Carlsbad, CA, USA).
2.3. Pyrosequencing and Data Analysis. Given the expectedhigher diversity in the cecal content samples compared withthe ileal mucosa samples, the amplicons from the formerand the latter were mixed in a 9 : 1 ratio for each species.The amplicons from the chickens and the turkeys weresubsequently pooled in a 2 : 1 ratio. The pooled ampliconsamples were divided and sequenced in two independentpyrosequencing runs on one-half of a picotiter plate eachusing a 454 Life Sciences Genome Sequencer FLX system(Roche, Basel, Switzerland) before the Genome SequencerFLXTitanium became available.TheV3 hypervariable regionwas sequenced because the FLX system produces a readlength of less than 250 bp. The raw data were provided as sfffiles.
The quality of the 454 pyrosequencing data was evalu-ated using the raw sff data files following the standardized
International Journal of Microbiology 3
operating procedure (SOP) proposed by Schloss et al. [19].Briefly, the flow file was generated from the sff file of eachsample using the sffinfo program of the GS Analysis Soft-ware (Version 2.5, 454 Life Sciences Corporation, Branford,CT, USA). The pyrosequencing noise of each flow file wasremoved by the AmpliconNoise function implemented inMothur [18, 19, 28]. The “denoised” sequences were trimmedoff the primer 357F and 519R, which results in sequencesof the V3 hypervariable region of 16S rRNA genes (mini-mum length: 100 bp, average length: 145 bp). The trimmedsequences were aligned using the Mothur aligner [28, 29]with the Silva SSU Ref NR 108 dataset [30] as referencesequences and with a −4 score penalty for gap-pen and −3score penalty for mismatch. Sequences that could not bealigned with the Silva reference dataset were removed. Thecommon gaps in the sequence alignment were filtered out,and the sequences were preclustered to remove sequencesthat contain possible pyrosequencing errors [19, 31]. Possi-ble chimeric sequences were identified and removed usingUCHIME [32] implemented in the Mothur package [28].
A distancematrix of each dataset was computed using theARB database environment with the Jukes-Cantor correction[30] applied.TheMothur andUSEARCHwere used to clustersequences into OTUs at 0.03, 0.05, and 0.20 phylogeneticdistances, generate rarefaction curves, and determine thenonparametric ACE and Chao1 estimates of maximum rich-ness from each of the distance matrices. The maximumnumber of OTUs likely present in each of the samples wasalso estimated using the nonlinear models procedure (PROCNLIN) of SAS (V9.2, SAS Inst. Inc., Cary, NC), which fitsthe monomolecular function to the rarefaction output todetermine the asymptote that serves as the upper boundof the curves as previously described [33]. Each distancematrix was computed three times, and the median valueswere chosen in calculating these indices to avoid under- oroverestimation.
One representative sequence of each OTU defined at 0.03genetic distances was obtained using the “get.oturep” com-mand in the Mothur package V1.22. [28]. These OTU repre-sentative sequences were imported into ARB, and then a phy-logenetic tree was constructed for each sample by insertingeach sequence into the reference tree of the 286,858 Silva ref-erence sequences (SSU 111 Ref NR, http://www.arb-silva.de)as described previously [34]. The phylogenetic tree was thenused for weighted UniFrac analysis as described in librarycomparison below. The sequences used in this study aremaintained in an in-house ARB database dedicated to the GIbacteriome of chickens and turkey and is available from thecorresponding author. The representative sequences of eachsample were also archived in the MG-RAST server underthe project of Poultry MID DB (4508915.3 to 4508920.3).The OTUs were classified using the RDP classifier [35]and the composition of each bacteriome was visualized asa taxonomic tree constructed using MEGAN [36]. Briefly,the taxonomic identification of 16S rRNA sequences wasperformed using the RDP naıve Bayesian classifier on theRDP server (https://rdp.cme.msu.edu/) [35] with the defaultsetting. The taxonomy files were retrieved and imported intoMEGANusing aminimumcutoff of 5OTUs and a confidence
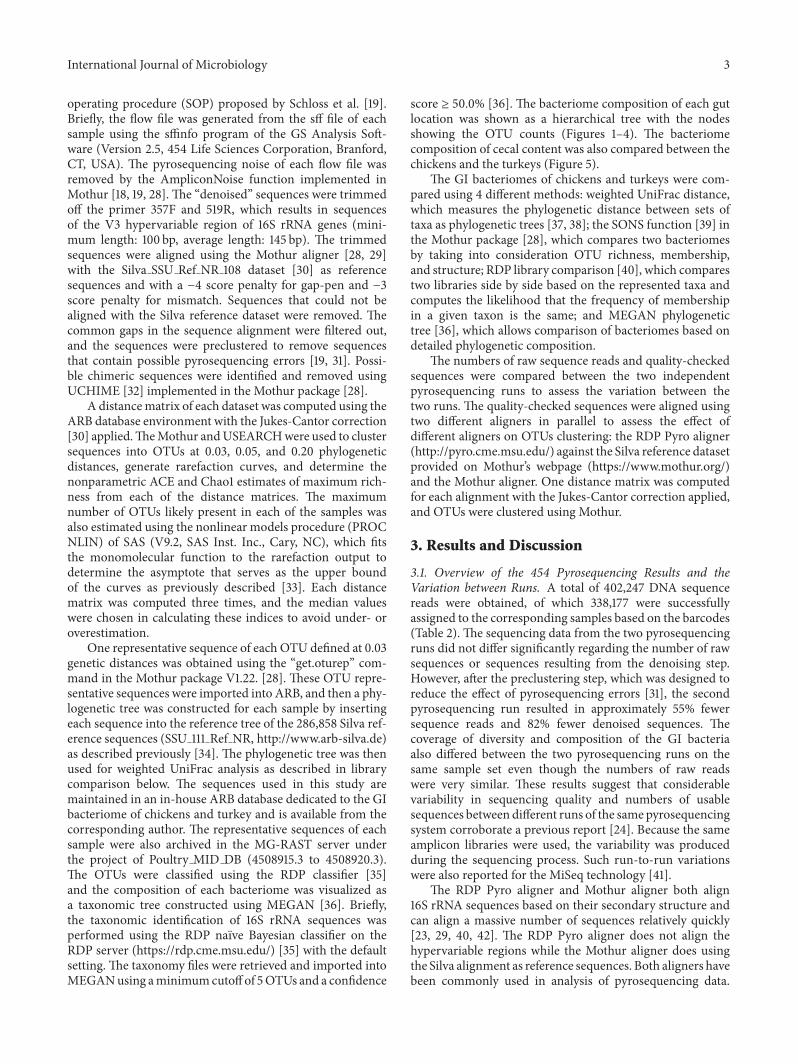
score ≥ 50.0% [36]. The bacteriome composition of each gutlocation was shown as a hierarchical tree with the nodesshowing the OTU counts (Figures 1–4). The bacteriomecomposition of cecal content was also compared between thechickens and the turkeys (Figure 5).
The GI bacteriomes of chickens and turkeys were com-pared using 4 different methods: weighted UniFrac distance,which measures the phylogenetic distance between sets oftaxa as phylogenetic trees [37, 38]; the SONS function [39] inthe Mothur package [28], which compares two bacteriomesby taking into consideration OTU richness, membership,and structure; RDP library comparison [40], which comparestwo libraries side by side based on the represented taxa andcomputes the likelihood that the frequency of membershipin a given taxon is the same; and MEGAN phylogenetictree [36], which allows comparison of bacteriomes based ondetailed phylogenetic composition.
The numbers of raw sequence reads and quality-checkedsequences were compared between the two independentpyrosequencing runs to assess the variation between thetwo runs. The quality-checked sequences were aligned usingtwo different aligners in parallel to assess the effect ofdifferent aligners on OTUs clustering: the RDP Pyro aligner(http://pyro.cme.msu.edu/) against the Silva reference datasetprovided on Mothur’s webpage (https://www.mothur.org/)and the Mothur aligner. One distance matrix was computedfor each alignment with the Jukes-Cantor correction applied,and OTUs were clustered using Mothur.
3. Results and Discussion
3.1. Overview of the 454 Pyrosequencing Results and theVariation between Runs. A total of 402,247 DNA sequencereads were obtained, of which 338,177 were successfullyassigned to the corresponding samples based on the barcodes(Table 2). The sequencing data from the two pyrosequencingruns did not differ significantly regarding the number of rawsequences or sequences resulting from the denoising step.However, after the preclustering step, which was designed toreduce the effect of pyrosequencing errors [31], the secondpyrosequencing run resulted in approximately 55% fewersequence reads and 82% fewer denoised sequences. Thecoverage of diversity and composition of the GI bacteriaalso differed between the two pyrosequencing runs on thesame sample set even though the numbers of raw readswere very similar. These results suggest that considerablevariability in sequencing quality and numbers of usablesequences between different runs of the samepyrosequencingsystem corroborate a previous report [24]. Because the sameamplicon libraries were used, the variability was producedduring the sequencing process. Such run-to-run variationswere also reported for the MiSeq technology [41].
The RDP Pyro aligner and Mothur aligner both align16S rRNA sequences based on their secondary structure andcan align a massive number of sequences relatively quickly[23, 29, 40, 42]. The RDP Pyro aligner does not align thehypervariable regions while the Mothur aligner does usingthe Silva alignment as reference sequences. Both aligners havebeen commonly used in analysis of pyrosequencing data.

4 International Journal of Microbiology
SynergistaceaeEnterobacteriaceae
DeltaproteobacteriaGemmigerProteobacteria
SelenomonadalesErysipelotrichaceae
HydrogenoanaerobacteriumFaecalibacterium
AnaerotruncusAnaerofilumAcetanaerobacterium
Ruminococcaceae
RoseburiaBlautia
Lachnospiraceae Eubacterium
Clostridiales
LactobacillusEnterococcaceaeCarnobacteriaceaeLactobacillalesStaphylococcaceaeBacillaceaeBacillales
Bacilli
Firmicutes
MucispirillumAlistipes
ParabacteroidesOdoribacterButyricimonasBarnesiella
Porphyromonadaceae
BacteroidesBacteroidales
CoriobacteriaceaeBifidobacteriaceaeActinobacteria
Bacteria
Root
Figure 1: Bacterial diversity of chicken cecal content bacteriome. Only the genera represented by ≥5 OTUs each were shown, and the sizeof each node reflects the total number of OTUs. The relative proportion of taxa from the two pyrosequencing runs was shown by differentcolors: red, from the first run; blue, from the second run.
Gammaproteobacteria
Ruminococcaceae
LachnospiraceaeClostridiales
Lactobacillus
EnterococcaceaeLactobacillales
Firmicutes
Bacteroidetes
Bacteria
Root
Figure 2: Bacterial diversity of chicken ileal mucosal bacteriome. Only the genera represented by ≥5 OTUs each were shown, and the sizeof each node reflects the total number of OTUs. The relative proportion of taxa from the two pyrosequencing runs was shown by differentcolors: red, from the first run; blue, from the second run.
Thus, the two aligners were evaluated using the same dataset.The Mothur aligner resulted in approximately twice as manyOTUs with the default alignment setting when penalties weregiven to gap open and mismatch. The RDP aligner yielded >3-fold more OTUs than the Mothur aligner when the penaltyoptions were applied. The RDP aligner has been reported toresult inmoreOTUs fromall but theV3 andV4hypervariableregions of 16S rRNAgeneswhen compared to the Silva aligner[19]. In this study, the V3 region was used, and more OTUs
also resulted from the RDP Pyro aligner. In addition, eventhough the SOP of Mothur includes several quality checkingprocedures, the default setting may not be optimal for everydataset. As demonstrated in this study, the introduction ofpenalties for gap open andmismatch can significantly reducethe likelihood of overestimating diversity. It is recommendedthat in future studies more than one setting be used ineach step to avoid inflation of diversity. Hence, the Mothuraligned sequences with penalties for gap open and mismatch

International Journal of Microbiology 5
Enterobacteriaceae
Bilophila
GemmigerProteobacteria
Selenomonadales
Turicibacter
Hydrogenoanaerobacterium
Faecalibacterium
AcetanaerobacteriumRuminococcaceae
Peptostreptococcaceae
Roseburia
MoryellaLachnospiraceae
Eubacteriaceae
Clostridiaceae
Clostridiales
Lactobacillus
StaphylococcaceaeBacilli
Firmicutes
Rikenella
AlistipesRikenellaceaePorphyromonadaceaeBacteroidales
Olsenella
MicrococcineaeActinobacteria
Bacteria
Root
Figure 3: Bacterial diversity of turkey cecal content bacteriome. Only the genera represented by ≥5 OTUs each were shown, and the sizeof each node reflects the total number of OTUs. The relative proportion of taxa from the two pyrosequencing runs was shown by differentcolors: red, from the first run; blue, from the second run.
appliedwere used in assessing the effect of different clusteringalgorithms on OTUs clustering in the present study.
Species richness of metagenomic datasets is typicallyexpressed as numbers of OTUs clustered at a specific phy-logenetic distance (commonly 0.03). In this study, Mothurand USEARCH, both of which are commonly used in OTUclustering [28, 43, 44], were compared using the same datasetof all four bacteriome samples. The USEARCH methodgenerated twice as many OTUs as Mothur (Table 2). Theseresults suggest that different clustering methods can producedifferent estimates of species richness, and thus comparisonsof results from various studies, especially those that useddifferent clustering and alignment methods, should be donewith caution. Additionally, different phylogenetic distancesmight be needed when different clustering methods are usedto produce comparable species richness. In this study, theMothur was used to cluster OTUs from all the four datasetsbecause it probably did not overestimate species richness.
3.2. Bacterial Diversity of Chicken Cecal Content Bacteriome.Thececum is the largestmajor reservoir of bacteria in poultry.The first and the second pyrosequencing runs produced 3,973and 2,829 OTUs, respectively, from the chicken cecal samples
(Table 2).The estimated asymptotes of OTUs reached 1.5-foldof the number of observed OTUs. Both pyrosequencing runsachieved a high level of coverage (Good’s coverage > 95%) ofthe bacterial diversity in the chicken cecal bacteriome. TheRDP classification of the OTUs from both pyrosequencingruns was combined and imported into MEGAN to generatea taxonomic tree of the major bacteria (Figure 1). In total,we identified nine bacterial phyla (Firmicutes, Proteobac-teria, Bacteroides, Synergistetes, Fusobacteria, Actinobacte-ria, Deferribacteres, Tenericutes, and Lentisphaerae) and 84known genera (data not shown). The Firmicutes was themost predominant phylum, accounting for 57.8% of the totalbacterial sequences of the cecal content sample. Within thisphylum, 30.9% of the OTUs could not be classified to anyknown taxa. The Bacteroidetes and Proteobacteria were farless predominant, accounting for 5.4% and 4.3% of the totalbacteria sequences, respectively. No significant differencewasobserved at phylum or class level between the two pyrose-quencing runs except for the class Gammaproteobacteria.However, a major difference was observed in unclassifiedEnterobacteriaceae. In the first pyrosequencing run, Bifi-dobacteriaceae, Bacillaceae, Staphylococcaceae, Carnobacte-riaceae, Enterococcaceae, Hydrogenoanaerobacterium, and

6 International Journal of Microbiology
Pseudomonas 1
Acinetobacter 1Pseudomonadales 2
Enterobacteriaceae 1Gammaproteobacteria 3
Sorangiineae 1
Betaproteobacteria 1
Sphingomonas 1
Gemmiger 1
Brevundimonas 1Alphaproteobacteria 3
Proteobacteria 8
Ruminococcaceae 1
Peptostreptococcaceae 2
Roseburia 1Clostridiales 9
Lactococcus 1
Lactobacillus 6
Granulicatella 1Lactobacillales 9
Firmicutes 19
Alistipes 2
Bacteria 32
Root 32
Figure 4: Bacterial diversity of turkey ileal mucosal bacteriome. Only the genera represented by ≥5 OTUs each were shown, and the sizeof each node reflects the total number of OTUs. The relative proportion of taxa from the two pyrosequencing runs was shown by differentcolors: red, from the first run; blue, from the second run.
Synergistaceae were found to be represented by ≥5 OTUseach, while Selenomonadales was the only taxon that wasrepresented by >5 OTUs. Consistent with a previous study[24], noticeable variation in diversity estimates can arisefrom different runs and quantitative interpretation of pyrose-quencing data should be donewith caution. Because the sameamplicon libraries were sequenced in the two pyrosequencingruns and the sequence data were analyzed using the samesequence pipeline and parameters, the variations betweenthe two pyrosequencing runs probably have arisen from thesequencing process.
A recent study established a global diversity frameworkof the poultry GI bacteriome by using a naıve analysis ofall the 16S rRNA gene sequences generated from poultry GI(primarily cecal) bacteria that have been recovered world-wide using the Sanger sequencing technology [34]. Whencompared to this global cecal bacterial diversity database,therewere 45 genera of bacteria in that database thatwere alsofound in the present study (Supplementary Table 1, in Supple-mentaryMaterial available online at http://dx.doi.org/10.1155/2016/4320412). However, 29 genera were missing from thecurrent pyrosequencing study (Supplementary Table 2).These include Salmonella, Megamonas, and Paraprevotella,each of which was represented by >10 sequences in thatdatabases. On the other hand, the current pyrosequencingstudy identified 39 bacterial genera that were not repre-sented in the global cecal bacterial diversity database, includ-ing Butyricimonas, Odoribacter, Hydrogenoanaerobacterium,
Moryella, Parasporobacterium, and Ruminococcus (Supple-mentary Table 3). There were also many minor generarepresented by less than five OTUs each. Overall, this studyexpanded the number of bacterial genera identified in thececum of chickens by 80%. This is likely attributed to theincreased sequencing depth we intentionally achieved. Mostof these new genera found in the cecum might be presentat low abundance. Future studies can further elucidate theirimportance to the host.
3.3. Bacterial Diversity of Chicken Ileal Mucosal Bacteriome.In this study, >5,000 sequences were obtained from each ofthe two pyrosequencing runs, resulting in 135 and 114 OTUsin the first and second runs, respectively (Table 2). Althoughthe Good’s coverage also reached >95%, the estimatedasymptotes of OTUs were 1.9-fold greater than the observednumbers of OTUs. These results suggest that the diversity inthe ileal mucosa has not been completely identified. It shouldbe noted that approximately half of the original sequencingreads from the ileal mucosa appeared to be 18S rRNA genesof the host.Thepresence of these host sequenceswas probablydue to the broad specificity of primers 357f and 519r, both ofwhich can anneal to 18S rRNA genes [45]. Bacterial domain-specific primers can reduce or eliminate amplification of host18S rRNA genes.
The OTUs from the chicken ileal mucosa were classifiedinto seven bacterial phyla: Actinobacteria, Bacteroidetes,

International Journal of Microbiology 7
Synergistaceae
EnterobacteriaceaeBilophila
GemmigerProteobacteria
Selenomonadales
Turicibacter
Hydrogenoanaerobacterium
FaecalibacteriumAnaerotruncus
Anaerofilum
Acetanaerobacterium
Ruminococcaceae
Peptostreptococcaceae
Roseburia
Moryella
BlautiaLachnospiraceae
Eubacterium
Clostridiaceae
Clostridiales
Lactobacillus
Enterococcaceae
CarnobacteriaceaeLactobacillales
StaphylococcaceaeBacillaceaeBacillales
Bacilli
Firmicutes
Mucispirillum
Rikenella
AlistipesRikenellaceaeParabacteroides
OdoribacterButyricimonas
BarnesiellaPorphyromonadaceae
Bacteroides
Bacteroidales
Olsenella
Bifidobacteriaceae
MicrococcineaeActinobacteridaeActinobacteria
BacteriaRoot
Figure 5: Comparison of the diversity of cecal content bacteriomes between broiler chickens and turkey. Only the genera represented by ≥5OTUs each were shown, and the size of each node reflects the total number of OTUs from the four microbiomes. The proportion of eachmicrobiome is distinguished by color: red, chicken; blue, turkey.
Cyanobacteria/Chloroplast, Firmicutes, Proteobacteria, Syn-ergistetes, and Saccharibacteria. Firmicutes and Proteobacte-ria were the major phyla, accounting for 72.6% and 11.1% ofthe total sequences of the chicken ileal mucosa, respectively(Figure 2). For the predominant taxa, significant differencesbetween the two pyrosequencing runs were not observedat taxonomic ranks from phylum to genus. However, someminor groups were only identified in one of the two pyrose-quencing runs. For example, Bacteroidetes, Enterococcaceae,Lachnospiraceae, and Gammaproteobacteria were only iden-tified in the first run, and each was represented by at least5 OTUs, whereas Prevotella, Salinicoccus, and another 10genera, each of which was represented by one or two OTUs,were only identified in the second run. Lactobacillus was
the largest genus in the chicken ileal mucosa, accountingfor 11% of the total sequences. In a previous study using16S rRNA gene clone libraries, Lactobacillus was found toaccount for 75% of the ileal mucosal bacterial sequencesamong 7-day-old chicks [26]. The differences in bird ageand methodologies used might explain the discrepancy inLactobacillus predominance witnessed in the ileal mucosa.In a study in Australia, approximately 99% of the bacterialsequences from jejunal mucosa were classified to Lactobacil-lus [46]. Choices ofmethodology and target regions of the 16SrRNA genemay influence the observed relative abundance oflactobacilli in the gut of chickens. A greater predominanceof Lactobacillus was expected for the jejunum than for theileum.

8 International Journal of Microbiology
Table 2: Summary of the 454 pyrosequencing data.
Sample # of raw seqsassigned
# of sequencesafter screening
# of preclusteredseqs afterscreening
Observed OTUs Maximum # of OTUs Good’scoverage∗∗Mothur USEARCH Rarefaction
asymptote∗ Chao1 ACE
CD-1 98021 91456 21080 3973 8899 6001 10657 19318 95.7%CD-2 98238 91227 12437 2829 5162 4278 7806 14361 96.9%CM-1 5457 2714 598 135 324 259 370 1121 95.0%CM-2 5273 2506 330 114 199 205 287 580 95.5%TD-1 56959 53527 10304 1891 4252 2779 5114 9286 96.5%TD-2 57442 49836 6685 1484 2706 2188 3971 6948 97.0%TM-1 8104 30 23 17 19 63 63 246 43.3%TM-2 8683 33 19 15 16 19 18 21 54.5%CD, chicken cecal digesta; CM, chicken ileal mucosa; TD, turkey cecal digesta; TM, turkey ileal mucosa.∗Estimated by Number of phylotypes = 𝛼(1 − 𝛽 × 𝑒[−𝜅×𝑛]).∗∗Estimated by Coverage of diversity = (𝑛 − 𝑁)/𝑛 × 100%.
3.4. Bacterial Diversity of Turkey Cecal Content Bacteriome.From the first and the second pyrosequencing runs, 1,891 and1,481 OTUs were obtained, respectively (Table 2). Similar tothe chicken cecal bacteriome, the estimated OTU asymptoteof the turkey cecal bacteriome was approximately 1.5-foldgreater than the number of OTUs observed, while the Good’scoverage reached >95%. The OTUs were classified into eightbacterial phyla (Firmicutes, Bacteroides, Actinobacteria, Pro-teobacteria, Verrucomicrobia, Synergistetes, Elusimicrobia,and Lentisphaerae) and 85 known genera (data not shown).The phyla represented by ≥ 5 OTUs each are shown onthe taxonomy tree (Figure 3). Firmicutes, Proteobacteria,and Actinobacteria were the most predominant phyla inthe turkey cecal bacteriome, accounting for 66.3%, 7.4%,and 3.2% of the total bacterial sequences identified. Basedon RDP Library comparison, a significant difference inthe proportions of the phyla Firmicutes and Proteobacte-ria was observed between the two pyrosequencing runs.In total, 17 genera or groups were recovered only in thefirst sequencing run, including Olsenella, Clostridiaceae,Roseburia, Hydrogenoanaerobacterium, Selenomonadales,Bilophila, Enterobacteriaceae, and other groups, each ofwhich was represented by ≤5 OTUs (Figure 3). On theother hand, 14 genera or groups were identified only inthe second sequencing run, including Porphyromonadaceaeand other minor genera. Only one OTU was classified asEscherichia/Shigella, a common genus of enteric bacteria, andthis might be due to its low abundance in the turkey cecalbacteriome.Quantitative PCR analysis for thisOTUmay helpconfirm its abundance in the turkey cecal bacteriome.
The bacterial profile of the turkey cecal bacteriomewas also compared to the global bacterial diversity frame-work of poultry [34]. Twenty-one genera, including Meg-amonas, Prevotella, Paraprevotella, Subdoligranulum, Hal-lella, Phascolarctobacterium, and minor genera represent-ing less than ten sequences documented in the globaldataset were not detected in the current pyrosequencingstudy. On the other hand, the current study uncovered 50bacterial genera that were not represented in the globaldataset. The major new genera include Gemmiger, Olsenella,
Moryella, Bilophila, Hydrogenoanaerobacterium, Akkerman-sia, Collinsella, Staphylococcus, Ruminococcus, Slackia, Spo-racetigenium, and some genera each represented by less than5 OTUs. Future studies are needed to further understandthe importance and contribution of these new genera to theoverall intestinal health and nutrient utilization in turkeys. Itshould be noted, however, that someof the identified bacterialgenera contain food-borne pathogens, such as Bilophila,which is implicated in several types of infection such asperforated and gangrenous appendicitis [47]. Thus, deepsequencing analysis not only facilitates a better understand-ing of the turkey cecal bacteriome but also provides anopportunity to identify potential risk factors that might havebeen overlooked. Future studies are needed to understand thefactors that govern the populations of these pathogens.
3.5. Bacterial Diversity of Turkey Ileal Mucosal Bacteriome.This study is the first reported investigation of the turkeyileal mucosal bacteriome using pyrosequencing analysis.Most of the sequencing reads turned out to be host 18SrRNA gene sequences rather than bacterial 16S rRNA genes(Table 2). This is likely attributed to the low proportion ofbacterial DNA in the DNA extract and also possibly thesmall number of PCR cycles (25 cycles). In total, only 30bacterial 16S rRNA gene sequences were obtained from eachof the two pyrosequencing runs, resulting in <20 OTUs(Table 2). The recovered OTUs was classified to the phylaFirmicutes, Proteobacteria, and Bacteroidetes, representing59.3%, 25.0%, and 6.3% of the total bacterial sequences,respectively (Figure 4). Twelve genera of bacteria were foundin the ileal mucosa of the turkeys. No significant differencesbetween the two pyrosequencing runs were observed due tothe small datasets, but seven genera were identified in the firstpyrosequencing run, and only three genera were identified inthe second sequencing run.
Except for Lactobacillus, all the identified genera wereeach represented by only oneOTU. Lactobacillus andAlistipeswere found in both pyrosequencing runs. The coverage ofbacterial diversity in the turkey ileal mucosal bacteriome wasfar from complete, and thus the bacterial diversity of the

International Journal of Microbiology 9
Table 3: Comparisons of intestinal bacterial diversity between chickens and turkeys.
Source Distance level # of OTUs shared 𝜃ycb (lci, hci) UniFrac distance
CD vs CM0.03 74 0.030 (0.023, 0.038)
0.6270.05 76 0.052 (0.034, 0.068)0.20 31 0.280 (0.211, 0.350)
CD vs TD0.03 743 0.186 (0.170, 0.202)
0.3640.05 758 0.332 (0.303, 0.358)0.20 69 0.600 (0.564, 0.630)
b: 𝜃yc = ∑𝑆𝑇𝑖=1 𝑎𝑖𝑏𝑖/(∑
𝑆𝑇𝑖=1(𝑎𝑖 − 𝑏𝑖)
2 + ∑𝑆𝑇𝑖=1 𝑎𝑖𝑏𝑖) [17]
where,𝑆𝑇 is the total number of OTUs in communities A and B;𝑎𝑖 is the relative abundance of OTU 𝑖 in community A;𝑏𝑖 is the relative abundance of OTU 𝑖 in community B.
turkey ileal mucosal bacteriome is not discussed any furtherin this paper. Again, future studies need to use primers thatmaximize amplification of bacterial 16S rRNA genes whilereducing amplification of host DNA using bacteria domain-specific primers.
3.6. Comparisons between Chicken and Turkey Bacteriomes.The OTUs from the two pyrosequencing runs were com-bined, and the bacteriome profiles of the two species werethen compared. Overall, the GI bacteriome of chickensappeared to be considerably different from that of turkeyswhen compared using UniFrac significance analysis (𝑝 <0.01, data not shown). When compared on OTU richness,membership, and structure using the SONS analysis, the twoGI bacteriomes were also distinct from each other, sharingonly 18.6% Yue and Clayton index (𝜃yc similarity) [17] at0.03 distance level and 60.0% at 0.20 distance level (Table 3).As expected, greater community similarities were noted athigher phylogenetic distances.
TheweightedUniFrac distances computed from theOTUrepresentatives were used to access the structure of the poul-try GI bacteriomes (Table 3). The weighted UniFrac distancewas chosen over OTU-based approaches because the latterlacks the resolution to detect overlapping species betweenbacteriomes when datasets with low sequence coverage wereused, while the former is a reliable index when comparingsequencing datasets with varied sample sizes [38]. Consistentwith the analysis using SONS, the analysis using weightedUniFrac distances indicated that bacteriomes from the sameGI region of the two species (chicken cecal content versusturkey cecal content) shared a greater similarity in phylo-genetic structure than the bacteriomes from the differentGI rejoins (ileal mucosa versus cecal content) of the samespecies. This is not surprising given the large differences inniche between cecal content and ileal mucosa.
Much smaller species richness was found in the ilealmucosal bacteriome of both chickens and turkeys (Table 2).About 95% of the bacteriome diversity was uncovered, butonly a relatively small portion of the diversity in the ilealmucosal bacteriome of the turkeys was represented by the16S rRNA gene sequences. Because the turkey ileal mucosalbacteriome is not adequately characterized, comparison ofthe ileal mucosal bacteriome was not included in this paper.However, the comparison of the ileal mucosal bacterial
diversity between these two bird species and a comparativephylogenetic tree are available upon request.
The distribution and relative abundance of the majorbacterial genera in the cecum differed between chickensand turkeys (Figure 5). Although the cecal bacteriomes ofboth species shared the major phyla (Actinobacteria, Bac-teroidetes, Firmicutes, and Proteobacteria), significant dif-ferences were revealed in Firmicutes, Actinobacteria, andBacteroidetes by RDP library comparison (data not shown).Fusobacteria and Deferribacteres were minor phyla that wereonly identified in the chicken cecal bacteriome, whereasVerrucomicrobia and Elusimicrobia were minor phyla onlyidentified in the turkey cecal bacteriome. At the genuslevel, Barnesiella and Odoribacter were significantly moreabundant in the chicken cecal bacteriome while the oppositewas observed for Olsenella and Rikenella in the turkey cecalbacteriome. In total, 22 major genera (each represented by>5 OTUs) were only identified in chicken cecal bacteriome,including Mucispirillum and Phascolarctobacterium as themost predominant genera (in descending order), whereas 23major genera were only identified in the turkey cecal bacteri-ome, including Olsenella, Akkermansia, and Sporacetigeniumas the most predominant genera. It is also of interest to notethe different occurrence of Actinobacteria genera betweenthe two bird species: Micrococcineae and Coriobacteriaceaewere the predominant taxa in the turkey cecal bacteriome,while Bifidobacteriaceae of Actinobacteria was predominantin the chicken cecal bacteriome. Such a disparity needs to beconfirmed, and their implications in host nutrition andhealthwarrant further investigation.
As discussed earlier [1, 34, 48], differences in host(genetics, breeds, anatomical features of the gut, physiology,etc.), litter management, and diets might be attributable tothe distinct GI bacteriomes in the chicken and turkey. Forexample, turkeys have a larger intestinal diameter, moreviscous digesta, and a slower digesta passage rate (i.e., longerretention time) than chickens [49]. These factors may leadto lower partial O2 pressure and redox potential in the gutof turkeys compared to that of chickens. Diet, however, isone the major factors affecting GI bacteriome in poultry [1].The chickens in US commercial farms are typically fed corn-soybean-based diets that meet the NRC requirement, so werethe chickens used in the present study.Thus, we compared theresults from the present study with those of published studies

10 International Journal of Microbiology
where chickens were also fed corn-soybean-based diet. Inthe study of Lumpkin et al. [50], the bacteriome of threegenetic lines of chickens were examined using DGGE and T-RFLP, and Lactobacillaceae,Clostridiaceae,Enterococcaceae,andBacteroidaceaewere themajor bacterial families detectedin the cecum of chickens at both 4 and 35 days of age.Staphylococcaceae was also detected in multipurpose broil-ers. These five families were well represented in the chickencecal bacteriome of the present study (Figure 1). Owingto the limited resolution, only five major bacterial familieswere detected in the study by Lumpkins et al. [50]. Ourpyrosequencing analysis enabled detailed characterizationof the bacteriome at OTU level. In one study on broilerchicken was challenged with Clostridium perfringens; thebacteriome was profiled using low depth coverage (6-7Ksequences per sample) pyrosequencing of the V3–V5 region[51]. In the unchallenged control group fed corn-soybean-based diet, only 2-3 major (>2%) bacterial families or orderswere found. At day 13, the control group was predominatedby Clostridiaceae (2.41%), Lactobacillaceae (80.00%), andEnterobacteriaceae (11.99%), or by Clostridiales (85.17%) andLactobacillaceae (7.13%). We identify all the above majorbacterial families, suggesting that the bacteriome revealed inthe present study is representative of the chickens reared incommercial settings.
The diets used in studies on turkey GI bacteriome werenot as well documented as those used in studies on thechicken GI bacteriome. We did a literature search of thePubMed database with keyword “turkey,” “corn-soybean-based,” and “bacteriome” (or “microbiome” and “micro-biota”) but found no publication. However, a few studiesexamined the turkey GI microbiota [52, 53]. Based on Illu-mina sequencing of the V3 region of 16S rRNA gene [52], theturkey cecal microbiomewas dominated by Clostridia (∼90%of total bacterial sequences), while as poults grow, Bacilli,Actinobacteria, and Bacteroidia grew in predominance (5–20%). The turkeys used in the present study were fed a corn-soybean-based diet and reared under commercial turkeymanagement conditions. The above taxa, along with othertaxa, were also detected in the present study, suggestingthat the turkey GI bacteriome revealed in the present studyapproximates the actual GI bacteriome of turkeys rearedin commercial settings. Therefore, this metagenomic studyadded new information to the poultry intestinal bacteriomeand may facilitate future studies. It remains to be determinedto what extent the distinct GI bacteriome of these two birdspecies contributes differently to host health and nutrientutilization.
4. Conclusion
A large number of genera and OTUs were found in thececum and ileal mucosa of broiler chickens and turkeys,expanding our knowledge on the GI bacteriome of these twobird species, especiallywhen they are reared under the dietaryandmanagerial conditions common inNorthAmerica. Someof the bacterial groups unique to each bird species might beimportant to host health and performance. A comprehensiveknowledge of the GI bacteriome of chickens and turkeys and
the differences between these bird species can be useful inmodulatingGI bacteriome to improve host health and growthperformance.
Competing Interests
The authors declare no competing interests.
Acknowledgments
This material is based upon work that is partially supportedby theNational Institute of Food andAgriculture, USDepart-ment of Agriculture, under Award no. 2008-35204-18845 andby a Midwest Poultry Consortium grant.
References
[1] D. Pan and Z. Yu, “Intestinal microbiome of poultry and itsinteraction with host and diet,” Gut Microbes, vol. 5, no. 1, pp.108–119, 2014.
[2] M. Yegani and D. R. Korver, “Factors affecting intestinal healthin poultry,” Poultry Science, vol. 87, no. 10, pp. 2052–2063, 2008.
[3] S.H. Jeurissen, F. Lewis, J. D. van derKlis, Z.Mroz, J.M. J. Rebel,and A. A. H. M. ter Huurne, “Parameters and techniques todetermine intestinal health of poultry as constituted by immu-nity, integrity, and functionality,” Current Issues in IntestinalMicrobiology, vol. 3, no. 1, pp. 1–14, 2002.
[4] H. U. Rehman, W. Vahjen, W. A. Awad, and J. Zentek,“Indigenous bacteria and bacterial metabolic products in thegastrointestinal tract of broiler chickens,” Archives of AnimalNutrition, vol. 61, no. 5, pp. 319–335, 2007.
[5] R. D. Wagner, “Efficacy and food safety considerations ofpoultry competitive exclusion products,” Molecular Nutritionand Food Research, vol. 50, no. 11, pp. 1061–1071, 2006.
[6] J. F. Petrosino, S. Highlander, R. A. Luna, R. A. Gibbs, andJ. Versalovic, “Metagenomic pyrosequencing and microbialidentification,” Clinical Chemistry, vol. 55, no. 5, pp. 856–866,2009.
[7] L. Krause, N. N. Diaz, A. Goesmann et al., “Phylogenetic classi-fication of short environmental DNA fragments,” Nucleic AcidsResearch, vol. 36, no. 7, pp. 2230–2239, 2008.
[8] R.A. Edwards, B. Rodriguez-Brito, L.Wegley et al., “Using pyro-sequencing to shed light on deepminemicrobial ecology,” BMCGenomics, vol. 7, article 57, 2006.
[9] P. J. Turnbaugh, R. E. Ley, M. A. Mahowald, V. Magrini,E. R. Mardis, and J. I. Gordon, “An obesity-associated gutmicrobiomewith increased capacity for energy harvest,”Nature,vol. 444, no. 7122, pp. 1027–1031, 2006.
[10] D. L. Kirchman, M. T. Cottrell, and C. Lovejoy, “The structureof bacterial communities in the western Arctic Ocean asrevealed by pyrosequencing of 16S rRNA genes,” EnvironmentalMicrobiology, vol. 12, no. 5, pp. 1132–1143, 2010.
[11] H. Zhang, J. K. DiBaise, A. Zuccolo et al., “Human gutmicrobiota in obesity and after gastric bypass,” Proceedings ofthe National Academy of Sciences of the United States of America,vol. 106, no. 7, pp. 2365–2370, 2009.
[12] N. Larsen, F. K. Vogensen, F. W. J. Van Den Berg et al., “Gutmicrobiota in human adults with type 2 diabetes differs fromnon-diabetic adults,” PLOS ONE, vol. 5, no. 2, Article ID e9085,2010.

International Journal of Microbiology 11
[13] D. Stanley, M. S. Geier, R. J. Hughes, S. E. Denman, and R. J.Moore, “Highly variablemicrobiota development in the chickengastrointestinal tract,” PLoS ONE, vol. 8, no. 12, Article IDe84290, 2013.
[14] D. Stanley, M. S. Geier, H. Chen, R. J. Hughes, and R. J. Moore,“Comparison of fecal and cecal microbiotas reveals qualitativesimilarities but quantitative differences,” BMC Microbiology,vol. 15, no. 1, article no. 51, 2015.
[15] A. Qu, J. M. Brulc, M. K. Wilson et al., “Comparative metage-nomics reveals host specificmetavirulomes and horizontal genetransfer elements in the chicken cecum microbiome,” PLoSONE, vol. 3, no. 8, Article ID e2945, 2008.
[16] T. R. Callaway, S. E. Dowd, R. D. Wolcott et al., “Evaluationof the bacterial diversity in cecal contents of laying hensfed various molting diets by using bacterial tag-encoded FLXamplicon pyrosequencing,” Poultry Science, vol. 88, no. 2, pp.298–302, 2009.
[17] J. C. Yue and M. K. Clayton, “A similarity measure based onspecies proportions,” Communications in Statistics. Theory andMethods, vol. 34, no. 11, pp. 2123–2131, 2005.
[18] C. Quince, A. Lanzen, R. J. Davenport, and P. J. Turnbaugh,“Removing Noise From Pyrosequenced Amplicons,” BMCBioinformatics, vol. 12, article no. 38, 2011.
[19] P.D. Schloss,D.Gevers, and S. L.Westcott, “Reducing the effectsof PCR amplification and sequencing artifacts on 16s rRNA-based studies,” PLoS ONE, vol. 6, no. 12, Article ID e27310, 2011.
[20] S. M. Huse, J. A. Huber, H. G. Morrison, M. L. Sogin, and D.M. Welch, “Accuracy and quality of massively parallel DNApyrosequencing,” Genome Biology, vol. 8, no. 7, article R143,2007.
[21] V. Kunin, A. Engelbrektson, H. Ochman, and P. Hugenholtz,“Wrinkles in the rare biosphere: pyrosequencing errors canlead to artificial inflation of diversity estimates,” EnvironmentalMicrobiology, vol. 12, no. 1, pp. 118–123, 2010.
[22] B. J. Haas, D. Gevers, A. M. Earl et al., “Chimeric 16SrRNA sequence formation and detection in Sanger and 454-pyrosequenced PCR amplicons,” Genome Research, vol. 21, no.3, pp. 494–504, 2011.
[23] P. D. Schloss, “The effects of alignment quality, distance calcu-lation method, sequence filtering, and region on the analysis of16S rRNAgene-based studies,”PLoSComputational Biology, vol.6, no. 7, Article ID e1000844, p. 19, 2010.
[24] M. Kim and Z. Yu, “Variations in 16S rRNA-based microbiomeprofiling between pyrosequencing runs and between pyrose-quencing facilities,” Journal of Microbiology, vol. 52, no. 5, pp.355–365, 2014.
[25] NRC, Nutrient Requirements of Poultry, National AcademyPress, Washington, DC, USA, 8th edition, 1994.
[26] M.D.Cressman, Z. Yu,M.C.Nelson, S. J.Moeller,M. S. Lilburn,and H. N. Zerby, “Interrelations between the microbiotas inthe litter and in the intestines of commercial broiler chickens,”Applied and Environmental Microbiology, vol. 76, no. 19, pp.6572–6582, 2010.
[27] Z. Yu and M. Morrison, “Improved extraction of PCR-qualitycommunity DNA from digesta and fecal samples,” BioTech-niques, vol. 36, no. 5, pp. 808–812, 2004.
[28] P. D. Schloss, S. L. Westcott, T. Ryabin et al., “Introduc-ing mothur: open-source, platform-independent, community-supported software for describing and comparing microbialcommunities,”Applied and EnvironmentalMicrobiology, vol. 75,no. 23, pp. 7537–7541, 2009.
[29] P. D. Schloss, “A high-throughput DNA sequence aligner formicrobial ecology studies,” PLoS ONE, vol. 4, no. 12, article no.e8230, 2009.
[30] W. Ludwig, O. Strunk, R. Westram et al., “ARB: a softwareenvironment for sequence data,”Nucleic Acids Research, vol. 32,no. 4, pp. 1363–1371, 2004.
[31] S. M. Huse, D. M. Welch, H. G. Morrison, and M. L. Sogin,“Ironing out the wrinkles in the rare biosphere throughimprovedOTU clustering,” EnvironmentalMicrobiology, vol. 12,no. 7, pp. 1889–1898, 2010.
[32] R. C. Edgar, B. J. Haas, J. C. Clemente, C. Quince, and R.Knight, “UCHIME improves sensitivity and speed of chimeradetection,” Bioinformatics, vol. 27, no. 16, pp. 2194–2200, 2011.
[33] R. Larue, Z. Yu, V. A. Parisi, A. R. Egan, and M. Morrison,“Novel microbial diversity adherent to plant biomass in theherbivore gastrointestinal tract, as revealed by ribosomal inter-genic spacer analysis and rrs gene sequencing,” EnvironmentalMicrobiology, vol. 7, no. 4, pp. 530–543, 2005.
[34] S. Wei, M. Morrison, and Z. Yu, “Bacterial census of poultryintestinal microbiome,” Poultry Science, vol. 92, no. 3, pp. 671–683, 2013.
[35] Q. Wang, G. M. Garrity, J. M. Tiedje, and J. R. Cole, “NaıveBayesian classifier for rapid assignment of rRNA sequencesinto the new bacterial taxonomy,” Applied and EnvironmentalMicrobiology, vol. 73, no. 16, pp. 5261–5267, 2007.
[36] D. H. Huson, S. Mitra, H.-J. Ruscheweyh, N. Weber, and S.C. Schuster, “Integrative analysis of environmental sequencesusingMEGAN4,”GenomeResearch, vol. 21, no. 9, pp. 1552–1560,2011.
[37] C. Lozupone and R. Knight, “UniFrac: a new phylogeneticmethod for comparing microbial communities,” Applied andEnvironmentalMicrobiology, vol. 71, no. 12, pp. 8228–8235, 2005.
[38] L. N. Lemos, R. R. Fulthorpe, and L. F. W. Roesch, “Lowsequencing efforts bias analyses of shared taxa in microbialcommunities,” Folia Microbiologica, vol. 57, no. 5, pp. 409–413,2012.
[39] P. D. Schloss and J. Handelsman, “Introducing SONS, a toolfor operational taxonomic unit-based comparisons ofmicrobialcommunitymemberships and structures,”Applied and Environ-mental Microbiology, vol. 72, no. 10, pp. 6773–6779, 2006.
[40] J. R. Cole,Q.Wang, E. Cardenas et al., “TheRibosomalDatabaseProject: improved alignments and new tools for rRNA analysis,”Nucleic Acids Research, vol. 37, supplement 1, pp. D141–D145,2009.
[41] M. Schirmer, U. Z. Ijaz, R. D’Amore, N. Hall, W. T. Sloan, and C.Quince, “Insight into biases and sequencing errors for ampliconsequencing with the Illumina MiSeq platform,” Nucleic AcidsResearch, vol. 43, no. 6, article no. e37, 2015.
[42] E. P. Nawrocki, D. L. Kolbe, and S. R. Eddy, “Infernal 1.0:inference of RNA alignments,”Bioinformatics, vol. 25, no. 10, pp.1335–1337, 2009.
[43] R. C. Edgar, “Search and clustering orders of magnitude fasterthan BLAST,” Bioinformatics, vol. 26, no. 19, pp. 2460–2461,2010.
[44] J. G. Caporaso, J. Kuczynski, J. Stombaugh et al., “QIIMEallows analysis of high-throughput community sequencingdata,” Nature Methods, vol. 7, no. 5, pp. 335–336, 2010.
[45] W. G.Weisburg, S. M. Barns, D. A. Pelletier, and D. J. Lane, “16Sribosomal DNA amplification for phylogenetic study,” Journalof Bacteriology, vol. 173, no. 2, pp. 697–703, 1991.

12 International Journal of Microbiology
[46] D. Stanley, S. E. Denman, R. J. Hughes et al., “Intestinal micro-biota associated with differential feed conversion efficiency inchickens,” Applied Microbiology and Biotechnology, vol. 96, no.5, pp. 1361–1369, 2012.
[47] E. J. Baron, “Bilophila wadsworthia: a unique gram-negativeanaerobic rod,” Anaerobe, vol. 3, no. 2-3, pp. 83–86, 1997.
[48] L.Wang,M. Lilburn, and Z. Yu, “Intestinalmicrobiota of broilerchickens as affected by litter management regimens,” Frontiersin Microbiology, vol. 7, article 593, 2016.
[49] S. Palander, M. Nasi, and P. Palander, “Digestibility and energyvalue of cereal-based diets in relation to digesta viscosityand retention time in turkeys and chickens at different agesestimated with different markers,”Archives of Animal Nutrition,vol. 64, no. 3, pp. 238–253, 2010.
[50] B. S. Lumpkins, A. B. Batal, and M. D. Lee, “Evaluation of thebacterial community and intestinal development of differentgenetic lines of chickens,”Poultry Science, vol. 89, no. 8, pp. 1614–1621, 2010.
[51] Y. O. Fasina, M. M. Newman, J. M. Stough, and M. R.Liles, “Effect of Clostridium perfringens infection and antibioticadministration on microbiota in the small intestine of broilerchickens,” Poultry Science, vol. 95, no. 2, pp. 247–260, 2016.
[52] J. L. Danzeisen, J. B. Clayton, H. Huang et al., “Temporalrelationships exist between cecum, ileum, and litter bacterialmicrobiomes in a commercial turkey flock, and subtherapeuticpenicillin treatment impacts ileum bacterial community estab-lishment,” Frontiers in Veterinary Science, vol. 2, 2015.
[53] J. L. Danzeisen, A. J. Calvert, S. L. Noll et al., “Succession of theturkey gastrointestinal bacterial microbiome related to weightgain,” PeerJ, vol. 2013, no. 1, article no. e237, 2013.

Submit your manuscripts athttp://www.hindawi.com
Hindawi Publishing Corporationhttp://www.hindawi.com Volume 2014
Anatomy Research International
PeptidesInternational Journal of
Hindawi Publishing Corporationhttp://www.hindawi.com Volume 2014
Hindawi Publishing Corporation http://www.hindawi.com
International Journal of
Volume 2014
Zoology
Hindawi Publishing Corporationhttp://www.hindawi.com Volume 2014
Molecular Biology International
GenomicsInternational Journal of
Hindawi Publishing Corporationhttp://www.hindawi.com Volume 2014
The Scientific World JournalHindawi Publishing Corporation http://www.hindawi.com Volume 2014
Hindawi Publishing Corporationhttp://www.hindawi.com Volume 2014
BioinformaticsAdvances in
Marine BiologyJournal of
Hindawi Publishing Corporationhttp://www.hindawi.com Volume 2014
Hindawi Publishing Corporationhttp://www.hindawi.com Volume 2014
Signal TransductionJournal of
Hindawi Publishing Corporationhttp://www.hindawi.com Volume 2014
BioMed Research International
Evolutionary BiologyInternational Journal of
Hindawi Publishing Corporationhttp://www.hindawi.com Volume 2014
Hindawi Publishing Corporationhttp://www.hindawi.com Volume 2014
Biochemistry Research International
ArchaeaHindawi Publishing Corporationhttp://www.hindawi.com Volume 2014
Hindawi Publishing Corporationhttp://www.hindawi.com Volume 2014
Genetics Research International
Hindawi Publishing Corporationhttp://www.hindawi.com Volume 2014
Advances in
Virolog y
Hindawi Publishing Corporationhttp://www.hindawi.com
Nucleic AcidsJournal of
Volume 2014
Stem CellsInternational
Hindawi Publishing Corporationhttp://www.hindawi.com Volume 2014
Hindawi Publishing Corporationhttp://www.hindawi.com Volume 2014
Enzyme Research
Hindawi Publishing Corporationhttp://www.hindawi.com Volume 2014
International Journal of
Microbiology