Research Article Prevalence of Hyperuricemia and Gout...
13
Research Article Prevalence of Hyperuricemia and Gout in Mainland China from 2000 to 2014: A Systematic Review and Meta-Analysis Rui Liu, Cheng Han, Di Wu, Xinghai Xia, Jianqiu Gu, Haixia Guan, Zhongyan Shan, and Weiping Teng Department of Endocrinology and Metabolism, e Endocrine Institute and e Liaoning Provincial Key Laboratory of Endocrine Diseases, e First Affiliated Hospital of China Medical University, Shenyang, Liaoning 110001, China Correspondence should be addressed to Haixia Guan; [email protected] and Weiping Teng; [email protected] Received 20 August 2015; Revised 20 October 2015; Accepted 25 October 2015 Academic Editor: Lorenzo Cavagna Copyright © 2015 Rui Liu et al. is is an open access article distributed under the Creative Commons Attribution License, which permits unrestricted use, distribution, and reproduction in any medium, provided the original work is properly cited. We systematically identified the prevalence of hyperuricemia and gout in mainland China and provided informative data that can be used to create appropriate local public health policies. Relevant articles from 2000 to 2014 were identified by searching 5 electronic databases: PubMed, Google Scholar, Chinese Wanfang, CNKI, and Chongqing VIP. All of the calculations were performed using the Stata 11.0 and SPSS 20.0 soſtware. e eligible articles ( = 36; 3 in English and 33 in Chinese) included 44 studies (38 regarding hyperuricemia and 6 regarding gout). e pooled prevalence of hyperuricemia and gout was 13.3% (95% CI: 11.9%, 14.6%) and 1.1% (95% CI: 0.7%, 1.5%), respectively. Although publication bias was observed, the results did not change aſter a trim and fill test, indicating that that impact of this bias was likely insignificant. e prevalence of hyperuricemia and gout was high in mainland China. e subgroup analysis suggested that the geographical region, whether the residents dwell in urban or rural and coastal or inland areas, the economic level, and sex may be associated with prevalence. 1. Introduction Serum uric acid is the final enzymatic product of purine me- tabolism [1, 2]. Abnormalities in serum uric acid metabolism may cause hyperuricemia and gout. Hyperuricemia is the result of interactions among multiple factors, including sex, age, genetics, lifestyle, and environment [3]. Several studies have suggested that hyperuricemia is associated with many diseases, including diabetes mellitus [4], hypertension [5, 6], stroke [2, 7], dyslipidemia [8], chronic kidney disease [9], cardiovascular events, and heart failure [10–12]. Hype- ruricemia is considered to be a precursor of gout as the deposition of urate crystals in the joints results in an acute inflammatory response. Deposition in the soſt tissue can lead to tophi [13–15]. Gout is also a serious health issue and is an independent risk factor for heart failure and metabolic syndrome [16, 17]. In recent years, an increasing trend in the prevalence of hyperuricemia and gout has been observed in epidemiological studies [13, 18–21], and both diseases have become public health problems that need to be solved quickly. Due to rapid economic development, the lifestyle of the Chinese has changed greatly, a huge transition from a dietary pattern traditionally based on carbohydrates and vegetables to a pattern that relies on meat, dairy products, and other purine-rich foods that are closely related to hyperuricemia and gout [22, 23]. As a large developing country, China has marked regional differences and varied populations. To date, most investiga- tions have been limited to certain areas or have focused on specific occupations. erefore, a comprehensive study on the epidemiology of hyperuricemia and gout in the entire mainland China is needed. As most of the published data are in Chinese, we present our study in the widely read English medium. Obtaining an accurate prevalence of hyperuricemia and gout is important to help us formulate appropriate local public health policies. In addition, such a study will benefit the people through health education by increasing awareness of hyperuricemia and gout and also the importance of improving lifestyle and maintaining a healthy diet. Hindawi Publishing Corporation BioMed Research International Volume 2015, Article ID 762820, 12 pages http://dx.doi.org/10.1155/2015/762820
Transcript of Research Article Prevalence of Hyperuricemia and Gout...

Research ArticlePrevalence of Hyperuricemia and Gout in Mainland China from2000 to 2014: A Systematic Review and Meta-Analysis
Rui Liu, Cheng Han, Di Wu, Xinghai Xia, Jianqiu Gu, Haixia Guan,Zhongyan Shan, and Weiping Teng
Department of Endocrinology and Metabolism, The Endocrine Institute and The Liaoning Provincial Key Laboratory ofEndocrine Diseases, The First Affiliated Hospital of China Medical University, Shenyang, Liaoning 110001, China
Correspondence should be addressed to Haixia Guan; [email protected] and Weiping Teng; [email protected]
Received 20 August 2015; Revised 20 October 2015; Accepted 25 October 2015
Academic Editor: Lorenzo Cavagna
Copyright © 2015 Rui Liu et al. This is an open access article distributed under the Creative Commons Attribution License, whichpermits unrestricted use, distribution, and reproduction in any medium, provided the original work is properly cited.
We systematically identified the prevalence of hyperuricemia and gout inmainlandChina and provided informative data that can beused to create appropriate local public health policies. Relevant articles from 2000 to 2014 were identified by searching 5 electronicdatabases: PubMed, Google Scholar, Chinese Wanfang, CNKI, and Chongqing VIP. All of the calculations were performed usingthe Stata 11.0 and SPSS 20.0 software.The eligible articles (𝑛 = 36; 3 in English and 33 in Chinese) included 44 studies (38 regardinghyperuricemia and 6 regarding gout). The pooled prevalence of hyperuricemia and gout was 13.3% (95% CI: 11.9%, 14.6%) and1.1% (95% CI: 0.7%, 1.5%), respectively. Although publication bias was observed, the results did not change after a trim and fill test,indicating that that impact of this bias was likely insignificant. The prevalence of hyperuricemia and gout was high in mainlandChina. The subgroup analysis suggested that the geographical region, whether the residents dwell in urban or rural and coastal orinland areas, the economic level, and sex may be associated with prevalence.
1. Introduction
Serum uric acid is the final enzymatic product of purine me-tabolism [1, 2]. Abnormalities in serum uric acid metabolismmay cause hyperuricemia and gout. Hyperuricemia is theresult of interactions among multiple factors, including sex,age, genetics, lifestyle, and environment [3]. Several studieshave suggested that hyperuricemia is associated with manydiseases, including diabetes mellitus [4], hypertension [5,6], stroke [2, 7], dyslipidemia [8], chronic kidney disease[9], cardiovascular events, and heart failure [10–12]. Hype-ruricemia is considered to be a precursor of gout as thedeposition of urate crystals in the joints results in an acuteinflammatory response. Deposition in the soft tissue can leadto tophi [13–15]. Gout is also a serious health issue and isan independent risk factor for heart failure and metabolicsyndrome [16, 17]. In recent years, an increasing trend in theprevalence of hyperuricemia and gout has been observed inepidemiological studies [13, 18–21], and both diseases havebecomepublic health problems that need to be solved quickly.
Due to rapid economic development, the lifestyle of theChinese has changed greatly, a huge transition from a dietarypattern traditionally based on carbohydrates and vegetablesto a pattern that relies on meat, dairy products, and otherpurine-rich foods that are closely related to hyperuricemiaand gout [22, 23].
As a large developing country, China hasmarked regionaldifferences and varied populations. To date, most investiga-tions have been limited to certain areas or have focused onspecific occupations. Therefore, a comprehensive study onthe epidemiology of hyperuricemia and gout in the entiremainland China is needed. As most of the published data arein Chinese, we present our study in the widely read Englishmedium. Obtaining an accurate prevalence of hyperuricemiaand gout is important to help us formulate appropriate localpublic health policies. In addition, such a study will benefitthe people through health education by increasing awarenessof hyperuricemia and gout and also the importance ofimproving lifestyle and maintaining a healthy diet.
Hindawi Publishing CorporationBioMed Research InternationalVolume 2015, Article ID 762820, 12 pageshttp://dx.doi.org/10.1155/2015/762820

2 BioMed Research International
Due to varied geographic locations that include diversepopulations and different socioeconomic conditions, a uni-fied epidemiological investigation about the prevalence ofhyperuricemia and gout remains difficult. We conducted ameta-analysis regarding the prevalence of both diseases inmainland China between January 2000 and December 2014to determine the epidemiology and to review the results fromprevious studies.
2. Methods2.1. Search Strategy. We manually searched all of the litera-tures regarding population-based research on the prevalenceof hyperuricemia and gout from 2000 to 2014 using thePubMed, Google Scholar, CNKI (Chinese National Knowl-edge Infrastructure), Chinese Wangfang, and ChongqingVIP electronic databases. The keywords for search were“uric acid,” “HUA,” “HU,” “hyperuricemia,” “gout,” “preva-lence(s),” “incidence(s),” and “epidemiology.” To find addi-tional studies, the reference lists of the identified studies werealso examined.
2.2. Inclusion and Exclusion Criteria. Papers were included ifthey met all of the following criteria: (1) all study participantsliving in mainland China; (2) study data being generalpopulation-based rather than hospital-based; (3) prevalencerate being also analyzed by according to sex; (4) accuratediagnostic criteria and clear study date; and (5) the mostdetailed study of duplicate studies on the same population.
Studies were excluded if they (1) were not originalresearch, such as a review or case report, (2) includedparticipants with concomitant diseases or had medicationhistory known to affect uric acid metabolism, or (3) focusedon specific population groups, such as teenagers, elderlypeople, or single gender, or a certain occupation.
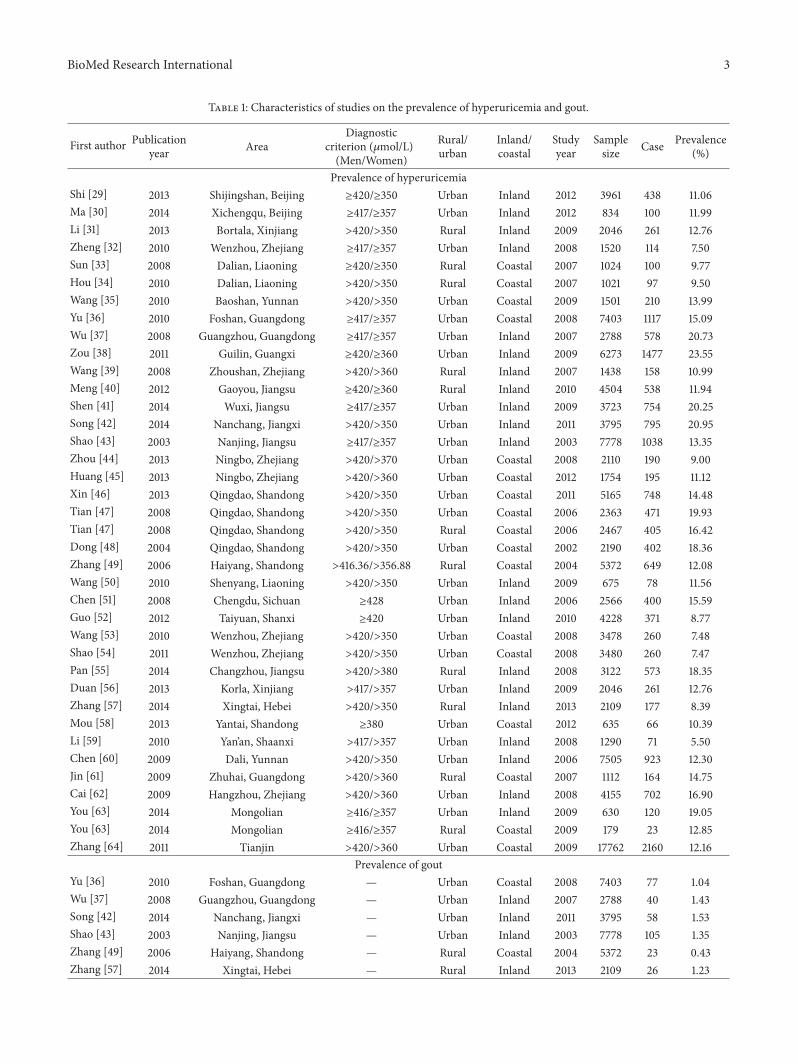
2.3. Definition of Hyperuricemia and Gout. The diagnosticcriteria for hyperuricemia varied among the studies; we havelisted each criterion in Table 1.The diagnostic criteria for goutwere listed in Table 2 [24, 25].
2.4. Data Extraction. Two reviewers searched the literatureindependently. Any disagreement on data extraction betweenthe two reviewers was mediated by discussion [26]. Figure 1shows the literature-search process. We recorded the charac-teristics of all the included papers in Table 1, including thetitle, author’s name, publication date, study year, study pop-ulation, geographic area, rural/urban, inland/coastal, samplesize, case, prevalence, and diagnostic criterion.
2.5. Statistical Analysis. Pooled prevalence and 95% confi-dence intervals (CIs) were calculated to estimate the preva-lence of hyperuricemia and gout in mainland China. Weadopted the Chi-squared-based 𝑄 test and the 𝐼2 test toevaluate the heterogeneity of the studies; 25%, 50%, and 75%were considered low, moderate, and high levels, respectively[27, 28]. If the level of heterogeneity was moderate or high,we used a random-effects meta-analysis model instead ofa fixed-effects model. To perform a secondary analysis andto address heterogeneity, a subgroup analysis was required.
Egger’s test was used to estimate publication bias. A 𝑃 valueless than 0.05 was considered statistically significant. Meta-analysis was calculated using Stata Version 11.0 (Stata CorpLP, College Station, TX, USA). Significant differences inprevalence among the groups were examined through theChi-square test using SPSS Version 20.0 (SPSS Software,Chicago, IL, USA). All figures were generated using Stata11.0 (Stata Corp LP, College Station, TX, USA) or MicrosoftPowerPoint (Microsoft, Redmond, USA).
3. Results
3.1. Characteristics of Included Studies. A total of 604 articleswere identified (Figure 1). After screening for populationbase, study type, relevancy, and duplicates, 36 literary papers(3 in English and 33 in Chinese) containing 44 studies (38regarding hyperuricemia and 6 regarding gout) met ourinclusion criteria. A detailed description of these studies isprovided in Table 1.
3.2. Pooled Prevalence of Hyperuricemia and Gout. As shownin Figure 2, the pooled prevalence of hyperuricemia was13.3% (95% CI: 11.9%, 14.6%), with the prevalence rangingfrom 5.5% to 23.6%. As shown in Figure 3, the pooledprevalence of gout was 1.1% (95%CI: 0.7%, 1.5%), with a rangeof 0.4–1.5%.
Figures 4 and 5 showed the individual prevalence ofhyperuricemia and gout, respectively, in different provinces,municipalities, and autonomous regions.
3.3. Subgroup Analysis. The prevalence of hyperuricemia inmainland China was analyzed in subgroups, which wereseparated based on the following categories: rural or urban,coast or inland, location (north, south, northwest, northeast,and southwest China), economic level, and sex. As shownin Table 3, location in an urban area (𝜒2 = 25.53, 𝑃 <0.001), inland area (𝜒2 = 117.95, 𝑃 < 0.001), or southChina (𝜒2 = 507.39, 𝑃 < 0.001) and a high economic level(𝜒2 = 8.40, 𝑃 = 0.004) might indicate a high prevalence ofhyperuricemia. Notably, sex may also be closely associatedwith hyperuricemia prevalence, as the prevalence amongmenand women was 19.4% (95% CI: 17.6%, 21.1%) and 7.9% (95%CI: 6.6%, 9.3%), respectively.
For gout, the prevalence among the subgroups was verydifferent (Table 4). Urban residents had a much higherprevalence of gout (1.2%, 95% CI: 0.7%, 1.8%) compared withrural residents (0.9%, 95% CI: 0.2%, 1.6%; 𝜒2 = 19.96, 𝑃 <0.001). Inland area residents had a higher prevalence of gout(1.4%, 95% CI: 0.8%, 1.9%) than coastal area residents (0.8%,95% CI: 0.2%, 1.4%; 𝜒2 = 23.88, 𝑃 < 0.001). An increasingprevalence of gout was seen over the years; 0.9% (95% CI:0.0%, 1.8%) of subjects investigated from 2000 to 2005 werediagnosed with gout, and this number increased to 1.4% (95%CI: 0.5%, 2.2%) after 2010 (𝜒2 = 7.47, 𝑃 = 0.024). Regardingsex, the prevalence rate was 1.5% (95%CI: 0.8%, 2.1%) inmenand 0.9% (95% CI: 0.0%, 1.0%) in women.
3.4. Analysis of Heterogeneity and Publication Bias. A sig-nificant overall heterogeneity was noted in the study on
BioMed Research International 3
Table 1: Characteristics of studies on the prevalence of hyperuricemia and gout.
First author Publicationyear Area
Diagnosticcriterion (𝜇mol/L)(Men/Women)
Rural/urban
Inland/coastal
Studyyear
Samplesize Case Prevalence
(%)
Prevalence of hyperuricemiaShi [29] 2013 Shijingshan, Beijing ≥420/≥350 Urban Inland 2012 3961 438 11.06Ma [30] 2014 Xichengqu, Beijing ≥417/≥357 Urban Inland 2012 834 100 11.99Li [31] 2013 Bortala, Xinjiang >420/>350 Rural Inland 2009 2046 261 12.76Zheng [32] 2010 Wenzhou, Zhejiang ≥417/≥357 Urban Inland 2008 1520 114 7.50Sun [33] 2008 Dalian, Liaoning ≥420/≥350 Rural Coastal 2007 1024 100 9.77Hou [34] 2010 Dalian, Liaoning >420/>350 Rural Coastal 2007 1021 97 9.50Wang [35] 2010 Baoshan, Yunnan >420/>350 Urban Coastal 2009 1501 210 13.99Yu [36] 2010 Foshan, Guangdong ≥417/≥357 Urban Coastal 2008 7403 1117 15.09Wu [37] 2008 Guangzhou, Guangdong ≥417/≥357 Urban Inland 2007 2788 578 20.73Zou [38] 2011 Guilin, Guangxi ≥420/≥360 Urban Inland 2009 6273 1477 23.55Wang [39] 2008 Zhoushan, Zhejiang >420/>360 Rural Inland 2007 1438 158 10.99Meng [40] 2012 Gaoyou, Jiangsu ≥420/≥360 Rural Inland 2010 4504 538 11.94Shen [41] 2014 Wuxi, Jiangsu ≥417/≥357 Urban Inland 2009 3723 754 20.25Song [42] 2014 Nanchang, Jiangxi >420/>350 Urban Inland 2011 3795 795 20.95Shao [43] 2003 Nanjing, Jiangsu ≥417/≥357 Urban Inland 2003 7778 1038 13.35Zhou [44] 2013 Ningbo, Zhejiang >420/>370 Urban Coastal 2008 2110 190 9.00Huang [45] 2013 Ningbo, Zhejiang >420/>360 Urban Coastal 2012 1754 195 11.12Xin [46] 2013 Qingdao, Shandong >420/>350 Urban Coastal 2011 5165 748 14.48Tian [47] 2008 Qingdao, Shandong >420/>350 Urban Coastal 2006 2363 471 19.93Tian [47] 2008 Qingdao, Shandong >420/>350 Rural Coastal 2006 2467 405 16.42Dong [48] 2004 Qingdao, Shandong >420/>350 Urban Coastal 2002 2190 402 18.36Zhang [49] 2006 Haiyang, Shandong >416.36/>356.88 Rural Coastal 2004 5372 649 12.08Wang [50] 2010 Shenyang, Liaoning >420/>350 Urban Inland 2009 675 78 11.56Chen [51] 2008 Chengdu, Sichuan ≥428 Urban Inland 2006 2566 400 15.59Guo [52] 2012 Taiyuan, Shanxi ≥420 Urban Inland 2010 4228 371 8.77Wang [53] 2010 Wenzhou, Zhejiang >420/>350 Urban Coastal 2008 3478 260 7.48Shao [54] 2011 Wenzhou, Zhejiang >420/>350 Urban Coastal 2008 3480 260 7.47Pan [55] 2014 Changzhou, Jiangsu >420/>380 Rural Inland 2008 3122 573 18.35Duan [56] 2013 Korla, Xinjiang >417/>357 Urban Inland 2009 2046 261 12.76Zhang [57] 2014 Xingtai, Hebei >420/>350 Rural Inland 2013 2109 177 8.39Mou [58] 2013 Yantai, Shandong ≥380 Urban Coastal 2012 635 66 10.39Li [59] 2010 Yan’an, Shaanxi >417/>357 Urban Inland 2008 1290 71 5.50Chen [60] 2009 Dali, Yunnan >420/>350 Urban Inland 2006 7505 923 12.30Jin [61] 2009 Zhuhai, Guangdong >420/>360 Rural Coastal 2007 1112 164 14.75Cai [62] 2009 Hangzhou, Zhejiang >420/>360 Urban Inland 2008 4155 702 16.90You [63] 2014 Mongolian ≥416/≥357 Urban Inland 2009 630 120 19.05You [63] 2014 Mongolian ≥416/≥357 Rural Coastal 2009 179 23 12.85Zhang [64] 2011 Tianjin >420/>360 Urban Coastal 2009 17762 2160 12.16
Prevalence of goutYu [36] 2010 Foshan, Guangdong — Urban Coastal 2008 7403 77 1.04Wu [37] 2008 Guangzhou, Guangdong — Urban Inland 2007 2788 40 1.43Song [42] 2014 Nanchang, Jiangxi — Urban Inland 2011 3795 58 1.53Shao [43] 2003 Nanjing, Jiangsu — Urban Inland 2003 7778 105 1.35Zhang [49] 2006 Haiyang, Shandong — Rural Coastal 2004 5372 23 0.43Zhang [57] 2014 Xingtai, Hebei — Rural Inland 2013 2109 26 1.23

4 BioMed Research International
Table 2: Gout classification criteria.
Yu et al. [36] Wu et al., Song et al., Shao et al., Zhang et al., and Zhang et al.[37, 42, 43, 49, 57]
Classification criteria for gout [25](1) More than one attack of acute arthritis(2) Maximum inflammation developed within 1 day(3) Oligoarthritis attack(4) Redness observed over joints(5) First MTP joint painful or swollen(6) Unilateral first MTP joint attack(7) Unilateral tarsal joint attack(8) Tophus (suspected or proven)(9) Hyperuricemia (more than 2 S.D. greater than the normalpopulation average)(10) Asymmetric swelling within a joint on X-ray(11) Complete termination of an attackCase definition: ≥6 of 11 clinical criteria
ARA preliminary classification criteria for acute gout 1977 [24](1) More than one attack of acute arthritis(2) Maximum inflammation developed within 1 day(3) Oligoarthritis attack(4) Redness observed over joints(5) First MTP joint painful or swollen(6) Unilateral first MTP joint attack(7) Unilateral tarsal joint attack(8) Tophus (suspected or proven)(9) Hyperuricemia (more than 2 S.D. greater than the normalpopulation average)(10) Asymmetric swelling within a joint on X-ray(11) Subcortical cysts without erosions on X-ray(12) Complete termination of an attackCase definition: ≥6 of 12 clinical criteria required or presence of MSUcrystals in SF or in tophus.
Records identified through database searching
Scre
enin
gIn
clude
dEl
igib
ility
Iden
tifica
tion
Additional records identified through other sources
Records after duplicates removed
Records screened Records excluded
Full-text articles assessed for eligibility
Full-text articles excluded:18 articles were lackingclear data4 articles were on participants suffering fromother diseases or taking medicineStudies included in
qualitative synthesis
Studies included in quantitative synthesis
(meta-analysis)
2 articles contained data in two areas,
6 articles contained a survey on both diseases
(n = 597) (n = 7)
(n = 604)
(n = 64) (n = 6)
(n = 58)
(n = 36)
(n = 44)
Figure 1: Flow diagram for the literature-search process.
hyperuricemia (𝑃 < 0.001, 𝐼2 = 98%); however, the het-erogeneity decreased in the subgroup analysis. We observedpublication bias in both studies according toEgger’s test.Thenwe performed a trim and fill method to address the problemof publication bias. However, it became unchanged after weapplied the trim and fill method [65].
4. Discussion
We analyzed 44 epidemiological surveys covering 16 prov-inces, municipalities, and autonomous regions in mainlandChina. An important strength of our study is that it is a cross-sectional study. We systematically analyzed the prevalence

BioMed Research International 5
Note: weights are from random effects analysis
Yu et al.
Tian et al.
Hou et al.
Zou et al.
Study ID
Meng et al.
Ma et al.
Sun et al.
Cai et al.
Zhang et al.
Zhang et al.
Shen et al.
Chen et al.
Zheng et al.
Wang et al.
You et al.
Huang et al.
Wang
Mou et al.
Song et al.
Jin et al.
Zhang et al.
Xin et al.
Shao
You et al.
Shao et al.
Duan et al.
Guo et al.
Tian et al.
Shi et al.
Wu et al.
Dong et al.
Wang
Zhou et al.
Li et al.
Wang et al.
Li et al.Chen et al.
Pan et al.
0.13 (0.12, 0.15)
0.15 (0.14, 0.16)
0.16 (0.15, 0.18)
0.09 (0.08, 0.11)
0.24 (0.22, 0.25)
0.12 (0.11, 0.13)
0.12 (0.10, 0.14)
0.10 (0.08, 0.12)
0.17 (0.16, 0.18
0.12 (0.11, 0.13)
0.08 (0.07, 0.10)
0.20 (0.19, 0.22)
0.16 (0.14, 0.17)
0.08 (0.06, 0.09)
0.07 (0.07, 0.08)
0.09 (0.04, 0.14)
0.11 (0.10, 0.13)
0.12 (0.09, 0.14)
0.10 (0.08, 0.13)
0.21 (0.20, 0.22)
0.15 (0.13, 0.17)
0.12 (0.12, 0.13)
0.14 (0.14, 0.15)
0.07 (0.07, 0.08
0.18 (0.15, 0.21)
0.13 (0.13, 0.14)
0.13 (0.11, 0.14)
0.09 (0.08, 0.10)
0.20 (0.18, 0.22)
0.11 (0.10, 0.12)
0.21 (0.19, 0.22)
0.18 (0.17, 0.20)
0.14 (0.12, 0.16)
0.09 (0.08, 0.10)
0.13 (0.11, 0.14)
0.11 (0.09, 0.13)
0.05 (0.04, 0.07)0.12 (0.12, 0.13)
0.18 (0.17, 0.20)
100.00
2.71
2.65
2.61
2.69
2.70
2.54
2.60
2.68
2.71
2.68
2.67
2.66
2.67
2.71
1.99
2.65
2.51
2.52
2.67
2.56
2.73
2.70
2.71
2.39
2.71
2.65
2.71
2.63
2.70
2.64
2.63
2.61
2.68
2.65
2.63
2.672.72
2.66
)
ES (95% CI) Weight (%)
−0.246 0 0.246
Overall (I2 = 98.0%, P = 0.000)
Figure 2: Forest plot of the pooled prevalence of hyperuricemia in mainland China.
of hyperuricemia and gout in mainland China. To ourknowledge, this is the first study of this kind to focus onmainland China and cover the years from 2000 to 2014.
In our meta-analysis, the prevalence of hyperuricemiain mainland China was 13.3% (19.4% in men and 7.9%in women), which was in accordance with the worldwideprevalence rate reported to be ranging from 2.6% to 36% indifferent populations [66]. Our result was lower than thatobserved in several developed countries, such as the United
States (21.2% in men and 21.6% in women) [21] and Japan(25.8% overall, 34.5% in men and 11.6% in women) [67]. Asexpected, the prevalence is close to that in most developingcountries; for example, it is 10.6% in Thailand (18.4% in menand 7.8% in women) [68] and 12.1% in Turkey (19.0% inmen and 5.8% in women) [69]. Chuang et al. performed theNutrition andHealth Survey inTaiwan (NAHSIT) study from2005 to 2008, which focused on a Chinese population, but theresults of their study differed significantly from those of our

6 BioMed Research International
Note: weights are from random effects analysis
Zhang et al.
Yu et al.
Zhang et al.
Wu et al.
Shao et al.
Song et al.
Study ID
0.01 (0.01, 0.01)
0.00 (−0.00, 0.01)
0.01 (0.00, 0.02)
0.01 (0.00, 0.02)
0.01 (−0.00, 0.03)
ES (95% CI)
0.01 (0.01, 0.02)
0.02 (0.00, 0.03)
100.00
20.82
23.78
11.30
6.98
27.68
9.43
Weight (%)
0−0.0293 0.0293
Overall (I2 = 0.0%, P = 0.644)
Figure 3: Forest plot of the pooled prevalence of gout in mainland China.
Hainan
Heilongjiang
Jilin
Liaoning
Hebei
Shandong
Fujian
Jiangxi
AnhuiHubei
Hunan
GuangdongGuangxi
Shanghai
Henan
Shanxi
Inner Mongolia
Shanxi
Ningxia
Gansu
Qinghai
Sichuan
GuizhouYunnan
Tibet
Xinjiang
Jiangsu
Zhejiang
Beijing
Taiwan
Tianjin
Prevalence estimate (%)No data<10%
10–20%>20%
Figure 4: Regional distribution of pooled prevalence of hyperuricemia in mainland China.

BioMed Research International 7
Hainan
Heilongjiang
Jilin
Liaoning
Hebei
Shandong
Fujian
Jiangxi
AnhuiHubei
Hunan
GuangdongGuangxi
Shanghai
Henan
Shanxi
Inner Mongolia
Shanxi
Ningxia
Gansu
Qinghai
Sichuan
GuizhouYunnan
Tibet
Xinjiang
Jiangsu
Zhejiang
Beijing
Taiwan
Tianjin
Prevalence estimate (%)No data<0.5%
0.5–1%>1%
Figure 5: Regional distribution of pooled prevalence of gout in mainland China.
study. In their reports the prevalence of hyperuricemia was21.6% inmen and 9.6% inwomen [70], whichwas higher thanours and similar to that in developed countries. Our researchwas performed on mainland China, whereas Chuang’s studywas conducted in Taiwan, an economically-developed regionin China. We believe that our results are more representativeof the Chinese population living in the mainland.
As China is geographically vast, the prevalence ofhyperuricemia varies significantly in different geographicregions. The prevalence in south China was 18.6%, whichis much higher than the pooled prevalence, followed bysouthwest China (13.9%), north China (13.2%), east China(12.9%), northwest China (10.3%), and northeast China(10.1%). Such differences might be related to variability inlifestyle and economic development. As a previous studydescribed, rapidly increasing economic development has ledto unhealthy lifestyles [71]. Residents in south China, whichis an economically developed region, consume more meat,seafood, and alcohol than residents elsewhere; therefore, theprevalence of hyperuricemia was higher in south China thanin other regions. Also, hyperuricemia was more commonin urban residents than in rural residents, and the inlandprevalence of hyperuricemia wasmuch higher than in coastalareas.
From our study, the pooled prevalence of gout was 1.1%,which is similar to that in Italy (0.9% in 2009) [19], France(0.9% in 2013) [72], the United Kingdom, andGermany (1.4%in 2000–2005) [17]. In addition, the prevalence of gout in ourcountry was much higher than that in Turkey (0.31% in 2001-2002) [73],Mexico (0.3% in 2011) [74],Greece (0.47% in 2003)[75], and the Czech Republic (0.3% in 2002-2003) [76] but ismarkedly lower than that in New Zealand (2.69% in 2008-2009) [77], the USA (3.9% in 2007-2008) [21], and Australia(9.7% in 2002) [78].
Another main finding in our study was that the preva-lence of gout in men (1.5%) was remarkably higher thanin women (0.9%). This difference in sex was consistentwith previous studies in other populations. Soriano et al.investigated the current epidemiology of gout in the generalUnitedKingdompopulation and suggested that the incidenceof gout was 4.42 per 1,000 persons per year in men and1.32 per 1,000 persons per year in women [13]. Zhu et al.reported that the prevalence in the US was 5.9% in men,which was much higher than the 2.0% observed for women[21]. In accordance with these researches, prevalence of goutin Taiwan was 9.2% for men and 2.3% for women [70]. Sexhormonesmay explain the difference between the sexes. Gheiet al. suggested that the serum uric acid levels were higher

8 BioMed Research International
Table 3: Stratified prevalence of hyperuricemia in mainland China.
Subgroups Prevalence (%) (95% CI) Number of studies Heterogeneity Case/total𝐼2% 𝑃 value
AreaUrban 13.7 (12.0, 15.4) 27 98.4 <0.001 14322/101787Rural 12.3 (10.5, 14.1) 11 94.3 <0.001 3154/24581
Coastal/inlandInland 13.8 (11.8, 15.7) 23 98.3 <0.001 10160/68666Coast 12.5 (10.8, 14.2) 15 97.3 <0.001 7316/57702
LocationNorth China 13.2 (11.5, 14.8) 13 96.3 <0.001 6162/48261East China 12.9 (10.2, 15.6) 12 98.6 <0.001 5577/40857Northwest 10.3 (5.4, 15.3) 3 97.4 <0.001 593/5382Northeast 10.1 (8.9, 11.2) 3 0.0 0.376 275/2720Southwest 13.9 (11.7, 16.1) 3 88.6 <0.001 1533/11572South China 18.6 (13.8, 23.3) 4 98.3 <0.006 3336/17576
Economic levelHigh 13.8 (12.0, 15.6) 20 98.0 <0.001 8094/59811Low 12.6 (10.6, 14.7) 18 98.1 <0.001 9382/66557
SexMale 19.4 (17.6, 21.1) 38 96.7 <0.001 11644/60768Female 7.9 (6.6, 9.3) 38 97.9 <0.001 5859/65654
Total 13.3 (11.9, 14.6) 38 98.0 <0.001 17476/126368
Table 4: Prevalence of gout in mainland China by different stratification factors.
Subgroups Prevalence (%) (95% CI) Number of studies Heterogeneity Case/total𝐼2% 𝑃 value
AreaUrban 1.2 (0.7, 1.8) 4 0.0 0.830 280/21764Rural 0.9 (0.2, 1.6) 2 14.0 0.313 49/7481Coastal/inlandInland 1.4 (0.8, 1.9) 4 0.0 0.989 229/16470Coastal 0.8 (0.2, 1.4) 2 0.4 0.316 100/12775
Study year2000–2005 0.9 (0.0, 1.8) 2 59.1 0.118 128/131502006–2010 1.1 (0.4, 1.8) 2 0.0 0.655 117/101912011–2014 1.4 (0.5, 2.2) 2 0.0 0.737 84/5904
SexMale 1.5 (0.8, 2.1) 6 1.9 0.404 226/14060Female 0.9 (0.0, 1) 6 0.0 0.924 78/15185
Total 1.1 (0.7, 1.5) 6 0.0 0.644 329/29245
in men than in women and that this difference is under theinfluence of sex hormones. Uric acid levels in women tend toincrease after menopause [69, 79].
Moreover, in line with previous results, a rise in theprevalence of gout was observed in the current study. Theprevalence was 0.9% in 2000–2005, 1.1% in 2006–2010, and1.4% in 2011–2014. The US National Health and NutritionExamination Survey (NHANES) study conducted in 2007-2008 demonstrated that the prevalence of gout was 3.9%,
though it was only 2.7% in 1988–1994 [21].TheNAHSIT stud-ies, carried out during 1993–1996 and 2005–2008, showedthat the prevalence of gout increased from 4.7% to 8.2%in men and 2.2% to 2.3% in women [70]. To help reducethe increasing burden of these diseases, prospective dataon modifiable risk factors in lifestyle and diet for theseconditions should be considered including, but not limitedto, weight control, regular exercise, restricted intake of meatand purine-rich foods, and avoidance of heavy drinking.

BioMed Research International 9
Vitamin C supplementation may also be considered a long-term preventive measure as it can lower the risk of goutthrough lowering serum urate levels [80, 81].
Noteworthy, there is a lack of unified diagnostic criteriafor gout, and several sets of criteria exist, such as theRome criteria, the New York criteria, and the AmericanRheumatology Association (ARA) criteria [24]. The goldstandard to diagnose gout is the presence of monosodiumurate monohydrate (MSU) crystals in the synovial fluid (SF)at the time the patient experiences a gout attack [82]. Thesets of criteria that include MSU crystals in SF have highspecificity, and the exclusion of MSU crystal examinationhas led to a dramatic reduction in sensitivity [83]. However,MSU crystal examination is not always feasible in clinicalpractice. In 2015, Taylor et al. performed the Study forUpdated Gout Classification Criteria (SUGAR) and deter-mined ten parameters for accurately distinguishing gout fromnongout [84]. In the same year, the American College ofRheumatology developed a new classification criteria for gout[85]. All the studies included in our analysis were performedfrom 2000 to 2014; therefore they were unable to adopt thenew classification criteria. The diagnostic criteria used inthis study could lead to a possible high sensitivity but lowspecificity. Because of this, the prevalence of gout in ouranalysis may be slightly higher than the actual rate, but itrepresents the general prevalence of gout and its geographicaldistribution in China.
Our meta-analysis has several other limitations. First, thepooled data covered only part of mainland China, especiallyfor gout; however, our data did cover 16 provinces, munici-palities, and autonomous regions. To our knowledge, it is themost encompassing cross-sectional study on hyperuricemiaand gout prevalence in China. Second, the primary studieson hyperuricemia used different assays to assess serum uricacid levels with different reference intervals.Third, there werevariations in the quality of the selected articles; hence hetero-geneitymay be influenced by uncertain data. Fourth, asmuchconcern is given to this topic by Chinese doctors, themajorityof the studies included were published in Chinese. However,this limitation was overcome by the current authors whoare proficient in Chinese for interpretation and extraction ofdata. Also, sample size of included papers was too small inour subgroup analysis for the prevalence of gout, so there wasno statistical power to explore the association between goutprevalence and geographic regions. Our work underlines theneed for additional population-based investigations in theareas absent from our analysis. This is the first study to assessthe nationwide epidemiology of hyperuricemia and gout inmainland China.
In conclusion, as previous studies were limited to specificregions, our study on the epidemiology of hyperuricemia andgout is of value to public health policies. Based on previousstudies, we show that the prevalence of these diseases ishigh and that the rate of gout is rising. Consequently, largewell-designed multicenter investigations are required in thefuture to provide information regarding the outcomes andprognosis of these chronic diseases in the entire population.Furthermore, effective measures should be adopted to pre-vent the increase in incidence of these diseases.
Conflict of Interests
The authors declare that there is no conflict of interestsregarding the publication of this paper.
Authors’ Contribution
Rui Liu and Cheng Han carried out the study. Rui Liu, ChengHan and Di Wu wrote the main paper. Xinghai Xia andJianqiu Gu prepared the figures and tables. Haixia Guan andWeipingTengdesigned and funded the study. Zhongyan Shanrevised the paper. All authors reviewed the paper. Rui Liu andCheng Han contributed equally to this work.
Acknowledgments
The authors thank all the authors and participants in thestudies mentioned in our research.
References
[1] S. Sinha, S. N. Singh, and U. S. Ray, “Total antioxidant status athigh altitude in lowlanders and native highlanders: role of uricacid,”High AltitudeMedicine and Biology, vol. 10, no. 3, pp. 269–270, 2009.
[2] M. Li, W. Hou, X. Zhang, L. Hu, and Z. Tang, “Hyperuricemiaand risk of stroke: a systematic review and meta-analysis ofprospective studies,”Atherosclerosis, vol. 232, no. 2, pp. 265–270,2014.
[3] B. Liu, T. Wang, H. N. Zhao et al., “The prevalence of hyper-uricemia in China: a meta-analysis,” BMC Public Health, vol. 11,article 832, 2011.
[4] N. Nakanishi, M. Okamoto, H. Yoshida, Y. Matsuo, K. Suzuki,and K. Tatara, “Serum uric acid and risk for development ofhypertension and impaired fasting glucose or type II diabetesin Japanese male office workers,” European Journal of Epidemi-ology, vol. 18, no. 6, pp. 523–530, 2003.
[5] R. J. Johnson, D.-H. Kang, D. Feig et al., “Is there a pathogeneticrole for uric acid in hypertension and cardiovascular and renaldisease?” Hypertension, vol. 41, no. 6, pp. 1183–1190, 2003.
[6] J. Wang, T. Qin, J. Chen et al., “Hyperuricemia and risk ofincident hypertension: a systematic review and meta-analysisof observational studies,” PLoS ONE, vol. 9, no. 12, Article IDe114259, 2014.
[7] M. J. Bos, P. J. Koudstaal, A. Hofman, J. C. M. Witteman, andM. M. B. Breteler, “Uric acid is a risk factor for myocardialinfarction and stroke: the Rotterdam study,” Stroke, vol. 37, no.6, pp. 1503–1507, 2006.
[8] T.-C. Peng, C.-C.Wang, T.-W. Kao et al., “Relationship betweenhyperuricemia and lipid profiles in US adults,” BioMed ResearchInternational, vol. 2015, Article ID 127596, 7 pages, 2015.
[9] H.-Y. Chang, C.-W. Tung, P.-H. Lee et al., “Hyperuricemia asan independent risk factor of chronic kidney disease in middle-aged and elderly population,” American Journal of the MedicalSciences, vol. 339, no. 6, pp. 509–515, 2010.
[10] D. I. Feig, D.-H. Kang, and R. J. Johnson, “Uric acid andcardiovascular risk,”The New England Journal of Medicine, vol.359, no. 17, pp. 1811–1821, 2008.
[11] D.Grassi, G.Desideri, A.V.DiGiacomantonio, P.DiGiosia, andC. Ferri, “Hyperuricemia and cardiovascular risk,” High Blood

10 BioMed Research International
Pressure and Cardiovascular Prevention, vol. 21, no. 4, pp. 235–242, 2014.
[12] H. Huang, B. Huang, Y. Li et al., “Uric acid and risk ofheart failure: a systematic review and meta-analysis,” EuropeanJournal of Heart Failure, vol. 16, no. 1, pp. 15–24, 2014.
[13] L. C. Soriano, D. Rothenbacher, H. K. Choi, and L. A. Garcıa,“Contemporary epidemiology of gout in the UK general popu-lation,”Arthritis Research andTherapy, vol. 13, no. 2, article R39,2011.
[14] H. K. Choi, D. B. Mount, and A. M. Reginato, “Pathogenesis ofgout,” Annals of Internal Medicine, vol. 143, no. 7, pp. 499–516,2005.
[15] A. J. Luk and P. A. Simkin, “Epidemiology of hyperuricemiaand gout,” American Journal of Managed Care, vol. 11, no. 15,supplement, pp. S435–S442, 2005.
[16] H. K. Choi, E. S. Ford, C. Li, and G. Curhan, “Prevalence of themetabolic syndrome in patients with gout: the Third NationalHealth and Nutrition Examination Survey,” Arthritis Care andResearch, vol. 57, no. 1, pp. 109–115, 2007.
[17] L. Annemans, E. Spaepen, M. Gaskin et al., “Gout in the UKand Germany: prevalence, comorbidities and management ingeneral practice 2000–2005,” Annals of the Rheumatic Diseases,vol. 67, no. 7, pp. 960–966, 2008.
[18] E. Arromdee, C. J. Michet, C. S. Crowson, W. M. O’Fallon, andS. E. Gabriel, “Epidemiology of gout: is the incidence rising?”Journal of Rheumatology, vol. 29, no. 11, pp. 2403–2406, 2002.
[19] G. Trifiro, P. Morabito, L. Cavagna et al., “Epidemiology ofgout and hyperuricaemia in Italy during the years 2005–2009:a nationwide population-based study,” Annals of the RheumaticDiseases, vol. 72, no. 5, pp. 694–700, 2013.
[20] P. Klemp, S. A. Stansfield, B. Castle, andM. C. Robertson, “Goutis on the increase in New Zealand,” Annals of the RheumaticDiseases, vol. 56, no. 1, pp. 22–26, 1997.
[21] Y. Zhu, B. J. Pandya, and H. K. Choi, “Prevalence of goutand hyperuricemia in the US general population: the NationalHealth andNutrition Examination Survey 2007-2008,”Arthritisand Rheumatism, vol. 63, no. 10, pp. 3136–3141, 2011.
[22] A. E. Hak and H. K. Choi, “Lifestyle and gout,” Current Opinionin Rheumatology, vol. 20, no. 2, pp. 179–186, 2008.
[23] F. Zhai, Y. He, G. Ma et al., “Study on the current statusand trend of food consumption among Chinese population,”Chinese Journal of Epidemiology, vol. 26, no. 7, pp. 485–488, 2005(Chinese).
[24] S. L. Wallace, H. Robinson, A. T. Masi, J. L. Decker, D. J.McCarty, andT. F. Yu, “Preliminary criteria for the classificationof the acute arthritis of primary gout,” Arthritis and Rheuma-tism, vol. 20, no. 3, pp. 895–900, 1977.
[25] R. Roubenoff, “Gout and hyperuricemia,” Rheumatic DiseaseClinics of North America, vol. 16, no. 3, pp. 539–550, 1990.
[26] C. Han, X. He, X. Xia et al., “Subclinical hypothyroidism andtype 2 diabetes: a systematic review and meta-analysis,” PLoSONE, vol. 10, no. 8, Article ID e0135233, 2015.
[27] J. P. T. Higgins, S. G. Thompson, J. J. Deeks, and D. G. Altman,“Measuring inconsistency in meta-analyses,” British MedicalJournal, vol. 327, no. 7414, pp. 557–560, 2003.
[28] W. Zhao, C. Han, X. Shi et al., “Prevalence of goiter and thyroidnodules before and after implementation of the Universal SaltIodization program in mainland China from 1985 to 2014: asystematic review and meta-analysis,” PLoS ONE, vol. 9, no. 10,Article ID e109549, 2014.
[29] P. Shi, P. Du, X. An et al., “Analysis of the relationship betweenserum uric acid levels and chronic diseases among residents inShijingshan district, Beijing,” Capital Journal of Public Health,vol. 7, no. 4, pp. 159–163, 2013 (Chinese).
[30] P. Ma, L. Chen, and P. Yang, “The correlation between hyper-uricemia and metabolic syndrome in the residents in Xichengdistrict of Beijing,” Tianjin Medical Journal, vol. 42, no. 7, pp.722–724, 2014 (Chinese).
[31] D. Li, M. Ma, Y. Su et al., “The prevalence of hyperuricemia ofbortala residents and its influencing factors,”Modern PreventiveMedicin, vol. 40, no. 9, pp. 1746–1748, 2013 (Chinese).
[32] J. Zheng, P. Chen, and J. Xie, “Analysis on prevalence rate andinfluential factors of hyperuricemia among residents in OuhaiDistrict, Wenzhou,” Zhejiang Preventive Medicine, vol. 22, no.12, pp. 13–16, 2010 (Chinese).
[33] X. Sun, X. Wang, X. Pan et al., “Investigation of the prevalenceand distributing feature of cardiovascular disease risk factorsin Zhangzi island of Dalian,” Chinese Journal of CardiovascularMedicine, vol. 13, no. 4, pp. 280–283, 2008 (Chinese).
[34] G. Hou, L. Luo, L. Cheng, and Z. Gao, “Analysis on prevalenceand influence factors of hyperuricemia among residents inDalian Zhangzidao,”The Journal ofMedical Research, vol. 39, no.2, pp. 37–40, 2010 (Chinese).
[35] R. Wang, “Analysis of urinary calculi in patients with hyper-uricemia,” Journal of Taishan Medical College, vol. 31, no. 4, pp.300–301, 2010 (Chinese).
[36] J.W. Yu, T. G. Yang,W. X. Diao et al., “Epidemiological study onhyperuricemia and gout in Foshan areas, Guangdong province,”Chinese Journal of Epidemiology, vol. 31, no. 8, pp. 860–862, 2010(Chinese).
[37] W. Wu, J. Guo, W. Yang, Z. Zhong, Y. Liu, and H. Luo,“Epidemiology of hyperuricemia and gout in a community inGuangzhou,” Chinese Journal of General Practice, vol. 6, no. 7,pp. 728–729, 2008 (Chinese).
[38] G. Zou, Y. Xiang, W. Che et al., “Prevalence of hyperuricemiain community residents of Xiangshan Disteict, Guilin City,”Chinese Journal of Hypertension, vol. 19, no. 2, pp. 148–152, 2011(Chinese).
[39] L. Wang, H. Fu, Y. Sun, and W. Cai, “A survey of metabolicsyndrome and its related diseases in fishing village in island,”Zhejiang Preventive Medicine, vol. 20, no. 10, pp. 8–9, 2008(Chinese).
[40] J. Meng, Y. Zhu, W. Tan et al., “Prevalence of hyperuricemiain rural residents of Gaoyou City, Jiangsu Province,” ChineseJournal of Rheumatology, vol. 16, no. 7, pp. 436–441, 2012.
[41] S. Shen, H. Li, Y. Feng et al., “Correlation between serum uricacid and metabolic syndrome of adults in Suxichang area ofJiangsu province,” Chinese Journal of Prevention and Control ofChronic Diseases, vol. 22, no. 1, pp. 39–42, 2014 (Chinese).
[42] W. Song, J. Liu, Z. Chen, Y. Huo, A. Lin, and Y. Zhang,“Hyperuricemia and gout: a prevalence survey among over-40-year-old community residents in Nanchang District,” ChineseGeneral Practice, vol. 17, no. 2, pp. 181–185, 2014 (Chinese).
[43] J. Shao, B. Mo, R. Yu, Z. Li, H. Li, and Y. Xu, “Epidemiologicalstudy on hyperuricemia and gout in community of Nanjing,”Chinese Journal of Disease Control and Prevention, vol. 7, no. 4,pp. 305–308, 2003 (Chinese).
[44] F. Zhou, Q. Luo, L.Wu et al., “Epidemiological survey of chronickidney disease among adults in Ningbo,” Chinese Journal ofPreventive Medicine, vol. 14, no. 9, pp. 669–674, 2013 (Chinese).

BioMed Research International 11
[45] J. Huang, B. Zhou, S. Chen, and J. Dong, “A cross-sectionalstudy on gout and hyperuricemia in community population,”Zhejiang Journal of Preventive Medicine, vol. 25, no. 7, pp. 8–10,2013 (Chinese).
[46] H. Xin, Q. Cao, F. Zhao et al., “Analysis on blood glucose, andblood lipid test results between hyperuricemia people and thegeneral population,” Preventive Medicine Tribune, vol. 17, no. 13,pp. 171–177, 2013 (Chinese).
[47] X. Tian, Z. Pang, G. Bao et al., “Ananlysis on prevalenceand influence factors of hyperuricemia among residents inQingdao,” Chinese Journal of Public Health, vol. 24, no. 3, pp.360–362, 2008 (Chinese).
[48] Y. Dong, H. Nan, andW.Gao, “Prevalence of themetabolic syn-drome among adults aged 20–74 years in Zhanshan communityof Qingdao,” Chinese Journal of Diabetes, vol. 12, no. 2, pp. 177–181, 2004 (Chinese).
[49] X. Zhang, W. Yu, L. Yu, L. Zhang, and Y. Yu, “An epidemiologicstudy on hyperuricaemia and gout in risidents of coastal areasof Haiyang City in Shangdong,” Chinese Journal of GeneralPractitioners, vol. 5, no. 4, pp. 216–219, 2006 (Chinese).
[50] X. Wang, “Analysis on prevalence and correlative factors ofhyperuricemia among residents in Shenyang,” in Proceedings ofthe 9th Annual Meeting of Chinese Society of Endocrinology, p.46, 2010 (Chinese).
[51] X. Chen, Y. Zou, G. Li, Y. Xiao, and L. Wang, “Analysison prevalence and influence factors of hyperuricemia amongresidents in Sichuan,” SichuanMedical Journal, vol. 29, no. 9, pp.1267–1269, 2008 (Chinese).
[52] W. Guo, C. Xiao, X. Shen, G. Liu, and H. Zhang, “Preva-lence of hyperuricemia and its relationship to hypertension,hyperglycemia and hyperlipidemia in community residents inTaiyuan city,” Chinese Jeneral Practice, vol. 15, no. 9, pp. 3045–3047, 2012 (Chinese).
[53] J. Wang, Y. Shao, Y. Chen, H. Qian, and N. Zhang, “Analysison Wenzhou citizen’s hyperuricemia and the influence factor,”Chinese Journal of Health Laboratory Technology, vol. 20, no. 10,pp. 2545–2547, 2010 (Chinese).
[54] Y. Shao, “Risk investigation on hyperuricemia among residentsof two communities in Wenzhou City,” Shanghai Journal ofPreventive Medicine, vol. 23, no. 6, pp. 257–260, 2011 (Chinese).
[55] Y. Pan, D.Qiang, J. Ding, andY. Shen, “Analysis on prevalencingof hyperuricemia and influence factors in Wujin District,”Chinese Journal of Prevention and Control of Chronic Non-Communicable Disease, vol. 22, no. 3, pp. 315–317, 2014 (Chi-nese).
[56] W. Duan, J. Zhang, Y. Ma, and J. Cheng, “Prevalence andinfluencing factors of hyperuricemia among residents in KorlaRegion of Xinjiang,” Chinese Jeneral Practice B, vol. 16, no. 3,2013 (Chinese).
[57] P. Zhang, L. Zhang, C. Wang, S. Wei, and Q. Qiao, “Epidemi-ology of hyperuricemia and gout in Xingtai among adults over30 years old,” Practical Preventive Medicine, vol. 21, no. 8, pp.1010–1012, 2014.
[58] S. Mou, C. Lv, J. Ju, Y. He, P. Guang, and Y. Ying, “Analusisof hyperuricemia of urban peasants,” Chinese Primarhy HealthCare, vol. 27, no. 6, pp. 66–67, 2013 (Chinese).
[59] S. Li, J. Yu, S. Lv, and Y. Zhang, “The prevalence and risk bactorsof hyperuricaemia in Yan’an,” Chinese Journal of PreventiveMedicine, vol. 11, no. 8, pp. 763–765, 2010 (Chinese).
[60] X. Chen, H. Yang, and J. Yang, “Prevalence of hyperuricemiaand gout among residents in Dali, Yunnan,” China PracticalMedical, vol. 4, no. 10, pp. 257–259, 2009 (Chinese).
[61] L. Jin, Y. Ma, R. Huang, J. Chen, H. Xiao, and X. Chen, “Epi-demiology of hyperuricemia and influence factors among ruralresidents in Doumen District, Zhuhai,” Chinese CommunityDoctors, vol. 11, no. 20, pp. 254–255, 2009 (Chinese).
[62] Z. Cai, X. Xu, X. Wu, C. Zhou, and D. Li, “Hyperuricemia andthe metabolic syndrome in Hangzhou,” Asia Pacific Journal ofClinical Nutrition, vol. 18, no. 1, pp. 81–87, 2009.
[63] L. You, A. Liu, G. Wuyun, H. Wu, and P. Wang, “Prevalenceof hyperuricemia and the relationship between serum uric acidand metabolic syndrome in the Asian Mongolian area,” Journalof Atherosclerosis and Thrombosis, vol. 21, no. 4, pp. 355–365,2014.
[64] Q. Zhang, S. Lou, Z. Meng, and X. Ren, “Gender andage impacts on the correlations between hyperuricemia andmetabolic syndrome in Chinese,” Clinical Rheumatology, vol.30, no. 6, pp. 777–787, 2011.
[65] S. R. Bapoje, A. Bahia, J. E. Hokanson et al., “Effects of miner-alocorticoid receptor antagonists on the risk of sudden cardiacdeath in patients with left ventricular systolic dysfunction:a meta-analysis of randomized controlled trials,” Circulation:Heart Failure, vol. 6, no. 2, pp. 166–173, 2013.
[66] S. Uaratanawong, S. Suraamornkul, S. Angkeaw, and R.Uaratanawong, “Prevalence of hyperuricemia in Bangkok pop-ulation,” Clinical Rheumatology, vol. 30, no. 7, pp. 887–893, 2011.
[67] K. Nagahama, K. Iseki, T. Inoue, T. Touma, Y. Ikemiya, and S.Takishita, “Hyperuricemia and cardiovascular risk factor clus-tering in a screened cohort in Okinawa, Japan,” HypertensionResearch, vol. 27, no. 4, pp. 227–233, 2004.
[68] V. Lohsoonthorn, B. Dhanamun, and M. A. Williams, “Preva-lence of hyperuricemia and its relationship with metabolic syn-drome in Thai adults receiving annual health exams,” Archivesof Medical Research, vol. 37, no. 7, pp. 883–889, 2006.
[69] I. Sari, S. Akar, B. Pakoz et al., “Hyperuricemia and its relatedfactors in an urban population, Izmir, Turkey,” RheumatologyInternational, vol. 29, no. 8, pp. 869–874, 2009.
[70] S.-Y. Chuang, S.-C. Lee, Y.-T. Hsieh, and W.-H. Pan, “Trendsin hyperuricemia and gout prevalence: Nutrition and HealthSurvey in Taiwan from 1993–1996 to 2005–2008,” Asia PacificJournal of Clinical Nutrition, vol. 20, no. 2, pp. 301–308, 2011.
[71] L. Zhang, F.Wang, L.Wang et al., “Prevalence of chronic kidneydisease in China: a cross-sectional survey,”The Lancet, vol. 379,no. 9818, pp. 815–822, 2012.
[72] T. Bardin, S. Bouee, P. Clerson et al., “Prevalence of gout in theadult population of France,” Arthritis Care & Research, 2015.
[73] M. Birlik, O. Gurler, S. Akar, I. Sari, F. Onen, and N. Akkoc,“The prevalence of gout in an urban area of Izmir, Turkey: apopulation-based epidemiological study,” International Journalof Clinical Practice, vol. 68, no. 6, pp. 775–782, 2014.
[74] J. Rodriguez-Amado, I. Pelaez-Ballestas, L. H. Sanin et al.,“Epidemiology of rheumatic diseases. A community-basedstudy in urban and rural populations in the state ofNuevo Leon,Mexico,” Journal of Rheumatology, vol. 38, no. 86, pp. 9–14, 2011.
[75] A. Andrianakos, P. Trontzas, F. Christoyannis et al., “Prevalenceof rheumatic diseases in Greece: a cross-sectional populationbased epidemiological study, The ESORDIG Study,” Journal ofRheumatology, vol. 30, no. 7, pp. 1589–1601, 2003.
[76] P. Hanova, K. Pavelka, C. Dosta, I. Holcatova, and H. Pikhart,“Epidemiology of rheumatoid arthritis, juvenile idiopathicarthritis and gout in two regions of the Czech Republic in adescriptive population-based survey in 2002-2003,” Clinical &Experimental Rheumatology, vol. 24, no. 5, pp. 499–507, 2006.

12 BioMed Research International
[77] D. Winnard, C. Wright, W. J. Taylor et al., “National prevalenceof gout derived fromadministrative health data in aotearoaNewZealand,” Rheumatology, vol. 51, no. 5, pp. 901–909, 2012.
[78] P. C. Robinson, W. J. Taylor, and T. R. Merriman, “Systematicreview of the prevalence of gout and hyperuricaemia in Aus-tralia,” Internal Medicine Journal, vol. 42, no. 9, pp. 997–1007,2012.
[79] M. Ghei, M. Mihailescu, and D. Levinson, “Pathogenesisof hyperuricemia: recent advances,” Current RheumatologyReports, vol. 4, no. 3, pp. 270–274, 2002.
[80] H. K. Choi, “A prescription for lifestyle change in patients withhyperuricemia and gout,” Current Opinion in Rheumatology,vol. 22, no. 2, pp. 165–172, 2010.
[81] H. K. Choi, X. Gao, and G. Curhan, “Vitamin C intake and therisk of gout in men: a prospective study,” Archives of InternalMedicine, vol. 169, no. 5, pp. 502–507, 2009.
[82] J. M. A. Wijnands, A. Boonen, I. C. W. Arts, P. C. Dagnelie, C.D. A. Stehouwer, and S. van der Linden, “Large epidemiologicstudies of gout: challenges in diagnosis and diagnostic criteria,”Current Rheumatology Reports, vol. 13, no. 2, pp. 167–174, 2011.
[83] W. J. Taylor, J. Fransen, N. Dalbeth et al., “Performance ofclassification criteria for gout in early and established disease,”Annals of the Rheumatic Diseases, 2014.
[84] W. J. Taylor, J. Fransen, T. L. Jansen et al., “Study for updatedgout classification criteria: identification of features to classifygout,” Arthritis Care & Research, vol. 67, no. 9, pp. 1304–1315,2015.
[85] T. Neogi, T. L. Jansen, N. Dalbeth et al., “2015 Gout classifica-tion criteria: an American College of Rheumatology/EuropeanLeague Against Rheumatism collaborative initiative,” Annals ofthe Rheumatic Diseases, vol. 74, no. 10, pp. 1789–1798, 2015.

Submit your manuscripts athttp://www.hindawi.com
Stem CellsInternational
Hindawi Publishing Corporationhttp://www.hindawi.com Volume 2014
Hindawi Publishing Corporationhttp://www.hindawi.com Volume 2014
MEDIATORSINFLAMMATION
of
Hindawi Publishing Corporationhttp://www.hindawi.com Volume 2014
Behavioural Neurology
EndocrinologyInternational Journal of
Hindawi Publishing Corporationhttp://www.hindawi.com Volume 2014
Hindawi Publishing Corporationhttp://www.hindawi.com Volume 2014
Disease Markers
Hindawi Publishing Corporationhttp://www.hindawi.com Volume 2014
BioMed Research International
OncologyJournal of
Hindawi Publishing Corporationhttp://www.hindawi.com Volume 2014
Hindawi Publishing Corporationhttp://www.hindawi.com Volume 2014
Oxidative Medicine and Cellular Longevity
Hindawi Publishing Corporationhttp://www.hindawi.com Volume 2014
PPAR Research
The Scientific World JournalHindawi Publishing Corporation http://www.hindawi.com Volume 2014
Immunology ResearchHindawi Publishing Corporationhttp://www.hindawi.com Volume 2014
Journal of
ObesityJournal of
Hindawi Publishing Corporationhttp://www.hindawi.com Volume 2014
Hindawi Publishing Corporationhttp://www.hindawi.com Volume 2014
Computational and Mathematical Methods in Medicine
OphthalmologyJournal of
Hindawi Publishing Corporationhttp://www.hindawi.com Volume 2014
Diabetes ResearchJournal of
Hindawi Publishing Corporationhttp://www.hindawi.com Volume 2014
Hindawi Publishing Corporationhttp://www.hindawi.com Volume 2014
Research and TreatmentAIDS
Hindawi Publishing Corporationhttp://www.hindawi.com Volume 2014
Gastroenterology Research and Practice
Hindawi Publishing Corporationhttp://www.hindawi.com Volume 2014
Parkinson’s Disease
Evidence-Based Complementary and Alternative Medicine
Volume 2014Hindawi Publishing Corporationhttp://www.hindawi.com