RESEARCH ARTICLE OpenAccess ... et al Monomorium wing...RESEARCH ARTICLE OpenAccess...
21
Favé et al. BMC Evolutionary Biology (2015) 15:183 DOI 10.1186/s12862-015-0448-4 RESEARCH ARTICLE Open Access Past climate change on Sky Islands drives novelty in a core developmental gene network and its phenotype Marie-Julie Favé 1 , Robert A. Johnson 2 , Stefan Cover 3 , Stephan Handschuh 4 , Brian D. Metscher 4 , Gerd B. Müller 4 , Shyamalika Gopalan 1 and Ehab Abouheif 1* Abstract Background: A fundamental and enduring problem in evolutionary biology is to understand how populations differentiate in the wild, yet little is known about what role organismal development plays in this process. Organismal development integrates environmental inputs with the action of gene regulatory networks to generate the phenotype. Core developmental gene networks have been highly conserved for millions of years across all animals, and therefore, organismal development may bias variation available for selection to work on. Biased variation may facilitate repeatable phenotypic responses when exposed to similar environmental inputs and ecological changes. To gain a more complete understanding of population differentiation in the wild, we integrated evolutionary developmental biology with population genetics, morphology, paleoecology and ecology. This integration was made possible by studying how populations of the ant species Monomorium emersoni respond to climatic and ecological changes across five ‘Sky Islands’ in Arizona, which are mountain ranges separated by vast ‘seas’ of desert. Sky Islands represent a replicated natural experiment allowing us to determine how repeatable is the response of M. emersoni populations to climate and ecological changes at the phenotypic, developmental, and gene network levels. Results: We show that a core developmental gene network and its phenotype has kept pace with ecological and climate change on each Sky Island over the last ∼90,000 years before present (BP). This response has produced two types of evolutionary change within an ant species: one type is unpredictable and contingent on the pattern of isolation of Sky lsland populations by climate warming, resulting in slight changes in gene expression, organ growth, and morphology. The other type is predictable and deterministic, resulting in the repeated evolution of a novel wingless queen phenotype and its underlying gene network in response to habitat changes induced by climate warming. Conclusion: Our findings reveal dynamics of developmental gene network evolution in wild populations. This holds important implications: (1) for understanding how phenotypic novelty is generated in the wild; (2) for providing a possible bridge between micro- and macroevolution; and (3) for understanding how development mediates the response of organisms to past, and potentially, future climate change. *Correspondence: [email protected] 1 Department of Biology, McGill University, 1205 Dr. Penfield avenue, Montréal, Québec, Canada Full list of author information is available at the end of the article © 2015 Favé et al. Open Access This article is distributed under the terms of the Creative Commons Attribution 4.0 International License (http://creativecommons.org/licenses/by/4.0/), which permits unrestricted use, distribution, and reproduction in any medium, provided you give appropriate credit to the original author(s) and the source, provide a link to the Creative Commons license, and indicate if changes were made. The Creative Commons Public Domain Dedication waiver (http://creativecommons. org/publicdomain/zero/1.0/) applies to the data made available in this article, unless otherwise stated.
Transcript of RESEARCH ARTICLE OpenAccess ... et al Monomorium wing...RESEARCH ARTICLE OpenAccess...

Favé et al. BMC Evolutionary Biology (2015) 15:183 DOI 10.1186/s12862-015-0448-4
RESEARCH ARTICLE Open Access
Past climate change on Sky Islands drivesnovelty in a core developmental gene networkand its phenotypeMarie-Julie Favé1, Robert A. Johnson2, Stefan Cover3, Stephan Handschuh4, Brian D. Metscher4,Gerd B. Müller4, Shyamalika Gopalan1 and Ehab Abouheif1*
Abstract
Background: A fundamental and enduring problem in evolutionary biology is to understand how populationsdifferentiate in the wild, yet little is known about what role organismal development plays in this process. Organismaldevelopment integrates environmental inputs with the action of gene regulatory networks to generate thephenotype. Core developmental gene networks have been highly conserved for millions of years across all animals,and therefore, organismal development may bias variation available for selection to work on. Biased variation mayfacilitate repeatable phenotypic responses when exposed to similar environmental inputs and ecological changes. Togain a more complete understanding of population differentiation in the wild, we integrated evolutionarydevelopmental biology with population genetics, morphology, paleoecology and ecology. This integration was madepossible by studying how populations of the ant speciesMonomorium emersoni respond to climatic and ecologicalchanges across five ‘Sky Islands’ in Arizona, which are mountain ranges separated by vast ‘seas’ of desert. Sky Islandsrepresent a replicated natural experiment allowing us to determine how repeatable is the response ofM. emersonipopulations to climate and ecological changes at the phenotypic, developmental, and gene network levels.
Results: We show that a core developmental gene network and its phenotype has kept pace with ecological andclimate change on each Sky Island over the last ∼90,000 years before present (BP). This response has produced twotypes of evolutionary change within an ant species: one type is unpredictable and contingent on the pattern ofisolation of Sky lsland populations by climate warming, resulting in slight changes in gene expression, organ growth,and morphology. The other type is predictable and deterministic, resulting in the repeated evolution of a novelwingless queen phenotype and its underlying gene network in response to habitat changes induced by climatewarming.
Conclusion: Our findings reveal dynamics of developmental gene network evolution in wild populations. This holdsimportant implications: (1) for understanding how phenotypic novelty is generated in the wild; (2) for providing apossible bridge between micro- and macroevolution; and (3) for understanding how development mediates theresponse of organisms to past, and potentially, future climate change.
*Correspondence: [email protected] of Biology, McGill University, 1205 Dr. Penfield avenue, Montréal,Québec, CanadaFull list of author information is available at the end of the article
© 2015 Favé et al. Open Access This article is distributed under the terms of the Creative Commons Attribution 4.0 InternationalLicense (http://creativecommons.org/licenses/by/4.0/), which permits unrestricted use, distribution, and reproduction in anymedium, provided you give appropriate credit to the original author(s) and the source, provide a link to the Creative Commonslicense, and indicate if changes were made. The Creative Commons Public Domain Dedication waiver (http://creativecommons.org/publicdomain/zero/1.0/) applies to the data made available in this article, unless otherwise stated.
Favé et al. BMC Evolutionary Biology (2015) 15:183 Page 2 of 21
BackgroundHow populations differentiate within species is a fun-damental problem in evolutionary biology that is keyfor uncovering the processes that generate biologi-cal diversity, including microevolution, speciation, andthe emergence of phenotypic novelty [1–6]. Tradition-ally, biologists have used the tools of population andquantitative genetics, two fields central to the modernevolutionary synthesis, to study population differentia-tion [1, 7–9]. These fields have significantly advanced ourknowledge of variation and change in the frequency ofalleles and phenotypes (quantitative and discrete) withinand between populations [10]. They have also uncoveredsignatures of natural selection and genetic drift and arebeing used to identify loci responsible for adaptive andnon-adaptive phenotypes driving the evolution of popula-tions [8, 11–14]. However, a largely unexplored dimensionof this problem is what role, if any, does organismal devel-opment play in the process of population differentiationin the wild [3, 15, 16].Organismal development integrates the action of gene
regulatory networks with environmental inputs to gener-ate the phenotype [3, 17–19], and therefore, may play a keyrole in facilitating phenotypic differentiation of popula-tions and species exposed to ecological changes [3, 17, 19].Major advances in the field of evolutionary developmen-tal biology, such as the discovery of Hox genes, haverevealed an unexpected degree of evolutionary conserva-tion of developmental regulatory genes across the animalkingdom [7, 20]. These regulatory genes, which are tran-scription factors and signalling molecules, are assembledin hierarchically organized networks [18, 20]. A primaryfunction of developmental networks is body plan for-mation [18, 20]. For example, the expression, structure,function, and regulation of the developmental genes Sonichedgehog and patched have been conserved for hun-dreds of millions of years across vertebrates and inver-tebrates [21]. Both Sonic hedgehog and its downstreamtarget patched regulate anterior/posterior patterning inthe developing limb of both fruit flies and chickens [21].The high degree of conservation and structure of devel-opmental networks suggests that these networks may biasthe variation that selection can act upon. Such bias mayfacilitate repeatable phenotypic responses when popu-lations are exposed to similar environmental inputs orencounter similar ecological changes [1, 3, 22, 23]. Herewe use an integrative approach that combines multiplelevels of organization (gene networks, development, andphenotype) as well as multiple fields (population genetics,paleoecology and ecology, morphology, and evolutionarydevelopmental biology) to gain a more complete under-standing of population differentiation in the wild.Our ability to integrate all of these levels and approaches
in a single study was made possible by using recently
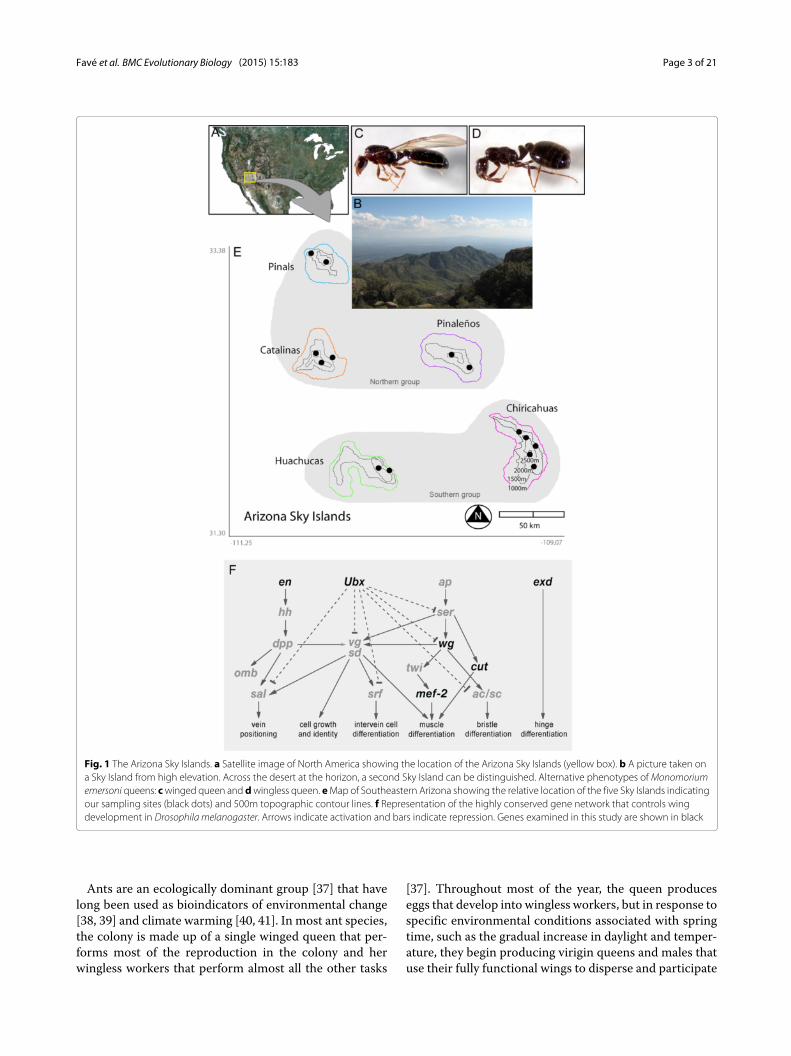
diverged populations within the ant species Monomo-rium emersoni along five ‘Sky Islands’ in Arizona. SkyIslands are a group of mountain ranges in the Amer-ican Southwest across the Arizona-Mexico border thatare isolated by large areas of deserts with limited geneticexchange between them [24, 25]. From the perspective ofthe evolutionary biologist, Sky Islands represent a repli-cated natural experiment, in which each Sky Island is anatural laboratory of high evolutionary potential. Isolationof the Sky Islands has facilitated the evolution of sev-eral endemic species: several squirrels, plants, ants, morethan 60 species of land snails, as well as many endangeredspecies that are found only in the Sky Islands of Arizona[26–29]. In essence, this archipelego of Sky Islands is com-parable to oceanic islands isolated by sea water, like thosein the Galapagos, Hawaii and the Caribbean islands [27](Fig. 1a and b).The paleoecological record of the Sky Islands is one of
the most complete records available [24, 25]. Numerousstudies have reconstructed the major ecological and cli-matic changes that have occurred in the region by usingthe stratification of pollen grains and middens of packrats in the fossil record. These studies show that dur-ing the Pleistocene glacial periods ∼90,000–20,000 yearsBP when atmospheric temperature around the regionwas substantially cooler, there was a largely continuousforest landscape connecting Sky Island mountain ranges[24, 25]. The region then began warming up between∼20,000–10,000 years BP, and atmospheric temperaturesincreased substantially, resulting in the formation of vastdeserts that isolated the Sky Islands [24, 25]. Species thatoccurred at lower elevations in the intervening valleysduring the Pleistocene glacial periods, such as Ponderosapine trees and Douglas fir, are currently only found athigh-elevations. These past climatic changes in the regionhave generally caused shifts in elevation, expansions, andcontractions of populations in numerous species [28–32].Each Sky Island is now considered to be one of the steep-est terrestrial ecological gradients in North America, fromlow-elevation deserts, through mid-elevation oak-juniperwoodlands, to high elevation coniferous forests [27]. Sev-eral ecological factors vary steeply along these altitudinalclines, in particular temperature, precipitation and habi-tat fragmentation [33–35]. Environmental changes thatwould normally be observed across a latitudinal gradientstretching thousands of kilometres can be observed acrossa few hundred meters of elevational change in the SkyIslands [26, 27, 36]. This poses a unique adaptive chal-lenge for organisms on Sky Islands that have distributionalranges that encompass more than one altitudinal zone[26, 27, 36]. These steep gradients therefore behave aspowerful sensors of climatic and environmental changesbecause noticeable changes in communities occur rapidlyand over short geographical distances [33–35].
Favé et al. BMC Evolutionary Biology (2015) 15:183 Page 3 of 21
Fig. 1 The Arizona Sky Islands. a Satellite image of North America showing the location of the Arizona Sky Islands (yellow box). b A picture taken ona Sky Island from high elevation. Across the desert at the horizon, a second Sky Island can be distinguished. Alternative phenotypes ofMonomoriumemersoni queens: cwinged queen and dwingless queen. eMap of Southeastern Arizona showing the relative location of the five Sky Islands indicatingour sampling sites (black dots) and 500m topographic contour lines. f Representation of the highly conserved gene network that controls wingdevelopment in Drosophila melanogaster. Arrows indicate activation and bars indicate repression. Genes examined in this study are shown in black
Ants are an ecologically dominant group [37] that havelong been used as bioindicators of environmental change[38, 39] and climate warming [40, 41]. In most ant species,the colony is made up of a single winged queen that per-forms most of the reproduction in the colony and herwingless workers that perform almost all the other tasks
[37]. Throughout most of the year, the queen produceseggs that develop into wingless workers, but in response tospecific environmental conditions associated with springtime, such as the gradual increase in daylight and temper-ature, they begin producing virigin queens and males thatuse their fully functional wings to disperse and participate

Favé et al. BMC Evolutionary Biology (2015) 15:183 Page 4 of 21
in mating flights away from the mother colony. Immedi-ately after these mating flights, males die while queenstear off their wings to found a new nest underground[37]. This life history strategy is known as ‘independentcolony foundation’ [42–45]. In some ant species, how-ever, an alternative life history strategy called ‘dependentcolony foundation’ has evolved [42–45]. In these species,there are multiple queens in a single ant colony in whichsome or all of the queens are wingless. Virgin queensthat are wingless mate on the ground and disperse onfoot aided and accompanied by wingless workers fromthe mother colony. This strategy dramatically decreasesmortality of wingless queens, but at the expense of longdistance dispersal. Wingless queens have evolved multipletimes independently within ants [43–45], suggesting thatwingless queens represent an adaptive life-history strat-egy. It takes less energy to produce wingless queens, andselection may favor the evolution of wingless queens inparticular ecological conditions where aerial dispersal isrisky [29, 46, 47].Colonies of the ant species M. emersoni are distributed
throughout the Sky Islands, where we discovered thepresence of two alternative queen phenotypes, wingedand wingless (Fig. 1c and d) [48]. A single M. emersonicolony can be headed by one or multiple queens, rangingfrom 1 to more than 70, and colonies can be composedeither exclusively by winged queens, exclusively by wing-less queens, or a mixture of winged and wingless queens[48]. Current evidence suggests that determination ofalternative queen phenotypes in a colony occurs duringdevelopment and can be influenced by both environmen-tal and genetic factors [43, 49, 50]. On each Sky Island,M. emersoni occurs sparsely at lower elevations, whereits abundance is very low and is associated with creekor woody patches near mountain ranges [48]. At mid-elevations of each Sky Island, from ∼1500–2300 meters,M. emersoni occurs at high densities in oak-juniper wood-lands, whereas at the highest elevations of each Sky Island,from 2300 m and above, M. emersoni occurs in patchesof high density in coniferous forests dominated by Pinyonpine and Douglas fir [48].Studying how population differentiation occurs in M.
emersoni along several naturally replicated ecological gra-dients on five Sky Islands in Arizona provides a uniqueopportunity to ask whether organismal development facil-itates repeatable, and thus, predictable responses to sim-ilar ecological and climate changes on each Sky Island.Furthermore, the interaction between ecology and organ-ismal development in the context of Sky Islands is keyfor understanding population dynamics of gene networksand its impacts on phenotypic evolution on microevolu-tionary timescales, as well as for understanding how pastchanges in developmental gene networks may affect thefuture course of evolution in response to climate change.
ResultsWe first used heat and cold shock experiments to deter-mine whether colonies of M. emersoni have respondedto the establishment of warmer conditions at the lowerlimit of their elevational range across all 5 Sky Islands dur-ing the last 10,000 years BP. We found that colonies fromwarmer sites show increased tolerance to high tempera-ture, whereas colonies from colder sites show increasedtolerance to cold temperature (Fig. 2a and b). This sug-gests that individuals in colonies of M. emersoni haveadapted to local temperature conditions along the eco-logical gradients. To determine how populations havechanged their distribution over the last 100,000 years BP(Fig. 1e, Additional file 1: Table S3), we reconstructed his-torical levels of gene flow using mitochondrial (mtDNA,CO1 and CO2) and nuclear (hymenotpaecin) sequences(Additional file 1: Table S4 and Additional file 1: FigureS1). Our coalescent (Additional file 1: Figure S1) andevolutionary (Additional file 1: Figure S2) simulationsshow a sequential model of isolation between adjacentSky Islands. A first split between southern (Huachucasand Chiricahuas) and northern (Pinaleños, Catalinas, andPinals, Fig 1e and 3a) Sky Islands occurred around 80,000years BP and was followed by the complete isolationof the 5 mountain ranges between 20,000 and 10,000years BP (Additional file 1: Table S5, Figure S1 and S2).These results indicate that some Sky Island populationsshare a more recent history than others, but were subse-quently isolated from one another during climatic warm-ing. Together, these results show that M. emersoni pop-ulations have responded directly to climate warming byadapting physiologically and modifying their distribution.We discovered two alternative queen phenotypes,
winged and wingless, which likely reflect different life his-tories (independent and dependent colony foundation)adapted to different habitats. We therefore determinedwhether the frequency of winged and wingless pheno-types changes along the ecological gradients on each SkyIsland. We found that wingless queens do indeed differ intheir frequencies along the ecological gradient (Additionalfile 1: Figure S4 and S5), suggesting that there may be aset of environmental factors that the winged and wing-less phenotypes may be adapting to on each Sky Island. Topotentially explain the distribution of winged andwinglessqueens across collection sites, we used previous litera-ture to construct 12 biological models (Table 1). Eachmodel included one or several of 5 key environmentalfactors as well as possible interactions between those fac-tors (Additional file 1: Table S1). We tested the abilityof the 12 competing models to describe the data using amodel-ranking approach [51]. Model m06, which includesthe combined effects of habitat fragmentation and ele-vation, is by far the model with the highest probability(0.58) accounting for 50% of the variability in the data

Favé et al. BMC Evolutionary Biology (2015) 15:183 Page 5 of 21
Fig. 2M. emersoni populations have adapted physiologically to the prevalent environmental conditions that were established after climate warmingbegan 10,000 years BP. a Heat shock experiment:M. emersoni workers from warmer collection sites show significantly less mortality after a one hourheatshock at 50 °C than workers from colder collection sites (R2 = 0.42, p = 0.035), indicating thatM. emersoni colonies are adapted to the localenvironmental conditions that were established after climatic warming. b Cold shock experiment:M. emersoni workers from colder collection sitesshow a significantly more rapid recovery after a 16h cold shock at 4 °C than workers from warmer collection sites (R2 = 0.46, p = 0.018)
(Table 1, Additional file 1: Table S2). Four out of the 5highest ranking models included habitat fragmentationand/or elevation as explanatory variables, bringing addi-tional support for a combined effect of these variableson the distribution of wingless queens along the ecolog-ical clines. Indeed, significant habitat fragmentation hasbeen postulated to favor the evolution of wingless queensfor short distance dispersal (dependent colony founda-tion) over winged queens for long distance dispersal(independent colony foundation), because winged queens
have increased chances of landing in an inhospitable habi-tat. These results support a scenario where climate warm-ing indirectly drove the evolution of the wingless queenphenotype through habitat changes. The paleoecologicalrecord indicates that during the last glaciation ∼90,000to 20,000 years BP forests were ubiquitous and continu-ously distributed at the lower elevations [24, 25]. Becausewinged queens occurmore frequently in low elevation andmore continuous habitats, we can infer that the ances-tral populations were likely composed of winged queens.
Fig. 3M. emersoni populations have been isolated from each other over the last 200,000 years and modern population structure reflects geography.a Simulations showing approximate timing of isolation events betweenM. emersoni populations in the Arizona Sky Islands during the last 200,000years (see also Additional file 1: Figure S2). These simulations revealed two geographical groupings of Sky Islands: North and South. b Redundancyanalysis showing that most of the mtDNA genetic variation is explained by geography (site). The Venn diagram represents the percentage of thegenetic variation that can be attributed to each factor (circles) or their combined effect (overlapping areas). This analysis supports the hypothesis ofmultiple origins of the wingless phenotype, where genetic variation is structured by geography rather than habitat, phenotype or elevation (seealso Additional file 1: Figure S3 and S4)

Favé et al. BMC Evolutionary Biology (2015) 15:183 Page 6 of 21
Table 1 A combination of landscape fragmentation and elevation best explain the distribution of wingless queens along ecologicalgradients. Based on previous studies, we generated 12 models (M01 to M12) representing alternative hypotheses to explain thevariation in frequency of wingless queens along the ecological gradient of each Sky Islands. The 12 models were ranked using themethod of [121] implemented in R (Additional file 1: Table S2) and model probabilities (Prob) are reported, with m06 scoring as thehighest ranking model
Model Formula Prob Underlying biological hypotheses
m01 Elev 0.03 Flightlessness in insects has been reported to increase with altitude [47, 127].
Elevation influences a wide range of ecological factors and may account for their jointeffects.
Atmospheric pressure is lower at higher altitude and efficient flight may require costlyadaptations [128].
m02 Temp 0.02 Insects will experience a decrease in annual thermal budget for growth and development.Critical temperature thresholds for growth, development and activity will be exceededless frequently [128].
m03 Seas 0.02 Temperature seasonality, the variability in temperature over the year, is indicative a lessstable environment. Flightless insects are known to be found in higher frequencies inmore stable habitats [47].
m04 Frag 0.11 Flying insects will have a tendency to be blown away from patchy habitats, thus onlywingless forms remain [46, 47]. The probability of finding a suitable habitat is decreasedwhen habitats are patchy, thus dispersal risk is increased [129].
m05 Prod 0.17 The need for dispersal in high productivity habitats is reduced because the conditions forsurvival are met and the relative risk of long distance dispersal becomes too high [130]
m06 Frag + Elev 0.56 Both fragmentation and elevation influence the distribution of wingless queens.
m07 Frag + Elev + Frag x Elev 0.03 The effect of fragmentation depends on elevation: fragmentation may only be affectingthe distribution of wingless queens at certain altitudes.
m08 Frag + Temp 0.03 Both fragmentation and temperature may influence the distribution of wingless queens.
m09 Frag + Temp + Frag x Temp 0.00 The effect of fragmentation depends on temperature: fragmentation may onlybe affecting the distribution of wingless queens at certaine temperature. Habitatfragmentation and temperature are know to be potentially interrelated [131] .
m10 Frag + Prod 0.02 Both fragmentation and productivity can influence the distribution of wingless queens.
m11 Frag + Prod + Frag x Prod 0.00 Habitat fragmentation can affect productivity. Fragmentation may affect wingless queendistribution in habitats with a certain productivity level only. Habitat fragmentation andbiomass growth are know to be potentially interrelated [131].
m12 Elev + Temp + Prod + Frag + Seas 0.00 Structure-rich model, including the effects of elevation, temperature, productivity,fragmentation and seasonality. Interactions were omitted.
Parameters abbreviations are Elev: elevation, Temp: temperature, Seas: seasonality, Frag: fragmentation, Prod: productivity. An (x) in the formula indicate the interactionbetween two variables
This is consistent with our finding of significant gene flowbetween all five Sky Islands ∼90,000 years BP (Additionalfile 1: Figure S1). Subsequently, wingless queens emergedwhen climatic warming drove the appearance of frag-mented high elevation habitats on each of the Sky Islands∼20,000 years BP.Our data show that emergence of the wingless queen
phenotype occurred repeatedly by parallel evolution inresponse to similar ecological conditions arising on eachof the Sky Islands during climatic warming. First, moderngene flow between mountain ranges is absent or low; thedegree of genetic differentiation (FST ) is high between col-lection sites on different Sky Islands, but is lower withina Sky Island (Additional file 1: Table S3 and S5). Second,phylogenetic and redundancy analyses based respectivelyon multilocus AFLP data and mtDNA sequences showthat M. emersoni colonized each Sky Island indepen-dently (Fig. 3b, Additional file 1: Figure S3 and S4).
We find that populations on each Sky Island containunique haplotype variants, while no shared haplotypeswere recovered among Sky Islands, indicating that uniquehaplotypes originated within each Sky Island (Additionalfile 1: Figure S3). Finally, our results show that geographydictates the patterns of genetic differentiation at neu-tral loci: winged and wingless queens from the same SkyIsland share a more recent ancestor than queens from dif-ferent Sky Islands (Additional file 1: Figure S3 and S4),and genetic variation among queens is best explained bygeography (collection site) rather than habitat or phe-notype (Fig. 3b). All together, this supports an incipi-ent process of parallel differentiation of the populationsand suggests that M. emersoni wingless queens emergedindependently on each Sky Island when each popula-tion encountered similar but newly established ecolog-ical conditions, namely, fragmented and high elevationhabitats.

Favé et al. BMC Evolutionary Biology (2015) 15:183 Page 7 of 21
In many taxa, the repeated evolution of a trait observedacross species within a genus, such as winglessness instick insects [52], Drosophila wing spots [53], or armorplate loss in freshwater sticklebacks [1], have not onlybeen generated by similar selective pressures but also byancestral developmental potentials [3, 54–56]. Develop-mental potentials are unexpressed genetic programs, suchas gene networks, or unexpressed developmental thresh-olds that determine sensitivity of these networks to spe-cific environmental conditions. Developmental potentialsare ancestral because they are often retained for millionsof years in modern groups of organisms, most probablybecause of pleiotropy [3, 57]. In ants, Rajakumar et al. [54]demonstrated that ancestral developmental potentials canbe induced by mutations or environmental perturbationsto produce ancestral phenotypic variants (anomalies) thatselection acts on to facilitate parallel evolution. We there-fore searched the literature for evidence of an ancestraldevelopmental potential to produce wingless queens inthe genusMonomorium. We found that, unlike other gen-era, a large proportion of NewWorld species (10 out of 16)in Monomorium show variable frequencies of appearanceof wingless queens (Table 2). In 5 species (M. emersoni,M.ergatogyna, M. trageri, M. viridae and in M. sp. AZ-03),queens are winged but the existence of wingless pheno-types have been reported either as anomalies (sporadicoccurrences) or alternative phenotypes (common occur-rence of both phenotypes), while in the other five species(M. compressum, M. cyaneum, M. ebeninum, M. sp. AZ-01 and M. sp. cf. ergatogyna), wingless queens appear asa fixed phenotype in the colony. The 6 remaining speciesare known to have winged queens only. The commonoccurrence of wingless queens as sporadic anomalies incolonies, as well as the evolution of species with alter-native or fixed phenotypes, indicates the existence of anancestral developmental potential to produce winglessqueens inMonomorium, which likely played a role in facil-itating the parallel evolution of the wingless queen phe-notype within M. emersoni. This developmental potentialto produce wingless queens could be unique to the genusMonomorium, or may be a more ancient feature thatfacilitated the ∼200 independent evolutionary origins ofwingless queens across ants. The ancestral developmen-tal potential to produce wingless queens may have beenco-opted from the wing polyphenism in ants - the abilityof a single genome to produce winged queens and wing-less workers in a colony in response to environmentalcues [58], just after the origin of ants. It is unlikely, how-ever, that wingless queens evolved by directly co-optingthis capacity to produce the wingless worker caste de novoduring the evolution of M. emersoni, because winglessworkers inM. emersoni interrupt wing developmentmuchearlier in development than wingless queens (Additionalfile 1: Figure S5). Collectively, our results suggest that in
Table 2 The presence of wing loss in queens inMonomoriumminimum-group species. Summary of known queen phenotypesforMonomoriumminimum-group species that are native to theUnited States and Mexico; species are listed alphabetically
Species Queen phenotypes
M. compressum Wingless a
M. cyaneum Wingless a
M. ebeninum Wingless a
M. emarginum Winged a
M. emersoni Winged and wingless c,d
M. ergatogyna Winged and wingless a,b
M. inquilinum Winged a
M.marjoriae Winged a
M.minimum Winged a
M. pergandei Winged a
M. talbotae Winged a
M. trageri Winged and wingless a
M. viride Winged and wingless a,c
M. sp. AZ-01 Wingless c,d
M. sp. AZ-03 Winged and wingless d
M. sp. cf. ergatogyna - Baja Wingless b,s
aDuBois (1986)bP.S. Ward, pers. obs.cS.P. Cover, pers. obs.dR.A. Johnson, pers. obs.
response to climatic change, selection on the phenotypicexpression of the ancestral potential for producing wing-less queens may have driven the parallel evolution of thewingless phenotype on each Sky Island.Based on this shared ancestral developmental potential
for producing wingless queens in the genus Monomo-rium, as well as the very recent history shared by M.emersoni populations, we initially predicted that similarchanges in the wing developmental system would under-lie the parallel evolution of the wingless phenotype.Wingsin holometabolous insects develop from imaginal discsthat are clusters of cells in larvae [17]. These cells alsogive rise to the flight muscles and to the wing hinge dur-ing metamorphosis [20, 59–62]. In wingless queens, wingimaginal discs appear as vestigial remnants during thelast larval instar (Additional file 1: Figure S5). We char-acterized the cell division and growth of wing imaginaldiscs and found that vestigial wing discs of wingless queenlarvae from different mountain ranges significantly differin size (Fig. 4) and levels of cell division (Fig. 4b to f).Because larvae were reared under the same experimentalconditions, these differences are a consequence of an evo-lutionary change in growth, not developmental plasticity,in wingless queens across Sky Islands. Surprisingly, wediscovered that these differences may be the consequenceof a demographic split that happened ∼80,000 years BP

Favé et al. BMC Evolutionary Biology (2015) 15:183 Page 8 of 21
Fig. 4Wingless queens from the Northern and the Southern Sky Islands show different growth patterns. a Surface area (μm2) of leg discs (x-axis)versus vestigial wing disc (y-axis) for wingless queen last instar larvae from different mountain ranges. A line was fitted through with a StandardizedMajor Axis bivariate line-fitting analysis. The slopes are significantly different from each other (p-value = 0.00017), reflecting an evolutionary changeaffecting developmental trajectories of imaginal discs among different mountains since their isolation. bWinged queen larvae shows extensive celldivision in imaginal discs in last larval instar. Wingless queen larvae from the Northern Sky Islands c Pinals and the d Catalinas show very few celldivisions in their vestigial wing discs while the Southern Sky Islands, the e Huachucas and f Chiricahuas show more. Red is PH3, green is DAPI, andyellow arrowheads indicate a cell that is expressing PH3. gMap of the Sky Islands indicating the position of Northern and Southern Sky Islands. hGraph of the number of dividing cells per unit area in vestigial discs of wingless queen larva from different Sky Islands. The x-axis shows the differentmountain ranges and the y-axis the number of cells dividing per (μm2). The number of dividing cells per unit area in vestigial wing discs differsbetween Northern and Southern Sky Islands (ANOVA, p <0.0001). Thus, the vestigial wing discs of queens from Southern Sky Islands showsignificantly higher levels of cell division and are larger than vestigial wing discs of queens from Northern Sky Islands

Favé et al. BMC Evolutionary Biology (2015) 15:183 Page 9 of 21
between the northern (Catalinas and the Pinals) and thesouthern (Huachucas and the Chiricahuas) Sky Islands(Figs. 1e, 3a and 4g). Wingless queens from northern SkyIslands possess smaller discs and low levels of cell division(Fig. 4h), whereas those from the southern Sky Islandspossess large imaginal discs and high levels of cell divi-sion. This association suggests that demographic eventsdrove the evolution of novel variations in wing disc growthacrossM. emersoni populations.Wing discs express a gene network that controls growth
and patterning of wings (Fig. 1f), of wing muscles, and ofthe wing hinge (Fig. 7, last column), and has been highlyconserved across holometabolous insects for approxi-mately 325 million years [20, 63–66]. In ants, the expres-sion of this network is conserved in winged queens andmales but is interrupted at specific points in the networkin wingless workers [63]. These points of interruptionin wingless workers are spatiotemporally associated withpatterns of apoptosis in the vestigial wing disc [65]. Wetherefore determined whether points of interruption inthis network in wingless queens has evolved in parallelor whether it differs between Sky Island populations. Toconfirm that expression of genes in this network is con-served inM. emersoni winged queens, we selected 6 geneswithin this network (Fig. 1f), including 4 genes involvedin patterning wing tissue (engrailed [en], Ultrabithorax[ubx], cut [cut], wingless [wg]), one gene involved in wingmuscle precursor development (myosin enhancer factor 2[mef2]), and one gene involved in wing hinge development(extradenticle [exd]). In winged queens, the expressionof these genes is similar to those in the wing discs ofDrosophila [20, 59–61] and winged queens and males ofother ant species [63, 67] (Fig. 5b, c, and d, Fig. 6b, Fig. 7band Additional file 1: Figure S6B), indicating that thisnetwork is conserved.We then determined whether the expression of these
genes has been interrupted in wingless queens, and foundthat their expression is altered relative to winged queens(Figs. 5, 6 and 7 and Additional file 1: Figure S6). Inwingless queens from different Sky Islands, we foundthat the 4 genes involved in wing tissue patterning (ubx,en, cut, wg) show similar aberrant patterns of expression(Fig. 5e to t and Additional file 1: Figure S6C to H). Theseshared alterations reveal that wingless queens, regardlessof their geographic origin and extent of vestigial wing discgrowth (Fig. 4a), interrupt wing patterning at least in partthrough similar changes in gene expression. Therefore,although organ growth retains the signature of histori-cal events caused by past demographic changes, alterationof the underlying expression of wing patterning genes isrecurrent among populations on each Sky Island.In contrast to genes involved in wing patterning, we
observed that the expression of mef2 - a key transcrip-tion factor involved in wing muscle development [61] -
differs among populations and shows a signature of thedemographic split between the southern and the north-ern Sky Islands. Mef2, which is expressed in the nuclei ofmyoblasts and appears as a dotted pattern in wing discs,shows expression differences between wingless queensfrom northern and southern Sky Islands (Fig. 6f and jversus N and R, and Additional file 1: Figure S7). In thenorthern Sky Islands, Mef2 expression is restricted to theouter edge of the vestigial disc in wingless queens, whereasin the southern Sky Islands, it is expressed more exten-sively and covers the central region of vestigial discs. Thus,like patterns of wing disc growth (Fig. 4h), Mef2 expres-sion patterns precisely recapitulate the history of contactsbetween Sky Islands. Furthermore, these differences in thepattern ofMef2 expression in vestigial wing discs are likelyto have evolved neutrally because wingless queens lackflight muscles regardless of their origin (Fig. 6g, h, k, l, o,p, s and t). This suggests that another mechanism, such asthe interruption of other genes in the network or apopto-sis of myoblasts [65], prevents mef2 expressing cells fromfurther differentiating into flight muscles.Finally, we found that exd - a gene known to be respon-
sible for wing hinge development [20] - shows highlydistinct expression patterns among wingless queens fromdifferent Sky Islands (Fig. 7b, e, h, k, and n) that cor-respond to fine differences in wing hinge morphology(Fig. 7c, f, i, l, and o). In wingless queens coming from thesame Sky Island, the aberrant pattern of Exd expression isthe same across individuals (Additional file 1: Figure S8).However, in wingless queens from the Pinals (north)and the Chiricahuas (south), Exd is expressed over theentire vestigial disc and adults have a prominent vestigialfore- and hindwing hinges, whereas in wingless queensfrom the Catalinas (north) and Huachucas (south), Exd isonly expressed in the anterior edge of vestigial discs andadults have a prominent vestigial hindwing hinge but theforewing hinge is absent or dramatically reduced in size(Fig. 7 and Additional file 1: Table S6). These observed dif-ferences within northern (Pinals and Catalinas) andwithinsouthern (Chiricahuas and Huachucas) Sky Islands indi-cate that these differences arose following the completeisolation of the five Sky Island populations ∼10,000 yearsBP and are therefore an indirect consequence of climaticwarming (Fig. 8).
DiscussionA paleoecological reconstruction for the parallel evolutionof a developmental network and its phenotype in responseto past climate change on Sky IslandsWe have provided evidence for the following scenario,which shows that in response to both direct and indi-rect effects of past climate change on Sky Islands, adevelopmental gene network and its corresponding phe-notype can respond to changing ecological conditions

Favé et al. BMC Evolutionary Biology (2015) 15:183 Page 10 of 21
Fig. 5 Expression profiles of cut, Ubx, and en in vestigial discs of wingless queens from different Sky Islands show similar expression patterns. Panelsin the left column a, e, i,m, and q represent diagrams of expression patterns of Cut (blue), Ubx (violet) and En (pink). From left to right, columnsshow gene expression profiles (purple) of Cut (b, f, j, n, r), Ubx c, g, k, o, s, and En (d, h, l, p, t) in winged queens and wingless queens across four SkyIslands. Black arrowheads point to vestigial discs and asterisks indicate an absence of expression in the vestigial wing discs. Insets show forewingdiscs at higher magnification
on short time scales (Fig. 8): Paleoecological reconstruc-tions of the Arizona Sky Islands [24, 25] show that dur-ing the last glaciation between about 90,000 to 20,000years BP, a continuous forest habitat across the land-scape prevailed, except for high elevations which wereinhospitable alpine habitats. The developmental potentialto produce wingless queens in M. emersoni was presentduring this period. During or immediately following thevicariant event ∼80,000 years BP causing the demo-graphic split between northern and southern Sky Islands,these M. emersoni populations accumulated unexpressed
differences in the genes that control wing growth andflight muscle development. Subsequently, during climaticwarming ∼10,000 years BP, the landscape became frag-mented and new habitats arose at high elevations thatwere suitable for colonization byM. emersoni. As popula-tions encountered these new habitats on each of the SkyIslands, the wingless phenotype evolved independentlyand became more frequent through selection on the phe-notypic expression of the developmental potential for pro-ducing wingless queens. The parallel evolution of winglessqueens on each Sky Island occurred through recurrent

Favé et al. BMC Evolutionary Biology (2015) 15:183 Page 11 of 21
Fig. 6Wingless queen larvae develop wing muscle precursors, but lack flight muscles entirely. Panels on the left column (a, e, i,m, q) representdiagrams of Mef-2 expression. Mef-2 expression in larval myoblasts is shown as a localized stain in nuclei of myoblasts associated with the imaginaldiscs b, f, j, n, and r. Details on Mef-2 expression are given in Additional file 1: Figure S7. Inserts show forewing discs at higher magnification. Dashedlines on Mef2 expression patterns highlight the vestigial disc boundaries based on DAPI staining. Virtual sections (microCT) through the thorax (lasttwo columns) showing the internal anatomy of a winged queen (top row) and wingless queens from all Sky Islands. c, g, k, o, and s show transversesections and d, h, l, p, and t show sagittal sections. Longitudinal muscles are artificially colored in pink and dorso-ventral muscles in blue. Winglessqueens from all Sky Islands show a complete absence of indirect flight muscles. These results show that, regardless of their origin, wingless queensdo not develop the main flight muscles
interruptions of similar wing-patterning genes in the net-work (ubx, en, cut, wg), and at the same time, inducedthe release of the unexpressed differences in vestigial winggrowth and mef-2 expression that accumulated in popu-lations during or after the demographic split between the
northern and southern Sky Islands ∼80,000 years BP. Cli-mate warming during the last ∼10,000 years BP formedvast deserts between Sky Islands thereby isolating the fiveSky Island populations from one another and forced M.emersoni populations to adapt physiologically to the warm

Favé et al. BMC Evolutionary Biology (2015) 15:183 Page 12 of 21
Fig. 7 The variation in Exd expression pattern across Sky Islands corresponds to changes of fine details in thorax morphology of wingless queens.Panels on the left column (a, d, g, j,m) represent diagrams of Exd expression. Exd expression in winged queens b and wingless queens e, h, k, andn. Black arrowheads point to Exd expression in imaginal discs. Insets show a close-up of Exd expression in the vestigial imaginal discs. 3D X-raymicrotomography thoracic morphology of a winged queen c and wingless queens from Pinals f, Catalinas i, Huachucas l, and Chiricahuas o SkyIslands. Insets show a close-up of the wing hinge region. Yellow brackets indicate vestigial forewing hinge and yellow arrowheads indicateoutgrowths of the hindwing hinge. Note that the vestigial forewing hinge in f and o is prominent with two distinct outgrowths, while it is reducedin i, l with only one prominent outgrowth. The vestigial hindwing hinge is present in all populations

Favé et al. BMC Evolutionary Biology (2015) 15:183 Page 13 of 21
Fig. 8 Summary of climatic changes, population history, wingless phenotype evolution and the associated changes in developmental systems inM.emersoni. The population tree represents the history of contacts during the last 200,000 years. Ancestral potential for wing loss (grey ant profile).Climatic changes are depicted in the bar on the left, with the associated changes in the habitats in different colors (green: largely continuouslandscape, yellow: fragmented landscape). Changes in the vestigial disc growth, wing hinge morphology, wing muscles and in expression patternsof genes responsible for wing, wing hinge and wing muscle development are depicted by symbols on the tree. Gene expression on vestigial discs isdepicted by purple (Exd), dotted green (Mef2) or black (wing patterning genes: Ubx, En, Cut and wg). Changes in cell division are depicted by thered dots
conditions at the lower elevations of their range. This mayhave led to the rapid evolution of the vestigial wing hingeand its underlying exd expression on each Sky Island.
Novelty as a mosaic of contingency and determinismWe show that developmental systems can facilitate twotypes of evolutionary change that contribute to the dif-ferentiation of populations within a species: one that isgoverned by chance events, is unpredictable, and hasproduced small differences in phenotype and genotype:wing hinge morphology, wing disc growth and expres-sion of exd and mef-2. In contrast, the other type isrepeatable and has produced large differences in pheno-type and genotype: the wingless queen. The evolution ofwingless queens represents an evolutionary novelty - itis the gain of a developmental switch, the complete loss
of wings and wing muscles, multiple alterations in theexpression of the core developmental network underly-ing wing development, and the gain of a new life historystrategy (dependent colony foundation). These findingsoffer a new perspective for the ongoing discussion of nov-elty generation in phenotypic evolution [68]. On the onehand, it has been argued that adaptive solutions throughnatural selection are deterministic and that evolution islargely predictable [69], while on the other, it has beenargued that historical contingency, which is the uniquechain of prior events that determine which of severalevolution paths a lineage will follow, renders evolutionunpredictable [70]. Several studies, from a phylogeneti-cally diverse array of organisms, show that the parallelevolution of phenotypic traits often occurs through recur-rent alterations in the same genes [12, 23, 71–74]. Yet, at

Favé et al. BMC Evolutionary Biology (2015) 15:183 Page 14 of 21
the same time, these and other studies report slight dif-ferences across multiple levels of biological organization:phenotype, development, and genetics [75–77]. In vitrostudies on microbial populations suggest that these simi-larities and differences underlying the parallel evolution oftraits are the consequence of a complex interplay betweendeterministic processes and historical events [78–80]. Weshow, in natural populations within a species, that theemergence of novelty at multiple biological levels can begenerated by the combination of ancestral developmen-tal potentials facilitating parallel evolution in responseto similar ecological conditions and chance events thatcreate slight variations on these repeatable evolutionarynovelties.A mosaic of contingent and deterministic processes at
multiple biological levels may be a general property of theevolution of novelty. Most, if not all, organisms experi-ence similar population dynamics over evolutionary timeand parallel evolution within and between species is anearly universal pattern throughout the tree of life [69, 81].Many independently evolved traits, such as, pigmentationspots on Drosophila wings [53, 82], pharyngeal jaws ofcichlid fish [83], hind limbs of anoles lizards [84], coatcolor of wild mice [85], and coloration on butterfly wings[86], exhibit patterns consistent with our findings in thatthey show slight variations in phenotype and genotype.Our results suggest that these slight variations are gen-erated by microevolutionary forces and historical con-tingency acting between populations, together causingthe gradual accumulation and evolution of unexpressedchanges in regulatory pathways. These unexpressed dif-ferences become expressed during the process of parallelevolution leading to novel variations on independentlyevolved traits. This process driving parallel phenotypicnovelty within species may translate into parallel pheno-typic novelty between species, and as in the case pharyn-geal jaws of cichlid fish [83], slight variations accumulatedin one of the lineages may potentially fuel phenotypicdiversification.
Implications for bridging Micro- and MacroevolutionOne of the biggest challenges facing evolutionary theorytoday is to explain how microevolution translates intomacroevolution. Evolutionary biologists have addressedthis problem from the perspective of paleontology [6, 87],population and quantitative genetics [88], and evolu-tionary developmental biology [16, 89, 90], producinga range of different perspectives on the translationbetween micro- and macroevolution. One perspective,which took hold during the neo-Darwinian synthesis inthe 1940’s, proposes no distinction micro- and macroevo-lution, where macroevolution is simply the product ofa specific kind of microevolution (mutations of smalleffect, individual level selection and drift) extrapolated
over long temporal scales [88]. This perspective, how-ever, is not well supported in the face of recent advancesin quantitative genetics [8, 91], experimental evolution[92], developmental plasticity [3] and paleontology [93].These recent advances show that: (1) dynamics of evo-lutionary change observed between individuals withinpopulations cannot be extrapolated to explain the dynam-ics of change observed between species within clades[87, 93]; and (2) alleles of large effect [8, 91] and largediscrete phenotypic variants [3, 54, 94] can be fixed inpopulations. Indeed, most modern textbooks of evolu-tion now distinguish micro- frommacroevolution and usethe species boundary as the dividing line between them,most often defining microevolution as ‘evolution belowthe species level’ - small changes, adaptive or neutral, thatarise within populations, while macroevolution is mostoften defined as ‘evolution above the species level’ - largechanges that arise within populations leading to the ori-gin of species or higher taxonomic groups [2, 95–98].Although all changes must necessarily arise within pop-ulations, macroevolutionary changes are thought to ariseduring or after populations have undergone speciation,and therefore, characterize differences observed betweenclosely-related species or higher taxonomic groups [3, 93].Our findings, however, suggest that the species bound-
ary may not adequately separate micro- and macroevo-lutionary changes. We observed macroevolution-likechange (emergence of wingless queens) between popu-lations within the same species (M. emersoni), which iscomparable to the variation observed between speciesin the genus Monomorium (Table 2). Our observa-tions are consistent with an idea known as ‘intraspe-cific macroevolution’, which proposes that micro- andmacroevolution are distinct, but that speciation is notthe primary cause of large phenotypic changes betweenspecies leading to macroevolution [3]. It proposes thatboth small and large phenotypic changes occur withinthe same species, and that the existence of alternativephenotypes within lineages facilitates macroevolution byreducing the negative fitness consequences associatedwith the appearance and fixation of large phenotypicvariants [3].Finally, it has been proposed that changes in hierar-
chically organized developmental networks can simul-taneously produce the large- and small-scale changesassociated with macro- and microevolution [99, 100].Genes in the network involved in core developmental pro-cesses (‘kernels’ sensu Davidson, [18]), such as body planformation, are thought to produce large-scale variantswhen changed, be highly stable during evolution, and areassociated with macroevolution. In contrast, genes in thenetwork involved in terminal differentiation processes,like pigment formation, are expected to produce small-scale variants, be more labile during evolution, and are

Favé et al. BMC Evolutionary Biology (2015) 15:183 Page 15 of 21
associated with microevolution [99, 100]. Our results areconsistent but show that the core developmental networkresponsible for wing formation facilitates the evolutionof both types of changes within a species in response toecological change. Based on all of our findings, we pro-pose that the parallel phenotypic novelty within speciesmay translate into parallel phenotypic novelty betweenspecies providing a possible bridge between micro- andmacroevolution.
The role of organismal development in past and futureclimate changeUnderstanding how developmental systems respond topast climate change is critical to facing the challenges ofglobal warming over the next few decades. Integratingthe responses of developmental systems with environ-mental changes will be necessary for building accurateprojection models to predict species distributions underclimatic change scenarios. Predicting species distributionsaccurately can affect decision making about conservationbiology strategies, agriculture and public health issues.Current projection models integrate demographic pro-cesses such as migration and population size changes,but few integrate the possible response of developmen-tal systems to environmental changes, which as we show,may profoundly affect the life history and dispersion abil-ities of a species. Ultimately, such changes directly orindirectly affect species interactions and ecosystem pro-cesses [101]. Sky Island mountain forests have been usedas models and indicators of climate change. They haveresponded to past [24] and present [36] global warm-ing by contracting towards the higher elevations [35],and climatic and ecological models predict that warm-ing and desertification in Arizona will continue over thenext 50 years [33, 34, 102]. Several species found in themountainous areas of the American Southwest alreadyshow signs of changes in phenology in response to recentglobal warming [103, 104]. These dramatic changes inenvironmental conditions will be integrated by the devel-opmental systems of different organisms, and as we show,can generate both predictable and unpredictable pheno-typic responses. Generally integrating the predictable partof the response of developmental systems into climatechange studies should hold the promise of making moreaccurate predictions for organismal responses to climatechange.
ConclusionSince the modern synthesis, our view of how populationdifferentiation occurs in the wild is largely based on theadvances made in population and quantitative genetics,especially with the advent and integration of genomicstools. This view is one of changes in allele and phenotypicfrequencies in response to adaptive and non-adaptive
forces. By integrating organismal development and pale-oecology on Sky Islands, we enrich this view by showingthat the emergence of novelty within populations occursthrough a combination contingent and deterministic pro-cesses. This combination results in the parallel evolutionof traits with slight variations at multiple levels of bio-logical organization (phenotype, growth, developmentalnetworks). We propose that this parallel phenotypic nov-elty within the species may represent the springboardsfor translation into macroevolutionary changes betweenspecies. Studying these evolutionary processes on the SkyIslands, with their rich fauna provides replicated ecologi-cal gradients, are a good model system for understandinghow development influences an organism’s response topast and future climate change.
Materials andmethodsAnimal collection and culturingWe discovered the M. emersoni wingless phenotype inthe Chiricahuas mountain range in 1999. We found thatthis wingless phenotype exists on four other Sky Islandmountains in Southeastern Arizona, USA and we col-lected colonies from 14 sites (Additional file 1: Table S3).We preserved colonies in 95% ethanol or kept them alivein plastic boxes with glass test tubes filled with water con-strained by a cotton plug. We fed colonies with a mix ofcrickets, mealworms and Bhatkar-Whitcomb diet [105].The colonies were maintained at 27 °C and 70% humiditywith a day/night cycle of 12 hours. We induced produc-tion of winged and wingless queens by exposing them to acycle of temperature range: the temperature of the growthchamber was reduced by 1 °C for 17 days until is reached10 °C. We kept the chamber at 10 °C for 2 weeks, and thenincreased the temperature gradually by 1 °C per day for 17days until the original conditions were restored.
Statistical analysesWe performed all statistical analyses using R, unless oth-erwise stated.
Inferringmodern and historical population demographySequencing and genotyping We extracted DNA from318 M.emersoni queens, each from a different colony,using thoracic tissue from preserved individuals inethanol. We amplified by PCR two mitochondrialgenes (cytochrome oxidase 1 (CO1) and 2(CO2)), andsequenced them in both directions on an ABI3730 (forprimers, see [106]) for a total of 1350 base pairs (bp) for70 individuals. We also amplified and sequenced 1020 bpfrom a nuclear gene, hymenoptaecin, including one intron.For each Sky Island, we isolated alleles from hymenop-taecin to create a pool of DNA for each Sky Island by mix-ing DNA from about 20 queens from different colonies.This method has been shown to be accurate to estimate

Favé et al. BMC Evolutionary Biology (2015) 15:183 Page 16 of 21
allele frequencies of a population [107, 108]. We ampli-fied all alleles in the DNA pool simultaneously by PCR andcloned them into a PGEM-T vector. We picked 15 bac-terial clones per mountain and we sequenced them withM13 primers in both directions. This allowed us to obtainthe exact haplotype phase for every nuclear allele sampledand sequenced. All sequences were assembled and alignedwith Geneious Pro V.5.4.3 and checked by eye. GenBankaccession numbers are KT356282-KT356545.We also genotyped all individuals for Amplified
Fragment Length Polymorphisms (AFLP) markers, asdescribed in [109]. We used 4 primer combinations togenerate 157 unambiguous loci: MCTA and EACC , MCTAand EACG, MCAG and EACC , and MCAG and EACG. We ranthe PCR products on a LiCor DNA analyser 4300 andthe same researcher scored them blindly using the accom-panying Saga software. To estimate the error rate in theprocedure, about 10% of the samples were amplified andscored twice, and we recovered a similar error rate to whathas been reported in other studies [110].
Estimation of modern gene flow We estimated FST val-ues with the Bayesian method developed by [111] andimplemented in AFLP-surv [112]. We removed from theanalysis sites where we collected less than 15 individualqueens from different colonies. P-values for the signifi-cance of each FST were estimated after applying Bonefer-roni corrections for multiple comparisons. Pairwise FSTestimates for all 14 sites are reported in Additional file 1:Table S5. Stars represent parameters that could not beestimated with confidence. To test for the presence ofrecent gene flow, we performed a Mantel test [113] tocalculate the correlation between the three-dimensionalgeographic distance and the genetic differentiation (FSTestimates) for all pairwise comparisons among sites. Weexpected a significant correlation to occur if restrictedbut non-zero gene flow existed among Sky Islands, or ifSky Islands diverged recently from a continuous ances-tral population without recent gene flow. On the otherhand, we expected a non-significant correlation for thetwo following demographic scenarios: a complete pan-mixia among most sites, or a highly reduced gene flow fora long time among most sites. We tested the Mantel coef-ficient for significance using 10,000 random permutationson the matrices.
Estimation of historicalgeneflowand times of divergenceWe used the Bayesian search strategy implemented inMIGRATE-n 3.2.15 [114] to estimate the effective pop-ulation sizes, the average historical migration rates, thehistorical migration rates and the coalescence times foreach population. We also evaluated 2 models of pop-ulation subdivision by comparing their marginal like-lihoods using the modified thermodynamic integration
(TH) implemented in MIGRATE-n [115]. The first modelconsidered all sampling sites as part of one panmictic unitwhile the second model considered each mountain rangeas independent units (limited or absence of gene flow).Each MIGRATE-n run consisted of 10 replicates of 4MCMC heated short chains (heating scheme: 1.0, 1.2, 3.0,6.0) and one long chain of 5,000,000 sampled trees where500,000 burn-in trees were discarded to ensure propersampling of the parameter space. All parameter esti-mates showed narrow posterior probability distributions,indicating high confidence in the estimates. All compar-isons involving the Chiricahuas as the sending populationshow clear outlier values and were thus not considered.� values from the haploid and maternally-transmittedmitochondrial loci were corrected for comparison witha diploid locus to obtain an estimate of 4Neμ. We usedthe direct estimate of mtDNA mutation rate calculatedby [116] and the immune gene mutation rate estimate inDrosophila from [117] to calculate migration rates andtimes of divergence. MIGRATE-n also implements theSkyline plot method for detecting changes in migrationrates over time, thus allowing the reconstruction of his-torical migrant exchanges between mountain ranges. Theanalysis was run separately for each pair of geographi-cally adjacent mountain ranges (Chiricahuas-Huachucas,Huachucas-Catalinas, Catalinas-Pinals, Pinals-Pinaleñosand Pinaleños-Chiricahuas) with the same run parametersas described above.
Testing for competing evolutionary scenarios of populationsplits We used Approximate Bayesian Computationimplemented in the program DIYABC v.1.0.4.45 beta[118] to test competing hypotheses of lineage divergence.Instead of estimating the likelihood of a model from anMCMC approach, DIYABC uses approximate Bayesiancomputation [119], where similarity of summary statisticsbetween observed and simulated data sets are compared.Data can be simulated for several scenarios, where pop-ulation sizes, times of divergence, population size changeand admixture can be specifically defined.In order to focus on testing the most probable scenar-
ios, we built up our hypotheses based on the results of theSkyline plot analysis from MIGRATE-n (Additional file 1:Table S4 and Additional file 1: Figure S1). We comparedthree divergence scenarios; (A) a simultaneous isolation ofthe five mountain ranges from a common ancestor, (B) asequential divergence of Sky Islands based on the resultsof the Skyline plot analysis using as priors the estimatedtimes where no more gene flow is observed between twoSky Islands, and (C) a third scenario based on scenario B,but with the Huachucas and the Catalinas interchangedon the topology, thereby affecting the relationships withinthe Southern and Northern Sky Islands (Additional file 1:Figure S2).

Favé et al. BMC Evolutionary Biology (2015) 15:183 Page 17 of 21
The prior probability uniform distribution on the old-est divergence event (t4) ranged from 10,000 to 200,000generations in the past and the prior probability uni-form distribution on the effective population (Ne) sizeranged from 1000 to 200,000 (coherent with MIGRATE-n estimates of Ne). The sequence of subsequent splitswas forced to be kept in this specific order when sim-ulating the data and the time interval prior probabilitydistribution for each of these respective splits were t4=1to 50,000, t3=10,000 to 70,000, t2=25,000 to 100,000 andt1=10,000 to 200,000 generations in the past. The prior onNe was kept constant through time and was sampled froma uniform distribution ranging from 1000–100,000. Mostimportantly, three conditions were imposed for the sam-pling of parameters for the population splitting to occur inthe specified order: t1≥ t2, t2≥ t3 and t3≥ t4. 300,000 sim-ulations were performed and the direct estimate methodwas used to estimate the posterior probabilities of eachscenario.
Parallel evolution of M.emersoni populationsInferring mitochondrial haplotype network To getinsight about whether the wingless phenotype evolvedrepeatedly in parallel or has a single origin, we first inferedgenealogical realtionships among queen haplotypes acrossthe Sky Islands populations. A mitochondrial DNA net-work was constructed using the R package ape. Divergenthaplotypes (12 and 20 steps away from the central hap-lotype were discovered in the Chiricahuas but left outof the analysis for simplicity of the representation of thenetwork.
Neighbor-joining tree A neighbor-joining tree was con-structed using AFLP data with the phylogenetic packagePhylip [120]. The tree was constructed using sequentiallythe executablesGenedist,Neighbor, Seqboot,Consense andDrawtree. Bootstrap values over 70 are reported on thetree.
Redundancy analyses We first calculated the pairwisemtDNA genetic distance between each pairs of queensand performed a multidimensional scaling to obtain aset of synthetic variables that best represented the pair-wise distances between records. To quantify habitat typein a discrete manner, we performed a principal com-ponent analysis using all environmental variables on allcollection sites, assigning a habitat type (1 to 5) tosites with high similarity. We built three explanatorymatrices: collection site, phenotype (winged or wing-less) and environment (habitat type). We partitionedthe variation in genetic distance with respect to thethree explanatory matrices using a redundancy analysisordination.
Adaptation to climatic changesTests for temperature tolerance Heat resistance ofworker ants was measured using a knockdown assay.About 20 individuals workers were collected from insidethe nest of each colony, placed into 8 mL glass vials, andincubated at 50 °C for one hour into a hybridization oven.Resistance was scored for each ant as the time taken to beknock down and mortality after treatment was recordedfor each sample. Cold resistance was evaluated as recov-ery from a chill coma. About 20 individuals workers werecollected from inside the nest of each colony, placed intosmall petri dishes, and immersed for 16 hours into abox filled with ice and water. This treatment led to rapidimmobilization of all individuals. The temperature waskept constant around 4 °C. Petri dishes were then exposedto ambient temperature and recovery was scored for eachworker as the time taken for muscular coordination tocome back.
Environmental factors the winged andwingless phenotypesmay be adapting to along the ecological gradientsExplanatory variables for queen phenotype distributionWe calculated the percentage of wingless queens presentat each site. This value represents the proportion ofwingless queens that were successful in founding or per-sisting in a colony, and thus, have survived the disper-sal/founding selection period. For each site, we measuredthe latitude and elevation in the field, and we obtainedclimatic variables from WorldClim Atlas and the veg-etational growth average and vegetational growth peakwere obtained from the National Atlas (Additional file 1:Table S1). The Worldclim Atlas and the National Atlasdata have a 1 km2 resolution, which is, from our obser-vations, of the same magnitude as the area of our averagesampling sites.We performed an information-theoretic approach to
evaluate the performance of 12 models explaining the fre-quency distribution of winged and wingless queens alongthe ecological gradients. This approach, widely used inecology, does not reject or accept models, but rather ranksa priori models and provides posterior probabilities thatallow for the interpretation of the performance of eachmodel. Using the findings of previous studies in the lit-erature, we constructed 10 biologically plausible modelsthat could explain which ecological factor(s) have themostinfluence on distribution of wingless queens along theecological gradients. We used the method and R code of[121] to fit and rank models: we fitted models using the Rfunction lm, and we calculated the sample-size correctedAkaike Information Criterion (AICc) for each model. Wecontrolled for population differentiation using the score ofthe first component from a principal component analysison the mtDNA pairwise genetic distances among all indi-vidual queens. We ranked the models based on AICc and

Favé et al. BMC Evolutionary Biology (2015) 15:183 Page 18 of 21
calculated their posterior and conditional probabilities forfurther interpretation.
Interruptions of the gene network controlling wingdevelopmentSample collection We collected queen larvae at late lastlarval instar, just prior to the prepupal stage, following thecriteria of [122]. We fixed larvae for 2h in a 4% formalde-hyde solution in PEM buffer [123], and dissected themunder a Zeiss Discovery V12 Stereomicroscope to exposetheir thoracic imaginal discs by removing obstructive tis-sues.
Wing imaginal disc morphology and cell division Wecalculated surface area of the forewing imaginal disc andof a leg imaginal disc (in μm2) using AxioVision software(Carl Zeiss Canada Ltd., Toronto, Ontario, Canada). Forall samples that were undamaged we counted the numberof Phosphohistone expressing cells in the forewing imag-inal disc from a z-stack image. To test for a differencein static allometry of leg and wing disc among popula-tions, we performed a Standardized Major Axis bivariateline-fitting analysis (SAM) and tested for slope differences[124] (Additional file 1: Figure S6A). We also performedan analysis of variance on the number of cells undergoingmitosis per wing disc unit area for each population (Fig. 4).
Expression patterns of genes of the wing patterningnetwork Immunohistochemistry: we performed antibodystainings for Engrailed (En), Ultrabithorax (Ubx), Cut(Cut) and Extradenticle (Exd) proteins following the pro-tocol of [123]. Antibody stainings for Myosin enhancingfactor-2 (Mef2) and Phosphohistone-3 (PH3) were con-ducted similarly, except that the tissues were treated withPAT 1% instead of PTW 1% to increase the antibody pen-etration in the tissue. We systematically included wingedqueen larvae in each staining reaction containing winglessqueen larvae as positive controls and we over developedthe staining reaction for larvae of both winged and wing-less queens to confirm that the absence of expression wasreal and not an artifact. We imaged the stained tissueswith a Zeiss microscope using the AxioVision software.Expression of genes in the network that controls wingdevelopment is highly conserved across winged castes ofants [63, 65]. Nonetheless, we confirm that winged queensfrom several collection sites do not show any expressiondifferences (data not shown).Whole mount in-situ hybridization: We isolated a frag-
ment of the gene wingless by PCR using the primers of[63] on cDNA synthesized from embryonic and larvalRNA. We cloned and sequenced this fragment to confirmits identity. Genbank accession number is KT361189. Wefollowed the whole mount in-situ protocol from [125].
3D X-ray microtomography In order to describe inmore detail the differences in external and internalanatomy of the thorax, we made 3D X-ray microtomog-raphy images (microCT scans) of winged queens and11 wingless queens of different geographic origins. Antswere stained with elemental iodine (1% w/v in abso-lute ethanol) to enhance the X-ray contrast of the softtissues [126]. The scans were performed on an XradiaMicroCT 3D imaging system with voxel sizes between 1.8and 4.2 μm. We examined sagittal, coronal, and trans-verse sections for the presence of direct and indirect flightmuscles. We applied a surface rendering algorithm usingOsiriX to visualize the 3D reconstruction of the externalanatomy of the thorax.
Data availabilityThe population sets of DNA sequences generated inthis study are available on GenBank (accession numbersKT356282-KT356545). Other data used in this study areavailable upon request to the authors.
Additional file
Additional file 1: Supplementary figures and tables. This files includessupplementary tables and figures to the main manuscript. (PDF 4085kb)
Competing interestsThe authors declare that they have no competing interests.
Author’s contributionsMJF designed the study, performed field sampling and laboratory work,collected the data, performed the analyses and wrote the manuscript. RAJprovided samples and field assistance. SC provided field assistance anddiscovered the species. SH, BDM and GBM performed the CT-scan analyses.GBM contributed substantially to revisions. SG performed genetic analyses. EAdesigned the study, performed field sampling and wrote the manuscript. Allauthors read and approved the final manuscript.
AcknowledgementsWe thank J. Losos, G. Wray, R. Barrett, T. Sanger, Y. Idaghdour, M.B. Dijkstra, A.P.Hendry, L. Nilson, J-P. Lessard, A. Gonzalez, J. Marcus, K Chaudhary, andAbouheif Lab members for comments. We also thank E. Furlong for theanti-mef2 antibody and R. Keller for technical advice. This work was supportedby grants from Fonds de la Recherche du Québec - Nature et Technologies,Canada Research Chairs program, and National Sciences and EngineeringResearch Council (NSERC) to E.A., NSERC postgraduate scholarship to M-J.F.
Author details1Department of Biology, McGill University, 1205 Dr. Penfield avenue, Montréal,Québec, Canada. 2School of Life Sciences, Arizona State University, AZ85287-4501 Tempe, USA. 3Museum of Comparative Zoology, HarvardUniversity, 26 Oxford Street, MA 02138 Cambridge, USA. 4Department ofTheoretical Biology, University of Vienna, Althanstrasse 14, 1090 Vienna, Austria.
Received: 13 July 2015 Accepted: 6 August 2015
References1. Schluter D, Nagel L. Parallel speciation by natural selection. American
Naturalist. 1995;146:292–301.2. Futuyma DJ. Evolutionary Biology: Sinauer; 1998.3. Eberhard MJW. Developmental Plasticity and Evolution. New-York:
Oxford University Press; 2003.
Favé et al. BMC Evolutionary Biology (2015) 15:183 Page 19 of 21
4. Darwin C. On the Origins of Species by Means of Natural Selection.London: Murray; 1859.
5. Mayr E. Systematics and the Origin of Species, from the Viewpoint of aZoologist: Harvard University Press; 1942.
6. Gould SJ, Eldredge N. Punctuated equilibria: an alternative to phyleticgradualism In: Schopf TJM, editor. Models in Paleobiology. SanFrancisco: Freeman Cooper; 1972. p. 82-115.
7. Raff RA. The Shape of Life: Genes, Development, and the Evolution ofAnimal Form. Chicago: University of Chicago Press; 1996.
8. Orr HA. The population genetics of adaptation: the distribution offactors fixed during adaptive evolution. Evolution. 1998;935–49.
9. Hartl DL, Clark AG, Clark AG. Principles of Population Genetics, vol. 116.Sunderland: Sinauer associates; 1997.
10. Nielsen R. Molecular signatures of natural selection. Annu. Rev. Genet.2005;39:197–218.
11. Jones FC, Chan YF, Schmutz J, Grimwood J, Brady SD, Southwick AM,et al. A genome-wide snp genotyping array reveals patterns of globaland repeated species-pair divergence in sticklebacks. Current Biology.2011;22(1):.
12. Chan Y, Marks M, Jones F, Villarreal G, Shapiro M, Brady S, et al.Adaptive evolution of pelvic reduction in sticklebacks by recurrentdeletion of a pitx1 enhancer. Science. 2010;327.5963:302–5.
13. ArnegardME, McGeeMD, Matthews B, Marchinko KB, Conte GL, Kabir S,et al. Genetics of ecological divergence during speciation. Nature. 2014.
14. Soria-Carrasco V, Gompert Z, Comeault AA, Farkas TE, Parchman TL,Johnston JS, et al. Stick insect genomes reveal natural selection’s role inparallel speciation. Science. 2014;344(6185):738–42.
15. Pfennig DW, Wund MA, Snell-Rood EC, Cruickshank T, Schlichting CD,Moczek AP. Phenotypic plasticity’s impacts on diversification andspeciation. Trends in Ecology & Evolution. 2010;25(8):459–67.
16. Nunes MD, Arif S, Schlötterer C, McGregor AP. A perspective onmicro-evo-devo: progress and potential. Genetics. 2013;195(3):625–34.
17. Gilbert SF. Developmental Biology. Sunderland: Sinauer Associates; 2010.18. Davidson EH. The Regulatory Genome: Gene Regulatory Networks in
Development and Evolution. Burlington: Academic Press; 2010.19. Gilbert SF, Epel D. Ecological Developmental Biology. Sunderland:
Sinauer Associates; 2009.20. Carroll SB, Grenier JK, Weatherbee SD. From DNA to Diversity: Molecular
Genetics and the Evolution of Animal Design. Cambridge: Blackwell;2001.
21. Marigo V, Scott MP, Johnson RL, Goodrich LV, Tabin CJ. Conservationin hedgehog signaling: induction of a chicken patched homolog bysonic hedgehog in the developing limb. Development. 1996;122(4):1225–33.
22. Stern DL. Evolution, Development, & the Predictable Genome: Robertsand Company Publishers; 2011.
23. Stern D, Orgogozo V. Is genetic evolution predictable? Science.2009;323(5915):746–51.
24. Lomolino M, Brown J, Davis R. Islands biogeography of montane forestmammals in the american southwest. Ecology. 1989;180–94.
25. Thompson RS, Anderson KH. Biomes of western North America at18,000, 6000 and 0 C-14 yr bp reconstructed from pollen and packratmidden data. Journal of Biogeography. 2000;27(3):555–84.
26. Warshall P. The madrean sky island archipelago: a planetary overview In:DeBano L, Ffolliott P, Ortega-Rubio A, Gottfried G, Hamre R, Edminster C,editors. RM-GTR-264 : Biodiversity and Management of the MadreanArchipelago: the Sky Islands of Southwestern United States andNorthwestern Mexico. Fort Collins: US Department of Agriculture, ForestService; 1994. p. 6–18.
27. Gottfried GJ, Gebow BS, Eskew LG, Edminster CB. Connecting MountainIslands and Desert Seas: Biodiversity and Management of the MadreanArchipelago II. Proc. RMRS-P-36. Fort Collins, CO: U.S. Department ofAgriculture, Forest Service, Rocky Mountain Research Station: 1–6.
28. Ober K, Matthews B, Ferrieri A, Kuhn S. The evolution and age ofpopulations of Scaphinotus petersi Roeschke on Arizona Sky Islands(coleoptera, carabidae, cychrini). ZooKeys. 2011;147:183.
29. Heinze J, Rueppell O. The frequency of multi-queen colonies increaseswith altitude in a nearctic ant. Ecological Entomology. 2014;39:4.
30. Masta S. Phylogeography of the jumping spider Habronattus pugillis(Araneae : Salticidae): Recent vicariance of sky island populations?Evolution. 2000;54(5):1699–711.
31. Smith CI, Farrell BD. Range expansions in the flightless longhorncactus beetles,Moneilema gigas andMoneilema armatum, in responseto pleistocene climate changes. Molecular Ecology. 2005;14(4):1025–44.
32. Perez-Alquicira J, Molina-Freaner F, Pinero D, Weller S, Martinez-Meyer E,Rozas J, et al. The role of historical factors and natural selection in theevolution of breeding systems of Oxalis alpina in the sonoran desert skyislands. Journal of Evolutionary Biology. 2010;23(10):2163–175.
33. Kupfer JA, John A, Cairns DM. The suitability of montane ecotones asindicators of global climatic change. Progress in Physical Geography.1996;20(3):253–72.
34. Kupfer JA, Balmat J, Smith JL. Shifts in the potential distribution of skyisland plant communities in response to climate change. USDA ForestService Proceedings. 2005;485–90.
35. Brusca RC, Wiens JF, Meyer WM, Eble J, Franklin K, Overpeck JT, et al.Dramatic response to climate change in the southwest: RobertWhittaker’s 1963 Arizona mountain plant transect revisited. Ecology andEvolution. 2013;3(10):3307–319.
36. Garfin G, Jardine A, Merideth R, Black M, LeRoy S. Assessment ofClimate Change in the Southwest United States: Island Press; 2013.
37. Hölldobler B, Wilson EO. The Ants. Cambridge: The Belknap Press ofHarvard University Press; 1990.
38. Andersen AN, Majer JD. Ants show the way down under: invertebratesas bioindicators in land management. Frontiers in Ecology and theEnvironment. 2004;2(6):291–8.
39. Agosti D. Ants: Standard Methods for Measuring and MonitoringBiodiversity. Biological diversity handbook series: Smithsonian InstitutionPress; 2000.
40. Diamond SE, Nichols LM, McCoy N, Hirsch C, Pelini SL, Sanders NJ,et al. A physiological trait-based approach to predicting the responsesof species to experimental climate warming. Ecology. 2012;93(11):2305–312.
41. Pelini SL, Diamond SE, MacLean H, Ellison AM, Gotelli NJ, Sanders NJ,et al. Common garden experiments reveal uncommon responses acrosstemperatures, locations, and species of ants. Ecology and Evolution.2012;2(12):3009–015.
42. Hölldobler B, Wilson EO. The number of queens: an important trait inant evolution. Naturwissenschaften. 1977;64(1):8–15.
43. Heinze J, Keller L. Alternative reproductive strategies: a queenperspective in ants. Trends in Ecology & Evolution. 2000;15(12):508–12.
44. Peeters C. Convergent evolution of wingless queens reproductive acrossall subfamilies of ants, and sporadic loss of winged queens(hymenoptera: Formicidae). Myrmecological News. 2012;16:75–91.
45. Peeters C, Ito F. Colony dispersal and the evolution of queenmorphology in social hymenoptera. Annual Review of Entomology.2001;46(1):601–30.
46. Heinze J, Buschinger A. Queen polymorphism in Leptothorax Species-A- its genetic and ecological background (hymenoptera, formicidae).Insectes Sociaux. 1989;36(2):139–55.
47. Roff DA. The evolution of flightlessness in insects. EcologicalMonographs. 1990;389–421.
48. Favé M-J. The role of past climate change in driving novelties in skyisland ant populations. Montreal: PhD thesis, McGill University; 2013.
49. Cremer S, Heinze J. Stress grows wings: Environmental induction ofwinged dispersal males in cardiocondyla ants. Current Biology.2003;13(3):219–223.
50. Mitchell HK, Petersen NS. Developmental abnormalities in drosophilainduced by heat shock. Developmental genetics. 1982;3(2):91–102.
51. Whittingham MJ, Stephens PA, Bradbury RB, Freckleton RP. Why do westill use stepwise modelling in ecology and behaviour? Journal of animalecology. 2006;75(5):1182–9.
52. Whiting MF, Bradler S, Maxwell T. Loss and recovery of wings in stickinsects. Nature. 2003;421(6920):264–7.
53. Prud’Homme B, Gompel N, Rokas A, Kassner VA, Williams TM, Yeh SD,et al. Repeated morphological evolution through cis-regulatory changesin a pleiotropic gene. Nature. 2006;440(7087):1050–3.
54. Rajakumar R, Mauro D, Dijkstra M, Huang M, Wheeler D, Hiou-Tim Fet al. Ancestral developmental potential facilitates parallel evolution inants. Science. 2012;335(6064):79–82.
55. Wund MA, Valena S, Wood S, Baker JA. Ancestral plasticity andallometry in threespine stickleback reveal phenotypes associated with

Favé et al. BMC Evolutionary Biology (2015) 15:183 Page 20 of 21
derived, freshwater ecotypes. Biological Journal of the Linnean Society.2012;105(3):573–83.
56. Losos JB. Convergence, adaptation, and constraint. Evolution.2011;65(7):1827–40.
57. Abouheif E, Favé M-J, Ibarrarán-Viniegra AS, Lesoway MP, Rafiqi AM,Rajakumar R. Eco-evo-devo: The time has come. In: Ecological Genomics.Springer; 2014. p. 107–25.
58. Molet M, Wheeler DE, Peeters C. Evolution of novel mosaic castes inants: Modularity, phenotypic plasticity, and colonial buffering. TheAmerican Naturalist. 2012;180(3):328–41.
59. Cohen SM, Bate M, Arias AM, (eds). 1993. The Development ofDrosophila Melanogaster vol. 1. Cold Spring Harbor Laboratory Pr.
60. Weatherbee SD, Halder G, Kim J, Hudson A, Carroll S. Ultrabithoraxregulates genes at several levels of the wing-patterning hierarchy toshape the development of the Drosophila haltere. Genes &Development. 1998;12(10):1474–82.
61. Cripps RM, Black BL, Zhao B, Lien CL, Schulz RA, Olson EN. Themyogenic regulatory genemef2 is a direct target for transcriptionalactivation by twist during Drosophilamyogenesis. Genes &Development. 1998;12(3):422–34.
62. Held Jr LI. Imaginal Discs: the Genetic and Cellular Logic of PatternFormation, vol. 39. New-York: Cambridge University Press; 2005.
63. Abouheif E, Wray GA. Evolution of the gene network underlying wingpolyphenism in ants. Science. 2002;297(5579):249–52.
64. Tomoyasu Y, Arakane Y, Kramer KJ, Denell RE. Repeated co-options ofexoskeleton formation during wing-to-elytron evolution in beetles.Current Biology. 2009;19(24):2057–065.
65. Shbailat S, Khila A, Abouheif E. Correlations between spatiotemporalchanges in gene expression and apoptosis underlie wing polyphenismin the ant Pheidole morrisi. Evolution and Development. 2010;12(6):579–90.
66. Carroll SB, Gates J, Keys DN, Paddock SW, Panganiban G, Selegue JE,et al. Pattern formation and eyespot determination in butterfly wings.Science (New York, NY). 1994;265(5168):109.
67. Shbailat SJ, Abouheif E. The wing-patterning network in the winglesscastes of myrmicine and formicine ant species is a mix of evolutionarilylabile and non-labile genes. Journal of Experimental Zoology Part B:Molecular and Developmental Evolution. 2013;320(2):1–10.
68. Peterson T, Müller GB. What is evolutionary novelty? process versuscharacter based definitions. Journal of Experimental Zoology. Part B:Molecular and Developmental Evolution. 2013;320(6):345–350.
69. Conway Morris S. Life’s Solution: Inevitable Humans in a Lonely Universe.New-York: Cambridge Univ Press; 2003.
70. Gould SJ. Wonderful Life: the Burgess Shale and the Nature of History:Random House; 2000.
71. Colosimo PF, Hosemann KE, Balabhadra S, Villarreal G, Dickson M,Grimwood J, et al. Widespread parallel evolution in sticklebacks byrepeated fixation of ectodysplasin alleles. Science. 2005;307.5717:1928–33.
72. Jeong S, Rokas A, Carroll SB. Regulation of body pigmentation by theabdominal-b hox protein and its gain and loss in drosophila evolution.Cell. 2006;125(7):1387–99.
73. Protas ME, Hersey C, Kochanek D, Zhou Y, Wilkens H, Jeffery WR, et al.Genetic analysis of cavefish reveals molecular convergence in theevolution of albinism. Nature genetics. 2005;38(1):107–11.
74. Sucena E, Delon I, Jones I, Payre F, Stern DL. Regulatory evolution ofshavenbaby/ovo underlies multiple cases of morphological parallelism.Nature. 2003;424(6951):935–8.
75. Tenaillon O, Rodríguez-Verdugo A, Gaut RL, McDonald P, Bennett AF,Long AD, et al. The molecular diversity of adaptive convergence.Science. 2012;335(6067):457–61.
76. Green DA, Extavour CG. Convergent evolution of a reproductive traitthrough distinct developmental mechanisms in drosophila.Developmental biology. 2012;372(1):120–30.
77. Manceau M, Domingues VS, Linnen CR, Rosenblum EB, Hoekstra HE.Convergence in pigmentation at multiple levels: mutations, genes andfunction. Philosophical Transactions of the Royal Society B: BiologicalSciences. 2010;365(1552):2439–450.
78. Travisano M, Mongold JA, Bennett AF, Lenski RE. Experimental tests ofthe roles of adaptation, chance, and history in evolution. Science.1995;267(5194):87–90.
79. MacLean RC, Bell G. Divergent evolution during an experimentaladaptive radiation. Proceedings of the Royal Society of London SeriesB-Biological Sciences. 2003;270(1524):1645–50.
80. Blount ZD, Borland CZ, Lenski RE. Historical contingency and theevolution of a key innovation in an experimental population ofescherichia coli. Proceedings of the National Academy of Sciences.2008;105(23):7899.
81. McGhee GR. Convergent Evolution: Limited Forms Most Beautiful: MITPress; 2011.
82. Wittkopp PJ, Stewart EE, Arnold LL, Neidert AH, Haerum BK, Thompson EM,et al. Intraspecific polymorphism to interspecific divergence: genetics ofpigmentation in drosophila. Science. 2009;326(5952):540–4.
83. Albertson RC, Streelman JT, Kocher TD, Yelick PC. Integration andevolution of the cichlid mandible: the molecular basis of alternatefeeding strategies. Proceedings of the National Academy of Sciences ofthe United States of America. 2005;102(45):16287.
84. Kolbe J, Leal M, Schoener T, Spiller D, Losos J. Founder effects persistdespite adaptive differentiation: A field experiment with lizards. Science.2012;335(6072):1086–9.
85. Steiner CC, Römpler H, Boettger LM, Schöneberg T, Hoekstra HE. Thegenetic basis of phenotypic convergence in beach mice: similarpigment patterns but different genes. Molecular Biology and Evolution.2009;26(1):35–45.
86. Brakefield PM, Gates J, Keys D, Kesbeke F, Wijngaarden PJ, Monteiro A,et al. Development, plasticity and evolution of butterfly eyespotpatterns. Nature. 1996;384(6606):236–42.
87. Jablonski D. Scale and hierarchy in macroevolution. Palaeontology.2007;50(1):87–109.
88. Charlesworth B, Lande R, Slatkin M. A neo-darwinian commentary onmacroevolution. Evolution. 1982;474–98.
89. Abouheif E. Parallelism as the pattern and process of mesoevolution.Evolution and Development. 2008;10(1):3–5.
90. Arthur W. Micro-, macro-, and megaevolution In: Hall BK, Olsen WM ,editors. Keywords and Concepts in Evolutional Developmental Biology.Harvard University Press; 2007. p. 496.
91. Leroi AM. The scale independence of evolution. Evolution & development.2000;2(2):67–77.
92. Meyer JR, Dobias DT, Weitz JS, Barrick JE, Quick RT, Lenski RE.Repeatability and contingency in the evolution of a key innovation inphage lambda. Science. 2012;335(6067):428–32.
93. Erwin DH. Macroevolution is more than repeated rounds ofmicroevolution. Evolution & Development. 2000;2(2):78–84.
94. Gibson G, Hogness DS. Effect of polymorphism in the drosophilaregulatory gene ultrabithorax on homeotic stability. Science.1996;271(5246):200–3.
95. Zimmer C, Emlen DJ. Evolution: Making Sense of Life: Roberts; 2013.96. Hall B. Strickberger’s Evolution: Jones & Bartlett Learning; 2008.97. Ridley M. Evolution, 3rd Edition: Blackwell Publishing; 2003.98. Stern DL. Evolution, Development, & the Predictable Genome.
Greenwood Village: Roberts and Company Publishers; 2011.99. Erwin DH, Davidson EH. The evolution of hierarchical gene regulatory
networks. Nature Reviews Genetics. 2009;10(2):141–8.100. Davidson EH, Erwin DH. Evolutionary innovation and stability in animal
gene networks. Journal of Experimental Zoology Part B: Molecular andDevelopmental Evolution. 2010;314(3):182–6.
101. Parmesan C. Ecological and evolutionary responses to recent climate change. Annual Review of Ecology, Evolution, and Systematics. 2006;637–69.
102. Seager R, Ting M, Held I, Kushnir Y, Lu J, Vecchi G, et al. Modelprojections of an imminent transition to a more arid climate insouthwestern North America. Science. 2007;316(5828):1181–4.
103. Brown JL, Li SH, Bhagabati N. Long-term trend toward earlier breedingin an american bird: A response to global warming?. Proceedings of theNational Academy of Sciences. 1999;96(10):5565–569.
104. Inouye DW, Barr B, Armitage KB, Inouye BD. Climate change is affectingaltitudinal migrants and hibernating species. Proceedings of theNational Academy of Sciences. 2000;97(4):1630–33.
105. Bhatkar A, Whitcomb WH. Artificial diet for rearing various species ofants. Fla. Entomol. 1970;53:229–32.
106. Moreau C, Bell C, Vila R, Archibald S, Pierce N. Phylogeny of the ants:Diversification in the age of angiosperms. Science. 2006;312.5770:101–104.

Favé et al. BMC Evolutionary Biology (2015) 15:183 Page 21 of 21
107. Zhu Y, Bergland AO, González J, Petrov DA. Empirical validation ofpooled whole genome population re-sequencing in Drosophilamelanogaster. PloS one. 2012;7(7):41901.
108. Skalski GT, Couch CR, Garber AF, Weir BS, Sullivan CV. Evaluation of dnapooling for the estimation of microsatellite allele frequencies: a casestudy using striped bass (Morone saxatilis). Genetics. 2006;173(2):863–75.
109. Vos P, Hogers R, Bleeker M, Reijans M, Vandelee T, Hornes M, et al. Aflp- a new technique for dna-fingerprinting. Nucleic Acids Research.1995;23(21):4407–414.
110. Bonin A, Ehrich D, Manel S. Statistical analysis of amplified fragmentlength polymorphism data: a toolbox for molecular ecologists andevolutionists. Molecular Ecology. 2007;16(18):3737–758.
111. Zhivotovsky LA. Estimating population structure in diploids withmultilocus dominant dna markers. Molecular Ecology. 1999;8(6):907–13.
112. Vekemans X, Beauwens T, Lemaire M, Roldán-Ruiz I. Data fromamplified fragment length polymorphism (aflp) markers show indicationof size homoplasy and of a relationship between degree of homoplasyand fragment size. Molecular ecology. 2002;11(1):139–51.
113. Mantel N. Detection of disease clustering and a generalized regressionapproach. Cancer Research. 1967;27:209–20.
114. Beerli P. Comparison of bayesian and maximum-likelihood inference ofpopulation genetic parameters. Bioinformatics. 2006;22.3:341–345.
115. Beerli P, Palczewski M. Unified framework to evaluate panmixia andmigration direction among multiple sampling locations. Genetics.2010;185(1):313–463.
116. Haag-Liautard C, Coffey N, Houle D, Lynch M, Charlesworth B,Keightley PD. Direct estimation of the mitochondrial dna mutation ratein Drosophila melanogaster. PLoS biology. 2008;6(8):204.
117. Obbard DJ, Welch JJ, Kim KW, Jiggins FM. Quantifying adaptiveevolution in the drosophila immune system. PLoS genetics.2009;5(10):1000698.
118. Cornuet JM, Ravigne V, Estoup A. Inference on population history andmodel checking using dna sequence and microsatellite data with thesoftware diyabc (v1.0). Bmc Bioinformatics. 2010;11(401):.
119. Beaumont MA, Zhang WY, Balding DJ. Approximate bayesiancomputation in population genetics. Genetics. 2002;162(4):2025–035.
120. Felsenstein J. Phylip-phylogeny inference package (version 3.2).Distributed by the author: Department of Genome Sciences, Universityof Washington, Seattle; 2004.
121. Correa C, Hendry AP. Invasive salmonids and lake order interact in thedecline of puye grande Galaxias platei in western patagonia lakes.Ecological Applications. 2012;22(3):828–42.
122. Wheeler DE, Nijhout HF. Imaginal wing discs in larvae of the soldiercaste of Pheidole bicarinata vinelandica forel (hymenoptera: Formicidae).International Journal of Insect Morphology and Embryology. 1981;10(2):131–9.
123. Patel N. Imaging neuronal subsets and other cell-types in whole-mountdrosophila embryos and larvae using antibody probes. In: Methods inCell Biology. San Diego: Academic Press Inc.; 1994. p. 445–87.
124. Warton DI, Wright IJ, Falster DS, Westoby M. Bivariate line-fittingmethods for allometry. Biological Reviews. 2006;81(2):259–91.
125. Tautz D, Pfeifle C. A non-radioactive insitu hybridization method for thelocalization of specific rnas in drosophila embryos reveals translationalcontrol of the segmentation gene hunchback. Chromosoma. 1989;98(2):81–5.
126. Metscher BD. Microct for comparative morphology: simple stainingmethods allow high-contrast 3d imaging of diverse non-mineralizedanimal tissues. BMC physiology. 2009;9(1):11.
127. Mani MS, Giddings LE. Ecology of Highlands: Dr. W. Junk.; 1980.128. Hodkinson ID. Terrestrial insects along elevation gradients: species and
community responses to altitude. Biological Reviews. 2005;80(3):489–513.
129. Harrison RG. Dispersal polymorphisms in insects. Annual Review ofEcology and Systematics. 1980;95–118.
130. Peeters C, Molet M. Colonial reproduction and life histories In: Lach L,Parr C, Abbott K, editors. Ant Ecology. New-York: Oxford University Press;2010. p. 159–76.
131. Murcia C. Edge effects in fragmented forests: implications forconservation. Trends in Ecology & Evolution. 1995;10(2):58–62.
Submit your next manuscript to BioMed Centraland take full advantage of:
• Convenient online submission
• Thorough peer review
• No space constraints or color figure charges
• Immediate publication on acceptance
• Inclusion in PubMed, CAS, Scopus and Google Scholar
• Research which is freely available for redistribution
Submit your manuscript at www.biomedcentral.com/submit