RESEARCH ARTICLE Open Access Promoting healthy weight …
14
RESEARCH ARTICLE Open Access Promoting healthy weight in primary school children through physical activity and nutrition education: a pragmatic evaluation of the CHANGE! randomised intervention study Stuart J Fairclough 1* , Allan F Hackett 2 , Ian G Davies 2 , Rebecca Gobbi 2,3 , Kelly A Mackintosh 2,4 , Genevieve L Warburton 2 , Gareth Stratton 1,4,5 , Esther MF van Sluijs 6 and Lynne M Boddy 1 Abstract Background: This pragmatic evaluation investigated the effectiveness of the Children’s Health, Activity and Nutrition: Get Educated! (CHANGE!) Project, a cluster randomised intervention to promote healthy weight using an educational focus on physical activity and healthy eating. Methods: Participants (n = 318, aged 10–11 years) from 6 Intervention and 6 Comparison schools took part in the 20 weeks intervention between November 2010 and March/April 2011. This consisted of a teacher-led curriculum, learning resources, and homework tasks. Primary outcome measures were waist circumference, body mass index (BMI), and BMI z-scores. Secondary outcomes were objectively-assessed physical activity and sedentary time, and food intake. Outcomes were assessed at baseline, at post-intervention (20 weeks), and at follow-up (30 weeks). Data were analysed using 2-level multi-level modelling (levels: school, student) and adjusted for baseline values of the outcomes and potential confounders. Differences in intervention effect by subgroup (sex, weight status, socio-economic status) were explored using statistical interaction. Results: Significant between-group effects were observed for waist circumference at post-intervention (β for intervention effect =-1.63 (95% CI = -2.20, -1.07) cm, p<0.001) and for BMI z-score at follow-up (β=-0.24 (95% CI = -0.48, -0.003), p=0.04). At follow-up there was also a significant intervention effect for light intensity physical activity (β=25.97 (95% CI = 8.04, 43.89) min, p=0.01). Interaction analyses revealed that the intervention was most effective for overweight/obese participants (waist circumference: β=-2.82 (95% CI = -4.06, -1.58) cm, p<0.001), girls (BMI: β=-0.39 (95% CI = -0.81, 0.03) kg/m 2 , p=0.07), and participants with higher family socioeconomic status (breakfast consumption: β=8.82 (95% CI = 6.47, 11.16), p=0.07). Conclusions: The CHANGE! intervention positively influenced body size outcomes and light physical activity, and most effectively influenced body size outcomes among overweight and obese children and girls. The findings add support for the effectiveness of combined school-based physical activity and nutrition interventions. Additional work is required to test intervention fidelity and the sustained effectiveness of this intervention in the medium and long term. Trial registration: Current Controlled Trials ISRCTN03863885. Keywords: Body size, Light physical activity, Accelerometry, Multilevel modelling * Correspondence: [email protected] 1 Physical Activity Exchange, Research Institute for Sport and Exercise Sciences, Liverpool John Moores University, 62, Great Crosshall Street, Liverpool, UK Full list of author information is available at the end of the article © 2013 Fairclough et al.; licensee BioMed Central Ltd. This is an Open Access article distributed under the terms of the Creative Commons Attribution License (http://creativecommons.org/licenses/by/2.0), which permits unrestricted use, distribution, and reproduction in any medium, provided the original work is properly cited. Fairclough et al. BMC Public Health 2013, 13:626 http://www.biomedcentral.com/1471-2458/13/626
Transcript of RESEARCH ARTICLE Open Access Promoting healthy weight …

Fairclough et al. BMC Public Health 2013, 13:626http://www.biomedcentral.com/1471-2458/13/626
RESEARCH ARTICLE Open Access
Promoting healthy weight in primary schoolchildren through physical activity and nutritioneducation: a pragmatic evaluation of theCHANGE! randomised intervention studyStuart J Fairclough1*, Allan F Hackett2, Ian G Davies2, Rebecca Gobbi2,3, Kelly A Mackintosh2,4,Genevieve L Warburton2, Gareth Stratton1,4,5, Esther MF van Sluijs6 and Lynne M Boddy1
Abstract
Background: This pragmatic evaluation investigated the effectiveness of the Children’s Health, Activity andNutrition: Get Educated! (CHANGE!) Project, a cluster randomised intervention to promote healthy weight using aneducational focus on physical activity and healthy eating.
Methods: Participants (n = 318, aged 10–11 years) from 6 Intervention and 6 Comparison schools took part in the20 weeks intervention between November 2010 and March/April 2011. This consisted of a teacher-led curriculum,learning resources, and homework tasks. Primary outcome measures were waist circumference, body mass index(BMI), and BMI z-scores. Secondary outcomes were objectively-assessed physical activity and sedentary time, andfood intake. Outcomes were assessed at baseline, at post-intervention (20 weeks), and at follow-up (30 weeks). Datawere analysed using 2-level multi-level modelling (levels: school, student) and adjusted for baseline values ofthe outcomes and potential confounders. Differences in intervention effect by subgroup (sex, weight status,socio-economic status) were explored using statistical interaction.
Results: Significant between-group effects were observed for waist circumference at post-intervention (β forintervention effect =−1.63 (95% CI = −2.20, -1.07) cm, p<0.001) and for BMI z-score at follow-up (β=−0.24(95% CI = −0.48, -0.003), p=0.04). At follow-up there was also a significant intervention effect for light intensityphysical activity (β=25.97 (95% CI = 8.04, 43.89) min, p=0.01). Interaction analyses revealed that the interventionwas most effective for overweight/obese participants (waist circumference: β=−2.82 (95% CI = −4.06, -1.58) cm,p<0.001), girls (BMI: β=−0.39 (95% CI = −0.81, 0.03) kg/m2, p=0.07), and participants with higher familysocioeconomic status (breakfast consumption: β=8.82 (95% CI = 6.47, 11.16), p=0.07).
Conclusions: The CHANGE! intervention positively influenced body size outcomes and light physical activity, andmost effectively influenced body size outcomes among overweight and obese children and girls. The findingsadd support for the effectiveness of combined school-based physical activity and nutrition interventions.Additional work is required to test intervention fidelity and the sustained effectiveness of this intervention in themedium and long term.
Trial registration: Current Controlled Trials ISRCTN03863885.
Keywords: Body size, Light physical activity, Accelerometry, Multilevel modelling
* Correspondence: [email protected] Activity Exchange, Research Institute for Sport and ExerciseSciences, Liverpool John Moores University, 62, Great Crosshall Street,Liverpool, UKFull list of author information is available at the end of the article
© 2013 Fairclough et al.; licensee BioMed CenCreative Commons Attribution License (http:/distribution, and reproduction in any medium
tral Ltd. This is an Open Access article distributed under the terms of the/creativecommons.org/licenses/by/2.0), which permits unrestricted use,, provided the original work is properly cited.
Fairclough et al. BMC Public Health 2013, 13:626 Page 2 of 14http://www.biomedcentral.com/1471-2458/13/626
BackgroundIt is well established that paediatric obesity increases therisk of cardiometabolic disease in later life [1]. Despiteevidence to suggest that the prevalence of obesity hasplateaued in recent years within the UK [2] and inter-nationally [3], there is no evidence of a decline, and ahigh proportion of children remain at risk of morbidity.Physical activity (PA), sedentary behaviours, and food in-take are key variables implicated in childhood obesitydue to their influence on energy balance [4]. Despitethis, children on average are insufficiently active [5], en-gage in excessive sedentary behaviour [6], and have sub-optimal nutritional intake [7,8].Many intervention projects have been conducted to
arrest the increase in child overweight and obesitythrough single and combined strategies to enhance levelsof habitual PA, reduce time spent in sedentary behav-iours, and improve nutritional intake. One systematic re-view of school-based obesity prevention interventionsreported that the effects of interventions including bothPA and diet behaviours were equivocal with 45% ofreviewed studies demonstrating significant interventioneffects on body mass index (BMI) [9]. Mixed success inthese interventions can be due to the different interven-tion strategies and variable methodological quality, suchas lack of objective measurements of PA [10] and failureto account for relevant confounders in analyses [11].Despite these weaknesses in the evidence base, it is sug-gested that school-based interventions that combine PAand diet may help to prevent children becoming over-weight in the long term [9]. Furthermore, previous evi-dence indicates that school-based interventions aremore likely to be effective when PA and dietary behav-iours are reinforced at home through a family interven-tion component [9,12].The school setting is a logical choice as a context
for implementing healthy weight interventions due toexisting infrastructure, staff, curricula, facilities, pol-icies, and environments that have potential to pro-mote healthy behaviours. In Europe there is limitedevidence of successful school curriculum-based inter-ventions focused on PA and/or nutrition, with previ-ous studies reporting improvements in school timePA [13] and vegetable intake [14], but no effects onweight status [15]. Elsewhere, curriculum-based interven-tions with additional components (e.g., modificationsto school meals) have resulted in positive changes inbody size outcomes [16,17]. It is postulated that life-style interventions to reduce the risk of overweightmay be effective if built into school curricula [12],particularly through interdisciplinary curriculum areassuch as Personal, Social, and Health Education (PSHE)(in the UK PSHE is distinct from other health-relatedsubjects such as physical education and food technology)
[13]. Furthermore, interventions that can be implementedby school personnel in ‘real life’ conditions (i.e., without re-searcher support and resources) are advocated [15], asthese are less costly [13], and are more likely to be inte-grated within existing curricula and sustained over time.The Children’s Health, Activity and Nutrition: Get
Educated! (CHANGE!) intervention was designed topromote healthy weight in primary school childrenthrough a teacher-delivered curriculum-based inter-vention with family involvement, focused on physicalactivity and dietary behaviour. The aim of this prag-matic evaluation was to assess the effectiveness of theCHANGE! intervention on measures of body size, PAand food intake.
MethodsParticipantsThe study was conducted in Wigan Borough in north-west England, UK, a large municipality with a populationof over 300,000 that is recognised as an area of highdeprivation and health inequalities [18]. Eligible schoolswere identified within pre-defined geographical unitsknown as Neighbourhood Management Areas (NMA).School-level socio-economic status (SES) was defined asthe percentage of students per school eligible to receivefree school meals. Within each NMA, one high and onelow SES school were randomly selected to take part toensure representation of the diverse geographical andsocial contexts present within the locale. Twelve primaryschools were approached and recruited to the study(100% participation rate). In each school all childrenwithin Year 6 (10–11 years old) were invited to takepart in the study (N=420). Available resources for thispragmatic evaluation (e.g., staffing, equipment, availabletime), dictated that 420 was the maximum number ofparticipants that could be recruited to test the feasibilityof the intervention, thus statistical methods were notused to determine samples sizes [19]. Written informedparental consent and participant assent were receivedfrom 318 children (75.7% participation rate; Comparisonn = 152; Intervention n = 166). Approximately 95% ofthe children were of white British ethnicity, which is rep-resentative of the school age population in Wigan [20].Ethical approval for the study was obtained from theLiverpool John Moores University Research Ethics Com-mittee (application reference # 10/ECL/039).
DesignSchools were stratified to ensure an equal distribution ofhigh and low SES schools, which were randomly allo-cated to an Intervention (n=6 schools) or Comparisoncondition (n=6 schools) using a random number gener-ator (SPSS Inc., Chicago, IL). Due to the nature of theintervention and logistical constraints, randomisation

Fairclough et al. BMC Public Health 2013, 13:626 Page 3 of 14http://www.biomedcentral.com/1471-2458/13/626
of schools was not blinded and was conducted by theresearch team prior to baseline measures. Baseline datacollection measures were completed in October 2010.Post-intervention measures were completed after the20 week intervention period in March and April 2011,and follow-up measures were completed 10 weeks afterpost-intervention measures, prior to school summerholidays. One Intervention school withdrew from thestudy due to reasons external to the project, prohibitingcollection of follow-up data at this school. Full detailsof the flow of schools and participants through thestudy are provided in Figure 1.
InterventionThe CHANGE! Project is a school-based PA and healthyeating intervention study delivered through the PSHEstrand of the primary school curriculum. The project
Figure 1 Flow of schools and participants through the study.
was underpinned by social cognitive theory which focuseson the interaction between social and environmentalfactors on behaviour [21]. The intervention designand content were informed by formative work conductedwith parents, children, and teachers in 10 of the schoolsin the year prior to intervention commencement [22,23].The final CHANGE! curriculum was adapted from existingresources that have been successfully implemented in theUSA [24] and UK [25,26], and which were designed forinterdisciplinary curricula [24]. The PSHE curriculum inEnglish primary schools is structured in an interdiscip-linary manner with relevant topics delivered collectivelywithin particular themes (e.g., PA and nutrition topicstaught within a ‘healthy lifestyles’ theme). With the per-mission of the publishers of the existing resources, mod-ifications were made to the language, guidelines for dietand physical activity, and reference to local contexts.

Fairclough et al. BMC Public Health 2013, 13:626 Page 4 of 14http://www.biomedcentral.com/1471-2458/13/626
Year 6 class teachers from the intervention schoolsreceived 4 hours of training in the delivery of the cur-riculum resource, and so were fully familiarised withthe curriculum prior to implementation. The CHANGE!curriculum consisted of 20 weekly lesson plans (seeTable 1), worksheets, homework tasks, lesson resources,and a CD-ROM. The lessons were of 60 minutes durationand provided an opportunity for children to discuss, ex-plore, and understand the meaning and practicalities of PAand nutrition as key elements of healthy lifestyles. The coremessage of the PA and sedentary behaviour components
Table 1 CHANGE! Themes, lesson titles and content summary
Theme Lesson titles
Introduction Healthy Living
Introduction: What is PA andwhere do we do it?
Map maker
Monitoring and goal setting Go for goal
Reducing sedentary time Power down
Impact of technology Identifying sedentary behaviours, when they otechnology has changed our lifestyles, goal sereducing screen time
Components of fitness Muscle mysteries
The human heart Simplify the concept of fitness as representinhealth’, ‘muscle health’, ‘body composition’;FITT principle as means of enhancing fitnessphysiological principles to demonstrate effecon body [e.g., pulse rate, etc.]
Energy balance Keeping the balance
Carbohydrate Carb smart
Sugar Sugar water
Beverage buzz Terminology & types; requirement; labels; sohidden; amounts; added sugar; consumptiocalculations
Fat Hunting hidden fat
Fruit & vegetables Menu monitoring
Breakfast Brilliant breakfast
Snacks (fat/sugar/salt) Snack attack
Snack decisions Frequency of eating; swaps; snacks at bedrequirements; hidden sources of fat/sugaramounts
Variety Balancing act
Keeping the balance Why variety needed; balanced diet & eatwenutrient functions and sources; food swaps;monitoring task
Awareness Foods around the world
Summary Have you CHANGE!’d?
was “move more, sit less” with no specific prescriptiongiven as to what forms of PA the children should do. Thenutrition components focused on topics such as, energybalance, macronutrients, and eating behaviours. Thehomework tasks supplemented the classroom work andtargeted family involvement in food and PA relatedtasks [27]. The CHANGE! topics were aligned with theUK Healthy Schools programme and were cross-referenced to the England National Curriculum objec-tives in Physical Education, Science, Maths, English,ICT, History, Geography, as well as PSHE [28]. Classes
Content summary
Lifestyle options, choices and consequences; eatwell plate
PA definitions, intensities, guidelines for health, opportunitiesin local environment [mapping], types of activities
Simple monitoring of PA [diary/pedometer], goal settingprinciples
ccur, howtting for
g ‘heartincorporate, basicts of PA
Fuel; intake; expenditure; balance; negative/ positive;monitoring; nutrient functions and sources
Types; processing; starchy foods; why important; fibre;good sources
urces -n
Terminology & types; requirement; labels (graphing activity);sources; effect of cooking; fish oils
Benefits (source of variety of nutrients); portions;preparation; variety, storage; cooking; access; other foodscontaining fruit & vegetables, menu planning
Benefits (energy); portions; choices; sugar; salt; nutritionalcomparison of different types of breakfast
time;/salt;
ll plate;access;
Food production – growing; local specialities; history;access; food miles; mapping locality.
Summary of principles of healthy living

Fairclough et al. BMC Public Health 2013, 13:626 Page 5 of 14http://www.biomedcentral.com/1471-2458/13/626
in the Comparison schools received normal instruction.This did not involve a specific unit of PSHE focused onhealthy eating and PA, but concepts related to these areasmay have been touched on informally during other lessons(e.g., science, food technology, physical education, etc.).
Outcome measuresPrimary outcomes: body sizeStature and sitting stature to the nearest 0.1 cm (SecaLtd. Birmingham, UK) and body mass to the nearest0.1 kg (Seca Ltd. Birmingham, UK) were measuredusing standard techniques [29]. Body mass index wascalculated (body mass (kg) / stature2 (m2)) and BMIz-scores were assigned to each participant [30]. Waistcircumference was measured to the nearest 0.1 cmusing a non-elastic anthropometric tape and measure-ments were taken at the narrowest point between thebottom of the ribs and the iliac crest. All measurementswere undertaken by the same trained researchers.
Secondary outcomesPhysical activity and sedentary time Physical activitywas objectively assessed for 7 consecutive days usingActiGraph GT1M accelerometers (ActiGraph LLC,Pensacola, FL). The ActiGraph is a common tool used toassess the volume and intensity of PA, and it has previ-ously been validated with children [31]. To distinguishbetween wear time and sleep time children also com-pleted a log sheet to record when the ActiGraph was puton in the morning and removed at night before bed, andany other times when the monitor was removed (e.g.,during showering, contact sports, swimming etc.). Theselog sheets were checked and initialled by parents at theend of each day. During the monitoring period physicalactivity was recorded using 5 second epochs [32].Sustained 20 minute periods of zero counts were consid-ered non-wear time [33]. Children were included in thedata analysis if they wore the monitors for at least 540 mi-nutes on week days [34] and 480 minutes on weekend days[35] for a minimum of 3 days in total [36]. These inclusioncriteria have previously shown acceptable reliability insimilarly aged children [36]. Numbers of participants thatdid not meet these criteria were 38 (11.9%) at baseline, 60(20.6%) at post-intervention, and 77 (26.6%) at follow-up.There were no significant differences in descriptive char-acteristics between included and excluded children atbaseline (p=0.08-0.76), post-intervention (p=0.12-0.96), orfollow-up (p=0.50-0.98). Furthermore, no differences inActiGraph compliance were observed between Interven-tion and Comparison groups. As there is no consensusas to which ActiGraph cutpoints are the most appropri-ate in diverse paediatric populations, a sub-study wasconducted which developed a field-based protocol for
generating population-specific accelerometer cut points.Cut points of >100 and <2160 counts per min, ≥2160counts per min, and ≥4806 counts per min classifiedlight intensity physical activity (LPA), moderate intensityphysical activity (MPA), and vigorous intensity physicalactivity (VPA), respectively [37]. For sedentary time a cutpoint of 100 counts per minute was used [38].
Food intakeParticipants completed a 24 hour recall food intake ques-tionnaire [39]. The survey has acceptable validity [40], reli-ability [41], and has been widely used in similarly agedchildren [42,43]. The survey contains 62 food items in-cluded some of the most commonly consumed among thisage group, such as breakfast cereals, breads, meats anddairy products. In addition, children reported whether theyhad eaten breakfast, fruit, and vegetables on the day priorto survey completion. These three items were consideredas being consistent with a ‘healthy diet’ based on existingresearch evidence [44] and public health messages (e.g.,‘5-a-day’) and were therefore used as the food intakeoutcomes in the analyses.
Assessment of covariatesInternational Obesity Task Force age and sex-specificbody mass index (BMI) cut-points [45] were used toclassify children as either normal-weight (NW) oroverweight/obese (OW). Somatic maturity status wasestimated by maturity offset values (i.e., years from at-tainment of peak height velocity [APHV]), which werecalculated using sex-specific regression equations thatincluded stature, sitting stature, leg length, chrono-logical age, body mass (girls only), and their interac-tions [46]. The 20 m shuttle run test (20 m SRT) wasconducted to provide an estimate of cardiorespiratoryfitness (CRF). This test has been widely used in chil-dren of similar age [47-49].Family SES was defined using home post code to gen-
erate indices of multiple deprivation (IMD) scores. IMDscores are a composite of seven domains of deprivation(income, employment, education, health, crime, accessto services, and living environment) [50] with higherscores representing higher degrees of deprivation. IMDscores were ranked and the median calculated. Participantsin the upper and lower 50th percentiles representedlow and high SES groups, respectively. The number ofchildren enrolled in each school was recorded. An esti-mate of playground spatial area was calculated usingaerial views of the schools’ playground areas, locatedusing the Google™ Earth Pro (GEP) application (version6.1.0.4738). Playground areas were calculated using theGEP polygon tool and summed for each school [51].Daily temperature and rainfall were recorded [52] usinglocal weather centre data.
Fairclough et al. BMC Public Health 2013, 13:626 Page 6 of 14http://www.biomedcentral.com/1471-2458/13/626
Statistical analysisMultilevel linear and logistic regression analyses exam-ined continuous and dichotomous outcome measures,respectively. Multilevel models can analyse the hierarch-ical nature of non-independent, nested data by takinginto account the dependency of observations [53]. Theoutcome measures at two follow-up measurements (i.e.,20 weeks post-intervention and 30 weeks follow-up)were the dependent variables. To account for the stu-dents being nested in schools, a 2-level data structurewas used. Children were defined as the first level unit ofanalysis, and school was the second level unit of analysis.Separate analyses were conducted to assess interventioneffects between baseline and post-intervention, andbaseline and follow-up. Preliminary analyses inspectedbetween-group differences in baseline values of potentialconfounding variables. Where statistically significantbetween-group differences existed, these variables wereincluded in the adjusted multilevel models as covariates.Regression coefficients for the group variables (where ‘0’indicated Comparison schools and ‘1’ indicated Interven-tion schools) reflected between-group differences in theoutcome measures (adjusted for baseline values and co-variates). Potential effect modification was assessed usinginteraction terms with dichotomous covariates (i.e., sex,weight status group, and SES group) to investigatewhether intervention effects differed between subgroups[54]. Separate ’crude’ interaction analyses adjusted foreach interaction term, group, and baseline value of theoutcome measure were initially performed. Where thesewere significant, ‘adjusted’ interaction analyses (i.e., inter-action term included in adjusted multilevel models) wereconducted for each effect modifier [54]. Regression coef-ficients in the main and interaction models wereassessed for significance using the Wald statistic. Ana-lyses were performed using MLwiN 2.26 software(Centre for Multilevel Modelling, University of Bristol,UK). Statistical significance was set at p<0.05, and atp<0.1 for interaction terms [54].
ResultsPreliminary resultsParticipant retention ranged from 84% (baseline) to 77%(follow-up) in the Comparison Group. The Interventiongroup’s retention ranged from 83% at baseline to 63% atfollow-up. However, the withdrawal of one school mid-way through the intervention automatically excluded 28children. Had the school not withdrawn and assumingall the children continued through the study, the reten-tion at follow-up would have been 80%. Baseline vari-ables did not differ between children who completed thestudy and those that were excluded from the analyses(p>0.05). Characteristics of the participants at baselineare presented in Table 2. Comparison children recorded
significantly better 20m SRT performances (p=0.003)and Intervention children had significantly higher IMDscores (p=0.007). The number of enrolled children andplayground area per child were significantly greater inComparison schools (p<0.001). During physical activitydata collection, average temperature was lower and rain-fall greater in Comparison schools (p<0.001).
Intervention effectsIn adjusted analyses significant between-group interven-tion effects were observed between baseline and post-intervention for waist circumference (β=−1.63 (95%CI = −2.20, -1.07) cm, p<0.001). No other significantintervention effects were observed in these analyses(Table 3). Between baseline and follow-up (Table 4)there were significant effects for BMI z-score (β=−0.24,(95% CI = −0.48, -0.003), p=0.04) and LPA (β=25.97(95% CI = 8.04, 43.89) min, p=0.01). At follow-up non-significant between group differences were observedfor BMI (β=−0.47 (95% CI = −1.03, 0.09)) and sedentarytime (β=−8.44 (95% CI = −53.23, 36.35) min). Adjustedmeans of the body size outcome measures across eachtime point are presented in Figure 2. No significantintervention effects were observed for MPA, VPA, andprevious day breakfast, fruit and vegetable intake.
Interaction effectsTable 5 shows the results of the significant sub-groupinteraction effects. The post-intervention interaction ef-fect of the CHANGE! curriculum on waist circumfer-ence was stronger in OW participants (β =−2.82 (95%CI = −4.06, -1.58) cm, p<0.001) than in NW participants(β =−1.34 (95% CI = −2.00, -0.72) cm, p<0.001). At post-intervention BMI (β =−0.39 (95% CI = −0.81, 0.03) kg/m2,p=0.07) and BMI z-score (β =−0.18 (95% CI = −0.42,0.06) cm, p=0.14) were strongest in girls whereas both out-comes increased in boys. The post-intervention effect onbreakfast consumption was strongest in the high SESgroup (OR=8.82 (95% CI = 6.47, 11.16), p=0.07). Therewere no significant interactions with PA or sedentary time.
DiscussionThe CHANGE! intervention was effective in promotinghealthy weight through educational activities focused onincreased PA, healthy eating, and reduced sedentarytime. Positive intervention effects were observed forbody size outcomes, with significant between-group dif-ferences identified for waist circumference at post-intervention (−1.63 cm), and BMI z-score at follow-up(−0.24). Waist circumference [55] and BMI z-scores [56]are positively associated with cardiovascular disease riskin children and the changes in waist circumference andBMI z-scores of the magnitudes observed here have pre-viously been reported as sufficient for population health
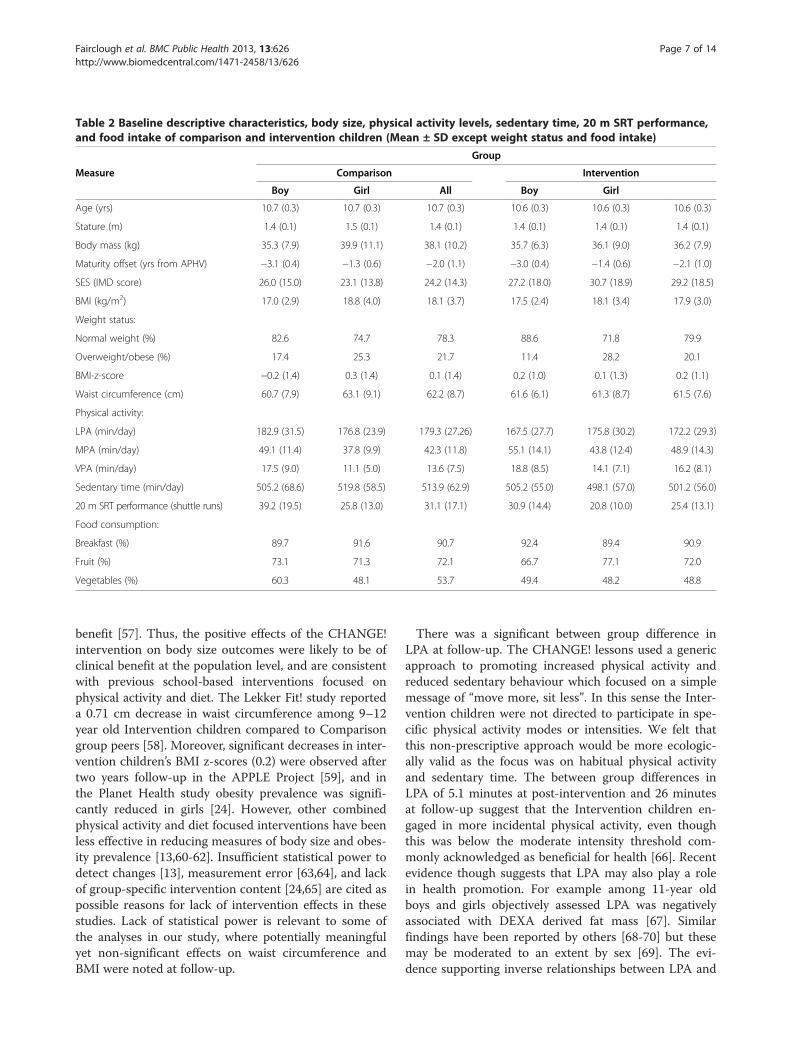
Table 2 Baseline descriptive characteristics, body size, physical activity levels, sedentary time, 20 m SRT performance,and food intake of comparison and intervention children (Mean ± SD except weight status and food intake)
Group
Measure Comparison Intervention
Boy Girl All Boy Girl
Age (yrs) 10.7 (0.3) 10.7 (0.3) 10.7 (0.3) 10.6 (0.3) 10.6 (0.3) 10.6 (0.3)
Stature (m) 1.4 (0.1) 1.5 (0.1) 1.4 (0.1) 1.4 (0.1) 1.4 (0.1) 1.4 (0.1)
Body mass (kg) 35.3 (7.9) 39.9 (11.1) 38.1 (10.2) 35.7 (6.3) 36.1 (9.0) 36.2 (7.9)
Maturity offset (yrs from APHV) −3.1 (0.4) −1.3 (0.6) −2.0 (1.1) −3.0 (0.4) −1.4 (0.6) −2.1 (1.0)
SES (IMD score) 26.0 (15.0) 23.1 (13.8) 24.2 (14.3) 27.2 (18.0) 30.7 (18.9) 29.2 (18.5)
BMI (kg/m2) 17.0 (2.9) 18.8 (4.0) 18.1 (3.7) 17.5 (2.4) 18.1 (3.4) 17.9 (3.0)
Weight status:
Normal weight (%) 82.6 74.7 78.3 88.6 71.8 79.9
Overweight/obese (%) 17.4 25.3 21.7 11.4 28.2 20.1
BMI-z-score −0.2 (1.4) 0.3 (1.4) 0.1 (1.4) 0.2 (1.0) 0.1 (1.3) 0.2 (1.1)
Waist circumference (cm) 60.7 (7.9) 63.1 (9.1) 62.2 (8.7) 61.6 (6.1) 61.3 (8.7) 61.5 (7.6)
Physical activity:
LPA (min/day) 182.9 (31.5) 176.8 (23.9) 179.3 (27.26) 167.5 (27.7) 175.8 (30.2) 172.2 (29.3)
MPA (min/day) 49.1 (11.4) 37.8 (9.9) 42.3 (11.8) 55.1 (14.1) 43.8 (12.4) 48.9 (14.3)
VPA (min/day) 17.5 (9.0) 11.1 (5.0) 13.6 (7.5) 18.8 (8.5) 14.1 (7.1) 16.2 (8.1)
Sedentary time (min/day) 505.2 (68.6) 519.8 (58.5) 513.9 (62.9) 505.2 (55.0) 498.1 (57.0) 501.2 (56.0)
20 m SRT performance (shuttle runs) 39.2 (19.5) 25.8 (13.0) 31.1 (17.1) 30.9 (14.4) 20.8 (10.0) 25.4 (13.1)
Food consumption:
Breakfast (%) 89.7 91.6 90.7 92.4 89.4 90.9
Fruit (%) 73.1 71.3 72.1 66.7 77.1 72.0
Vegetables (%) 60.3 48.1 53.7 49.4 48.2 48.8
Fairclough et al. BMC Public Health 2013, 13:626 Page 7 of 14http://www.biomedcentral.com/1471-2458/13/626
benefit [57]. Thus, the positive effects of the CHANGE!intervention on body size outcomes were likely to be ofclinical benefit at the population level, and are consistentwith previous school-based interventions focused onphysical activity and diet. The Lekker Fit! study reporteda 0.71 cm decrease in waist circumference among 9–12year old Intervention children compared to Comparisongroup peers [58]. Moreover, significant decreases in inter-vention children’s BMI z-scores (0.2) were observed aftertwo years follow-up in the APPLE Project [59], and inthe Planet Health study obesity prevalence was signifi-cantly reduced in girls [24]. However, other combinedphysical activity and diet focused interventions have beenless effective in reducing measures of body size and obes-ity prevalence [13,60-62]. Insufficient statistical power todetect changes [13], measurement error [63,64], and lackof group-specific intervention content [24,65] are cited aspossible reasons for lack of intervention effects in thesestudies. Lack of statistical power is relevant to some ofthe analyses in our study, where potentially meaningfulyet non-significant effects on waist circumference andBMI were noted at follow-up.
There was a significant between group difference inLPA at follow-up. The CHANGE! lessons used a genericapproach to promoting increased physical activity andreduced sedentary behaviour which focused on a simplemessage of “move more, sit less”. In this sense the Inter-vention children were not directed to participate in spe-cific physical activity modes or intensities. We felt thatthis non-prescriptive approach would be more ecologic-ally valid as the focus was on habitual physical activityand sedentary time. The between group differences inLPA of 5.1 minutes at post-intervention and 26 minutesat follow-up suggest that the Intervention children en-gaged in more incidental physical activity, even thoughthis was below the moderate intensity threshold com-monly acknowledged as beneficial for health [66]. Recentevidence though suggests that LPA may also play a rolein health promotion. For example among 11-year oldboys and girls objectively assessed LPA was negativelyassociated with DEXA derived fat mass [67]. Similarfindings have been reported by others [68-70] but thesemay be moderated to an extent by sex [69]. The evi-dence supporting inverse relationships between LPA and
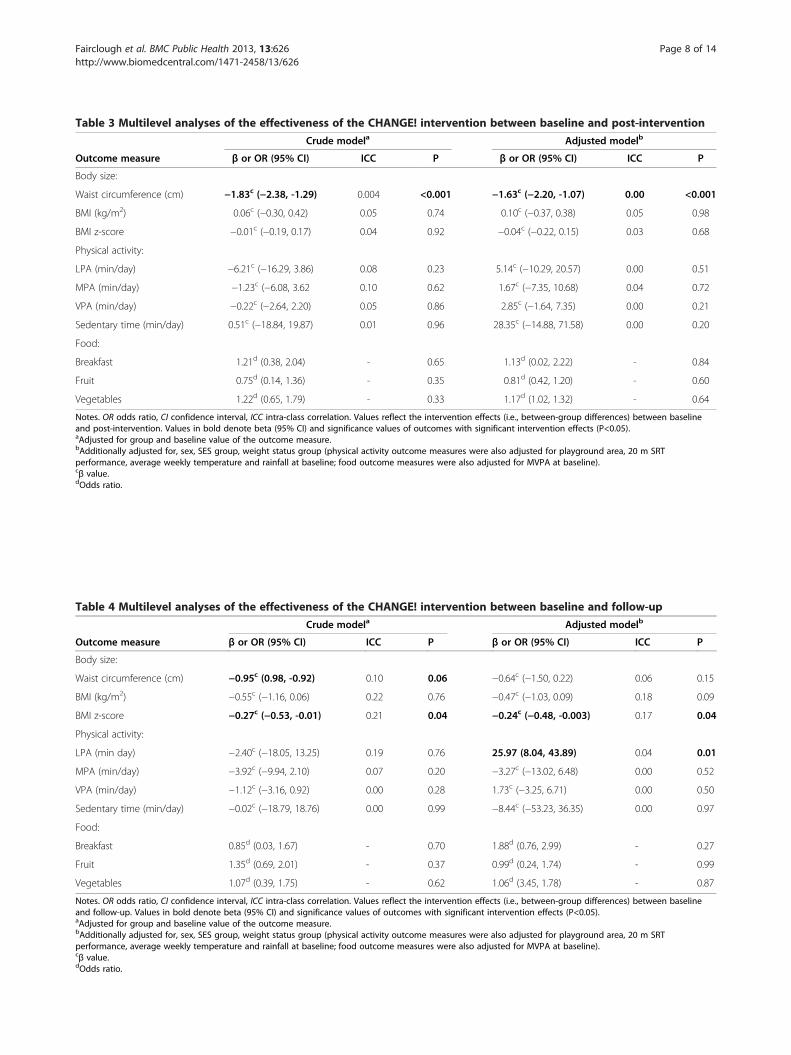
Table 4 Multilevel analyses of the effectiveness of the CHANGE! intervention between baseline and follow-up
Crude modela Adjusted modelb
Outcome measure β or OR (95% CI) ICC P β or OR (95% CI) ICC P
Body size:
Waist circumference (cm) −0.95c (0.98, -0.92) 0.10 0.06 −0.64c (−1.50, 0.22) 0.06 0.15
BMI (kg/m2) −0.55c (−1.16, 0.06) 0.22 0.76 −0.47c (−1.03, 0.09) 0.18 0.09
BMI z-score −0.27c (−0.53, -0.01) 0.21 0.04 −0.24c (−0.48, -0.003) 0.17 0.04
Physical activity:
LPA (min day) −2.40c (−18.05, 13.25) 0.19 0.76 25.97 (8.04, 43.89) 0.04 0.01
MPA (min/day) −3.92c (−9.94, 2.10) 0.07 0.20 −3.27c (−13.02, 6.48) 0.00 0.52
VPA (min/day) −1.12c (−3.16, 0.92) 0.00 0.28 1.73c (−3.25, 6.71) 0.00 0.50
Sedentary time (min/day) −0.02c (−18.79, 18.76) 0.00 0.99 −8.44c (−53.23, 36.35) 0.00 0.97
Food:
Breakfast 0.85d (0.03, 1.67) - 0.70 1.88d (0.76, 2.99) - 0.27
Fruit 1.35d (0.69, 2.01) - 0.37 0.99d (0.24, 1.74) - 0.99
Vegetables 1.07d (0.39, 1.75) - 0.62 1.06d (3.45, 1.78) - 0.87
Notes. OR odds ratio, CI confidence interval, ICC intra-class correlation. Values reflect the intervention effects (i.e., between-group differences) between baselineand follow-up. Values in bold denote beta (95% CI) and significance values of outcomes with significant intervention effects (P<0.05).aAdjusted for group and baseline value of the outcome measure.bAdditionally adjusted for, sex, SES group, weight status group (physical activity outcome measures were also adjusted for playground area, 20 m SRTperformance, average weekly temperature and rainfall at baseline; food outcome measures were also adjusted for MVPA at baseline).cβ value.dOdds ratio.
Table 3 Multilevel analyses of the effectiveness of the CHANGE! intervention between baseline and post-intervention
Crude modela Adjusted modelb
Outcome measure β or OR (95% CI) ICC P β or OR (95% CI) ICC P
Body size:
Waist circumference (cm) −1.83c (−2.38, -1.29) 0.004 <0.001 −1.63c (−2.20, -1.07) 0.00 <0.001
BMI (kg/m2) 0.06c (−0.30, 0.42) 0.05 0.74 0.10c (−0.37, 0.38) 0.05 0.98
BMI z-score −0.01c (−0.19, 0.17) 0.04 0.92 −0.04c (−0.22, 0.15) 0.03 0.68
Physical activity:
LPA (min/day) −6.21c (−16.29, 3.86) 0.08 0.23 5.14c (−10.29, 20.57) 0.00 0.51
MPA (min/day) −1.23c (−6.08, 3.62 0.10 0.62 1.67c (−7.35, 10.68) 0.04 0.72
VPA (min/day) −0.22c (−2.64, 2.20) 0.05 0.86 2.85c (−1.64, 7.35) 0.00 0.21
Sedentary time (min/day) 0.51c (−18.84, 19.87) 0.01 0.96 28.35c (−14.88, 71.58) 0.00 0.20
Food:
Breakfast 1.21d (0.38, 2.04) - 0.65 1.13d (0.02, 2.22) - 0.84
Fruit 0.75d (0.14, 1.36) - 0.35 0.81d (0.42, 1.20) - 0.60
Vegetables 1.22d (0.65, 1.79) - 0.33 1.17d (1.02, 1.32) - 0.64
Notes. OR odds ratio, CI confidence interval, ICC intra-class correlation. Values reflect the intervention effects (i.e., between-group differences) between baselineand post-intervention. Values in bold denote beta (95% CI) and significance values of outcomes with significant intervention effects (P<0.05).aAdjusted for group and baseline value of the outcome measure.bAdditionally adjusted for, sex, SES group, weight status group (physical activity outcome measures were also adjusted for playground area, 20 m SRTperformance, average weekly temperature and rainfall at baseline; food outcome measures were also adjusted for MVPA at baseline).cβ value.dOdds ratio.
Fairclough et al. BMC Public Health 2013, 13:626 Page 8 of 14http://www.biomedcentral.com/1471-2458/13/626

57
58
59
60
61
62
63
64
65
Baseline Post-intervention Follow-up
Wai
st c
irc
(cm
)
17
17.5
18
18.5
19
19.5
20
Baseline Post-intervention Follow-up
BM
I (kg
/m2)
-0.4
-0.2
0
0.2
0.4
0.6
0.8
Baseline Post-intervention Follow-up
BM
I z-s
core
Comparison
Intervention
a
b
cFigure 2 Adjusted means (SE) of body size outcomes across each time point. a: waist circumference; b: BMI; c: BMI z-score.
Fairclough et al. BMC Public Health 2013, 13:626 Page 9 of 14http://www.biomedcentral.com/1471-2458/13/626
body size related outcomes is however equivocal withother authors reporting no associations [71,72]. Never-theless, the role of LPA in health risk reduction may begrowing more prominent [73]. Recent commentary onthis topic in adults highlights that reductions in mortal-ity risk begin with increases in activity beyond baseline(i.e., no activity or sedentary), and that the rate of riskreduction is greatest among the least active members ofthe population [74]. The contention is that LPA is bene-ficial to health when sedentary behaviours are replacedby LPA, and MPA and VPA are constant [74], and there-fore total energy expenditure is increased [66]. Thoughthis relationship between LPA and sedentary time wasnot observed at post-intervention, the significant effectsfor LPA at follow-up did coincide with a between-groupdifference of −8.4 minutes sedentary time. As MPA and
VPA were relatively unchanged the positive effects onLPA and sedentary time support the notion that LPA isof value in the context of total energy expenditure. Fur-thermore, LPA may be more important for the leastactive children, such as girls and the OW group. It isperhaps significant that sub-sample analyses demon-strated greatest effects in these groups in relation toBMI (girls) and waist circumference (OW).No intervention effects were observed for MPA and
VPA. It is likely that relying solely on a curricular inter-vention to illicit significant change in these relativelyhigher PA intensities was insufficient. In the school set-ting, environmental and/or policy intervention compo-nents would most likely have complemented the curricularand homework elements of CHANGE! to increase MPAand VPA [11,75]. For example, in Australia the Fit-4-Fun
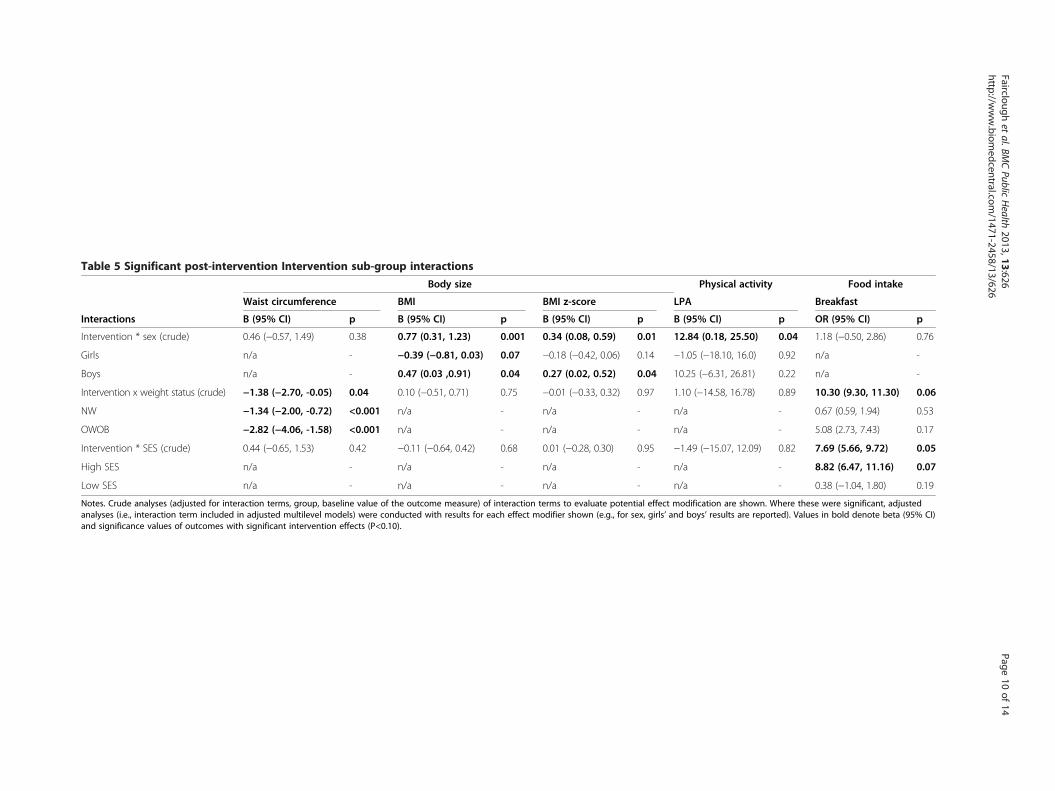
Table 5 Significant post-intervention Intervention sub-group interactions
Body size Physical activity Food intake
Waist circumference BMI BMI z-score LPA Breakfast
Interactions Β (95% CI) p Β (95% CI) p Β (95% CI) p Β (95% CI) p OR (95% CI) p
Intervention * sex (crude) 0.46 (−0.57, 1.49) 0.38 0.77 (0.31, 1.23) 0.001 0.34 (0.08, 0.59) 0.01 12.84 (0.18, 25.50) 0.04 1.18 (−0.50, 2.86) 0.76
Girls n/a - −0.39 (−0.81, 0.03) 0.07 −0.18 (−0.42, 0.06) 0.14 −1.05 (−18.10, 16.0) 0.92 n/a -
Boys n/a - 0.47 (0.03 ,0.91) 0.04 0.27 (0.02, 0.52) 0.04 10.25 (−6.31, 26.81) 0.22 n/a -
Intervention x weight status (crude) −1.38 (−2.70, -0.05) 0.04 0.10 (−0.51, 0.71) 0.75 −0.01 (−0.33, 0.32) 0.97 1.10 (−14.58, 16.78) 0.89 10.30 (9.30, 11.30) 0.06
NW −1.34 (−2.00, -0.72) <0.001 n/a - n/a - n/a - 0.67 (0.59, 1.94) 0.53
OWOB −2.82 (−4.06, -1.58) <0.001 n/a - n/a - n/a - 5.08 (2.73, 7.43) 0.17
Intervention * SES (crude) 0.44 (−0.65, 1.53) 0.42 −0.11 (−0.64, 0.42) 0.68 0.01 (−0.28, 0.30) 0.95 −1.49 (−15.07, 12.09) 0.82 7.69 (5.66, 9.72) 0.05
High SES n/a - n/a - n/a - n/a - 8.82 (6.47, 11.16) 0.07
Low SES n/a - n/a - n/a - n/a - 0.38 (−1.04, 1.80) 0.19
Notes. Crude analyses (adjusted for interaction terms, group, baseline value of the outcome measure) of interaction terms to evaluate potential effect modification are shown. Where these were significant, adjustedanalyses (i.e., interaction term included in adjusted multilevel models) were conducted with results for each effect modifier shown (e.g., for sex, girls’ and boys’ results are reported). Values in bold denote beta (95% CI)and significance values of outcomes with significant intervention effects (P<0.10).
Faircloughet
al.BMCPublic
Health
2013,13:626Page
10of
14http://w
ww.biom
edcentral.com/1471-2458/13/626
Fairclough et al. BMC Public Health 2013, 13:626 Page 11 of 14http://www.biomedcentral.com/1471-2458/13/626
intervention which included modifications to the recessenvironment and prescribed family engagement activitiesto complement the curriculum intervention component,reported improvements in BMI, BMI z-score, and PA [76].In CHANGE!, however, resources were not available andpolicy changes were not forthcoming to modify the likes ofthe recess environment (e.g., playground markings, equip-ment availability), physical education class content and de-livery, access to school facilities out of hours, etc. Althoughthe Intervention children recorded less sedentary time thanthe Comparison group at follow up, at post-interventionthey did over 28 minutes more. It is possible that thechildren did not act upon the intervention messages re-garding sedentary behaviours, or that the messages werenot sufficiently emphasised either in the lesson plans orin the lesson delivery. While plausible, this explanation islimited though by the absence of lesson observations orteacher evaluations.No intervention effects were observed for the selected
day food intake outcomes. The relatively short durationof the CHANGE! intervention and the dichotomous re-sponse structure of the previous day food intake meas-ure offer some explanation why this was the case.Moreover, high baseline values observed for these out-comes suggests a ceiling effect may have been evidentwhereby it was not possible to detect children with sig-nificantly better or worse food intakes than others. Thisphenomenon is not uncommon when assessing behav-ioural outcomes in school-based interventions [13].Sub-group analyses highlighted how intervention ef-
fects for BMI were significantly greater in girls than inboys. These findings endorse the contention that genderis a significant moderator of school-based energy bal-ance behaviour interventions, which appear to typicallywork better for girls than boys [54]. Indeed, the signifi-cant post-intervention increases in the intervention boys’BMI and BMI z-score values reinforce this viewpoint. Asignificant intervention effect on waist circumferencewas evident for all Intervention children, but was stron-ger in OW children compared to NW children at post-intervention. This demonstrates that not only was theCHANGE! intervention effective for children across theweight status spectrum, but that it was particularly ef-fective for those who were initially overweight or obese,and who therefore were at greatest potential risks ofpoor health. In developed countries prevalence of over-weight and obesity is highest in children from low SESfamilies [58-60], and there is evidence that low SES chil-dren are more likely to have poorer diets [77-79]. Weobserved that children in the high SES interventiongroup were much more likely to eat breakfast than thosethe low SES group. Breakfast is advocated as an import-ant element of a healthy lifestyle for young people that isassociated with reduced body weight and other positive
health outcomes [44,80]. The limited evidence investigatingthe influence of SES on the effectiveness of school-basedinterventions to promote healthy weight is equivocal, pos-sibly because studies have employed different measures ofSES [81], which may be independently associated withbody size outcomes [82]. By focusing on the promotion ofhealthy weight rather than weight loss per se, a favourableresponse was observed in the OW group. De-emphasisingbody weight but reinforcing and promoting healthy lifestylebehaviours related to energy balance may encourage moresustained changes in behaviour which can facilitate positivechanges in body size [83].This study demonstrated positive effects on body size
outcomes and has several strengths. Over 75% of thestudy population consented to participate which reducedthe risk of sampling bias. Randomisation occurred at theschool level so as to reduce the risk of contamination toComparison group children, and this cluster-randomiseddesign was accounted for in the analyses. The interven-tion content was relevant to the local context of theschools and unlike other similar studies, was informedby the participants’ opinions and beliefs [22,23]. Few in-terventions of this nature have involved parents toreinforce their children’s engagement in healthy behav-iours. Through regular family-focused homework tasksthe children and their parents were provided with op-portunities to learn together, thus messages about PAand healthy eating were promoted beyond the school en-vironment and into the wider family unit. Furthermore,integration of the intervention with the existing curricu-lum and delivery by class teachers was a sustainable ap-proach, that was undertaken at minimal financial cost.The low cost and simplicity of the intervention wouldmake it easy to adopt and implement in others schoolselsewhere in the UK.The lack of an objective measure of food intake was a
limitation of the study. The previous day food intakesurvey did not give a picture of dietary behaviours over atypical week. Moreover, the inability of the survey to rec-ord macronutrients did not allow energy intake to be es-timated, and as a result we were unable to investigate theintervention’s effect on energy balance. For these reasonswe were unable to confidently explain the positive effectson body size. Although teachers in the Interventionschools received training in use of the curriculum re-source and homework tasks, there was no on-going rec-ord of lesson delivery or evaluation. Teachers providedfeedback at the end of the study, but any inconsistenciesin lesson delivery that occurred during the 20 week inter-vention period could not be addressed at the time, whichincreased the risk of intervention infidelity. Although theintervention training and curriculum resources wereapplicable to all Year 6 primary school teachers it isacknowledged that schools and individual teachers may

Fairclough et al. BMC Public Health 2013, 13:626 Page 12 of 14http://www.biomedcentral.com/1471-2458/13/626
have approached teaching the lessons in different ways,and this could have influenced the study results. Fur-thermore, although Comparison schools did not teacha specific unit of PSHE focused on healthy eating andPA, concepts related to these areas may have beentouched on informally during other lessons such as sci-ence, food technology, and physical education. We donot believe that this would have impacted in a mean-ingful way on the eating and PA behaviours of theComparison group, but acknowledge that this was notcontrolled. These points therefore should be taken intoaccount when considering the generalisability of thefindings. The higher levels of PA observed among theIntervention children at baseline suggest that the studydesign was a limitation, whereby the schools were allo-cated to Intervention or Comparison conditions priorto baseline data collection. An alternative approach isto randomise schools to conditions following initialcomparisons of baseline data, but this was not possibledue to the need to schedule Intervention teacher train-ing combined with the number of weeks required forthe intervention in relation to the available weeks acrossthe school year. Furthermore, human resource con-straints prohibited blinding of the research team to allo-cation of schools to the Intervention and Comparisonconditions, and subsequent data analysis. Unlike someschool-based interventions this study included a follow-up phase after the intervention lessons had ended. Theduration of this though was limited to 10 weeks andtherefore it could only be recognised as a short termperiod when intervention effects are likely to be stronger.To impact health, behaviour change needs to be sustainedin the medium term (i.e., 6 months) and long term (i.e., 12months and beyond). This pragmatic evaluation assessedthe effectiveness of the CHANGE! intervention under‘real-life’ conditions, and thus the design and limitations ofthe study reflected this.
ConclusionsThe CHANGE! school-based curriculum interventionresulted in significant effects on waist circumference,BMI z-scores, and LPA. CHANGE! was most effectiveamong girls, overweight/obese, and high SES partici-pants. The study findings add further support for theeffectiveness of combined school-based physical activ-ity and nutrition interventions. Effectiveness may beenhanced when such curriculum-based interventionsinclude a formative phase to inform intervention de-sign, involve parents in the children’s learning, focuson the positive aspects of PA and healthy eating ratherthan body weight or obesity prevention, have low partici-pant burden, and are low cost. Further work is required totest intervention fidelity and the sustained effectiveness ofthis approach in the medium and long term.
Competing interestsThe authors declare that they have no competing interests.
Authors’ contributionsSJF and LMB conceived and designed the study, assisted with datacollection, undertook the analysis, and wrote the manuscript. IGD and AFHdesigned the study and commented on drafts of the manuscript. KAM, RG,and GW undertook data collection and commented on drafts of themanuscript.GS commented on drafts of the manuscript. EvS advised on theanalyses and commented on drafts of the manuscript. All authors read andapproved the final manuscript.
AcknowledgementsThe authors acknowledge the participation and help of the teachers andchildren involved in the study, and Helen Roberts and Alex Jones at WiganCouncil. This work was carried out at Liverpool John Moores University atthe Research Institute for Sport and Exercise Sciences and the Faculty ofEducation, Community, and Leisure. GS and KAM are now based at theUniversity of Swansea, and RG is now based at Liverpool Hope University.
Author details1Physical Activity Exchange, Research Institute for Sport and ExerciseSciences, Liverpool John Moores University, 62, Great Crosshall Street,Liverpool, UK. 2Faculty of Education, Community, and Leisure, Liverpool JohnMoores University, IM Marsh Campus, Barkhill Road, Liverpool, UK.3Department of Health Sciences, Liverpool Hope University, Hope Park,Taggert Avenue, Liverpool, UK. 4Research Centre for Sports and ExerciseSciences, College of Engineering, University of Swansea, Swansea, UK.5School of Sports Science, Exercise and Health, University of WesternAustralia, Perth, Australia. 6MRC Epidemiology Unit & UKCRC Centre for Dietand Activity Research, Institute of Public Health, Cambridge, UK.
Received: 20 March 2013 Accepted: 28 June 2013Published: 2 July 2013
References1. Freedman DS, Mei Z, Srinivasan SR, Berenson GS, Dietz WH: Cardiovascular
risk factors and excess adiposity among overweight children andadolescents: the bogalusa heart study. J Pediatr 2007, 150:12–17. e12.
2. Boddy LM, Hackett AF, Stratton G: Changes in fitness, body mass indexand obesity in 9–10 year olds. J Hum Nutr Diet 2010, 23:254–259.
3. Rokholm B, Baker JL, Sorensen TI: The levelling off of the obesity epidemicsince the year 1999 - a review of evidence and perspectives. Obes Rev2010, 11:835–846.
4. Rowland T: The childhood obesity epidemic: putting the ‘dynamics’ intothermodynamics. Ped Exerc Sci 2004, 16:87–93.
5. Hills AP, Andersen LB, Byrne NM: Physical activity and obesity in children.Br J Sports Med 2011, 45:866–870.
6. Steele RM, van Sluijs EM, Sharp SJ, Landsbaugh JR, Ekelund U, Griffin SJ: Aninvestigation of patterns of children's sedentary and vigorous physicalactivity throughout the week. Int J Behav Nutr Phys Act 2010, 7:88.
7. Yngve A, Wolf A, Poortvliet E, Elmadfa I, Brug J, Ehrenblad B, Franchini B,Haraldsdottir J, Krolner R, Maes L, et al: Fruit and vegetable intake in asample of 22-year old children in 9 european countries. Ann Nutr Metab2005, 49:236–245.
8. LaRowe TL, Moeller SM, Adams AK: Beverage patterns, diet quality, andbody mass index of US preschool and school-aged children. J Am DietAssoc 2007, 107:1124–1133.
9. Brown T, Summerbell C: Systematic review of school-based interventionsthat focus on changing dietary intake and physical activity levels toprevent childhood obesity: an update to the obesity guidance producedby the national institute for health and clinical excellence. Obes Rev 2009,10:110–141.
10. Mountjoy M, Andersen LB, Armstrong N, Biddle S, Boreham C, Bedenbeck HP,Ekelund U, Engebretsen L, Hardman K, Hills A, et al: International olympiccommittee consensus statement on the health and fitness of young peoplethrough physical activity and sport. Br J Sports Med 2011, 45:839–848.
11. van Sluijs EMF, McMinn AM, Griffin SJ: Effectiveness of interventions topromote physical activity in children and adolescents: systematic reviewof controlled trials. BMJ 2007, 335:703.

Fairclough et al. BMC Public Health 2013, 13:626 Page 13 of 14http://www.biomedcentral.com/1471-2458/13/626
12. Waters E, de Silva-Sanigorski A, Hall BJ, Brown T, Campbell KJ, Gao Y,Armstrong R, Prosser L, Summerbell CD: Interventions for preventingobesity in children. Cochrane Database Syst Rev 2011(12). doi:10.1002/14651858.CD001871.pub3. Art. No.: CD001871.
13. Warren JM, Henry CJ, Lightowler HJ, Bradshaw SM, Perwaiz S: Evaluation ofa pilot school programme aimed at the prevention of obesity inchildren. Health Promot Int 2003, 18:287–296.
14. Amaro S, Viggiano A, Di Costanzo A, Madeo I, Baccari ME, Marchitelli E, Raia M,Viggiano E, Deepak S, Monda M, et al: Kaledo, a new educational board-game,gives nutritional rudiments and encourages healthy eating in children: apilot cluster randomized trial. Eur J Pediatr 2006, 165:630–635.
15. De Bourdeaudhuij I, Van Cauwenberghe E, Spittaels H, Oppert JM, Rostami C,Brug J, Van Lenthe F, Lobstein T, Maes L: School-based interventionspromoting both physical activity and healthy eating in Europe: a systematicreview within the HOPE project. Obes Rev 2011, 12:205–216.
16. Hollar D, Messiah SE, Lopez-Mitnik G, Hollar TL, Almon M, Agatston AS:Healthier options for public schoolchildren program improves weightand blood pressure in 6- to 13-year-olds. J Am Diet Assoc 2010,110:261–267.
17. Hollar D, Messiah SE, Lopez-Mitnik G, Hollar TL, Almon M, Agatston AS:Effect of a two-year obesity prevention intervention on percentilechanges in body mass index and academic performance in low-incomeelementary school children. Am J Public Health 2010, 100:646–653.
18. Wigan Borough Partnership: Living well in wigan borough, Joint publichealth strategy. Wigan: Wigan Borough Partnership; 2007.
19. Zwarenstein M, Treweek S, Gagnier JJ, Altman DG, Tunis S, Haynes B,Oxman AD, Moher D: Improving the reporting of pragmatic trials: anextension of the CONSORT statement. BMJ 2008, 337:a2390.
20. Wigan Council: Equality information and objectives. http://www.wigan.gov.uk/Council/Strategies-Plans-and-Policies/Equality-and-Diversity/Equality-information-and-objectives.aspx.
21. Bandura A: Social foundations of thought and action: a social cognitivetheory. Englewood Cliffs, NJ: Prentice Hall; 1986.
22. Boddy L, Knowles Z, Davies I, Warburton G, Mackintosh K, Houghton L,Fairclough SJ: Using formative research to develop the healthy eatingcomponent of the change! school-based curriculum intervention.BMC Public Health 2012, 12:710.
23. Mackintosh K, Knowles Z, Ridgers ND, Fairclough SJ: Using formativeresearch to develop CHANGE!: a curriculum-based physical activitypromoting intervention. BMC Public Health 2011, 11(1):831.
24. Gortmaker SL, Peterson K, Wiecha J, Sobol AM, Dixit S, Fox MK, Laird N:Reducing obesity via a school-based interdisciplinary interventionamong youth: planet health. Arch Pediatr Adolesc Med 1999, 153:409–418.
25. Kipping RR, Jago R, Lawlor DA: Diet outcomes of a pilot school-basedrandomised controlled obesity prevention study with 9–10 year olds inengland. Prev Med 2010, 51(1):56–62.
26. Kipping RR, Payne C, Lawlor DA: Randomised controlled trial adapting USschool obesity prevention to England. Arch Dis Child 2008, 93:469–473.
27. Duncan S, McPhee J, Schluter P, Zinn C, Smith R, Schofield G: Efficacy of acompulsory homework programme for increasing physical activity andhealthy eating in children: the healthy homework pilot study. Int J BehavNutr Phys Act 2011, 8:127.
28. Personal, social and health educaiton key stage 2. Non-statutory content.http://www.biomedcentral.com/bmcpublichealth/authors/instructions/debate#formatting-references.
29. Lohman T, Roche AF, Martorell R: Anthropometric standardization referencemanual. Champaign, Illinois: Human Kinetics; 1988.
30. Cole TJ, Freeman JV, Preece MA: Body mass index reference curves for theUK, 1990. Arch Dis Child 1995, 73:25–29.
31. Trost SG, Ward DS, Moorehead SM, Watson PD, Riner W, Burke JR: Validityof the computer science and application (CSA) activity monitor inchildren. Med Sci Sports Exerc 1998, 30:629–633.
32. McClain JJ, Abraham TL, Brusseau TA, Tudor-Locke C: Epoch length andaccelerometer outputs in children: comparison to direct observation.Med Sci Sports Exerc 2008, 40:2080–2087.
33. Catellier DJ, Hannan PJ, Murray DM, Addy CL, Conway TL, Yang S, Rice JC:Imputation of missing data when measuring physical activity byaccelerometry. Med Sci Sports Exerc 2006, 37:S555–S562.
34. Graves LEF, Ridgers ND, Atkinson G, Stratton G: The effect of active videogaming on children's physical activity, behavior preferences and bodycomposition. Ped Exerc Sci 2011, 22:535–546.
35. Rowlands AV, Pilgrim EL, Eston RG: Patterns of habitual activity acrossweekdays and weekend days in 9–11 year old children. Prev Med 2008,46:317–324.
36. Mattocks C, Ness AR, Leary SD, Tilling K, Blair SN, Sheild J, Deere K, Saunders J,Kirkby J, Davey Smith G, et al: Use of accelerometers in a large field-basedstudy of children: protocols, design issues, and effects on precision. J PhysAct Health 2008, 5:S98–S111.
37. Mackintosh KA, Fairclough SJ, Stratton G, Ridgers ND: A calibrationprotocol for population-specific accelerometer cut-points in children.PLoS One 2012, 7:e36919.
38. Trost SG, Loprinzi PD, Moore R, Pfeiffer KA: Comparison of accelerometercut-points for predicting activity intensity in youth. Med Sci Sports Exerc2011, 43:1360–1368.
39. Taylor S, Hackett A, Stratton G, Lamb L: SportsLinx: improving the healthand fitness of Liverpool’s youth. Educ Health 2004, 22(1):3–7.
40. Johnson B, Hackett A, Bibby A, Cross J: An investigation of the facevalidity of a food intake questionnaire: lessons for dietary advice? J HumNutr Diet 1999, 12:307–316.
41. Johnson B, Hackett AF, Roundfield M, Coufopoulos A: An investigation ofthe validity and reliability of a food intake questionnaire. J Hum Nutr Diet2001, 14:457–465.
42. Johnson B, Hackett AF: Trends in fruit, vegetable and salad intakesin 9-10-year-old schoolchildren living in liverpool, 2000–2005. PublicHealth Nutr 2007, 10:252–255.
43. Boddy LM, Abayomi J, Johnson B, Hackett AF, Stratton G: Ten year changesin positive and negative marker food, fruit, vegatables, and salad intakein 9–10 year olds: SportsLinx 2000–2001 to 2010–2011. J Hum Nutr Diet2013. doi:10.1111/jhn.12129.
44. Szajewska H, Ruszczynski M: Systematic review demonstrating thatbreakfast consumption influences body weight outcomes inchildren and adolescents in europe. Crit Rev Food Sci Nutr 2010,50:113–119.
45. Cole TJ, Bellizzi MC, Flegal KM, Dietz WH: Establishing a standard definitionfor child overweight and obesity worldwide: international survey. BMJ2000, 320:1240–1244.
46. Mirwald R, Baxter-Jones A, Bailey D, Beunen G: An assessment ofmaturity from anthropometric measurements. Med Sci Sports Exerc2002, 34:689–694.
47. EUROFIT: European test of physical fitness. Rome: Committee for theDevelopment of Sport, Council of Europe; 1998.
48. Stratton G, Canoy D, Boddy LM, Taylor SR, Hackett AF, Buchan IE:Cardiorespiratory fitness and body mass index of 9-11-year-old englishchildren: a serial cross-sectional study from 1998 to 2004. Int J Obes 2007,31:1172–1178.
49. Van Mechelen W, Hlobil H, Kemper H: Validation of two running tests asestimates of maximal aerobic power in children. Eur J Appl Physiol OccupPhysiol 1986, 55:S03–S06.
50. Department for Communities and Local Government: The english indicesof deprivation 2007. Wetherby: Communities and Local GovernmentPublications; 2008.
51. Ridgers ND, Fairclough SJ, Stratton G: Variables associated with children'sphysical activity levels during recess: the a-CLASS project. nt J Behav NutrPhys Act 2010, 7:74.
52. Wigan: Forecast Weather. http://www.biomedcentral.com/bmcpublichealth/authors/instructions/debate#formatting-references.
53. Goldstein H: Multilevel statistical models. 2nd edition. London: Arnold; 1995.54. Twisk JWR: Applied multilevel analysis. Cambridge: Cambridge University
Press; 2006.55. Maffeis C, Pietrobelli A, Grezzani A, Provera S, Tato L: Waist circumference
and cardiovascular risk factors in prepubertal children. Obes Res 2001,9:179–187.
56. Freedman DS, Kahn HS, Mei Z, Grummer-Strawn LM, Dietz WH, Srinivasan SR,Berenson GS: Relation of body mass index and waist-to-height ratio tocardiovascular disease risk factors in children and adolescents: the bogalusaheart study. Am J Clin Nutr 2007, 86:33–40.
57. Lazarus R, Wake M, Hesketh K, Waters E: Change in body mass index inAustralian primary school children, 1985–1997. Int J Obes Relat MetabDisord 2000, 24:679–684.
58. Jansen W, Borsboom G, Meima A, Zwanenburg EJ-V, Mackenbach JP, Raat H,Brug J: Effectiveness of a primary school-based intervention to reduceoverweight. Int J Ped Obes 2011, 6:e70–e77.
Fairclough et al. BMC Public Health 2013, 13:626 Page 14 of 14http://www.biomedcentral.com/1471-2458/13/626
59. Taylor RW, McAuley KA, Barbezat W, Strong A, Williams SM, Mann JI: APPLEproject: 2-y findings of a community-based obesity prevention programin primary school age children. Am J Clin Nutr 2007, 86:735–742.
60. Sahota P, Rudolf MCJ, Dixey R, Hill AJ, Barth JH, Cade J: Randomisedcontrolled trial of primary school based intervention to reduce riskfactors for obesity. BMJ 2001, 323:1029–1032.
61. Singh AS, Chin APMJ, Kremers SP, Visscher TL, Brug J, van Mechelen W:Design of the dutch obesity intervention in teenagers (NRG-DOiT):systematic development, implementation and evaluation of a school-based intervention aimed at the prevention of excessive weight gain inadolescents. BMC Public Health 2006, 6:304.
62. Trevino RP, Yin Z, Hernandez A, Hale DE, Garcia OA, Mobley C: Impact ofthe bienestar school-based diabetes mellitus prevention program onfasting capillary glucose levels: a randomized controlled trial. Arch PediatrAdolesc Med 2004, 158:911–917.
63. Bader N, Bosy-Westphal A, Dilba B, Muller MJ: Intra- and interindividualvariability of resting energy expenditure in healthy male subjects -biological and methodological variability of resting energy expenditure.Br J Nutr 2005, 94:843–849.
64. Nooyens AC, Koppes LL, Visscher TL, Twisk JW, Kemper HC, Schuit AJ,van Mechelen W, Seidell JC: Adolescent skinfold thickness is a betterpredictor of high body fatness in adults than is body mass index: theamsterdam growth and health longitudinal study. Am J Clin Nutr 2007,85:1533–1539.
65. Sallis JF, McKenzie TL, Conway T, Elder J, Prochaska JJ, Brown M, Zive MM,Marshall S, Alcarez J: Environmental interventions for eating and physicalactivity. A randomized control trial in middle school. Am J Prev Med 2003,24:209–217.
66. Chief Medical Officers: Start active, stay active, A report on physical activityfor health from the four home countries. London: Crown Copyright; 2011.
67. Kwon S, Janz KF, Burns TL, Levy SM: Association between light-intensityphysical activity and adiposity in childhood. Pediatr Exerc Sci 2011,23:218–229.
68. Butte NF, Puyau MR, Adolph AL, Vohra FA, Zakeri I: Physical activity innonoverweight and overweight hispanic children and adolescents.Med Sci Sports Exerc 2007, 39:1257–1266.
69. Treuth MS, Hou N, Young DR, Maynard LM: Accelerometry-measuredactivity or sedentary time and overweight in rural boys and girls.Obes Res 2005, 13:1606–1614.
70. Stone MR, Rowlands AV, Middlebrooke AR, Jawis MN, Eston RG: The patternof physical activity in relation to health outcomes in boys. Int J Ped Obes2009, 4:306–315.
71. Hughes AR, Henderson A, Ortiz-Rodriguez V, Artinou ML, Reilly JJ: Habitualphysical activity and sedentary behaviour in a clinical sample of obesechildren. Int J Obes 2006, 30:1494–1500.
72. Thompson AM, Campagna PD, Durant M, Murphy RJL, Rehman LA,WAdsworth LA: Are overweight students in grades 3, 7, and 11 lessphysically active than their healthy weight counterparts? Int J Ped Obes2009, 4:28–35.
73. Kim J, Tanabe K, Yokoyama N, Zempo H, Kuno S: Objectively measuredlight-intensity lifestyle activity and sedentary time are independentlyassociated with metabolic syndrome: a cross-sectional study of Japaneseadults. nt J Behav Nutr Phys Act 2013, 10:30.
74. Powell KE, Paluch AE, Blair SN: Physical activity for health: what kind? Howmuch? How intense? on top of what? Ann Rev Pub Health 2011,32:349–365.
75. Kriemler S, Meyer U, Martin E, van Sluijs EMF, Andersen LB, Martin BW:Effect of school-based interventions on physical activity and fitness inchildren and adolescents: a review of reviews and systematic update.Br J Sports Med 2011, 45:923–930.
76. Eather N, Morgan PJ, Lubans DR: Improving the fitness and physicalactivity levels of primary school children: results of the Fit-4-Fun grouprandomized controlled trial. Prev Med 2013, 56:12–19.
77. Grimes CA, Campbell KJ, Riddell LJ, Nowson CA: Is socioeconomic statusassociated with dietary sodium intake in Australian children? Across-sectional study. BMJ Open 2013, 3:e002106. doi:10.1136/bmjopen-2012-002106.
78. Brug J, van Stralen MM, te Velde SJ, Chinapaw MJM, De Bourdeaudhuij I,Lien N, Bere E, Maskini V, Singh AS, Maes L, et al: Differences in weightstatus and energy-balance related behaviors among schoolchildrenacross europe: the ENERGY-project. PLoS One 2012, 7:e34742.
79. Eloranta AM, Lindi V, Schwab U, Kiiskinen S, Kalinkin M, Lakka HM, Lakka TA:Dietary factors and their associations with socioeconomic background infinnish girls and boys 6–8 years of age: the PANIC study. Eur J Clin Nutr2011, 65:1211–1218.
80. Albertson AM, Thompson D, Franko DL, Kleinman RE, Barton BA, Crockett SJ:Consumption of breakfast cereal is associated with positive healthoutcomes: evidence from the national heart, lung, and blood institutegrowth and health study. Nutr Res 2008, 28:744–752.
81. Gorely T, Nevill ME, Morris JS, Stensel DJ, Nevill AM: Effect of a schoolbased intervention to promote healthy lifestyles in 7–11 year oldchildren. Int J Behav Nutr Phys Act 2009, 6(5). doi:10.1186/1479-5868-6-5.
82. Janssen I, Boyce WF, Simpson K, Pickett W: Influence of individual- andarea-level measures of socioeconomic status on obesity, unhealthyeating, and physical inactivity in canadian adolescents. Am J Clin Nutr2006, 83:139–145.
83. Bacon L, Aphramor L: Weight science: evaluating the evidence for aparadigm shift. Nutr J 2011, 10:9.
doi:10.1186/1471-2458-13-626Cite this article as: Fairclough et al.: Promoting healthy weight inprimary school children through physical activity and nutritioneducation: a pragmatic evaluation of the CHANGE! randomisedintervention study. BMC Public Health 2013 13:626.
Submit your next manuscript to BioMed Centraland take full advantage of:
• Convenient online submission
• Thorough peer review
• No space constraints or color figure charges
• Immediate publication on acceptance
• Inclusion in PubMed, CAS, Scopus and Google Scholar
• Research which is freely available for redistribution
Submit your manuscript at www.biomedcentral.com/submit