RESEARCH ARTICLE Open Access Measuring household ...
15
RESEARCH ARTICLE Open Access Measuring household vulnerability to climate-induced stresses in pastoral rangelands of Kenya: Implications for resilience programming Francis EO Opiyo 1,2* , Oliver V Wasonga 1,3 and Moses M Nyangito 1 Abstract This study uses statistical and econometric tools to measure households’ vulnerability in pastoral rangelands of Kenya. It considered 27 socio-economic and biophysical indicators obtained from 302 households’ in-depth interviews to reflect climate vulnerability components: adaptive capacity, exposure and sensitivity. The theoretical framework used combines exposure and sensitivity to produce potential impact, which was then compared with adaptive capacity in order to generate an overall measure of vulnerability. Principal component analysis (PCA) was used to develop weights for different indicators and produce a household vulnerability index (HVI) so as to classify households according to their level of vulnerability. In order to understand the determinants of vulnerability to climate-induced stresses, an ordered probit model was employed with predictor variables. The results show that 27% of households were highly vulnerable, 44% were moderately vulnerable and 29% of households were less vulnerable to climate-induced stresses. Factor estimates of the probit model further revealed that the main determinants of pastoral vulnerability are sex of household head, age of household head, number of dependents, marital status, social linkages, access to extension services and early warning information, complementary source of income, herd size and diversity, herd structure, herd mobility, distance to markets, employment status, coping strategies and access to credit. Therefore, policies that address these determinants of vulnerability with emphasis on women's empowerment, education and income diversifications are likely to enhance resilience of pastoral households. Keywords: Climate change; Pastoralists; Principal component analysis; Resilience; Vulnerability Background Vulnerability, commonly defined as the propensity or predisposition to be adversely affected, has been studied as a composite of adaptive capacity, sensitivity and exposure to hazards (Adger and Kelly 1999; Kelly and Adger 2000; McCarthy et al. 2001; Intergovernmental Panel on Climate Change IPCC 2001; Adger 2006; Füssel 2007; Paavola 2008; Yuga et al. 2010). Adaptive capacity is the ability of people to cope with or adjust to the changing context and is explained by socio-economic indicators. Sensitivity is the ability of a system to be affected, and exposure is the incidences of events (Kasperson et al. 1995; Adger 2006; Paavola 2008). Vulnerability is thus comprised of risks or a chain of risky events that households confront in pursuit of their livelihoods, the sensitivity of livelihood to these risks, the response or options that households have for managing these risks and finally the outcomes that describe the loss in wellbeing (Turner et al. 2003). On the other hand, resilience is seen as the ability to self-organize, learn and adapt to risk hazards (Carpenter et al. 2001; Turner et al. 2003). The United Nations International Strategy for Disaster Reduction (United Nations International Strategy for Disaster Reduction- UNISDR 2009) defines resilience as the transformative process of a household or community exposed to hazards to resist, absorb, accommodate and recover from hazards * Correspondence: [email protected] 1 Department of Land Resources Management and Agricultural Technology, University of Nairobi, P.O. Box 29053, Kabete, Nairobi 00625, Kenya 2 Dryland Development Centre, United Nations Development Programme (UNDP), United Nations Office in Nairobi, P.O. Box 30552, Nairobi, Gigiri 00100, Kenya Full list of author information is available at the end of the article © 2014 Opiyo et al.; licensee Springer. This is an Open Access article distributed under the terms of the Creative Commons Attribution License (http://creativecommons.org/licenses/by/4.0), which permits unrestricted use, distribution, and reproduction in any medium, provided the original work is properly credited. Opiyo et al. Pastoralism: Research, Policy and Practice 2014, 4:10 http://www.pastoralismjournal.com/content/4/1/10
Transcript of RESEARCH ARTICLE Open Access Measuring household ...

Opiyo et al. Pastoralism: Research, Policy and Practice 2014, 4:10http://www.pastoralismjournal.com/content/4/1/10
RESEARCH ARTICLE Open Access
Measuring household vulnerability toclimate-induced stresses in pastoralrangelands of Kenya: Implicationsfor resilience programmingFrancis EO Opiyo1,2*, Oliver V Wasonga1,3 and Moses M Nyangito1
Abstract
This study uses statistical and econometric tools to measure households’ vulnerability in pastoral rangelands of Kenya.It considered 27 socio-economic and biophysical indicators obtained from 302 households’ in-depth interviews toreflect climate vulnerability components: adaptive capacity, exposure and sensitivity. The theoretical framework usedcombines exposure and sensitivity to produce potential impact, which was then compared with adaptive capacity inorder to generate an overall measure of vulnerability. Principal component analysis (PCA) was used to develop weightsfor different indicators and produce a household vulnerability index (HVI) so as to classify households according to theirlevel of vulnerability. In order to understand the determinants of vulnerability to climate-induced stresses, an orderedprobit model was employed with predictor variables. The results show that 27% of households were highly vulnerable,44% were moderately vulnerable and 29% of households were less vulnerable to climate-induced stresses. Factorestimates of the probit model further revealed that the main determinants of pastoral vulnerability are sex ofhousehold head, age of household head, number of dependents, marital status, social linkages, access to extensionservices and early warning information, complementary source of income, herd size and diversity, herd structure,herd mobility, distance to markets, employment status, coping strategies and access to credit. Therefore, policiesthat address these determinants of vulnerability with emphasis on women's empowerment, education and incomediversifications are likely to enhance resilience of pastoral households.
Keywords: Climate change; Pastoralists; Principal component analysis; Resilience; Vulnerability
BackgroundVulnerability, commonly defined as the propensity orpredisposition to be adversely affected, has been studied asa composite of adaptive capacity, sensitivity and exposureto hazards (Adger and Kelly 1999; Kelly and Adger 2000;McCarthy et al. 2001; Intergovernmental Panel on ClimateChange IPCC 2001; Adger 2006; Füssel 2007; Paavola 2008;Yuga et al. 2010). Adaptive capacity is the ability of peopleto cope with or adjust to the changing context and isexplained by socio-economic indicators. Sensitivity is
* Correspondence: [email protected] of Land Resources Management and Agricultural Technology,University of Nairobi, P.O. Box 29053, Kabete, Nairobi 00625, Kenya2Dryland Development Centre, United Nations Development Programme(UNDP), United Nations Office in Nairobi, P.O. Box 30552, Nairobi, Gigiri00100, KenyaFull list of author information is available at the end of the article
© 2014 Opiyo et al.; licensee Springer. This is aAttribution License (http://creativecommons.orin any medium, provided the original work is p
the ability of a system to be affected, and exposure isthe incidences of events (Kasperson et al. 1995; Adger2006; Paavola 2008). Vulnerability is thus comprised ofrisks or a chain of risky events that households confrontin pursuit of their livelihoods, the sensitivity of livelihoodto these risks, the response or options that householdshave for managing these risks and finally the outcomesthat describe the loss in wellbeing (Turner et al. 2003).On the other hand, resilience is seen as the ability to
self-organize, learn and adapt to risk hazards (Carpenteret al. 2001; Turner et al. 2003). The United NationsInternational Strategy for Disaster Reduction (UnitedNations International Strategy for Disaster Reduction-UNISDR 2009) defines resilience as the transformativeprocess of a household or community exposed to hazardsto resist, absorb, accommodate and recover from hazards
n Open Access article distributed under the terms of the Creative Commonsg/licenses/by/4.0), which permits unrestricted use, distribution, and reproductionroperly credited.

Opiyo et al. Pastoralism: Research, Policy and Practice 2014, 4:10 Page 2 of 15http://www.pastoralismjournal.com/content/4/1/10
in a timely and efficient manner. Turner et al. (2003) andGallopın (2006) define hazards as threats to a system andcomprised of stressors. For simplicity, the term stress isused in this study to denote a continuous or slowly in-creasing pressure (in this case drought), commonly withinthe range of normal variability. However, over the lastdecades, most of the scientific literature and discourses onvulnerability have concentrated on contributing to theor-etical insights or measurements at the regional or nationalscale, with selected indicators for each region, and identi-fying resilience-building strategies that have implicationfor national and regional planning (Brooks et al. 2005;Füssel 2007; Hinkel 2011). Yet, micro-level vulnerabilityanalysis is an essential prerequisite for local-level planningand prioritization of resilience planning and strategiesespecially among the natural resource-dependent com-munities at risk to projected climate variability andchanges (Callaway 2004; Fraser et al. 2011).While thereis no superior scale of climate vulnerability analysis,recent studies by Yuga et al. (2010) and Marshall et al.(2014) have confirmed that micro-level analyses havehitherto largely been overlooked in favour of ecosystem-scale studies of biophysical vulnerability.As observed by Deressa et al. (2008), climate change
vulnerability analysis ranges from local or householdlevel (Adger 1999) to the global level (Brooks et al. 2005;Intergovernmental Panel on Climate Change IPCC 2014).However, the choice of scale is dictated by the objectives,methodologies and data availability. This present studyfocused on household-level vulnerability analysis. Afterall, it is by understanding, planning for and adapting to achanging climate that individual households can takeadvantage of opportunities to reduce risks associated withclimate-induced stresses (Madu 2012). Similarly, Kleinet al. (2007) observed that vulnerability analysis to climatechange is needed at the level that would enable policymakers to tackle climate change challenges with the preci-sion that is necessary, particularly in the arid and semi-aridregions of Africa. Previous studies by Brooks et al. (2005)and Intergovernmental Panel on Climate Change IPCC(2012) concluded that the majority of households areparticularly vulnerable to the impacts of climate changein the arid and semi-arid regions. Although the causesof such vulnerability are multi-dimensional, they areprimarily due to widespread poverty, food insecurity,recurrent droughts, land degradation, inequitable landdistribution and overdependence on rain-fed agricul-ture (Notenbaert et al. 2013; Lo´pez-Carr et al. 2014).Some of the other common factors also postulated todetermine adaptive capacity, and therefore influencevulnerability at the household level, include access toresources, markets and infrastructure; household struc-ture, gender, education and age; farm size; income and in-come diversity; access to community-based organizations,
information, credit facilities, savings and loans; and healthstatus among others. Stringer et al. (2009) argued thatthough all households in a community are exposed torisks associated with climate change and could potentiallybe rendered vulnerable, the poorer households are themost at risk of adverse impacts of climate variability andchange. That notwithstanding, the proportion of house-holds vulnerable to extreme weather events is perceived tobe increasing in arid environments of eastern Africa, espe-cially in Kenya, and there is an uncertain degree to whichthe population or the system is becoming susceptible andunable to cope with hazards and stresses, including theeffects of climate change.In Kenya, there is a consensus that projected climate
change will worsen food security, mainly through increasedextremes and temporal or spatial shifts (Eriksen andO’Brien 2007; Herrero et al. 2010; Sherwood 2013). Infact, there is considerable potential impact of these glo-bal drivers of change on the production systems andresource-poor households who depend on them. Studiesby Kabubo-Mariara (2009) and Silvestri et al. (2012) re-vealed that extreme weather events such as prolongeddry spells and intense rainfall are already affecting ruralcommunities in parts of arid and semi-arid lands(ASALs) of Kenya. At present, nearly 30% of the totalhuman population resides in the ASALs, which coverapproximately 88% of the country’s land mass, and holdalmost 70% of the total national livestock herd. However,large proportions of pastoralists who reside in ASALs arebelieved to be at risk of food production deficit, with po-tential declines in pasture and water availability (Opiyoet al. 2011), all exacerbated by extreme climate events.Hence, the purpose of this paper is to identify the de-terminants of vulnerability and measure micro-levelvulnerability of pastoralists in arid rangelands of Kenya.The vital information that is obtained from household-levelvulnerability analysis is presently lacking in national and re-gional level assessments. Deressa et al. (2008), Pearson et al.(2008) and Sherwood (2013) show that vulnerability con-texts are diverse for different multiple spatial scales, andtherefore this approach can contextualize how climatevariability and change affect pastoralist livelihoods.This study was thus carried out to investigate households’
vulnerability to climate variability and change to climate-induced stresses in a case study of a pastoralist rangelandof Kenya. The study identifies some of the determiningfactors for vulnerability based on certain household social,economic and environmental (biophysical) characteristics.The household was selected as the main unit of analysisbecause major decisions about adaptation to climate-induced stresses and livelihood processes are taken atthat level (Thomas 2008). Nevertheless, households areconnected to the wider community, which can greatlyinfluence their decision-making processes in relation

Opiyo et al. Pastoralism: Research, Policy and Practice 2014, 4:10 Page 3 of 15http://www.pastoralismjournal.com/content/4/1/10
to use of particular productive resources. The findingsof this study can therefore be useful for targeting inter-ventions, priority setting and resource allocations atmicro-level. Complemented with studies analysing climatechange impacts and findings from country-level adaptivecapacity, governmental policy can be informed. At thesame time, the uncertainty associated with climate vari-ability and change demands an approach that preparesrural households without relying on detailed climate pro-jections. The study therefore focused on the adaptive cap-acity of households for wider resilience programming.Moreover, the findings would assist in resources allocationand determination of resilience investment opportunitiesthat are likely to increase the adaptive capacity of thevulnerable households. The findings in particular suggestpotential avenues for research that may further enhanceunderstanding of household vulnerability to climate stressesin the arid rangelands of Kenya.
Study areaThe study was conducted in Turkana County, northwesternrangelands of Kenya (Figure 1). The county lies betweenlongitude 34° 30′ and 36° 40′E and latitude 1° 30′ and 5°30′ N, covering an area of 77,000 km2 with an estimatedhuman population of 855,399 according to the 2009 Kenyahousing and population census report. The county is oneof the poorest in Kenya with an estimated 87.5% of thepopulation living below the absolute poverty line (KenyaNational Bureau of Statistics KNBS 2013). In Lokichoggio,Kakuma and Oropoi divisions where the household surveywas undertaken, poverty is exacerbated by the harsh envir-onment, poor infrastructure and low access to basic ser-vices, in addition to other underlying causes of povertythat are experienced in northern Kenya. About 96% of thestudy area falls into arid and very arid eco-climatic zones(Jaetzold and Schmidt 1983). In the study area, because ofaridity, managing short-term climatic fluctuations as wellas adapting to long-term changes is critical in sustaininglivelihoods. According to the most recent household econ-omy approach assessments, pastoralism is the predomin-ant livelihood accounting for over 55% of the population;15.6% agro-pastoral, 8% fisher folks and 8.4% are in theurban/peri-urban areas (Household Economy ApproachHEA 2012).Rainfall in the study area exhibits a bimodal pattern,
and distribution is unreliable and erratic in both spaceand time, with an average annual rainfall of 120 mm inthe east to over 200 mm in the northwest. Figure 2 showsthe annual rainfall variability of the study area. The mainrainy season at local level between March 1950 and July2012 the study area received very low and variable rain. Inthe past decades, major widespread drought events wereexperienced in 1980 to 1984, 1990 to 1995, 1999 to 2000,2008 to 2009 and 2010 to 2011 within the study area. The
last drought crisis in the Horn of Africa is estimated tohave affected over 13 million people, including 3.75million Kenyan, especially in the ASALs (UN-OCHA2011). The daily temperature ranges are extremely highwith an average daily range varying between 24°C and38°C with a mean of 30°C. The vegetation in this areais mainly scattered Acacia bush and a cover of annualherbaceous plants. The density of the woody plantssuch as Acacia reficiens and A. mellifera increases onhilly ground.The study area is inhabited by the Turkana pastoralists
whose major occupation is extensive livestock production(Watson and van Binsbergen 2008).The livestock specieskept include camels, cattle, sheep, goats and donkeys,which have different forage and water requirements andvariable levels of resilience during drought episodes. InTurkana, droughts, famine, epidemics and flash floods arealso very common occurrences. In most instances, theseshocks and stresses are associated with climatic variabilityand change (Notenbaert et al. 2013). The outcome ofthese climatic stresses has been high livestock mortality,loss of property, displacement of people and resourcesconflicts (Schilling et al. 2012). In general, by weakeningthe productivity and functioning of livelihood resources,climatic stresses aggravate the vulnerability of householdsdependent on these resources. However, Turkana pasto-ralists are known to be highly mobile with no fixed resi-dence (McCabe et al. 1988), but their regular patterns ofmovement often get disrupted by conflicts and diseaseoutbreaks (Hendrickson et al. 1998; Schilling et al. 2012).
MethodsData collectionA total of 302 pastoralist households were selected forinterviews a using semi-structured questionnaire to elicitresponses between June and July 2012. Systematic purpos-ive sampling was used to select drought-prone divisions inTurkana County which include Lokichoggio, Kakuma andOropoi. However, the specific kraals (homesteads)/loca-tions where households were selected based on accessibil-ity of the area. Consequently, 10 locations/kraals wereselected from which the sample households were selectedrandomly proportional to population size. Table 1 showsthe sampled households from each of the 10 kraals/locations. A semi-structured questionnaire was usedto interview the household heads. The questionnaire wasdivided into the following: demographic and economichousehold characteristics, livestock and crops production,access to extension services, credit access, hazards oc-currence, perception level, adaptation strategies pursued,different coping strategies, level of resilience and otherrelevant information.In addition, in situ rainfall and temperature datasets
relevant for this study were obtained from Kenya

Figure 1 Location of the study area.
Opiyo et al. Pastoralism: Research, Policy and Practice 2014, 4:10 Page 4 of 15http://www.pastoralismjournal.com/content/4/1/10
Meteorological Services, National Drought ManagementAuthority (National Drought Management Authority -NDMA 2013) and County government officers inLodwar, Turkana to strengthen some of the study find-ings. The STATA software was used to analyse the dataobtained.
Analysis of households’ vulnerabilityThere are various ways of analysing vulnerability, namely,socio-economic, biophysical and an integrated approach,which unites both socio-economic and biophysical factors.The socio-economic vulnerability assessment approachfocuses on the socio-economic and political status of

Figure 2 Annual rainfall variability for period 1950 to 2012 in the study area.
Opiyo et al. Pastoralism: Research, Policy and Practice 2014, 4:10 Page 5 of 15http://www.pastoralismjournal.com/content/4/1/10
individuals or groups. Individuals in a community vary interms of education, gender, wealth, health status, access tocredit, access to information and technology, formal andinformal (social) capital and political power, which areresponsible for variations in vulnerability levels (Füssel2007; Deressa et al. 2008). Consequently, vulnerability isconsidered to be a starting point or a state that existswithin a system before it encounters a hazard event (Kellyand Adger 2000). In this regard, vulnerability is shaped bysociety as a result of institutional and economic changes.The socio-economic approach focuses on identifying theadaptive capacity of individuals or communities based ontheir internal characteristics. One major limitation of thisapproach is that it focuses only on variations within society,but in reality, societies vary not only due to socio-politicalfactors but also because of environmental or biophysicalfactors. The socio-economic approach does not accountfor the natural resource bases which have the potential tocounteract the negative impacts of environmental shocks.
Table 1 Sampled households by Kraal
Location/Kraals Number ofhouseholds
Sampledhousehold
Percentageof respondent
Mogila 1,536 20 6.62
Lokichoggio 1,868 9 2.98
Lopusiki 649 1 0.33
Lopwarin 277 11 3.64
Songot 459 19 6.29
Nanam 748 38 12.58
Kakuma 12,767 33 10.93
Letea 4,957 56 18.54
Kalobeyei 2,577 39 12.91
Pelekech 1,863 76 25.17
Kraal used herein to refer to a traditional pastoralists village of huts, typicallyenclosed by a fence. (Source: Authors’ compilation).
For example, areas with easily accessible undergroundwater can better cope with drought by utilizing this re-source, compared to areas without it (Deressa et al. 2008).The second commonly used approach is biophysical
that attempts to assess the level of damage that a givenenvironmental stress causes on both social and biologicalsystems. It is sometimes known as an impact assessment.The emphasis is on the vulnerability or degradation ofbiophysical conditions (Liverman 1990). This is a dom-inant approach employed in studies of vulnerability tonatural hazards and climate variability and change (Hewitt1995). Füssel (2007) identified this approach as a risk-hazard approach. The biophysical approach, although veryinformative, also has a major limitation that assessment ofbiophysical factors is not a sufficient condition for un-derstanding the complex dynamics of vulnerability.This approach also neglects both structural factors andhuman agency in producing vulnerability and in coping oradapting to it. The approach overemphasizes extremeevents while neglecting root causes and everyday socialprocesses that influence differential vulnerability (Liverman1990; Hewitt 1995; Pulwarty and Riebsame 1997). The thirdapproach is the integrated vulnerability analysis, whichcombines both the socio-economic and biophysical factors.This approach includes all the internal state of vulnerabilityand the external situation. This analytical approach wasapplied by Madu (2012) in agro-ecological based house-hold vulnerability analysis in Ethiopia and by Deressa et al.(2008) in regionally based vulnerability analysis.This present study replicates an integrated vulnerability
approach to develop vulnerability indices for each house-hold as proposed by Madu (2012) and adopted by Tessoet al. (2012) in Ethiopia. In this research, it is assumed thathouseholds with higher adaptive capacity are less sensitiveto impacts of climate-induced stresses, thus keeping thelevel of exposure constant. The integrated assessmentapproach combines both socio-economic and biophysical

Opiyo et al. Pastoralism: Research, Policy and Practice 2014, 4:10 Page 6 of 15http://www.pastoralismjournal.com/content/4/1/10
approaches to determine vulnerability. The vulnerabilityindex development is given as developed by the Intergov-ernmental Panel on Climate Change IPCC (2012) that vul-nerability is seen as the net effect of adaptive capacity(socio-economic) and sensitivity/exposure (biophysical):
Vulnerability ¼ Adaptive capacityð Þ− Sensitivity þ Exposureð Þð1Þ
When the adaptive capacity of the household exceedsthat of its sensitivity and exposure, the household becomesless vulnerable to climate change impacts and the reverse isalso true. As explained in the foregoing, each set (adaptivecapacity, sensitivity and exposure) is composed of differentvariables. The model specification further looks like
V i ¼ A1X1J þ A2X2J þ⋯þ A2nXnJð Þ− Anþ1Y 1J þ Anþ2Y 2J þ⋯þ AnþnXnJð Þ
ð2Þ
where Vi is the vulnerability index, while Xs are elementsof adaptive capacity, and Ys are elements of exposureand sensitivity. The values of X and Y are obtained bynormalization using their mean and standard errors. Forinstance, XIJ ¼ XIJ−X1�ð Þ=S1� , where X1j* is the mean ofX1j across the different households, S1* is its standarddeviation. X1 is the principal component result of factors.In this regard, the first principal component of a set ofvariables is the linear index of all the variables that cap-tures the largest amount of information common to allthe variables. The whole matrix of variables of adaptivecapacity (Xij) and variables of exposure and sensitivity (Yij)appears as follows:
Xij�Y ij
¼X11 þ X12 þ⋯þ X2nð Þ− Y 11 þ Y 12 þ⋯Y 2nð Þ
⋅Xm1 þ Xm2 þ⋯þ Xmnð Þ− Ym1 þ Ym2 þ⋯Ymnð Þ
0@
1A
ð3ÞThe i and j in the foregoing notation imply the number
of rows (in this case is the 302 individual households) andthe number of columns (27 variables of adaptive capacity,exposure and sensitivity). In Equation 4, the As is the firstcomponent score of each variable computed using principalcomponent analysis (PCA) in STATA. Finally, the vulner-ability index of each household is obtained using Equation 4as follows:
V i ¼A1
A12
⋅Anþn
0BB@
1CCA�
X11 þ⋯þ X2nð Þ− Y 11 þ⋯þ Y 2nð Þ⋅
Xm1 þ⋯þ Xmnð Þ− Ym1 þ⋯þ Ymnð Þ
0@
1A
ð4ÞIn calculating the direction of relationship in vulnerabil-
ity indicators (that is, their sign), a negative value wasassigned to both exposure and sensitivity. The justificationis that households which are highly exposed to climate
shocks are more sensitive to damage, assuming constantadaptive capacity. The implication is that a higher netvalue indicates lesser vulnerability and vice versa.However, in creating the indices, the scale of analysis isimportant. As noted by Tesso et al. (2012) from Deressaet al. (2008), vulnerability analysis ranges from local orhousehold level to the global level (Brooks et al. 2005).The choice of scale is dictated by the objectives, method-ologies and data availability. In this study, the householdswere classified into three categories based on the value oftheir vulnerability index, which puts households intohighly vulnerable, vulnerable and less vulnerable categor-ies. However, the index computed is not based on thethresholds or presents an absolute value. It is a relativemeasure, representing the households’ own perception ofhow they have been coping in the past compared to otherhouseholds.
Factors influencing household vulnerabilityNotenbaert et al. (2013) note that many factors contributeto vulnerability, and these factors undermine capacity forself-protection, block or diminish access to social protec-tion, delay recovery or expose some households to greateror more frequent hazards than other households. Theanalysis was performed using ordinal logistic regressionanalysis. The ordinal logit model is used when the outcomevariable is categorized in an ordinal scale, as in this casewhere vulnerability is ordered as (1) highly vulnerable,which implies households for whom the difference be-tween adaptive capacity and sensitivity/exposure is signifi-cantly negative; (2) moderately vulnerable, which meansthat households for whom the difference between adaptivecapacity and sensitivity/exposure is nearly zero; and (3)less vulnerable, which means that the difference betweenadaptive capacity and exposure/sensitivity is significantlypositive. In this study, sensitivity of households to climate-induced stresses is represented by its associated impacts,i.e., shortage of food, loss of water and pasture resourcesand conflicts faced by those households. In the case of ex-posure, since all households are assumed to be located inthe same environment, exposure is almost uniform acrossthe respondents residing in the study area.This model is particularly useful in that it can show
movement between vulnerability groups, explaining whomoves in and out of vulnerability. Following Greene(1997), the reduced form of the ordinal logit model isgiven as
Y �j ¼ XI
jβþ UIj ð5Þ
where Y is the level of vulnerability and involves orderedoutcome, that is, Y = 1 was given to households thathave a high level of vulnerability as observed by the nega-tive value of adaptive capacity minus sensitivity/exposure;

Opiyo et al. Pastoralism: Research, Policy and Practice 2014, 4:10 Page 7 of 15http://www.pastoralismjournal.com/content/4/1/10
Y = 2 was given to households having adaptive capacitynearly equal to their sensitivity/exposure; and Y = 3 wasgiven to households having their adaptive capacity ex-ceeding their sensitivity and exposure. Y* is the givenstate of vulnerability. The Xij are the explanatory variablesdetermining vulnerability level. The independent variablesincluded in the model were sex and age of the householdhead, experience in the study area, household size andeducation level of the household head, dependency, mari-tal status, social linkages and visits by extension officers,access to early warning information, non-farm income,herd size, herd structure, access to markets, propertyregimes, access to remittances, employment, copingstrategies, herd diversity, credit access, herd mobility,climate change, experience in increased temperature,drought, floods, and wind, and natural hazards encounteredin 5 years. βS are parameters estimated and Uij is the dis-turbance term. Y* is unobserved, but what was observedin this study is
� Y ¼ 1 if Y �≤ μ2
� Y ¼ 2 if μ2 < Y �≤ μ3
� Y ¼ 3 if μ3 < Y �
Given the cumulative normal function Φ (β ' x), theprobabilities can be shown, thus,
� Prob [y = 1 or highly vulnerable] =Φ (−β ' x),� Prob [y = 2 or neutral level of vulnerability] =Φ
(μ2 − β ' x) −Φ (μ3 − β ' x)� Prob [y = 3 or less vulnerable] = 1 −Φ (μ3 − β ' x)
ResultsHazards reported by householdsThe results show that 49% of households experienceddrought over the past three decades, with 27.1% of therespondents reporting livestock disease outbreak, 19%mentioning cross-border inter-community conflicts and4% citing riverine flash floods as the main hazard(Table 2). However, it was difficult for the respondentsto differentiate between threats and hazards, which re-quired clarification of the differences. Drought events
Table 2 Hazards identified by respondents
Hazard Description of hazards
Floods Flash floods along ephemeral rivers
Droughts Widespread frequent droughts
Disease outbreak Livestock diseases outbreak are common
Others i.e. conflicts, fire Inter-community conflicts along the borders over
United Nations (2004) defines a ‘hazard’ broadly as “a potentially damaging physicainjury, property damage, social and economic disruption or environmental degrada
were reported to be frequent hazards in the area and haddevastating impacts on household livelihoods, pasture andwater, which escalates the area’s chronic conflicts, insecur-ity and food insecurity.Inter-community and ethnic conflict related to scarce
grazing land and water resources was reported to haveincreased inter-tribal animosity, often resulting in armedviolent conflicts, which are predatory in nature and muchmore destructive. Households stated that violent conflictsregularly lead to heavy losses of lives and livelihoods,undermining human and livestock population mobility, aswell as development efforts. Study findings show thatoutbreaks of peste des petit ruminants (PPR) locally referredto as lomoo is considered as the major hazard, having thehighest impact on small ruminants compared to other en-demic livestock diseases in the area. On further probingwith community animal health workers and veterinary of-ficers, based on the symptoms described by the pastoralistrespondents, other diseases were identified as etome(mange), emadang’ (worms infestation), lukoi (contagiouscaprine pleuropneumonia), lomeri (lump skin disease),lokichum (heart water), etune (sheep/goat pox), lotorebwoor lokipi (trypanosomiasis), logooroi (hemorrhagic septi-caemia) and loukoi (contagious bovine pleuropneumonia).
Socio-economic and biophysical vulnerabilityThe social and economic variables contributing to vul-nerability are summarized in Table 3. Findings show thatmore than 80% of the respondents had no basic primaryeducation, while the majority are not able to read and write.This in turn reduces a household’s ability to understandclimatic information, access market and early warninginformation. Data on household size showed that 64% ofthose interviewed had more than five persons, with 43%respondents reported more than five dependents. Whereasthe sex of the household head is likely to be critical forclimate adaptation, the study revealed that more than50% of households are headed by females. In addition,54% of the respondents indicated that they do not haveaccess to livestock extension services. The results implythat the vulnerability level of households to the frequentlyoccurring climate-induced stresses is largely determinedby gender and education level of the household head inthe study area.
Number of respondents Percentage of respondents
13 4.3
148 49.0
82 27.1
resources 59 19.5
l event, phenomenon or human activity that may cause the loss of life ortion”. (Source: Authors’ compilation).

Table 3 Social, economic and environmental indicators and their effect on vulnerability level
Hypothesized variables Percentage Influence on vulnerabilitya
Social vulnerability variables
Sex of HH head: female-headed 50.7 +
Age of HH head: 50+ years 26.6 −
Experiences in the area: less than 5 years 7.9 +
HH size: more than 5 persons 64.6 −
Educational level: no primary education 80.1 +
Dependents: more than 5 persons 43.8 −
Marital status: single (including divorced and widowed) 29.5 +
Linkages: having no social linkages 25.8 −
Visit by extension officers: no access to extension services 54.3 +
Access to early warning information: no access to the information 74.8 +
Economic vulnerability variables
Non-farm income: have no non-farm income 35.5 −
Herd size: own less than 2 TLUs 18.3 +
Herd structure: no milking herd 72.8 +
Distance to market: more than 10 km away 39.4 −
Property regime: own private land 8.6 −
Access to remittances: no cash transfers 58 +
HH employed: no member of HH employed 88.1 +
HH coping strategies: more than 2 coping strategies 92.1 +
Livestock diversity: less than 2 livestock species 45.4 −
Credit access: having no access to credit at all 77.8 +
Mobility: able to move livestock freely 67.9 −
Environmental vulnerability variables
Climate change: experiencing change 96.7 +
Temperature: experiencing increase 47.9 +
Drought: noticed increasing events 3.4 +
Flood: noticed change 4.1 +
Wind: noticed unusual change 11.6 +
HH facing more than 2 hazards in 5 years 72.5 −aPositive sign indicates that the variable increases vulnerability, while negative sign means it reduces vulnerability. TLU, tropical livestock unit (1 TLU = 250 kg).(Source: Estimated from June to July 2012 household survey interviews in Turkana; Authors’ compilation).
Opiyo et al. Pastoralism: Research, Policy and Practice 2014, 4:10 Page 8 of 15http://www.pastoralismjournal.com/content/4/1/10
More than 35.5% of the households had no diversifiedincome sources and heavily depend on livestock as theirsource of income. Results show that only a few of thehouseholds were practicing dry land crop farming along-side livestock keeping. For the livestock owned, 18% ofrespondents had less than two tropical livestock units(TLUsa), and 72% of households had no milking herdduring the interview period. Further, the result revealedthat about 68% of households practice seasonal herdmobility and flexible resource use in the study area. Theresults show that 88% of households had none of itsmember formally employed, and 92% of respondents usemore than two coping strategies to survive in this harsh
climatic condition, despite the low access to credit, accessto remittances and long distances to markets. Othereconomic concern mentioned was the high formal un-employment opportunities, especially for the youths inTurkana.Table 3 displays environmental, economic and bio-
physical factors hypothesized for climate-induced vulner-ability. The results show that the sensitivity and exposureto climate variability in terms of those experiencing climatevariability (96.7%) and people facing more than two hazardsin 5 years (72.5%) have contributed negatively to the vul-nerability level of households. Approximately 48% of therespondents noticed an increase in temperature. However,

Opiyo et al. Pastoralism: Research, Policy and Practice 2014, 4:10 Page 9 of 15http://www.pastoralismjournal.com/content/4/1/10
most of the environmental variables increase household’slevel of vulnerability to climate-induced stresses as indi-cated by the positive sign.
Measuring household-level vulnerabilityTable 4 presents the result of principal component analysisand its association with the social, economic and environ-mental variables. The factor scores (weights) of the firstprinciple component analysis was positively associated withthe majority of the indicators identified under adaptive cap-acity, exposure and sensitivity. Holding exposure and sensi-tivity constant, a negative index shows the household tohave relatively lower adaptive capacity when compared to ahousehold with a positive index value and vice versa.
Table 4 Factor score for the first principal componentanalysis
Factors FactorScore
Social vulnerability variables
Sex of HH head: female-headed 0.22917
Age of HH head: 50+ years −0.25804
Experiences in the area: less than 5 years −0.02906
HH size: more than 5 persons −0.29837
Educational level: no primary education 0.039479
Dependents: more than 5 persons −0.31599
Marital status: single (including divorced and widowed) 0.07224
Linkages: having no social linkages −0.04414
Visit by extension officers: no access to extension services 0.189862
Access to early warning information: having no access 0.19573
Economic variables
Non-farm income: HH with no farm income −0.34130
Herd size in TLU: own less than 2 TLUs 0.293813
Herd structure: no milking herd 0.100562
Distance to markets: more than 10 km away −0.15870
Property regime: own private land −0.06728
Access to remittances: no cash transfers 0.047677
HH employed: no member of HH employed 0.095173
HH coping strategies: more than 2 coping strategies 0.101335
Livestock diversity: less than 2 livestock species −0.42800
Credit access: having no access to credit at all 0.178153
Mobility: able to move livestock freely −0.14718
Environmental variables
Climate change: experiencing change −0.02276
Temperature: experiencing increase 0.081161
Drought: noticed increasing events 0.164723
Flood: noticed change 0.039066
Wind: noticed unusual change 0.259975
HH facing more than 2 hazards in 5 years −0.06667
Abbreviations: Households (HH), Tropical livestock unit (TLU).
To compute the vulnerability index in Equation 2, indi-cators of adaptive capacity, which are positively associatedwith the first principal component analysis, and indicatorsof sensitivity and exposure, which are negatively associ-ated with the principal component analysis, were used inthis study. The variables considered in Equation 2 includesex of the household head, education level, marital status,access to extension services and early warning infor-mation, livestock ownership, herd structure, access tocash remittances, household employment status, copingstrategies and access to credit. However, for the exposureand sensitivity, all the variables were considered in theanalysis. This is because adaptive capacity is considered aspositively contributing to the reduction of vulnerability,while exposure and sensitivity are negatively contributingto vulnerability reduction. The larger the factor score themore important is the variable and contributes more tothe household’s vulnerability.The households were classified into three categories
using the vulnerability index: less vulnerable are house-holds that are in a vulnerable situation but can still cope;moderately vulnerable households are those that needurgent but temporary assistance in case of shock andstresses; and the highly vulnerable are those householdsthat are almost at a point of no return. The result showsthat the majority of households fall within the moderatelyvulnerable category, with 44% households having an indexfrom −1.00 to 1.00. The less vulnerable households had anindex of 1.1 to 3.0 and constitute 29%, while the highlyvulnerable households had an index of −0.9 to −3.0 butare 27% of the total households sampled (Table 5 andFigure 3). Although there seems to be normal vulnerabil-ity index distribution in Figure 3, a keen look at the valuesshowed a slight shift to the left. Statistically, the house-holds’ distribution is skewed toward the highly vulnerablein the illustration. In general, the results reveal high andmoderate vulnerability levels of the pastoralist householdsin Turkana.
Determinants of vulnerabilityThe majority of highly vulnerable households were headedby females or someone with no primary level of education(Table 6). The highly vulnerable households also had morethan five dependents, no access to early warning infor-mation, no milking herd and own less than two livestockspecies, and perceived changes in climate. By contrast, ahousehold is likely to be less vulnerable when they areheaded by a male, the household head is literate, notdivorced or widowed, when they have access to extensionservices and early warning information, and own largeand mixed-species herds. Similarly, households with ac-cess to cash remittances, with a member of the householdin formal employment, and those with diverse copingstrategies and access to credit facilities are reported to be

Table 5 Classification of community according to the range of their vulnerability index
Vulnerability category Household situation Vulnerability index Percentage of households
Highly vulnerable Emergency level HHs −0.9 to −3.5 27
Moderately vulnerable Needs urgent but temporary external assistance to recover −1.0 to +1.0 44
Less vulnerable In a vulnerable situation but still able to cope +1.1 to +3.0 29
Total 100
(Source: Computed from household questionnaire interviews in June to July 2012).
Opiyo et al. Pastoralism: Research, Policy and Practice 2014, 4:10 Page 10 of 15http://www.pastoralismjournal.com/content/4/1/10
less vulnerable to climate extremes. The results suggestthat because of scarce resources during extreme climateevents, households with high number of dependents andwithout any other livelihood diversification activities arelikely to be more vulnerable than households with com-plementary sources of income and less dependents.As shown in Table 6, the majority of households in the
moderately vulnerable category are the ones with lessthan 5 years’ experience, either divorced or widowedhousehold heads, household heads with no social linkages,household heads with no access to extension services,households who own less than two TLUs, own privatelands, households which do not received any cash re-mittances, household heads with more than two copingstrategies, households who practice mobility and areable to move freely with their livestock herd, and perceiveclimatic changes in the area.The results of the ordered logistic regression model
for all the single predictors’ variables influencing a house-hold’s vulnerability are summarized in Table 7. A numberof variables were statistically significant at 1% and 5%levels of significance and were important in influencinghouseholds’ vulnerability to climate-induced stresses. Thevariables that showed significant influence on vulnerabilityinclude gender of the household head, age of the house-hold head, size of the household, number of dependents,
Vul
nera
bili
ty I
ndex
-10
-50
5
10 20 30 40 50 60 70 80 90 100
110
120
130
140
Highly vulnerable (27%)Moderate
Figure 3 Vulnerability index by households in Kakuma, Oropoi and L
marital status, access to extension services and earlywarning information, complementary sources of income,herd diversity and structure, coping strategies and accessto credit.The higher odds ratios computed for age of the house-
hold head, household size, dependents, complementaryincome sources, herd diversity and mobility imply thatthese factors have more effects on the households’ vulner-ability level. But it should be noted that majority of thesampled population derived their means of subsistencefrom nomadic pastoral production system which are wea-ther sensitive and therefore absence of non-agriculturalincome sources (salary or wages labour) which are notweather sensitive would be a significant determinant onvulnerability level as reflected in the odds ratio figures.Herd diversity and mobility allow households to spreadrisk and pursue various coping strategies. Herd mobilitywas observed to be a significant (at 5%) determinant ofhouseholds’ vulnerability to climate variability and change.From the ordered regression results, 75% of female-
headed households are more likely to be vulnerable toclimate-induced stresses and shocks compared to themale-headed households. This might be because female-headed households normally face gender discriminationwith respect to resources, rights, education, income andeconomic opportunities. Household age was also an
150
160
170
180
190
200
210
220
230
240
250
260
270
280
290
300
ly Vulnerable (44%)
Less Vulnerable (29%)
okichoggio divisions in Turkana.

Table 6 Statistical description of model variables by vulnerability category
Vulnerability variables Vulnerability category
Less vulnerable Moderate vulnerable Highly vulnerable
Sex of HH head: female 67 (44%) 62 (20%) 24 (45%)
Age of HH head: 50+ years 6 (41%) 33 (34%) 35 (25%)
Experiences in the area: less than 5 years 10 (16%) 10 (44%) 4 (4%)
HH size: more than 5 persons 27 (8%) 92 (22%) 76 (42%)
Educational level: no primary education 72 (45%) 107 (5%) 63 (55%)
Dependents: more than 5 persons 10 (47%) 58 (41%) 59 (33%)
Marital status: single (including divorced and widowed) 31 (42%) 41 (55%) 17 (46%)
Linkages: HH with no social linkages 18 (42%) 34 (52%) 26 (21%)
Visit by extension officers: no access to extension services 67 (17%) 65 (39%) 32 (20%)
Access to early warning information: having no access 77 (14%) 100 (9%) 49 (45%)
Non-farm income: HH with no farm income 5 (47%) 43 (33%) 58 (34%)
Herd size in TLU: own less than 2 TLUs 23 (39%) 17 (44%) 4 (31%)
Herd structure: no milking herd 72 (30%) 97 (23%) 51 (42%)
Distance to market: more than 10 km away 20 (44%) 51 (18%) 40 (27%)
Property regime: own private land 4 (26%) 13 (46%) 9 (40%)
Access to remittances: no cash transfers 58 (8%) 71 (36%) 46 (30%)
HH employed: no member of HH employed 81 (46%) 118 (15%) 67 (30%)
HH coping strategies: more than 2 coping strategies 82 (46%) 121 (50%) 66 (25%)
Livestock diversity: less than 2 species 5 (35%) 57 (35%) 75 (58%)
Credit access: having no access to credit at all 78 (46%) 108 (33%) 49 (17%)
Mobility: able to move livestock freely 42 (19%) 93 (41%) 70 (32%)
Climate change: experiencing change 43 (23%) 59 (26%) 38 (47%)
Drought: noticed increasing events 4 (44%) 3 (30%) 3 (21%)
Flood: noticed change 3 (33%) 7 (44%) 2 (29%)
Wind: noticed unusual change 11 (41%) 16 (25%) 7 (45%)
HH facing more than 2 hazards in 5 years 63 (40%) 99 (30%) 57 (26%)
HH, households; TLU, tropical livestock unit.
Opiyo et al. Pastoralism: Research, Policy and Practice 2014, 4:10 Page 11 of 15http://www.pastoralismjournal.com/content/4/1/10
important demographic factor determining how vulner-able a household could be. For example, householdsheaded by person above 50 years of age are more likely tobe vulnerable compared with the younger persons. Conse-quently, elderly household heads are probably worse off interms of preparing strategies to cushion their familiesagainst adverse climatic stresses and impacts and likelyto make them more vulnerable. Similarly, the moredependents a household has the more likely for it tobe vulnerable since a larger proportion of household re-sources are directed to dependents who cannot contributemuch toward household welfare. Further results also showthat widowed or divorced single-headed families are 37.4%more likely to be vulnerable than families where bothspouses are present. According to the study results, it wasobserved that livestock diversity had higher odds ratio of29.592, which suggest that households with more thantwo livestock species are 28 times more likely to shift from
highly vulnerability category to moderately vulnerabilitylevel.Although 27 variables were hypothesized to be corre-
lated with vulnerability, ordinal regression model resultconfirmed that only 17 factors were significant (at p < 0.1and p < 0.05) in influencing households’ vulnerability.Although not computed in this present study, it shouldbe noted that different determinants have differentialeffects on a household’s vulnerability levels.
DiscussionDrought was considered by the respondents as one of themost frequent hazards in Turkana, in addition to otherhazards such as conflicts, disease outbreaks and flooding.The pastoralist respondents maintained that frequent,prolonged drought events have increased in severityover the past decade or so. This perception corrobor-ate Nicholson’s (2014) assertion about drought events
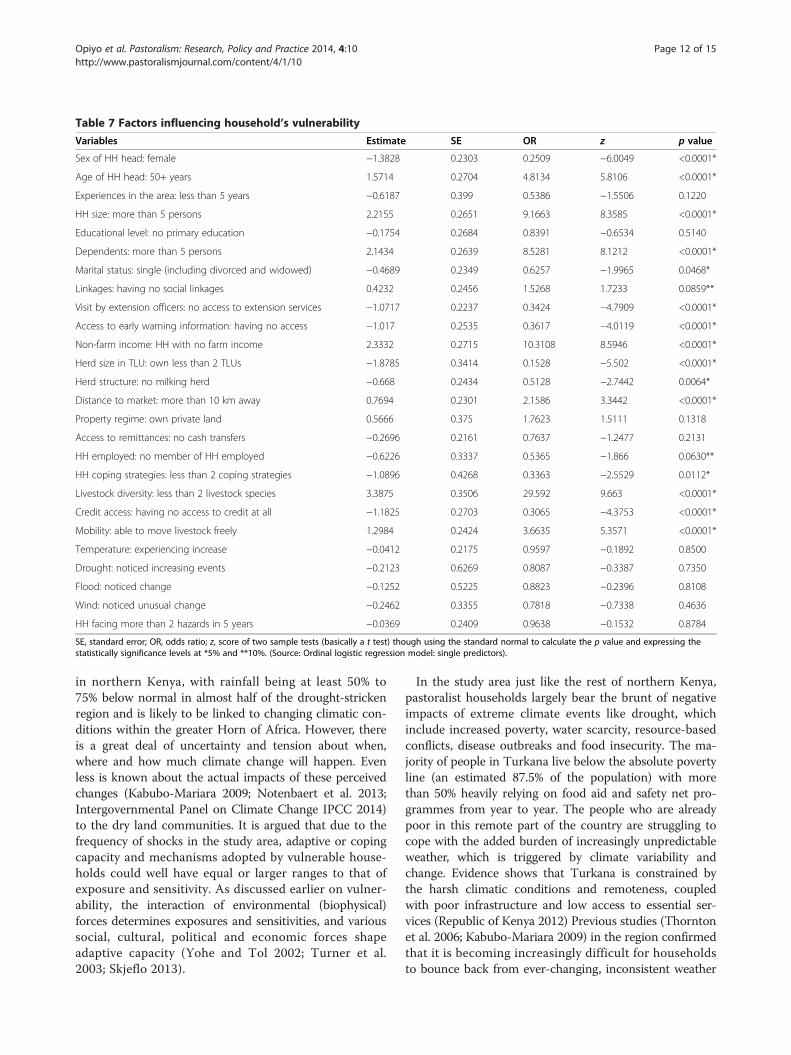
Table 7 Factors influencing household’s vulnerability
Variables Estimate SE OR z p value
Sex of HH head: female −1.3828 0.2303 0.2509 −6.0049 <0.0001*
Age of HH head: 50+ years 1.5714 0.2704 4.8134 5.8106 <0.0001*
Experiences in the area: less than 5 years −0.6187 0.399 0.5386 −1.5506 0.1220
HH size: more than 5 persons 2.2155 0.2651 9.1663 8.3585 <0.0001*
Educational level: no primary education −0.1754 0.2684 0.8391 −0.6534 0.5140
Dependents: more than 5 persons 2.1434 0.2639 8.5281 8.1212 <0.0001*
Marital status: single (including divorced and widowed) −0.4689 0.2349 0.6257 −1.9965 0.0468*
Linkages: having no social linkages 0.4232 0.2456 1.5268 1.7233 0.0859**
Visit by extension officers: no access to extension services −1.0717 0.2237 0.3424 −4.7909 <0.0001*
Access to early warning information: having no access −1.017 0.2535 0.3617 −4.0119 <0.0001*
Non-farm income: HH with no farm income 2.3332 0.2715 10.3108 8.5946 <0.0001*
Herd size in TLU: own less than 2 TLUs −1.8785 0.3414 0.1528 −5.502 <0.0001*
Herd structure: no milking herd −0.668 0.2434 0.5128 −2.7442 0.0064*
Distance to market: more than 10 km away 0.7694 0.2301 2.1586 3.3442 <0.0001*
Property regime: own private land 0.5666 0.375 1.7623 1.5111 0.1318
Access to remittances: no cash transfers −0.2696 0.2161 0.7637 −1.2477 0.2131
HH employed: no member of HH employed −0.6226 0.3337 0.5365 −1.866 0.0630**
HH coping strategies: less than 2 coping strategies −1.0896 0.4268 0.3363 −2.5529 0.0112*
Livestock diversity: less than 2 livestock species 3.3875 0.3506 29.592 9.663 <0.0001*
Credit access: having no access to credit at all −1.1825 0.2703 0.3065 −4.3753 <0.0001*
Mobility: able to move livestock freely 1.2984 0.2424 3.6635 5.3571 <0.0001*
Temperature: experiencing increase −0.0412 0.2175 0.9597 −0.1892 0.8500
Drought: noticed increasing events −0.2123 0.6269 0.8087 −0.3387 0.7350
Flood: noticed change −0.1252 0.5225 0.8823 −0.2396 0.8108
Wind: noticed unusual change −0.2462 0.3355 0.7818 −0.7338 0.4636
HH facing more than 2 hazards in 5 years −0.0369 0.2409 0.9638 −0.1532 0.8784
SE, standard error; OR, odds ratio; z, score of two sample tests (basically a t test) though using the standard normal to calculate the p value and expressing thestatistically significance levels at *5% and **10%. (Source: Ordinal logistic regression model: single predictors).
Opiyo et al. Pastoralism: Research, Policy and Practice 2014, 4:10 Page 12 of 15http://www.pastoralismjournal.com/content/4/1/10
in northern Kenya, with rainfall being at least 50% to75% below normal in almost half of the drought-strickenregion and is likely to be linked to changing climatic con-ditions within the greater Horn of Africa. However, thereis a great deal of uncertainty and tension about when,where and how much climate change will happen. Evenless is known about the actual impacts of these perceivedchanges (Kabubo-Mariara 2009; Notenbaert et al. 2013;Intergovernmental Panel on Climate Change IPCC 2014)to the dry land communities. It is argued that due to thefrequency of shocks in the study area, adaptive or copingcapacity and mechanisms adopted by vulnerable house-holds could well have equal or larger ranges to that ofexposure and sensitivity. As discussed earlier on vulner-ability, the interaction of environmental (biophysical)forces determines exposures and sensitivities, and varioussocial, cultural, political and economic forces shapeadaptive capacity (Yohe and Tol 2002; Turner et al.2003; Skjeflo 2013).
In the study area just like the rest of northern Kenya,pastoralist households largely bear the brunt of negativeimpacts of extreme climate events like drought, whichinclude increased poverty, water scarcity, resource-basedconflicts, disease outbreaks and food insecurity. The ma-jority of people in Turkana live below the absolute povertyline (an estimated 87.5% of the population) with morethan 50% heavily relying on food aid and safety net pro-grammes from year to year. The people who are alreadypoor in this remote part of the country are struggling tocope with the added burden of increasingly unpredictableweather, which is triggered by climate variability andchange. Evidence shows that Turkana is constrained bythe harsh climatic conditions and remoteness, coupledwith poor infrastructure and low access to essential ser-vices (Republic of Kenya 2012) Previous studies (Thorntonet al. 2006; Kabubo-Mariara 2009) in the region confirmedthat it is becoming increasingly difficult for householdsto bounce back from ever-changing, inconsistent weather

Opiyo et al. Pastoralism: Research, Policy and Practice 2014, 4:10 Page 13 of 15http://www.pastoralismjournal.com/content/4/1/10
affecting their livelihoods, and many have been forced topursue other livelihoods and coping mechanisms that onlyincrease the cycle of vulnerability.This study has shown that female-headed households,
households with experience of less than 5 years in thearea, household heads with no primary level of educationand households headed by divorced and widowed persons,with no access to extension services and early warninginformation, in particular, are disproportionately likely tobe affected by climate stresses and variability. In times ofclimate stresses and shocks like drought, these categoriesof households tend to have fewer options to find otherways of making a living, because their very low levels ofliteracy reduce their opportunities in coping mechanismssuch as wage employment. Similarly, female or divorcedand widowed household heads are likely not to beempowered enough in pastoral communities to makehousehold decisions (Nabikolo et al. 2012) and are fre-quently without access to credit services and adequatecapital assets or not able to own large herds to managehouseholds’ daily requirements. Similar observationshave been made by Kakota et al. (2011) in Malawi andTesso et al. (2012) in Ethiopia that widowed or divorcedhousehold heads are more vulnerable because they rely onincome earned by either the father or mother as the breadwinners. These findings make a strong case for continuoustargeting of pastoralist women in resilience-building inter-ventions in the rangelands.The results are consistent with previous findings
(Deressa et al. 2008) in similar ecosystems. However,for the biophysical variables, the greater the level ofhousehold reliance on natural resources, such as pas-toralism or dry land crop farming, the greater will betheir vulnerability to climate variability and change.This is partly because the use of such natural resources isdependent on rainfall, which is projected to change. Thisstudy observed that almost all the postulated biophysical/environmental variables contribute positively to householdvulnerability. It is likely that the level of dependence onnatural resources especially pastures and water will varyfrom household to household. For example, while the ma-jority of households (78.9%) depend on livestock herdingas their main source of livelihood, for others, livestock isjust an equal or lesser contributor besides other economicactivities.The level of vulnerability is closely associated with the
degree of poverty in Turkana. This county has higherdegrees of vulnerability in terms of households’ adaptivecapacity or social and economic characteristics that arelinked to their exposure and sensitivity to biophysicalvariables (Lo´pez-Carr et al. 2014). The findings of thisstudy suggest that in case of an external stress or shock,the majority of the households would need some assist-ance for them to recover. These results reflect the findings
of studies by Kenya National Bureau of Statistics (KNBS)(2013) which showed that Turkana is the poorest countyin Kenya, with 87.5% of the population living in absolutepoverty. Other studies have indicated that Turkana regionhas a number of households with high of dependents, lowengagement in off-farm activities and low levels of educa-tion (Blench 2000; McPeak and Barrett 2001; Watson andvan Binsbergen 2008).The determinants of households’ vulnerability were
found to be significantly influenced by the sex of thehousehold head, age of the household head, size of thehousehold, number of dependents, marital status, sociallinkages, access to extension services and early warninginformation. In addition, non-farm income, herd sizeand diversity, herd structure and herd mobility, access tomarkets, households’ employment status, coping strategiesand access to credit were also observed to be the key deter-minants of the households’ vulnerability to climate-inducedstresses. This concurs with studies by Eriksen et al. (2005)and Notenbaert et al. (2013) which similarly observed someof these factors to be the key determinant of households’vulnerability to climate variability and change in ruralcommunities. The results are also consistent with previousfindings by Kakota et al. (2011) and Gebrehiwot and vander Veen (2013). From these findings, it seems there is stillmore to be done to understand vulnerability and itsunderlying processes. In this paper, the causal relation-ships between the statistically significant variables andoutcomes in terms of vulnerability levels are explainedusing existing literature. Some of these explanations are,however, rather speculative and not confirmed for thelocal situation. More in-depth qualitative fieldwork, such asincluding open-ended questions, conducting focus-groupdiscussions or in-depth interviews with selected householdsbased on these factors, could strengthen our confidencein some of these explanations. The combination ofquantitative surveys with qualitative autopsy is likely toprovide a much more in-depth analysis of determinantsof vulnerability.
ConclusionsUnderstanding vulnerability to environmental change andextreme climate events is necessary for policy makers to de-velop mitigation and adaptation programmes for long-termresilience. Vulnerability analyses contribute to the know-ledge on climate-sensitive socio-economic or ecologicalsystems, enabling policy to be targeted on the most vulner-able places, sectors or people and adaptation options to bedefined. The results of this study from Turkana portraysocial and biophysical vulnerability indices which are usefulto local development programming for long-term resili-ence. However, as a prerequisite for building households’resilience to climatic extremes, in-depth understanding isnecessary of the adaptive capacity, exposure and sensitivity.

Opiyo et al. Pastoralism: Research, Policy and Practice 2014, 4:10 Page 14 of 15http://www.pastoralismjournal.com/content/4/1/10
This study focused on the micro-level to assess thevariability of vulnerability across different households.Categorization of vulnerability levels was used to helpidentify households that are not vulnerable currentlybut have a high probability of becoming vulnerable inthe future. In the future, studies assessing household-levelvulnerability to climate-induced stresses should explorethe use of panel data as well as cross-sectional data toportray longitudinal and cross-sectional characteristicsof households. Similarly, future resilience interventionsshould target individual households within a communitybecause major decisions about adaptation to climate-induced stresses and livelihood processes are taken atthe micro-level.We conclude that because of various social, economic
and biophysical determinants observed to influence house-holds’ vulnerability to climate-induced stresses, policieswith emphasis on women’s empowerment, promotingeducation, supporting extension services and enhancingdiversifications of income sources and access to credit,supporting herd mobility and diversity, creating employ-ments, and increasing access to markets and early warninginformation are likely to improve resilience of pastoralhouseholds. Although the results of this study are specificto Turkana County in Kenya, the approach and findingscould be applicable to other arid and semi-arid areas inthe region.
EndnotesaA TLU is the 250-kg live weight of any domestic herbivore(sheep or goat = 0.1 TLU; donkey = 0.4 TLU; cattle = 0.7TLU; camel = 1.0 TLU).
Competing interestsThe authors declare that they have no competing interests.
Authors’ contributionsFEOO collected the data and drafted the manuscript. OVW and MN guidedthe design of the research study and provided technical reviews of thepaper. All authors read and approved the final manuscript.
Authors’ informationFEOO is a PhD research student in the Department of Land ResourceManagement and Agricultural Technology (LARMAT), University of Nairobi,Kenya and a project officer of the United Nations Development Programme(UNDP), Dryland Development Centre United Nations Office in Nairobi, Kenya.OVW is a lecturer at LARMAT, University of Nairobi and a post-doctoral researchfellow at the German Institute for Tropical and Sub-tropical Agriculture (DITSL),Germany, while MMN is a senior lecturer at LARMAT, University of Nairobi.
AcknowledgementsThe work has been supported by small grants from the African Climate ChangeFellowship Program, Global Change for System Analysis, Research & Training(ACCFP/START), and additional support from the Red Cross/Red CrescentClimate Centre/START and United Nations International Strategy for DisasterReduction (UNISDR) under Climate and Development Knowledge Networksmall grant. The authors also thank Boniface Makone of the Welcome Trust forthe statistical guidance during the preparation of this paper.
Author details1Department of Land Resources Management and Agricultural Technology,University of Nairobi, P.O. Box 29053, Kabete, Nairobi 00625, Kenya. 2DrylandDevelopment Centre, United Nations Development Programme (UNDP),United Nations Office in Nairobi, P.O. Box 30552, Nairobi, Gigiri 00100, Kenya.3German Institute for Tropical and Subtropical Agriculture (DITSL), Steinstraße19, Witzenhausen 37213, Germany.
Received: 15 April 2014 Accepted: 18 June 2014
ReferencesAdger, WN, and PM Kelly. 1999. Social vulnerability to climate change and the
architecture of entitlements. Mitigation and Adaptation Strategies for GlobalChange 4:253–266.
Adger, WN. 1999. Social vulnerability to climate change and extremes in coastalVietnam. World Development 27:249–269.
Adger, WN. 2006. Vulnerability. Global Environmental Change 16(3):68–281.Blench, R. 2000. Extensive pastoral livestock systems: Issues and options for the
future. GCP/JPN/005/ JPN. Rome, Italy: FAO (Food and AgricultureOrganization of the United Nations).
Brooks, N, WN Adger, and PM Kelly. 2005. The determinants of vulnerability andadaptive capacity at the national level and the implications for adaptation.Global Environmental Change 15(2):151–163.
Callaway, JM. 2004. Adaptation benefits and costs:how important are they in theglobal policy picture and how can we estimate them? Global EnvironmentalChange 14:273–284.
Carpenter, S, B Walker, JM Anderies, and N Abel. 2001. From metaphor tomeasurement: resilience of what to what? Ecosystems 4(8):765–781.
Deressa, T, RM Hassan, and C Ringler. 2008. Measuring Ethiopian farmers’vulnerability to climate change across regional states, IFPRI discussion paperno. 806.
Eriksen, S, and K O’Brien. 2007. Vulnerability, poverty and the need for sustainableadaptation measures. Climate Policy 7:337–352.
Eriksen, S, K Brown, and K Mick. 2005. The dynamics of vulnerability:locatingcoping strategies in Kenya and Tanzania. Geographical Journal 171:287–305.
Fraser, EDG, AJ Dougill, K Hubacek, CH Quinn, J Sendzimir, and M Termansen.2011. Assessing vulnerability to climate change in dryland livelihood systems:Conceptual challenges and interdisciplinary solutions. Ecology and Society16(3):14.
Füssel, H. 2007. Vulnerability:a generally applicable conceptual framework for CCresearch. Global Environmental Change 17:155–167.
Gallopın, GC. 2006. Linkages between vulnerability, resilience, and adaptivecapacity. Global Environmental Change 16:293–303.
Gebrehiwot, T, and A van der Veen. 2013. Climate change vulnerability inEthiopia:disaggregation of Tigray Region. Journal of Eastern African Studies 7(4):607–629.
Greene, WH. 1997. Econometric analysis. New Jersey:Prentice Hall.Hendrickson, D, J Armon, and R Mearns. 1998. The changing nature of conflict
and famine vulnerability: the case of livestock raiding in Turkana District,Kenya. Disasters 22:185–199.
Herrero, M, C Ringler, J van de Steeg, P Thornton, T Zhu, E Bryan, A Omolo, JKoo, and A Notenbaert. 2010. Climate variability and climate change andtheir impacts on Kenya’s agriculture sector. Nairobi, Kenya: InternationalLivestock Research Institute (ILRI).
Hewitt, K. 1995. Excluded perspectives in the social construction of disaster.International Journal of Mass Emergencies and Disasters 13:317–319.
Hinkel, J. 2011. Indicators of vulnerability and adaptive capacity: towards aclarification of the science–policy interface. Global Environmental Change21:198–208.
Household Economy Approach (HEA). 2012. Livelihood profiles:Six livelihoodzones in Turkana County, Kenya. June 2012 report prepared for Oxfam andSave the Children UK.
Intergovernmental Panel on Climate Change IPCC. 2001. Climate change 2001:Impacts, adaptations and vulnerability. Report of working group II. Synthesisreport. Cambridge: Cambridge University Press.
Intergovernmental Panel on Climate Change IPCC. 2012. Managing the risks ofextreme events and disasters to advance climate change adaptation. Aspecial report of Working Groups I and II of the Intergovernmental Panel onClimate Change. Cambridge, UK: Cambridge University Press.

Opiyo et al. Pastoralism: Research, Policy and Practice 2014, 4:10 Page 15 of 15http://www.pastoralismjournal.com/content/4/1/10
Intergovernmental Panel on Climate Change IPCC. 2014. Climate change:Impacts, adaptation, and vulnerability. Working Group II contribution to theIPCC 5th assessment report.
Jaetzold, R, and H Schmidt. 1983. Farm management in Kenya, vol. II part C: EastKenya. Nairobi, Kenya: Ministry of Agriculture.
Kabubo-Mariara, J. 2009. Global warming and livestock husbandry in Kenya:impacts and adaptations. Ecological Economics 68:1915–1924.
Kakota, T, D Nyariki, D Mkwambisi, and W Kogi-Makau. 2011. Gender vulnerabilityto climate variability and household food insecurity. Climate andDevelopment 3(4):298–309.
Kasperson, J, R Kasperson, and B Turner (eds). 1995. Regions at Risk: Comparisonsof Threatened Environments. New York: United Nations University Press.
Kelly, PM, and WN Adger. 2000. Theory and practice in assessing vulnerability toclimate change and facilitation adaptation. Climatic Change 47(4):925–1352.
Kenya National Bureau of Statistics (KNBS). 2013. Exploring Kenya’s inequality:Pulling apart or pooling together. Nairobi, Kenya: National Bureau of Statisticsand Society for International Development (SID). National report ISBN–978-9966-029-17-1.
Klein, RJ, S Eriksen, LO Naess, A Hammill, TM Tanner, C Robledo, and K O’Brien.2007. Portfolio screening to support the mainstreaming of adaptation toclimate change into development assistance, Tyndall Centre Working PaperNo. 102.
Liverman, DM. 1990. Vulnerability to global environmental change. InUnderstanding global environmental change, ed. RE Kasperson et al., 27–44.Worcester:Center for Technology, Environment, and Development, ClarkUniversity.
Lo´pez-Carr, D, GP Narcisa, EA Juliann, MM Jankowska, C Funk, G Husak, and JMichaelsen. 2014. A spatial analysis of population dynamics and climatechange in Africa: potential vulnerability hot spots emerge whereprecipitation declines and demographic pressures coincide. PopulationEnvironment 35:323–339.
Madu, IA. 2012. Partial vulnerability of rural households to climate change inNigeria:Implication for internal security. Working paper number 2; May 2012.University of Texas, USA: The Robert S. Strauss Center for InternationalSecurity and Law.
Marshall, NA, CJ Stokes, NP Webb, PA Marshall, and AJ Lankester. 2014. Socialvulnerability to climate change in primary producers: a typology approach.Agriculture, Ecosystems and Environment 186:86–93.
McCabe, JT, R Dyson-Hudson, PW Leslie, PH Fry, N Dyson-Hudson, and J Wienpahl.1988. Movement and migration as pastoral responses to limited andunpredictable resources. In Arid lands today and tomorrow, ed. EE Whitehead,CF Hutchinson, BN Timmerman, and RG Varady, 727–734. Tucson, Arizona,USA: Proceedings of an International Research and Development Conference.
McCarthy, JJ, OF Canziani, NA Leary, DJ Dokken, and KS White (eds.). 2001.Climate change 2001: Impacts, adaptation and vulnerability. Cambridge:Cambridge University Press.
McPeak, JG, and CB Barrett. 2001. Differential risk exposure and stochastic povertytraps among east African pastoralists. American Journal of AgriculturalEconomics 83(3):674–679.
Nabikolo, D, B Bashaasha, MN Mangheni, and JGM Majaliwa. 2012. Determinantsof climate change adaptation among male and female headed farmhouseholds in eastern Uganda. African Crop Science Journal 20(2):203–212.
National Drought Management Authority - NDMA. 2013. Turkana Countydrought monitoring and early warning bulletin - December 2013.
Nicholson, SE. 2014. A detailed look at the recent drought situation in theGreater Horn of Africa. Journal of Arid Environments 104:71–79.
Notenbaert, A, SN Karanja, M Herrero, M Felisberto, and S Moyo. 2013. Derivationof a household-level vulnerability index for empirically testing measures ofadaptive capacity and vulnerability. Regional Environmental Change13:459–470.
Opiyo, FEO, SM Mureithi, and RK Ngugi. 2011. The influence of water availabilityon pastoralist’s resource use in Kitui and Mwingi districts of Kenya. Journal ofHuman Ecology 35(1):43–52.
Paavola, J. 2008. Livelihoods, vulnerability and adaptation to climate change inMorogoro, Tanzania. Environmental Science and Policy 11(7):642–654.
Pearson, L, R Nelson, S Crimp, and J Langridge. 2008. Climate changevulnerability assessment: Review of agricultural productivity. CSIRO climateadaptation flagship working paper 08.1.
Pulwarty, RS, and WE Riebsame. 1997. The political ecology of vulnerability tohurricane-related hazards. In Hurricanes: Climate and socioeconomic impacts,185–214. Berlin, Heidelberg, New York: Springer.
Republic of Kenya. 2012. National policy for sustainable development of NorthernKenya and other arid lands; Sessional Paper No. 8 of 2012, Republic of Kenya.
Schilling, J, FEO Opiyo, and J Scheffran. 2012. Raiding pastoral livelihoods:Motives and effects of violent conflict in north-western Kenya. Pastoralism:Research, Policy and Practice 2:25.
Sherwood, A. 2013. Community adaptation to climate change: exploring droughtand poverty traps in Gituamba location, Kenya. Journal of Natural ResourcesPolicy Research 5(2–3):147–161.
Silvestri, S, E Bryan, C Ringler, M Herrero, and B Okoba. 2012. Climate changeperception and adaptation of agro-pastoral communities in Kenya. RegionalEnvironmental Change 12(4):791–802.
Skjeflo, S. 2013. Measuring household vulnerability to climate change—Whymarkets matter? Global Environmental Change 23(6):1694–1701.
Stringer, LC, MS Reed, AJ Dougill, and C Twyman. 2009. Local adaptations toclimate change, drought and desertification: Insights to enhance policy insouthern Africa. Environmental Science and Policy 12:748–765.
Tesso, G, B Emana, and M Ketema. 2012. Analysis of vulnerability and resilience toclimate change induced shocks in North Shewa, Ethiopia. AgriculturalSciences 3:871–888.
Thomas, RJ. 2008. Opportunities to reduce the vulnerability of dryland farmers inCentral and West Asia and North Africa to climate change. Agriculture,Ecosystems and Environment 126(1–2):36–45.
Thornton, PK, PG Jones, T Owiyo, RL Kruska, M Herrero, P Kristjanson, ANotenbaert, N Bekele, A Omolo, and with contributions from Orindi V, BOtiende, A Ochieng, S Bhadwal, K Anantram, S Nair, V Kumar, and U Kulkar.2006. Mapping Climate Vulnerability and Poverty in Africa, 171. Nairobi,Kenya: Report to the Department for International Development,International livestock research institute.
Turner, BL, RE Kasperson, PA Matson, JJ McCarthy, RW Corell, L Christensen, NEckley, JX Kasperson, A Luers, ML Martello, C Polsky, A Pulsipher, and ASchiller. 2003. A framework for vulnerability analysis in sustainability science.Proceedings of the National Academy of Sciences of the United States ofAmerica 100(14):8074–8079.
United Nations International Strategy for Disaster Reduction-UNISDR. 2009. Globalassessment report on disaster risk reduction, 207. 207:207.
United Nations. 2004. Living with risk: A global review of disaster reductioninitiatives. Geneva, Switzerland: United Nations International Strategy forDisaster Reduction.
UN-OCHA. 2011. Horn of Africa Crisis: Situation Report No. 13: United NationsOffice for Co-ordination of Humanitarian Affairs.
Watson, DJ, and J van Binsbergen. 2008. Livestock market access andopportunities in Turkana, Kenya. ILRI Research Report 3, 106. Nairobi, Kenya:ILRI (International Livestock Research Institute).
Yohe, G, and RSJ Tol. 2002. Indicators for social and economic copingcapacity—moving toward a working definition of adaptive capacity. GlobalEnvironmental Change 12:25–40.
Yuga, NG, PG Shivakoti, and RP Sylvain. 2010. Household-level vulnerability todrought in hill agriculture of Nepal: Implications for adaptation planning.International Journal of Sustainable Development and World Ecology17(3):225–230.
doi:10.1186/s13570-014-0010-9Cite this article as: Opiyo et al.: Measuring household vulnerability toclimate-induced stresses in pastoral rangelands of Kenya: Implicationsfor resilience programming. Pastoralism: Research, Policy and Practice2014 4:10.