RESEARCH ARTICLE Open Access Investigation of dust storms ... · Whereas, maybe because of air...
12
RESEARCH ARTICLE Open Access Investigation of dust storms entering Western Iran using remotely sensed data and synoptic analysis Ali D Boloorani 1 , Seyed O Nabavi 2* , Hosain A Bahrami 3 , Fardin Mirzapour 4 , Musa Kavosi 5 , Esmail Abasi 5 and Rasoul Azizi 5 Abstract Background: One of the natural phenomena which have had considerable impacts on various regions of the world, including Iran, is “dust storm”. In recent years, this phenomenon has taken on new dimensions in Iran and has changed from a local problem to a national issue. This study is an attempt to investigate the formation of the dust storms crossing the Western Iran. Methodology: To find the sources of the dust storms entering Iran, first we examine three determined dust paths in the region and their temporal activities, using MODIS satellite images. Then, four regions were identified as dust sources through soil, land cover and wind data. Finally, atmospheric analyses are implemented to find synoptic patterns inducing dust storms. Results and discussion: Source 1 has covered the region between the eastern banks of Euphrates and western banks of Tigris. Source 2 is in desert area of western and south-western Iraq. Finally source 3 is bounded in eastern and south-eastern deserts of Saudi Arabia called Rub-Al-Khali desert, or Empty Quarter. Moreover, south-eastern part of Iraq (source 4) was also determined as a secondary source which thickens the dust masses originating from the above mentioned sources. The study of synoptic circulations suggests that the dust storms originating from source 1 are formed due to the intense pressure gradient between the low-pressure system of Zagros and a high-pressure cell formed on Mediterranean Sea. The dust events in sources 2 and 3 are outcomes of the atmospheric circulations dominant in the cold period of the year in mid-latitudes. Keywords: Dust source, Dust storm, Dust detection, Remote sensing, Synoptic climatology Background Dust storms are the result of the air turbulences which spread a large mass of dust in the atmosphere, and de- crease the horizontal visibility to less than 1000 meters [1]. In a general perspective, primary sources of dust plumes lie in the arid and semi-arid regions in East Asia, Middle East, Europe, Latin America, North America, Australia, eastern and southern Africa. Among them, Middle East has many dust sources in Arabian Peninsula, Syria, Egypt, Iraq and Iran [2]. Therefore, in countries with arid climate such as Iran, dust phenomena are not new natural events. However, in recent years there has been a new problem: a sudden increase in the number of dusty days and the level of air dust, especially in western Iran which has seriously affected the people’ s health and every- day life. As shown in Figure 1, only in the course of 3 years (2005–2008), the dust event spotted in western Iran has considerably become wider in terms of thickness and spatial expansion. The frequent occurrence of this phenomenon in vari- ous regions of the world such as Iran has gained atten- tions from academia and has triggered many research projects on the issue. Remote sensing is one of the most widely-used methods in dust storm studies. Drawing upon a model based on surface conditions and satellite observations, Ozsoy et al. examined one of the greatest * Correspondence: [email protected] 2 Geoinformatics Research Institute (GRI), University of Tehran and Department of Geography and Regional Research, University of Vienna, Vienna, Austria Full list of author information is available at the end of the article JOURNAL OF ENVIRONMENTAL HEALTH SCIENCE & ENGINEERING © 2014 Boloorani et al.; licensee BioMed Central Ltd. This is an Open Access article distributed under the terms of the Creative Commons Attribution License (http://creativecommons.org/licenses/by/2.0) which permits unrestricted use, distribution, and reproduction in any medium, provided the original work is properly credited. The Creative Commons Public Domain Dedication waiver (http://creativecommons.org/publicdomain/zero/1.0/) applies to the data made available in this article, unless otherwise stated. Boloorani et al. Journal of Environmental Health Science & Engineering 2014, 12:124 http://www.ijehse.com/content/12/1/124
Transcript of RESEARCH ARTICLE Open Access Investigation of dust storms ... · Whereas, maybe because of air...
JOURNAL OF ENVIRONMENTAL HEALTHSCIENCE & ENGINEERING
Boloorani et al. Journal of Environmental Health Science & Engineering 2014, 12:124http://www.ijehse.com/content/12/1/124
RESEARCH ARTICLE Open Access
Investigation of dust storms entering WesternIran using remotely sensed data and synopticanalysisAli D Boloorani1, Seyed O Nabavi2*, Hosain A Bahrami3, Fardin Mirzapour4, Musa Kavosi5, Esmail Abasi5
and Rasoul Azizi5
Abstract
Background: One of the natural phenomena which have had considerable impacts on various regions of theworld, including Iran, is “dust storm”. In recent years, this phenomenon has taken on new dimensions in Iran andhas changed from a local problem to a national issue. This study is an attempt to investigate the formation of thedust storms crossing the Western Iran.
Methodology: To find the sources of the dust storms entering Iran, first we examine three determined dust pathsin the region and their temporal activities, using MODIS satellite images. Then, four regions were identified as dustsources through soil, land cover and wind data. Finally, atmospheric analyses are implemented to find synopticpatterns inducing dust storms.
Results and discussion: Source 1 has covered the region between the eastern banks of Euphrates and westernbanks of Tigris. Source 2 is in desert area of western and south-western Iraq. Finally source 3 is bounded in easternand south-eastern deserts of Saudi Arabia called Rub-Al-Khali desert, or Empty Quarter. Moreover, south-eastern partof Iraq (source 4) was also determined as a secondary source which thickens the dust masses originating from theabove mentioned sources. The study of synoptic circulations suggests that the dust storms originating from source1 are formed due to the intense pressure gradient between the low-pressure system of Zagros and a high-pressurecell formed on Mediterranean Sea. The dust events in sources 2 and 3 are outcomes of the atmospheric circulationsdominant in the cold period of the year in mid-latitudes.
Keywords: Dust source, Dust storm, Dust detection, Remote sensing, Synoptic climatology
BackgroundDust storms are the result of the air turbulences whichspread a large mass of dust in the atmosphere, and de-crease the horizontal visibility to less than 1000 meters[1]. In a general perspective, primary sources of dustplumes lie in the arid and semi-arid regions in East Asia,Middle East, Europe, Latin America, North America,Australia, eastern and southern Africa. Among them,Middle East has many dust sources in Arabian Peninsula,Syria, Egypt, Iraq and Iran [2]. Therefore, in countries witharid climate such as Iran, dust phenomena are not new
* Correspondence: [email protected] Research Institute (GRI), University of Tehran andDepartment of Geography and Regional Research, University of Vienna,Vienna, AustriaFull list of author information is available at the end of the article
© 2014 Boloorani et al.; licensee BioMed CentCommons Attribution License (http://creativecreproduction in any medium, provided the orDedication waiver (http://creativecommons.orunless otherwise stated.
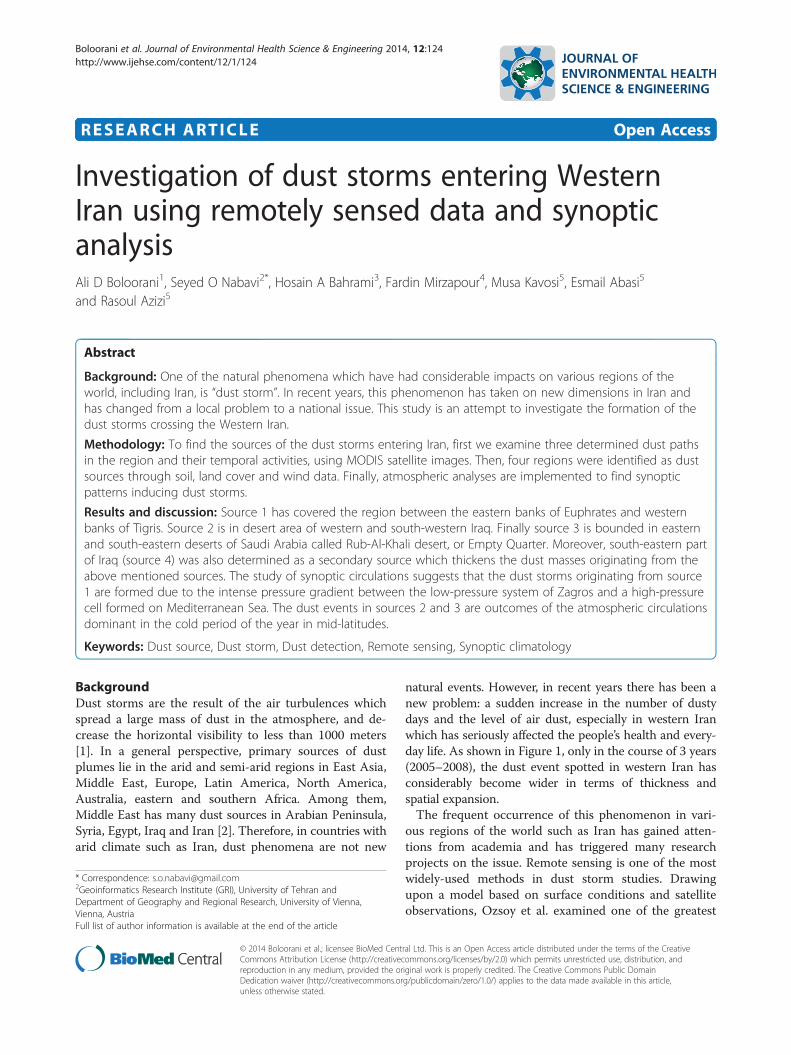
natural events. However, in recent years there has been anew problem: a sudden increase in the number of dustydays and the level of air dust, especially in western Iranwhich has seriously affected the people’s health and every-day life. As shown in Figure 1, only in the course of 3 years(2005–2008), the dust event spotted in western Iran hasconsiderably become wider in terms of thickness andspatial expansion.The frequent occurrence of this phenomenon in vari-
ous regions of the world such as Iran has gained atten-tions from academia and has triggered many researchprojects on the issue. Remote sensing is one of the mostwidely-used methods in dust storm studies. Drawingupon a model based on surface conditions and satelliteobservations, Ozsoy et al. examined one of the greatest
ral Ltd. This is an Open Access article distributed under the terms of the Creativeommons.org/licenses/by/2.0) which permits unrestricted use, distribution, andiginal work is properly credited. The Creative Commons Public Domaing/publicdomain/zero/1.0/) applies to the data made available in this article,
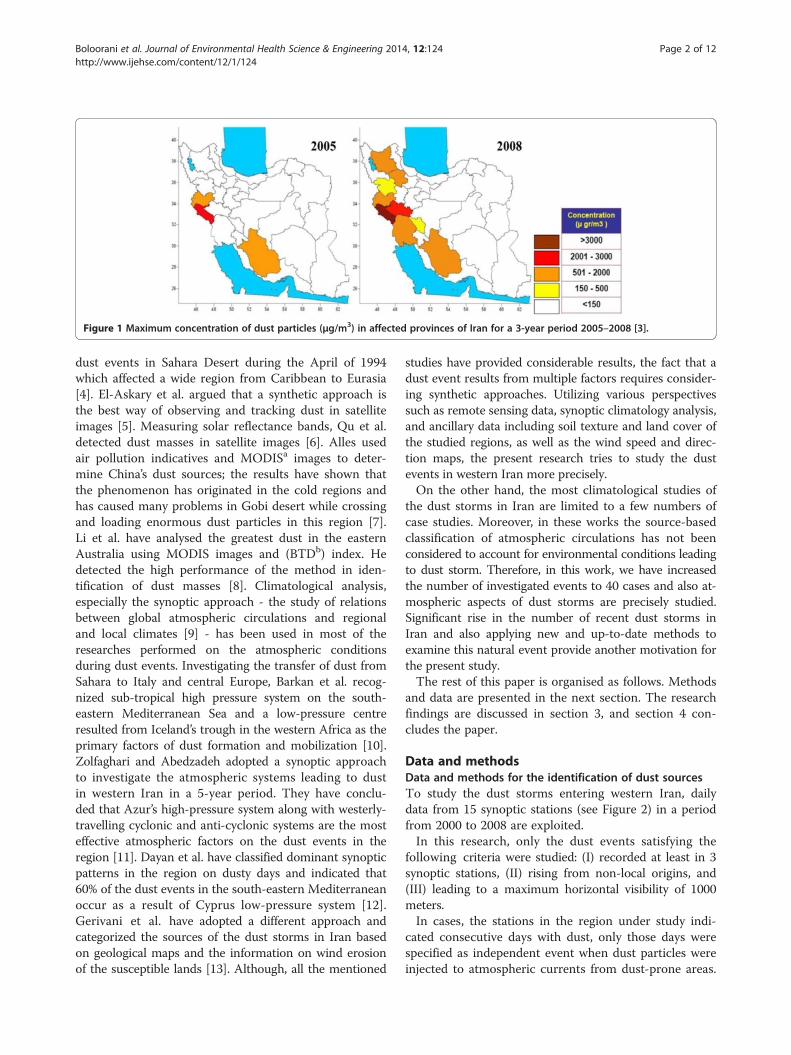
Figure 1 Maximum concentration of dust particles (μg/m3) in affected provinces of Iran for a 3-year period 2005–2008 [3].
Boloorani et al. Journal of Environmental Health Science & Engineering 2014, 12:124 Page 2 of 12http://www.ijehse.com/content/12/1/124
dust events in Sahara Desert during the April of 1994which affected a wide region from Caribbean to Eurasia[4]. El-Askary et al. argued that a synthetic approach isthe best way of observing and tracking dust in satelliteimages [5]. Measuring solar reflectance bands, Qu et al.detected dust masses in satellite images [6]. Alles usedair pollution indicatives and MODISa images to deter-mine China’s dust sources; the results have shown thatthe phenomenon has originated in the cold regions andhas caused many problems in Gobi desert while crossingand loading enormous dust particles in this region [7].Li et al. have analysed the greatest dust in the easternAustralia using MODIS images and (BTDb) index. Hedetected the high performance of the method in iden-tification of dust masses [8]. Climatological analysis,especially the synoptic approach - the study of relationsbetween global atmospheric circulations and regionaland local climates [9] - has been used in most of theresearches performed on the atmospheric conditionsduring dust events. Investigating the transfer of dust fromSahara to Italy and central Europe, Barkan et al. recog-nized sub-tropical high pressure system on the south-eastern Mediterranean Sea and a low-pressure centreresulted from Iceland’s trough in the western Africa as theprimary factors of dust formation and mobilization [10].Zolfaghari and Abedzadeh adopted a synoptic approachto investigate the atmospheric systems leading to dustin western Iran in a 5-year period. They have conclu-ded that Azur’s high-pressure system along with westerly-travelling cyclonic and anti-cyclonic systems are the mosteffective atmospheric factors on the dust events in theregion [11]. Dayan et al. have classified dominant synopticpatterns in the region on dusty days and indicated that60% of the dust events in the south-eastern Mediterraneanoccur as a result of Cyprus low-pressure system [12].Gerivani et al. have adopted a different approach andcategorized the sources of the dust storms in Iran basedon geological maps and the information on wind erosionof the susceptible lands [13]. Although, all the mentioned
studies have provided considerable results, the fact that adust event results from multiple factors requires consider-ing synthetic approaches. Utilizing various perspectivessuch as remote sensing data, synoptic climatology analysis,and ancillary data including soil texture and land cover ofthe studied regions, as well as the wind speed and direc-tion maps, the present research tries to study the dustevents in western Iran more precisely.On the other hand, the most climatological studies of
the dust storms in Iran are limited to a few numbers ofcase studies. Moreover, in these works the source-basedclassification of atmospheric circulations has not beenconsidered to account for environmental conditions leadingto dust storm. Therefore, in this work, we have increasedthe number of investigated events to 40 cases and also at-mospheric aspects of dust storms are precisely studied.Significant rise in the number of recent dust storms inIran and also applying new and up-to-date methods toexamine this natural event provide another motivation forthe present study.The rest of this paper is organised as follows. Methods
and data are presented in the next section. The researchfindings are discussed in section 3, and section 4 con-cludes the paper.
Data and methodsData and methods for the identification of dust sourcesTo study the dust storms entering western Iran, dailydata from 15 synoptic stations (see Figure 2) in a periodfrom 2000 to 2008 are exploited.In this research, only the dust events satisfying the
following criteria were studied: (I) recorded at least in 3synoptic stations, (II) rising from non-local origins, and(III) leading to a maximum horizontal visibility of 1000meters.In cases, the stations in the region under study indi-
cated consecutive days with dust, only those days werespecified as independent event when dust particles wereinjected to atmospheric currents from dust-prone areas.
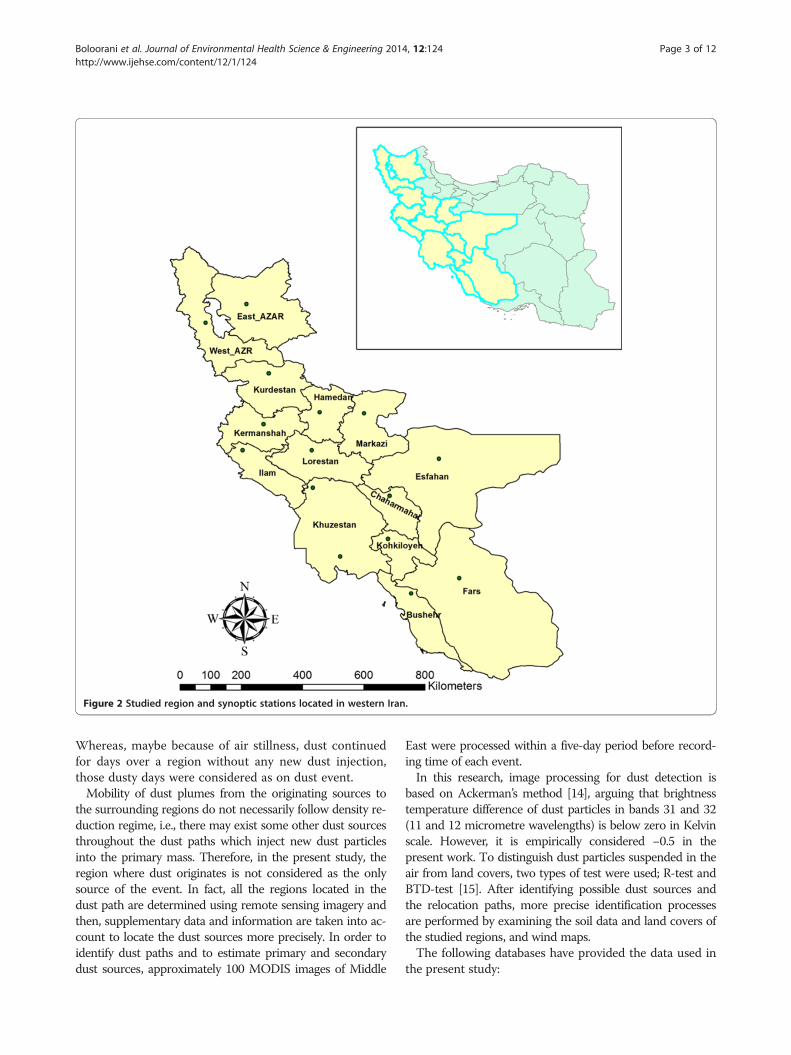
Figure 2 Studied region and synoptic stations located in western Iran.
Boloorani et al. Journal of Environmental Health Science & Engineering 2014, 12:124 Page 3 of 12http://www.ijehse.com/content/12/1/124
Whereas, maybe because of air stillness, dust continuedfor days over a region without any new dust injection,those dusty days were considered as on dust event.Mobility of dust plumes from the originating sources to
the surrounding regions do not necessarily follow density re-duction regime, i.e., there may exist some other dust sourcesthroughout the dust paths which inject new dust particlesinto the primary mass. Therefore, in the present study, theregion where dust originates is not considered as the onlysource of the event. In fact, all the regions located in thedust path are determined using remote sensing imagery andthen, supplementary data and information are taken into ac-count to locate the dust sources more precisely. In order toidentify dust paths and to estimate primary and secondarydust sources, approximately 100 MODIS images of Middle
East were processed within a five-day period before record-ing time of each event.In this research, image processing for dust detection is
based on Ackerman’s method [14], arguing that brightnesstemperature difference of dust particles in bands 31 and 32(11 and 12 micrometre wavelengths) is below zero in Kelvinscale. However, it is empirically considered −0.5 in thepresent work. To distinguish dust particles suspended in theair from land covers, two types of test were used; R-test andBTD-test [15]. After identifying possible dust sources andthe relocation paths, more precise identification processesare performed by examining the soil data and land covers ofthe studied regions, and wind maps.The following databases have provided the data used in
the present study:
Boloorani et al. Journal of Environmental Health Science & Engineering 2014, 12:124 Page 4 of 12http://www.ijehse.com/content/12/1/124
– Visibility data from Iranian MeteorologyOrganization database,
– MODIS images from NASA website,c
– Soil information from the Harmonized World SoilDatabase [16], and
– Land-cover data from ESA websited.
Data and methods to identify atmospheric circulationsassociated with dust stormsThe analysis of synoptic circulations associated with duststorms is carried out according to geopotential height at850 hPa and 500 hPa levels, temperature, and wind data atheight of 10 meters above the ground during the beginningdays of studied dust storms. All atmospheric data, except
Figure 3 Three specified paths of dust relocation to the western Iran.the first path (from left to right): the origin of primitive dust mass (A), the ddissipation (C) for August 7-8-9,2005. The images shown in the second andof February 15–16, 2004 (D, E, and F) and of March 1–3, 2007 (G, H, and I
for dust records, were provided by National Centre ofEnvironmental Predicting (NCEP) database [17].
Result and discussionIdentification of western Iran’s dust sourcesHaving examined the recorded dust storm data of thelocal stations from 2000 to 2008, a number of 40 dustevents were selected. The analysis of the satellite imagesof dust events in the western Iran shows that the dustplumes travel in three main paths (from the source tothe region under the study):
– North western–South eastern path: The detecteddust plumes in Iraq and Syria are carried to the
Images in the first row are the samples of dust plumes moving alongust mass relocating and entering to the study region (B), and itsthird rows show these three steps in the same order for dust events).

Table 1 The dates of the dust events which have formedand moved through the Northwest-Southeast path
No Starting date ofdust storm
Observation date ofdust storm in study area
1 11-Jun-05 12-Jun-05
2 12-Jun-05 13-Jun-05
3 22-Jun-05 23-Jun-05
4 24-Jun-05 25-Jun-05
5 04-Jul-05 05-Jul-05
6 24-Jul-05 25-Jul-05
7 07-Aug-05 08-Aug-05
8 08-Aug-05 09-Aug-05
9 17-Apr-06 18-Apr-06
10 17-Jul-07 18-Jul-07
11 18-Jul-07 19-Jul-07
12 15-Feb-08 15-Feb-08
13 04-Apr-08 05-Apr-08
14 29-Apr-08 01-May-08
15 01-Jun-08 02-Jun-08
16 07-Jun-08 08-Jun-08
17 08-Jun-08 09-Jun-08
18 15-Jun-08 16-Jun-08
19 16-Jun-08 17-Jun-08
20 17-Jun-08 18-Jun-08
21 18-Jun-08 19-Jun-08
22 30-Jun-08 02-Jul-08
23 15-Sep-08 16-Sep-08
Table 2 The dates of the dust events which have formedand moved through the West–east path
No Starting dateof dust storm
Observation date ofdust storm in study area
1 21-Dec-02 22-Dec-02
2 22-May-03 22-May-03
3 15-Feb-04 16-Feb-04
4 13-May-04 14-May-04
5 15-May-04 16-May-04
6 06-Jan-05 07-Jan-05
7 24-Jan-05 25-Jan-05
8 03-Apr-05 04-Apr-05
9 05-May-05 05-May-05
10 21-Jan-06 22-Jan-06
11 04-Feb-07 04-Feb-07
12 16-May-07 17-May-07
13 19-Feb-08 20-Feb-08
14 15-Mar-08 15-Mar-08
Table 3 The dates of the dust events which have formedand displaced through the southern-northern path
No Starting date of dust storm Observation date of dust storm
1 22-Mar-03 23-Mar-03
2 01-Mar-07 03-Mar-07
3 10-Apr-07 11-Apr-07
Boloorani et al. Journal of Environmental Health Science & Engineering 2014, 12:124 Page 5 of 12http://www.ijehse.com/content/12/1/124
western part of Iran by north-westerly winds(Figure 3). Among the 40 dust storms, 23 eventshave formed along this path (Table 1).
Based on the recorded data, massive dust stormsentering Iran began to move in this path since 2005 andhit a peak in 2008. Four consecutive dust events that haveaffected Iran since June 15 to 19, 2008 are rare instancesof this phenomenon resulted from dust source activities inthe first dust pathway. Therefore, it may be inferred thatdust masses which have entered Iran in the recent years,have mainly moved along this path and are originatedfrom the same sources. Seasonal distribution of dustevents (except for an event in February 2008) indicatesthat this path is mainly active in the warm months of theyear, especially June and July. The reasons for these cir-cumstances will be discussed in details in chapter 3.2.
– West-east path: dust masses rise from Iraq-Jordanborders and enter Iran (Figure 3). 14 cases of thestudied dust events have occurred along this path(Table 2).
Temporal distributions of the west–east dust eventsindicate a declining trend in their frequency by the endof the study period (in contrast to the dust events corre-sponding to the first path). According to Table 2, eventsof this category have mostly occurred in 2004 and 2005.These conditions again reflect the considerable effect ofdust origins in recent dust events. The seasonal distribu-tion of the dust storms formed in second path shows apeak in the cold period of year.
– Southern-northern path: It begins from the regionslocated to the south of Persian Gulf and ends atwestern Iran (Figure 3). Only three dust eventstravelled on this path (Table 3).
As indicated in Table 3, dust masses moving in thethird path do not play a significant role in dust eventsoccurring in Iran and thus, it cannot be considered as aninfluential region of forming the dust storms occurred inthe last decade in the study area. Saudi Arabia dustevents occurred in the late cold period of the year that isexamined in atmospheric analysis section.Although it is possible to specify the approximate
places of dust formation and its relocation paths by

Figure 4 The Middle East Soil Map [16].
Boloorani et al. Journal of Environmental Health Science & Engineering 2014, 12:124 Page 6 of 12http://www.ijehse.com/content/12/1/124
processing satellite images, the information on the soiland wind in the region should be analysed to identify thedust sources more accurately. Therefore, we carefully ex-amined the ancillary data corresponding to the mentioneddust paths. These data include soil information of Iraq,Syria, and Saudi Arabia (Figure 4 and Table 4), their landcovers data (Figure 5), as well as the maps of wind velocityand direction (Figure 6).Soil maps of the northwest–southeast dust path in Syria
and Iraq indicated a region of gypsum sediments in thenorth-western Iraq and the eastern Syria. This area hasmainly formed in arid regions with poor vegetation calledgypsisole (Figure 4). Despite the fact that southernmost re-gion of the path, i.e. the south-eastern Iraq, consists of sol-onchaks soil, which is also found in arid and semi-aridregions, one of its distinguishing features is that the watertable is close to the surface. Since, the soil is almost wet- acondition sometimes leading to water stillness on the soilsurface [19]. Although in the recent years, this region has
Table 4 Soil characteristics of dust sources [16]
Sources Dominant soil group Topsoil
The east of Syria and North west of Iraq GY - Gypsisols loam
South east of Iraq Sc-Solonchaks loam
The west and south west of Iraq CL-Calsisol loamy sa
The east and south east of Saudi Arabia DS-sand dunes loamy sa
experienced an increase in depth of groundwater becauseof drought, and some ponds have changed into limitederodible zones [20], the south eastern Iraq cannot be con-sidered as a main and wide dust source influencing thewestern Iran. However, in some cases, dust masses origin-ating from other region have been intensified locally in thisregion and then entered Iran (not shown here). The quan-titative characteristics of soil along northwest–southeastpath (80% of the soil has a fine texture including clay andsilt) verify that the north-western parts of Iraq and theeastern parts of Syria potentially lead to massive duststorms. Furthermore, these conditions are intensified bythe regions with low soil moisture (15–50 mm per 1 msoil depth) and spare land covers. It should be notedthat despite the fine texture of the soil in south easternIraq, higher moisture (150 mm per 1 m soil depth) andmore dense land cover lead to a lower chance ofdust event in this region (Table 4, Figures 4 and 5). Ac-cording to the discussion above, the upper zone of
USDA texture classification AWC (mm) Topsoil sand fraction (%)
15-50 sand(35)/Silt(45)/clay(20)
150 sand(36)/Silt(43)/clay(21)
nd 15-50 sand(39)/Silt(37)/clay(24)
nd 15-100 sand(84)/Silt(9)/clay(7)
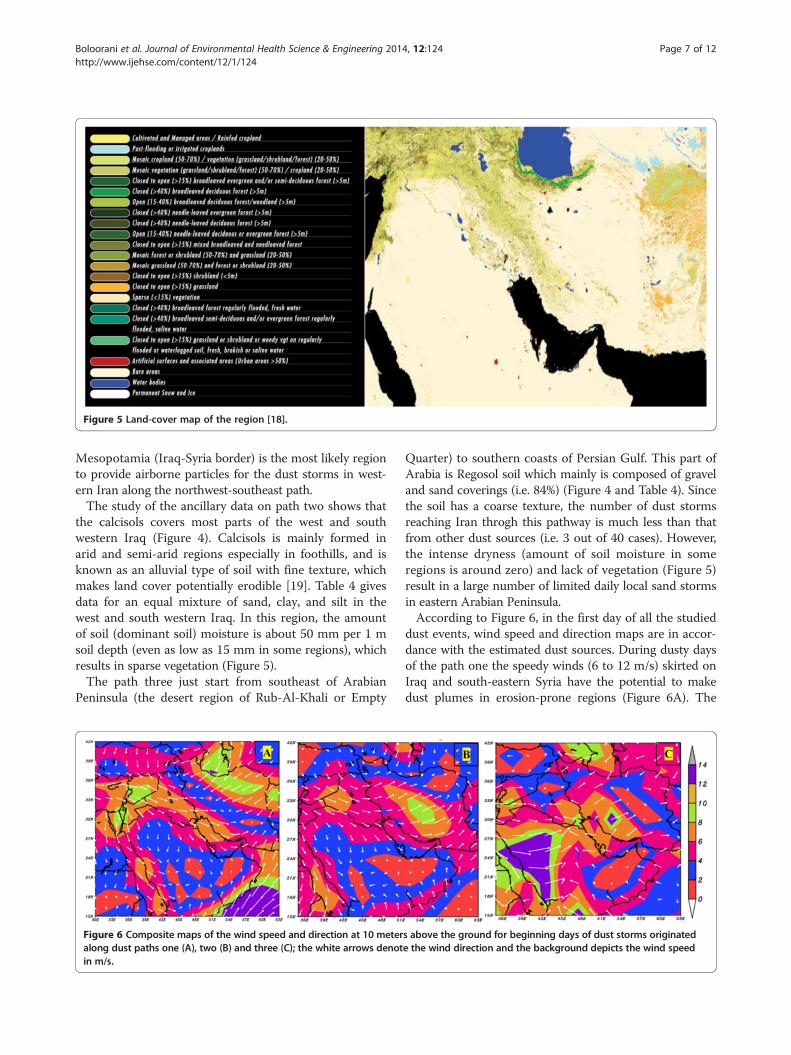
Figure 5 Land-cover map of the region [18].
Boloorani et al. Journal of Environmental Health Science & Engineering 2014, 12:124 Page 7 of 12http://www.ijehse.com/content/12/1/124
Mesopotamia (Iraq-Syria border) is the most likely regionto provide airborne particles for the dust storms in west-ern Iran along the northwest-southeast path.The study of the ancillary data on path two shows that
the calcisols covers most parts of the west and southwestern Iraq (Figure 4). Calcisols is mainly formed inarid and semi-arid regions especially in foothills, and isknown as an alluvial type of soil with fine texture, whichmakes land cover potentially erodible [19]. Table 4 givesdata for an equal mixture of sand, clay, and silt in thewest and south western Iraq. In this region, the amountof soil (dominant soil) moisture is about 50 mm per 1 msoil depth (even as low as 15 mm in some regions), whichresults in sparse vegetation (Figure 5).The path three just start from southeast of Arabian
Peninsula (the desert region of Rub-Al-Khali or Empty
Figure 6 Composite maps of the wind speed and direction at 10 meteralong dust paths one (A), two (B) and three (C); the white arrows denotin m/s.
Quarter) to southern coasts of Persian Gulf. This part ofArabia is Regosol soil which mainly is composed of graveland sand coverings (i.e. 84%) (Figure 4 and Table 4). Sincethe soil has a coarse texture, the number of dust stormsreaching Iran throgh this pathway is much less than thatfrom other dust sources (i.e. 3 out of 40 cases). However,the intense dryness (amount of soil moisture in someregions is around zero) and lack of vegetation (Figure 5)result in a large number of limited daily local sand stormsin eastern Arabian Peninsula.According to Figure 6, in the first day of all the studied
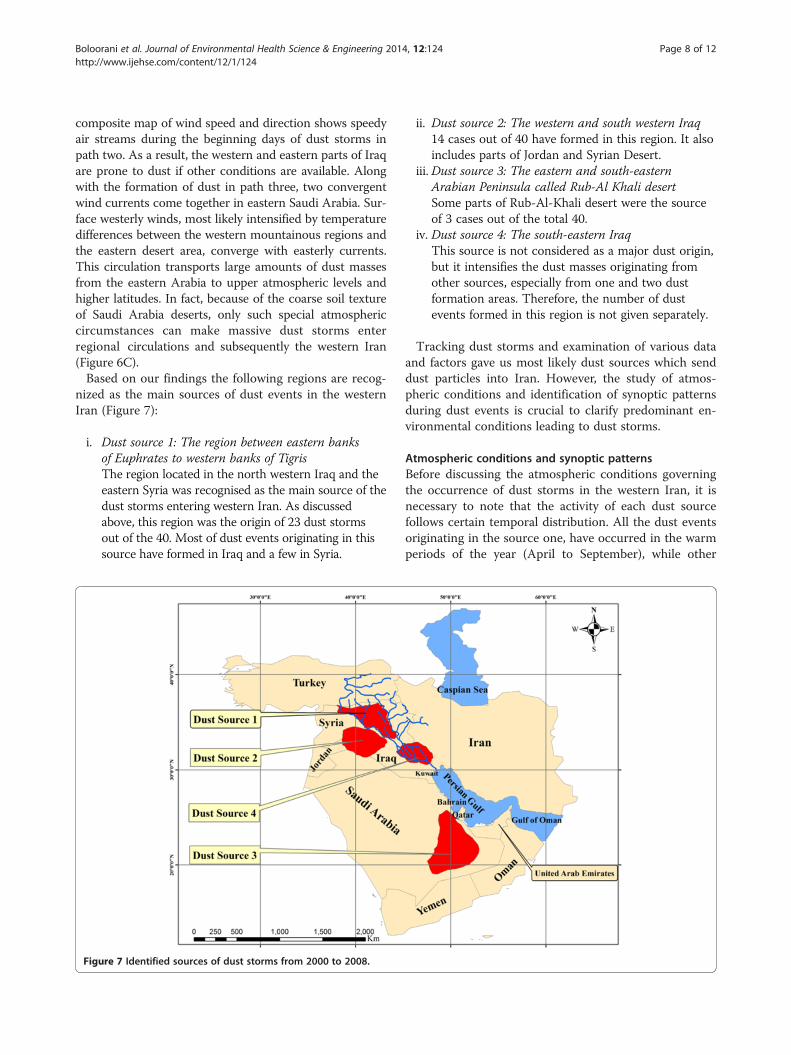
dust events, wind speed and direction maps are in accor-dance with the estimated dust sources. During dusty daysof the path one the speedy winds (6 to 12 m/s) skirted onIraq and south-eastern Syria have the potential to makedust plumes in erosion-prone regions (Figure 6A). The
s above the ground for beginning days of dust storms originatede the wind direction and the background depicts the wind speed
Boloorani et al. Journal of Environmental Health Science & Engineering 2014, 12:124 Page 8 of 12http://www.ijehse.com/content/12/1/124
composite map of wind speed and direction shows speedyair streams during the beginning days of dust storms inpath two. As a result, the western and eastern parts of Iraqare prone to dust if other conditions are available. Alongwith the formation of dust in path three, two convergentwind currents come together in eastern Saudi Arabia. Sur-face westerly winds, most likely intensified by temperaturedifferences between the western mountainous regions andthe eastern desert area, converge with easterly currents.This circulation transports large amounts of dust massesfrom the eastern Arabia to upper atmospheric levels andhigher latitudes. In fact, because of the coarse soil textureof Saudi Arabia deserts, only such special atmosphericcircumstances can make massive dust storms enterregional circulations and subsequently the western Iran(Figure 6C).Based on our findings the following regions are recog-
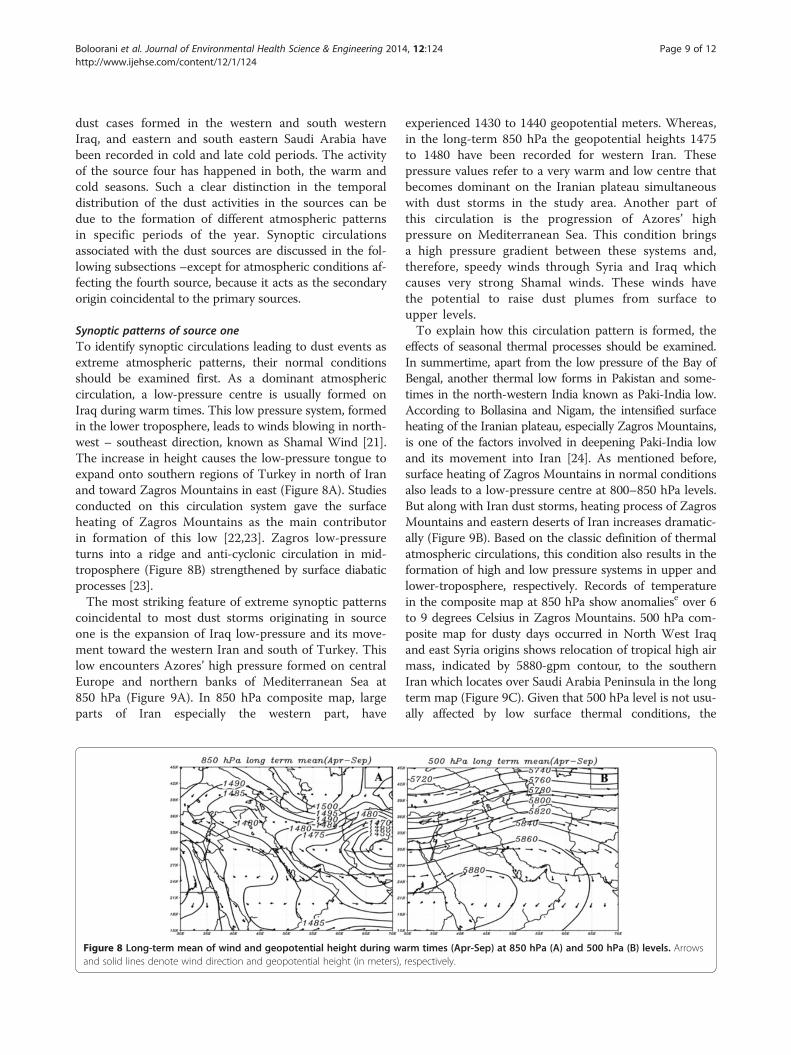
nized as the main sources of dust events in the westernIran (Figure 7):
i. Dust source 1: The region between eastern banksof Euphrates to western banks of Tigris
Fig
The region located in the north western Iraq and theeastern Syria was recognised as the main source of thedust storms entering western Iran. As discussedabove, this region was the origin of 23 dust stormsout of the 40. Most of dust events originating in thissource have formed in Iraq and a few in Syria.
ure 7 Identified sources of dust storms from 2000 to 2008.
ii. Dust source 2: The western and south western Iraq14 cases out of 40 have formed in this region. It alsoincludes parts of Jordan and Syrian Desert.
iii. Dust source 3: The eastern and south-easternArabian Peninsula called Rub-Al Khali desertSome parts of Rub-Al-Khali desert were the sourceof 3 cases out of the total 40.
iv. Dust source 4: The south-eastern IraqThis source is not considered as a major dust origin,but it intensifies the dust masses originating fromother sources, especially from one and two dustformation areas. Therefore, the number of dustevents formed in this region is not given separately.
Tracking dust storms and examination of various dataand factors gave us most likely dust sources which senddust particles into Iran. However, the study of atmos-pheric conditions and identification of synoptic patternsduring dust events is crucial to clarify predominant en-vironmental conditions leading to dust storms.
Atmospheric conditions and synoptic patternsBefore discussing the atmospheric conditions governingthe occurrence of dust storms in the western Iran, it isnecessary to note that the activity of each dust sourcefollows certain temporal distribution. All the dust eventsoriginating in the source one, have occurred in the warmperiods of the year (April to September), while other
Boloorani et al. Journal of Environmental Health Science & Engineering 2014, 12:124 Page 9 of 12http://www.ijehse.com/content/12/1/124
dust cases formed in the western and south westernIraq, and eastern and south eastern Saudi Arabia havebeen recorded in cold and late cold periods. The activityof the source four has happened in both, the warm andcold seasons. Such a clear distinction in the temporaldistribution of the dust activities in the sources can bedue to the formation of different atmospheric patternsin specific periods of the year. Synoptic circulationsassociated with the dust sources are discussed in the fol-lowing subsections –except for atmospheric conditions af-fecting the fourth source, because it acts as the secondaryorigin coincidental to the primary sources.
Synoptic patterns of source oneTo identify synoptic circulations leading to dust events asextreme atmospheric patterns, their normal conditionsshould be examined first. As a dominant atmosphericcirculation, a low-pressure centre is usually formed onIraq during warm times. This low pressure system, formedin the lower troposphere, leads to winds blowing in north-west – southeast direction, known as Shamal Wind [21].The increase in height causes the low-pressure tongue toexpand onto southern regions of Turkey in north of Iranand toward Zagros Mountains in east (Figure 8A). Studiesconducted on this circulation system gave the surfaceheating of Zagros Mountains as the main contributorin formation of this low [22,23]. Zagros low-pressureturns into a ridge and anti-cyclonic circulation in mid-troposphere (Figure 8B) strengthened by surface diabaticprocesses [23].The most striking feature of extreme synoptic patterns
coincidental to most dust storms originating in sourceone is the expansion of Iraq low-pressure and its move-ment toward the western Iran and south of Turkey. Thislow encounters Azores’ high pressure formed on centralEurope and northern banks of Mediterranean Sea at850 hPa (Figure 9A). In 850 hPa composite map, largeparts of Iran especially the western part, have
Figure 8 Long-term mean of wind and geopotential height during waand solid lines denote wind direction and geopotential height (in meters),
experienced 1430 to 1440 geopotential meters. Whereas,in the long-term 850 hPa the geopotential heights 1475to 1480 have been recorded for western Iran. Thesepressure values refer to a very warm and low centre thatbecomes dominant on the Iranian plateau simultaneouswith dust storms in the study area. Another part ofthis circulation is the progression of Azores’ highpressure on Mediterranean Sea. This condition bringsa high pressure gradient between these systems and,therefore, speedy winds through Syria and Iraq whichcauses very strong Shamal winds. These winds havethe potential to raise dust plumes from surface toupper levels.To explain how this circulation pattern is formed, the
effects of seasonal thermal processes should be examined.In summertime, apart from the low pressure of the Bay ofBengal, another thermal low forms in Pakistan and some-times in the north-western India known as Paki-India low.According to Bollasina and Nigam, the intensified surfaceheating of the Iranian plateau, especially Zagros Mountains,is one of the factors involved in deepening Paki-India lowand its movement into Iran [24]. As mentioned before,surface heating of Zagros Mountains in normal conditionsalso leads to a low-pressure centre at 800–850 hPa levels.But along with Iran dust storms, heating process of ZagrosMountains and eastern deserts of Iran increases dramatic-ally (Figure 9B). Based on the classic definition of thermalatmospheric circulations, this condition also results in theformation of high and low pressure systems in upper andlower-troposphere, respectively. Records of temperaturein the composite map at 850 hPa show anomaliese over 6to 9 degrees Celsius in Zagros Mountains. 500 hPa com-posite map for dusty days occurred in North West Iraqand east Syria origins shows relocation of tropical high airmass, indicated by 5880-gpm contour, to the southernIran which locates over Saudi Arabia Peninsula in the longterm map (Figure 9C). Given that 500 hPa level is not usu-ally affected by low surface thermal conditions, the
rm times (Apr-Sep) at 850 hPa (A) and 500 hPa (B) levels. Arrowsrespectively.
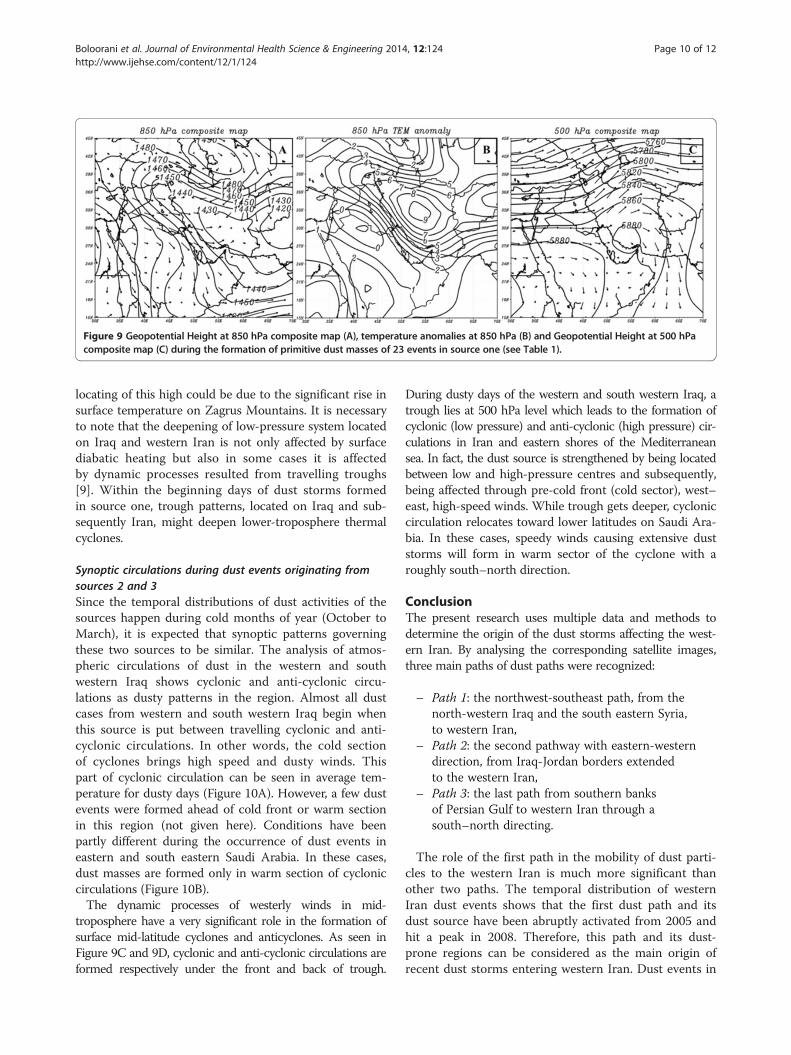
Figure 9 Geopotential Height at 850 hPa composite map (A), temperature anomalies at 850 hPa (B) and Geopotential Height at 500 hPacomposite map (C) during the formation of primitive dust masses of 23 events in source one (see Table 1).
Boloorani et al. Journal of Environmental Health Science & Engineering 2014, 12:124 Page 10 of 12http://www.ijehse.com/content/12/1/124
locating of this high could be due to the significant rise insurface temperature on Zagrus Mountains. It is necessaryto note that the deepening of low-pressure system locatedon Iraq and western Iran is not only affected by surfacediabatic heating but also in some cases it is affectedby dynamic processes resulted from travelling troughs[9]. Within the beginning days of dust storms formedin source one, trough patterns, located on Iraq and sub-sequently Iran, might deepen lower-troposphere thermalcyclones.
Synoptic circulations during dust events originating fromsources 2 and 3Since the temporal distributions of dust activities of thesources happen during cold months of year (October toMarch), it is expected that synoptic patterns governingthese two sources to be similar. The analysis of atmos-pheric circulations of dust in the western and southwestern Iraq shows cyclonic and anti-cyclonic circu-lations as dusty patterns in the region. Almost all dustcases from western and south western Iraq begin whenthis source is put between travelling cyclonic and anti-cyclonic circulations. In other words, the cold sectionof cyclones brings high speed and dusty winds. Thispart of cyclonic circulation can be seen in average tem-perature for dusty days (Figure 10A). However, a few dustevents were formed ahead of cold front or warm sectionin this region (not given here). Conditions have beenpartly different during the occurrence of dust events ineastern and south eastern Saudi Arabia. In these cases,dust masses are formed only in warm section of cycloniccirculations (Figure 10B).The dynamic processes of westerly winds in mid-
troposphere have a very significant role in the formation ofsurface mid-latitude cyclones and anticyclones. As seen inFigure 9C and 9D, cyclonic and anti-cyclonic circulations areformed respectively under the front and back of trough.
During dusty days of the western and south western Iraq, atrough lies at 500 hPa level which leads to the formation ofcyclonic (low pressure) and anti-cyclonic (high pressure) cir-culations in Iran and eastern shores of the Mediterraneansea. In fact, the dust source is strengthened by being locatedbetween low and high-pressure centres and subsequently,being affected through pre-cold front (cold sector), west–east, high-speed winds. While trough gets deeper, cycloniccirculation relocates toward lower latitudes on Saudi Ara-bia. In these cases, speedy winds causing extensive duststorms will form in warm sector of the cyclone with aroughly south–north direction.
ConclusionThe present research uses multiple data and methods todetermine the origin of the dust storms affecting the west-ern Iran. By analysing the corresponding satellite images,three main paths of dust paths were recognized:
– Path 1: the northwest-southeast path, from thenorth-western Iraq and the south eastern Syria,to western Iran,
– Path 2: the second pathway with eastern-westerndirection, from Iraq-Jordan borders extendedto the western Iran,
– Path 3: the last path from southern banksof Persian Gulf to western Iran through asouth–north directing.
The role of the first path in the mobility of dust parti-cles to the western Iran is much more significant thanother two paths. The temporal distribution of westernIran dust events shows that the first dust path and itsdust source have been abruptly activated from 2005 andhit a peak in 2008. Therefore, this path and its dust-prone regions can be considered as the main origin ofrecent dust storms entering western Iran. Dust events in
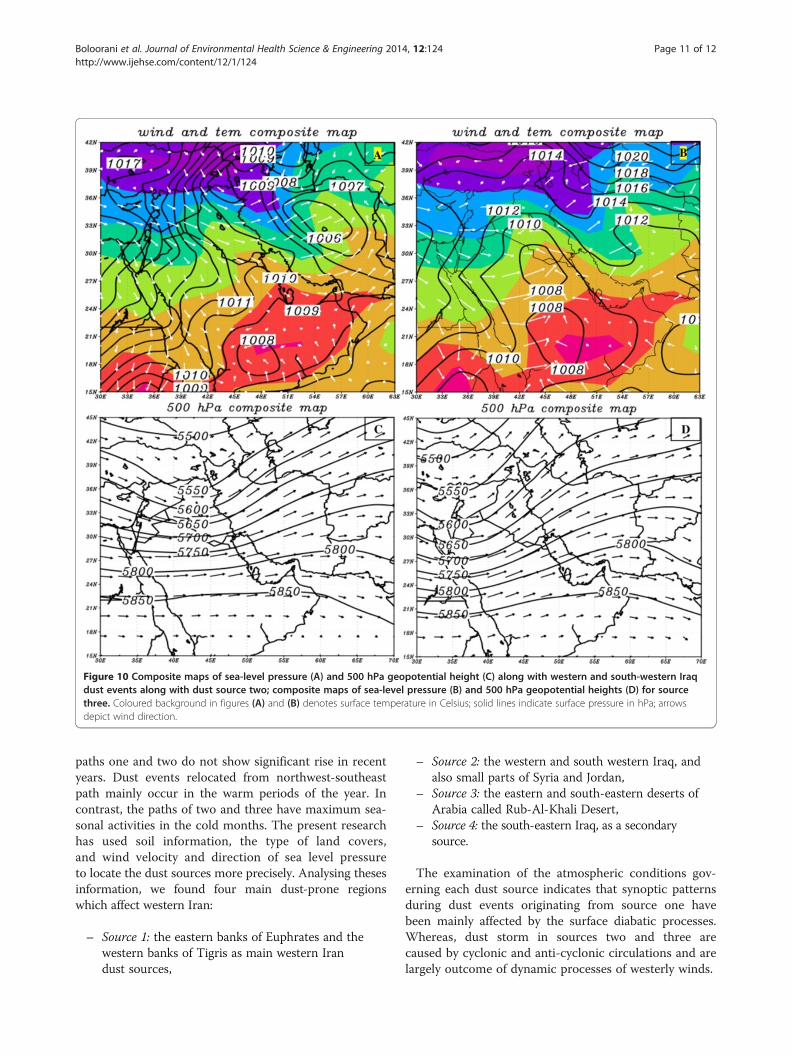
Figure 10 Composite maps of sea-level pressure (A) and 500 hPa geopotential height (C) along with western and south-western Iraqdust events along with dust source two; composite maps of sea-level pressure (B) and 500 hPa geopotential heights (D) for sourcethree. Coloured background in figures (A) and (B) denotes surface temperature in Celsius; solid lines indicate surface pressure in hPa; arrowsdepict wind direction.
Boloorani et al. Journal of Environmental Health Science & Engineering 2014, 12:124 Page 11 of 12http://www.ijehse.com/content/12/1/124
paths one and two do not show significant rise in recentyears. Dust events relocated from northwest-southeastpath mainly occur in the warm periods of the year. Incontrast, the paths of two and three have maximum sea-sonal activities in the cold months. The present researchhas used soil information, the type of land covers,and wind velocity and direction of sea level pressureto locate the dust sources more precisely. Analysing thesesinformation, we found four main dust-prone regionswhich affect western Iran:
– Source 1: the eastern banks of Euphrates and thewestern banks of Tigris as main western Irandust sources,
– Source 2: the western and south western Iraq, andalso small parts of Syria and Jordan,
– Source 3: the eastern and south-eastern deserts ofArabia called Rub-Al-Khali Desert,
– Source 4: the south-eastern Iraq, as a secondarysource.
The examination of the atmospheric conditions gov-erning each dust source indicates that synoptic patternsduring dust events originating from source one havebeen mainly affected by the surface diabatic processes.Whereas, dust storm in sources two and three arecaused by cyclonic and anti-cyclonic circulations and arelargely outcome of dynamic processes of westerly winds.

Boloorani et al. Journal of Environmental Health Science & Engineering 2014, 12:124 Page 12 of 12http://www.ijehse.com/content/12/1/124
EndnotesaModerate Resolution Imaging Spectroradiometer.bBrightness Temperature Difference.chttp://rapidfire.sci.gsfc.nasa.gov/realtime.dhttp://www.esa.int/Our_Activities/Observing_the_Earth/
Space_for_our_climate/ESA_global_land_cover_map_available_online.
eTemperature anomaly = (daily temperature – averagedaily temperature).
Competing interestsThe authors declare that they have no competing interests.
Authors’ contributionsThe most parts of this study including: research scheme, data analysis, andmanuscript preparation were implemented by first two authors. Third authorhas helped to find an effective dust detection algorithm and make itconvenient by programing in MATLAB software. Other authors haveaccompanied in editing, cohesion and translating presented paper.All authors read and approved the final manuscript.
AcknowledgementsThis research paper is made possible through the help and financial supportfrom science and technology affairs of Islamic republic of Iran.
Author details1Department of Remote Sensing & GIS & Geoinformatics Research Institute(GRI), University of Tehran, Tehran, Iran. 2Geoinformatics Research Institute(GRI), University of Tehran and Department of Geography and RegionalResearch, University of Vienna, Vienna, Austria. 3Department of Soil Science,Tarbiat Modares University, Tehran, Iran. 4Faculty of Electrical Engineering,Sadra Institute of Higher Education, Isfahan, Iran. 5Geoinformatics ResearchInstitute (GRI), University of Tehran, Tehran, Iran.
Received: 12 February 2013 Accepted: 14 October 2014
References1. Goudie AS, Middleton N: Desert dust in the global system. New York:
Springer Berlin Heidelberg; 2006.2. Shao Y, Wyrwoll KH, Chappell A, Huang J, Lin Z, McTainsh GH, Mikami M,
Tanaka TY, Wangh X, Yoon S: Dust cycle: an emerging core theme inearth system science. Aeolian Res 2011, 2:181–204.
3. Ardehjani SS: I.R of Iran national report on regional action plan tocombat dust and sand storm. http://icap.atmos.und.edu/AERP/MeetingPDFs/RemoteSensing/Shirkani_Iran_Dust_Report%20(NXPowerLite).pdf.
4. Ozsoy E, Nilgun K: A hemispheric dust storm affecting the Atlantic andMediterranean in April 1994: Analyses, modeling, ground-basedmeasurements and satellite observations. J Geophys Res 2001,106:18439–18460.
5. El-Askary HM, Sarkar S, Kafatos M, El-Ghazawi TA: A multisensor approachto dust storm monitoring over the Nile Delta. Geosci Remote Sens 2003,41:2386–2391.
6. Qu JJ, Hao X, Kafatos M, Wang L: Asian dust storm monitoring combiningterra and aqua MODIS SRB measurements. Geosci Remote Sens Lett 2006,3:484–486.
7. Alles DL: geomorphology and dust storm in the China. http://fire.biol.wwu.edu/trent/alles/ChinaDust.pdf.
8. Li X, Ge L, Dong Y, Chang HC: Estimating the greatest dust storm ineastern Australia with MODIS satellite images. In Proceedings of IGARSS.Honolulu, HI: 2010:1039–1042.
9. Barry RG, Perry AH: Synoptic Climatology: Methods and Applications.London: Methuen; 1973.
10. Barkan J, Alpert P, Kutiel H, Kishcha P: Synoptics of dust transportationdays from Africa toward Italy and central Europe. J J Geophys Res 2005,110:1984–2012.
11. Zolfaghari H, Abedzadeh H: A synoptic analysis of dust systems at thewest part of Iran. Geography Dev Q 2006, 6:173–188.
12. Dayan U, Ziv B, Shoob T, Enzel Y: Suspended dust over south-easternMediterranean and its relation to atmospheric circulations. Int J Climatol2008, 28:915–924.
13. Gerivani H, Lashkaripour GR, Ghafoor IM, Jalili N: The source of dust stormin Iran: a case study based on geological information and rainfall data.Carpathian J Earth Environ Sci 2010, 6:297–308.
14. Ackerman SA: Remote sensing aerosols using satellite infraredobservations. J Geophys Res 1997, 102:17069–17079.
15. Zhao TXP, Ackerman S, Guo W: Dust and smoke detection for multi-channel imagers. Remote Sens 2010, 2:2347–2368.
16. Harmonized World Soil Database (version 1.1). http://webarchive.iiasa.ac.at/Research/LUC/External-World-soil-database/HTML/.
17. Kalnay E, Kanamitsu M, Kistler R, Collins W, Deaven D, Gandin L, Iredell M,Saha S, White G, Woollen J, Zhu Y, Leetmaa A, Reynolds B, Chelliah M,Ebisuzaki W, Higgins W, Janowiak J, Mo KC, Ropelewski C, Wang J, Jenne R,Bull JD: The NCEP/NCAR 40-year reanalysis project. Am Meteorol Soc 1996,77:437–472.
18. ENVISAT global land cover map. http://www.esa.int/spaceinimages/Images/2008/12/Envisat_global_land_cover_map.
19. IUSS Working Group WRB: World Reference Base for Soil Resources.http://www.fao.org/fileadmin/templates/nr/images/resources/pdf_documents/wrb2007_red.pdf.
20. UNEP, Partow H: The Mesopotamian Marshlands: Demise of anEcosystem Early Warning and Assessment Technical Report.http://eoimages.gsfc.nasa.gov/images/imagerecords/1000/1716/meso2.pdf.
21. Aurelius L, Buttgereit V, Cammelli S, Zanina M: The impact of Shamalwinds on tall building design in the Gulf Region. https://www.dm.gov.ae.
22. Zaitchik BF, Evans JP, Smith RB: Regional impact of an elevated heatsource: the Zagros Plateau of Iran. J Clim 2007, 20:4133–4146.
23. Zarrin A, Ghaemi H, Azadi M, Mofidi A, Mirzaei E: The effect of the ZagrosMountains on the formation and maintenance of the Iran Anticycloneusing RegCM4. Meteorol Atmos Phys 2011, 112:91–100.
24. Bollasina M, Nigam S: The summertime "heat" low over Pakistan/north-western India: evolution and origin. Clim Dynam 2010, 37:957–970.
doi:10.1186/s40201-014-0124-4Cite this article as: Boloorani et al.: Investigation of dust storms enteringWestern Iran using remotely sensed data and synoptic analysis. Journalof Environmental Health Science & Engineering 2014 12:124.
Submit your next manuscript to BioMed Centraland take full advantage of:
• Convenient online submission
• Thorough peer review
• No space constraints or color figure charges
• Immediate publication on acceptance
• Inclusion in PubMed, CAS, Scopus and Google Scholar
• Research which is freely available for redistribution
Submit your manuscript at www.biomedcentral.com/submit