RESEARCH ARTICLE Open Access Integrated genomics of ...
13
RESEARCH ARTICLE Open Access Integrated genomics of ovarian xenograft tumor progression and chemotherapy response Ashley Stuckey 1† , Andrew Fischer 2† , Daniel H Miller 2† , Sara Hillenmeyer 2 , Kyu K Kim 1 , Anna Ritz 3 , Rakesh K Singh 1 , Benjamin J Raphael 3 , Laurent Brard 4 and Alexander S Brodsky 2*† Abstract Background: Ovarian cancer is the most deadly gynecological cancer with a very poor prognosis. Xenograft mouse models have proven to be one very useful tool in testing candidate therapeutic agents and gene function in vivo. In this study we identify genes and gene networks important for the efficacy of a pre-clinical anti-tumor therapeutic, MT19c. Methods: In order to understand how ovarian xenograft tumors may be growing and responding to anti-tumor therapeutics, we used genome-wide mRNA expression and DNA copy number measurements to identify key genes and pathways that may be critical for SKOV-3 xenograft tumor progression. We compared SKOV-3 xenografts treated with the ergocalciferol derived, MT19c, to untreated tumors collected at multiple time points. Cell viability assays were used to test the function of the PPARg agonist, Rosiglitazone, on SKOV-3 cell growth. Results: These data indicate that a number of known survival and growth pathways including Notch signaling and general apoptosis factors are differentially expressed in treated vs. untreated xenografts. As tumors grow, cell cycle and DNA replication genes show increased expression, consistent with faster growth. The steroid nuclear receptor, PPARg, was significantly up-regulated in MT19c treated xenografts. Surprisingly, stimulation of PPARg with Rosiglitazone reduced the efficacy of MT19c and cisplatin suggesting that PPARg is regulating a survival pathway in SKOV-3 cells. To identify which genes may be important for tumor growth and treatment response, we observed that MT19c down-regulates some high copy number genes and stimulates expression of some low copy number genes suggesting that these genes are particularly important for SKOV-3 xenograft growth and survival. Conclusions: We have characterized the time dependent responses of ovarian xenograft tumors to the vitamin D analog, MT19c. Our results suggest that PPARg promotes survival for some ovarian tumor cells. We propose that a combination of regulated expression and copy number can identify genes that are likely important for chemotherapy response. Our findings suggest a new approach to identify candidate genes that are critical for anti- tumor therapy. Background Epithelial ovarian cancer (EOC) is the most lethal of all the gynecologic cancers, affecting thousands of women each year [1]. Most patients initially respond to chemotherapy, only to recur within a few years with drug-resistant meta- static disease [2]. Thus, there is a pressing need to develop new anti-tumor therapies that can work alone, or in com- bination with platinum-based therapy. Two general approaches have been pursued to address drug resistance: development of new therapeutics, and drug combinations that improve standard platinum and/or taxane based chemotherapy. The application of calcitriol/ vitamin D3 has emerged as an important strategy to target the vitamin D receptor (VDR) for cancer treatment [3]. Hypercalcemia and other toxicities have limited develop- ment of calcitriol and vitamin D analogs tested to date [3]. MT19c is a novel vitamin D analog based on B3CD [4,5] that shows significant effects on EOC cell lines and xeno- graft tumor models. MT19c was designed to be a vitamin D receptor ligand but appears to work independently of VDR (Brard L, Lange TS, Robinson K, Kim KK, Brodsky * Correspondence: [email protected] † Contributed equally 2 Department of Molecular Biology, Cell Biology, and Biochemistry, Brown University, Providence, RI 02903, USA Full list of author information is available at the end of the article Stuckey et al. BMC Cancer 2011, 11:308 http://www.biomedcentral.com/1471-2407/11/308 © 2011 Stuckey et al; licensee BioMed Central Ltd. This is an Open Access article distributed under the terms of the Creative Commons Attribution License (http://creativecommons.org/licenses/by/2.0), which permits unrestricted use, distribution, and reproduction in any medium, provided the original work is properly cited.
Transcript of RESEARCH ARTICLE Open Access Integrated genomics of ...

RESEARCH ARTICLE Open Access
Integrated genomics of ovarian xenograft tumorprogression and chemotherapy responseAshley Stuckey1†, Andrew Fischer2†, Daniel H Miller2†, Sara Hillenmeyer2, Kyu K Kim1, Anna Ritz3, Rakesh K Singh1,Benjamin J Raphael3, Laurent Brard4 and Alexander S Brodsky2*†
Abstract
Background: Ovarian cancer is the most deadly gynecological cancer with a very poor prognosis. Xenograftmouse models have proven to be one very useful tool in testing candidate therapeutic agents and gene functionin vivo. In this study we identify genes and gene networks important for the efficacy of a pre-clinical anti-tumortherapeutic, MT19c.
Methods: In order to understand how ovarian xenograft tumors may be growing and responding to anti-tumortherapeutics, we used genome-wide mRNA expression and DNA copy number measurements to identify keygenes and pathways that may be critical for SKOV-3 xenograft tumor progression. We compared SKOV-3 xenograftstreated with the ergocalciferol derived, MT19c, to untreated tumors collected at multiple time points. Cell viabilityassays were used to test the function of the PPARg agonist, Rosiglitazone, on SKOV-3 cell growth.
Results: These data indicate that a number of known survival and growth pathways including Notch signaling andgeneral apoptosis factors are differentially expressed in treated vs. untreated xenografts. As tumors grow, cell cycleand DNA replication genes show increased expression, consistent with faster growth. The steroid nuclear receptor,PPARg, was significantly up-regulated in MT19c treated xenografts. Surprisingly, stimulation of PPARg withRosiglitazone reduced the efficacy of MT19c and cisplatin suggesting that PPARg is regulating a survival pathway inSKOV-3 cells. To identify which genes may be important for tumor growth and treatment response, we observedthat MT19c down-regulates some high copy number genes and stimulates expression of some low copy numbergenes suggesting that these genes are particularly important for SKOV-3 xenograft growth and survival.
Conclusions: We have characterized the time dependent responses of ovarian xenograft tumors to the vitamin Danalog, MT19c. Our results suggest that PPARg promotes survival for some ovarian tumor cells. We propose that acombination of regulated expression and copy number can identify genes that are likely important forchemotherapy response. Our findings suggest a new approach to identify candidate genes that are critical for anti-tumor therapy.
BackgroundEpithelial ovarian cancer (EOC) is the most lethal of all thegynecologic cancers, affecting thousands of women eachyear [1]. Most patients initially respond to chemotherapy,only to recur within a few years with drug-resistant meta-static disease [2]. Thus, there is a pressing need to developnew anti-tumor therapies that can work alone, or in com-bination with platinum-based therapy.
Two general approaches have been pursued to addressdrug resistance: development of new therapeutics, anddrug combinations that improve standard platinum and/ortaxane based chemotherapy. The application of calcitriol/vitamin D3 has emerged as an important strategy to targetthe vitamin D receptor (VDR) for cancer treatment [3].Hypercalcemia and other toxicities have limited develop-ment of calcitriol and vitamin D analogs tested to date [3].MT19c is a novel vitamin D analog based on B3CD [4,5]
that shows significant effects on EOC cell lines and xeno-graft tumor models. MT19c was designed to be a vitaminD receptor ligand but appears to work independently ofVDR (Brard L, Lange TS, Robinson K, Kim KK, Brodsky
* Correspondence: [email protected]† Contributed equally2Department of Molecular Biology, Cell Biology, and Biochemistry, BrownUniversity, Providence, RI 02903, USAFull list of author information is available at the end of the article
Stuckey et al. BMC Cancer 2011, 11:308http://www.biomedcentral.com/1471-2407/11/308
© 2011 Stuckey et al; licensee BioMed Central Ltd. This is an Open Access article distributed under the terms of the Creative CommonsAttribution License (http://creativecommons.org/licenses/by/2.0), which permits unrestricted use, distribution, and reproduction inany medium, provided the original work is properly cited.
AS, Uzun A, Padbury J, Moore R, Singh RK: Discovery ofthe first Ergocalciferol derived vitamin D receptor inde-pendent true non-hypercalcemic anti-cancer agent(MT19c), submitted). Here, we aimed to understandwhich pathways and genes may be important for MT19caction in a SKOV-3 xenograft tumor model. These dataalso provide insight into key pathways and genes impor-tant for tumor growth and survival.As EOC progresses, tumors may evolve through two
general mechanisms: accumulation of new mutations, orselection of specific cell types emerging from a heteroge-neous mixture of cells [6]. In the clinic, examination oftumors is typically only feasible as a snapshot at a giventime with little knowledge about how a tumor is evolvingduring disease progression. A recent evaluation of long-term platinum treatment of a mouse lung cancer modelsuggested that DNA repair pathways are significantly up-regulated leading to resistance [7].Many mutations and chromosomal structural rearrange-
ments have been identified in primary ovarian tumors andcell lines [8-10]. Copy number aberrations (CNAs) are acommon mechanism observed to control gene expressionand tumor progression [8]. Loss of DNA is anothermechanism that reduces expression of tumor suppressorgenes, which inhibit tumor progression. Conversely, DNAcopy number gain may increase expression of oncogenes.However, CNAs can explain a significant fraction of thevariation in gene expression but not all of it, perhapsbecause of epigenetic mechanisms such as DNA methyla-tion [11,12].The purpose of this study was to understand which
genes and pathways may be important for MT19c’s anti-tumor activity and to identify genes critical for tumor pro-gression. A number of genes in the PPARg network,including PPARg, were enriched in MT19c treated tumors.When PPARg is stimulated with Rosiglitazone, MT19cand cisplatin have significantly higher IC50s suggestingthat PPARg is promoting survival in at least some types ofovarian cancer cells, leading to poorer outcomes. By com-bining CNAs and drug induced expression changes, weobserve a subset of genes that may be particularly impor-tant for MT19c action and/or tumor survival. We proposethat combining copy number analysis with drug inducedexpression changes can identify key genes important forchemotherapeutic efficacy. These results will be relevantto plan future xenograft studies and highlight the impor-tance of considering the changing tumor dynamics overtime when evaluating gene expression and drug responses.
MethodsCell culture and ReagentsSKOV-3 (ATCC) cells were grown DMEM (Mediatech,Manassas, VA) with 10% FBS (Hyclone, Logan, UT) with.MT19c was synthesized as described in detail elsewhere
[13]. Briefly, commercially available Ergocalciferol under-went a Diels-Alder reaction with N-methyl,1,2,4-triazoline-dione to generate an adduct, which upon reaction withbromoacetic acid in the presence of DCC (N, N’-dicyclo-hexylcarbodiimide) generated MT19c in good yields. Rosi-glitazone was purchased from Axxora (San Diego, CA).GW9662 was purchased from Sigma-Aldrich (St Louis,MO).
SKOV-3 Xenograft Tumors and TreatmentSKOV-3 cells (2 × 10⁶ cells/inoculate) were suspended in0.1 mL of matrigel and inoculated subcutaneously in theflank of 4-6 week-old nude mice (NU/NU; strain code088/homozygous) (Charles River Laboratories, Wilming-ton, MA) two weeks before treatment. MT19c was pre-pared as a stock solution of 1 mM in 100% EtOH anddiluted 1:40 in PBS for administration. Mice were moni-tored and treated intraperitoneally (IP) every other daywith either vehicle control (control group, PBS/2.5%EtOH; 12 animals) or 0.3 mL (10 mg/kg bwt) of MT19c(10 animals). Tumor size was calculated using a caliper.Animal experiments were carried out in the animal facil-ities of Rhode Island Hospital (RIH), RI, USA with strictadherence to the guidelines of the Animal Welfare Com-mittee of RIH and Women and Infants Hospital (IACUCprotocol # 0061-07).
RNA purification and microarraysRNA was isolated from each tumor by homogenization inTrizol (Invitrogen) using a Tissuemizer (Tekmar Company,Cincinnati, OH). RNA was purified using Qiagen RNAsycolumns following manufacturer’s protocol. All RNA wasof high quality as assessed by an Agilent 2100 Bioanalyzer(Agilent Technologies, Inc. Santa Clara, CA). RNA wasprepared for hybridization on Affymetrix Human Gene 1.0St arrays. All RNA processing, array hybridizations andscanning were performed by the Brown University Centerfor Genomics and Proteomics core facility. RNA was pre-pared for hybridization using Affymetrix standard proto-cols and applied to Human Gene 1.0 ST microarrays(Affymetrix, Santa Clara, CA). All microarrays were quan-tile normalized together and the Probe Logarithmic Inten-sity Error (PLIER) algorithm was used to generate signalestimates for all RefSeq genes. To select actual signal, wediscarded those transcripts belonging to the lowest quartileof their respective datasets. Analysis of significantly chan-ging genes was determined using R http://www.r-project.org/. Complete microarray data have been deposited at theNational Center for Biotechnology Information’s GeneExpression Omnibus (accession number GSE23616).
Ingenuity Pathway AnalysisThe discriminating genes were used as input into Inge-nuity Pathway Analysis (IPA) (Ingenuity IP 8.6-3003
Stuckey et al. BMC Cancer 2011, 11:308http://www.biomedcentral.com/1471-2407/11/308
Page 2 of 13
http://www.ingenuity.com. The following analysis set-tings were used, the Ingenuity Knowledge database forgenes on the Affymetrix Human Gene 1.0 St Array wasused as a reference set, direct and indirect relationshipswere included, with a maximum of 35 molecules pernetwork and a maximum of 25 networks per analysis.All data sources and species, and all tissues and celllines were included. IPA uses a Fischer’s exact test todetermine which pathways and biological functions aresignificantly enriched in the input gene set relative tothe reference set.
Quantitative Real-Time PCREqual amounts of total RNA were reverse transcribedusing Superscript III and random hexamers (Invitrogen,Carlsbad, CA). Resulting cDNA was renormalized usingQuant-iT PicoGreen (Invitrogen) before mixing with 1×Power SYBR Green PCR Master Mix (Applied Biosys-tems, Foster City, CA). Reactions were performed in anApplied Biosystems 7900HT Fast Real-Time PCR Sys-tem. The fold change was calculated as described pre-viously using calnexin as an internal control. Primersequences are listed in Additional file 1 Table S1.
DNA purification and CGH arraysDNA was isolated using Qiagen DNasy Blood and Tis-sue Kit following manufacturer’s instructions. DNAquality was determined on an agarose gel as shown inFigure 1. DNA was prepared for Agilent 180 K CGHmicroarrays using the Roche NimblGen (Madison, WI)enzymatic labeling protocol using random nonamersand hybridized following manufacturer’s protocols at theMicroarray Centre at the Prostate Centre in Vancouver,British Columbia, Canada. Each sample was hybridizedwith Promega (Madison, WI) female reference DNA.The log10 copy number ratios were smoothed using astandard deviation-based outlier detection method andsegmented using Circular Binary Segmentation (CBS)[14] as implemented in the R package DNAcopy(’smooth.region = 10’ for the smoothing method, ‘alpha= 0.05’ for the segmentation, and default parameters forall other arguments). A log10 copy number for eachgene was computed by averaging the smoothed and seg-mented log10 ratios for each probe located in within thegene region. Only genes that contained three or moreprobes were considered.
Cell viability measurementsCells were plated in 96-well plates and, 24 hours later,were treated with the indicated combinations of com-pounds. Viability was measured after 96 hours by WST-1 (Roche). All assays were done in biological triplicate,with technical triplicates done for each biological repeat.
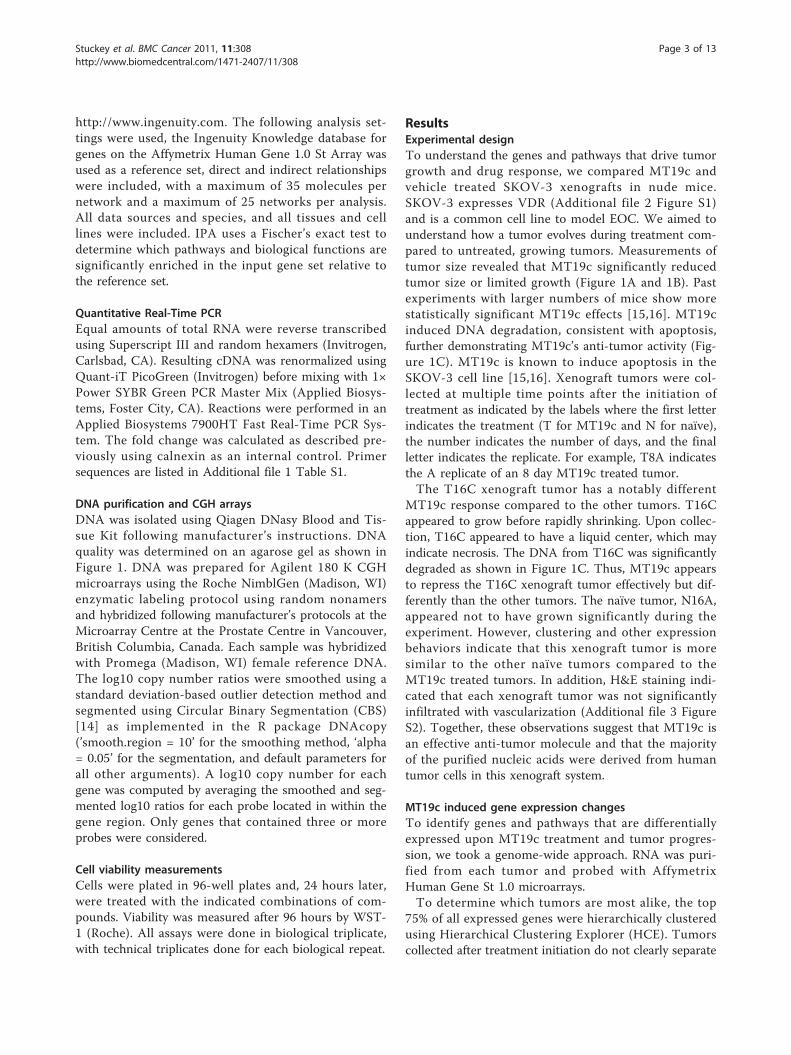
ResultsExperimental designTo understand the genes and pathways that drive tumorgrowth and drug response, we compared MT19c andvehicle treated SKOV-3 xenografts in nude mice.SKOV-3 expresses VDR (Additional file 2 Figure S1)and is a common cell line to model EOC. We aimed tounderstand how a tumor evolves during treatment com-pared to untreated, growing tumors. Measurements oftumor size revealed that MT19c significantly reducedtumor size or limited growth (Figure 1A and 1B). Pastexperiments with larger numbers of mice show morestatistically significant MT19c effects [15,16]. MT19cinduced DNA degradation, consistent with apoptosis,further demonstrating MT19c’s anti-tumor activity (Fig-ure 1C). MT19c is known to induce apoptosis in theSKOV-3 cell line [15,16]. Xenograft tumors were col-lected at multiple time points after the initiation oftreatment as indicated by the labels where the first letterindicates the treatment (T for MT19c and N for naïve),the number indicates the number of days, and the finalletter indicates the replicate. For example, T8A indicatesthe A replicate of an 8 day MT19c treated tumor.The T16C xenograft tumor has a notably different
MT19c response compared to the other tumors. T16Cappeared to grow before rapidly shrinking. Upon collec-tion, T16C appeared to have a liquid center, which mayindicate necrosis. The DNA from T16C was significantlydegraded as shown in Figure 1C. Thus, MT19c appearsto repress the T16C xenograft tumor effectively but dif-ferently than the other tumors. The naïve tumor, N16A,appeared not to have grown significantly during theexperiment. However, clustering and other expressionbehaviors indicate that this xenograft tumor is moresimilar to the other naïve tumors compared to theMT19c treated tumors. In addition, H&E staining indi-cated that each xenograft tumor was not significantlyinfiltrated with vascularization (Additional file 3 FigureS2). Together, these observations suggest that MT19c isan effective anti-tumor molecule and that the majorityof the purified nucleic acids were derived from humantumor cells in this xenograft system.
MT19c induced gene expression changesTo identify genes and pathways that are differentiallyexpressed upon MT19c treatment and tumor progres-sion, we took a genome-wide approach. RNA was puri-fied from each tumor and probed with AffymetrixHuman Gene St 1.0 microarrays.To determine which tumors are most alike, the top
75% of all expressed genes were hierarchically clusteredusing Hierarchical Clustering Explorer (HCE). Tumorscollected after treatment initiation do not clearly separate
Stuckey et al. BMC Cancer 2011, 11:308http://www.biomedcentral.com/1471-2407/11/308
Page 3 of 13
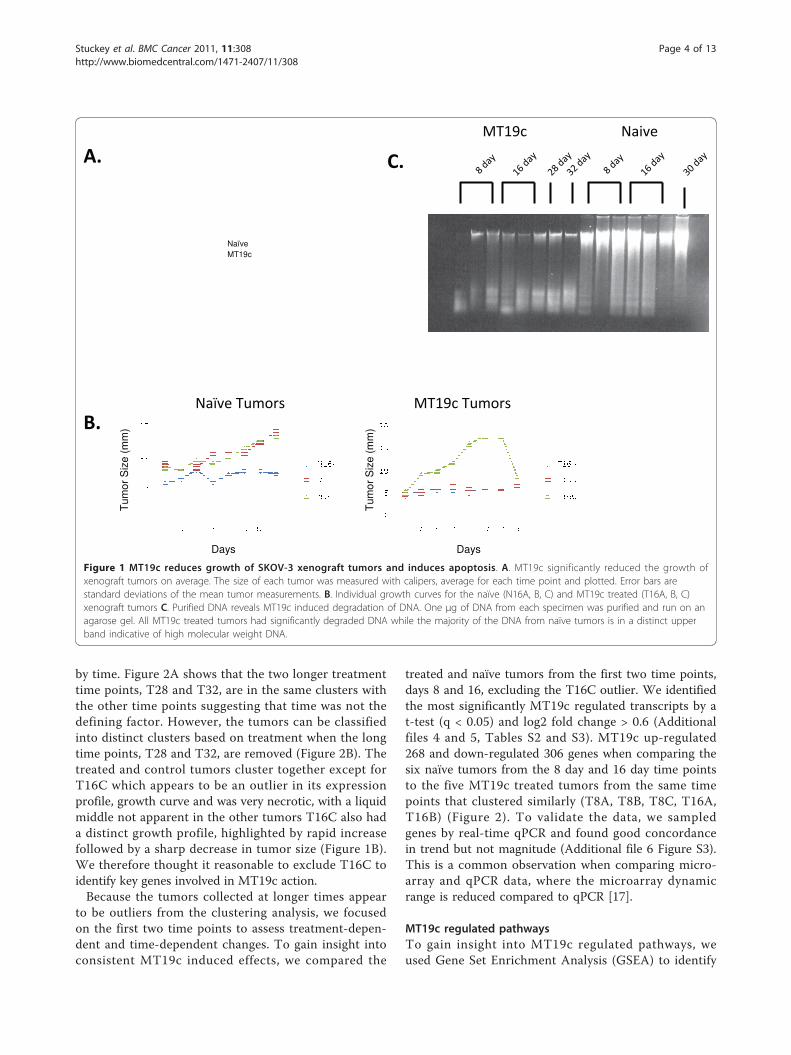
by time. Figure 2A shows that the two longer treatmenttime points, T28 and T32, are in the same clusters withthe other time points suggesting that time was not thedefining factor. However, the tumors can be classifiedinto distinct clusters based on treatment when the longtime points, T28 and T32, are removed (Figure 2B). Thetreated and control tumors cluster together except forT16C which appears to be an outlier in its expressionprofile, growth curve and was very necrotic, with a liquidmiddle not apparent in the other tumors T16C also hada distinct growth profile, highlighted by rapid increasefollowed by a sharp decrease in tumor size (Figure 1B).We therefore thought it reasonable to exclude T16C toidentify key genes involved in MT19c action.Because the tumors collected at longer times appear
to be outliers from the clustering analysis, we focusedon the first two time points to assess treatment-depen-dent and time-dependent changes. To gain insight intoconsistent MT19c induced effects, we compared the
treated and naïve tumors from the first two time points,days 8 and 16, excluding the T16C outlier. We identifiedthe most significantly MT19c regulated transcripts by at-test (q < 0.05) and log2 fold change > 0.6 (Additionalfiles 4 and 5, Tables S2 and S3). MT19c up-regulated268 and down-regulated 306 genes when comparing thesix naïve tumors from the 8 day and 16 day time pointsto the five MT19c treated tumors from the same timepoints that clustered similarly (T8A, T8B, T8C, T16A,T16B) (Figure 2). To validate the data, we sampledgenes by real-time qPCR and found good concordancein trend but not magnitude (Additional file 6 Figure S3).This is a common observation when comparing micro-array and qPCR data, where the microarray dynamicrange is reduced compared to qPCR [17].
MT19c regulated pathwaysTo gain insight into MT19c regulated pathways, weused Gene Set Enrichment Analysis (GSEA) to identify
NaïveMT19c
Days Days
Tum
or S
ize
(mm
)
Tum
or S
ize
(mm
)
Figure 1 MT19c reduces growth of SKOV-3 xenograft tumors and induces apoptosis. A. MT19c significantly reduced the growth ofxenograft tumors on average. The size of each tumor was measured with calipers, average for each time point and plotted. Error bars arestandard deviations of the mean tumor measurements. B. Individual growth curves for the naïve (N16A, B, C) and MT19c treated (T16A, B, C)xenograft tumors C. Purified DNA reveals MT19c induced degradation of DNA. One μg of DNA from each specimen was purified and run on anagarose gel. All MT19c treated tumors had significantly degraded DNA while the majority of the DNA from naïve tumors is in a distinct upperband indicative of high molecular weight DNA.
Stuckey et al. BMC Cancer 2011, 11:308http://www.biomedcentral.com/1471-2407/11/308
Page 4 of 13
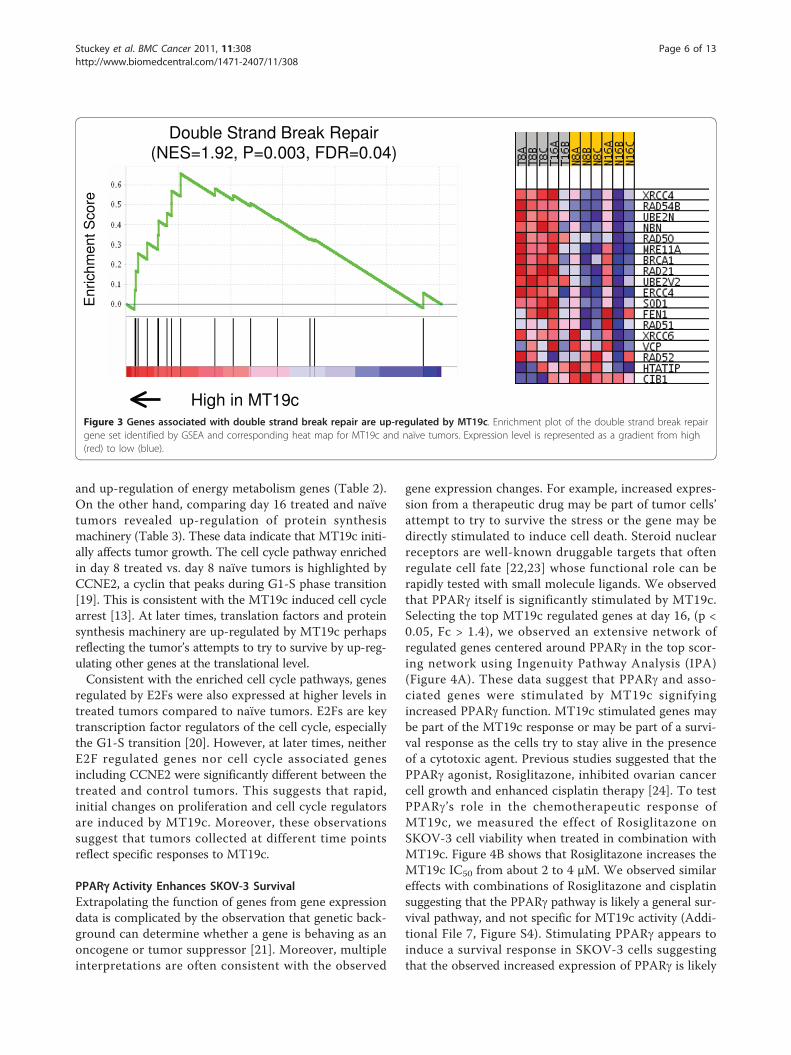
enriched pathways mediated by MT19c and tumor pro-gression over time. GSEA uses all Refseq transcripts onthe microarray data to identify biases in tested pathwaysbetween two conditions [18]. Table 1 summarizes path-ways enriched in treated vs. naïve tumors. Energy meta-bolism genes including transcripts coding for oxidativephosphorylation machinery were down-regulated byMT19c compared to naïve tumors. These metabolicpathways may be higher in the naïve tumors becausethese tumors may have been growing faster and weretherefore more metabolically active. On the other hand,genes involved in double strand break repair, proteinturnover, and apoptosis were enriched in MT19c treatedtumors. The double strand break repair pathway is high-lighted by stimulation of XRCC4, RAD54B and RAD50as show in Figure 3. These protein products are thoughtto directly repair DNA and not just be part of a generalstress response. Stimulation of DNA repair pathwaysmay help tumor cells survive the lethal effects of MT19cor, alternatively, MT19c may be inducing DNA damageto elicit this response. Grouping the MT19c treated andnaïve tumors identified numerous pathways and genesdifferentially regulated.
Specific time dependent changes may be observed byexamining each time point separately as opposed togrouping the treated and naïve tumors. Comparing day8 treated to the day 8 naïve tumors, we observed down-regulation of genes in cell cycle control, DNA replication,
Figure 2 Hierarchical clustering of mRNA expression in each tumor suggests MT19c treatment is the defining feature of the panel ofxenograft tumors. A. All samples were clustered by HCE Hierarchical Clustering Explorer revealing four major groups. Outliers are in black. B.Tumors collected after 16 days were removed from the clustering revealing two distinct classes defined by MT19c treatment.
Table 1 Gene Set Enrichment Analysis reveals MT19Cdown-regulation of energy metabolism and stimulationof DNA repair and apoptosis pathways
Geneset NES P-value FDR GSEA
Kegg (n = 165)
Cell Communication -1.97 0.000 0.029
Biosynthesis of Steroids -1.95 0.002 0.046
Galactose metabolism -1.84 0.005 0.082
Oxidative Phosphorylation -1.69 0.000 0.102
Notch signaling pathway -1.49 0.032 0.232
Ubiquitin mediated Proteolysis 1.98 0.000 0.021
Gene Ontology (n = 1307)
Double Strand Break Repair 1.86 (1.85) 0.000 (0.006) 0.006
Ubiquitin Cycle 2.01 (1.96) 0.000 (0.000) 0.111
NES > 1.4 indicates enriched in MT19C treated tumors compared to naïvetumors for all 8 and 16 day tumors, including T16C.
Stuckey et al. BMC Cancer 2011, 11:308http://www.biomedcentral.com/1471-2407/11/308
Page 5 of 13
and up-regulation of energy metabolism genes (Table 2).On the other hand, comparing day 16 treated and naïvetumors revealed up-regulation of protein synthesismachinery (Table 3). These data indicate that MT19c initi-ally affects tumor growth. The cell cycle pathway enrichedin day 8 treated vs. day 8 naïve tumors is highlighted byCCNE2, a cyclin that peaks during G1-S phase transition[19]. This is consistent with the MT19c induced cell cyclearrest [13]. At later times, translation factors and proteinsynthesis machinery are up-regulated by MT19c perhapsreflecting the tumor’s attempts to try to survive by up-reg-ulating other genes at the translational level.Consistent with the enriched cell cycle pathways, genes
regulated by E2Fs were also expressed at higher levels intreated tumors compared to naïve tumors. E2Fs are keytranscription factor regulators of the cell cycle, especiallythe G1-S transition [20]. However, at later times, neitherE2F regulated genes nor cell cycle associated genesincluding CCNE2 were significantly different between thetreated and control tumors. This suggests that rapid,initial changes on proliferation and cell cycle regulatorsare induced by MT19c. Moreover, these observationssuggest that tumors collected at different time pointsreflect specific responses to MT19c.
PPARg Activity Enhances SKOV-3 SurvivalExtrapolating the function of genes from gene expressiondata is complicated by the observation that genetic back-ground can determine whether a gene is behaving as anoncogene or tumor suppressor [21]. Moreover, multipleinterpretations are often consistent with the observed
gene expression changes. For example, increased expres-sion from a therapeutic drug may be part of tumor cells’attempt to try to survive the stress or the gene may bedirectly stimulated to induce cell death. Steroid nuclearreceptors are well-known druggable targets that oftenregulate cell fate [22,23] whose functional role can berapidly tested with small molecule ligands. We observedthat PPARg itself is significantly stimulated by MT19c.Selecting the top MT19c regulated genes at day 16, (p <0.05, Fc > 1.4), we observed an extensive network ofregulated genes centered around PPARg in the top scor-ing network using Ingenuity Pathway Analysis (IPA)(Figure 4A). These data suggest that PPARg and asso-ciated genes were stimulated by MT19c signifyingincreased PPARg function. MT19c stimulated genes maybe part of the MT19c response or may be part of a survi-val response as the cells try to stay alive in the presenceof a cytotoxic agent. Previous studies suggested that thePPARg agonist, Rosiglitazone, inhibited ovarian cancercell growth and enhanced cisplatin therapy [24]. To testPPARg’s role in the chemotherapeutic response ofMT19c, we measured the effect of Rosiglitazone onSKOV-3 cell viability when treated in combination withMT19c. Figure 4B shows that Rosiglitazone increases theMT19c IC50 from about 2 to 4 μM. We observed similareffects with combinations of Rosiglitazone and cisplatinsuggesting that the PPARg pathway is likely a general sur-vival pathway, and not specific for MT19c activity (Addi-tional File 7, Figure S4). Stimulating PPARg appears toinduce a survival response in SKOV-3 cells suggestingthat the observed increased expression of PPARg is likely
Double Strand Break Repair(NES=1.92, P=0.003, FDR=0.04)
Enr
ichm
ent S
core
High in MT19cFigure 3 Genes associated with double strand break repair are up-regulated by MT19c. Enrichment plot of the double strand break repairgene set identified by GSEA and corresponding heat map for MT19c and naïve tumors. Expression level is represented as a gradient from high(red) to low (blue).
Stuckey et al. BMC Cancer 2011, 11:308http://www.biomedcentral.com/1471-2407/11/308
Page 6 of 13

an attempt for SKOV-3 cells to survive lethal MT19cactivity. We then tested a PPARg antagonist, GW9662,which did not significantly affect cells as a single agent orin combination with MT19c until very high concentra-tions (Additional File 7, Figure S4). This suggests thatinhibiting PPARg activity does not necessarily induce celldeath. Unlike published studies in other cell lines [24],Rosiglitazone does not appear to significantly affectSKOV-3 proliferation. To test how Rosiglitazone maymediate cisplatin efficacy in other cell lines, we testedcombinations of these two molecules in the other NCI60ovarian cancer cell lines (Figure 4B and Additional File 8,Figure S5). Three cell lines (OVCAR-3, OVCAR-5, andOVCAR-8) showed modest, but reproducible, 20%decreases in cell viability after four days of Rosiglitazone
treatment while two others (IGROV-1 and OVCAR-4)showed no significant effects. Thus, SKOV-3 may be aspecial case, where Rosiglitazone inhibits cisplatin activityand stimulates survival. Like many factors, the geneticbackground appears to control whether a gene is actingas an oncogene or tumor suppressor [21,25]. Theseobservations highlight how the same factors may lead toopposite functions to control growth and survival in var-ious subtypes of ovarian cancer.A second IPA identified network, centered on insulin
(Figure 4C), is observed when comparing all the naïveand MT19c treated tumors. These observations may beconsistent with findings suggesting that IRS 1/2 andERK 1/2 pathways are down-regulated by MT19c [13].These expression data along with probing of insulin sig-naling in cell culture, suggest that MT19c is down-regu-lating these pro-growth and survival pathways in SKOV-3 as part of its anti-tumor activity.
MT19c Regulates Genes in Copy Number AberrationsCopy number changes often drive gene expression of keyfactors critical for tumor survival and growth. We
Table 2 Increased expression of cell cycle regulators asduring naïve tumor growth by GSEA
Geneset NES P-value FDR GSEA
Naïve Tumor 8 day vs. 16 day
BioCarta (n = 184)
Cell cycle pathway -2.06 0.000 0.065
Kegg (n = 165)
Ribosome 2.25 0.000 0.000
Cell Cycle -2.34 0.000 0.000
Proteasome -1.72 0.000 0.088
GenMapp (n = 107)
DNA replication reactome -2.13 0.000 0.003
Cholesterol Biosynthesis -1.89 0.012 0.024
TFT (n = 614)
E2F_Q3 -1.84 0.000 0.039
E2F1_Q6 -1.76 0.000 0.027
Gene Ontology (n = 1307)
M phase of mitotic cell cycle -2.15 0.000 0.008
M phase -2.17 0.000 0.007
Mitosis -2.18 0.000 0.008
MT19C 8 day vs. 16 day
GenMapp (n = 107)
DNA Replication Reactome 1.74 0.000 0.056
Ribosomal Proteins -2.44 0.000 0.000
Proteasome -1.76 0.016 0.091
Kegg (n = 165)
Cell Cycle 1.68 0.004
Apoptosis -1.54 0.016 0.164
Transcription Factor Targets (n = 614)
E2F_Q4 1.83 0.000 0.025
E2F1_Q6 1.77 0.000 0.018
NFKB -1.79 0.000 0.021
AP1 -1.78 0.000 0.024
NFKAPPAB -1.52 0.000 0.063
NES > 1.4 indicates higher expression in 8 day naïve tumors compared to 16day. NES < -1.4 indicates higher expression in 16 day naïve tumors comparedto 8 day.
Table 3 Cell cycle regulators are more affected by MT19Cat earlier times while translation regulators andribosomes are affected at later times by GSEA
Geneset NES P-value FDR
Treat8 vs. Naive8
Biocarta (n = 184)
ATRBRCA pathway 1.74 0.000 0.315
MTA3 pathway -1.87 0.000 0.141
GenMapp (n = 107)
DNA Replication 1.84 0.000 0.024
G1 to S Cell Cycle Reactome 1.59 0.006 0.122
Krebs TCA Cycle 1.49 0.033 0.219
Galactose metabolism -1.88 0.000 0.113
Oxidative Phosphorylation -1.68 0.002 0.139
Nuclear Receptors -1.59 0.013 0.227
Kegg (n = 165)
Cell Cycle 1.94 0.000 0.013
Transcription factor targets (n = 614)
E2F1s 1.76-2.05 0.000 0.000-0.008
Bach2 -1.73 0.000 0.037
Treat16 vs. Naive16
Genmapp (n = 107)
Ribosomal proteins 2.41 0.000 0.000
Aminoacyl tRNA biosynthesis 2.05 0.002 0.003
Translation Factors 1.66 0.005 0.203
Comparisons are indicated byTreat8 vs. Naive8 and Treat16 vs. Naive 16. NES> 0 indicates higher expression in MT19C treated tumors and NES < 0indicates higher expression in naïve tumors.
Stuckey et al. BMC Cancer 2011, 11:308http://www.biomedcentral.com/1471-2407/11/308
Page 7 of 13

hypothesized that an antitumor drug such as MT19c mayselect cells that can evade induced cell death, drive fastergrowth, and directly affect gene expression through genedosage effects. We initially observed that GSEA analysissuggested a number of genomic loci were significantlyup- and down-regulated by MT19c (Additional Files 9and 10, Tables S4 and S5). We hypothesized that theseMT19c induced changes could be due to the type oftumor cell selected by MT19c compared to naïve tumors.To test this possibility, we performed CGH analysis bypurifying DNA from each tumor. DNA was competitivelyhybridized to Agilent 180 K microarrays with pooled
female DNA. For the most degraded treated samples, day30 xenograft tumors, the microarray signal was poor andwas not considered further. The Agilent arrays were seg-mented using circular binary segmentation (CBS), afteroutliers greater than four standard deviations from theneighborhood of 20 probes were removed. Each tumorhad similar copy number patterns suggesting the samegenomes were selected to form the xenografts, with onlyrelatively subtle difference such as in 17 p and 7 p (Addi-tional File 11, Figure S5). Perhaps because of the smallnumber of tumors and the observation that 3/8 MT19ctumors retain some copy loss, no significant trend in
μμμμ
Fra
ctio
n V
iab
le C
ells
Vehicle
10 μM Rosi
Figure 4 Rosiglitazone reduces cisplatin and MT19c efficacy in SKOV-3. A. PPARg network enriched in MT19c treated tumors. IngenuityPathway Analysis (IPA) of significantly up and down MT19c (Fold change > 1.4, p < 0.05) regulated genes comparing 16 day treated and naïvetumors identifies a network including PPARg including PPARg itself. Red indicates stimulated by MT19c and green indicates down regulation byMT19c. B. Addition of 10 μM Rosiglitazone increases the number of viable SKOV-3 cells when treated with MT19c (left panel) in a dosedependent manner (right panel). The number of viable cells was determined by a modified MTT assay using Wst-1. The y-axis represents percentof viable cells normalized to DMSO treated cells. Error bars represent standard deviation. * indicates p < 0.05 from a Student’s t-test comparingMT19c treated and Rosiglitazone-MT19c treated cells. 10 μm Rosiglitazone has a range of effects on the NCI-60 panel of six ovarian cancer celllines. Viability effects of Rosiglitazone in with cisplatin. - indicates < 20% decrease in number viable cells, - - indicates > 20% decrease in numberviable cells, + indicates < 20% increase in number viable cells, + + indicates > 20% increase in number viable cells, o indicates no change innumber of viable cells. C. Insulin centered network identified by IPA. Red indicates stimulated by MT19c and green indicates down regulation byMT19c. Ingenuity Pathway Analysis (IPA) of significantly up and down MT19c (Fold change > 1.4, p < 0.05) regulated genes comparing 16 daytreated and naïve tumors identifies a network centered around insulin regulation.
Stuckey et al. BMC Cancer 2011, 11:308http://www.biomedcentral.com/1471-2407/11/308
Page 8 of 13

expression change for these genes between the treatedand naïve tumors is observed.Copy number can be a major determinant of expres-
sion levels for some genes. To determine if gene dosagedrives expression of some genes in these xenografts, wemapped segmented CGH probes to each RefSeq gene,to determine a log score reflecting its copy number sta-tus. This score was calculated by averaging the log10copy number ratios of the probes within each gene andselecting transcripts in the top quartile of all expressedgenes. A global view of SKOV-3 CNAs show a modestnumber CNAs compared to other cell lines (AdditionalFile 11, Figure S5) [26].Because CNAs in tumors are often very large, many
genes may be affected by the change in copy number,complicating determination of the functional importanceof these genes. We reasoned that genes that are function-ally important in CNAs would be differentially affected byan anti-tumor agent. To test if genes in CNAs are differen-tially regulated by MT19c, we created gene sets includingall genes with log ratios > 0.3 in the gene set and expres-sion levels consistent with being regulated by copy num-ber (Additional File 12, Table S6). Using GSEA, theseCNA gene sets revealed that MT19c down-regulatedamplified genes and up-regulated genes in copy lossregions (Figure 5A), consistent with the idea that many ofthese genes are likely important for tumor cell growth andsurvival. qPCR of selected genes suggests the validity ofthis approach (Figure 5B). For example, a number of genesthat may be important for growth and survival are signifi-cantly down-regulated by MT19c despite having high copynumbers, including histones (HIST1H3B, HISTH2AE andHIST1H4L), a key enzyme in fatty acid metabolism (DCI),and cell surface proteins possibly important in cell-cellinteractions (AGRN, GRN). In particular, the chr17 regionincluding PNMT, ERBB2, and nearby genes such as GRN,is amplified and many of the genes are down-regulated byMT19c. This region is amplified in numerous ovarian can-cer cell lines including OVCAR-3, OVCAR-5, OVCAR-8,and CAOV-3 [26] and in a small population of ovariantumors, although targeting Her2 (ERBB2) has not beensuccessful to date in EOC [27,28]. We observe a numberof genes being down-regulated including PNMT, whichcatalyzes a key step in epinephrine synthesis. Epinephrinemay be stimulating tumor growth of ovarian cancer cells,including SKOV-3 [29] and appears to be more sensitiveto MT19c action than other genes in this region. Theseobservations suggest that other genes near the ERBB2locus may also be important for tumor progression andMT19c response.Many of the copy loss regions span large segments ofchromosomes (Additional File 11, Figure S5), signifi-cantly complicating the identification of importantgenes. MT19c up-regulates some genes in copy loss
regions (Figure 5). By reducing the number of genesthat are expressed and change expression, we havereduced the number of candidates to consider forfurther experimentation and importance. The up-regula-tion of these genes when challenged with MT19c, sug-gests that they may be important to inhibit growth.
DiscussionXenograft tumor model systems are powerful tools for theevaluation and development of anti-tumor therapeutics.These models are especially useful for ovarian cancer,where only limited mouse models have been developed[30]. SKOV-3 ovarian cancer cells are one of the morecommonly used cell lines to model ovarian cancer. Weaimed to understand what may drive xenograft tumorgrowth, which likely differs from growth in cell cultureconditions, and what factors may be important for anti-tumor treatment. As a model, we tested the effects ofMT19c, a vitamin D derivative that shows promising pre-clinical properties as demonstrated here and elsewhere[6,15,16]. We used multiple approaches to identify signifi-cantly MT19c regulated genes, pathways and networkswith experimental support suggesting the functionalimportance of the insulin and PPARg networks for MT19cefficacy. In particular, we found that PPARg and PPARg-controlled networks are up-regulated in treated tumorsand stimulation of PPARg with Rosiglitazone inhibited thechemotherapeutic efficacy in SKOV-3 cells. Finally, wepropose an approach integrating copy number and expres-sion data to identify which genes within CNAs are mostlikely to be important for tumor progression and che-motherapy. We propose that genes with high or low copynumber, along with significant gene expression changes inresponse to an anti-tumor agent indicate genes importanttumorigenesis.This approach of linking copy number and drug induced
expression changes may be a viable approach to identifyparticularly important genes for tumor progression.Although the majority of high copy number and highexpression genes were affected by MT19c, many were not.A few high copy number genes such as RPL23 and RPS29were significantly stimulated by MT19c. These high copynumber genes may be up-regulated to help SKOV-3 cellssurvive in response to a lethal compound such as MT19c.But, their up-regulation upon MT19c treatment suggeststhat their high expression and high copy number may beserving a different role than down-regulated genes. Com-bining gene expression and copy number can reduce thenumber of genes to consider for further study. These dataalso suggest that genes regulated by dosage play an impor-tant role in cancer cells’ response to chemotherapy.Together, these data provide insights into general path-ways important for tumor progression and survival as wellas MT19c efficacy.
Stuckey et al. BMC Cancer 2011, 11:308http://www.biomedcentral.com/1471-2407/11/308
Page 9 of 13

Our observations suggest that in some cases the PPARgnetwork is stimulated to help ovarian cancer cells surviveas suggested by Rosiglitazone treatment increasing theIC50s of MT19c and cisplatin. The observations suggestthat stimulation of PPARg by Rosiglitazone increasesSKOV-3 chemotherapy resistance (Figure 4B). Rosiglita-zone has been reported to inhibit growth and enhance cis-platin efficacy in some ovarian cancer cell lines, thoughSKOV-3 was not tested [24]. These findings suggest thatadditional study is warranted to understand the conditionsin which Rosiglitazone may be an effective chemothera-peutic and when it may actually promote survival of ovar-ian cancer cells.
We aimed to understand which gene expression net-works may be important for SKOV-3 xenograft tumorsprogression and MT19c response. We found that signifi-cantly different conclusions may be made depending onhow long the tumor was treated before the specimen wascollected. Because xenograft tumors, much like patienttumors, are continuously evolving during growth, drugresponses may differ at each captured state of the tumorat the time the specimen is collected for analysis. Genesinvolved in the cell cycle, energy metabolism, and DNAreplication machinery are significantly affected by MT19cat the earlier, day 8 time point, while regulation of proteinsynthesis and ribosomes were significantly up-regulated at
Higher in Naive Higher in MT19c
B
Enr
ichm
ent S
core
(E
S)
Enr
ichm
ent S
core
(E
S)
Copy Gain
Copy Loss
A
qPCR Log2 Fc (Mt19c/Vehicle)
Arr
ay L
og2
Fc
(Mt1
9c/V
ehic
le)
Figure 5 Genes in copy number gain or loss regions mediate gene expression and are significantly affected by MT19c treatment. A. GSEAEnrichment plots suggest that amplified genes are significantly down-regulated by MT19c compared to naïve tumors while copy number loss genesare significantly up-regulated by MT19c. Significantly amplified (log ratio > 0.3) or deleted genes (log ratio < -0.3) with concomitant high or lowexpression were selected to define the gene sets. The black lines demonstrate where each gene in the gene set falls within the 15,000 probe setsprobing RefSeq transcripts ordered from left to right based on the expression level in MT19c treated or naïve tumors with gene #1 the most highlyexpressed in MT19c treated tumors. The green line represents the running ES score that becomes more negative as probe sets are identified towardthe bottom of the list. More black lines are observed near the top of the rankings in untreated tumors (right side) than in the treated tumors (left side)for amplified genes while genes in LOH regions are biased towards treated tumors (right side). The genes that are most significantly affected byMT19c may be the most important genes mediating SKOV-3 tumor growth and survival. B. qPCR of selected genes within CNAs validates microarrayobservations. Copy loss genes include PBEF1, STEAP1, and ZNF32. Copy gain genes are PNMT, GRN, PAPLN, and SLC25A6.
Stuckey et al. BMC Cancer 2011, 11:308http://www.biomedcentral.com/1471-2407/11/308
Page 10 of 13

the later day 16 time point. No significant enrichment ofcell cycle and DNA replication machinery was observedafter 16 days of MT19c treatment. These pathways areoften observed to be affected in tumors as control of meta-bolism and the cell cycle are often critical for tumorgrowth and survival. From gene expression data, it is diffi-cult to conclude whether the effects are direct or indirect.These data identify candidate genes to test for their impor-tance in mediating chemosensitivity in ovarian cancer cellsas well as possible specific factors related to MT19c thatcan be discriminated with further study.A significant contribution to these differences appears
to originate from changes in the tumor as it progresses.This is highlighted when comparing the naïve tumors atthe day 8 and 16 time points. When comparing the day8 and 16 naïve tumors, cell cycle and DNA replicationmachinery is expressed higher at later times. We thenobserved that MT19c down-regulates the cell cycle atearly times and yet not at later times when many ofthese genes are expressed at higher levels. Many ofthese genes are controlled by E2F. These observationssuggest that control of the cell cycle depends on whenthe tumor is collected. In patients, the exact place intumor progression/growth is always different and thusthis alone can explain expression differences, as opposedto the inherent character of genomic differences of thetumor. Among many other factors, these expressionchanges during tumor growth may be inherent totumors and could be a source of heterogeneity inpatient samples. In probing xenograft tumors, theseobservations highlight the importance of examiningchanges at multiple time points, and not just at an arbi-trarily defined endpoint.Integrating copy number and expression measurements
has proven valuable to gain insight into tumor networksand regulation [31]. However, determining which genesare drivers of tumorigenesis and which may be passengersremains a challenging problem, typically requiring exten-sive experiments to test the function of identified factors[32]. Copy number can be a mechanism driving geneexpression levels. Typically this is assessed by correlatingthe measured expression and copy number values. Here,we propose an extension of the copy number and expres-sion comparison, in which we identify important genes inCNAs by examining changes driven by an anti-tumortherapy such as MT19c. Alternatively, these expressionchanges could also indicate chromatin deregulation ofthese genes, suggesting that the observed differential regu-lation is simply a result of chance. The many loci differen-tially regulated by MT19c suggest extensive changes inepigenetic control by MT19c. We believe the simplestexplanation is that the MT19c induced down-regulationstrongly suggests that at least some of these amplifiedgenes are important for growth.
Together, these observations suggest that some of theamplified genes are important for tumorigenesis consis-tent with the hypothesis that amplified genes are selectedfor tumor growth and survival. Similarly, genes at lowergene dosage are stimulated by MT19c to induce celldeath or at least limit growth. These observations suggestthat a significant fraction of these CNA genes are impor-tant for tumor growth and survival. We speculate thatthese loci are being deregulated epigenetically by chro-matin changes to overcome the gene dosage determinedby the DNA copy number at the time points tested.Thus, the combination of DNA copy number and themRNA expression behavior in response to MT19c sug-gest that these genes may be among the most importantfor SKOV-3 xenograft progression.MT19c has strong anti-tumor effects in multiple ovar-
ian cancer cell lines including SKOV-3; however, themechanism of MT19c action remains unclear. Weobserved many factors and pathways affected by MT19c,including some related to tumor growth and survival,such as DNA damage response, apopotic genes, insulin,and PPARg. Similar to PPARg, it is likely that many ofthese factors are general survival and pathway factors forSKOV-3 cells. Identifying specific mechanisms fromexpression data based on small molecule perturbationsremains challenging, and requires significant additionalfunctional studies. These data highlight how MT19caffects specific pathways, such as PPARg and insulin sig-naling, that can be tested in additional cell lines and invivo models to determine their importance. These studiescould lead to the development of biomarkers to helpdetermine which features effect MT19c efficacy in pre-clinical and clinical models.Combining copy number and changes in gene expres-
sion approach in multiple cell lines may prove useful toidentify particularly important genes in mediating survi-val and drug responses in ovarian cancer. The majorcopy number changes in the SKOV3 xenografts areobserved in the SKOV-3 cell line as reported [26]including the amplifications on chromosomes 3 and 17and LOH on chromosome 1.
ConclusionsIn summary, these data characterize SKOV-3 ovarianxenograft tumors and identify candidate factors importantfor tumor progression and response to chemotherapy. Wehave characterized the time dependent expression changesof SKOV-3 xenograft tumors in response to a novel che-motherapeutic. We also identify a possible role for PPARgand Rosiglitazone stimulation in mediating chemotherapyin some ovarian cancer cells. Further study examining thewidely varying functions of PPARg in different genetic andepigenetic backgrounds is warranted. Finally, we propose anew integrated genomics approach that combines copy
Stuckey et al. BMC Cancer 2011, 11:308http://www.biomedcentral.com/1471-2407/11/308
Page 11 of 13

number and expression data to identify candidate tumordrivers. We find a general bias for down-regulation ofamplified genes by the cytotoxic agent, MT19c, high-lighted by strong down-regulation of genes, such asPNMT, in the same amplicon as the ERBB2 locus. Theseobservations suggest that at least some genes regulated bydosage are critical for chemotherapy responses. Together,these data suggest that integrated genomics can provideimportant insights into the behavior of xenograft tumorsystems, which are commonly used to evaluate tumor pro-gression and drug efficacy.
Additional material
Additional file 1: Table S1. List of primers used for real-time qPCR
Additional file 2: Figure S1. VDR is expressed in SKOV-3. Immunoblotshowing VDR is expressed in SKOV-3 and VDR levels do not change inresponse to MT19c.
Additional file 3: Figure S2. Immunohistochemistry suggests tumorsare majority tumor cells with little invasion. A. H&E staining of naïvetumor. B. CA-125 staining of a representative naïve tumor. C. CA-125staining of a MT19C treated tumor.
Additional file 4: Table S2. List of genes down-regulated by MT19c.
Additional file 5: Table S3. List of genes up-regulated by MT19c.
Additional file 6: Figure S3. qPCR and microarray data correlate.Pooling samples from the 16 day MT19C treated and naïve tumorsindicates that qPCR and microarray data agree on the direction of thefold change upon MT19C treatment. Error bars are standard deviation.Panels A, B, and C indicate fold range relative to calnexin and tumorN8A. Panel D calculates the fold change of the array and qPCR data forthe three genes indicated. ABCA1 and PPARg were considered significantin the microarray data.
Additional file 7: Figure S4. PPARg signaling mediates chemosensitivity.A. Rosiglitazone also inhibits cisplatin in SKOV-3. Increasing concentrationof Rosiglitazone show a dose dependent increase in the number of cellswith cisplatin similar to the dose dependent effects observed withMT19c. B. The PPAR g antagonist, GW9662, shows no significant effect onMT19c efficacy in a dose response curve.
Additional file 8: Figure S5. Dose response curves of cisplatin(CDDP) inthe presence of Rosiglitazone (Rosi) in the six NCI-60 ovarian cancer celllines. The number of viable cells was determined by Wst-1 after fourdays. Rosi inhibits CDDP in some lines (SKOV-3) while in others (OVCAR-3and OVAR-5) Rosi supports CDDP induced cell death.
Additional file 9: Table S4. GSEA data of chromosome loci enriched inMT19c treated tumors.
Additional file 10: Table S5. GSEA data of chromosome loci enriched innaive tumors
Additional file 11: Figure S6. Global copy number views of SKOV3xenografts. Heat maps of all > 2 fold copy number changes from Agilent180 K CGH microarrays compared to pooled normal female DNA. Noticethe amplification on chromosome 17 which includes ERBB2. Thegenome has relatively few aberrations compared to other ovarian cancercell lines and many ovarian tumors. Red indicates a copy number gainand blue indicates a copy number loss.
Additional file 12: Table S6. List of genes used to define the copynumber aberration gene set.
List of Abbreviations usedThe abbreviations used are: EOC: epithelial ovarian cancer; PPARg:peroxisome proliferator-activated receptorγ; VDR: vitamin D receptor; CNA:
copy number alteration; H&E: hematoxylin and eosin; CCNE2: cyclin E2; CGH:Comparative Genomic Hybridization.
AcknowledgementsWe thank Christoph Schorl and the Brown University Center for Genomicsand Proteomics supported by NIH grant P20RR015578 for processingAffymetrix microarrays. We thank the Microarray Facility at the ProstateCentre at Vancouver General Hospital, Vancouver, BC, Canada for the AgilentCGH array processing. This work was supported in part by a NHGRI K22Genome Scholar Award (A.S.B), 7K22 HG002488, (A.S.B.), a Medical EllisonFoundation award (A.S.B.), and a seed award from the Brown UniversityOffice of the Vice President for Research (A.S.B. and L.B).
Author details1Molecular Therapeutics Laboratory, Program in Women’s Oncology,Department of Obstetrics and Gynecology, Women and Infants7 Hospital,Alpert Medical School of Brown University, Providence, RI 02905, USA.2Department of Molecular Biology, Cell Biology, and Biochemistry, BrownUniversity, Providence, RI 02903, USA. 3Department of Computer Science &Center for Computational Molecular Biology, Brown University, Providence, RI02912, USA. 4Department of Obstetrics and Gynecology, Division ofGynecologic Oncology, Southern Illinois University School of Medicine,Springfield, IL 62794-9640, USA.
Authors’ contributionsConception and design: LB and ASB, Animal studies: AS and KKK, MT19csynthesis and verification of efficacy: RS, Nucleic acid isolation and in vitrostudies: AS and DHM, Data analysis and interpretation: ASB, LB, SH, AR, andBJR, Manuscript writing: ASB and LB, Final approval of manuscript: AS, AF,DHM, SH, KKK, AR, RKS, BJR, LB, ASB.
Competing interestsThe authors declare that they have no competing interests.
Received: 10 September 2010 Accepted: 22 July 2011Published: 22 July 2011
References1. Jemal A, Siegel R, Ward E, Hao Y, Xu J, Murray T, Thun MJ: Cancer statistics,
2008. CA Cancer J Clin 2008, 58(2):71-96.2. Kikkawa F, Nawa A, Ino K, Shibata K, Kajiyama H, Nomura S: Advances in
treatment of epithelial ovarian cancer. Nagoya J Med Sci 2006, 68(1-2):19-26.3. Deeb KK, Trump DL, Johnson CS: Vitamin D signalling pathways in
cancer: potential for anticancer therapeutics. Nat Rev Cancer 2007,7(9):684-700.
4. Lange TS, Stuckey AR, Robison K, Kim KK, Singh RK, Raker CA, Brard L: Effectof a Vitamin D(3) derivative (B3CD) with postulated anti-cancer activityin an ovarian cancer animal model. Invest New Drugs 2009, 28(5):543-553.
5. Lange TS, Zou Y, Singh RK, Kim KK, Kristjansdottir K, Sholler GL, Brard L:Chemotherapeutic Effect of Calcidiol Derivative B3CD in aNeuroblastoma Xenograft Model. Chem Biol Drug Des 2010, 76(2):164-173.
6. Shackleton M, Quintana E, Fearon ER, Morrison SJ: Heterogeneity in cancer:cancer stem cells versus clonal evolution. Cell 2009, 138(5):822-829.
7. Oliver TG, Mercer KL, Sayles LC, Burke JR, Mendus D, Lovejoy KS, Cheng MH,Subramanian A, Mu D, Powers S, et al: Chronic cisplatin treatmentpromotes enhanced damage repair and tumor progression in a mousemodel of lung cancer. Genes Dev 2010, 24(8):837-852.
8. Gorringe KL, Campbell IG: Large-scale genomic analysis of ovariancarcinomas. Mol Oncol 2009, 3(2):157-164.
9. Beroukhim R, Mermel CH, Porter D, Wei G, Raychaudhuri S, Donovan J,Barretina J, Boehm JS, Dobson J, Urashima M, et al: The landscape ofsomatic copy-number alteration across human cancers. Nature 2010,463(7283):899-905.
10. Bignell GR, Greenman CD, Davies H, Butler AP, Edkins S, Andrews JM,Buck G, Chen L, Beare D, Latimer C, et al: Signatures of mutation andselection in the cancer genome. Nature 2010, 463(7283):893-898.
11. Pollack JR, Sorlie T, Perou CM, Rees CA, Jeffrey SS, Lonning PE, Tibshirani R,Botstein D, Borresen-Dale AL, Brown PO: Microarray analysis reveals amajor direct role of DNA copy number alteration in the transcriptionalprogram of human breast tumors. Proc Natl Acad Sci USA 2002,99(20):12963-12968.
Stuckey et al. BMC Cancer 2011, 11:308http://www.biomedcentral.com/1471-2407/11/308
Page 12 of 13

12. Andrews J, Kennette W, Pilon J, Hodgson A, Tuck AB, Chambers AF,Rodenhiser DI: Multi-platform whole-genome microarray analyses refinethe epigenetic signature of breast cancer metastasis with geneexpression and copy number. PLoS One 2010, 5(1):e8665.
13. Brard L, Lange TS, Robinson K, Kim KK, Brodsky AS, Uzun A, Padbury J,Moore R, Singh RK: Discovery of the first Ergocalciferol derived vitamin Dreceptor independent true non-hypercalcemic anti-cancer agent(MT19c). submitted 2010.
14. Venkatraman ES, Olshen AB: A faster circular binary segmentationalgorithm for the analysis of array CGH data. Bioinformatics 2007,23(6):657-663.
15. Brard L, Robison K, Singh R, Kim K, Lange : A Novel Non-HypercalcemicVitamin D Derivative in the Treatment of Ovarian Cancer. BuildingInterdisciplinary Research Careers in Women’s Health (BIRCWH): 2007 2007,1095-1107.
16. Robison K, Kim K, Singh R, Lange T, Granai C, Brard L: The use of a vitaminD derivative in a mouse xenograft ovarian cancer model. GOG: 20082008, S68.
17. Bronson MW, Hillenmeyer S, Park RW, Brodsky AS: Estrogen coordinatestranslation and transcription, revealing a role for NRSF in human breastcancer cells. Mol Endocrinol 2010, 24(6):1120-1135.
18. Subramanian A, Tamayo P, Mootha VK, Mukherjee S, Ebert BL, Gillette MA,Paulovich A, Pomeroy SL, Golub TR, Lander ES, et al: Gene set enrichmentanalysis: a knowledge-based approach for interpreting genome-wideexpression profiles. Proc Natl Acad Sci USA 2005, 102(43):15545-15550.
19. Payton M, Coats S: Cyclin E2, the cycle continues. Int J Biochem Cell Biol2002, 34(4):315-320.
20. Chen HZ, Tsai SY, Leone G: Emerging roles of E2Fs in cancer: an exit fromcell cycle control. Nat Rev Cancer 2009, 9(11):785-797.
21. Majumder S: REST in good times and bad: roles in tumor suppressor andoncogenic activities. Cell Cycle 2006, 5(17):1929-1935.
22. Mishra P, Gulbake A, Jain A, Khare P, Soni V, Vyas SP, Jain SK: Steroidreceptors as molecular targets for cancer diagnosis and therapy. Crit RevTher Drug Carrier Syst 2009, 26(3):207-273.
23. Wiench M, Hager GL: Expanding horizons for nuclear receptors. EMBO Rep2010, 11(8):569-571.
24. Girnun GD, Naseri E, Vafai SB, Qu L, Szwaya JD, Bronson R, Alberta JA,Spiegelman BM: Synergy between PPARgamma ligands and platinum-based drugs in cancer. Cancer Cell 2007, 11(5):395-406.
25. Manfredi JJ: The Mdm2-p53 relationship evolves: Mdm2 swings bothways as an oncogene and a tumor suppressor. Genes Dev 2010,24(15):1580-1589.
26. The data was obtained from the Wellcome Trust Sanger Institute CancerGenome Project web site. [http://www.sanger.ac.uk/genetics/CGP].
27. Gordon AN, Finkler N, Edwards RP, Garcia AA, Crozier M, Irwin DH, Barrett E:Efficacy and safety of erlotinib HCl, an epidermal growth factor receptor(HER1/EGFR) tyrosine kinase inhibitor, in patients with advanced ovariancarcinoma: results from a phase II multicenter study. Int J Gynecol Cancer2005, 15(5):785-792.
28. Secord AA, Blessing JA, Armstrong DK, Rodgers WH, Miner Z, Barnes MN,Lewandowski G, Mannel RS: Phase II trial of cetuximab and carboplatin inrelapsed platinum-sensitive ovarian cancer and evaluation of epidermalgrowth factor receptor expression: a Gynecologic Oncology Groupstudy. Gynecol Oncol 2008, 108(3):493-499.
29. Sood AK, Armaiz-Pena GN, Halder J, Nick AM, Stone RL, Hu W, Carroll AR,Spannuth WA, Deavers MT, Allen JK, et al: Adrenergic modulation of focaladhesion kinase protects human ovarian cancer cells from anoikis. J ClinInvest 2010, 120(5):1515-1523.
30. Garson K, Shaw TJ, Clark KV, Yao DS, Vanderhyden BC: Models of ovariancancer–are we there yet? Mol Cell Endocrinol 2005, 239(1-2):15-26.
31. Bussey KJ, Chin K, Lababidi S, Reimers M, Reinhold WC, Kuo WL, Gwadry F,Ajay , Kouros-Mehr H, Fridlyand J, et al: Integrating data on DNA copynumber with gene expression levels and drug sensitivities in the NCI-60cell line panel. Mol Cancer Ther 2006, 5(4):853-867.
32. Chin L, Gray JW: Translating insights from the cancer genome intoclinical practice. Nature 2008, 452(7187):553-563.
Pre-publication historyThe pre-publication history for this paper can be accessed here:http://www.biomedcentral.com/1471-2407/11/308/prepub
doi:10.1186/1471-2407-11-308Cite this article as: Stuckey et al.: Integrated genomics of ovarianxenograft tumor progression and chemotherapy response. BMC Cancer2011 11:308.
Submit your next manuscript to BioMed Centraland take full advantage of:
• Convenient online submission
• Thorough peer review
• No space constraints or color figure charges
• Immediate publication on acceptance
• Inclusion in PubMed, CAS, Scopus and Google Scholar
• Research which is freely available for redistribution
Submit your manuscript at www.biomedcentral.com/submit
Stuckey et al. BMC Cancer 2011, 11:308http://www.biomedcentral.com/1471-2407/11/308
Page 13 of 13


![CottonFGD: an integrated functional genomics database for ......variation data. Thus, an integrated functional genomics database similar to the IC4R rice database [13] is neces-sary](https://static.fdocuments.in/doc/165x107/60a036ef7365e062b04fe515/cottonfgd-an-integrated-functional-genomics-database-for-variation-data.jpg)