RESEARCH ARTICLE Open Access Genome-wide SNP analyses ...
13
RESEARCH ARTICLE Open Access Genome-wide SNP analyses reveal high gene flow and signatures of local adaptation among the scalloped spiny lobster (Panulirus homarus) along the Omani coastline Rufaida Dhuhai Al-Breiki 1,2 , Shannon R. Kjeldsen 3 , Hasifa Afzal 1 , Manal Saif Al Hinai 1 , Kyall R. Zenger 3 , Dean R. Jerry 3 , Mohammed Ali Al-Abri 4 and Madjid Delghandi 1* Abstract Background: The scalloped spiny lobster (Panulirus homarus) is a popular seafood commodity worldwide and an important export item from Oman. Annual catches in commercial fisheries are in serious decline, which has resulted in calls for the development of an integrated stock management approach. In Oman, the scalloped spiny lobster is currently treated as a single management unit (MU) or stock and there is an absence of information on the genetic population structure of the species that can inform management decisions, particularly at a fine-scale level. This work is the first to identify genome-wide single nucleotide polymorphisms (SNPs) for P. homarus using Diversity Arrays Technology sequencing (DArT-seq) and to elucidate any stock structure in the species. Results: After stringent filtering, 7988 high utility SNPs were discovered and used to assess the genetic diversity, connectivity and structure of P. homarus populations from Al Ashkharah, Masirah Island, Duqm, Ras Madrakah, Haitam, Ashuwaymiyah, Mirbat and Dhalkut landing sites. Pairwise F ST estimates revealed low differentiation among populations (pairwise F ST range = − 0.0008 - 0.0021). Analysis of genetic variation using putatively directional F ST outliers (504 SNPs) revealed higher and significant pairwise differentiation (p < 0.01) for all locations, with Ashuwaymiyah being the most diverged population (Ashuwaymiyah pairwise F ST range = 0.0288–0.0736). Analysis of population structure using Discriminant Analysis of Principal Components (DAPC) revealed a broad admixture among P. homarus, however, Ashuwaymiyah stock appeared to be potentially under local adaptive pressures. Fine scale analysis using Netview R provided further support for the general admixture of P. homarus. Conclusions: Findings here suggested that stocks of P. homarus along the Omani coastline are admixed. Yet, fishery managers need to treat the lobster stock from Ashuwaymiyah with caution as it might be subject to local adaptive pressures. We emphasize further study with larger number of samples to confirm the genetic status of the Ashuwaymiyah stock. The approach utilised in this study has high transferability in conservation and management of other marine stocks with similar biological and ecological attributes. Keywords: Scalloped spiny lobster, Population genetic structure, Management unit, SNP, F ST outliers * Correspondence: [email protected] 1 Centre of Excellence in Marine Biotechnology, Sultan Qaboos University, P.O. Box 50, Al-Khoud, 123 Muscat, Sultanate of Oman Full list of author information is available at the end of the article © The Author(s). 2018 Open Access This article is distributed under the terms of the Creative Commons Attribution 4.0 International License (http://creativecommons.org/licenses/by/4.0/), which permits unrestricted use, distribution, and reproduction in any medium, provided you give appropriate credit to the original author(s) and the source, provide a link to the Creative Commons license, and indicate if changes were made. The Creative Commons Public Domain Dedication waiver (http://creativecommons.org/publicdomain/zero/1.0/) applies to the data made available in this article, unless otherwise stated. Al-Breiki et al. BMC Genomics (2018) 19:690 https://doi.org/10.1186/s12864-018-5044-8
Transcript of RESEARCH ARTICLE Open Access Genome-wide SNP analyses ...

RESEARCH ARTICLE Open Access
Genome-wide SNP analyses reveal highgene flow and signatures of localadaptation among the scalloped spinylobster (Panulirus homarus) along theOmani coastlineRufaida Dhuhai Al-Breiki1,2, Shannon R. Kjeldsen3, Hasifa Afzal1, Manal Saif Al Hinai1, Kyall R. Zenger3, Dean R. Jerry3,Mohammed Ali Al-Abri4 and Madjid Delghandi1*
Abstract
Background: The scalloped spiny lobster (Panulirus homarus) is a popular seafood commodity worldwide and animportant export item from Oman. Annual catches in commercial fisheries are in serious decline, which has resultedin calls for the development of an integrated stock management approach. In Oman, the scalloped spiny lobster iscurrently treated as a single management unit (MU) or stock and there is an absence of information on the geneticpopulation structure of the species that can inform management decisions, particularly at a fine-scale level. Thiswork is the first to identify genome-wide single nucleotide polymorphisms (SNPs) for P. homarus using DiversityArrays Technology sequencing (DArT-seq) and to elucidate any stock structure in the species.
Results: After stringent filtering, 7988 high utility SNPs were discovered and used to assess the genetic diversity,connectivity and structure of P. homarus populations from Al Ashkharah, Masirah Island, Duqm, Ras Madrakah, Haitam,Ashuwaymiyah, Mirbat and Dhalkut landing sites. Pairwise FST estimates revealed low differentiation among populations(pairwise FST range = − 0.0008 - 0.0021). Analysis of genetic variation using putatively directional FST outliers (504 SNPs)revealed higher and significant pairwise differentiation (p < 0.01) for all locations, with Ashuwaymiyah being the mostdiverged population (Ashuwaymiyah pairwise FST range = 0.0288–0.0736). Analysis of population structureusing Discriminant Analysis of Principal Components (DAPC) revealed a broad admixture among P. homarus, however,Ashuwaymiyah stock appeared to be potentially under local adaptive pressures. Fine scale analysis using Netview Rprovided further support for the general admixture of P. homarus.
Conclusions: Findings here suggested that stocks of P. homarus along the Omani coastline are admixed. Yet, fisherymanagers need to treat the lobster stock from Ashuwaymiyah with caution as it might be subject to local adaptivepressures. We emphasize further study with larger number of samples to confirm the genetic status of the Ashuwaymiyahstock. The approach utilised in this study has high transferability in conservation and management of other marine stockswith similar biological and ecological attributes.
Keywords: Scalloped spiny lobster, Population genetic structure, Management unit, SNP, FST outliers
* Correspondence: [email protected] of Excellence in Marine Biotechnology, Sultan Qaboos University,P.O. Box 50, Al-Khoud, 123 Muscat, Sultanate of OmanFull list of author information is available at the end of the article
© The Author(s). 2018 Open Access This article is distributed under the terms of the Creative Commons Attribution 4.0International License (http://creativecommons.org/licenses/by/4.0/), which permits unrestricted use, distribution, andreproduction in any medium, provided you give appropriate credit to the original author(s) and the source, provide a link tothe Creative Commons license, and indicate if changes were made. The Creative Commons Public Domain Dedication waiver(http://creativecommons.org/publicdomain/zero/1.0/) applies to the data made available in this article, unless otherwise stated.
Al-Breiki et al. BMC Genomics (2018) 19:690 https://doi.org/10.1186/s12864-018-5044-8

BackgroundSevere decline of many commercial fish stocks highlightsthe emerging need for sustainable management plans forregulation and conservation of marine biodiversity. Man-aging marine stocks sustainably is a dynamic process andrequires an in-depth understanding of the stock and itsspatial boundaries, along with biological, ecological, evolu-tionary, economic, social or even political factors thatinfluence the fishery [1, 2]. While traditional fishery man-agement plans rely on morphological and demographicaspects of a population such as growth, size, and mortalityrates [3, 4], appropriate management should also considerevolutionary criteria, including conservation of genetic di-versity and maintenance of sustainable spawning stockbiomass [2]. Recent studies have shown the complexity inthe population genetic structure of many marine species[5–7]. Generally, marine organisms possess high geneticdiversity and show weak population differentiation due tohighly dispersive larval stages and relative absence of bar-riers to dispersal in the marine environment [8–10]. How-ever, seascape factors (e.g. water currents, seafloor featuresand bathymetry) and environmental attributes can signifi-cantly influence rates of gene flow, connectivity and gen-etic structure in some species. Further, evolutionaryprocesses like genetic drift and selection [11–13] continu-ously shape the genomes of marine organisms. For thesereasons, defining the population structure of such organ-isms is challenging, but important for their conservationand management [14–16]. Current progress in the fieldsof genomics and computational biology doubtlessly offersa versatile platform for fishery managers to answer ques-tions and issues related to population structure, stockboundaries and the level of divergence of marine organ-isms [1, 16, 17]. Recent reports support the successful ap-plication of genomic approaches to identify conservationor management units (MUs) of marine species [8, 18, 19].Many of these utilise advanced genomic approaches, usinghigh-throughput genotyping technologies i.e. Next gener-ation sequencing (e.g. Illumina HiSeq and MiSeq plat-forms) and third generation sequencing (e.g. PacBio andNanopore technology), to isolate large number of geneticmarkers suitable for inference of population differentiationand structure [20–23]. These technologies have enabledthe development of panels of SNP markers to investigateinterspecific hybrids [24, 25], to assign individuals to pop-ulations, or to identify MUs [8, 11, 26]. Harnessing of gen-omic wide SNPs in the assessment of commercial marinestocks is a successful approach that could address manyquestions related to the level of genetic diversity and sta-bility of these stocks [27].The scalloped spiny lobster P. homarus (Linnaeus
1758) is characterised by a relatively long pelagic larvalduration (PLD) of about 4.5–6.5 months [28], duringwhich the larvae is exposed to oceanic dispersal as a
result of currents and wind-shear, before metamorphos-ing into the puerulus stage and continuing its life as abenthic organism [28, 29]. The species is distributedthroughout the Indo-Pacific [30] and in the region sup-ports valuable fisheries of considerable socio-economicimportance. There are major concerns about the futureof spiny lobster fisheries owing to a general decline incatch [31, 32], emphasizing the need for serious effortstowards sustainable fishery management and regulationof the species. It is essential to introduce comprehensivefishery management guidelines for the species, consider-ing a wide range of biological aspects e.g. demographicinteractions of individuals and genetic structuring. Char-acterisation of stock boundaries and identification ofpopulation divergence will greatly support managers indeciding whether two populations should be managedtogether, or as separate stocks [27, 33]. Many recentworks of P. homarus have studied sub-species resolution,phylogeography throughout its wide range [34–37] ordispersal capabilities [38]. However, the fine-scale gen-etic structure of the species in many regions is still re-mains unrevealed [38].Commercial spiny lobster fisheries have a long trad-
ition in Oman, with the country currently being one ofthe major suppliers to the global market [39]. Of con-cern, however, is the observation that the annual harvestof Omani lobsters has declined dramatically from 2000tons/year in the 1980’s, to less than 485 tons in 2016[40]. Presently, the lobster fishery management in Omanis primarily based on data from growth, mortality andcatch rates and aims to increase population densities[39, 41]. Despite regulations implemented by the govern-ment, they are not regularly reinforced (i.e. high inci-dence of illegal catch) and no clear legislation systemagainst illegal practices [42]. There is a lack of know-ledge surrounding the population genetic structure of P.homarus in Oman, its levels of genetic fitness and re-latedness in this region. Hence, the lobster stock alongthe Omani coastline is currently treated as one singlemanagement unit. This study is the first to assess thegenetic structure of P. homarus in Oman using highresolution genome-wide SNPs genotyping. The findingsprovide valuable insight into the connectivity of theOmani P. homarus population and will aid in the identi-fication of management units for the fishery of this com-mercially important crustacean.
ResultsSNPs quality control and filteringA primary dataset of 48,140 SNPs was filtered to retain7988 SNPs (Additional file 1) suitable for genomic ana-lysis (Table 1). Significant deviations from Hardy Wein-berg Equilibrium (HWE) were observed across allpopulations (p < 0.000004 after Bonferroni correction).
Al-Breiki et al. BMC Genomics (2018) 19:690 Page 2 of 13

After the removal of these SNP loci deviating from HWE,significant skew in estimation of genetic diversity indices(Fis and Ho) was observed. Thus, indicating the status ofthose SNPs as putative null alleles or genotypic artifacts.Additionally, nine individuals were excluded from thedataset due to poor genotyping coverage < 80%.
Population genetic diversityObserved heterozygosity (Ho) across populations rangedfrom 0.1660 to 0.1840 and were generally lower than theexpected heterozygosity values (Hn.b) (0.2260–0.2333,Table 2). Average individual multilocus heterozygosity(Av.MLH) revealed similar values and distribution to Ho,
ranging from 0.1683 to 0.1858 (for Ashuwaymiyah andHaitam, respectively) (Table 2). Average standardizedMLH (sMLH) values slightly varied across populations
and ranged from 0.9302 to 1.029. Inbreeding coefficient(Fis) was significantly high across all populations,(0.2094–0.2861, Table 2). The estimated parameters ofidentity disequilibrium (g2) slightly differentiated fromzero (0.0003–0.0038). However, this differentiation wasstatistically significant (i.e. 95% C. I. does not overlapzero) in two locations (Haitam and Dhalkut, Table 2).Estimated effective population size (NeLD) varied from5507.5 for Haitam and 10,305.8 for Al Ashkharah to aninfinite value for other populations.
Population differentiation and genetic structureIn general, pairwise genetic differentiation estimates (FST)using 7988 SNPs indicated very low levels of genetic dif-ferentiation, with average FST = 0.0004 (±SD = 0.1843), withonly seven out of 28 pairwise comparisons being statisti-cally significant (Table 3). AMOVA indicated an absence ofhierarchical genetic structure between populations (vari-ation of 80.47% within individuals; 19.51% among individ-uals; 0.01% among populations and 0% among groups (AS,MA; group1; DU, RM, group2; HA, SH, group3; MI, DA;group4)). While visualization of population structure usingDAPC with all 7988 SNPs revealed two admixed geneticclusters (Additional file 2), population Network analysiswith Netview R displayed only one genetic cluster(Fig. 1a, b). Similarly, high admixture was observedthrough the NJ tree, indicating high genetic relatednessamong individuals from different geographical locations(similar branch lengths among all individuals, Fig. 1c).
Putatively selective SNPsThe genomic scan using Bayescan v.2.1 identified onlyone SNP as a directional outlier, which was
Table 1 Filtering steps and SNPs counts retained after eachstep
Retained SNPs count
Initial potential SNPs 48,140
Duplicated SNPs filters 39,086
Clustered SNPs filters 32,840
Call rate≥ 0.7 23,764
Replication average≥ 0.95 23,549
SNPs coverage ≥80% 20,421
Reads depth≥ 5 14,695
SNPs MAF≥ 0.02 12,589
HWE filters 7988
Retained SNPS for genomic analysis 7988
MAF minor allele frequencies, HWE Hardy Weinberg Equilibrium
Table 2 Genetic diversity indices for P. homarus for each sampling site using 7988 SNPs
Location n Hn.b (±SD) Ho (±SD) Av. MLH (±SD) sMLH (±SD) g2 (95% C.I.) Fis (p < 0.001) NeLD (95% C.I.)
Al Ashkharah 20 0.2324 (±0.1643) 0.1789 (±0.1495) 0.1807 (±0.0027) 1.001 (±0.0147) 0.0038(0.0000–0.0088)
0.2349 10,305 (4860 - ∞)
Masirah 29 0.2277 (±0.1635) 0.1803 (±0.1481) 0.1823 (±0.0009) 1.009 (±0.0053) 0.0004(0.0000–0.0008)
0.2113 ∞ (∞ - ∞)
Duqm 19 0.2275 (±0.1691) 0.1798 (±0.1532) 0.1817 (±0.0011) 1.005 (±0.0062) 0.0003(−0.0001–0.0008)
0.2142 ∞ (∞ - ∞)
Ras Madrakah 17 0.2260 (±0.1715) 0.1799 (±0.1576) 0.1820 (±0.0013) 1.006 (±0.0073) 0.0006(0.0000–0.0013)
0.2094 ∞ (∞ - ∞)
Haitam 20 0.2333 (±0.1630) 0.1840 (±0.1509) 0.1858 (±0.0015) 1.029 (±0.0084) 0.0010(0.0005–0.00151)
0.2160 5507 (3457–13,521)
Ashuwaymiyah 10 0.2287 (±0.1843) 0.1660 (±0.1677) 0.1683 (±0.0025) 0.9302 (±0.0144) 0.0031(−0.0002–0.0077)
0.2861 ∞ (∞ - ∞)
Mirbat 20 0.2270 (±0.1678) 0.1780 (±0.1513) 0.1797 (±0.0024) 0.9947 (±0.0131) 0.0044(−4.8190–0.0122)
0.2203 ∞ (∞ - ∞)
Dhalkut 29 0.2273 (±0.1640) 0.1770 (±0.1437 0.1788 (±0.0017) 0.9892 (±0.0094) 0.0032(0.0007–0.0059)
0.2248 ∞ (∞ - ∞)
n number of samples, Hn.b average expected heterozygosity corrected for population sample size, Ho observed heterozygosity, Av. MLH average multi-locusheterozygosity, sMLH standard multi-locus heterozygosity, g2 identity disequilibrium parameter, Fis inbreeding coefficient, NeLD effective population size by thelinkage disequilibrium method with 95% confidence interval
Al-Breiki et al. BMC Genomics (2018) 19:690 Page 3 of 13

characterized by Jeffery’s scale as decisive. The frequen-tist approach with Arlequin v.3.5.2.2 indicated out of7988 SNPs, 504 SNPs (6.31%) potentially under diver-gent selection, 168 SNPs (2.10%) under balancing selec-tion and 7316 SNPs (91.59%) likely to be neutral(Genotypes of 504 SNP loci are available as Add-itional file 3). Global FST for the 504 SNPs candidateoutliers was 0.0423 (Table 4), more than 100 timesgreater than for all 7988 SNPs (0.0004). All of the pair-wise estimates with these directional outliers were
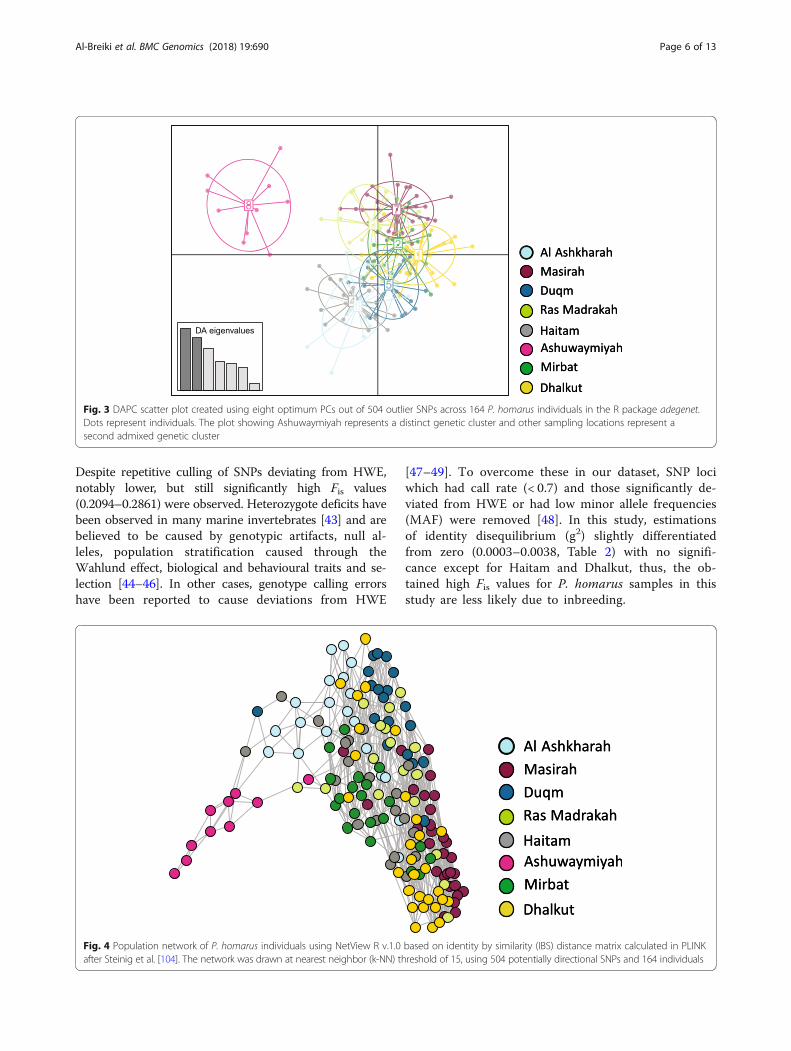
significant (p < 0.001), with highest differentiation be-tween Ashuwaymiyah and Ras Madrakah (0.0736) andthe lowest between Masirah and Dhalkut (0.0288)(Fig. 2; Table 4). Visualization of DAPC revealed thatAshuwaymiyah samples represented a distinct geneticcluster, while all other samples were grouped into a sec-ond admixed genetic cluster (Fig. 3). The same patternwas also observed by population Netview at a rangefrom k-NN =10 to 30 and visualized at k-NN = 15(Fig. 4).
Table 3 Pairwise FST values for 7988 SNPs using Genetix v.4.05.2 with permuted p-values inside brackets
Al Ashkharah Masirah Duqm Ras Madrakah Haitam Ashuwaymiyah Mirbat
Masirah −0.0006 (0.970) – – – – – –
Duqm 0.0001 (0.570) 0.0007 (0.198) – – – – –
Ras Madrakah 0.0004 (0.416) −0.0002 (0.347) 0.0007 (0.306) – – – –
Haitam 0.0003 (0.319) 0.0002 (0.477) 0.0013a (0.044) 0.0001 (0.690) – – –
Ashuwaymiyah 0.0006 (0.267) 0.0002a (0.045) 0.0016a (0.041) 0.0021a (0.010) 0.0021a (0.031) – –
Mirbat −0.0008 (0.931) −0.0004 (0.901) 0.0013a (0.040) −0.0001 (0.771) − 0.0001 (0.720) 0.0004 (0.258) –
Dhalkut −0.0003 (0.485) 0.0005 (0.129) 0.0005 (0.198) −0.0001 (0.780) 0.0007 (0.112) 0.0021a (0.043) 0.0007 (0.491)adenotes significant comparisons
a
c
b
Fig. 1 Population structure of 164 individuals of P. homarus samples using 7988 SNPs. Population network was constructed using NetView R v.1.0.The network is visualised at nearest neighbor (k-NN) threshold of 25 (a) and 50 (b). Un-rooted neighbor-joining tree (c) was drawn in MEGA6using 1-psa genetic distances, scale bar indicates genetic distance
Al-Breiki et al. BMC Genomics (2018) 19:690 Page 4 of 13
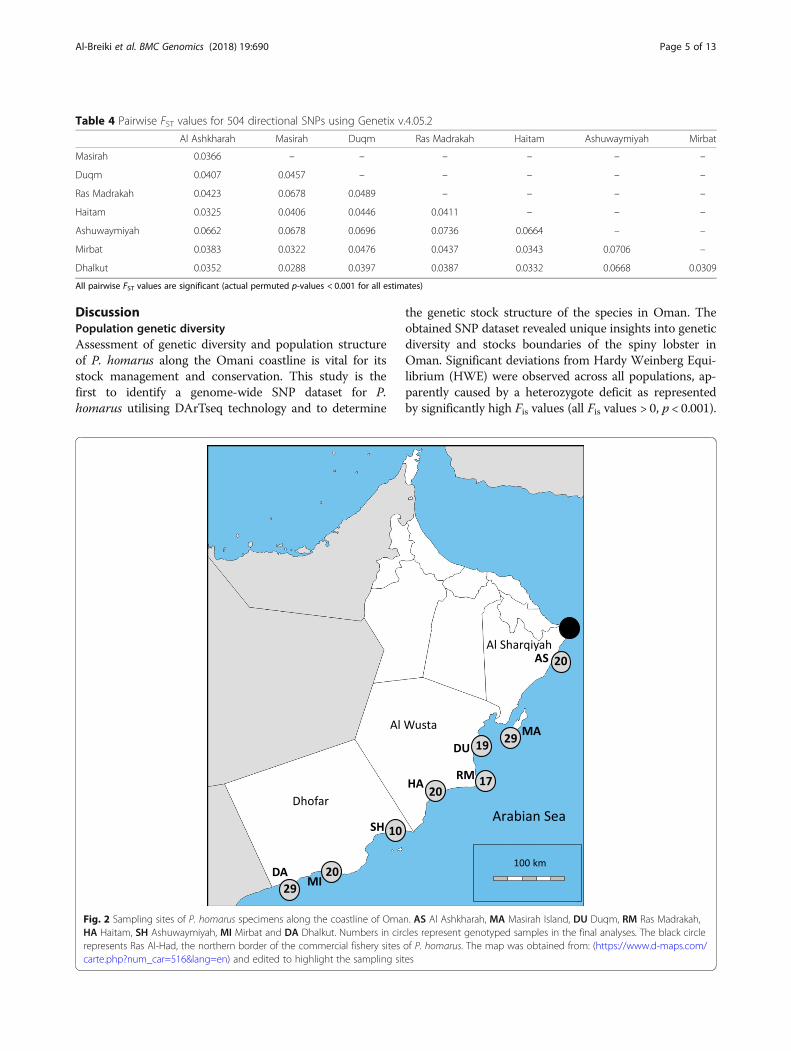
DiscussionPopulation genetic diversityAssessment of genetic diversity and population structureof P. homarus along the Omani coastline is vital for itsstock management and conservation. This study is thefirst to identify a genome-wide SNP dataset for P.homarus utilising DArTseq technology and to determine
the genetic stock structure of the species in Oman. Theobtained SNP dataset revealed unique insights into geneticdiversity and stocks boundaries of the spiny lobster inOman. Significant deviations from Hardy Weinberg Equi-librium (HWE) were observed across all populations, ap-parently caused by a heterozygote deficit as representedby significantly high Fis values (all Fis values > 0, p < 0.001).
Table 4 Pairwise FST values for 504 directional SNPs using Genetix v.4.05.2
Al Ashkharah Masirah Duqm Ras Madrakah Haitam Ashuwaymiyah Mirbat
Masirah 0.0366 – – – – – –
Duqm 0.0407 0.0457 – – – – –
Ras Madrakah 0.0423 0.0678 0.0489 – – – –
Haitam 0.0325 0.0406 0.0446 0.0411 – – –
Ashuwaymiyah 0.0662 0.0678 0.0696 0.0736 0.0664 – –
Mirbat 0.0383 0.0322 0.0476 0.0437 0.0343 0.0706 –
Dhalkut 0.0352 0.0288 0.0397 0.0387 0.0332 0.0668 0.0309
All pairwise FST values are significant (actual permuted p-values < 0.001 for all estimates)
Fig. 2 Sampling sites of P. homarus specimens along the coastline of Oman. AS Al Ashkharah, MA Masirah Island, DU Duqm, RM Ras Madrakah,HA Haitam, SH Ashuwaymiyah, MI Mirbat and DA Dhalkut. Numbers in circles represent genotyped samples in the final analyses. The black circlerepresents Ras Al-Had, the northern border of the commercial fishery sites of P. homarus. The map was obtained from: (https://www.d-maps.com/carte.php?num_car=516&lang=en) and edited to highlight the sampling sites
Al-Breiki et al. BMC Genomics (2018) 19:690 Page 5 of 13
Despite repetitive culling of SNPs deviating from HWE,notably lower, but still significantly high Fis values(0.2094–0.2861) were observed. Heterozygote deficits havebeen observed in many marine invertebrates [43] and arebelieved to be caused by genotypic artifacts, null al-leles, population stratification caused through theWahlund effect, biological and behavioural traits and se-lection [44–46]. In other cases, genotype calling errorshave been reported to cause deviations from HWE
[47–49]. To overcome these in our dataset, SNP lociwhich had call rate (< 0.7) and those significantly de-viated from HWE or had low minor allele frequencies(MAF) were removed [48]. In this study, estimationsof identity disequilibrium (g2) slightly differentiatedfrom zero (0.0003–0.0038, Table 2) with no signifi-cance except for Haitam and Dhalkut, thus, the ob-tained high Fis values for P. homarus samples in thisstudy are less likely due to inbreeding.
Fig. 3 DAPC scatter plot created using eight optimum PCs out of 504 outlier SNPs across 164 P. homarus individuals in the R package adegenet.Dots represent individuals. The plot showing Ashuwaymiyah represents a distinct genetic cluster and other sampling locations represent asecond admixed genetic cluster
Fig. 4 Population network of P. homarus individuals using NetView R v.1.0 based on identity by similarity (IBS) distance matrix calculated in PLINKafter Steinig et al. [104]. The network was drawn at nearest neighbor (k-NN) threshold of 15, using 504 potentially directional SNPs and 164 individuals
Al-Breiki et al. BMC Genomics (2018) 19:690 Page 6 of 13

Additionally, average multi locus heterozygosity esti-mates (Av.MLH) showed a moderate to high level ofgenomic heterozygosity (0.1683–0.1858) compared tosome marine invertebrates e.g. Hapalochlaena maculosa(0.0800–0.1720) [50], Pinctada margaritifera (0.0520–0.1030) [11] and P. maxima (0.3030–0.3110) [51]. Thismay support that the significantly high Fis values are un-likely due to reduction in genomic heterozygosity. Multilocus heterozygosity may reflect genome wide heterozy-gosity especially when thousands of genomic markersare used [52, 53].It is also unlikely that the high Fis values are caused by
the Wahlund effect, as Netview analyses indicated highlevels of admixture (Fig. 1a, b). Possibly, the observedheterozygote deficits are caused by null alleles or selection.In our study, high missingness rate (> 0.2) of SNPs wasobserved for some samples from Ashuwaymiyah and wereexcluded, as they did not match our quality criteria. In theremaining samples (with genotyping coverage ≥0.8),monomorphic loci were observed for Ashuwaymiyah only,but not other sites. The monomorphic loci observed inAshuwaymiyah samples could be attributed to mutationsin restriction enzyme sites during DArTseq genotypingcausing null alleles in populations [54]. It is also possible,that these observations were due to small sample sizeeffect from Ashuwaymiyah. A study in our group withmicrosatellite markers revealed divergence of Ashuawy-miyah stock in a larger sample size of 20 individuals(Delghandi et al., under prep).Generally, null alleles may indicate occurrence of
genetic variation in the form of point mutations orstructural mutations (i.e. insertions/deletions) andcontribute to the organism’s fitness and adaptation[55]. It has been reported that the frequency of miss-ing data is correlated with the level of genetic diver-gence between populations [54, 56]. Other studies,however, have reported that null alleles are frequentlyencountered in SNP datasets and generate biases inestimation of diversity indices [57].
Population differentiation and genetic structureIn our study, pairwise differentiation estimates (FST) ana-lysis using 7988 SNP loci, showed low but statistically sig-nificant (p < 0.05) differentiation between Ashuwaymiyahand other locations, except for Al Ashkharah and Mirbat(Table 3). Earlier reports showed that P. homarus pos-sesses a genetic structure at the large Indo-Pacificscale [36] and relatively small scales, within both thenorth west Indian Ocean and south west IndianOcean [38, 58].Other studies demonstrated different patterns and
levels of genetic structure in spiny lobsters e.g. P. orna-tus, exhibit low levels of genetic structure across an ex-pansive distribution of the Indo-Pacific [59], but not at
smaller scales i.e. South East Asia [60]. Similarly, no gen-etic structure was observed in Hawaiian P. penicillatus[61], while at the scale of the Indian Ocean and acrossits Indo-Pacific range, significant structure was revealed[62, 63]. These contrasting patterns are referred to,mainly, environmental (e.g. pattern of water circulation)[38], bioecological (e.g. larval retention) [64], behavioral(e.g. spawning migrations) [60], or geographical factors(e.g. habitats patchiness) [59]. In this study, the observedgenetic divergence among Omani P. homarus could becaused by distinct environmental and geographical fac-tors in the region. The Omani coast in the Arabian seais known to be influenced by complex water circulationwhich varies seasonally with the Monsoon and results ina series of eddies along the coast of Oman [65, 66]. Gen-erally, eddies might act as a larval retention system [67],limiting larval dispersal and maintaining divergence inmarine populations including spiny lobsters, e.g. Jasusedwardsii [68] and P. h. rubellus [38]. Additionally, frag-mentation of marine habitats across the Omani coastlineby sandy stretches and absence of corals and rock reefs[44] could have contributed to this observation. Similarobservations have been reported for other marine organ-isms with larval life stage such as Corkwing wrasse acrossNorwegian coastline [69] and the Omani clownfish [70].In fact, Ashuwaymiyah is a shallow bay characterized bylarge rocky reefs, and its extended sea shelf (about 50 km)is less affected by the Monsoon currents, even during itsextremes from June to September (National Survey Au-thority, Ministry of Defense, Oman, unpublished localdata). This unique geography of Ashuwaymiyah couldhave limited the gene flow among lobsters from Ashuway-miyah and other sites. This could be a possible explan-ation for the putative genetic divergence of P. homarussamples from Ashuwaymiyah. Moreover, it is not surpris-ing to observe a genetically heterogeneous stock amongother admixed stocks over a relatively small geographicalscale. Such observation of fine scale genetic differentiationwithin relatively high gene flow environment has beenwidely described in a variety of marine species with plank-tonic early life stage and in a phenomenon known as cha-otic genetic patchiness [71, 72]. Examples includecrown-of-thorns starfish, Acanthaster planci [73], clam,Spisula ovalis, [74], the sea urchin, Strongylocentrotus pur-puratus [75], marine goby, Coryphopterus personatus [76],marine goby, pulmonate limpets, Siphonaria sp. [71], bi-colour damselfish, Stegastes partitus [77] and spiny lob-ster, P. interruptus [78]. Therefore, it is possible that theobserved slight divergence of Ashuwaymiyah is due tochaotic genetic patchiness. A typical feature of chaoticgenetic patchiness is being temporal therefore, repeti-tive sampling from Ashuwaymiyah would be useful toclarify the current status of the genetic heterogeneityin Ashuwaymiyah.
Al-Breiki et al. BMC Genomics (2018) 19:690 Page 7 of 13

Detecting potential selective SNPsGenome-wide scan for FST outliers using Bayescan v2.1identified only one directional outlier, hence further ana-lysis of population structure was not possible using thisapproach. In contrast, applying Arlequin resulted inmore candidate outlier loci being identified, allowingfurther investigation for adaptive variation. It is commonto detect less candidate outliers with Bayescan as it is aconservative approach and may fail to detect relativelylow signals of selection [79–81]. Therefore other studieshave used only the frequentist approach to perform FSToutliers analysis [82].Assessment of population structure with putatively
directional SNPs using both population Network andDAPC, revealed Ashuwaymiyah to be potentially underlocal adaptive pressures (Figs. 3 and 4). The utilizationof the whole dataset of SNPs could not capture the lowlevels of genetic structure, while analyses based on FSToutliers allowed detection of selective divergence andidentification of possible discrete stock. Similarly, manyother studies showed that the use of FST outliers could de-tect adaptive variation in the absence of broader analysesbased on neutral markers [83–85]. A possible explanationfor the observed divergence is the heterogeneous environ-mental attributes i.e. massive rocky reefs and shallow wa-ters in Ashuwaymiyah, which might be the driver of thisdifferentiation. In addition to the morphological/biologicaldifferences among P. homarus stocks [42], genetic studieswith microsatellite markers revealed a significant diver-gence of lobsters from the Dhofar governorate, includingAshuwamiyah from Al Sharqiyah and Al Wusta governor-ates (Delghandi et al., under prep).
Implications for fishery managementThe population of P. homarus along Oman is currentlyconsidered as a single homogenous stock with a singlemanagement regulation. This study shows that the sam-ples from Ashuwaymiyah are genetically distinct fromother broadly admixed samples, albeit at low levels. Anearlier study reported that stock of P. homarus inAshuwaymiyah was significantly differentiated in bodysize and that lobsters reach maturity at significantlylower sizes when compared to two geographically closelocations [86]. The same study suggested a need to in-vestigate the current fishery management further and in-dicated that Ashuwaymiyah site might require separatemanagement. Additionally, a recent biological study ofP. homarus in Oman revealed that the stock in Dhofargovernorate differs from other stocks in size, time ofspawning and number of spawning peaks/year, suggestinga need to consider spatial management of P. homarusalong the Omani coastline [42]. Our study delivers for thefirst time genetic support for possible differentiation ofthe Ashuwamiyah stock from other locations across the
coastline of Oman, using genome-wide markers, and thatthis stock might need to be considered for regional man-agement. We recommend the conduct of further studieswith larger number of samples, coupled with environmen-tal and ecological data, to aid integrated assessment stud-ies and potential discovery of unique management units.
ConclusionsUtilisation of genome wide SNPs to study the geneticstatus of P. homarus stocks in Oman provided valuableinsights into the genetic status of the stock. This gen-omic resource is the first of its kind in P. homarus andthe SNP dataset obtained in this study has allowed deepcharacterization of the lobster population genetic diver-sity, connectivity and structure in Oman. This study hasrevealed general admixture and high connectivity of P.homarus across the Omani coastline. Additionally, thestudy highlighted the potential prevalence of local adap-tive pressures in Ashuwaymiyah. These findings indicatethe importance of considering spatially customized man-agement strategies for P. homarus across the coastline ofOman. Further studies of the genetic status of Ashuway-miyah and stocks from other locations in Dhofar withadequate sampling based on different temporal periodstogether with ecological and environmental data aboutOmani coastline is required before any conclusive deci-sion on the stock structure can be inferred.
MethodsSampling and genomic DNA extractionThe commercial P. homarus fishery in Oman is situatedbetween Ras Al-Hadd and Dhalkut (a distance of approxi-mately 1100 km) (Fig. 2). Samples were obtained fromeight commercial landing-sites, covering most of the dis-tribution range of the lobster in Oman (Fig. 2). All sam-ples were euthanized and purchased from local fishermenin March 2015 during the legal fishing season. A singlewalking leg was excised from wild caught P. homarus (n =172) and preserved immediately in 95% ethanol untilDNA extraction. All samples were purchased from localfishermen in March 2015 during the legal fishing season.Genomic DNA was extracted from tissue samples using amodified cetyl trimethyl ammonium bromide (CTAB)/Chloroform-Isoamyl method [87]. DNA extracts were fur-ther purified through a Sephadex G50 (GE, 2007) columnprior to quantification with a Nanodrop 1000 Spectropho-tometer (Thermo Scientific).
Library preparation and genotypingGenomic DNA extracts were standardised to 50 ng/μl,and sent for sequencing and genotyping using DArTseq™technology, with Diversity Arrays Technology, Canberra,Australia [88, 89]. Library preparation was completed asdescribed by Kilian et al. [89] and Sansaloni et al. [90]
Al-Breiki et al. BMC Genomics (2018) 19:690 Page 8 of 13
with all P. homarus DNA samples being digested using acombination of PtsI and HpaII restriction enzymes. Multi-plexed reduced representation libraries were then se-quenced on the Illumina HiSeq2500 platform for 77 cycles.To call SNPs and genotype each individual, raw Illu-
mina HiSeq2500 data was first de-multiplexed into indi-vidual samples, based on sample-specific barcodesequences. De-multiplexed samples were then assessedfor overall sequence quality, with any fragments with anaverage Q-score of < 25 being removed from the dataset.Sequences were also compared to public databases foridentification of contaminant sequences, and anynon-target sequences (including bacterial and viral frag-ments) were removed. SNP calling was conducted usingthe DArTsoft14 algorithm within the KDComputeframework developed by Diversity Arrays Technology(http://www.kddart.org/kdcompute.html), with initialcalling parameters and filtering methods as described inMorse et al. [50] and Lind et al. [91].
SNPs quality control and filteringTo eliminate potentially aberrant SNPs, stringent qualitycontrols were applied using custom python scripts withinthe DArTQC pipeline (https://github.com/esteinig/dartQC)[92]. Initially, all duplicated sequences with > 95% similaritywere identified using CD-HIT and collapsed into a singlecluster, or removed [93]. Further, SNPs with a call rate <70% and those where technical replicates did not return arepeatability value of > 95% were also removed. Addition-ally, individuals and SNPs with > 20% missing data andSNPs with a Minor Allele Frequency (MAF) < 0.02 were ex-cluded using Plink v1.07 [94].To investigate the effect of sequencing depth, Fis and
Ho were calculated for each population at different readsdepth (Average SNP Counts) thresholds (3, 5, 7 and 10)to discover the degree of potential bias caused by lowercall depths. Accordingly, four subsets of SNPs were gen-erated at these sequencing depths. To detect potentialgenotyping artifacts, SNPs were tested for significant de-viation from Hardy-Weinberg equilibrium (HWE) usingArlequin v.3.5.2.2 [95]. Any SNP loci which significantlydeviated from HWE were excluded following Bonferronicorrection (p < 0.000004). To assess the impact of devi-ation from HWE, Fis and Ho were calculated before andafter removal of significantly deviated SNPs.
Population genetic diversityTo estimate the genetic diversity within populations,standard allelic diversity indices including average ob-served heterozygosity (Ho), average expected heterozy-gosity corrected for population sample size (Hn.b.) andinbreeding coefficient (Fis) were calculated using Genetixv.4.05.2 [96]. Effective population size, using a linkagedisequilibrium method (NeLD) was computed with
NeEstimator [97]. To examine individual genome widediversity and individual inbreeding, multi-locus hetero-zygosity (MLH) and identity disequilibrium parameter(g2) were calculated for all individuals using the R pack-age inbreedR [52].
Population differentiation and genetic structureTo assess population differentiation and genetic structure,a number of different statistical approaches were con-ducted. The extent of pairwise population differentiationwas evaluated using Weir and Cockerham’s unbiasedF-statistics [98] through Genetix v.4.05.2 [96]. To assesshierarchical levels of population structuring, an analysis ofmolecular variance (AMOVA) using Arlequin v.3.5.2.2[99] was calculated between sampling locations based ongrouping samples in four groups (AS, MA; group1;DU,RM, group2; HA, SH, group3; MI, DA; group4). Thegrouping criterion was based on habitat similarity i.e.abundance of corals and rock substrates. Obviously, AlWusta coast is dominated by sandy habitat and sparsecoral colonies [100, 101]. Region surrounding DU hasbeen exposed for the last seven years to major construc-tion and industrial influence, most probably having an im-pact on fragmentation of marine populations. Hence, HAbeing not affected of these factors, was grouped with SH,which is just below the border line between Al Wusta andDhofar governates (Fig. 2). In addition, the functionfind.clusters in the R package adegenet [102] was used todetermine the optimal number of clusters with the Bayes-ian Information Criterion (BIC) method. To assess levelsof differentiation between the obtained genetic clusters,Discriminant Analysis of Principal Components (DAPC)was used. DAPC was performed using the optimum num-ber of principal components (PCs) calculated using theα-score function in adegenet [103].Finally, a network analysis with no prior population as-
sumptions was performed to assess both broad and finescale population structure using NetView R [104]. Net-View was run through the R implementation of NetViewP [104, 105] at a k-NN range from 25 to 50 as determinedby a k-NN selection plot. Similarly, to visualise the extentof relatedness between individuals within each populationand divergence among populations, a Neighbour-Joining(NJ) tree was constructed in MEGA6 [106]. The NJ treewas constructed using 1-proportion of shared alleles(1-psa) genetic distance matrix calculated in the R packageadegenet using propShared function [102].
Identifying potential selective SNPsTo detect possible signatures of directional and balan-cing selection, detection of putatively selective outlierSNPs was performed using an FST approach. To minimizefalse positive rates in identifying SNPs under selection, twoindependent statistical approaches were used. A Bayesian
Al-Breiki et al. BMC Genomics (2018) 19:690 Page 9 of 13

approach was implemented in Bayescan v.2.1 [107] and afrequentist approach [108] was implemented in Arlequinv.3.5.2.2 [99]. Bayescan estimates population-specific FST co-efficients by the Bayesian method described in [109] anduses a statistical cut-off based on the mode of the posteriordistribution to detect SNPs under selection [107]. Bayescanv2.1 was used with 1:10 prior odds for a neutral model andall other parameters were kept as default (20 pilot runs of5000 iterations followed by 100,000 iterations with an add-itional burn-in of 50,000) [110]. Once probabilities had beencalculated for each locus, they were ranked from largest tosmallest. SNPs with posterior probabilities ≥0.91–1, whichare categorised as strong to decisive according to the Jeffery’sscale [110], were retained. In addition, the Bayescan v2.1function, plot R.r in the R v.3.3.1 was used to control thefalse discovery rate (FDR) of the selective markers at FDR of0.05. SNPs were considered as outliers if their probabilitywas > 0.9 at FDR of 0.05.The frequentist approach in Arlequin v.3.5.2.2 was ex-
ecuted under a finite island model with 200,000 simula-tions and 100 demes simulated [99]. SNPs wereconsidered as outliers based on their FST and p values.SNPs were considered as directional loci if their FSTvalues fell within the upper 5% quantile and p < 0.05.They were considered as balancing SNPs if their FSTvalues fell in the lower 5% quantile and p < 0.05.To assess the population structure based on direc-
tional outliers, a dataset of the putative outlier SNPs wasgenerated. Broad scale population differentiation basedon this SNP dataset was examined by calculating magni-tude and significance of pairwise FST comparisons usingGenetix v.4.05.2. Population structure and network wereexamined based on the putative outlier SNPs usingDAPC and Netview respectively. DAPC was visualisedafter retaining the optimum number of PCs and Net-View was run at k-NN range = 10 to 30.
Additional files
Additional file 1: Genotypic data of P. homarus for 164 individuals fromOman using 7988 SNPs. Genotypes are in genetix format. (TXT 576 kb)
Additional file 2: A plot of the Discriminant Analysis of PrincipalComponents (DAPC) against the discriminant function retained. The plotis indicating presence of two genetic clusters of P. homarus in Oman. Theplot was generated using the most informative 13 PCs identified from all7988 SNPs dataset across 164 P. homarus individuals in the R packageadegenet. (TXT 9105 kb)
Additional file 3: Genotypic data of P. homarus for 164 individuals fromOman using 504 putatively directional SNPs. Genotypes are in genetixformat. (PDF 389 kb)
Abbreviations1-psa: 1-proportion of shared alleles; AMOVA: Analysis of molecular variance;AS: Al Ashkharah; BIC: Bayesian information criterion; CTAB: Cetyl trimethylammonium bromide; DA: Dhalkut; DAPC: Discriminant analysis of principalcomponents; DartQC: Diversity arrays technology SNPs quality control; DArT-seq: Diversity arrays technology sequencing; Du: Duqm; FDR: False discovery
rate; gDNA: Genomic deoxyribonucleic acid; HA: Haitam; HWE: Hardy-Weinbergequilibrium; IBS: Identity by similarity; k-NN: Number of nearest neighbours k-threshold; Ma: Masirah Island; MAF: Minor allele frequency; MI: Mirbat;MLH: Multi-locus heterozygosity; NJ: Neighbour-joining; PCR: Polymerasechain reaction; PCs: Principal components; PLD: Pelagic larval duration;RM: Ras Madrakah; SH: Ashuwaymiyah; sMLH: Standardized multi-locusheterozygosity; SNP: Single nucleotide polymorphism
AcknowledgementsWe would like to thank Monal Lal and Eike Steinig for their advice and supporton different statistical analysis and software including Netview R and DArTQCpipeline. Sincere thanks are also extended for Abdulaziz Al Marzouqi, Ministry ofAgriculture and Fisheries Wealth for facilitating samples collection. We thankalso Mohammed Al Wahaibi for his assistance in samples collection.
FundingThe present study was supported by the Research Council of Oman (TRC)(ORG/SQU/EBR/13/027).
Availability of data and materialsGenotypes data are provided as Additional files.
Authors’ contributionsRDB participated in the investigation design of the study, optimization ofDNA extraction, analyzed and interpreted the data, drafted, revised andedited the manuscript. SRK carried out the DNA purification and optimizedsamples prior to library preparation, provided support in the data analysisand contributed to the writing of the manuscript. HA and MSH, extractedthe DNA and provided support in the data analysis. KRZ provided distinctadvices in the data quality control and analysis. DRJ participated in theinvestigation design, provided support in the data analysis and writing themanuscript. MAA provided support in the data analysis and reviewing themanuscript. MD developed the concept of the project and the investigationdesign, collected samples, provided supervisory support, contributed tointerpretation of data, writing and revision of the manuscript. All authorsread and approved the final manuscript.
Ethics approvalAll animal samples in this study complied with the Omani law on Sea Fishingand Protection of the Marine Biological Wealth RD 53–81 and fully compliedwith local fisheries management and marine protected area controls. Allsamples were purchased from local fishermen, hence no specific permits wererequired for the described filed sampling as the fishermen were required tocomply with local laws regarding capture. The species sampled are notendangered or protected.
Consent for publicationNot applicable.
Competing interestsThe authors declare that they have no competing interests.
Publisher’s NoteSpringer Nature remains neutral with regard to jurisdictional claims inpublished maps and institutional affiliations.
Author details1Centre of Excellence in Marine Biotechnology, Sultan Qaboos University,P.O. Box 50, Al-Khoud, 123 Muscat, Sultanate of Oman. 2College ofAgriculture and Marine Sciences, Department of Marine Sciences andFisheries, Sultan Qaboos University, P.O. Box 34, Al-Khoud, 123 Muscat,Sultanate of Oman. 3Centre for Sustainable Tropical Fisheries andAquaculture and College of Science and Engineering, James Cook University,Townsville QLD 4810, Australia. 4College of Agriculture and Marine Sciences,Department of Animal and Veterinary Sciences and Technology, SultanQaboos University, P.O. Box 34, Al-Khoud, 123 Muscat, Sultanate of Oman.
Al-Breiki et al. BMC Genomics (2018) 19:690 Page 10 of 13
Received: 10 April 2018 Accepted: 27 August 2018
References1. Reiss H, Hoarau G. Ckey-Collas M, Wolff WJ. Genetic population structure of
marine fish: mismatch between biological and fisheries management units.Fish Fish. 2009;10(4):361–95.
2. Lal MM, Southgate PC, Jerry DR, Bosserelle C, Zenger KR. A parallelpopulation genomic and hydrodynamic approach to fishery Managementof Highly-Dispersive Marine Invertebrates: the case of the Fijian black-lippearl oyster Pinctada margaritifera. PLoS One. 2016;11(8):e0161390.
3. Carvalho GR, Hauser L. Molecular-genetics and the stock concept infisheries. Rev Fish Biol Fish. 1994;4(3):326–50.
4. McKeown NJ, Arkhipkin AI, Shaw PW. Regional genetic population structureand fine scale genetic cohesion in the southern blue whitingMicromesistius australis. Fish Res. 2017;185:176–84.
5. Selkoe KA, D'Aloia CC, Crandall ED, Iacchei M, Liggins L, Puritz JB, et al. Adecade of seascape genetics: contributions to basic and applied marineconnectivity. Mar Ecol Prog Ser. 2016;554:1–19.
6. Riginos C, Liggins L. Seascape genetics: populations, individuals, and genesmarooned and adrift. Geogr Compass. 2013;7(3):197–216.
7. Roy D, Hurlbut TR, Ruzzante DE. Biocomplexity in a demersal exploited fish,white hake (Urophycis tenuis): depth-related structure and inadequacy ofcurrent management approaches. Can J Fish Aquat Sci. 2012;69(3):415–29.
8. Lal MM, Southgate PC, Jerry DR, Zenger KR. Fishing for divergence in a seaof connectivity: the utility of ddRADseq genotyping in a marineinvertebrate, the black-lip pearl oyster Pinctada margaritifera. Mar Genomics.2016;25:57–68.
9. Waples RS. Separating the wheat from the chaff: patterns of geneticdifferentiation in high gene flow species. J Hered. 1998;89(5):438–50.
10. Waples RS, Gaggiotti O. What is a population? An empirical evaluation ofsome genetic methods for identifying the number of gene pools and theirdegree of connectivity. Mol Ecol. 2006;15(6):1419–39.
11. Lal MM, Southgate PC, Jerry DR, Bosserelle C, Zenger KR. Swept away: oceancurrents and seascape features influence genetic structure across the 18,000km indo-Pacific distribution of a marine invertebrate, the black-lip pearloyster Pinctada margaritifera. BMC Genomics. 2017;18(1):66.
12. Limborg MT, Helyar SJ, de Bruyn M, Taylor MI, Nielsen EE, Ogden R, et al.Environmental selection on transcriptome-derived SNPs in a high gene flowmarine fish, the Atlantic herring (Clupea harengus). Mol Ecol. 2012;21(15):3686–703.
13. Nosil P, Funk DJ, Ortiz-Barrientos D. Divergent selection and heterogeneousgenomic divergence. Mol Ecol. 2009;18(3):375–402.
14. Andre C, Larsson LC, Laikre L, Bekkevold D, Brigham J, Carvalho GR, et al.Detecting population structure in a high gene-flow species, Atlantic herring(Clupea harengus): direct, simultaneous evaluation of neutral vs putativelyselected loci. Heredity. 2011;106(2):270–80.
15. Benestan L, Gosselin T, Perrier C, Sainte-Marie B, Rochette R, Bernatchez L.RAD genotyping reveals fine-scale genetic structuring and providespowerful population assignment in a widely distributed marine species, theAmerican lobster (Homarus americanus). Mol Ecol. 2015;24(13):3299–315.
16. Gaggiotti OE, Bekkevold D, Jorgensen HBH, Foll M, Carvalho GR, Andre C, etal. Disentangling the effects of evolutionary, demographic, andenvironmental factors influencing genetic structure of natural populations:Atlantic herring as a case study. Evolution. 2009;63(11):2939–51.
17. Garner BA, Hand BK, Amish SJ, Bernatchez L, Foster JT, Miller KM, et al.Genomics in conservation: case studies and bridging the gap between dataand application. Trends Ecol Evol. 2016;31(2):81–3.
18. Larson WA, Seeb LW, Everett MV, Waples RK, Templin WD, Seeb JE.Genotyping by sequencing resolves shallow population structure to informconservation of Chinook salmon ( Oncorhynchus tshawytscha). Evol Appl.2014;7(3):355–69.
19. Benestan L, Quinn BK, Maaroufi H, Laporte M, Clark FK, Greenwood SJ, et al.Seascape genomics provides evidence for thermal adaptation and current-mediated population structure in American lobster (Homarus americanus).Mol Ecol. 2016;25(20):5073–92.
20. Aykanat T, Lindqvist M, Pritchard VL, Primmer CR. From populationgenomics to conservation and management: a workflow for targetedanalysis of markers identified using genome-wide approaches in Atlanticsalmon Salmo salar. J Fish Biol. 2016;89(6):2658–79.
21. Loman NJ, Misra RV, Dallman TJ, Constantinidou C, Gharbia SE, Wain J, et al.Performance comparison of benchtop high-throughput sequencingplatforms. Nat Biotechnol. 2012;30(5):434–9.
22. Rusk N. Cheap third-generation sequencing. Nat Methods. 2009;6(4):244–5.23. Rhoads A, Au KF. PacBio sequencing and its applications. Geno Proteo
Bioinform. 2015;13(5):278–89.24. Campbell NR, Amish SJ, Pritchard VL, McKelvey KS, Young MK, Schwartz MK,
et al. Development and evaluation of 200 novel SNP assays for populationgenetic studies of westslope cutthroat trout and genetic identification ofrelated taxa. Mol Ecol Resour. 2012;12(5):942–9.
25. Pujolar JM, Jacobsen MW, Als TD, Frydenberg J, Munch K, Jonsson B, et al.Genome-wide single-generation signatures of local selection in thepanmictic European eel. Mol Ecol. 2014;23(10):2514–28.
26. Candy JR, Campbell NR, Grinnell MH, Beacham TD, Larson WA, Narum SR.Population differentiation determined from putative neutral and divergentadaptive genetic markers in eulachon (Thaleichthys pacificus, Osmeridae),an anadromous Pacific smelt. Mol Ecol Resour. 2015;15(6):1421–34.
27. Saha A, Hauser L, Kent M, Planque B, Neat F, Kirubakaran TG, et al. Seascapegenetics of saithe (Pollachius virens) across the North Atlantic using singlenucleotide polymorphisms. ICES J Mar Sci. 2015;72(9):2732–41.
28. Phillips BAGR of SLA, Matsuda H. A Global Review of Spiny LobsterAquaculture. In: Fotedar K, Phillips BF, editors. Recent Advances and NewSpecies in Aquaculture. UK: Blackwell Publishing Ltd. p. 22–84.
29. Booth JD, Phillips BF. Early-life history of spiny lobster. Crustaceana. 1994;66:271–94.
30. Berry PF. A revision of the Panulirus Homarus-Group of Spiny Lobsters(Decapoda, Palinuridae). Crustaceana. 1974;27(1):31–42.
31. Delghandi M, Goddard S, Jerry DR, Dao HT, Al Hinai MSN, Al-Amry W, et al.Novel genomic microsatellite markers for genetic population and diversitystudies of tropical scalloped spiny lobster (Panulirus homarus) and theirpotential application in related Panulirus species. Genet Mol Res. 2016;15(2):gmr7846. https://doi.org/10.4238/gmr.15027846.
32. Rogers PP, Barnard RM, Johnston MD. Lobster aquaculture a commercialreality: a review. J Mar Biol Ass Ind. 2010;52(2):327–35.
33. Fu CH, Fanning LP. Spatial considerations in the management of Atlanticcod off Nova Scotia. Canada North Amer J Fish Man. 2004;24(3):775–84.
34. Lavery SD, Farhadi A, Farahmand H, Chan TY, Azhdehakoshpour A, Thakur V, etal. Evolutionary divergence of geographic subspecies within the scallopedspiny lobster Panulirus homarus (Linnaeus 1758). PLoS One. 2014;9(6):e97247.
35. Singh SP, Groeneveld JC, Al-Marzouqi A, Willows-Munro S. A molecularphylogeny of the spiny lobster Panulirus homarus highlights a separatelyevolving lineage from the Southwest Indian Ocean. Peer J. 2017;5:e3356.
36. Farhadi A, Jeffs AG, Farahmand H, Rejiniemon TS, Smith G, Lavery SD.Mechanisms of peripheral phylogeographic divergence in the indo-Pacific:lessons from the spiny lobster Panulirus homarus. BMC Evol Biol. 2017;17(1):195.
37. Al-Marzouqi A, Al-Amry W, Al-Hadabi A, Al-Senaidi R. DNA barcoding ofPanulirus homarus from Oman and Yemen. J Aquac Mar Biol. 2015;2(5):0043.
38. Reddy MM, Macdonald AHH, Groeneveld JC, Schleyer MH. Phylogeographyof the scalloped spiny-lobster Panulirus Homarus Rubellus in the SouthwestIndian Ocean. J Crust Biol. 2014;34(6):773–81.
39. Mehanna S, Al-Shijibi S, Al-Jafary J, Al-Senaidi R. Population dynamics andmanagement of scalloped spiny lobster Panulirus homarus in Oman coastalwaters. J Biol Agr Heal. 2012;2(10):184–94.
40. Book Fishery Statistics. Year Book Issued by Department of Fisheries Statistics.Ministry of Agriculture and Fisheries Wealth. Sultanate of Oman; 2016.
41. Al-Marzouqi A, Al-Nahdi A, Jayabalan N, Groeneveld J. An assessment of thespiny lobster Panulirus homarus fishery in Oman - another decline in thewestern Indian Ocean? Western Indian Ocean J Mar Sci. 2007;6(2):159–74.
42. Al-Marzouqi A, Chesalin M, Al-Shajibi S, Al-Hadabi A, Al SR. Changes in thescalloped spiny lobster, Panulirus Homarus biological structure after a shiftof the fishing season. J Aquac Mar Biol. 2015;3(5):1–14.
43. Raymond M, Vaanto RL, Thomas F. Rousset F, deMeeus T. Renaud FHeterozygote deficiency in the mussel species complex revisited Mar EcolProg Ser. 1997;156:225–37.
44. Addison JA, Hart MW. Spawning, copulation and inbreeding coefficients inmarine invertebrates. Biol Lett. 2005;1(4):450–3.
45. Zouros E. Heterozygosity and growth in marine bivalves response.Evolution. 1990;44(1):216–8.
46. Valles-Jimenez R, Cruz P, Perez-Enriquez R. Population genetic structure ofpacific white shrimp (Litopenaeus vannamei) from Mexico to Panama:microsatellite DNA variation. Mar Biotechnol. 2004;6(5):475–84.
Al-Breiki et al. BMC Genomics (2018) 19:690 Page 11 of 13

47. Brumfield RT, Beerli P, Nickerson DA, Edwards SV. The utility of singlenucleotide polymorphisms in inferences of population history. Trends EcolEvol. 2003;18(5):249–56.
48. Laurie CC, Doheny KF, Mirel DB, Pugh EW, Bierut LJ, Bhangale T, et al.Quality control and quality Assurance in Genotypic Data for genome-wideassociation studies. Genet Epidemiol. 2010;34(6):591–602.
49. Li H. Toward better understanding of artifacts in variant calling from high-coverage samples. Bioinformatics. 2014;30(20):2843–51.
50. Morse P, Kjeldsen SR, Meekan MG, McCormick MI, Finn JK, Huffard CL, et al.Genome-wide comparisons reveal a clinal species pattern within aholobenthic octopodthe Australian southern blue-ringed octopus,Hapalochlaena maculosa (Cephalopoda: Octopodidae). Ecol Evol. 2018;8(4):2253–67.
51. Nayfa MG, Zenger KR. Unravelling the effects of gene flow and selection inhighly connected populations of the silver-lip pearl oyster (Pinctadamaxima). Mar Genomics. 2016;28:99–106.
52. Stoffel MA, Esser M, Kardos M, Humble E, Nichols H, David P, et al. inbreedR:an R package for the analysis of inbreeding based on genetic markers.Methods Ecol Evol. 2016;7(11):1331–9.
53. Herdegen M, Dudka K, Radwan J. Heterozygosity and orange coloration areassociated in the guppy (Poecilia reticulata). J Evol Biol. 2014;27(1):220–5.
54. Andrews KR, Luikart G. Recent novel approaches for population genomicsdata analysis. Mol Ecol. 2014;23(7):1661–7.
55. Crooks L, Carlborg O, Marklund S, Johansson AM. Identification of NullAlleles and Deletions from SNP Genotypes for an Intercross BetweenDomestic and Wild Chickens. G3-Gen Geno Genet. 2013;3(8):1253–60.
56. Kjeldsen SR, Zenger KR, Leigh K, Ellis W, Tobey J, Phalen D, et al. Genome-wide SNP loci reveal novel insights into koala (Phascolarctos cinereus)population variability across its range. Conserv Genet. 2016;17(2):337–53.
57. Carlson CS, Smith JD, Stanaway IB, Rieder MJ, Nickerson DA. Directdetection of null alleles in SNP genotyping data. Hum Mol Genet. 2006;15(12):1931–7.
58. Farhadi A, Farhamand H, Nematollahi MA, Jeffs A, Lavery SD. MitochondrialDNA population structure of the scalloped lobster Panulirus homarus(Linnaeus 1758) from the West Indian Ocean. ICES J Mar Sci. 2013;70(7):1491–8.
59. Yellapu B, Jeffs A, Battaglene S, Lavery SD. Population subdivision in thetropical spiny lobster Panulirus ornatus throughout its indo-West Pacificdistribution. ICES J Mar Sci. 2017;74(3):759–68.
60. Dao HT, Smith-Keune C, Wolanski E, Jones CM, Jerry DR. OceanographicCurrents and Local Ecological Knowledge Indicate, and Genetics Does NotRefute, a Contemporary Pattern of Larval Dispersal for The Ornate SpinyLobster, Panulirus ornatus in the South-East Asian Archipelago. PLoS One.2015;10(5):e0124568.
61. Iacchei M, O'Malley JM, Toonen RJ. After the gold rush: population structureof spiny lobsters in Hawaii following a fishery closure and the implicationsfor contemporary spatial management. Bull Mar Sci. 2014;90(1):331–57.
62. Abdullah MF. Alimuddin, Muththalib M, Salama AJ, Imai H. Genetic isolationamong the northwestern, southwestern and central-eastern Indian Oceanpopulations of the pronghorn spiny lobster Panulirus penicillatus. Int J MolSci. 2014;15(6):9242–54.
63. Iacchei M, Gaither MR, Bowen BW, Toonen RJ. Testing dispersal limits in thesea: range-wide phylogeography of the pronghorn spiny lobster Panuliruspenicillatus. J Biogeogr. 2016;43(5):1032–44.
64. George RW. Evolution of life cycles, including migration, in spiny lobsters(Palinuridae). N Z J Mar Freshw Res. 2005;39(3):503–14.
65. Ivanochko, T. S. 2005. Sub-orbital scale variations in the intensity of theArabian Sea monsoon. University of Edinburgh, PhD Thesis.
66. Schott FA, McCreary JP. The monsoon circulation of the Indian Ocean. ProgOceano. 2001;51(1):1–123.
67. Condie S, Condie R. Retention of plankton within ocean eddies. Glob EcolBiogeog. 2016;25(10):1264–77.
68. Chiswell SM, Roemmich D. The east cape current and two eddies: amechanism for larval retention? N Z J Mar Freshw Res. 1998;32(3):385–97.
69. Gonzalez EB, Knutsen H, Jorde PE. Habitat discontinuities separategenetically divergent populations of a rocky shore marine fish. PLoS One.2016;11(10):e0163052.
70. Simpson SD, Harrison HB, Claereboudt MR, Planes S. Long-distance dispersalvia ocean currents connects omani clownfish populations throughout entirespecies range. PLoS One. 2014;9(9):e107610.
71. Johnson MS, Black R. Chaotic genetic patchiness in an intertidal limpet.Siphonaria sp Mar Biol. 1982;70(2):157–64.
72. Larson RJ, Julian RM. Spatial and temporal genetic patchiness in marinepopulations and their implications for fisheries management. Calif CoopOcean Fish Investig Reports. 1999;40:94–9.
73. Nash WJ, Goddard M, Lucas JS. Population genetic studies of the crown-of-thorns starfish, Acanthaster planci (L.), in the great barrier reef region. CoralReefs. 1988;7910:11–8.
74. David P, Perdieu M. A, Pernot a F, Jarne P. Fine-grained spatial and temporalpopulation genetic structure in the marine bivalve Spisula ovalis. Evolution.1997;51(4):1318–22.
75. Flowers JM, Schroeter SC, Burton RS. The recruitment sweepstakes hasmany winners: genetic evidence from the sea urchin Strongylocentrotuspurpuratus. Evolution. 2002;56(7):1445–53.
76. Selwyn JD, Hogan JD, Downey-Wall AM, Gurski LM, Portnoy DS, Heath DD.Kin-aggregations explain chaotic genetic patchiness, a commonly observedgenetic pattern, in a marine fish. PLoS One. 2016;11(4):1–11.
77. Christie MR, Johnson DW, Stallings CD, Hixon MA. Self-recruitment andsweepstakes reproduction amid extensive gene flow in a coral-reef fish. MolEcol. 2010;19(5):1042–57.
78. Iacchei M, Ben-Horin T, Selkoe KA, Bird CE, García-Rodríguez FJ, Toonen RJ.Combined analyses of kinship and FSTsuggest potential drivers of chaoticgenetic patchiness in high gene-flow populations. Mol Ecol. 2013;22(13):3476–94.
79. Zhao S, Zheng P, Dong S, Zhan X, Wu Q, Guo X, et al. Whole-genomesequencing of giant pandas provides insights into demographic history andlocal adaptation. Nat Genet. 2013;45(1):67–71.
80. Dillon S, McEvoy R, Baldwin DS, Rees GN, Parsons Y, Southerton S.Characterisation of adaptive genetic diversity in environmentally contrastedpopulations of Eucalyptus camaldulensis Dehnh. (river red gum). Plos one.2014; 9(8):e103515.
81. Zhan X, Dixon A, Batbayar N, Bragin E, Ayas Z, Deutschova L, et al. Exonicversus intronic SNPs: contrasting roles in revealing the population geneticdifferentiation of a widespread bird species. Heredity. 2015;114(1):1–9.
82. Drury C, Dale KE, Panlilio JM, Miller SV, Lirman D, Larson EA, et al. Genomicvariation among populations of threatened coral: Acropora cervicornis. BMCGenomics. 2016;17(1):286.
83. Nielsen EE, Hemmer-Hansen J, Larsen PF, Bekkevold D. Population genomicsof marine fishes: identifying adaptive variation in space and time. Mol Ecol.2009;18(15):3128–50.
84. Tsumura Y, Uchiyama K, Moriguchi Y, Ueno S, Ihara-Ujino T. Genomescanning for detecting adaptive genes along environmental gradients inthe Japanese conifer, Cryptomeria japonica. Heredity. 2012;109(6):349–60.
85. Orsini L, Mergeay J, Vanoverbeke J, De Meester L. The role of selection indriving landscape genomic structure of the waterflea Daphnia magna. MolEcol. 2013;22(3):583–601.
86. Mohan R. Size structure and reproductive variation of the spiny lobsterPanulirus homarus over a relatively small geographic range along the Dhofarcoast in the Sultanate of Oman. R Mar Freshw Res. 1997;48(8):1085–91.
87. Adamkewicz SL, Harasewych MG. Systematics and biogeography of thegenus Donax (Bivalvia: Donacidae) in eastern North America. Amer MalacolBulletin. 1996;13(1–2):97–103.
88. Jaccoud D, Peng K, Feinstein D, Kilian A. Diversity arrays: a solid statetechnology for sequence information independent genotyping. Nuc AcidRes. 2001;29:e25.
89. Kilian A, Wenzl P, Huttner E, Carling J, Xia L, Blois H, et al. Diversity arraystechnology: a generic genome profiling technology on open platforms.Methods Mol Biol. 2012;888:67–89.
90. Sansaloni C, Petroli C, Jaccoud D, Carling J, Detering F, Grattapaglia D, KilianA. Diversity arrays technology (DArT) and next-generation sequencingcombined: genome-wide, high throughput, highly informative genotypingfor molecular breeding of Eucalyptus. BMC Proc. 2011;5(Suppl 7):54–P54.
91. Lind C, Kilian A, Benzie J. Development of diversity arrays technologymarkers as a tool for rapid genomic assessment in Nile tilapia. Anim Genet.2017;48(3):362–4.
92. Steinig E, Guppy J, Jones D, Zenger K. 2016. DartQC pipeline. https://github.com/esteinig/dartQC (2018). Accessed 5 Apr 2018.
93. Li W, Godzik A. Cd-hit: a fast program for clustering and comparing largesets of protein or nucleotide sequences. Bioinformatics. 2006;22(13):1658–9.
94. Purcell S, Neale B, Todd-Brown K, Thomas L, Ferreira MAR, Bender D, et al.PLINK: a tool set for whole-genome association and population-basedlinkage analyses. J Hum Genet. 2007;81(3):559–75.
95. Excoffier L, Laval G, Schneider S. Arlequin ( version 3 . 0 ): An integratedsoftware package for population genetics data analysis. 2005;23(1):47–50.
Al-Breiki et al. BMC Genomics (2018) 19:690 Page 12 of 13

96. Belkhir K, Borsa P, Chikhi L, Raufaste N, Bonhomme F. 1996. GENETIX 4.05,logiciel sous Windows TM pour la génétique des populations. Universite´ deMontpellier II. http://www.genetix.univ-montp2.fr/. Accessed 5 Apr 2018.
97. Do C, Waples RS, Peel D, Macbeth GM, Tillett BJ, Ovenden JR. NEESTIMATORv2: re-implementation of software for the estimation of contemporaryeffective population size (Ne) from genetic data. Mol Ecol Resour. 2014;14(1):209–14.
98. Weir B, Cockerham C. Estimating F statistics for the analysis of populationstructure. Evolution. 1984;38(6):1358–70.
99. Excoffier L, Lischer HEL. Arlequin suite ver 3.5. 5 a new Ser. Programs toperform Popul. Genet. Anal. Under {Linux} {windows}. {molecular} Ecol.Resour. 2010;10:564–7.
100. Sheppard CRC, Salm RV. Reef and coral communities of Oman, with adescription of a new coral species (order scleractinia, genus acanthastrea). JNat Hist. 1988;22(1):263–79.
101. Schils T, Wilson SC. Temperature threshold as a biogeographic barrier innorthern Indian ocean macroalgae. J Phycol. 2006;42(4):749–56.
102. Jombart T. Adegenet: a R package for the multivariate analysis of geneticmarkers. Bioinformatics. 2008;24(11):1403–5.
103. Jombart T, Devillard S, Balloux F. Discriminant analysis of principalcomponents: a new method for the analysis of genetically structuredpopulations. BMC Genet. 2010;11(1):94.
104. Steinig EJ, Neuditschko M, Khatkar MS, Raadsma HW, Zenger KR. NETVIEW P:a network visualization tool to unravel complex population structure usinggenome-wide SNPs. Mol Ecol Resour. 2016;16(1):216–27.
105. Neuditschko M, Khatkar MS, Raadsma HW. NETVIEW: a high-definitionnetwork-visualization approach to detect fine-scale population structuresfrom genome-wide patterns of variation. PLoS One. 2012;7(10):e48375.
106. Tamura K, Stecher G, Peterson D, Filipski A, Kumar S. MEGA6: molecularevolutionary genetics analysis version 6.0. Mol Biol Evol. 2013;30(12):2725–9.
107. Foll M, Gaggiotti O. A genome-scan method to identify selected lociappropriate for both dominant and Codominant markers: a Bayesianperspective. Genetics. 2008;180(2):977–93.
108. Beaumont MA, Nichols RA. Evaluating loci for use in the genetic analysis ofpopulation structure. Proc R Soc B Biol Sci. 1996;263(1377):1619–26.
109. Beaumont MA, Balding DJ. Identifying adaptive genetic divergence amongpopulations from genome scans. Mol Ecol. 2004;13(4):969–80.
110. Foll M. BayeScan v2.1 user manual. Ecology. 2012;20:1450–62.
Al-Breiki et al. BMC Genomics (2018) 19:690 Page 13 of 13