RESEARCH ARTICLE Median fin function during the escape ...glauder/reprints_unzipped/Chadwell... ·...
12
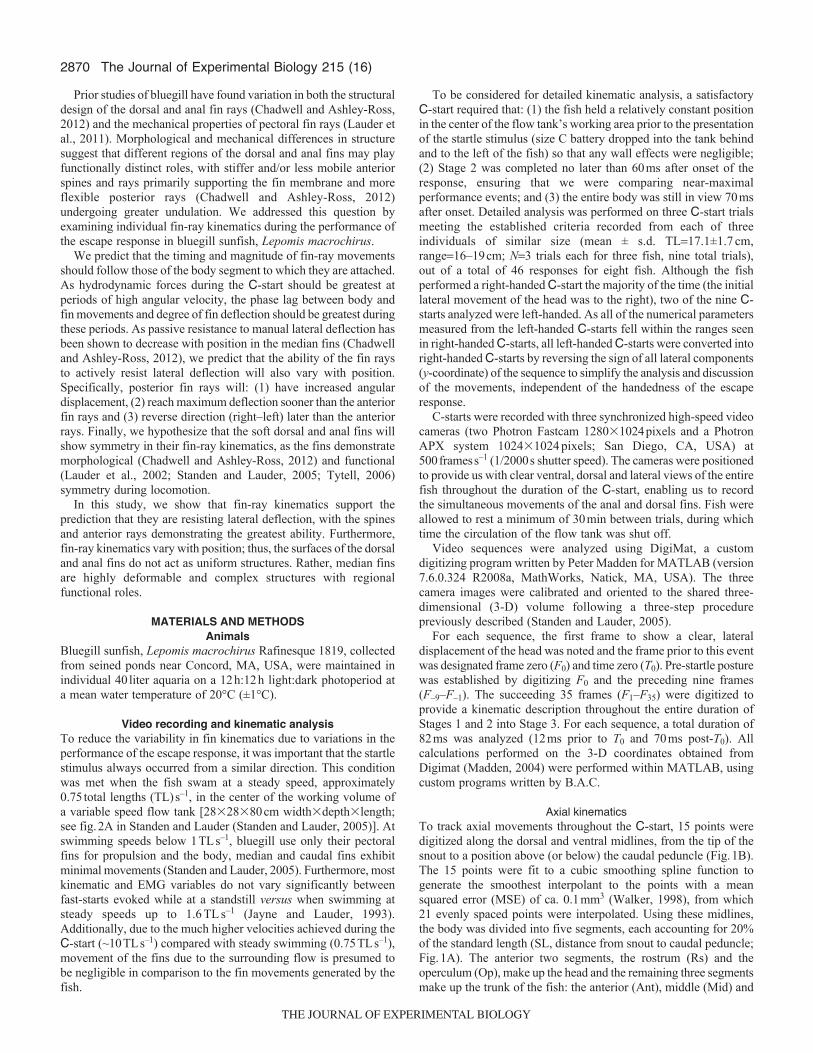
2869 INTRODUCTION Among aquatic predator–prey interactions, the fast-start escape response can determine who eats and who is eaten. Fast-starts are swimming maneuvers associated with the production of high acceleration over a brief period of activity. Most commonly, fast- starts are used to evade predators (Eaton et al., 1977; Webb, 1976; Webb, 1978; Weihs, 1973) and capture prey (Hoogland et al., 1956; Rand and Lauder, 1981; Webb and Skadsen, 1980). However, fast- starts have also been observed in behaviors such as post-feeding turns (Canfield and Rose, 1993) and social interactions (Fernald, 1975). Within the kinematic literature, fast-starts of fish have been classified as either C-starts or S-starts based on the shape the body forms at the end of the initial phase of the behavior (reviewed by Domenici and Blake, 1997; Wakeling, 2001). Although S-starts are used by some fish species during escape responses (Harper and Blake, 1990; Schriefer and Hale, 2004; Spierts and Leeuwen, 1999; Webb, 1976), the majority of fish species studied to date have been described as performing the C-start escape response (Domenici and Blake, 1991; Eaton et al., 1977; Webb, 1978). Regardless of type, fast-starts have been divided into three kinematic stages: a preparatory stroke (Stage 1) in which the long axis of the body bends into the characteristic ‘C’ or ‘S’ shape; a propulsive stroke (Stage 2) that accelerates the fish; and a variable stage (Stage 3) that can include continued swimming strokes, braking maneuvers or simply gliding to a stop (Domenici and Blake, 1997; Weihs, 1973). The majority of kinematic papers on fast-starts describe the stereotypic maneuver of the axial body and tail, paying particular attention to the timing and magnitude of the turning rate of the head, and the overall performance of the center of mass (displacement, maximum velocity and acceleration). Only a few papers make mention of fin movements, with most simply referring to a qualitative observation that the median fins are splayed (elevated) during the behavior (Eaton et al., 1977; Webb, 1977; Webb, 1978). Weihs (Weihs, 1973) suggested that enlarged dorsal and anal fins close to the caudal fin could potentially act as a second tail to enhance performance. During the C-start, the axial body rotates to one side (Stage 1), changes direction and then rotates in the opposite direction (Stage 2). During these rotational phases, we would expect the hydrodynamic forces acting on the median fins to correlate with the angular velocity of the body. Therefore, hydrodynamic forces should be greatest during peak angular rotations (Stages 1 and 2) and lowest during the change in direction of axial rotation (Stage 1 to Stage 2 transition) in which angular velocity decreases until it reaches zero. A recent study using particle image velocimetry demonstrated for the first time that the dorsal and anal fins do in fact contribute a thrust component to the acceleration of the fish (Tytell and Lauder, 2008). However, no studies have addressed the movement of fins and how they may be generating this force. SUMMARY The fast-start escape response is critically important to avoid predation, and axial movements driving it have been studied intensively. Large median dorsal and anal fins located near the tail have been hypothesized to increase acceleration away from the threat, yet the contribution of flexible median fins remains undescribed. To investigate the role of median fins, C-start escape responses of bluegill sunfish (Lepomis macrochirus) were recorded by three high-speed, high-resolution cameras at 500 frames s –1 and the 3-D kinematics of individual dorsal and anal fin rays were analyzed. Movement and orientation of the fin rays relative to the body axis were calculated throughout the duration of the C-start. We found that: (1) timing and magnitude of angular displacement varied among fin rays based on position within the fin and (2) kinematic patterns support the prediction that fin rays are actively resisting hydrodynamic forces and transmitting momentum into the water. We suggest that regions within the fins have different roles. Anterior regions of the fins are rapidly elevated to increase the volume of water that the fish may interact with and transmit force into, thus generating greater total momentum. The movement pattern of all the fin rays creates traveling waves that move posteriorly along the length of the fin, moving water as they do so. Flexible posterior regions ultimately act to accelerate this water towards the tail, potentially interacting with vortices generated by the caudal fin during the C-start. Despite their simple appearance, median fins are highly complex and versatile control surfaces that modulate locomotor performance. Supplementary material available online at http://jeb.biologists.org/cgi/content/full/215/16/2869/DC1 Key words: median fin, 3-D kinematics, fin ray, C-start, escape response. Received 22 November 2011; Accepted 22 April 2012 The Journal of Experimental Biology 215, 2869-2880 © 2012. Published by The Company of Biologists Ltd doi:10.1242/jeb.068585 RESEARCH ARTICLE Median fin function during the escape response of bluegill sunfish (Lepomis macrochirus). I: Fin-ray orientation and movement Brad A. Chadwell 1 , Emily M. Standen 2, *, George V. Lauder 2 and Miriam A. Ashley-Ross 1,† 1 Department of Biology, Box 7325, Wake Forest University, Winston-Salem, NC 27109, USA and 2 Museum of Comparative Zoology, Harvard University, 26 Oxford Street, Cambridge, MA 02138, USA *Present address: Redpath Museum, McGill University, 859 Sherbrooke Street West, Montreal, Quebec, H3A 0C4, Canada † Author for correspondence ([email protected]) THE JOURNAL OF EXPERIMENTAL BIOLOGY
Transcript of RESEARCH ARTICLE Median fin function during the escape ...glauder/reprints_unzipped/Chadwell... ·...
2869
INTRODUCTIONAmong aquatic predator–prey interactions, the fast-start escaperesponse can determine who eats and who is eaten. Fast-starts areswimming maneuvers associated with the production of highacceleration over a brief period of activity. Most commonly, fast-starts are used to evade predators (Eaton et al., 1977; Webb, 1976;Webb, 1978; Weihs, 1973) and capture prey (Hoogland et al., 1956;Rand and Lauder, 1981; Webb and Skadsen, 1980). However, fast-starts have also been observed in behaviors such as post-feedingturns (Canfield and Rose, 1993) and social interactions (Fernald,1975).
Within the kinematic literature, fast-starts of fish have beenclassified as either C-starts or S-starts based on the shape the bodyforms at the end of the initial phase of the behavior (reviewed byDomenici and Blake, 1997; Wakeling, 2001). Although S-starts areused by some fish species during escape responses (Harper andBlake, 1990; Schriefer and Hale, 2004; Spierts and Leeuwen, 1999;Webb, 1976), the majority of fish species studied to date have beendescribed as performing the C-start escape response (Domenici andBlake, 1991; Eaton et al., 1977; Webb, 1978). Regardless of type,fast-starts have been divided into three kinematic stages: apreparatory stroke (Stage 1) in which the long axis of the body bendsinto the characteristic ‘C’ or ‘S’ shape; a propulsive stroke (Stage2) that accelerates the fish; and a variable stage (Stage 3) that can
include continued swimming strokes, braking maneuvers or simplygliding to a stop (Domenici and Blake, 1997; Weihs, 1973).
The majority of kinematic papers on fast-starts describe thestereotypic maneuver of the axial body and tail, paying particularattention to the timing and magnitude of the turning rate of the head,and the overall performance of the center of mass (displacement,maximum velocity and acceleration). Only a few papers makemention of fin movements, with most simply referring to aqualitative observation that the median fins are splayed (elevated)during the behavior (Eaton et al., 1977; Webb, 1977; Webb, 1978).
Weihs (Weihs, 1973) suggested that enlarged dorsal and anal finsclose to the caudal fin could potentially act as a second tail to enhanceperformance. During the C-start, the axial body rotates to one side(Stage 1), changes direction and then rotates in the oppositedirection (Stage 2). During these rotational phases, we would expectthe hydrodynamic forces acting on the median fins to correlate withthe angular velocity of the body. Therefore, hydrodynamic forcesshould be greatest during peak angular rotations (Stages 1 and 2)and lowest during the change in direction of axial rotation (Stage1 to Stage 2 transition) in which angular velocity decreases until itreaches zero. A recent study using particle image velocimetrydemonstrated for the first time that the dorsal and anal fins do infact contribute a thrust component to the acceleration of the fish(Tytell and Lauder, 2008). However, no studies have addressed themovement of fins and how they may be generating this force.
SUMMARYThe fast-start escape response is critically important to avoid predation, and axial movements driving it have been studiedintensively. Large median dorsal and anal fins located near the tail have been hypothesized to increase acceleration away fromthe threat, yet the contribution of flexible median fins remains undescribed. To investigate the role of median fins, C-start escaperesponses of bluegill sunfish (Lepomis macrochirus) were recorded by three high-speed, high-resolution cameras at500framess–1 and the 3-D kinematics of individual dorsal and anal fin rays were analyzed. Movement and orientation of the finrays relative to the body axis were calculated throughout the duration of the C-start. We found that: (1) timing and magnitude ofangular displacement varied among fin rays based on position within the fin and (2) kinematic patterns support the prediction thatfin rays are actively resisting hydrodynamic forces and transmitting momentum into the water. We suggest that regions within thefins have different roles. Anterior regions of the fins are rapidly elevated to increase the volume of water that the fish may interactwith and transmit force into, thus generating greater total momentum. The movement pattern of all the fin rays creates travelingwaves that move posteriorly along the length of the fin, moving water as they do so. Flexible posterior regions ultimately act toaccelerate this water towards the tail, potentially interacting with vortices generated by the caudal fin during the C-start. Despitetheir simple appearance, median fins are highly complex and versatile control surfaces that modulate locomotor performance.
Supplementary material available online at http://jeb.biologists.org/cgi/content/full/215/16/2869/DC1
Key words: median fin, 3-D kinematics, fin ray, C-start, escape response.
Received 22 November 2011; Accepted 22 April 2012
The Journal of Experimental Biology 215, 2869-2880© 2012. Published by The Company of Biologists Ltddoi:10.1242/jeb.068585
RESEARCH ARTICLE
Median fin function during the escape response of bluegill sunfish (Lepomismacrochirus). I: Fin-ray orientation and movement
Brad A. Chadwell1, Emily M. Standen2,*, George V. Lauder2 and Miriam A. Ashley-Ross1,†
1Department of Biology, Box 7325, Wake Forest University, Winston-Salem, NC 27109, USA and 2Museum of Comparative Zoology,Harvard University, 26 Oxford Street, Cambridge, MA 02138, USA
*Present address: Redpath Museum, McGill University, 859 Sherbrooke Street West, Montreal, Quebec, H3A 0C4, Canada†Author for correspondence ([email protected])
THE JOURNAL OF EXPERIMENTAL BIOLOGY
2870
Prior studies of bluegill have found variation in both the structuraldesign of the dorsal and anal fin rays (Chadwell and Ashley-Ross,2012) and the mechanical properties of pectoral fin rays (Lauder etal., 2011). Morphological and mechanical differences in structuresuggest that different regions of the dorsal and anal fins may playfunctionally distinct roles, with stiffer and/or less mobile anteriorspines and rays primarily supporting the fin membrane and moreflexible posterior rays (Chadwell and Ashley-Ross, 2012)undergoing greater undulation. We addressed this question byexamining individual fin-ray kinematics during the performance ofthe escape response in bluegill sunfish, Lepomis macrochirus.
We predict that the timing and magnitude of fin-ray movementsshould follow those of the body segment to which they are attached.As hydrodynamic forces during the C-start should be greatest atperiods of high angular velocity, the phase lag between body andfin movements and degree of fin deflection should be greatest duringthese periods. As passive resistance to manual lateral deflection hasbeen shown to decrease with position in the median fins (Chadwelland Ashley-Ross, 2012), we predict that the ability of the fin raysto actively resist lateral deflection will also vary with position.Specifically, posterior fin rays will: (1) have increased angulardisplacement, (2) reach maximum deflection sooner than the anteriorfin rays and (3) reverse direction (right–left) later than the anteriorrays. Finally, we hypothesize that the soft dorsal and anal fins willshow symmetry in their fin-ray kinematics, as the fins demonstratemorphological (Chadwell and Ashley-Ross, 2012) and functional(Lauder et al., 2002; Standen and Lauder, 2005; Tytell, 2006)symmetry during locomotion.
In this study, we show that fin-ray kinematics support theprediction that they are resisting lateral deflection, with the spinesand anterior rays demonstrating the greatest ability. Furthermore,fin-ray kinematics vary with position; thus, the surfaces of the dorsaland anal fins do not act as uniform structures. Rather, median finsare highly deformable and complex structures with regionalfunctional roles.
MATERIALS AND METHODSAnimals
Bluegill sunfish, Lepomis macrochirus Rafinesque 1819, collectedfrom seined ponds near Concord, MA, USA, were maintained inindividual 40liter aquaria on a 12h:12h light:dark photoperiod ata mean water temperature of 20°C (±1°C).
Video recording and kinematic analysisTo reduce the variability in fin kinematics due to variations in theperformance of the escape response, it was important that the startlestimulus always occurred from a similar direction. This conditionwas met when the fish swam at a steady speed, approximately0.75total lengths (TL)s–1, in the center of the working volume ofa variable speed flow tank [28�28�80cm width�depth�length;see fig.2A in Standen and Lauder (Standen and Lauder, 2005)]. Atswimming speeds below 1TLs–1, bluegill use only their pectoralfins for propulsion and the body, median and caudal fins exhibitminimal movements (Standen and Lauder, 2005). Furthermore, mostkinematic and EMG variables do not vary significantly betweenfast-starts evoked while at a standstill versus when swimming atsteady speeds up to 1.6TLs–1 (Jayne and Lauder, 1993).Additionally, due to the much higher velocities achieved during theC-start (~10TLs–1) compared with steady swimming (0.75TLs–1),movement of the fins due to the surrounding flow is presumed tobe negligible in comparison to the fin movements generated by thefish.
To be considered for detailed kinematic analysis, a satisfactoryC-start required that: (1) the fish held a relatively constant positionin the center of the flow tank’s working area prior to the presentationof the startle stimulus (size C battery dropped into the tank behindand to the left of the fish) so that any wall effects were negligible;(2) Stage 2 was completed no later than 60ms after onset of theresponse, ensuring that we were comparing near-maximalperformance events; and (3) the entire body was still in view 70msafter onset. Detailed analysis was performed on three C-start trialsmeeting the established criteria recorded from each of threeindividuals of similar size (mean ± s.d. TL17.1±1.7cm,range16–19cm; N3 trials each for three fish, nine total trials),out of a total of 46 responses for eight fish. Although the fishperformed a right-handed C-start the majority of the time (the initiallateral movement of the head was to the right), two of the nine C-starts analyzed were left-handed. As all of the numerical parametersmeasured from the left-handed C-starts fell within the ranges seenin right-handed C-starts, all left-handed C-starts were converted intoright-handed C-starts by reversing the sign of all lateral components(y-coordinate) of the sequence to simplify the analysis and discussionof the movements, independent of the handedness of the escaperesponse.
C-starts were recorded with three synchronized high-speed videocameras (two Photron Fastcam 1280�1024pixels and a PhotronAPX system 1024�1024pixels; San Diego, CA, USA) at500framess–1 (1/2000s shutter speed). The cameras were positionedto provide us with clear ventral, dorsal and lateral views of the entirefish throughout the duration of the C-start, enabling us to recordthe simultaneous movements of the anal and dorsal fins. Fish wereallowed to rest a minimum of 30min between trials, during whichtime the circulation of the flow tank was shut off.
Video sequences were analyzed using DigiMat, a customdigitizing program written by Peter Madden for MATLAB (version7.6.0.324 R2008a, MathWorks, Natick, MA, USA). The threecamera images were calibrated and oriented to the shared three-dimensional (3-D) volume following a three-step procedurepreviously described (Standen and Lauder, 2005).
For each sequence, the first frame to show a clear, lateraldisplacement of the head was noted and the frame prior to this eventwas designated frame zero (F0) and time zero (T0). Pre-startle posturewas established by digitizing F0 and the preceding nine frames(F–9–F–1). The succeeding 35 frames (F1–F35) were digitized toprovide a kinematic description throughout the entire duration ofStages 1 and 2 into Stage 3. For each sequence, a total duration of82ms was analyzed (12ms prior to T0 and 70ms post-T0). Allcalculations performed on the 3-D coordinates obtained fromDigimat (Madden, 2004) were performed within MATLAB, usingcustom programs written by B.A.C.
Axial kinematicsTo track axial movements throughout the C-start, 15 points weredigitized along the dorsal and ventral midlines, from the tip of thesnout to a position above (or below) the caudal peduncle (Fig.1B).The 15 points were fit to a cubic smoothing spline function togenerate the smoothest interpolant to the points with a meansquared error (MSE) of ca. 0.1mm3 (Walker, 1998), from which21 evenly spaced points were interpolated. Using these midlines,the body was divided into five segments, each accounting for 20%of the standard length (SL, distance from snout to caudal peduncle;Fig.1A). The anterior two segments, the rostrum (Rs) and theoperculum (Op), make up the head and the remaining three segmentsmake up the trunk of the fish: the anterior (Ant), middle (Mid) and
The Journal of Experimental Biology 215 (16)
THE JOURNAL OF EXPERIMENTAL BIOLOGY

2871Median fin kinematics in bluegill
posterior (Post) segments. This was done in order to compare theorientation and movement of the fins relative to the body segmentto which they are attached, e.g. the spiny dorsal fin is primarilyattached to Ant and the soft dorsal and anal fins are connected toMid (Fig.1B).
For each time point (t) of the sequence, the three orthogonal planesand their corresponding axes (note that the axes are normal to theirplane) were defined for each body segment: transverse (TrSeg(t)),sagittal (SgSeg(t)) and frontal (FrSeg(t)), where Seg represents the bodysegment of interest (Fig.1A). Relative to the X,Y,Z-coordinate
system of the tank, the yaw (rotation about the FrSeg(t)-axis), pitch(rotation about the SgSeg(t)-axis) and roll (rotation about the TrSeg(t)-axis) angles could be defined and tracked over time for each bodysegment.
Axial rotationFitting the angle of yaw, t, from each time point to a quinticsmoothing spline function (MSE2.5deg), the first time derivativeof yaw, �t, over the duration of the sequence, provided the turningrate (angular velocity, d/dt). A positive turning rate (�t>0) indicatesa counterclockwise lateral rotation of the body about FrSeg(t), witha clockwise rotation resulting in a negative turning rate (�t<0). Acounterclockwise rotation of the head, Rs and Op, are to the leftside, but because the axis of rotation of the body lies near the centerof mass, a counterclockwise rotation of the trunk segments, Ant,Mid and Post, are to the fish’s right side. Thus, when the head andtrunk both rotate to the same side of the fish, the sign of �t for thehead and trunk segments are reversed. A change in the sign of �tindicates a rotational transition of the body segment, i.e. a changein direction.
The turning rate of the rostrum, �t, was used to determine thestages of the escape response, according to standard definitions(Domenici and Blake, 1997). Stage 1 (S1) is the period from T0 tothe time of the first rotational transition (t�tr1), and Stage 2 (S2) isthe period from t�tr1 to the second rotational transition (t�tr2). Asthe rotational transitions of the rostrum define the C-start, t�tr1 andt�tr2 will often be referenced within the text as the S1/S2 and S2/S3transitions, respectively.
To compare the rotation/movement of the fins and their fin rayswith the movement of their respective trunk segments, five kinematicvariables from �t for Ant and Mid segments were measured: t�max1and �max1, the time and magnitude, respectively, of the maximumturning rate during the initial rotation of the body segments; t�tr,the time of rotational transition; and t�max2 and �max2, the time andmagnitude, respectively, of the maximum turning rate during thesecond rotation of the body segments.
Center of massAs this was not a terminal study, the centers of mass for each ofthe fish used in this study were not measured. Therefore, the locationof the centers of mass of several preserved specimens similar inbody size to the fish used in this study were measured using theplumb-line method (Vogel, 2003). Among these specimens, theaverage stretched-straight center of mass (ssCOM) was located justbehind and above the ‘ear’ of the operculum (Fig.1) at a longitudinalposition of ca. 35% of SL and at a lateral depth of ca. 33% of thebody at that position. For each digitized frame, the position relativeto the two midlines that matched the corresponding percent valueswas used as the 3-D coordinates for the estimated ssCOM of theexperimental fish, allowing tracking of a consistent point on thefish’s body. The ssCOM coordinates from each time point were fitto a quintic smoothing spline function (MSE0.125mm3), allowingfor the calculation of displacement, velocity and acceleration ofssCOM over the duration of the C-start. At each time point, thevelocity and acceleration of ssCOM was divided into the componentsparallel and perpendicular to the trajectory of the head at thatmoment, i.e. TrRs(t). The components of velocity and accelerationof ssCOM parallel with the heading of the fish are represented byvt and at, respectively. From the quintic spline, five variables werecalculated: displacement of ssCOM at the ends of Stages 1 and 2(DS1 and DS2); the maximum velocity achieved during the C-start(vmax); and the two peak accelerations (amax1 and amax2).
ssCOM
Pc
Pv
Cd
Rs Mid PostAntOp
v
s pd
A
Tr
FrMid
Mid SgMid
Head Trunk
BDSp1
DSp7DSp4 DRy2
DRy8
DRy5
ASp1 ARy2
ARy8
ARy5
DSp10
ASp3
‘ear’
spD
DF
AF
sfD
Fig.1. The bluegill sunfish, Lepomis macrochirus. (A)Illustration of thebluegill. Unpaired median fins: dorsal fins (DF), composed of twodevelopmentally separate fins, the spiny dorsal (spD) and soft dorsal (sfD)fins; anal fin (AF); and caudal fin (Cd). Paired fins: pectoral (Pc) and pelvic(Pv). Fin supports of DF and AF are shown: spines (thick, solid lines) andrays (thin, dashed lines). The body was divided into five equal segments[20% of the body length from the tip of the snout (s) to the caudal peduncle(pd)]: the rostrum (Rs) and operculum (Op), which comprise the head, andthe anterior (Ant), middle (Mid) and posterior (Post) segments of the trunk.Orthogonal axes and planes of the body are shown only for the Midsegment: transverse (TrMid; grey plane), sagittal (SgMid; orange plane) andfrontal (FrMid; plane not shown). Note that the axes are normal to theircorresponding planes. Other symbols: position of the stretched-straightcenter of mass (ssCOM) indicated by the corresponding symbol, ʻearʼ ofthe operculum and vent (v). (B)Still image of the bluegill sunfish. Yellowdots represent the approximate location of the 15 points used to define thedorsal and ventral midlines. Orange lines indicate the digitized fin rays andthe approximate location of the four to six points (white dots) used to defineeach fin ray. The associated text identifies each fin ray based on itslocation: dorsal (D) versus anal (A), fin-ray type, spine (Sp) versus ray(Ry), and numbered position within the respective fin. A�DRy5� representsthe fin area between rays DRy5 and DRy8.
THE JOURNAL OF EXPERIMENTAL BIOLOGY
2872
Fin kinematicsFour spines and four rays from the dorsal fins and two spines andfour rays from the anal fin were selected for digitizing (Fig.1B).Throughout the paper, the term ‘fin ray’ is used to refer to all externalskeletal fin supports when the distinction between spines and rays isdisregarded. Six points (four in the case of DSp1; Fig.1B) weredigitized along the posterior edge of the selected fin rays, startingproximally at the point at which the fin ray first appears from theskin and musculature and ending at the distal tip. For each fin ray,the six (or four) points were fit to a cubic smoothing spline function(MSE0.1mm3) and 21 equally spaced points along the length of thefin ray curve were interpolated. Thus, point numbers represent thesame relative position along the length of each fin ray, e.g. point 1of all fin rays represents the 0% position, with each successive pointmoving distally at 5% intervals along the length of the fin-ray curve.
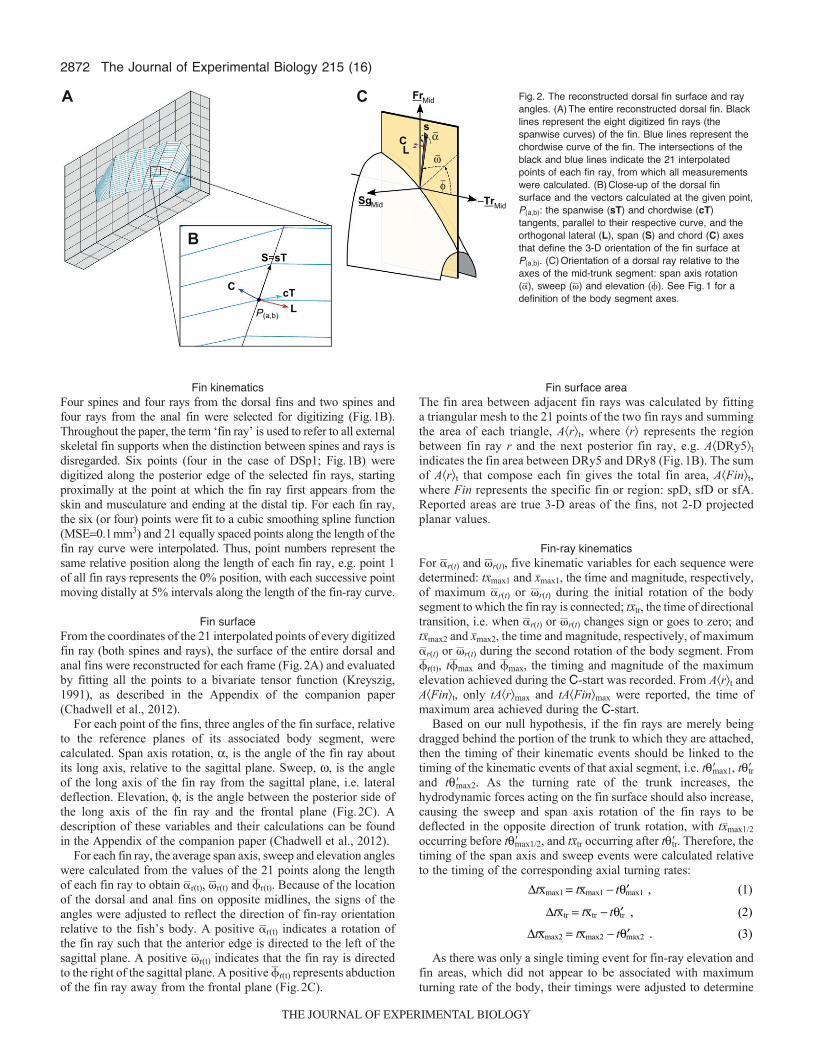
Fin surfaceFrom the coordinates of the 21 interpolated points of every digitizedfin ray (both spines and rays), the surface of the entire dorsal andanal fins were reconstructed for each frame (Fig.2A) and evaluatedby fitting all the points to a bivariate tensor function (Kreyszig,1991), as described in the Appendix of the companion paper(Chadwell et al., 2012).
For each point of the fins, three angles of the fin surface, relativeto the reference planes of its associated body segment, werecalculated. Span axis rotation, , is the angle of the fin ray aboutits long axis, relative to the sagittal plane. Sweep, , is the angleof the long axis of the fin ray from the sagittal plane, i.e. lateraldeflection. Elevation, , is the angle between the posterior side ofthe long axis of the fin ray and the frontal plane (Fig.2C). Adescription of these variables and their calculations can be foundin the Appendix of the companion paper (Chadwell et al., 2012).
For each fin ray, the average span axis, sweep and elevation angleswere calculated from the values of the 21 points along the lengthof each fin ray to obtain �r(t), �r(t) and �r(t). Because of the locationof the dorsal and anal fins on opposite midlines, the signs of theangles were adjusted to reflect the direction of fin-ray orientationrelative to the fish’s body. A positive �r(t) indicates a rotation ofthe fin ray such that the anterior edge is directed to the left of thesagittal plane. A positive �r(t) indicates that the fin ray is directedto the right of the sagittal plane. A positive �r(t) represents abductionof the fin ray away from the frontal plane (Fig.2C).
Fin surface areaThe fin area between adjacent fin rays was calculated by fittinga triangular mesh to the 21 points of the two fin rays and summingthe area of each triangle, A�r�t, where �r� represents the regionbetween fin ray r and the next posterior fin ray, e.g. A�DRy5�tindicates the fin area between DRy5 and DRy8 (Fig.1B). The sumof A�r�t that compose each fin gives the total fin area, A�Fin�t,where Fin represents the specific fin or region: spD, sfD or sfA.Reported areas are true 3-D areas of the fins, not 2-D projectedplanar values.
Fin-ray kinematicsFor �r(t) and �r(t), five kinematic variables for each sequence weredetermined: txmax1 and xmax1, the time and magnitude, respectively,of maximum �r(t) or �r(t) during the initial rotation of the bodysegment to which the fin ray is connected; txtr, the time of directionaltransition, i.e. when �r(t) or �r(t) changes sign or goes to zero; andtxmax2 and xmax2, the time and magnitude, respectively, of maximum�r(t) or �r(t) during the second rotation of the body segment. From�r(t), t�max and �max, the timing and magnitude of the maximumelevation achieved during the C-start was recorded. From A�r�t andA�Fin�t, only tA�r�max and tA�Fin�max were reported, the time ofmaximum area achieved during the C-start.
Based on our null hypothesis, if the fin rays are merely beingdragged behind the portion of the trunk to which they are attached,then the timing of their kinematic events should be linked to thetiming of the kinematic events of that axial segment, i.e. t�max1, t�trand t�max2. As the turning rate of the trunk increases, thehydrodynamic forces acting on the fin surface should also increase,causing the sweep and span axis rotation of the fin rays to bedeflected in the opposite direction of trunk rotation, with txmax1/2occurring before t�max1/2, and txtr occurring after t�tr. Therefore, thetiming of the span axis and sweep events were calculated relativeto the timing of the corresponding axial turning rates:
As there was only a single timing event for fin-ray elevation andfin areas, which did not appear to be associated with maximumturning rate of the body, their timings were adjusted to determine
Δ = − ′θt t tx x , (1)max1 max1 max1
Δ = − ′θt t tx x , (2)tr tr tr
Δ = − ′θt t tx x . (3)max2 max2 max2
The Journal of Experimental Biology 215 (16)
–TrMid
FrMid
SgMid
C
C cT
P(a,b)
S=sT
L
L
s
ω–
α–
φ–
A C
B
Fig.2. The reconstructed dorsal fin surface and rayangles. (A)The entire reconstructed dorsal fin. Blacklines represent the eight digitized fin rays (thespanwise curves) of the fin. Blue lines represent thechordwise curve of the fin. The intersections of theblack and blue lines indicate the 21 interpolatedpoints of each fin ray, from which all measurementswere calculated. (B)Close-up of the dorsal finsurface and the vectors calculated at the given point,P(a,b): the spanwise (sT) and chordwise (cT)tangents, parallel to their respective curve, and theorthogonal lateral (L), span (S) and chord (C) axesthat define the 3-D orientation of the fin surface atP(a,b). (C)Orientation of a dorsal ray relative to theaxes of the mid-trunk segment: span axis rotation(�), sweep (�) and elevation (�). See Fig.1 for adefinition of the body segment axes.
THE JOURNAL OF EXPERIMENTAL BIOLOGY
2873Median fin kinematics in bluegill
whether the time of maximum elevation and area occurred beforeor after the change in rotational direction of the body segment:
Statistical analysisTo test for systematic differences in the C-start performances of thethree fish, a one-way multivariate analysis of covariance(MANCOVA) was performed on the 19 axial and ssCOM kinematicvariables, using total duration of Stages 1 and 2 (t�tr2) as thecovariate.
Excluding ASp1, each digitized fin ray was assigned to one ofthree groups based on the fin it supported (Fig.1). The last spineof the dorsal and anal fins (DSp10 and ASp3, respectively) provides
Δ = − ′θtA Fin tA Fin t . (6)max max tr
Δ φ = φ − ′θt t t , (4)max max tr
Δ = − ′θtA r tA r t , (5)max max tr
the anterior-most support of the soft region of the fins and both areincluded in the analyses of sfD and sfA. When referring to the finrays of the sfD and sfA groups collectively, the two spines will bereferred to as Sp0, due to the discrepancy in their number, and therays, which are numbered the same, will be referred to as Ry2, Ry5,Ry8 and Ry12.
Although each fin ray is actuated by individual musculature andis capable of independent movement, it is likely that its orientationand movement is influenced by neighboring fin rays because of theirconnection via the fin membrane. Therefore, ANOVAs weredeemed inappropriate to test for differences in kinematics betweenfin rays within the fins. Instead, the position effect within each fingroup was tested using Friedman’s method for randomized blocks(2), using each fish as a block and the fin rays within each groupas the treatment levels (Sokal and Rohlf, 1981; Zar, 1984).
To avoid any pseudo-replication from using multiple sequencesfrom each fish, the average value of each kinematic variable wascalculated and ranked between fin rays within each group. Theranked average values from each of the three fish were then testedfor a position effect in the average timing and magnitude of the fin-ray kinematics. As it is commonly considered that a fast-start escaperesponse requires maximum performance, and the raw values forfin kinematics determine the interaction with the surrounding water,we deemed it important to measure the absolute maxima for eachfin-ray parameter. Therefore, we recorded the overall maximummagnitude of each parameter for each fish, and tested the positioneffect for the ranked maxima of the three fish.
As a means to easily assess the degree of agreement between thethree fish for each variable, Kendall’s coefficient of concordance(W) was also calculated (Sokal and Rohlf, 1981; Zar, 1984). Todetermine whether any significant position effects observed withinboth sfD and sfA were conserved between the two groups,multigroup coefficients of concordance (�) were computed (Zar,1984).
Wilk’s , Friedman’s 2 and Kendall’s W and their associatedP-values were calculated using SPSS v16.0 (IBM, Armonk, NY,USA); a custom program, based on the equations of Zar (Zar, 1984),was written in MATLAB to calculate � and its Z-score. To controlfor Type I errors resulting from multiple comparisons of the 18variables of each fin group, P-values were compared with corrected-levels using a sequential Bonferroni adjustment (Rice, 1989).
RESULTSC-start performance
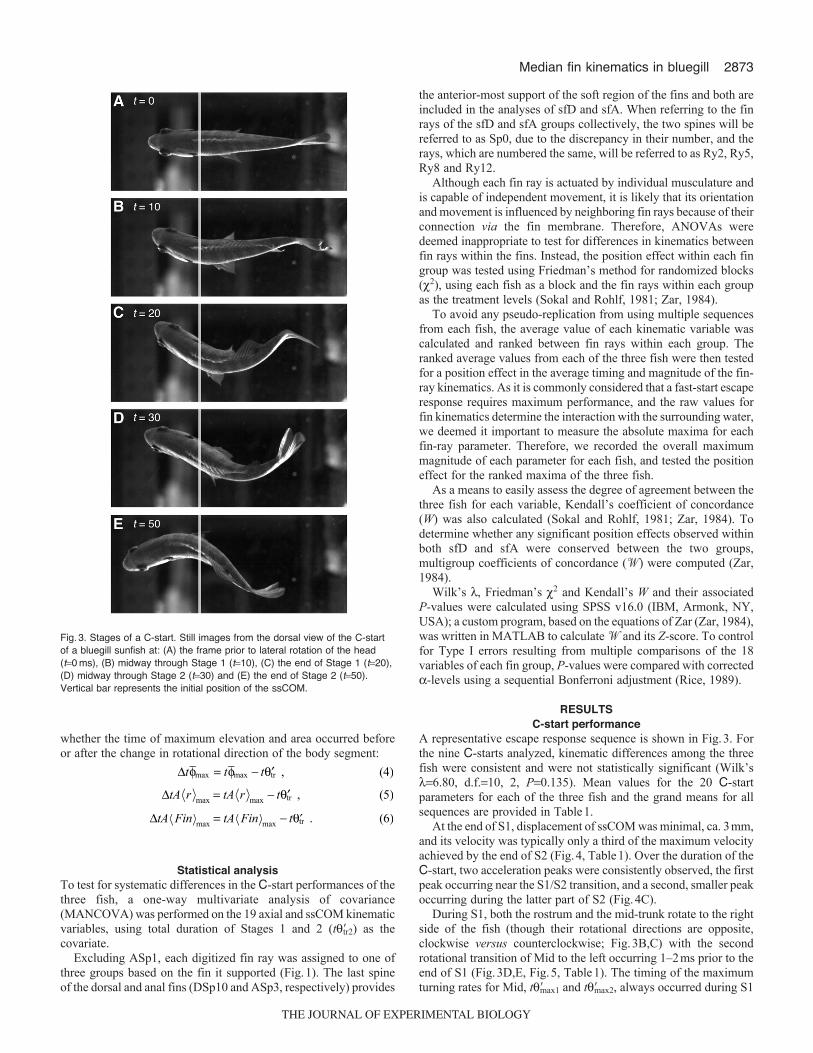
A representative escape response sequence is shown in Fig.3. Forthe nine C-starts analyzed, kinematic differences among the threefish were consistent and were not statistically significant (Wilk’s6.80, d.f.10, 2, P0.135). Mean values for the 20 C-startparameters for each of the three fish and the grand means for allsequences are provided in Table1.
At the end of S1, displacement of ssCOM was minimal, ca. 3mm,and its velocity was typically only a third of the maximum velocityachieved by the end of S2 (Fig.4, Table1). Over the duration of theC-start, two acceleration peaks were consistently observed, the firstpeak occurring near the S1/S2 transition, and a second, smaller peakoccurring during the latter part of S2 (Fig.4C).
During S1, both the rostrum and the mid-trunk rotate to the rightside of the fish (though their rotational directions are opposite,clockwise versus counterclockwise; Fig.3B,C) with the secondrotational transition of Mid to the left occurring 1–2ms prior to theend of S1 (Fig.3D,E, Fig.5, Table1). The timing of the maximumturning rates for Mid, t�max1 and t�max2, always occurred during S1
Fig.3. Stages of a C-start. Still images from the dorsal view of the C-startof a bluegill sunfish at: (A) the frame prior to lateral rotation of the head(t0 ms), (B) midway through Stage 1 (t10), (C) the end of Stage 1 (t20),(D) midway through Stage 2 (t30) and (E) the end of Stage 2 (t50).Vertical bar represents the initial position of the ssCOM.
THE JOURNAL OF EXPERIMENTAL BIOLOGY

2874
and S2, respectively. In the sequence shown, a third rotationaltransition of Mid, back to the right, occurs several milliseconds priorto the end of S2 (Fig.5C); however, this was not observed amongall sequences (data not shown). Although the timing of the rostrumand mid-trunk were closely coordinated, rotation of the anterior trunkwas delayed, with little rotation occurring until midway through S1,at which point it rotated clockwise to the fish’s left with t�tr occurringmidway through S2 (Fig.5B). Timing of the maximum turning ratesof Ant, t�max1 and t�max2, was nearly concurrent with the S1/S2 andS2/S3 transitions (Fig.5B, Table1).
Fin-ray kinematicsThe mean and maximum kinematic values for each parameter byfish can be found in the supplementary material. Data for the spinesof the spD group can be found in supplementary material TableS1,and the data for the rays of the soft fins are reported in supplementarymaterial TablesS2 (sfD) and S3 (sfA).
Spiny dorsal finAt the onset of the C-start, the spines of the dorsal fin underwenta lateral sweep to the right of the fish with maximum sweep anglesoccurring 3–15ms prior to the first maximum turning rate, t�max1(Fig.6A–D, Fig.7A, supplementary material TableS1).Concurrently, a rapid increase in elevation and fin surface areausually preceded any appreciable rotation by the anterior trunk;t�max, tA�r�max and tA�spD�max of the spines all preceded t�trwith such little difference between spines that they occurred almostsimultaneously (Fig.8A,C, supplementary material TableS1). AsS1 proceeded, a chordwise cupping of the spiny dorsal fin occurredsynchronous with a lateral bending of the anterior trunk as theanterior and posterior regions of the fin underwent span axis rotationsin opposite directions (anterior spines clockwise, posteriorcounterclockwise), with concavity for both the fin and body directedto the right (Fig.3C, Fig.6F–I, Fig.7F,G).
By the end of S1 most spines had undergone a directional sweeptransition and were now at a sweep angle oriented towards the leftof the fish, although Ant was still undergoing its initial rotation tothe left (Fig.7C), which persisted throughout the majority of S2
(Fig.6A–D). With the exception of DSp10, maximum sweep to theleft by the anterior three spines always preceded t�max2 by severalmilliseconds (Fig.7D). Midway through S2, span axis rotationunderwent a direction transition followed by a second chordwisecupping of the fin, matching the lateral bend of the anterior trunk,directed towards the left (Fig.3E, Fig.6F–I, Fig.7I,J). Elevation andfin area during S2 was highly variable between sequences, eithermaintaining the same degree of elevation/fin area or depressing thespines/decreasing fin area, which may or may not be followed bya second elevation and increase of fin area (data not shown).
The Journal of Experimental Biology 215 (16)
Table1. Escape response kinematic parameters by fish
Axial region Parameter Fish A Fish B Fish C Grand mean
ssCOM DS1 (mm) 3.1±1.30 2.7±1.08 2.1±1.11 2.6±1.09DS2 (mm) 35.7±7.20 29.4±4.03 33.1±3.66 32.7±5.30
vmax (ms–1) 1.1±0.18 1.5±0.18 1.5±0.11 1.4±0.24amax1 (ms–2) 66.9±11.7 55.6±4.53 58.4±2.23 60.3±8.15amax2 (ms–2) 37.3±17.1 47.3±6.87 45.1±10.5 43.2±11.6
Rostrum t�tr1 (ms) 23.3±1.15 21.0±3.61 20.7±1.53 21.7±2.40S2 (ms) 32.0±4.00 24.7±4.04 29.7±2.31 28.8±4.47t�tr2 (ms) 55.3±4.16 45.7±0.58 50.3±2.52 50.4±4.85
�max1 (degms–1) –3.3±0.17 –4.0±0.08 –3.5±0.19 –3.6±0.35�max2 (degms–1) 1.4±0.59 3.1±0.18 3.0±0.39 2.5±0.88
Ant-trunk t�max1 (ms) 23.7±1.53 21.7±3.21 21.7±1.53 22.3±2.18�max1 (degms–1) –2.4±0.16 –2.7±0.19 –2.5±0.36 –2.5±0.26
t�tr (ms) 40.7±3.51 35.3±4.62 36.3±0.58 37.4±3.81t�max2 (ms) 56.3±7.09 45.0±4.36 49.0±1.73 50.1±6.55
�max2 (degms–1) 1.1±0.48 2.3±0.15 2.6±0.42 2.0±0.77Mid-trunk t�max1 (ms) 12.3±1.15 11.3±1.15 11.0±1.00 11.6±1.13
�max1 (degms–1) 1.5±0.03 1.5±0.07 1.4±0.12 1.5±0.08t�tr (ms) 19.7±0.58 17.7±2.52 18.0±1.00 18.4±1.67
t�max2 (ms) 33.0±1.00 29.7±3.51 29.0±1.00 30.6±2.65�max2 (degms–1) –3.1±0.23 –3.6±0.32 –3.2±0.45 –3.3±0.36
Axial region indicates the region from which the C-start parameters were calculated. See Materials and methods for a description of the parameters. Values aremeans ±1 s.d., N3 sequences for each fish.
B
C
A
DS1T0
S1 S2
DS2
vmax
amax1amax2
–10 0 10 20 30 40 50 60
Acc
eler
atio
n (m
s–2)
Vel
ocity
(ms–1
)
Time (ms)
60
6040
40
20
20
0
0
0
–20
1.01.5
0.5
Dis
plac
emen
t (m
m)
Fig.4. Center of mass kinematics throughout a C-start. (A)Displacement.DS1 and DS2, ssCOM displacement at the end of Stages 1 and 2,respectively. (B)Velocity. vmax, maximum ssCOM velocity achieved duringthe two stages. (C)Acceleration. amax1 and amax2, the two peak ssCOMaccelerations during the two stages. In all panels, the light gray regionindicates the period of Stage 1 (S1), starting from T0 (onset of C-start), andthe darker gray region indicates the period of Stage 2 (S2). All timesequences shown are from the same fish.
THE JOURNAL OF EXPERIMENTAL BIOLOGY
2875Median fin kinematics in bluegill
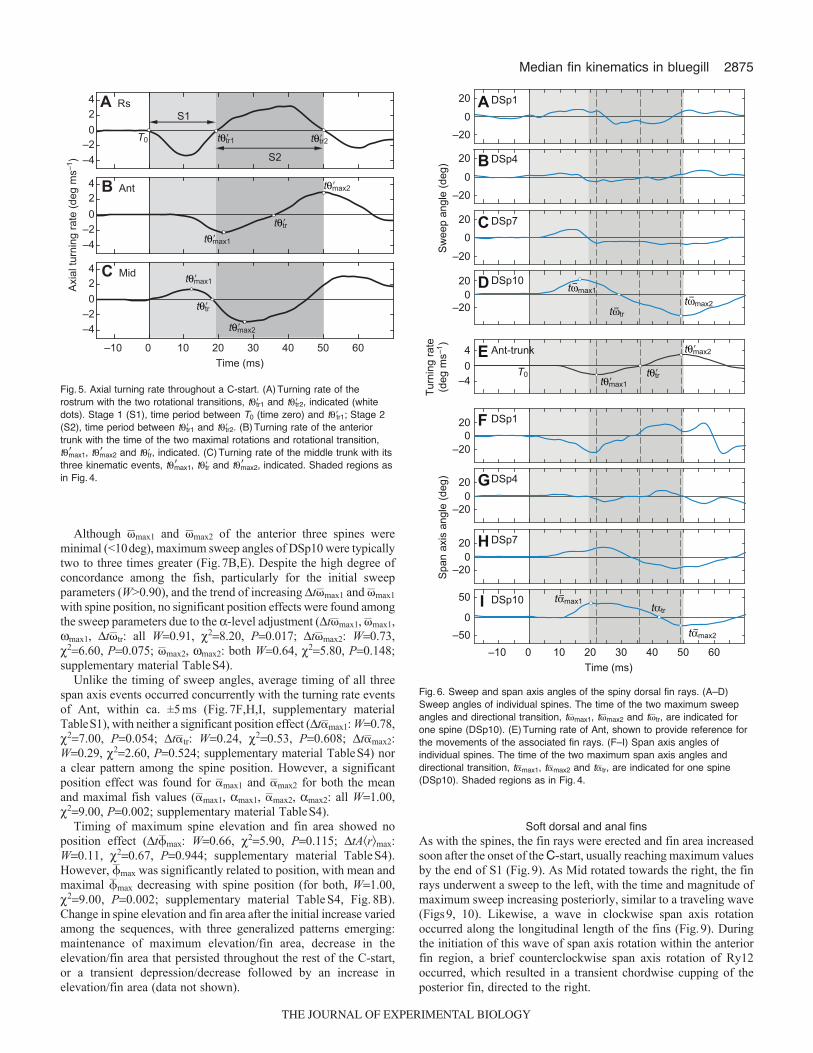
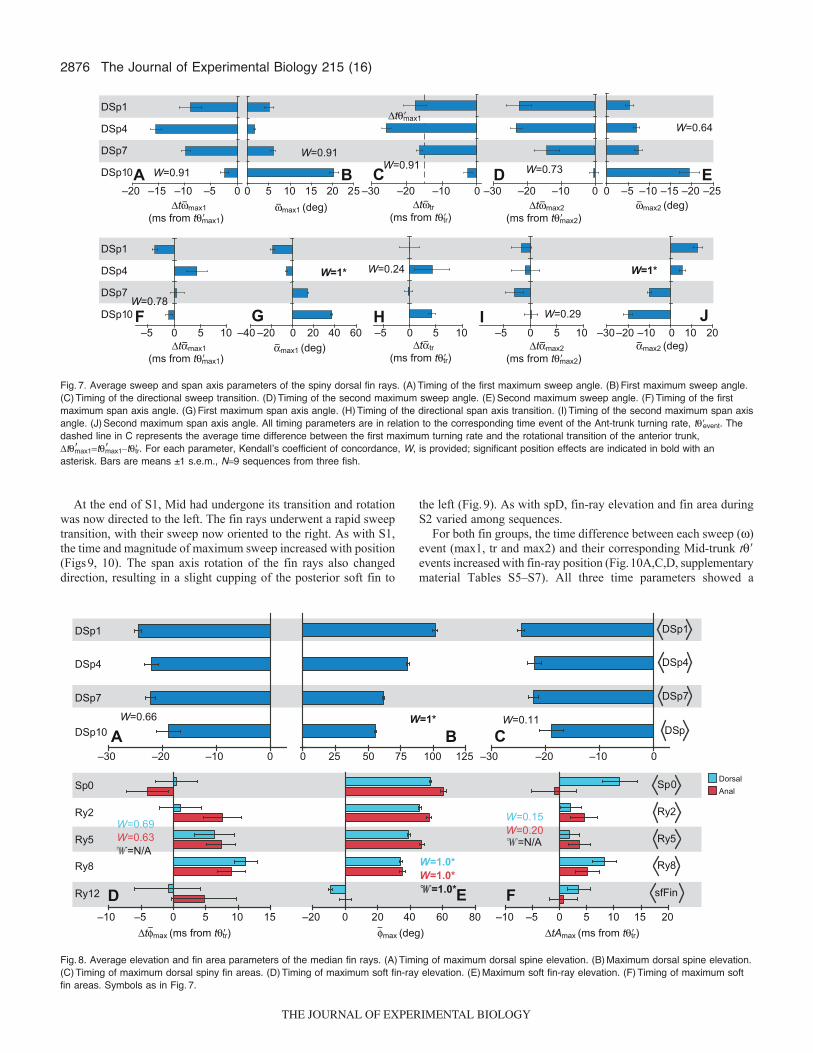
Although �max1 and �max2 of the anterior three spines wereminimal (<10deg), maximum sweep angles of DSp10 were typicallytwo to three times greater (Fig.7B,E). Despite the high degree ofconcordance among the fish, particularly for the initial sweepparameters (W>0.90), and the trend of increasing t�max1 and �max1with spine position, no significant position effects were found amongthe sweep parameters due to the -level adjustment (t�max1, �max1,max1, t�tr: all W0.91, 28.20, P0.017; t�max2: W0.73,26.60, P0.075; �max2, max2: both W0.64, 25.80, P0.148;supplementary material TableS4).
Unlike the timing of sweep angles, average timing of all threespan axis events occurred concurrently with the turning rate eventsof Ant, within ca. ±5ms (Fig.7F,H,I, supplementary materialTableS1), with neither a significant position effect (t�max1: W0.78,27.00, P0.054; t�tr: W0.24, 20.53, P0.608; t�max2:W0.29, 22.60, P0.524; supplementary material TableS4) nora clear pattern among the spine position. However, a significantposition effect was found for �max1 and �max2 for both the meanand maximal fish values (�max1, max1, �max2, max2: all W1.00,29.00, P0.002; supplementary material TableS4).
Timing of maximum spine elevation and fin area showed noposition effect (t�max: W0.66, 25.90, P0.115; tA�r�max:W0.11, 20.67, P0.944; supplementary material TableS4).However, �max was significantly related to position, with mean andmaximal �max decreasing with spine position (for both, W1.00,29.00, P0.002; supplementary material TableS4, Fig.8B).Change in spine elevation and fin area after the initial increase variedamong the sequences, with three generalized patterns emerging:maintenance of maximum elevation/fin area, decrease in theelevation/fin area that persisted throughout the rest of the C-start,or a transient depression/decrease followed by an increase inelevation/fin area (data not shown).
Soft dorsal and anal finsAs with the spines, the fin rays were erected and fin area increasedsoon after the onset of the C-start, usually reaching maximum valuesby the end of S1 (Fig.9). As Mid rotated towards the right, the finrays underwent a sweep to the left, with the time and magnitude ofmaximum sweep increasing posteriorly, similar to a traveling wave(Figs9, 10). Likewise, a wave in clockwise span axis rotationoccurred along the longitudinal length of the fins (Fig.9). Duringthe initiation of this wave of span axis rotation within the anteriorfin region, a brief counterclockwise span axis rotation of Ry12occurred, which resulted in a transient chordwise cupping of theposterior fin, directed to the right.
B Ant
C Mid
A Rs
Axi
al tu
rnin
g ra
te (d
eg m
s–1)
S1
T0
`
`
0
0
0
4
4
4
–4
–4
–4
2
2
2
–2
–2
–2S2
tθ�max1
tθ�max1
tθ�max2
tθ�max2
tθ�tr
tθ�tr
–10 0 10 20 30 40 50 60Time (ms)
tθ�tr1 tθ�tr2
Fig.5. Axial turning rate throughout a C-start. (A)Turning rate of therostrum with the two rotational transitions, t�tr1 and t�tr2, indicated (whitedots). Stage 1 (S1), time period between T0 (time zero) and t�tr1; Stage 2(S2), time period between t�tr1 and t�tr2. (B)Turning rate of the anteriortrunk with the time of the two maximal rotations and rotational transition,t�max1, t�max2 and t�tr, indicated. (C)Turning rate of the middle trunk with itsthree kinematic events, t�max1, t�tr and t�max2, indicated. Shaded regions asin Fig.4.
DSp1A
B
C
D
E
F
G
H
I
DSp4
DSp7
DSp10
Ant-trunk
DSp1
DSp4
DSp7
DSp10
T0
0
50
–200
20
–50
–200
20
–200
20
–200
20
–20
0
20
–20
0
20
–20
0
20
–404
Turn
ing
rate
(d
eg m
s–1)
Sw
eep
angl
e (d
eg)
Spa
n ax
is a
ngle
(deg
)
tθ�max1
tθ�max2
–10 0 10 20 30 40 50 60Time (ms)
tθ�tr
tαtr
tαmax2–
tαmax1–
tωtr– tωmax2
–tωmax1–
Fig.6. Sweep and span axis angles of the spiny dorsal fin rays. (A–D)Sweep angles of individual spines. The time of the two maximum sweepangles and directional transition, t�max1, t�max2 and t�tr, are indicated forone spine (DSp10). (E)Turning rate of Ant, shown to provide reference forthe movements of the associated fin rays. (F–I) Span axis angles ofindividual spines. The time of the two maximum span axis angles anddirectional transition, t�max1, t�max2 and t�tr, are indicated for one spine(DSp10). Shaded regions as in Fig.4.
THE JOURNAL OF EXPERIMENTAL BIOLOGY
2876
At the end of S1, Mid had undergone its transition and rotationwas now directed to the left. The fin rays underwent a rapid sweeptransition, with their sweep now oriented to the right. As with S1,the time and magnitude of maximum sweep increased with position(Figs9, 10). The span axis rotation of the fin rays also changeddirection, resulting in a slight cupping of the posterior soft fin to
the left (Fig.9). As with spD, fin-ray elevation and fin area duringS2 varied among sequences.
For both fin groups, the time difference between each sweep ()event (max1, tr and max2) and their corresponding Mid-trunk t�events increased with fin-ray position (Fig.10A,C,D, supplementarymaterial Tables S5–S7). All three time parameters showed a
The Journal of Experimental Biology 215 (16)
FW=0.78
100–5 5G
W=1*
–20 200–40 40 60H
W=0.24
100–5 5I W=0.29
100–5 5J
W=1*
–20 –10 0–30 10 20
DSp1
DSp4
DSp7
DSp10
C–20 –10 0–30
W=0.91
–20 –10 0–15 –5A B
20100 155 25
W=0.91
W=0.91 D–20 –10 0–30
W=0.73 E
W=0.64
–20–100 –5 –15 –25
DSp1
DSp4
DSp7
DSp10
ωmax1 (deg) ∆tωmax1(ms from tθ�max1)
– ∆tωmax2(ms from tθ�max2)
∆tθ�max1
– ωmax2 (deg) –∆tωtr(ms from tθ�tr)
––
αmax1 (deg) ∆tαmax1(ms from tθ�max1)
– ∆tαmax2(ms from tθ�max2)
– αmax2 (deg) –∆tαtr(ms from tθ�tr)
––
2010 155–5
Sp0
Ry2
Ry5
sfFin
Ry8
W=0.15W=0.20
F0–10
D
W=0.63W=0.69
�=N/A�=N/A
–10 0–5 155
DorsalAnal
10 0 20
W=1.0*
�=1.0*W=1.0*
E–20 40 60 80
Sp0
Ry2
Ry5
Ry12
Ry8
BW=1*
50 1000 75 12525–20 –10 0–30
W=0.66
A CW=0.11
–20 –10 0–30
DSp1
DSp4
DSp7
DSp10
DSp1
DSp4
DSp7
DSp
∆tφmax (ms from tθ�tr) – ∆tAmax (ms from tθ�tr) φmax (deg) –
Fig.7. Average sweep and span axis parameters of the spiny dorsal fin rays. (A)Timing of the first maximum sweep angle. (B)First maximum sweep angle.(C)Timing of the directional sweep transition. (D)Timing of the second maximum sweep angle. (E)Second maximum sweep angle. (F)Timing of the firstmaximum span axis angle. (G)First maximum span axis angle. (H)Timing of the directional span axis transition. (I)Timing of the second maximum span axisangle. (J)Second maximum span axis angle. All timing parameters are in relation to the corresponding time event of the Ant-trunk turning rate, t�event. Thedashed line in C represents the average time difference between the first maximum turning rate and the rotational transition of the anterior trunk,t�max1t�max1–t�tr. For each parameter, Kendallʼs coefficient of concordance, W, is provided; significant position effects are indicated in bold with anasterisk. Bars are means ±1 s.e.m., N9 sequences from three fish.
Fig.8. Average elevation and fin area parameters of the median fin rays. (A)Timing of maximum dorsal spine elevation. (B)Maximum dorsal spine elevation.(C)Timing of maximum dorsal spiny fin areas. (D)Timing of maximum soft fin-ray elevation. (E)Maximum soft fin-ray elevation. (F)Timing of maximum softfin areas. Symbols as in Fig.7.
THE JOURNAL OF EXPERIMENTAL BIOLOGY

2877Median fin kinematics in bluegill
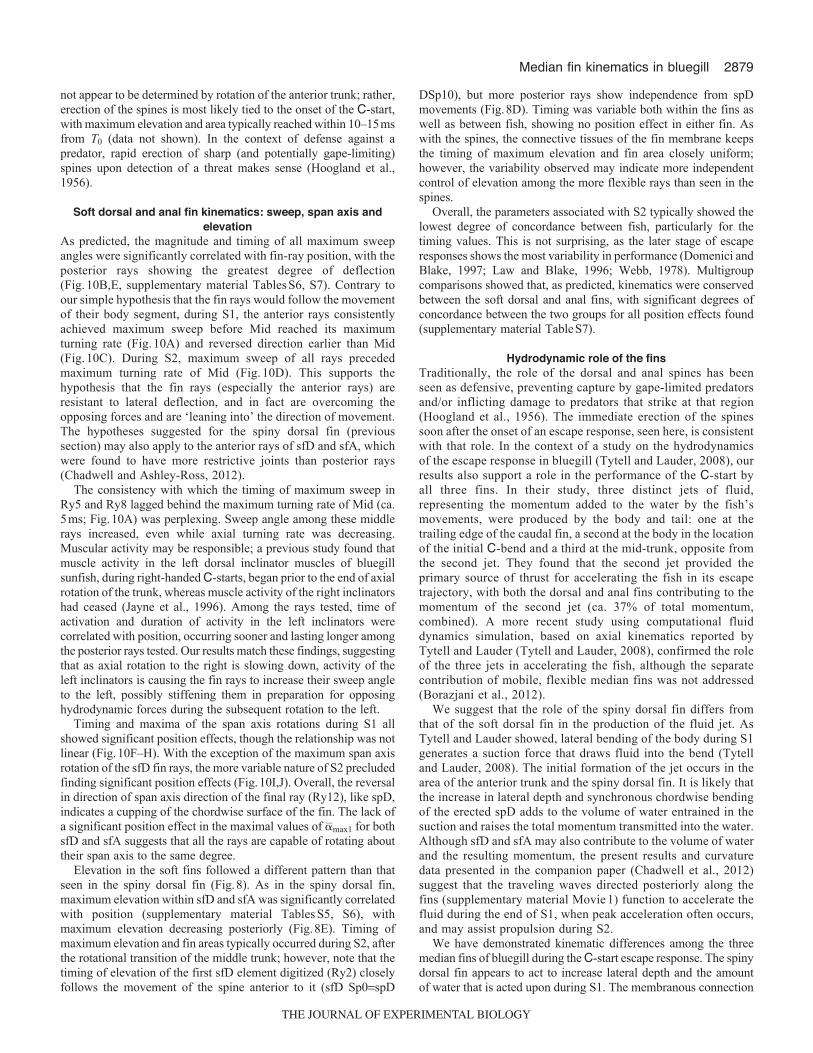
significant position effect within sfD (t�max1: W0.96, 211.47,P0.001; t�tr: W1.00, 212.00, P<0.001; t�max2: W0.96,211.47, P0.001; supplementary material TableS5); within sfA,a significant position effect was found in t�max1 and t�tr, but nott�max2 (t�max1 and t�tr: both W0.95, 211.44, P0.001;
t�max2: W0.69, 28.27, P0.056; supplementary materialTableS6). Both �max1 and �max2 increased with position within sfDand sfA (Fig.10B,E), with significant position effects for both themean and maximal values (sfD �max1, max1, �max2: all W0.96,211.47, P0.001; max2: W0.89, 210.67, P0.004;supplementary material TableS5; sfA �max1, max1: both W0.97,211.59, P<0.001; �max2, max2: both W1.00, 212.00, P<0.001;supplementary material TableS6). For all sweep parameters in whichsignificant position effects were found in both the sfD and sfAgroups, a significant degree of concordance between groups wasalso found (t�max1: �0.93, Z5.57, P<0.001; t�tr, �max2: both�0.97, Z5.80, P<0.001; �max1, max1: both �0.96, Z5.73,P<0.001; max2: �0.93, Z5.60, P<0.001; supplementary materialTableS7).
Among the first four fin rays, the span axis parameters t�max1,t�tr and t�max2 increased with position, whereas the timing ofRy12 usually occurred at the same time as Sp0 or Ry2 (Fig.10F,H,I,supplementary material TablesS2, S3). Significant position effectswere found for t�max1 and t�tr, but not t�max2 for both sfD(t�max1: W0.96, 211.47, P0.001; t�tr: W1.00, 212.00,P<0.001; t�max2: W0.82, 29.87, P0.015; supplementarymaterial TableS5) and sfA (t�max1, t�tr: both W0.95, 211.44,P0.001; t�max2: W0.82, 29.87, P0.015; supplementarymaterial TableS6). During the initial span axis rotation, clockwise�max1 increased with fin-ray position among Sp0, Ry2 and Ry5. AtRy8, clockwise �max1 decreased and by Ry12, �max1 was directedcounterclockwise. A similar pattern in the reverse direction wasobserved for �max2 (Fig.10G,J). For both sfD and sfA, mean �max1,but not maximal, was significantly related to position (sfD �max1:W0.87, 210.40, P0.001; max1: W0.73, 28.80, P0.038;supplementary material TableS5; sfA �max1: W0.87, 210.40,P0.005; max1: W0.78, 29.33, P0.026; supplementary materialTableS6). In sfD, but not sfA, significant position effects were foundfor both mean and maximal �max2 (sfD �max2: W0.89, 210.67,P0.004; max2: W0.96, 211.47, P0.001; supplementarymaterial TableS5; sfA �max2: W0.60, 27.20, P0.117; max2:W0.56, 26.67, P0.163; supplementary material TableS6). Forall span axis parameters in which significant position effects werefound in both the sfD and sfA fin groups, a significant degree ofconcordance between sfD and sfA was also found (t�max1, t�tr:both �0.97, Z5.80, P<0.001; �max1: �0.87, Z5.20, P0.000;supplementary material TableS7).
Timing of maximal elevation () and area were highly variablebetween fin rays of the soft dorsal and anal fins and no significantposition effects were found for either group (sfD t�max: W0.69,28.27, P0.056; tA�r�max: W0.15, 21.35, P0.781;supplementary material TableS5; sfA t�max: W0.63, 27.52,P0.083; tA�r�max: W0.20, 21.80, P0.727; supplementarymaterial TableS6). For both groups, �max decreased with fin-rayposition (Fig.8E, supplementary material TablesS2, S3) andsignificant position effects for both mean and maximal �max werefound in both sfD (�max, max: both W1.00, 212.00, P<0.001;supplementary material TableS5) and sfA (�max, max: both W1.00,212.00, P<0.001; supplementary material TableS6) as well as asignificant degree of concordance between sfD and sfA (�max, max:both �1.00, Z6.00, P<0.001; supplementary material TableS7).
DISCUSSIONDuring locomotion, fin-ray kinematics are the result of theinteraction between the fin ray’s inherent structural properties andits resistance/susceptibility to the combination of forces acting onit: external hydrodynamic forces, activity of its intrinsic muscles,
DorsalAnal
Sp0A
B Ry2
C Ry5
D Ry8
–50
0
50
–50
050
–200
20
–200
20
E Ry12
–500
50
F Mid- trunk
–404
J Ry8
–200
20
G
H Ry2
I Ry5
Sp0
020
–200
20
–20
–200
20
K Ry12
–200
20
T0
Turn
ing
rate
(d
eg m
s–1)
Sw
eep
angl
e (d
eg)
Spa
n ax
is a
ngle
(deg
)
tθ�tr
tωmax1
tωmax2
tωtr
tθ�max1
tθ�max2
–10 0 10 20 30 40 50 60Time (ms)
tαtr
tαmax1
–
– –
–
–
tαmax2–
Fig.9. Sweep and span axis angles of the soft dorsal (blue) and anal (red)fin rays. (A–E) Sweep angles of individual fin rays. The time of the twomaximum sweep angles and directional transition, t�max1, t�max2 and t�tr,are indicated for one fin ray (ARy2). (F)Turning rate of Mid, shown toprovide reference for the movements of the associated fin rays. (G–K)Span axis angles of individual fin rays. The time of the two maximum spanaxis angles and directional transition, t�max1, t�max2 and t�tr, are indicatedfor one ray (ARy2). Shaded regions as in Fig.4.
THE JOURNAL OF EXPERIMENTAL BIOLOGY

2878
and intra-fin forces transmitted via the fin webbing by the movementof adjacent fin rays. Over the course of a fast-start, the fin rays ofthe dorsal and anal fins demonstrated variations in their timing andmagnitude for several kinematic parameters, based on positionwithin the fin. Furthermore, these variations were generally inagreement with our expectations from previously discusseddifferences in musculoskeletal and biomechanical properties,supporting our hypothesis that there is functional regionalizationwithin the dorsal and anal fins of the bluegill sunfish (Chadwelland Ashley-Ross, 2012). Although the data supported our hypothesisthat fin rays are capable of resisting deflecting forces, the patternin timing of the maximum sweep angles did not always match ouroriginal predictions about fin-ray resistance to lateral deflectionrelative to the axial body. This suggests that our original assumptionsabout the forces acting on the fin rays and/or the kinematicperformance of the fin rays because of their resistance/susceptibilityto lateral deflection are more complex than the simple model wehad proposed.
Spiny dorsal fin kinematics: sweep, span axis and elevationAs expected, the spines generally resisted lateral deflection;however, the sweep parameters within spD were neither closelylinked with the turning rate of Ant nor significantly correlated withspine position (Fig.7A–E, supplementary material TableS4),possibly because of the low degrees of freedom (d.f.2, 3) and theconservative nature of the -adjustment. The timing of maximumsweep angle of the anterior three spines relative to maximum turningrate of Ant did not conform to our initial expectations of laggingbehind the body due to hydrodynamic resistance. Rather thanfollowing the turning of Ant, as we had predicted, the timing ofmaximum sweep angles and directional transitions typicallypreceded that of Ant.
There are three potential explanations for this pattern. First, ourinitial hypothesis on the opposing hydrodynamic forces generated
during the escape response may have been incorrect. During S1,rotation of the anterior trunk is delayed by ca. 10ms; however, thisdoes not mean that there was no movement. As the head andposterior trunk segments rotate to the right, the anterior trunkconsistently undergoes lateral translation to the left, i.e. a lineardisplacement rather than angular. Under this circumstance, opposinghydrodynamic force might passively deflect spines to the right, aswas observed (Fig.6A–D). Second, because of the restrictive natureof the spine joint, maximum lateral deflection (sweep) of the spinesis limited and quickly met, with no further increase in deflectiondespite any increase in angular velocity and the resulting opposingforces exerted on the spines. And third, contractions of the inclinatormuscles may allow spines to initiate lateral deflection independentof axial rotation and either actively resist, or generate hydrodynamicforces.
The timing of span axis rotation in spD was coupled with thetiming of axial rotation of Ant, with no significant position effector discernable pattern in the timing between spines (Fig.7F,H,I).Maximum span axis rotation was correlated with position (Fig.7G,J,supplementary material TableS4); however, because of therestrictive nature of the spine joints, it is unclear how much of themeasured rotation may be due to the overall chordwise cupping ofthe fin membrane and lateral bend in the trunk (Fig.3C,D). Futureexperiments might sever the fin membrane between spines to answerthis question.
Elevation of the spines and increase in fin area always occurredwithin one or two frames after the onset of a C-start, reaching bothmaximum elevation and fin area well before the rotational transitionof the anterior trunk (Fig.8A–C). It is unclear to what extent thesynchronized elevation is due to the activation of individual erectormuscles associated with each spine (Chadwell and Ashley-Ross,2012) versus elevation of the anteriormost spine (via its erectormuscle) that passively moves the successive spines through theconnection via the fin membrane. Timing of maximal elevation does
The Journal of Experimental Biology 215 (16)
W=0.96*W=1.0*�=0.97*
10F
0 5–5
W=0.87*W=0.87*�=0.87*
20100G
–10–20
W=1.0*W=0.96*�=0.97*
–5 5H
0–10 10
W=0.82W=0.82
–2 40–6I
2–4–8
W=0.89*W=0.60�=N/A
�=N/A
–20 400–40 20J
Sp0
Ry2Ry5
Ry12Ry8
–5–15
W=0.96*W=0.95*�=0.93*
–10 50A
DorsalAnal
–20–100 –30B
W=0.96*W=0.97*�=0.96*
C
∆tθ�max1
–20 –10 0
W=1.0*W=0.95*�=0.97*
5–5–15D
W=0.96*W=0.69
–20 –10 0–5–15E
W=0.96*W=1.0*�=0.97*
300 15 45 60
Sp0
Ry2Ry5
Ry12Ry8
�=N/A
αmax1 (deg) ∆tαmax1(ms from tθ�max1)
– ∆αmax2(ms from tθ�max2)
– αmax2 (deg) –∆tαtr(ms from tθ�tr)
––
ωmax1 (deg) ∆tωmax1(ms from tθ�max1)
– ∆tωmax2(ms from tθ�max2)
– ωmax2 (deg) –∆tωtr(ms from tθ�tr)
––
Fig.10. Average sweep and span axis parameters of the soft dorsal and anal fin rays. (A)Timing of the first maximum sweep angle. (B)First maximumsweep angle. (C)Timing of the directional sweep transition. (D)Timing of the second maximum sweep angle. (E)Second maximum sweep angle. (F)Timingof the first maximum span axis angle. (G)First maximum span axis angle. (H)Timing of the directional span axis transition. (I)Timing of the secondmaximum span axis angle. (J)Second maximum span axis angle. All timing parameters are in relation to the corresponding time event of the Mid-trunkturning rate, t�event. The dashed line in C represents the average time difference between the first maximum turning rate and the rotational transition of themiddle trunk, t�max1t�max1–t�tr. For each parameter, Kendallʼs coefficient of concordance, W, and, if applicable, the multigroup coefficient of concordance,�, are provided. Significant position effects are indicated in bold with an asterisk. Bars are means ± 1 s.e.m., N9 sequences from three fish.
THE JOURNAL OF EXPERIMENTAL BIOLOGY
2879Median fin kinematics in bluegill
not appear to be determined by rotation of the anterior trunk; rather,erection of the spines is most likely tied to the onset of the C-start,with maximum elevation and area typically reached within 10–15msfrom T0 (data not shown). In the context of defense against apredator, rapid erection of sharp (and potentially gape-limiting)spines upon detection of a threat makes sense (Hoogland et al.,1956).
Soft dorsal and anal fin kinematics: sweep, span axis andelevation
As predicted, the magnitude and timing of all maximum sweepangles were significantly correlated with fin-ray position, with theposterior rays showing the greatest degree of deflection(Fig.10B,E, supplementary material TablesS6, S7). Contrary toour simple hypothesis that the fin rays would follow the movementof their body segment, during S1, the anterior rays consistentlyachieved maximum sweep before Mid reached its maximumturning rate (Fig.10A) and reversed direction earlier than Mid(Fig.10C). During S2, maximum sweep of all rays precededmaximum turning rate of Mid (Fig.10D). This supports thehypothesis that the fin rays (especially the anterior rays) areresistant to lateral deflection, and in fact are overcoming theopposing forces and are ‘leaning into’ the direction of movement.The hypotheses suggested for the spiny dorsal fin (previoussection) may also apply to the anterior rays of sfD and sfA, whichwere found to have more restrictive joints than posterior rays(Chadwell and Ashley-Ross, 2012).
The consistency with which the timing of maximum sweep inRy5 and Ry8 lagged behind the maximum turning rate of Mid (ca.5ms; Fig.10A) was perplexing. Sweep angle among these middlerays increased, even while axial turning rate was decreasing.Muscular activity may be responsible; a previous study found thatmuscle activity in the left dorsal inclinator muscles of bluegillsunfish, during right-handed C-starts, began prior to the end of axialrotation of the trunk, whereas muscle activity of the right inclinatorshad ceased (Jayne et al., 1996). Among the rays tested, time ofactivation and duration of activity in the left inclinators werecorrelated with position, occurring sooner and lasting longer amongthe posterior rays tested. Our results match these findings, suggestingthat as axial rotation to the right is slowing down, activity of theleft inclinators is causing the fin rays to increase their sweep angleto the left, possibly stiffening them in preparation for opposinghydrodynamic forces during the subsequent rotation to the left.
Timing and maxima of the span axis rotations during S1 allshowed significant position effects, though the relationship was notlinear (Fig.10F–H). With the exception of the maximum span axisrotation of the sfD fin rays, the more variable nature of S2 precludedfinding significant position effects (Fig.10I,J). Overall, the reversalin direction of span axis direction of the final ray (Ry12), like spD,indicates a cupping of the chordwise surface of the fin. The lack ofa significant position effect in the maximal values of �max1 for bothsfD and sfA suggests that all the rays are capable of rotating abouttheir span axis to the same degree.
Elevation in the soft fins followed a different pattern than thatseen in the spiny dorsal fin (Fig.8). As in the spiny dorsal fin,maximum elevation within sfD and sfA was significantly correlatedwith position (supplementary material TablesS5, S6), withmaximum elevation decreasing posteriorly (Fig.8E). Timing ofmaximum elevation and fin areas typically occurred during S2, afterthe rotational transition of the middle trunk; however, note that thetiming of elevation of the first sfD element digitized (Ry2) closelyfollows the movement of the spine anterior to it (sfD Sp0spD
DSp10), but more posterior rays show independence from spDmovements (Fig.8D). Timing was variable both within the fins aswell as between fish, showing no position effect in either fin. Aswith the spines, the connective tissues of the fin membrane keepsthe timing of maximum elevation and fin area closely uniform;however, the variability observed may indicate more independentcontrol of elevation among the more flexible rays than seen in thespines.
Overall, the parameters associated with S2 typically showed thelowest degree of concordance between fish, particularly for thetiming values. This is not surprising, as the later stage of escaperesponses shows the most variability in performance (Domenici andBlake, 1997; Law and Blake, 1996; Webb, 1978). Multigroupcomparisons showed that, as predicted, kinematics were conservedbetween the soft dorsal and anal fins, with significant degrees ofconcordance between the two groups for all position effects found(supplementary material TableS7).
Hydrodynamic role of the finsTraditionally, the role of the dorsal and anal spines has beenseen as defensive, preventing capture by gape-limited predatorsand/or inflicting damage to predators that strike at that region(Hoogland et al., 1956). The immediate erection of the spinessoon after the onset of an escape response, seen here, is consistentwith that role. In the context of a study on the hydrodynamicsof the escape response in bluegill (Tytell and Lauder, 2008), ourresults also support a role in the performance of the C-start byall three fins. In their study, three distinct jets of fluid,representing the momentum added to the water by the fish’smovements, were produced by the body and tail: one at thetrailing edge of the caudal fin, a second at the body in the locationof the initial C-bend and a third at the mid-trunk, opposite fromthe second jet. They found that the second jet provided theprimary source of thrust for accelerating the fish in its escapetrajectory, with both the dorsal and anal fins contributing to themomentum of the second jet (ca. 37% of total momentum,combined). A more recent study using computational fluiddynamics simulation, based on axial kinematics reported byTytell and Lauder (Tytell and Lauder, 2008), confirmed the roleof the three jets in accelerating the fish, although the separatecontribution of mobile, flexible median fins was not addressed(Borazjani et al., 2012).
We suggest that the role of the spiny dorsal fin differs fromthat of the soft dorsal fin in the production of the fluid jet. AsTytell and Lauder showed, lateral bending of the body during S1generates a suction force that draws fluid into the bend (Tytelland Lauder, 2008). The initial formation of the jet occurs in thearea of the anterior trunk and the spiny dorsal fin. It is likely thatthe increase in lateral depth and synchronous chordwise bendingof the erected spD adds to the volume of water entrained in thesuction and raises the total momentum transmitted into the water.Although sfD and sfA may also contribute to the volume of waterand the resulting momentum, the present results and curvaturedata presented in the companion paper (Chadwell et al., 2012)suggest that the traveling waves directed posteriorly along thefins (supplementary material Movie1) function to accelerate thefluid during the end of S1, when peak acceleration often occurs,and may assist propulsion during S2.
We have demonstrated kinematic differences among the threemedian fins of bluegill during the C-start escape response. The spinydorsal fin appears to act to increase lateral depth and the amountof water that is acted upon during S1. The membranous connection
THE JOURNAL OF EXPERIMENTAL BIOLOGY

2880
between the stiff spiny and flexible soft regions of both dorsal andanal fins may allow for both enhanced mechanical support andeffective water transfer posteriorly. The soft dorsal and anal fin raysundergo movements that suggest they shed jets of water that mayincrease thrust to move the fish away from the threat. Anterior andposterior regions of the soft fins show distinct kinematic patterns,indicating that these median appendages do not act as simple stiffplates, but rather as highly flexible and finely tuned control surfaces.Such detailed information will provide essential input to improvecomputational simulations of escape behavior, which are currentlyhampered by the lack of information regarding natural finmovements. Future studies that elucidate the active motor controlover the fins and the role played by the connection between spinyand soft fins (by examining fish without continuous spiny and softdorsal fins, e.g. largemouth bass, or interrupting the membranousconnection between fins) will provide essential data to enable fullunderstanding of the complex roles performed by the fins of ray-finned fishes.
LIST OF SYMBOLS AND ABBREVIATIONSa acceleration of the ssCOM parallel to the fish trajectoryA�x� area, where x represents the fin surface between a named fin-ray
and the next posterior digitized fin ray, or of the entire namedfin/region
Ant anterior trunkARy# anal rays, where # indicates its numbered position within the finASp# anal spines, where # indicates its numbered position within the finC chord axis of the fin surfacecT tangent to the chordwise curveD displacement of the center of massDRy# dorsal rays, where # indicates its numbered position within the finDSp# dorsal spines, where # indicates its numbered position within the
finFr frontal axis, a.k.a. normal to the frontal planeL lateral axis, a.k.a. normal to the fin surfaceMid middle trunkMSE mean square errorOp operculumPost posterior trunkr fin-ray identifierRs rostrumS span axis of the fin surfaceS1 stage 1 of the C-startS2 stage 2 of the C-startSeg body segment identifiersfA soft region of the anal finsfD soft dorsal finSg sagittal axis, a.k.a. normal to the sagittal planespD spiny dorsal finssCOM stretched-straight center of masssT tangent to the spanwise curvet time point during a C-start sequenceT0 time zeroTL total lengthtr directional transition event, i.e. change in direction of rotation or
orientationTr transverse axis, a.k.a. normal to the transverse planetX time of a given parameter, where X is the event of a given
parameterv velocity of the ssCOM parallel to the fish trajectory� average span axis angle of a fin raytX time difference between a given fin-ray parameter and its
corresponding axial event, where X is the event of a givenparameter
� average elevation of a fin ray� turning rate, i.e. the first time derivative of yaw� average sweep angle of a fin ray
ACKNOWLEDGEMENTSWe thank Peter Madden for writing DigiMat, the custom video analysis programused in this study. We also thank two anonymous reviewers for constructivecomments that improved the manuscript.
FUNDINGThis work was supported by the National Science Foundation [grant IBN-0316331to M.A.A.-R. and grant EFRI-0938043 to G.V.L.] and a Vecellio Fund Fellowshipto B.A.C.
REFERENCESBorazjani, I., Sotiropoulos, F., Tytell, E. D. and Lauder, G. V. (2012).
Hydrodynamics of the bluegill sunfish C-start escape response: three-dimensionalsimulations and comparison with experimental data. J. Exp. Biol. 215, 671-684.
Canfield, J. G. and Rose, G. J. (1993). Activation of Mauthner neurons during preycapture. J. Comp. Physiol. A 172, 611-618.
Chadwell, B. A. and Ashley-Ross, M. A. (2012). Musculoskeletal morphology andregionalization within the dorsal and anal fins of bluegill sunfish (Lepomismacrochirus). J. Morphol. 273, 405-422.
Chadwell, B. A., Standen, E. M., Lauder, G. V. and Ashley-Ross, M. A. (2012).Median fin function during the escape response of bluegill sunfish (Lepomismacrochirus). II: Fin-ray curvature. J. Exp. Biol. 215, 2881-2890.
Domenici, P. and Blake, R. W. (1991). The kinematics and performance of theescape response in the angelfish (Pterophyllum eimekei). J. Exp. Biol. 156, 187-205.
Domenici, P. and Blake, R. W. (1997). The kinematics and performance of fish fast-start swimming. J. Exp. Biol. 200, 1165-1178.
Eaton, R. C., Bombardieri, R. A. and Meyer, D. L. (1977). The Mauthner-initiatedstartle response in teleost fish. J. Exp. Biol. 66, 65-81.
Fernald, R. D. (1975). Fast body turns in a cichlid fish. Nature 258, 228-229.Harper, D. G. and Blake, R. W. (1990). Fast-start performance of rainbow trout Salmo
gairdneri and northern pike Esox lucius. J. Exp. Biol. 150, 321-342.Hoogland, R., Morris, D. and Tinbergen, N. (1956). The spines of sticklebacks
(Gasterosteus and Pygosteus) as means of defence against predators (Perca andEsox). Behaviour 10, 205-236.
Jayne, B. C. and Lauder, G. V. (1993). Red and white muscle activity and kinematicsof the escape response of the bluegill sunfish during swimming. J. Comp. Physiol. A173, 495-508.
Jayne, B. C., Lozada, G. F. and Lauder, G. V. (1996). Function of the dorsal fin inbluegill sunfish: motor patterns during four distinct locomotor behaviors. J. Morphol.228, 307-326.
Kreyszig, E. (1991). Differential Geometry. New York: Dover Publications.Lauder, G. V., Nauen, J. C. and Drucker, E. G. (2002). Experimental hydrodynamics
and evolution: function of median fins in ray-finned fishes. Integr. Comp. Biol. 42,1009-1017.
Lauder, G. V., Madden, P. G. A., Tangorra, J. L., Anderson, E. and Baker, T. V.(2011). Bioinspiration from fish for smart material design and function. Smart Mater.Struct. 20, 094014.
Law, T. and Blake, R. (1996). Comparison of the fast-start performances of closelyrelated, morphologically distinct threespine sticklebacks (Gasterosteus spp.). J. Exp.Biol. 199, 2595-2604.
Rand, D. M. and Lauder, G. V. (1981). Prey capture in the chain pickerel, Esox niger:correlations between feeding and locomotor behavior. Can. J. Zool. 59, 1072-1078.
Rice, W. R. (1989). Analyzing tables of statistical tests. Evolution 43, 223-225.Schriefer, J. E. and Hale, M. E. (2004). Strikes and startles of northern pike (Esox
lucius): a comparison of muscle activity and kinematics between S-start behaviors. J.Exp. Biol. 207, 535-544.
Sokal, R. R. and Rohlf, F. J. (1981). Biometry. New York: W. H. Freeman.Spierts, I. L. and Leeuwen, J. L. (1999). Kinematics and muscle dynamics of C- and
S-starts of carp (Cyprinus carpio L.). J. Exp. Biol. 202, 393-406.Standen, E. M. and Lauder, G. V. (2005). Dorsal and anal fin function in bluegill
sunfish Lepomis macrochirus: three-dimensional kinematics during propulsion andmaneuvering. J. Exp. Biol. 208, 2753-2763.
Tytell, E. D. (2006). Median fin function in bluegill sunfish Lepomis macrochirus:streamwise vortex structure during steady swimming. J. Exp. Biol. 209, 1516-1534.
Tytell, E. D. and Lauder, G. V. (2008). Hydrodynamics of the escape response inbluegill sunfish, Lepomis macrochirus. J. Exp. Biol. 211, 3359-3369.
Vogel, S. (2003). Comparative Biomechanics: Lifeʼs Physical World. Princeton, NJ:Princeton University Press.
Wakeling, J. M. (2001). Biomechanics of fast-start swimming in fish. Comp. Biochem.Physiol. 131A, 31-40.
Walker, J. A. (1998). Estimating velocities and accelerations of animal locomotion: asimulation experiment comparing numerical differentiation algorithms. J. Exp. Biol.201, 981-995.
Webb, P. W. (1976). The effect of size on the fast-start performance of rainbow troutSalmo cairdneri, and a consideration of piscivorous predator–prey interactions. J.Exp. Biol. 65, 157-177.
Webb, P. W. (1977). Effects of median-fin amputation on fast-start performance ofrainbow trout (Salmo gairdneri). J. Exp. Biol. 68, 123-135.
Webb, P. W. (1978). Fast-start performance and body form in seven species of teleostfish. J. Exp. Biol. 74, 211-226.
Webb, P. W. and Skadsen, J. M. (1980). Strike tactics of Esox. Can. J. Zool. 58,1462-1469.
Weihs, D. (1973). The mechanism of rapid starting of slender fish. Biorheology 10,343-350.
Zar, J. H. (1984). Biostatistical Analysis. Englewood Cliffs, NJ: Prentice Hall.
The Journal of Experimental Biology 215 (16)
THE JOURNAL OF EXPERIMENTAL BIOLOGY