Research Article Identification of Imitation Cheese...
10
Hindawi Publishing Corporation International Journal of Food Science Volume 2013, Article ID 367841, 9 pages http://dx.doi.org/10.1155/2013/367841 Research Article Identification of Imitation Cheese and Imitation Ice Cream Based on Vegetable Fat Using NMR Spectroscopy and Chemometrics Yulia B. Monakhova, 1,2,3 Rolf Godelmann, 1 Claudia Andlauer, 1 Thomas Kuballa, 1 and Dirk W. Lachenmeier 1,4 1 Chemisches und Veterin¨ aruntersuchungsamt (CVUA) Karlsruhe, Weissenburger Strasse 3, 76187 Karlsruhe, Germany 2 Department of Chemistry, Saratov State University, Astrakhanskaya Street 83, 410012 Saratov, Russia 3 Bruker Biospin GmbH, Silbersteifen, 76287 Rheinstetten, Germany 4 Ministry of Rural Affairs and Consumer Protection, Kernerplatz 10, 70182 Stuttgart, Germany Correspondence should be addressed to Dirk W. Lachenmeier; [email protected] Received 15 January 2013; Revised 21 May 2013; Accepted 22 May 2013 Academic Editor: Carl J. Schaschke Copyright © 2013 Yulia B. Monakhova et al. is is an open access article distributed under the Creative Commons Attribution License, which permits unrestricted use, distribution, and reproduction in any medium, provided the original work is properly cited. Vegetable oils and fats may be used as cheap substitutes for milk fat to manufacture imitation cheese or imitation ice cream. In this study, 400 MHz nuclear magnetic resonance (NMR) spectroscopy of the fat fraction of the products was used in the context of food surveillance to validate the labeling of milk-based products. For sample preparation, the fat was extracted using an automated Weibull-Stoldt methodology. Using principal component analysis (PCA), imitation products can be easily detected. In both cheese and ice cream, a differentiation according to the type of raw material (milk fat and vegetable fat) was possible. e loadings plot shows that imitation products were distinguishable by differences in their fatty acid ratios. Furthermore, a differentiation of several types of cheese (Edamer, Gouda, Emmentaler, and Feta) was possible. Quantitative data regarding the composition of the investigated products can also be predicted from the same spectra using partial least squares (PLS) regression. e models obtained for 13 compounds in cheese ( 2 0.75–0.95) and 17 compounds in ice cream ( 2 0.83–0.99) (e.g., fatty acids and esters) were suitable for a screening analysis. NMR spectroscopy was judged as suitable for the routine analysis of dairy products based on milk or on vegetable fat substitutes. 1. Introduction Due to industry efforts to provide low-cost foods or due to general ethical considerations against cow’s milk consump- tion [1], imitation dairy products have recently appeared on the market [2–5]. Cheese analogues or imitation cheese are cheese-like products in which milk fat, milk protein, or both are partially or completely replaced with nonmilk- based components such as soy [2], starch [6], or vegetable replacers [3]. Other alternative products for consumers with cow milk intolerance [7] based on goat [8, 9] or sheep milk [9] can also be found on the market. Vegetable oils and fats are most commonly used as cheap substitutes for milk fat to manufacture imitation cheese or imitation ice cream. While not being harmful to health, the imitation products may be of lesser nutritional quality (e.g., by lower calcium content) and contain several artificial flavors and food colors [10]. Unfortunately, such imitation products may be offered without the necessary labeling, which is a deception of the consumer. Pizza topping is a good example of such a possibility [10]. It has therefore become necessary to develop a reliable technique able to detect such products in the market.
-
Upload
nguyenhanh -
Category
Documents
-
view
215 -
download
0
Transcript of Research Article Identification of Imitation Cheese...

Hindawi Publishing CorporationInternational Journal of Food ScienceVolume 2013, Article ID 367841, 9 pageshttp://dx.doi.org/10.1155/2013/367841
Research ArticleIdentification of Imitation Cheese andImitation Ice Cream Based on Vegetable Fat UsingNMR Spectroscopy and Chemometrics
Yulia B. Monakhova,1,2,3 Rolf Godelmann,1 Claudia Andlauer,1
Thomas Kuballa,1 and Dirk W. Lachenmeier1,4
1 Chemisches und Veterinaruntersuchungsamt (CVUA) Karlsruhe, Weissenburger Strasse 3, 76187 Karlsruhe, Germany2Department of Chemistry, Saratov State University, Astrakhanskaya Street 83, 410012 Saratov, Russia3 Bruker Biospin GmbH, Silbersteifen, 76287 Rheinstetten, Germany4Ministry of Rural Affairs and Consumer Protection, Kernerplatz 10, 70182 Stuttgart, Germany
Correspondence should be addressed to Dirk W. Lachenmeier; [email protected]
Received 15 January 2013; Revised 21 May 2013; Accepted 22 May 2013
Academic Editor: Carl J. Schaschke
Copyright © 2013 Yulia B. Monakhova et al. This is an open access article distributed under the Creative Commons AttributionLicense, which permits unrestricted use, distribution, and reproduction in any medium, provided the original work is properlycited.
Vegetable oils and fats may be used as cheap substitutes for milk fat to manufacture imitation cheese or imitation ice cream. Inthis study, 400MHz nuclear magnetic resonance (NMR) spectroscopy of the fat fraction of the products was used in the context offood surveillance to validate the labeling of milk-based products. For sample preparation, the fat was extracted using an automatedWeibull-Stoldt methodology. Using principal component analysis (PCA), imitation products can be easily detected. In both cheeseand ice cream, a differentiation according to the type of raw material (milk fat and vegetable fat) was possible. The loadingsplot shows that imitation products were distinguishable by differences in their fatty acid ratios. Furthermore, a differentiation ofseveral types of cheese (Edamer, Gouda, Emmentaler, and Feta) was possible. Quantitative data regarding the composition of theinvestigated products can also be predicted from the same spectra using partial least squares (PLS) regression.Themodels obtainedfor 13 compounds in cheese (𝑅2 0.75–0.95) and 17 compounds in ice cream (𝑅2 0.83–0.99) (e.g., fatty acids and esters) were suitablefor a screening analysis. NMR spectroscopy was judged as suitable for the routine analysis of dairy products based on milk or onvegetable fat substitutes.
1. Introduction
Due to industry efforts to provide low-cost foods or due togeneral ethical considerations against cow’s milk consump-tion [1], imitation dairy products have recently appearedon the market [2–5]. Cheese analogues or imitation cheeseare cheese-like products in which milk fat, milk protein,or both are partially or completely replaced with nonmilk-based components such as soy [2], starch [6], or vegetablereplacers [3]. Other alternative products for consumers withcow milk intolerance [7] based on goat [8, 9] or sheep milk
[9] can also be found on the market. Vegetable oils andfats are most commonly used as cheap substitutes for milkfat to manufacture imitation cheese or imitation ice cream.While not being harmful to health, the imitation productsmay be of lesser nutritional quality (e.g., by lower calciumcontent) and contain several artificial flavors and food colors[10]. Unfortunately, such imitation products may be offeredwithout the necessary labeling, which is a deception ofthe consumer. Pizza topping is a good example of such apossibility [10]. It has therefore becomenecessary to develop areliable technique able to detect such products in the market.

2 International Journal of Food Science
Chromatographic methods are the most popular choicefor analysis of organic substances in cheese. For example,gas chromatography (GC) with mass-spectrometric detec-tion [11–13] or flame ionization detection [11] and high-performance liquid chromatography [9, 13, 14] were pre-viously applied. With these methods, precise and diverseinformation about volatile profiles of the particular type ofcheese could be obtained. This has been done, for example,for Reggianito Argentino cheese [11], Italianmountain cheese(Bitto) [15], Majorcan cheese [16], Kuflu Turkish cheese [13],and different varieties of goat and sheep cheese [9, 12].However, due to the matrix complexity of dairy productschromatographic analysis usually involves pretreatment stepssuch as solid-phase extraction (SPE) [17] or headspace sorp-tive extraction (HSSE) combined with thermal desorption(TD) [15]. Therefore, it can be concluded that chromato-graphic techniques are accurate but laborious, expensive, andtime consuming.
Other methods based on spectroscopic techniques arealso available. These include Fourier transform infrared(FTIR) spectroscopy [18–20], visible-near infrared reflect-ance spectroscopy [21], near infrared (NIR) spectroscopy[20, 22], atomic absorption spectroscopy [23], inductivelycoupled plasma optical emission spectrometry [24, 25], andfluorescence spectroscopy [20]. Fluorescence spectroscopyis the most sensitive method but only few compoundsgive rise to fluorescence signals. In FTIR and NIR spectra,strong and broad signals of water prevent the informativecharacterization of dairy products.
Among spectroscopic techniques in the area of foodanalysis, NMR is currently on the rise [26]. Previous appli-cation areas include beer [27], juice [28], grapes [29], infantformulas, [30] or pine nuts [31]. The application of NMRspectroscopy to cheese and ice cream analysis has beenalso presented in several studies. 1H NMR was used toinvestigate the influence of packaging on the degradationof soft cheese [32]. Full 1H NMR assignments of signals ofthe water fractions of different types of cheese were recentlyprovided [25, 33, 34]. 1HNMR is also able to provide reliablequalitative and quantitative analysis of amino acids [35] andbiogenic amines [36] in cheese. 31P and 23Na NMR wereused for the investigation of both phosphate and sodium iondistribution in semihard cheese [37]. A time-domain nuclearmagnetic resonance (TD-NMR) was applied to the quickdetermination of moisture profiles during cheese drying[38]. Regarding NMR analysis of ice cream, TD-NMR waspreviously used for the investigation of the aggregation state(liquid or solid) of water and fat [39–41]. Another articleutilized site-specific natural isotope fractionation NMR todetect adulteration of vanillin in ice cream [42].
Despite thementioned diverse studies about compositionof dairy products, there are only few articles dealing withthe detection of their adulteration. For example, it wasdemonstrated that it is possible to identify the presence ofcow milk in buffalo mozzarella by the use of electrophoreticmobility of cow and buffalo casein [43]. A method based ontriacylglycerol composition obtained with GC-FID of cheesewas also proposed to detect the levels of foreign fat [44].
Other techniques based on the determination of particularmarkers were also reviewed [4]. All of them are based ontime-consuming chromatographic measurements and, whatis more important, are able to detect only specific types ofadulteration.
In the view of these facts, NMR seems to be promising toprovide accurate classification of dairy products according tothe raw material origin. Therefore, the main objective of thisresearchwas to investigate the ability ofNMR spectroscopy todifferentiate milk fat products from vegetable fat substitutes.Cheese and ice cream were chosen as examples.
2. Experimental Section
2.1. Samples. A total of 109 cheese samples and 112 ice creamsamples based on milk fat were analyzed. The products wereeither purchased at local stores in Karlsruhe, Germany, orsubmitted to the CVUA Karlsruhe for official food controlpurposes in Baden-Wurttemberg, Germany. Samples wereselected to cover all possible imitation products available onthe German market and a wide composition variability ofmilk fat products. Furthermore, imitation products based onvegetable fat (or vegetable fat/milk fatmixture) were analyzed(𝑛 = 11 cheese and 𝑛 = 11 ice cream). All samples weresubjected to the standard GC/MS analysis that confirmed thelabeling information in every case.
2.2. Sample Preparation and Validation. Sample preparationof cheese and ice cream was conducted by the Germanreference Weibull-Stoldt methodology for fat hydrolysis andextraction. The hydrolysis of the sample was conductedusing the automated hydrolysis system HYDROTHERM(Gerhardt Analytical Systems, Konigswinter, Germany) asshown in Figure 1. Briefly, a representative average sample(at least 200 g) is minced and homogenized. Then 10 g of thehomogenized sample is weighed and put into the digestionbeaker for automated hydrochloric acid hydrolysis. After theaddition of hydrochloric acid (4mol/L, 150mL), the liquidis then quickly brought to boil and simmered for about 1hour. At the end of hydrolysis the digestionmixture is dilutedwith hot water (100mL) to the double amount and then isimmediately filtered through pleated filter, which has beenmoistened automatically by the system with water (numberof moisture cycles = 3 and water amount per cycle = 40 mL).After the program has finished, the filter is placed on a watchglass and dried for up to 1.5 h at 103 ± 2∘C in a drying oven.After cooling off, the fat is extracted using Soxhlet extractionwith petroleum ether.
After finishing, the extraction flasks are dried in thedrying oven for 60minutes at 103±2∘C.Then, they are placedin a desiccator, left to cool down to room temperature. Aftera constant weight was achieved, the fat phase was ready forNMR analysis, for which 200mg of the fat fraction is mixedwith 0.80mL of CDCl
3containing 0.1% tetramethylsilane
(TMS). 0.6mL of the mixture is poured into an NMR tubeand directly measured.
To investigate the reproducibility of the sample prepara-tion, two different imitation cheese samples were prepared

International Journal of Food Science 3
J
9
8
7
6
5
4
2
3
1
10
1211 13
A B C
D E
GH
I
F
Figure 1: Schematic illustration of the automatic sample hydrolysisprocess necessary for Weibull-Stoldt fat extraction (reproducedwith permission from Gerhardt Analytical Systems). 1 Condenser,2 shower, 3 hydrolysis beaker, 4 sample transfer device, 5 hotplate,6 shower for filter, 7 level sensor funnel, 8 funnel, 9 folded filter, 10hot water generator, 11 tank for sample waste, 12 tank for H
2O, and
13 tank for HCl, A sample drainage, B distilled water addition, Cair ventilation for condenser, D hot water addition-filter moisture,E hot water addition-rinsing sample transfer, F hot water addition-rinsing hydrolysis beaker, G hot water addition-rinsing condenser,H cooling water inlet, I cooling water outlet, J hydrochloric acidaddition.
twice and several resonances were integrated: 9.76–9.74 ppm(triplet), 4.33–4.30 ppm (doublet), and 2.80–2.72 ppm(triplet). The reproducibility was then calculated as relativestandard deviation (RSD) between replicates.
2.3. NMR Measurements at 400MHz. All NMR measure-ments were performed on a Bruker Avance 400 Ultra-shield spectrometer (Bruker Biospin, Rheinstetten, Ger-many) equipped with a 5mm SEI probe with Z-gradientcoils, using a Bruker Automatic Sample Changer (B-ACS120). All spectra were acquired at 300.0 K. The data wereacquired automatically under the control of ICON-NMR(Bruker Biospin, Rheinstetten, Germany), requiring about12min (1H NMR) and 30min (13C NMR) per sample. AllNMR spectra were phased and baseline corrected.
2.4. NMR Spectra Acquisition. 1H NMR spectra were acqui-red using the Bruker 1D zg pulse sequencewith 128 scans (NS)and 2 prior dummy scans (DS). The sweep width (SW) was
20.5503 ppm and the time domain (TD) of the free inductiondecays (FIDs) was 131 k, acquisition time (AQ) was 7.97 s, andthe repetition time (D1) was 1.0 s. Receiver gain (RG) valuewas set to 8.0. For acquisition of 13CNMRspectra, the Brukerpulse sequence zgpg was used. After the application of 4DS,8 FIDs (NS = 1024) were collected into a TD of 131072 (131 k)complex data points using a 238.8728 ppm SW and a RG of2050 (AQ = 1.38 s and D1 = 2.00 s).
2.5. Nontargeted Analysis and Chemometrics. The resultingspectra were analyzed using the software Unscrambler Xversion 10.0.1 (Camo Software AS, Oslo, Norway). We testedseveral spectral regions for calculation: aliphatic (0.25–3 ppm), midfield (3–6 ppm), aromatic (6–10 ppm) as well asthe 0.25–6 ppm region with 0.01 ppm bucket width. Detailson the bucketing process of NMR spectra for multivariatedata analysis were previously described [27].
The technique of cross-validation was applied to deter-mine the number of principal components (PCs) needed. Forcheese spectra differentiation, we used 7 PCs (explained vari-ance 97%) for 1H NMR and 8 PCs (explained variance 98%)for 13CNMR.The PCAmodel for ice cream spectra required8 PCs (explained variance 97%). Using PLS regression, theNMR spectra were correlated with reference GC analysisdata. PCA and PLS models were validated via full cross-validation. Furthermore, the PLS models were evaluated viatest set validation (𝑛 = 10), and results are compared withthose obtained from a standard GC method.
3. Results and Discussion
3.1. Sample Preparation and Spectra Analysis. Cheese and icecream cannot be directly measured with liquid-state NMR,so that a sample preparation has to occur aiming to providea measurable liquid solution. According to the literature, themost meaningful information about discrimination betweentypes of cheese is contained in the fat fraction [45–47]. Forthis reason, we decided to apply the fat obtained with theWeibull-Stoldt methodology for our NMR analysis. Accord-ing to Weibull-Stoldt, the sample is first hydrolyzed to freethe fat, and then the fat fraction was extracted from therest of the sample using a solvent. The use of the Weibull-Stoldt fat had also the advantage that this methodology isalready conducted for nearly all samples of cheese and icecream that reach our laboratory, as the labeled fat contenton the package has to be controlled. The Weibull-Stoldt fatwas also used for standard GC analysis. To simplify theWeibull-Stoldt protocol, we applied an automated devicefor the hydrolysis, which is the first system worldwidethat was recently commercialized for this purpose. Prior toits application, we conducted this procedure using manualhydrolysis according to theWeibull-Stoldtmethod.TheNMRspectra obtained with both methods showed the same fattyacid profile; however, the automated device was considerablymore efficient as it is possible to prepare 6 samples at oncewithout human intervention.
To demonstrate the reproducibility of this method, repli-cate measurements of different samples were performed.

4 International Journal of Food Science
The relative standard deviations (RSD) between the twomeasurements were found to range between 0.1% and 2.1%(9.76–9.74 ppm), 1.0% and 1.2% (4.33–4.30 ppm), and 0.7 and3.1% (2.80–2.72 ppm) for imitation cheese samples. The dataindicated that the sample preparation procedure is adequatelyreproducible to facilitate a comparison between differentcheese and ice cream samples.
Figure 2(a) showed the 1HNMR spectrum of a represen-tative sample of Gouda cheese.The signal of triglycerides andfatty acids dominated the spectrum [46]. Imitation cheesedisplayed a similar fatty acid profile (Figure 2(b)). By inspec-tion of these spectra, we found the differences in the intensityof resonances relative to methyl (1.00–0.90 ppm) and bis-allylic protons (5.00–4.90 ppm) between the two groups ofthe products. In the 13CNMR spectra, differences in the 173–170 ppm region (butyric acid) can also be observed.The samefindings were valid for ice cream samples. Nevertheless, it canbe concluded that NMR spectra of cheese and ice cream arevery complex and a strong overlap of the resonances occurs.In the following, dairy products properties were uncoveredfrom the NMR spectra using multivariate data analysis.
3.2. Nontargeted Analysis. The spectroscopic data were visu-alized either through PCA scatter plots, in which eachpoint represents an individual sample, or through loadingsplots, which permit the identification of the most importantspectral regions to separate the clusters and, therefore, revealmarkers (compounds that are responsible for differentiation).
At first, PCA was performed on NMR spectra of cheesesamples. The best grouping of similar samples was observedin the PCA scores plots of PC1-PC2 (1H NMR spectra,Figure 3(a)) and PC3-PC6 (13C NMR spectra, Figure 3(b)).On both plots, the imitation cheese samples were clearlyseparated from all of the remaining ones and were clusteredin the range of negative values of PC1 (1H NMR) or positivevalues of PC3 (13C NMR). Furthermore, on both plotstwo especially conspicuous imitation samples were observed(marked with stars on Figures 3(a) and 3(b)). These twoproducts represented tzatziki (a traditional Greek appetizer),which consists of bothmilk fat with vegetable fat and olive oiladdition. Additionally, one outlier was located in the positivevalues of PC1 (Figure 3(a)). In addition to vegetable fat, thissample contained also about 3% of milk fat (as proven byGC analysis). Cheese made from milk (cow, goat, and sheep)was clustered around 0 in both PCA scores plots. Overall, wethink that PCA in the aliphatic 1HNMR region (Figure 3(a))provided better differentiation of cheese samples. In this case,the samples in the imitation cluster were located closer toeach other and the distance between milk fat/vegetable fatclusters was larger than that obtained with 13C NMR data.Furthermore, vegetable fat/milk fat mixtures can also berecognized with 1H NMR spectra.
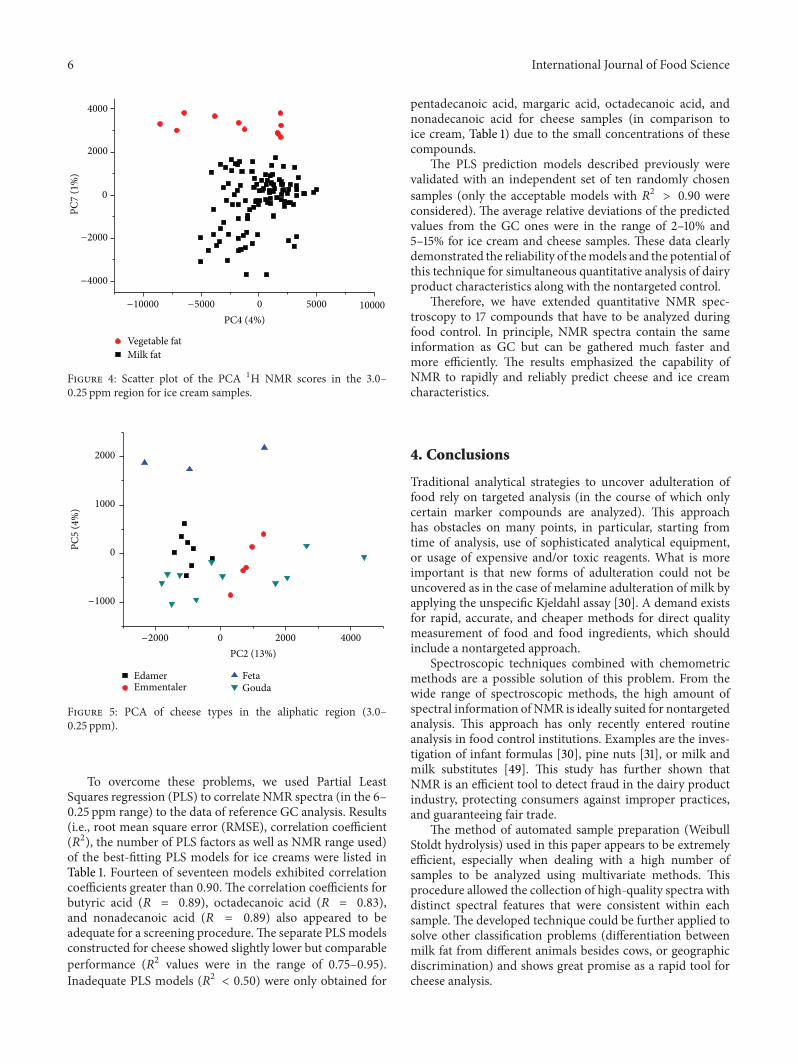
The PCA scatter plot of 1HNMR spectra (3–0.25 ppm) ofice cream samples was shown in Figure 4. In this case, sevenPCs were found sufficient for differentiation. Unlike cheesesamples, for which a good discrimination was observedbetween the first two PCs (Figure 3(a)), for ice cream thebest model was constructed between PC4 and PC7. For ice
cream samples, therefore, the variability in minor compoundconcentrations (such as alcohols and long-chain fatty acids)influenced the discrimination.
The chemical shifts and the associated functional groupsthat were responsible for the differentiation of the dairy prod-ucts can be identified using the loadings plots. In the loadingsplot, each chemical shift was plotted against its importance indiscriminating the samples. In our case, the spectral regions1.00–0.90 and 5.00–4.90 ppm were found to be important inthe milk fat/vegetable fat product differentiation (for bothcheese and ice cream). These regions consisted of the signalsfrom methyl groups of different compounds and olefinicprotons of all unsaturated chains [46].The buckets at 2.32 and2.30 ppm (most probablymethylenic protons bonded toC2 ofall fatty acid chains) [46] were also important for ice creamproducts.
Due to the low number of different imitation productscurrently available on the German market (probably becauseof a recent media campaign against these products [10]),we were not able to analyze our data with classificationmethods such soft independent modeling of class analogy(SIMCA) or linear discriminant analysis (LDA), whichwouldrequire a larger dataset for training and validation. However,new samples can be distinguished by adding them to thedeveloped PCA model.
While the differences of fat material used for cheese man-ufacture can be seenwithin the first several PCs (Figure 3(a)),higher PCs could uncover further clustering. To do this, weremoved the imitation products and repeated the PCA. It canseen from Figure 5 that grouping in respect to the cheesetypes (Edamer, Gouda, Feta, and Emmentaler) is observed.It is not surprising because every cheese type was produceddifferently and, therefore, had a unique fatty acid profile. Thetwo separate Gouda clusters were separated probably due todifferent ripening times similar to what was previously foundfor Italian Parmigiano Reggiano cheese [34]. It should benoted that 13CNMRcannot provide such clear differentiation(only Emmentaler, Gouda, and Feta can be classified).
A recent review discussed the potential of differenttechniques coupled with chemometric analysis for the deter-mination of the quality and the authenticity of dairy products,from which NMR plays an important role [47]. In the studyof Rodrigues et al. [33] it was shown that metabolic profilingobtained byNMRcombinedwithmultivariate analysis allowsto distinguish cheese samples in terms of maturation time,as well as added probiotic and prebiotic substances. PCAanalysis was also performed on 1H NMR spectra of ItalianParmigiano Reggiano cheese to control time of ripening[34]. In the same research, the authors were able to providegeographical differentiation of cheese samples with PartialLeast Squares-Discriminant Analysis (PLS-DA). 1H and 13CNMR coupled with PCA was used to differentiate PDO Asi-ago cheese produced in different areas [46]. High-resolutionmagic angle spinning (HR MAS) NMR together with PCAwas able to distinguish Emmental cheese samples accordingto geographical region [48]. It should bementioned, however,that data sets in all of these studies involved not more than30 samples and focused on one specific group or origin.

International Journal of Food Science 5
6 5 4 3 2 1 0(ppm)
0
20000
40000
60000
Inte
nsity
(a.u
.)
(a)
6 5 4 3 2 1 0(ppm)
0
20000
40000
60000
Inte
nsity
(a.u
.)
(b)
Figure 2: 1H NMR spectra of Gouda cheese (a) compared to an imitation cheese based on vegetable fat (b).
−20000
−15000
−10000
−5000
0
5000
10000
15000
20000
PC2
(8%
)
PC1 (77%)
Milk fatVegetable fat
−80000 −60000 −40000 −20000 0 20000
∗
∗
(a)
∗
∗
PC3 (2%)
PC6
(1%
)
−0.6
−0.4
−0.2
−0.2
0
0
0.2
0.2
0.4
0.4 0.6
0.6
0.8 1 1.2 1.4 1.6
Milk fatVegetable fat
(b)
Figure 3: Scatter plot of the PCA scores for 1HNMR ((a), 3.0–0.25 ppm) and 13CNMR ((b), 200–0.25 ppm) for cheese samples (stars denotetzatziki samples).
Therefore, our investigation is the first to apply 1H NMRspectroscopy with multivariate methods to characterize alarge number of commercial cheese and ice cream samples.Furthermore, to the best of our knowledge, no previousstudies evaluated the performance of NMR spectroscopy toreveal vegetable fat adulteration of cheese and ice cream sofar.
3.3. Quantitative Prediction of Dairy Product Composition.Besides the qualitative classification of our samples, in orderto perform quality control of dairy products, it is also
necessary to quantify certain compounds (e.g., saturatedand unsaturated fatty acids and their esters). GC is amongthe most common methods for determining the fatty acidcomposition of cheese and ice cream [9, 11, 12, 15, 17]. 1HNMR spectroscopic methods based on direct integrationwere also proposed for this purpose [45]. However, only alimited number of fatty acids can be quantified because theydisplay similar and overlapping signals in the NMR spectra(Figure 2), which make simple quantification by integrationof a distinct peak not possible. Moreover, in some cases theresults can strongly deviate from the reference values [45].
6 International Journal of Food Science
Milk fatVegetable fat
−10000 −5000
−2000
−4000
100005000
2000
4000
PC7
(1%
)
PC4 (4%)0
0
Figure 4: Scatter plot of the PCA 1H NMR scores in the 3.0–0.25 ppm region for ice cream samples.
−1000
2000
1000
0
−2000 400020000
EdamerGoudaFeta
Emmentaler
PC5
(4%
)
PC2 (13%)
Figure 5: PCA of cheese types in the aliphatic region (3.0–0.25 ppm).
To overcome these problems, we used Partial LeastSquares regression (PLS) to correlate NMR spectra (in the 6–0.25 ppm range) to the data of reference GC analysis. Results(i.e., root mean square error (RMSE), correlation coefficient(𝑅2), the number of PLS factors as well as NMR range used)of the best-fitting PLS models for ice creams were listed inTable 1. Fourteen of seventeen models exhibited correlationcoefficients greater than 0.90. The correlation coefficients forbutyric acid (𝑅 = 0.89), octadecanoic acid (𝑅 = 0.83),and nonadecanoic acid (𝑅 = 0.89) also appeared to beadequate for a screening procedure.The separate PLSmodelsconstructed for cheese showed slightly lower but comparableperformance (𝑅2 values were in the range of 0.75–0.95).Inadequate PLS models (𝑅2 < 0.50) were only obtained for
pentadecanoic acid, margaric acid, octadecanoic acid, andnonadecanoic acid for cheese samples (in comparison toice cream, Table 1) due to the small concentrations of thesecompounds.
The PLS prediction models described previously werevalidated with an independent set of ten randomly chosensamples (only the acceptable models with 𝑅2 > 0.90 wereconsidered). The average relative deviations of the predictedvalues from the GC ones were in the range of 2–10% and5–15% for ice cream and cheese samples. These data clearlydemonstrated the reliability of themodels and the potential ofthis technique for simultaneous quantitative analysis of dairyproduct characteristics along with the nontargeted control.
Therefore, we have extended quantitative NMR spec-troscopy to 17 compounds that have to be analyzed duringfood control. In principle, NMR spectra contain the sameinformation as GC but can be gathered much faster andmore efficiently. The results emphasized the capability ofNMR to rapidly and reliably predict cheese and ice creamcharacteristics.
4. Conclusions
Traditional analytical strategies to uncover adulteration offood rely on targeted analysis (in the course of which onlycertain marker compounds are analyzed). This approachhas obstacles on many points, in particular, starting fromtime of analysis, use of sophisticated analytical equipment,or usage of expensive and/or toxic reagents. What is moreimportant is that new forms of adulteration could not beuncovered as in the case of melamine adulteration of milk byapplying the unspecific Kjeldahl assay [30]. A demand existsfor rapid, accurate, and cheaper methods for direct qualitymeasurement of food and food ingredients, which shouldinclude a nontargeted approach.
Spectroscopic techniques combined with chemometricmethods are a possible solution of this problem. From thewide range of spectroscopic methods, the high amount ofspectral information of NMR is ideally suited for nontargetedanalysis. This approach has only recently entered routineanalysis in food control institutions. Examples are the inves-tigation of infant formulas [30], pine nuts [31], or milk andmilk substitutes [49]. This study has further shown thatNMR is an efficient tool to detect fraud in the dairy productindustry, protecting consumers against improper practices,and guaranteeing fair trade.
The method of automated sample preparation (WeibullStoldt hydrolysis) used in this paper appears to be extremelyefficient, especially when dealing with a high number ofsamples to be analyzed using multivariate methods. Thisprocedure allowed the collection of high-quality spectra withdistinct spectral features that were consistent within eachsample. The developed technique could be further applied tosolve other classification problems (differentiation betweenmilk fat from different animals besides cows, or geographicdiscrimination) and shows great promise as a rapid tool forcheese analysis.

International Journal of Food Science 7
Table 1: PLS correlation between data of reference GC analysis and NMR spectra (6.0–0.25 ppm) for ice cream (𝑛 = 99).
Analytes Reference range PLS factors Calibration ValidationRMSEa
𝑅2 RMSE 𝑅
2
Butyric acid (C4:0) (%) 0–25 7 0.21 0.89 0.24 0.85Caproic acid (C6:0) (%) 0–1.9 7 0.15 0.87 0.17 0.84Octanoic acid (C8:0) (%) 0–8.4 4 0.33 0.93 0.37 0.92𝑛-Capric acid (C10:0) (%) 0–6.7 4 0.28 0.91 0.33 0.87Dodecanoic acid (C12:0) (%) 0–43.5 6 1.2 0.97 1.6 0.96Tetradecanoic acid (C14:0) (%) 0–20.3 5 0.70 0.94 0.84 0.92Myristoleic acid (C14:1) (%) 0–1.1 6 0.072 0.91 0.089 0.87Hexadecanoic acid (C16:0) (%) 9.7–40.6 6 1.1 0.96 1.39 0.94Palmitoleic acid (C16:1) (%) 0–1.7 6 0.09 0.94 0.11 0.91Oleic acid (C18:1) (%) 5.2–60.7 4 1.0 0.99 1.5 0.97Pentadecanoic acid (C15:0) (%) 0–1.6 7 0.099 0.93 0.12 0.90Margaric acid (C17:0) (%) 0–0.8 7 0.04 0.92 0.05 0.89Octadecanoic acid (C18:0) (%) 3.9–36 5 1.0 0.83 1.2 0.76Nonadecanoic acid (C19:0) (%) 0–1.1 7 0.02 0.89 0.04 0.78cis. cis-9.12-Octadecadienoic acid (C18:2) (%) 0.3–22.8 7 0.25 0.99 0.39 0.97Methyl butanoate (g/100 g fat) 0–3.8 7 0.11 0.99 0.18 0.97Hexanoic acid methyl ester (g/100 g fat) 0.04–2.24 7 0.07 0.98 0.09 0.96aRoot mean-squared error (RMSE) values are expressed in the same units as the analytes.
Acknowledgments
The authors warmly thank H. Heger, M. Bohm, B. Siebler,and J. Geisser for excellent technical assistance. G. Raiberand M. Kranz (Gerhardt Analytical Systems) are thankedfor their support in introducing the automatic Weibull-Stoldt hydrolysis to the authors’ routine analysis. The viewsexpressed in this paper do not necessarily reflect those of theMinistry of Rural Affairs and Consumer Protection.
References
[1] A. Beardsworth and T. Keil, “The vegetarian option: varieties,conversions, motives and careers,” Sociological Review, vol. 40,pp. 253–293, 1992.
[2] N. Sutar, P. P. Sutar, and G. Singh, “Evaluation of different soy-bean varieties for manufacture of soy ice cream,” InternationalJournal of Dairy Technology, vol. 63, no. 1, pp. 136–142, 2010.
[3] A. I.W. Rosnani, I. N. Aini, A.M.M. Yazid, andM.H.Dzulkifly,“Flow properties of ice cream mix prepared from palm oil:anhydrous milk fat blends,” Pakistan Journal of BiologicalSciences, vol. 10, no. 10, pp. 1691–1696, 2007.
[4] H. Bachmann, “Cheese analogues: a review,” InternationalDairyJournal, vol. 11, no. 4–7, pp. 505–515, 2001.
[5] C. R. Cunha, A. I. Dias, and W. H. Viotto, “Microstructure,texture, colour and sensory evaluation of a spreadable processedcheese analogue made with vegetable fat,” Food Research Inter-national, vol. 43, no. 3, pp. 723–729, 2010.
[6] N. Noronha, E. D. O’Riordan, andM. O’Sullivan, “Replacementof fat with functional fibre in imitation cheese,” InternationalDairy Journal, vol. 17, no. 9, pp. 1073–1082, 2007.
[7] M. Montalto, V. Curigliano, L. Santoro et al., “Managementand treatment of lactose malabsorption,” World Journal ofGastroenterology, vol. 12, no. 2, pp. 187–191, 2006.
[8] D. Sanchez-Macias, M. Fresno, I. Moreno-Indias et al., “Physic-ochemical analysis of full-fat, reduced-fat, and low-fat artisan-style goat cheese,” Journal of Dairy Science, vol. 93, no. 9, pp.3950–3956, 2010.
[9] K. Raynal-Ljutovac, G. Lagriffoul, P. Paccard, I. Guillet, and Y.Chilliard, “Composition of goat and sheep milk products: anupdate,” Small Ruminant Research, vol. 79, no. 1, pp. 57–72, 2008.
[10] A. Rehm, “Kase ist nicht gleich Kase,” Ernahrung im Fokus, vol.11, pp. 538–541, 2011.
[11] I. V. Wolf, M. C. Perotti, S. M. Bernal, and C. A. Zalazar,“Study of the chemical composition, proteolysis, lipolysisand volatile compounds profile of commercial ReggianitoArgentino cheese: characterization of Reggianito Argentinocheese,” Food Research International, vol. 43, no. 4, pp. 1204–1211, 2010.
[12] J. M. Poveda, E. Sanchez-Palomo, M. S. Perez-Coello, andL. Cabezas, “Volatile composition, olfactometry profile andsensory evaluation of semi-hard Spanish goat cheeses,” DairyScience and Technology, vol. 88, no. 3, pp. 355–367, 2008.
[13] A. A. Hayaloglu, E. Y. Brechany, K. C. Deegan, and P. L. H.McSweeney, “Characterization of the chemistry, biochemistryand volatile profile of Kuflu cheese, a mould-ripened variety,”Lebensmittel-Wissenschaft& Technologie, vol. 41, no. 7, pp. 1323–1334, 2008.
[14] S. Bonetta, J. D. Coısson, D. Barile et al., “Microbiological andchemical characterization of a typical Italian cheese: Robiola diRoccaverano,” Journal of Agricultural and Food Chemistry, vol.56, no. 16, pp. 7223–7230, 2008.
[15] S. Panseri, I. Giani, T. Mentasti, F. Bellagamba, F. Caprino,and V. M. Moretti, “Determination of flavour compounds ina mountain cheese by headspace sorptive extraction-thermaldesorption-capillary gas chromatography-mass spectrometry,”Lebensmittel-Wissenschaft & Technologie, vol. 41, no. 2, pp. 185–192, 2008.

8 International Journal of Food Science
[16] A. Castell-Palou, C. Rossello, A. Femenia, and S. Simal, “Appli-cation of multivariate statistical analysis to chemical, physicaland sensory characteristics of Majorcan cheese,” InternationalJournal of Food Engineering, vol. 6, no. 2, article 9, 2010.
[17] S. Hauff and W. Vetter, “Quantification of branched chain fattyacids in polar and neutral lipids of cheese and fish samples,”Journal of Agricultural and Food Chemistry, vol. 58, no. 2, pp.707–712, 2010.
[18] A. Subramanian, W. J. Harper, and L. E. Rodriguez-Saona,“Rapid prediction of composition and flavor quality of cheddarcheese using ATR-FTIR spectroscopy,” Journal of Food Science,vol. 74, no. 3, pp. C292–C297, 2009.
[19] N. A. Kocaoglu-Vurma, A. Eliardi, M. A. Drake, L. E.Rodriguez-Saona, and W. J. Harper, “Rapid profiling of swisscheese by attenuated total reflectance (ATR) infrared spec-troscopy and descriptive sensory analysis,” Journal of FoodScience, vol. 74, no. 6, pp. S232–S239, 2009.
[20] C. M. Andersen, M. B. Frøst, and N. Viereck, “Spectroscopiccharacterization of low- and non-fat cream cheeses,” Interna-tional Dairy Journal, vol. 20, no. 1, pp. 32–39, 2010.
[21] A. Lucas, D. Andueza, E. Rock, and B. Martin, “Predictionof dry matter, fat, pH, vitamins, minerals, carotenoids, totalantioxidant capacity, and color in fresh and freeze-dried cheesesby visible-near-infrared reflectance spectroscopy,” Journal ofAgricultural and Food Chemistry, vol. 56, no. 16, pp. 6801–6808,2008.
[22] G. Cozzi, J. Ferlito, G. Pasini, B. Contiero, and F. Gottardo,“Application of near-infrared spectroscopy as an alternative tochemical and color analysis to discriminate the productionchains of Asiago d’Allevo cheese,” Journal of Agricultural andFood Chemistry, vol. 57, no. 24, pp. 11449–11454, 2009.
[23] R. Moreno-Rojas, P. J. Sanchez-Segarra, F. Camara-Martos,and M. A. Amaro-Lopez, “Multivariate analysis techniques astools for categorization of Southern Spanish cheeses: nutritionalcomposition andmineral content,” European Food Research andTechnology, vol. 231, no. 6, pp. 841–851, 2010.
[24] A. Lante, G. Lomolino, M. Cagnin, and P. Spettoli, “Contentand characterisation of minerals in milk and in Crescenza andSquacquerone Italian fresh cheeses by ICP-OES,” Food Control,vol. 17, no. 3, pp. 229–233, 2006.
[25] M. A. Brescia, M. Monfreda, A. Buccolieri, and C. Carrino,“Characterisation of the geographical origin of buffalo milkandmozzarella cheese bymeans of analytical and spectroscopicdeterminations,” Food Chemistry, vol. 89, no. 1, pp. 139–147,2005.
[26] G. Le Gall and I. J. Colquhoun, Food Authenticity and Traceabil-ity, M. Lees eds, Woodhead Publishing, Cambridge, UK, 2003.
[27] D. W. Lachenmeier, W. Frank, E. Humpfer et al., “Qualitycontrol of beer using high-resolution nuclear magnetic reso-nance spectroscopy and multivariate analysis,” European FoodResearch and Technology, vol. 220, no. 2, pp. 215–221, 2005.
[28] P. S. Belton, I. J. Colquhoun, E. K. Kemsley et al., “Applicationof chemometrics to the 1H NMR spectra of apple juices:discrimination between apple varieties,” FoodChemistry, vol. 61,no. 1-2, pp. 207–213, 1998.
[29] L. Forveille, J. Vercauteren, and D. N. Rutledge, “Multivariatestatistical analysis of two-dimensional NMR data to differenti-ate grapevine cultivars and clones,” Food Chemistry, vol. 57, no.3, pp. 441–450, 1996.
[30] D. W. Lachenmeier, H. Eberhard, F. Fang et al., “NMR-spectroscopy for nontargeted screening and simultaneous
quantification of health-relevant compounds in foods: theexample of melamine,” Journal of Agricultural and Food Chem-istry, vol. 57, no. 16, pp. 7194–7199, 2009.
[31] H. Kobler, Y. B.Monakhova, T. Kuballa et al., “Nuclearmagneticresonance spectroscopy and chemometrics to identify pine nutsthat cause taste disturbance,” Journal of Agricultural and FoodChemistry, vol. 59, no. 13, pp. 6877–6881, 2011.
[32] R. Lamanna, I. Piscioneri, V. Romanelli, and N. Sharma,“A preliminary study of soft cheese degradation in differentpackaging conditions by 1H-NMR,” Magnetic Resonance inChemistry, vol. 46, no. 9, pp. 828–831, 2008.
[33] D. Rodrigues, C. H. Santos, T. A. P. Rocha-Santos, A.M.Gomes,B. J. Goodfellow, and A. C. Freitas, “Metabolic profiling ofpotential probiotic or synbiotic cheeses by nuclear magneticresonance (NMR) spectroscopy,” Journal of Agricultural andFood Chemistry, vol. 59, no. 9, pp. 4955–4961, 2011.
[34] R. Consonni and L. R. Cagliani, “Ripening and geographicalcharacterization of Parmigiano Reggiano cheese by 1H NMRspectroscopy,” Talanta, vol. 76, no. 1, pp. 200–205, 2008.
[35] S. De Angelis Curtis, R. Curini, M. Delfini, E. Brosio, F.D’Ascenzo, and B. Bocca, “Amino acid profile in the ripeningof Grana Padano cheese: a NMR study,” Food Chemistry, vol. 71,no. 4, pp. 495–502, 2000.
[36] E. Schievano, K. Guardini, and S. Mammi, “Fast determinationof histamine in cheese by nuclear magnetic resonance (NMR),”Journal of Agricultural and Food Chemistry, vol. 57, no. 7, pp.2647–2652, 2009.
[37] M. Gobet, C. Rondeau-Mouro, S. Buchin et al., “Distributionand mobility of phosphates and sodium ions in cheese by solid-state 31P and double-quantumfiltered 23NaNMR spectroscopy,”Magnetic Resonance in Chemistry, vol. 48, no. 4, pp. 297–303,2010.
[38] A. Castell-Palou, C. Rossello, A. Femenia, J. Bon, and S.Simal, “Moisture profiles in cheese drying determined by TD-NMR:mathematical modeling ofmass transfer,” Journal of FoodEngineering, vol. 104, no. 4, pp. 525–531, 2011.
[39] T. Lucas, D. Le Ray, P. Barey, and F. Mariette, “NMR assessmentof ice cream: effect of formulation on liquid and solid fat,”International Dairy Journal, vol. 15, no. 12, pp. 1225–1233, 2005.
[40] T. Lucas, M. Wagener, P. Barey, and F. Mariette, “NMR assess-ment ofmix and ice cream. Effect of formulation on liquidwaterand ice,” International Dairy Journal, vol. 15, no. 10, pp. 1064–1073, 2005.
[41] F. Mariette and T. Lucas, “NMR signal analysis to attribute thecomponents to the solid/liquid phases present in mixes and icecreams,” Journal of Agricultural and Food Chemistry, vol. 53, no.5, pp. 1317–1327, 2005.
[42] G. S. Remaud, Y. Martin, G. G. Martin, and G. J. Martin,“Detection of sophisticated adulterations of natural vanillaflavors and extracts: application of the SNIF-NMR to methodvanillin and p-hydroxybenzaldehyde,” Journal of Agriculturaland Food Chemistry, vol. 45, no. 3, pp. 859–866, 1997.
[43] F. Locci, R. Ghiglietti, S. Francolino et al., “Detection of cowmilk in cooked buffalo Mozzarella used as Pizza topping,” FoodChemistry, vol. 107, no. 3, pp. 1337–1341, 2008.
[44] J. Fontecha, I. Mayo, G. Toledano, and M. Juarez, “Triacyl-glycerol composition of protected designation of origin cheesesduring ripening. Authenticity of milk fat,” Journal of DairyScience, vol. 89, no. 3, pp. 882–887, 2006.
[45] G. Knothe and J. A. Kenar, “Determination of the fatty acidprofile by 1H-NMR spectroscopy,” European Journal of LipidScience and Technology, vol. 106, no. 2, pp. 88–96, 2004.

International Journal of Food Science 9
[46] E. Schievano, G. Pasini, G. Cozzi, and S.Mammi, “Identificationof the production chain of Asiago d’Allevo cheese by nuclearmagnetic resonance spectroscopy and principal componentanalysis,” Journal of Agricultural and Food Chemistry, vol. 56,no. 16, pp. 7208–7214, 2008.
[47] R. Karoui and J. De Baerdemaeker, “A review of the analyticalmethods coupledwith chemometric tools for the determinationof the quality and identity of dairy products,” Food Chemistry,vol. 102, no. 3, pp. 621–640, 2007.
[48] L. Shintu and S. Caldarelli, “Toward the determination of thegeographical origin of emmental(er) cheese via high resolutionMASNMR: a preliminary investigation,” Journal of Agriculturaland Food Chemistry, vol. 54, no. 12, pp. 4148–4154, 2006.
[49] Y. B. Monakhova, T. Kuballa, J. Leitz et al., “NMR spectroscopyas a screening tool to validate nutrition labeling ofmilk, lactose-free milk, and milk substitutes based on soy and grains,” DairyScience and Technology, vol. 92, no. 2, pp. 109–120, 2012.

Submit your manuscripts athttp://www.hindawi.com
Hindawi Publishing Corporationhttp://www.hindawi.com Volume 2014
Anatomy Research International
PeptidesInternational Journal of
Hindawi Publishing Corporationhttp://www.hindawi.com Volume 2014
Hindawi Publishing Corporation http://www.hindawi.com
International Journal of
Volume 2014
Zoology
Hindawi Publishing Corporationhttp://www.hindawi.com Volume 2014
Molecular Biology International
GenomicsInternational Journal of
Hindawi Publishing Corporationhttp://www.hindawi.com Volume 2014
The Scientific World JournalHindawi Publishing Corporation http://www.hindawi.com Volume 2014
Hindawi Publishing Corporationhttp://www.hindawi.com Volume 2014
BioinformaticsAdvances in
Marine BiologyJournal of
Hindawi Publishing Corporationhttp://www.hindawi.com Volume 2014
Hindawi Publishing Corporationhttp://www.hindawi.com Volume 2014
Signal TransductionJournal of
Hindawi Publishing Corporationhttp://www.hindawi.com Volume 2014
BioMed Research International
Evolutionary BiologyInternational Journal of
Hindawi Publishing Corporationhttp://www.hindawi.com Volume 2014
Hindawi Publishing Corporationhttp://www.hindawi.com Volume 2014
Biochemistry Research International
ArchaeaHindawi Publishing Corporationhttp://www.hindawi.com Volume 2014
Hindawi Publishing Corporationhttp://www.hindawi.com Volume 2014
Genetics Research International
Hindawi Publishing Corporationhttp://www.hindawi.com Volume 2014
Advances in
Virolog y
Hindawi Publishing Corporationhttp://www.hindawi.com
Nucleic AcidsJournal of
Volume 2014
Stem CellsInternational
Hindawi Publishing Corporationhttp://www.hindawi.com Volume 2014
Hindawi Publishing Corporationhttp://www.hindawi.com Volume 2014
Enzyme Research
Hindawi Publishing Corporationhttp://www.hindawi.com Volume 2014
International Journal of
Microbiology