Research Article Human Skeleton Model Based Dynamic...
16
Research Article Human Skeleton Model Based Dynamic Features for Walking Speed Invariant Gait Recognition Jure KovaI and Peter Peer Faculty of Computer and Information Science, University of Ljubljana, Trˇ zaˇ ska 25, 1000 Ljubljana, Slovenia Correspondence should be addressed to Jure Kovaˇ c; [email protected] Received 1 October 2013; Revised 19 December 2013; Accepted 23 December 2013; Published 21 January 2014 Academic Editor: Yue Wu Copyright © 2014 J. Kovaˇ c and P. Peer. is is an open access article distributed under the Creative Commons Attribution License, which permits unrestricted use, distribution, and reproduction in any medium, provided the original work is properly cited. Humans are able to recognize small number of people they know well by the way they walk. is ability represents basic motivation for using human gait as the means for biometric identification. Such biometrics can be captured at public places from a distance without subject’s collaboration, awareness, and even consent. Although current approaches give encouraging results, we are still far from effective use in real-life applications. In general, methods set various constraints to circumvent the influence of covariate factors like changes of walking speed, view, clothing, footwear, and object carrying, that have negative impact on recognition performance. In this paper we propose a skeleton model based gait recognition system focusing on modelling gait dynamics and eliminating the influence of subjects appearance on recognition. Furthermore, we tackle the problem of walking speed variation and propose space transformation and feature fusion that mitigates its influence on recognition performance. With the evaluation on OU-ISIR gait dataset, we demonstrate state of the art performance of proposed methods. 1. Introduction Psychological studies showed that humans have small but significant ability to recognize people they know well by their gait. is ability has encouraged the research for using gait as the means of biometric identification. Early studies on Point Light Displays (PLD) [1], which enable isolated study of motion by removing all other contexts from observed subjects, confirmed this ability. Commonly used biometrics based on fingerprints, face, iris, and so forth have two obvious deficiencies. ey perform badly at low image resolutions and need active user partic- ipation. Gait on the other hand does not suffer from these deficiencies. It can be captured with ordinary equipment without individual’s awareness or even consent. e main deficiencies of such biometrics are the unknown level of uniqueness and covariate factors that change gait charac- teristics. ese can be external (changes of view, direction, or speed of movement, illumination conditions, weather, clothing, footwear, terrain, etc.) or internal (changes due to illness, injuries, ageing, pregnancy, etc.). Problems are also caused by uncertain measurements, occlusions, and the use of noninvasive acquiring techniques (without sensors or markers). All these negatively influence the recognition performance in real-life environment, which is still too weak for efficient use in biometry. Methods can be categorized into two main groups. Model based approaches [2–5] build the model of human body or its movement in 3D and acquire gait parameters from this model (e.g., step dimensions, cadence, human skeleton, body dimensions, locations and orientations of body parts, joint kinematics, etc.). e methods of this group mostly focus on gait dynamics and less on appearance of individuals, which makes them more resistant to problems like changes of view and scale but in general do not achieve as good results as methods that also consider appearance. Furthermore, such methods are computationally demanding and especially susceptible to problems like occlusions. Model-free approaches [6–9] acquire gait parameters by performing measurements directly on 2D images, without adopting specific model of human body or motion. Fea- ture correspondence in consecutive images is obtained by prediction of speed, shape, texture, and color. ey mostly use geometric representations like silhouettes, optical flow, Hindawi Publishing Corporation Mathematical Problems in Engineering Volume 2014, Article ID 484320, 15 pages http://dx.doi.org/10.1155/2014/484320
Transcript of Research Article Human Skeleton Model Based Dynamic...

Research ArticleHuman Skeleton Model Based Dynamic Features for WalkingSpeed Invariant Gait Recognition
Jure KovaI and Peter Peer
Faculty of Computer and Information Science University of Ljubljana Trzaska 25 1000 Ljubljana Slovenia
Correspondence should be addressed to Jure Kovac jurekovacfriuni-ljsi
Received 1 October 2013 Revised 19 December 2013 Accepted 23 December 2013 Published 21 January 2014
Academic Editor Yue Wu
Copyright copy 2014 J Kovac and P PeerThis is an open access article distributed under the Creative Commons Attribution Licensewhich permits unrestricted use distribution and reproduction in any medium provided the original work is properly cited
Humans are able to recognize small number of people they knowwell by the way they walkThis ability represents basic motivationfor using human gait as the means for biometric identification Such biometrics can be captured at public places from a distancewithout subjectrsquos collaboration awareness and even consent Although current approaches give encouraging results we are still farfromeffective use in real-life applications In generalmethods set various constraints to circumvent the influence of covariate factorslike changes of walking speed view clothing footwear and object carrying that have negative impact on recognition performanceIn this paper we propose a skeleton model based gait recognition system focusing on modelling gait dynamics and eliminating theinfluence of subjects appearance on recognition Furthermore we tackle the problem of walking speed variation and propose spacetransformation and feature fusion that mitigates its influence on recognition performance With the evaluation on OU-ISIR gaitdataset we demonstrate state of the art performance of proposed methods
1 Introduction
Psychological studies showed that humans have small butsignificant ability to recognize people they knowwell by theirgait This ability has encouraged the research for using gaitas the means of biometric identification Early studies onPoint Light Displays (PLD) [1] which enable isolated studyof motion by removing all other contexts from observedsubjects confirmed this ability
Commonly used biometrics based on fingerprints faceiris and so forth have two obvious deficienciesThey performbadly at low image resolutions and need active user partic-ipation Gait on the other hand does not suffer from thesedeficiencies It can be captured with ordinary equipmentwithout individualrsquos awareness or even consent The maindeficiencies of such biometrics are the unknown level ofuniqueness and covariate factors that change gait charac-teristics These can be external (changes of view directionor speed of movement illumination conditions weatherclothing footwear terrain etc) or internal (changes dueto illness injuries ageing pregnancy etc) Problems arealso caused by uncertain measurements occlusions and the
use of noninvasive acquiring techniques (without sensorsor markers) All these negatively influence the recognitionperformance in real-life environment which is still too weakfor efficient use in biometry
Methods can be categorized into twomain groupsModelbased approaches [2ndash5] build the model of human bodyor its movement in 3D and acquire gait parameters fromthis model (eg step dimensions cadence human skeletonbody dimensions locations and orientations of body partsjoint kinematics etc) The methods of this group mostlyfocus on gait dynamics and less on appearance of individualswhichmakes themmore resistant to problems like changes ofview and scale but in general do not achieve as good resultsas methods that also consider appearance Furthermoresuchmethods are computationally demanding and especiallysusceptible to problems like occlusions
Model-free approaches [6ndash9] acquire gait parameters byperforming measurements directly on 2D images withoutadopting specific model of human body or motion Fea-ture correspondence in consecutive images is obtained byprediction of speed shape texture and color They mostlyuse geometric representations like silhouettes optical flow
Hindawi Publishing CorporationMathematical Problems in EngineeringVolume 2014 Article ID 484320 15 pageshttpdxdoiorg1011552014484320
2 Mathematical Problems in Engineering
joint trajectories history of movement and so forth Themethods do not rely only on gait dynamics but also measurethe individual during movementmdashwith it they also takeappearance of individual into consideration Methods aretherefore less sensitive to covariate factors that result invariations of gait dynamics (eg ageing illness and walkingspeed change) but more susceptible to factors that result inchanges of appearance (eg clothing obesity hairstyle etc)changes of view and direction of movement
Although several gait recognition methods demonstrateimpressive performance under controlled (in-lab) environ-ment setups [2 3 5ndash7 9 10] the use of gait recognition inreal-life application is still limited mostly because of covari-ate factors that influence individualrsquos gait and therefore makerecognition task more difficult (eg view changes walkingspeed changes occlusions etc) Nevertheless examples ofreal-life applications using gait analysis exist Authors in [1112] demonstrate how monitoring gait motion parameters ofresidents in the senior housing facility can detect anomaliesin residentrsquos movements [11] and also discriminate andrecognize facility residents and visitors [12] Suchmonitoringcan be used for fall risk assessment detection of healthproblems and monitoring of patients during rehabilitationAlthough authors do not specifically handle covariate factorsthey propose an efficient way for eliminatingwalking samplesthat do not conform to constraints posed by gait analysismethods
However often in other real-life scenarios only limitednumber of individualrsquos walking samples are available (egsecurity cameras) which can also be short contain only afew steps and are influenced by several previouslymentionedcovariate factors Under such circumstances these covariatefactors must be dealt with in order to make walking samplesuseful for gait analysis Our work focuses on variationsof walking speed since it represents one of the majorcovariate factors that affect gait recognition performance isalmost always present in real-life environment and there-fore requires special attention Several approaches handlingchanging walking speed exist in the literature The mostoutstanding are summarized below but as opposed to ourwork none of them are model based and none of them usessolely gait dynamics for recognition task
Authors in [8] researched the influence of walking speedchanges to recognition performance based on cadence andstep length and suggested the improvement by silhouettenormalization Authors proposed a stride normalization ofdouble-support gait silhouettes based on a statistical relationbetween the walking speed and the strideThey used baselinealgorithm [7] on only five silhouettes of gait cycle (twosingle-support images and three double-support images) forrecognition and discarded the other still informative images
Furthermore authors in [13] used geometrical transfor-mations to applywalking speednormalization to averaged sil-houette [6] and Probabilistic Spatiotemporal Model (PSTM)[10] and demonstrated how negative effects of walking speedchanges can be mitigated to improve recognition perfor-mance
Authors in [14] proposed aHMM-based time-normalizedgait feature extraction with standard gait poses and tested it
on the slow and fast walking dataThemethod does howevernot consider spatial changes (eg stride changes)
Authors in [15] introduced a spatiotemporal ShapeVariation-Based Frieze Pattern (SVB frieze pattern) represen-tation for gait which captures motion information over timeand represents normalized frame difference over gait cyclesA temporal symmetry map of gait patterns is constructedand combined with verticalhorizontal SVB frieze patternsfor measuring the dissimilarity between gait sequences
Authors in [16] proposed an approach based on DynamicTimeWarping (DTW) which uses a set of DTW functions torepresent the distribution of gait patterns using uniform andwrapped-Gaussian distributions
Authors in [17] proposed a three-way (119909- 119910- and time-axis) method of autocorrelation that effectively extractedspatio-temporal local geometric features to characterizemotions called Cubic Higher-order Local Autocorrelation(CHLAC) It is relatively robust against variations in walkingspeed since it only uses the sums of local features over agait sequence and thus does not explicitly use the phaseinformation of the gait Researchers have assumed thatwalking speed does not change much within or across gaitsequences
Authors in [18] separated static and dynamic featuresfrom gait silhouettes by fitting a human model and thencreated a factorization based speed transformation model forthe dynamic features using a training set for multiple personson multiple speeds The model can transform the dynamicfeatures from a reference speed to another arbitrary speed
Authors in [19] propose a new descriptor named Higher-order derivative Shape Configuration (HSC) which cangenerate robust feature when body shape changes due tovarying walking speed Procrustes shape analysis was usedfor gait signature and HSC is able to retain discriminativeinformation in the gait signatures while it is still ableto tolerate the varying walking speed They upgraded themethod by introducing a Differential Composition Model(DCM) [20] which differentiates different effects caused bywalking speed changes on various human body parts
Human body skeleton model is proved to be an effectivetool for representing human motion and was thereforeadapted by several model based gait recognition approaches[3 4] Similar as authors in [3] we acquire gait signature bysegmenting 2D human skeleton from silhouette images andthen use this model to further extract motion parametersOn the other hand authors in [4] first acquire individualrsquosgaitrsquos characteristics by the principle of deformable templatematching and then use view decomposing principle ofgeneral viewing angle and prior constraints from generalknowledge of human body to impose gait characteristics togeneric 3D skeleton model
Authors in [3 4] both assume that subjects are walkingwith constant (ie normal) speed Moreover authors in [3]do not handle any covariate factors at all while authors in [4]achieve some degree of view invariance by reconstructing a3D bodymodel Both worksmainly use static gait parameterslike subjectrsquos height gait frequency stride length and evenwalking speed itself which are all highly discriminativeunder unchanged normal-walking conditions but on the
Mathematical Problems in Engineering 3
other hand very susceptible to for example perspectivedeformations caused by view change and gait dynamicstransformations caused by walking speed change Althoughdynamic gait parameters are also used they are not fullyutilized for the recognition task Authors in [3] use onlymeans and standard deviations of main joint angles whileauthors in [4] only use motion trajectories of main jointsBoth are similarly susceptible to covariate factors as staticfeatures
As opposed to both of these works our focus is ondynamic motion parameters only We observe time series ofchanging joint angles angle phase differences mass ratiosof different body parts distances of body parts from bodycenter and so forth through the entire gait sequence Theseare less sensitive to covariate factors that greatly affect theappearance of individualrsquos gait
We argue that although dynamic features are claimed tobe less discriminative than static features they still containenough discriminator power to achieve comparable recogni-tion performance to appearance based methods and are atthe same time more resistant and easily adoptable to handlecovariate factors that exist in real-life scenarios Our maincontributions are as follows
(i) feature space transformation based on statisticalmodel of different walking speeds to compensate forwalking speed changes in dynamic gait features
(ii) feature fusion scheme that enables the use of perfeature classifiers as a weak classifiers that are fusedinto the final distance based classifier
(iii) image moments based cycle detection stage thatenables almost perfect gait phase alignment amongdifferent video sequences which is crucial for dis-tance based classification on time series signal basedfeatures
The remainder of this paper is organized as followsIn Section 2 we will introduce the procedure for extract-ing human skeletons from silhouette images Section 3 willdiscuss the details of acquiring gait signals and motionparameters from skeletonmodels and introduce the proposedfeature space transformation which helps mitigate the effectsof changed walking speed on recognition performance InSection 4 we will describe classification procedure based onproposed feature fusion scheme and in Section 5 we willpresent the results and analysis of performed experimentstogether with comparison to related walking speed invariantstate-of-the-art methods Finally we will provide some direc-tions for future work in the conclusion
2 Skeleton Segmentation
Input video must first be processed to acquire silhouettesof walking subjects We use Gaussian mixture based back-ground subtraction to acquiremotion foreground which cor-responds to subjectsrsquos silhouettes that are further processedby morphology operations to improve their quality Since
most of the gait datasets already provide extracted silhou-ettes we use standard procedures for silhouette extractionwhen required and do not pay special attention to motionsegmentation procedure as this is another active researcharea (see [21] for recent advancements)Therefore we assumethat silhouettes of decent quality are either provided oracquired as the input to our method It means that extractedsilhouettes must conform to the constraints posed by rela-tively complex skeleton segmentation procedure For exam-ple walking subjects which are far away from the cameramight appear too small in the video to effectively distinguishhuman body parts (limbs head etc) Despite the silhou-ette quality constraint posed in this work we still providemethods for handling low quality and noisy silhouettes inSection 45
We adopt the skeleton extraction procedure from [3]since their method uses simple segmentation steps for deriv-ing skeletons based on single view 2D motion sequenceswhich turned out to supply sufficient gait information for gaitbased identification Our segmentation procedure containsthe following steps
First we extract silhouette contour from every imageof the sequence Then calculate body height and segmentlengths based on average anatomical properties of humanbody [22] For a body height 119867 the initial estimate of thevertical position of the neck shoulder waist pelvis knee andankle was set to be 0870119867 0818119867 0530119867 0480119867 0285119867and 0039119867 respectively
Next we divide silhouette into individual body parts(head neck torso waist upper legs bottom left rightleg and left and right feet) based on calculated segmentlengths (Figure 1(a)) For each body segment we then findleft most and right most contour points and calculate theirmiddle (Figure 1(b)) After that we fit lines through thispoints using Hough transformation and chose the line withlargest value in accumulation field Such fitting is morerobust to errors as opposed to linear regression used in[3] (Figure 1(c))
While upper body part segmentation is straightforwardthe lower body part (thighs and shins) is much harder toextract and must therefore be specially handled First wedetect shin bones Especially during single support phaseonly one segment is detected in lower body part Thereforeboth legs are represented by single body segment In thiscase left and right most contour points are used as left andright bone angles In the case of double support each shinis represented by its own body segment and middle pointsof both segments are used similar to those in upper bodypart The thigh bone angles are then derived from torsolover midpoint and starting points of both left and rightshins Finally we compute bone endpoints from bone start-ing points derived angles and segment length estimations(Figure 1(d))
Extracted bones form a simplified (no arms shouldersetc) skeleton of human body for single silhouette frameRaw gait signature is then acquired by detecting skeletons onall frames of the input video Such signature enables directextraction of bone and joint angles which form time-seriessignals that can be used for recognition
4 Mathematical Problems in Engineering
(a) (b) (c) (d)
Figure 1 Skeleton segmentation algorithm in steps
3 Gait Signal Extraction
Several gait signals are extracted from acquired skeletonsignatures
(i) body part angles head neck torso left and rightthighs and left and right shins
(ii) joint locations left and right knees and ankles(iii) masses and centres of mass (COM) for the whole
silhouette and individual body parts(iv) silhouette width and height
All these so-called raw signals represent the basis for thederived signals which are actually used in recognition systemlater By definition joint angles are measured as one jointrelative to the other so relative joint angles are derived fromextracted raw angle values At normalwalking torso is almostvertical so relative hip angle (thigh bone angle) is the sameas extracted value while relative knee angle is calculated as
120579knee = 120579thigh minus 120579shin (1)
Phase difference of thighs and shins describe the correlationamong left and right thighs or left and right shins and can bevery specific for walking subjects
120579tphs = 120579thigh1
minus 120579thigh2
(2)
Body part mass ratio represents the ratio between masses ofspecific body parts and the mass of entire body
119876119898119894
=
119898119894
119898
(3)
Body part center of mass distance represents the distances ofcenter of mass of specific body parts to the center of mass forthe entire body
119863119888119894= radic(119888
119894119909minus 119888119909)2
+ (119888119894119910minus 119888119910)
2
(4)
The total of 64 feature signals are extracted and later usedin classification
31 Image Moments Based Motion Parameters Imagemoments for binary images and its derivatives especiallyCOM turned out very useful for gait motion parametersestimation Their use for estimating gait frequency gait cyclestarts and gait phases (double single support) is describedbelow
Image moments are defined as
119872119894119895= sum
119909
sum
119910
119909119894
119910119895
119868 (119909 119910) (5)
where 119894119895 is the order of the moment and 119868(119909 119910) is the imagevalue at point (119909 119910) Since binary silhouette images containvalues either 0 or 1 its COM can be computed as
C = [
11987210
11987200
11987201
11987200
] (6)
where 11987210
and 11987201
are the sums of all 119909 and 119910 coordinatesof all nonzero image elements respectively and 119872
00is the
number of all non-zero image elements also referred to asmass Both COM C and mass 119872
00are also useful as gait
features
311 Gait Cycle Detection Walking sequences are not syn-chronized among subjects and can start at any phase of thegait cycle To be able to compare the cycles later we mustdefine at which phase gait cycle should start Double supportis the easiest to detect therefore we set all cycles to start atdouble support
First we determine gait frequency based on frequencyanalysis of extracted signals The most appropriate signalsfor gait frequency detection are vertical movement of COMbody mass and silhouette width The main property of thesesignals is that the signal has its peaks at double support (max)and single support (min) phases of gait cycleWhen subject isobserved from side view COM is at its lowest point (highest119910 value) and subjectrsquos mass is at its highest point since handsand legs are spread and occupy more space than at singlesupport and the same goes for subjectrsquos width Among thesesubjectrsquos width is the most sensitive to noisy silhouettes and
Mathematical Problems in Engineering 5
0 50 100 150 200 250 300 350 400 450
0
2
minus2
Frame number
Gait signal
(a)
200 100 67 50 40 33 29 25 22 20 18 17 15 14 13 13 12 11 11 100
1
2
SignalF limit
PeaksGait freq
InfCycle length (frame number)
DFT spectrum
(b)
0 50 100 150 200 250 300 350 400 450
0
2
SignalxcorrLeg sig
Start candCyc starts
minus2
Frame number
Gait cycle detection
(c)
Figure 2 Gait frequency analysis (a) shows COM119910 signal with peaks at double support phases (half gait cycle) (b) shows DFT spectrumwith one outstanding frequency indicating half gait cycle length (c) shows gait cycle starts detection where left leg double support is detectedby leg signal value at main signal autocorrelation peaks
also the least reliable since it is severely affected by handmovements and is therefore the least appropriate COM isthe most resistant to noisy silhouettes but a bit less stable infinding double support peaks than subjectrsquos mass Thereforethe best way is to use mass when dealing with high qualitysilhouettes and COM when silhouettes are noisy
We analysed the signal with Discrete Fourier Transform(DFT) to determine frequency spectra Two frequencieswith highest amplitudes stand out (Figure 2) 119865
119904represents
one half of the gait cycle which usually has the highest
amplitude since it corresponds to subjectrsquos steps which aremost common in the signal 119865
119892has slightly lower amplitude
and represents the gait frequency (two steps) 119865119892asymp 2119865119904
312 Left Leg Double Support Detection To be able tocompare these signals later it is essential to detect the samedouble support for every subject (eg the one with left leg infront) so that cycles of all the subjects start with the same legin front (eg left) and are therefore roughly aligned Merely
6 Mathematical Problems in Engineering
Left leg in front
(a)
Right leg in front
(b)
0 50 100 150 200 250 300 350 400 450122
123
124
125Foot COM
(c)
Figure 3 Double support detection (a) shows double support when left leg is in front (b) shows double support when right leg is in frontRed and blue markers indicate a location of body and leg COMs (c) demonstrates a clear gap in COM119910 value between left and right legdouble support 119909 axis denotes time in frames and 119910 axis denotes 119910 coordinate of COM
switching the legs at the later stage does not help here becauseall other features are also affected
We solve this by exploiting constraint posed by perspec-tive projection It can be observed that because of perspectiveprojection when looking at walking subject from side viewthe leg closer to the camera appears a bit lower in the image(Figure 3) That is when left leg is in front it appears lowerthan when the right leg is in frontWe use this property whenanalysing another signal The 119910 coordinate of front leg footCOM is observed at double support phases When the legcloser to the camera (eg left) is in front the value of COM119910
of the foot is higher than foot COM119910 value of the leg that isfarther away from the camera
Finally we derive cycle starts based on estimated gaitfrequency and detected left leg double support phases whichare used as initial estimates for cycle length and start of thefirst cycle So obtained signal part is then cross-correlatedagainst entire signal and its peaks represent starts of gaitcycles (Figure 2(c))
313 Leg Crossover Detection One of the problems withthe extracted signature represents the crossing of the legsWhen observing subject from side view which is mostcommonly the case the legs are crossed during single supportphase Previously described algorithm for skeleton extractioncannot detect the crossing instead it always tracks the frontleg as leg number 1 and rear leg as leg number 2 When legsget crossed the leg that was previously in the front (eg leftleg) now goes to the back and vice versa
Authors in [3] use physical constraints (eg foot does notmove forward when in contact with the floor) to detect thecrossover Such constraint gets broken for example whenwalking on a treadmill Therefore we use vertical movementof COMwhich turns out to bemore appropriate for the giventask
It can be observed that single support phase locationcorresponds to local minima in COM119910 or mass signal Thisis similar as double support detection by local maxima in
the same signal described earlier Gait signature is thenadopted by softly switching left and right thigh angle signals atdetected leg switches locations Softlywedenote interpolationthrough small time frame window during single supportShin angles and joint locations are adopted according tochanged thigh angle values afterwards (see Figure 4)
32 Signal Postprocessing Signals in gait signature are proneto erratic detections which manifest as spikes in gait signalsThe spikes are detected by applying moving median filterthrough entire signal Movingmedian enables local detectionof spikes
First we compute the difference 119889(119905) between signal 119904(119905)andmovingmedian 119904
119898(119905)Then spikes are detected according
to
119889 (119905) =1003817100381710038171003817119904 (119905) minus 119904
119898(119905)1003817100381710038171003817
119904 (119905) =
NaN 119889 (119905) gt 120572 lowast 14826 lowast 119904119898120590(119905)
119904 (119905) else
(7)
where 119904(119905) is the value of the signal at time 119905 120572 is a parameterdetermining the size of the spike 119904
119898120590
is median deviationwhich is similar to standard deviation and except deviationis calculated based onmedian mean instead of average meanScaling median mean by factor 14826 gives median-absolutemean which is on average equal to standard deviation forGaussian distributions When spike is detected signal valuesare set to undefined NaN
For example in the case of bone angle signals wedetect spikes for both thighs and both shins and theninterpolate themissing values with spline interpolation Afterthat bone structures (joints and angles) must be adoptedaccordingly (eg changing angle of left thigh also affectsleft shin position) Moreover all the signals are additionallyfiltered by trigonometric polynomials used when buildinggait descriptor (see Section 42)
As human gait is cyclic in nature all gait signals are thensliced to smaller pieces based on found cycle starts This
Mathematical Problems in Engineering 7
0 50 100 150 200 250 300 350 400 450
0
2
4
minus4
minus2
(a)
0 50 100 150 200 250 300 350 400 4501
2
15
25
(b)
0 50 100 150 200 250 300 350 400 450
SignalLeft thighRight thigh
Cyc startLeg switchInterp win
1
2
15
25
(c)
Figure 4 Leg crossover detection (a) shows COM119910 signal (full-black line) detected cycle starts (dashed-red vertical lines) and leg crossoverlocations (full-magenta vertical lines) (b) shows front (blue) and rear (green) thigh angle signals as extracted from skeleton (c) shows thighangle signals interpolated into left (blue) and right (green) thigh angles 119909 axis denotes time in frames and 119910 axis represents normalized signalvalues
also implies that gait cycles of the same subject are similarunder unchanged conditions For acquired signals this alsomeans that the next cycle should start with approximatelythe same values as previous cycle and also that cyclic signalshould end with approximately the same values as it hasstarted [10] Because of noisy segmentation this is not alwaysthe case Therefore signals are adopted to correspond tothis assumption We make the signals cyclic by finding thedifference between cycle start and cycle end and interpolatingthe entire signal to negate this difference
119878119894= 119878119894minus
2119894 minus (119871 minus 1)
2 (119871 minus 1)
lowast 119863 (8)
where 119878 is the part of the signal corresponding to somespecific gait cycle 119878
119894is the value at point 119894 of that gait cycle 119871
is the gait cycle length and 119863 is the difference between cyclestart and cycle end
Also different people walk with different speeds whichaffect gait frequency and with that the duration of the gaitcycle If gait is sampled by the same sampling frequency (egcamera frame rate) cycle lengths differ in the number ofacquired samples in one gait cycle To be able to comparegait cycles of different subjects (and also gait cycles of thesame subject acquired with different sampling frequencies)gait cycle signals must be resampled to the same length byinterpolation and decimation
Each gait cycle now contains only parts of the originalsignals corresponding to this gait cycle These signal partsare called features (see examples in Figure 5) Each featurecorresponds to one gait cycle of some extracted signal Figurealso demonstrates the difference in inter- and intraclass
8 Mathematical Problems in Engineering
0 50 1002000
2500
3000
3500s 1 masses1
0 50 100minus40
minus20
0
20
40s 1 thigh1
0 50 100minus50
0
50
100s 1 knee1
(a)
0 50 1002000
2500
3000
3500s 2 masses1
0 50 100minus40
minus20
0
20
40s 2 thigh1
0 50 100minus50
0
50
100s 2 knee1
(b)
0 50 1002500
3000
3500
4000s 3 masses1
0 50 100minus40
minus20
0
20
40s 3 thigh1
0 50 100minus50
0
50
100s 3 knee1
(c)
0 50 1002000
2500
3000
3500
4000
0 50 100minus40
minus20
0
20
40
0 50 100minus100
minus50
0
50
100s all masses1 s all thigh1 s all knee1
(d)Figure 5 Example of extracted features image shows extracted mass thigh1 and knee1 signals (in columns) of several gait cycles for threesubjects (rows (a) (b) and (c)) denoted by s 1 s 2 and s 3 Blue lines indicate signals red-thick lines indicate signals mean and red-dashedlines indicate intraclass variance Row (d) shows mean and variance (interclass) of all the signals for all subjects (s all)
variance It is evident that the latter is smaller which is goodfor recognition purposes
33 Feature Space Transformation Changes in walking speedpresent one of the major covariate factors with negativeimpact on recognition results When a person changes
walking speed dynamic features (eg stride length and jointangles) are changed while static features (eg thigh and shinlengths) remain unchanged From top row of Figure 6 itcan be seen how single subjectsrsquos features differ for differentwalking speeds (redmdashfast walk bluemdashslowwalk) As we onlydeal with dynamic features we have to compensate for suchchanges
Mathematical Problems in Engineering 9
0 20 40 60 80 1002400
2600
2800
3000
3200
3400Class means
masses1
0 20 40 60 80 100
0
20
40thigh1
0 20 40 60 80 100
0
50
100knee1
Class means Class means
minus20
minus40 minus50
0 20 40 60 80 1002400
2600
2800
3000
3200
3400
0 20 40 60 80 100
0
20
40
0 20 40 60 80 100
0
20
40
60
80
Space meansSpace means Space meansthigh1 knee1masses1
minus20
minus40 minus20
0 20 40 60 80 1002400
2600
2800
3000
3200
3400
Transformed probe means
0 20 40 60 80 100
0
20
40
0 20 40 60 80 100
0
50
100thigh1 knee1masses1
Transformed probe means Transformed probe means
minus20
minus40
minus50
minus100
0 20 40 60 80 100
0
1
2
Normalized class
0 20 40 60 80 100
0
1
2
3
Mean galSt dev gal St dev prb
Mean prb
0 20 40 60 80 100
0
2
4masses1
Normalized class Normalized classthigh1 knee1
minus1
minus2
minus1
minus2
minus2
minus4
minus6
(d)
(a)
(b)
(c)
Figure 6 Feature space transformation (a) single subjectrsquos features for fast walk (red) and slow walk (blue) (b) Slow and fast walk groupmean and st dev (c) Slow walk features transformed to fast walk space (d) Remaining differences after transformation Note that 119910 axis inrows (a) (b) and (c) shows absolute (measured) values while row (d) shows differences after normalization which therefore appear relativelysmall compared to measured values 119909 axis denotes the percent of gait cycle
10 Mathematical Problems in Engineering
We perform a feature space transformation based onstatisticalmodel of feature space for gallery and probe groupswhich contain subjects walking with different speeds Firstwe calculate the main statistical measures for each groupbelonging to certain walking speed based only on a fewrandomly chosen subjects from that group Then we derivegroup mean and standard deviation (Figure 6 2nd row) andtransform the feature signals of all the samples (all subjectsall gait cycles) in that group by
s =s minus gg
(9)
where s is the signal vector of single feature of single gait cyclesample g is the mean vector of the same feature for targetgroup and g is the vector of standard deviations for the samegroup All operations are element wise
Such transformation removes major group space devi-ations caused by varying walking speed and retains onlyinterclass differences based onwhich subjects can be discrim-inated (Figure 6 4th row) The transformation is performedon both gallery and probe groups and subjects within thesegroups are now comparable For a demonstration probe fea-tures of slow walk are transformed by inverse transformationto fast walking feature space of the gallery (Figure 6 3rdrow) It is evident that the signals are closer together aftertransformation
4 Classification
41 Phase Alignment Classification is done by comparingthe probe subjects with the subject stored in the gallery Thecomparison is based on Euclidean distance To make thiscomparison feasible gait and probe featuresmust be perfectlyaligned This is roughly achieved in cycle detection phasehowever cycle starts can still differ by a few frames thereforemore precise alignment is required before classification
We perform phase alignment by finding the offset of twosubjectrsquos gait cycles based on a few selected features (COM119910mass and width) We shift one subjectrsquos gait cycles in therange of few frames and calculate the distances of selectedfeatures for these shifts The one with minimal distance ischosen and probe cycles are then shifted accordingly
119900 = arg119894=10
min119894=minus10
119889 (F1 F2)
F1= [
f1198881198841f1198981
f1199081]
F2= [
f1198881198842f1198982
f1199082]
(10)
where 119900 is the offset 119889 is distance and F119895is the feature
vector of subject 119895 composed of feature vectors f119894119895of specific
features 119888119884 119898 and 119908 denote COM119910 mass and width
It is important to limit the shifting to small ranges (eg[minus10 sdot sdot sdot 10]) since larger ranges can result in shifting the gaitcycle to the next double support (with the wrong leg in front)
Prior to classification all subjects in the gallery are alignedto one chosen subject (eg first) and also all probes arealigned to the same subject
42 Gait Descriptor Only after such alignment we cancompose gait descriptors for all cycles of all subjects Firstgait cycle signals of all acquired features are approximated bytrigonometric polynomial coefficients Periodic signals canbe approximated by
119878 (119909) = 1198860+
119873
sum
119899=1
119886119899cos (119899119909) + 119894
119873
sum
119899=1
119887119899sin (119899119909) (11)
where 119886119899and 119887
119899are the polynomial coefficient acquired
by DFT We use these coefficient to form the descriptorfor each feature Such approximation serves as a low-passfilter where higher frequencies are filtered out and in thesame time greatly reduces feature size so it also reducesthe dimensionality of features If acquired feature size is100 elements we can safely use 119873 asymp 10 which givesapproximately 20 coefficients Gait descriptors of individualfeatures
d119894= [1198860119894
119886119873119894
1198871119894
119887119873119894
] (12)
are then stacked together to form a descriptor of the entiregait cycle
D119888119894
= [d1d2
d119873119891
] (13)
where D119888119894
is subjectrsquos descriptor of 119888119894th gait cycle and d
1sdot sdot sdot
d119873119891
are feature descriptors of119873119891different features
Acquired descriptors are still to long for further process-ing For example in our case of 64 features each containing20 coefficients descriptor length is 1280 Dimensionality isfurther reduced by PCA to retain approximately 99 of vari-ance which ends up in approximately 100 PCA coefficients
Furthermore all gallery descriptors are processed by LDAto achieve better discrimination between gallery models
43 Distance Based Classification Now we calculate thedistances between each probe descriptor (gait cycle) and alldescriptors of all the models in the gallery Distance betweentwo subjects is defined as
119863(119901 119892119898) = 119891119888(119889 (p
119894 g119898119895
)) 119894 isin 119875 119895 isin 119866119898 (14)
where 119901 and 119892119898denote probe and gallery subjects 119875 and
119866119898number of descriptors (corresponding to gait cycles) for
each subject and 119889(sdot) the distance between two descriptors119891119888is a criteria function denoting which distance to chose
among distances formed by several probe descriptors Mostcommonlymeanminimum andmedian are usedWe choosemedian as it best reduces the importance of deviated dis-tances (outliers) that might result from measurement errorsWe then calculate 119863(119901 119892
119898) for all gallery models to obtain a
vector of distance scores
D119901= 119863 (119901 119892
1) 119863 (119901 119892
119872) (15)
where 119872 is the number of subjects in the gallery Since weuse Cumulative Match Characteristics (CMC) to representclassification results the vector is sorted and ranks areassigned to the models based on calculated distances Themodel with the smallest distance is chosen as best (rank 1)match
Mathematical Problems in Engineering 11
44 Feature Fusion Scheme Different features have differentdiscriminative abilitiesTherefore it is natural to assume thatusing these features separately and assigning their influenceby weighting could improve classification results To demon-strate this point we employ feature fusion scheme [23] whereeach feature can be seen as a separate classifier and finalresult is formed by fusing the results of all the classifiersSuch process can additionally help in the case of missingor erratically measured features For example in the case ofocclusions only a few features (like missing parts of the legsetc) are affected and negative effects can be diminished byclassification based on the remaining features which over-vote the problematic ones
First we perform distance based classification asdescribed earlier in Section 43 for each feature separatelyWe compose gait descriptors based on single feature andperform classification PCA is not required in this casesince trigonometric coefficients sufficiently diminish thedimensionality to make LDA feasible Each feature forms avector of distance scores D
119901119891 which is first normalized to
interval [0 1] to remove feature distance bias using min-maxnorm Then we combine all the score vectors of all thefeatures to a single fused distance score
S119901=
1
119865
119894=119865
sum
119894=1
(119908119894
10038171003817100381710038171003817D119901119894
10038171003817100381710038171003817minminusmax)
(16)
where 119865 is the number of features and 119908119894are feature weights
Please note that sdot minminusmax denotes vector normalizationwhich results in normalized vector rather than vector normwhich results in a scalar value Finally the so-obtaineddistance score vector S
119901is sorted and ranks are assigned for
all gallery modelsIn this work we obtain weights experimentally by eval-
uating the discriminative power of the features on the basisof intra-interclass feature variance Class corresponds to asubjectThe intraclass feature variance 1205902
119904119891(119883) is the variance
of all the signal samples (rows of 119883) of specific feature 119891 forsingle subject 119904 Sample 119909
119894isin 119883 is the signal of the feature 119891
during single gait cycle Interclass feature variance 1205902119891is the
variance measured on all the samples of all subjects for thesame feature (see examples on Figure 5) The ratio of average(through subjects) intra class feature variance and inter classvariance
119903120590=
1205902
119904119891
1205902
119891
(17)
is an indicator of feature discrimination power the smallerthe ratio is the bigger the discrimination power of the featurecan be expected For our experiments the variances werecalculated on training subjects subset
Undoubtedly the process of assigning weights could bemore sophisticated using some training technique Howeverclassification performance turned out to be relatively insen-sitive to small variations in weights therefore chosen weightassignment is sufficient for demonstrating the effect of featureclassifier fusion on classification performance
45 Noise Occlusions andOutliers Due to sensitive nature ofskeleton segmentation process several types of errors causedby noise sensitive video capturing process poor qualitysilhouette extraction algorithm or scene objects occludingrecorded subject may occur We deal with these errors onseveral different layers of our method
Most common are small erratic measurements of boneand joint positions which are due to noisy silhouettes forexample random artifacts appearing on particular framesof the video holes between legs get filled in knee or anklearea and so forth This type of errors only occurs on afew consecutive frames and then disappears and might laterreappear in some other areasThe result of such errors is noisysignals obtained from segmented skeleton The noise canbe effectively handled by spike detection elimination andinterpolation as described in Section 32 and additional fil-tering by trigonometric polynomial coefficients as describedin Section 42
Larger disruptions can be caused by occluding objectsin the scene missing larger parts of silhouettes body partsand so forth When these errors are short-lived most of theireffects are already eliminated by noise handling proceduresOn the other hand longer presence of occluding objectsmight result in erratic measurements of several features forentire or even several gait cycles In the case of missing orbadly measured features bad effects are eliminated by featurefusion (Section 44) which acts as classifier fusion wheresingle classifier (feature) adds only minor contribution tofinal score while most of the score is formed by the rest ofthe unaffected features In the cases when entire gait cyclesare affected such cycles appear as outliers in probegallerydistance calculation process (Section 43) and the effectsof problematic distances are eliminated by calculating themedian of the distances of all available gait cycles
5 Experimental Results and Discussion
We tested our methods on OU-ISIR gait database [24] moreprecisely dataset A which is composed of high quality gaitsilhouette sequences of 34 subjects from side view walkingon a treadmill with speed variation from 2 kmh to 10 kmhat 1 kmh interval For each subject and each speed twosequences are provided one for the gallery and the other forthe probe
In our cross-speed test we performed several experi-ments where gallery subjects belong to one speed andmatch-ing probe subjects belong to the other speed The resultsare given as rank 1 correct classification rate in CumulativeMatch Characteristic (CMC) to enable comparison withother works as CMC is also mostly used by other authorsSuchmetric is highly dependant on the size of the gallery andin order to enable fair comparison to otherworks the numberof subjects must be the same 25 subject were used for iden-tification and 9 were used for training previously describedfeature space transformation Such split was designed in [18]and adopted by other researchers working on speed-invariantgait recognition as a method benchmark
12 Mathematical Problems in Engineering
Table 1 Recognition performance () results of basic experimentswithout feature fusion and space transformation for walking speeds119866 and 119875 denote the speed group of gallery and probe respectively
119866119875 2 kmh 3 kmh 4 kmh 5 kmh 6 kmh 7 kmh2 kmh 84 80 44 24 16 163 kmh 36 80 72 28 28 124 kmh 44 68 92 84 52 285 kmh 40 36 68 100 88 646 kmh 16 24 28 68 92 927 kmh 28 20 28 56 76 96
Table 2 Recognition performance () results of experiments withfeature fusion and without space transformation for walking speeds
119866119875 2 kmh 3 kmh 4 kmh 5 kmh 6 kmh 7 kmh2 kmh 88 88 96 72 56 523 kmh 68 92 96 84 76 524 kmh 72 80 96 92 88 725 kmh 56 72 96 100 100 966 kmh 56 64 76 96 100 1007 kmh 36 56 52 80 92 100
Table 3 Recognition performance () results of experimentswithout space transformation for running speeds
119866119875
No fusion Feature fusion8 kmh 9 kmh 10 kmh 8 kmh 9 kmh 10 kmh
8 kmh 96 92 92 96 96 969 kmh 92 100 100 100 100 10010 kmh 76 92 96 92 96 96
The experiments were split to four sets to illustratethe impact of feature fusion and space transformation onrecognition results Additionally we split the speeds to walk-ing (2 kmh to 7 kmh) and running (8 kmh to 10 kmh)because running is so much different to walking in terms ofgait dynamics that it is regarded as different action (in analogyto action recognition field) and the cross-matching is quitedifficult
First we perform basic method evaluation without fea-ture fusion and without space transformation The results inTable 1 are quite modest and rarely reach 90 even whengallery and probes are in the same speed group It can benoticed that higher speeds yield better results We assumethat this is because higher speeds reveal more specifics (egconsider running) intraclass variation is smaller and alsodynamic features are easier (less noisy) for capturing at higherspeeds when subjectrsquos silhouettes are more spread at doublesupport phases more information is revealed
Next we perform experiments with previously describedfeature fusion scheme without space transformation Theresults in Table 2 show noticeable improvement For easiercomparison see also test result summary in Figure 7
Results for higher speeds (ie running speeds) with andwithout feature fusion are given separately in Table 3 Thesealso confirm our high speed observation
Table 4 Recognition performance () results of experimentswithout feature fusion and with space transformation for walkingspeeds
119866119875 2 kmh 3 kmh 4 kmh 5 kmh 6 kmh 7 kmh2 kmh 92 84 84 72 44 323 kmh 68 88 84 72 60 484 kmh 72 92 96 88 88 645 kmh 64 76 100 100 96 926 kmh 40 60 72 88 100 967 kmh 36 36 48 76 96 92
Table 5 Recognition performance () results of experiments withfeature fusion and with space transformation for walking speeds
119866119875 2 kmh 3 kmh 4 kmh 5 kmh 6 kmh 7 kmh2 kmh 92 96 92 92 60 683 kmh 80 96 100 84 76 644 kmh 80 92 100 96 96 725 kmh 80 92 100 100 96 1006 kmh 76 92 100 100 100 1007 kmh 72 60 80 96 100 100
Table 6 Recognition performance () results of experiments withspace transformation for running speeds
119866119875
Space transformation Space transformation + fusion8 kmh 9 kmh 10 kmh 8 kmh 9 kmh 10 kmh
8 kmh 96 96 96 100 100 1009 kmh 88 100 100 100 100 10010 kmh 92 96 96 100 100 100
The results of the next experiments where we use featurespace transformation without and with feature fusion aregiven in Tables 4 and 5 The space transformation againimproves recognition performance in both cases (with andwithout fusion) In the case where gallery and probes aretaken from the same speed (0 kmh speed change) as shownin result summaries in Table 7 and Figure 7 the differencesare not so drastic Nevertheless space transformation revealssmall improvement and together with feature fusion reachesalmost 100This improvement is due to the effect achievedby removing the means of the whole speed group from spe-cific subjectrsquos features and since only inter class differencesremain in the signals only those are modelled in descriptors
Finally the results of space transformation for runningare given in Table 6 and in the case of 18 both improvementsreach 100 in all the experiments
Table 7 and Figure 7 show average recognition perfor-mance for cross-speed walking and running experimentsBasic results are given in column 1 feature fusion resultsare given in column 2 space transformation results aregiven in column 3 and results with both improvementsare given in column 4 Also the average performance fordifferent degree of speed changes (from 0 kmh to 5 kmh)and the performance gains for feature fusion and spatialtransformation are given Feature gain is calculated as a
Mathematical Problems in Engineering 13
Table 7 Average recognition performance () of cross-speed walking and running
Basic Feature ST ST + feature Feature gain ST gain ST + feature gainWalk 530 791 749 883 261 92 353Run 929 969 956 1000 40 31 71Δ = 0 kmh 929 964 956 987 36 22 58Δ = 1 kmh 732 908 892 980 176 72 248Δ = 2 kmh 440 830 790 950 390 120 510Δ = 3 kmh 287 653 613 820 367 167 534Δ = 4 kmh 160 550 420 620 390 70 460Δ = 5 kmh 220 440 340 440 220 00 220
Table 8 Recognition performance () comparison to other works handling cross-speed walking gait identification
Test scenario Our method SN [8] HMM [14] SVT [18] HSC [19] DCM [20]Small speed change 96 84 90 96 98Large speed change 68 34 58 68 82Whole dataset 8833 8567 9244
difference between feature fusion results (2nd column) andbasic results (1st column) while space transformation gainis calculated as a difference between the results of bothimprovements (column 4) and results with only featurefusion (column 2) Such calculation indicates howmuch gaindoes space transformation bring on top of feature fusionOverall gain (column 7) is calculated as a difference betweenthe results of both improvements (column 4) and basicresults (column 1) It can be noticed that performance gainreaches the peak at 3 kmh degree of speed change andthen starts falling back down to 22 at the largest degreeof speed change 5 kmh This indicates the deficiency inboth improvements which do not to cope well with severespeed changes Nevertheless the average performance gainfor cross-speed walking recognition is 35
51 Comparison to Other Works For cross-speed walkinggait recognition authors in [18] designed two gait recognitiontests on OU-ISIR-A dataset to enable comparison with otherworks handling speed changesWe compare our results to thefollowing state-of-the-art gait recognition methods whichall focus on dealing with walking speed change HMM-based time normalized (HMM) [14] Stride Normalization(SN) [8] Silhouette Volume Transformation (SVT) [18]High-order Shape Configuration (HSC) [19] andDifferentialComposition Model (DCM) [20] The results of HMM andSN methods are based on 25 and 24 subjects from otherdatasets while SVT HSC and DCM are based on the sameOU-ISIR-A dataset used also in our experiments Similartest scenarios are designed for OU-ISIR-A dataset For smallspeed change HMM uses 33 kmh and 45 kmh whileOU-ISIR-A uses similar 3 kmh and 4 kmh speed changeFor large speed change SN uses the speed change between25 kmh and 58 kmh which approximately corresponds to2 kmh and 6 kmh speed change in OU-ISIR-A dataset
Results in Table 8 show method performance for bothpreviously described gait tests and also the average methodperformance on the entire OU-ISIR-A dataset (test scenario
whole dataset) It also gives performance for methods thatpublished these results It can be seen that our methodwas outperformed only by DCM method especially inthe scenario with larger speed changes (4 kmh or more)Nevertheless our method demonstrates state-of-the-art per-formance by using model based gait features describing gaitdynamics which is greatly affected by walking speed changesand discarding any possible appearance based identificationclues that other silhouette based methods benefit from It canbe noticed that no other model based methods can be foundamong these results merely because existing model basedmethods rarely match the performance of nonmodel basedtechniques even with no covariate factors present To our bestknowledge our method is also the first model-based methodhandling walking speed changes and together with the useof dynamic features represents a novel contribution to gaitanalysis research field
6 Conclusion
In this paper we presented a skeletonmodel based gait recog-nition system using only features that describe gait dynamicsWe described solutions for solving specific problems that istwo-stage feature alignment (image moments based coarsealignment togetherwith distance based fine alignment) that iscrucial for successful comparison of time-series features likeoursWe addressed a problem of walking-speed variation andproposed feature fusion and space transformation approachthat successfully mitigate its negative effects on recognitionperformance Moreover our features can be understood byhuman (medical kinesiological) expert and can handle walk-ing speed changes by undemanding training stage that alsohas a human understandable interpretation Such propertygives our method the perspective for being used also in otherfields like medicine kinesiology and sports
We evaluated the performance of proposed methods onOU-ISIR gait database and proved that model based systemconcentrating on dynamic features only can demonstrate
14 Mathematical Problems in Engineering
0
20
40
60
80
100
Cross-walk Cross-run
Cross-speed average performance
BasicFeature
STFeature + ST
(a)
0
20
40
60
80
100Average performance by degree of speed change
0km 1km 2km 3km 4km 5km
BasicFeature
STFeature + ST
(b)
0
10
20
30
40
50
60
0km 1km 2km 3km 4km 5km
FeatureST
Feature + ST
Average performance gain
Walk Run
(c)
Figure 7 Recognition performance () results summary (a) average performance of cross-speed walking and running (b) averageperformance by degree of speed change (in kmh) and (c) performance gains for feature fusion and space transformation
state-of-the-art performance and can easily find its placealongside other appearance based state-of-the-art methodsTo the best of our knowledge our method is the first model-based method handling walking speed changes efficientlythat is comparable to state-of-the-art results AlthoughOU-ISIR gait database contains relatively small number of34 subjects especially in benchmark form as designed by[18] it provides the broadest range of walking speeds andis up-to-date the most appropriate database for studyingwalking speed effects on human gait Moreover general
recognition ability of similar model-based approaches wasalready addressed by other authors (eg [3]) where correctclassification rate of 84 was achieved on 100 subjects atunchanged conditions
Nevertheless there are further problems that need to beaddressed in the future First the problem of time seriesfeature alignment should be circumvented by using a distancemetric that is starting point invariant Furthermore theperformance of larger (4 kmh and up) speed change shouldbe investigated and improvedThis could be achieved bymore
Mathematical Problems in Engineering 15
sophisticated feature selection technique on one hand and onthe other by finding strongermodels of walking speed spaceswhich could also tackle the problem of cross-walker-runneridentification
Conflict of Interests
The authors declare that there is no conflict of interestsregarding the publication of this paper
Acknowledgment
Operation is partly financed by the European Union Euro-pean Social Fund
References
[1] G Johansson ldquoVisual motion perceptionrdquo Scientific Americanvol 232 no 6 pp 76ndash88 1976
[2] G Ariyanto and M S Nixon ldquoModel-based 3D Gait biomet-ricsrdquo in Proceedings of the International Joint Conference onBiometrics (IJCB rsquo11) pp 354ndash359 October 2011
[3] J-H Yoo and M S Nixon ldquoAutomated markerless analysis ofhuman Gait motion for recognition and classificationrdquo ETRIJournal vol 33 no 2 pp 259ndash266 2011
[4] T Yu and J-H Zou ldquoAutomatic human Gait imitation andrecognition in 3D from monocular video with an uncalibratedcamerardquo Mathematical Problems in Engineering vol 2012Article ID 563864 pp 1ndash35 2012
[5] H Lu K N Plataniotis and A N Venetsanopoulos ldquoA full-body layered deformable model for automatic model-basedGait recognitionrdquoEurasip Journal onAdvances in Signal Process-ing vol 2008 Article ID 261317 pp 1ndash14 2008
[6] Z Liu and S Sarkar ldquoSimplest representation yet for Gaitrecognition averaged silhouetterdquo in Proceedings of the 17thInternational Conference on Pattern Recognition (ICPR rsquo04) vol4 pp 211ndash214 August 2004
[7] S Sarkar P J Phillips Z Liu I R Vega P Grother andK W Bowyer ldquoThe humanID Gait challenge problem datasets performance and analysisrdquo IEEE Transactions on PatternAnalysis and Machine Intelligence vol 27 no 2 pp 162ndash1772005
[8] R Tanawongsuwan and A Bobick ldquoModelling the effects ofwalking speed on appearance-based Gait recognitionrdquo in Pro-ceedings of the IEEE Computer Society Conference on ComputerVision andPatternRecognition (CVPR rsquo04) pp II783ndashII790 July2004
[9] ZWang X Sun L Sun and Y Huang ldquoManifold adaptive ker-nel semisupervised discriminant analysis for Gait recognitionrdquoAdvances in Mechanical Engineering vol 2013 pp 1ndash12 2013
[10] M Peternel and A Leonardis ldquoVisual learning and recognitionof a probabilistic spatio-temporal model of cyclic humanlocomotionrdquo in Proceedings of the 17th International Conferenceon Pattern Recognition (ICPR rsquo04) pp 146ndash149 August 2004
[11] W Stone and M Skubic ldquoCapturing habitual in-home Gaitparameter trends using an inexpensive depth camerardquo in Pro-ceedings of the International Conference of the IEEE Engineeringin Medicine and Biology Society pp 5106ndash5109 2012
[12] T Banerjee J M Keller andM Skubic ldquoResident identificationusing kinect depth image data and fuzzy clustering techniquesrdquo
in Proceedings of the International Conference of the IEEEEngineering in Medicine and Biology Society pp 5102ndash51052012
[13] J Kovac and P Peer ldquoTransformation basedWalking speed nor-malization for Gait recognitionrdquo KSII Transactions on Internetand Information Systems vol 7 no 11 pp 2690ndash2701 2013
[14] Z Liu and S Sarkar ldquoImproved Gait recognition by Gaitdynamics normalizationrdquo IEEE Transactions on Pattern Anal-ysis and Machine Intelligence vol 28 no 6 pp 863ndash876 2006
[15] S Lee Y Liu and R Collins ldquoShape variation-based friezepattern for robust Gait recognitionrdquo in Proceedings of the IEEEComputer Society Conference on Computer Vision and PatternRecognition (CVPR rsquo07) June 2007
[16] A Veeraraghavan A Srivastava A K Roy-Chowdhury andR Chellappa ldquoRate-invariant recognition of humans and theiractivitiesrdquo IEEE Transactions on Image Processing vol 18 no 6pp 1326ndash1339 2009
[17] T Kobayashi and N Otsu ldquoThree-way auto-correlationapproach to motion recognitionrdquo Pattern Recognition Lettersvol 30 no 3 pp 212ndash221 2009
[18] A Tsuji Y Makihara and Y Yagi ldquoSilhouette transformationbased on walking speed for Gait identificationrdquo in Proceedingsof the IEEE Computer Society Conference on Computer Visionand Pattern Recognition (CVPR rsquo10) pp 717ndash722 June 2010
[19] W Kusakunniran Q Wu J Zhang and H Li ldquoSpeed-invariantGait recognition based on procrustes shape analysis usinghigher-order shape configurationrdquo in Proceedings of the 18thIEEE International Conference on Image Processing (ICIP rsquo11) pp545ndash548 September 2011
[20] W Kusakunniran Q Wu J Zhang and H Li ldquoDifferentialcompositionmodelrdquo Systems Man and Cybernetics vol 42 no6 pp 1654ndash1668 2012
[21] L Zappella X Llado and J Salvi New Trends in MotionSegmentation Pattern Recognition Edited by P-Y Yin InTech2009
[22] D A Winter The Biomechanics and Motor Control of HumanMovement John Wiley amp Sons 1990
[23] X Huang and N Boulgouris ldquoModel-based human Gait recog-nition using fusion of featuresrdquo in Proceedings of the Interna-tional Conference on Acoustics Speech and Signal Processing pp1469ndash1472 2009
[24] Y Makihara H Mannami A Tsuji et al ldquoThe OU-ISIR Gaitdatabase comprising the Treadmill datasetrdquo IPSJ Transactionson Computer Vision and Applications vol 4 pp 53ndash62 2012
Submit your manuscripts athttpwwwhindawicom
Hindawi Publishing Corporationhttpwwwhindawicom Volume 2014
MathematicsJournal of
Hindawi Publishing Corporationhttpwwwhindawicom Volume 2014
Mathematical Problems in Engineering
Hindawi Publishing Corporationhttpwwwhindawicom
Differential EquationsInternational Journal of
Volume 2014
Applied MathematicsJournal of
Hindawi Publishing Corporationhttpwwwhindawicom Volume 2014
Probability and StatisticsHindawi Publishing Corporationhttpwwwhindawicom Volume 2014
Journal of
Hindawi Publishing Corporationhttpwwwhindawicom Volume 2014
Mathematical PhysicsAdvances in
Complex AnalysisJournal of
Hindawi Publishing Corporationhttpwwwhindawicom Volume 2014
OptimizationJournal of
Hindawi Publishing Corporationhttpwwwhindawicom Volume 2014
CombinatoricsHindawi Publishing Corporationhttpwwwhindawicom Volume 2014
International Journal of
Hindawi Publishing Corporationhttpwwwhindawicom Volume 2014
Operations ResearchAdvances in
Journal of
Hindawi Publishing Corporationhttpwwwhindawicom Volume 2014
Function Spaces
Abstract and Applied AnalysisHindawi Publishing Corporationhttpwwwhindawicom Volume 2014
International Journal of Mathematics and Mathematical Sciences
Hindawi Publishing Corporationhttpwwwhindawicom Volume 2014
The Scientific World JournalHindawi Publishing Corporation httpwwwhindawicom Volume 2014
Hindawi Publishing Corporationhttpwwwhindawicom Volume 2014
Algebra
Discrete Dynamics in Nature and Society
Hindawi Publishing Corporationhttpwwwhindawicom Volume 2014
Hindawi Publishing Corporationhttpwwwhindawicom Volume 2014
Decision SciencesAdvances in
Discrete MathematicsJournal of
Hindawi Publishing Corporationhttpwwwhindawicom
Volume 2014 Hindawi Publishing Corporationhttpwwwhindawicom Volume 2014
Stochastic AnalysisInternational Journal of
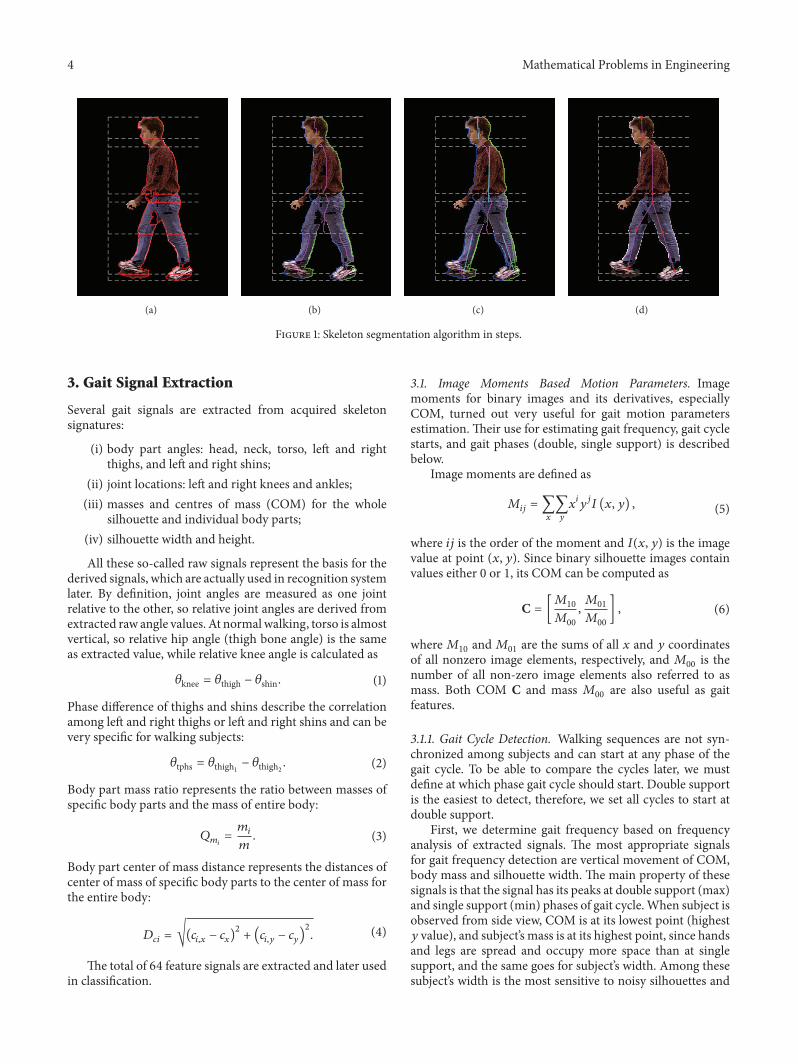
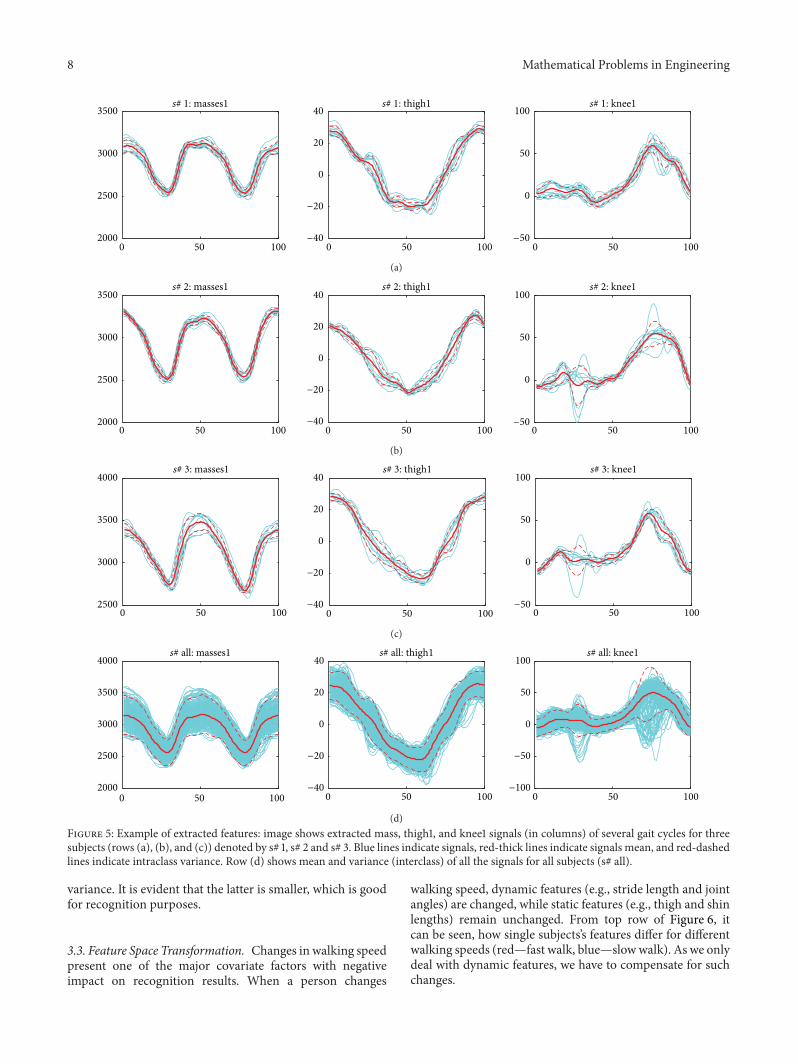
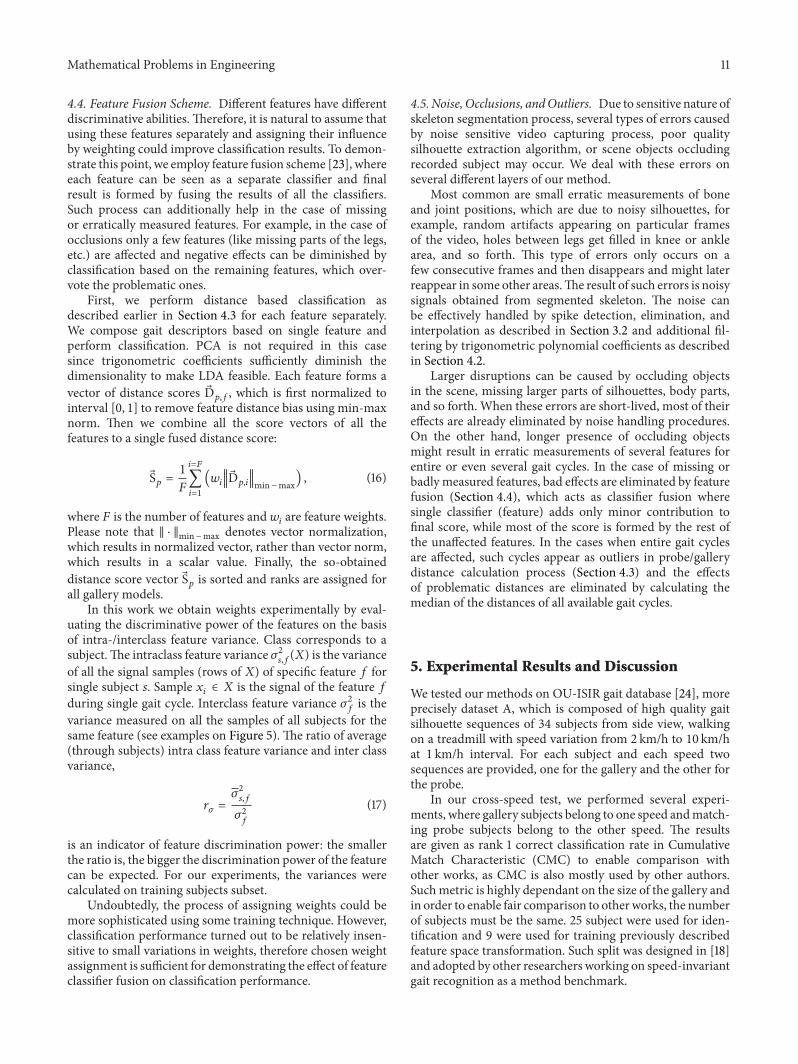