An Experimental Evaluation on Reliability Features of N-Version Programming
Research ArticleExperimental Research of Reliability of Plant Stress StateDetection by Laser-Induced Fluorescence Method
Yury Fedotov, Olga Bullo, Michael Belov, and Viktor Gorodnichev
Faculty of Radioelectronics and Laser Techniques, Department of Laser and Optoelectronics Systems,Bauman Moscow State Technical University, 2-ya Baumanskaya Ulitsa, Moscow 105005, Russia
Correspondence should be addressed to Yury Fedotov; [email protected]
Received 9 November 2015; Revised 31 January 2016; Accepted 11 February 2016
Academic Editor: Giulio Cerullo
Copyright © 2016 Yury Fedotov et al. This is an open access article distributed under the Creative Commons Attribution License,which permits unrestricted use, distribution, and reproduction in any medium, provided the original work is properly cited.
Experimental laboratory investigations of the laser-induced fluorescence spectra of watercress and lawn grass were conducted.The fluorescence spectra were excited by YAG:Nd laser emitting at 532 nm. It was established that the influence of stress caused bymechanical damage, overwatering, and soil pollution ismanifested in changes of the spectra shapes.Themean values and confidenceintervals for the ratio of two fluorescence maxima near 685 and 740 nm were estimated. It is presented that the fluorescence ratiocould be considered a reliable characteristic of plant stress state.
1. Introduction
Fluorescence analysis is a widely used high-sensitivitymethod that is applied in many scientific and technical fields.A viable application of the technique is the analysis of plantstate [1–14]. External factors can cause plants stress andmake their growth abnormal. Stress conditions are difficultto detect by visual observation during the early growth stagesof a plant; however, the laser-induced fluorescence method iseffective in the remote detection of plant stress state.
Chlorophyll is the basic fluorescent component of greenleaf in the red and far-red regions.The fluorescence spectrumof a green leaf at room temperature exhibits two maxima inthe red band (680–690 nm) and in the far-red band (730–740 nm) [1, 6, 8, 15]. The fluorescence spectrum of a stressedplant is deformed in comparison with that of a plant ina nonstressed state. This effect is caused by disturbing thephotosynthetic process of a plant under stressed conditions.The fluorescence spectrum depends on different factors suchas excitation wavelength, type of stress factor, and plantspecies.
There are wide experimental data on the fluorescencespectra of various plant species, both stressed and non-stressed, excited at wavelength ranges of 266–635 nm [2,10, 11, 15, 16]. However, a number of points remain to beinvestigated. One such point is the reliability of the plant state
detection based on the differences in fluorescence spectra ofsamples of a plant species, grown under identical conditions,except that some samples were stressed and the others werenot.
In this paper, experimental results of the analysis offluorescence spectra variation of different samples of a plantspecies in both normal and stressed states are presented.
2. Materials and Methods
2.1. Laboratory Setup Description. The fluorescence spectrawere excited at a wavelength of 532 nm. It is common to uselasers with wavelengths at 337, 335, and 532 nm for fluores-cence excitation in experimental research. The laser sourceused in this study was selected because of the advantagesoffered by the solid-state YAG:Nd laser at the wavelengthof 532 nm (for remote sensing equipment development), incomparisonwith both the nitrogen gas laser at thewavelengthof 337 nm and the solid-state YAG:Nd laser at the wavelengthof 355 nm (the third harmonic of the YAG laser has lowerpulse intensity than its second harmonic).
The laboratory configuration used to measure fluores-cence spectra is shown in Figure 1.
An EKSPLA NL210 solid-state YAG:Nd laser with diodepumping and frequency doubling was used as the source of
Hindawi Publishing CorporationInternational Journal of OpticsVolume 2016, Article ID 4543094, 6 pageshttp://dx.doi.org/10.1155/2016/4543094
2 International Journal of Optics
YAG:Ndlaser
Secondharmonicgenerator
PC with software
CCD Poly-chromator
Opticalsystem
Imageintensifier
Opticalfiber
Image intensifier unit
Power supply andgate generator unit
Sync
Laser control unit
Optical
Targ
et p
lant
system
Opticalsystem
Pulse laser
Optical signalsElectrical signals
Figure 1: Laboratory configuration for laser-induced fluorescenceexperiments.
fluorescence excitation. Laser light was transmitted by meansof the optical system to the target plant located at a distanceof 1m from the optical system. The apparent diameter of thelaser beam on the plant sample was approximately 25mm.The laser spot has covered 15–20 plants. The fluorescentradiation of the plants was collected from the same spot sizetogether with the reflected laser light by the optical systemand directed into the optical fiber. The optical fiber wasused to transmit light to the input of the polychromator.The reflected light from the laser beam was prevented fromentering a polychromator by using an NF01-532U Semrockfilter. Fluorescent radiation from 595 to 800 nmwas detected.An M266 Solar LS polychromator was used as the spectraldevice and all transitions within the polychromator fullyautomated (i.e., the swapping of diffraction grids and opticalfilters and slit width selection).
The fluorescence spectrum was detected using a highlysensitive detector (Matrix-430k-ns Deltatekh) based on CCDarray with an image intensifier. The image intensifier (gen-eration II+, diameter 18mm) has quantum efficiency 15% atthe wavelength 550 nm. The image was transferred by theoptical system from the image intensifier to the CCD. Theimage was converted into a digital array and transmittedto the computer. Special software developed with LabVIEWNational Instruments was used to control the setup. Themajor specifications of the setup are presented in Table 1.
The experiment included equipment calibration as apreparatory step. The polychromator was calibrated by
Table 1: Specifications of laboratory setup.
Specifications ValueLaser pulse energy, mJ 2.1Laser wavelength, nm 532Laser pulse duration, ns <7Laser repetition rate, Hz <500Laser beam spread, mrad <3Spectral band of registration, nm 595–800Spectral resolution, nm 6Diameter of optical detection system, mm 15Distance to sample, m 1
wavelength using a calibration light source based on amercury-argon lamp (SL2 StellarNet Inc.) with a linear spec-trum.The test was performed at thewavelength of 546.07 nm.Calibration of sensitivity of the registration system wasperformed using a light source based on halogen lamp (DH-2000-CAL Ocean Optics Inc.) with a continuous spectrum.Known spectrum of the lamp was acquired for sensitivitycalculation.
2.2. Plant Samples. The experimental research of laser-induced fluorescence spectra was performed using easy tokeep fast-growing plant species, that is, salads, watercress,mustard, common borage, cucumbers, and lawn grass. Theexperimental measurements of fluorescence spectra of water-cress (Lepidium sativum) and lawn grass (that comprised amixture of 30% perennial ryegrass (Lolium perenne), 65%creeping red fescue (Festuca rubra), and 5% sheep’s ovina(Festuca ovina)) are presented in this paper. The researchwas conducted on plants in their normal state and under theinfluence of stress factors, for example, mechanical damage(leaf cutting and laying, root system damage), root systemoverwatering, and soil pollution (copper sulfate, CuSO
4,
ferric sulfate, FeSO4, and sodium chloride, NaCl).
2.3. Normal and Stress Conditions. The plants in normal statewere grown in favorable condition for their development.Thewatercress plants have height of approximately 4 cm, and thelawn grass plants 8 cm.
By the leaf cutting of the watercress, the half of one leaf ofeach plant was dissected.The leaf laying was conducted using7 × 7 cm flat plate with 200 g weight during approximately1min. For root system damage in seedlings pots was cut aslit at the depth of 2 cm, the root system has been damagedthrough the slit by means of utility knife, and then the slitwas closed.
The overwatering stress condition was implemented byplacing the pot of thewatercress sample in awatering can.Thelevel ofwater in thewatering canwas always slightly below thelevel of soil in the plant pot; thus, it was not visually obviousthat the root system of the plant sample was constantly inoverwatered soil.

International Journal of Optics 3
0.0
0.1
0.2
0.3
0.4
0.5
0.6
600 650 700 750 800Wavelength (nm)
Relat
ive i
nten
sity
(a.u
.)
Figure 2: Fluorescence spectra of different watercress samples innormal state.
0.0
0.1
0.2
0.3
0.4
600 650 700 750 800Wavelength (nm)
Relat
ive i
nten
sity
(a.u
.)
Figure 3: Fluorescence spectra of different watercress samples instressed state caused by leaf laying.
3. Results and Discussion
3.1. Fluorescence Spectra of Different Watercress Samples inNormal State. The fluorescence spectra of different samplesof watercress grown under normal conditions are shownin Figure 2. The different plots in Figure 2 correspond todifferent plant samples that were planted at the same time andgrown under the same conditions. The measurements wereconducted in 16 days after planting.
As it can be seen in Figure 2, there are insignificantchanges in the shapes of the fluorescence spectra from onesample to another, despite the differences in spectra intensity.
3.2. Fluorescence Spectra of Watercress Stressed by MechanicalDamage. The fluorescence spectra of different samples ofwatercress stressed by leaf laying mechanical damage areshown in Figure 3. There have been several experimentalresearches on the fluorescence spectra of plants in stressedstates caused by different types of mechanical damage [9, 13,14], but few or none investigated the fluorescence spectra atan excitation wavelength of 532 nm [9].
0.0
0.1
0.2
0.3
0.4
600 650 700 750 800Wavelength (nm)
Relat
ive i
nten
sity
(a.u
.)
12
34
Figure 4: Averaged fluorescence spectra of watercress samples innormal and stressed conditions: (1) normal state, (2) leaf layingstress, (3) leaf cutting stress, and (4) root system damage stress.
The fluorescence spectra of watercress in a stressed statecaused by leaf laying fluctuate considerably (Figure 3) anddiffer from those of watercress in a normal state (Figure 2). Asimilar difference is found between the fluorescence spectraof watercress in normal and stressed states when the stress iscaused by mechanical damage of root system.
The differences between the fluorescence spectra of plantsunder normal and stressed conditions are illustrated clearlyby averaging the measurements of the fluorescence spectra.Figure 4 displays the averaged fluorescence spectra of water-cress in a normal state (plot 1) and stressed state by themechanical damage of leaf laying (plot 2), leaf cutting (plot3), and root system damage (plot 4). Plot 1 in Figure 4 corre-sponds to the averaged fluorescence spectra over the result of20 measurements. Plots 2, 3, and 4 in Figure 4 correspond tothe averaged fluorescence spectra over 11 measurements foreach stress factor; thus, a single measurement corresponds tothe measurement of a single fluorescence spectrum of a plantsample in definite time intervals from 20 to 40min from thestart of the stress factor influence.
It is clearly illustrated in Figure 4 that the shapes of thelaser-induced fluorescence spectra of watercress in stressedconditions were caused by various types of mechanical dam-age change significantly. The ratios of fluorescence intensityin the red region (680–690 nm) and far-red region (730–740 nm) increase in stress conditions.
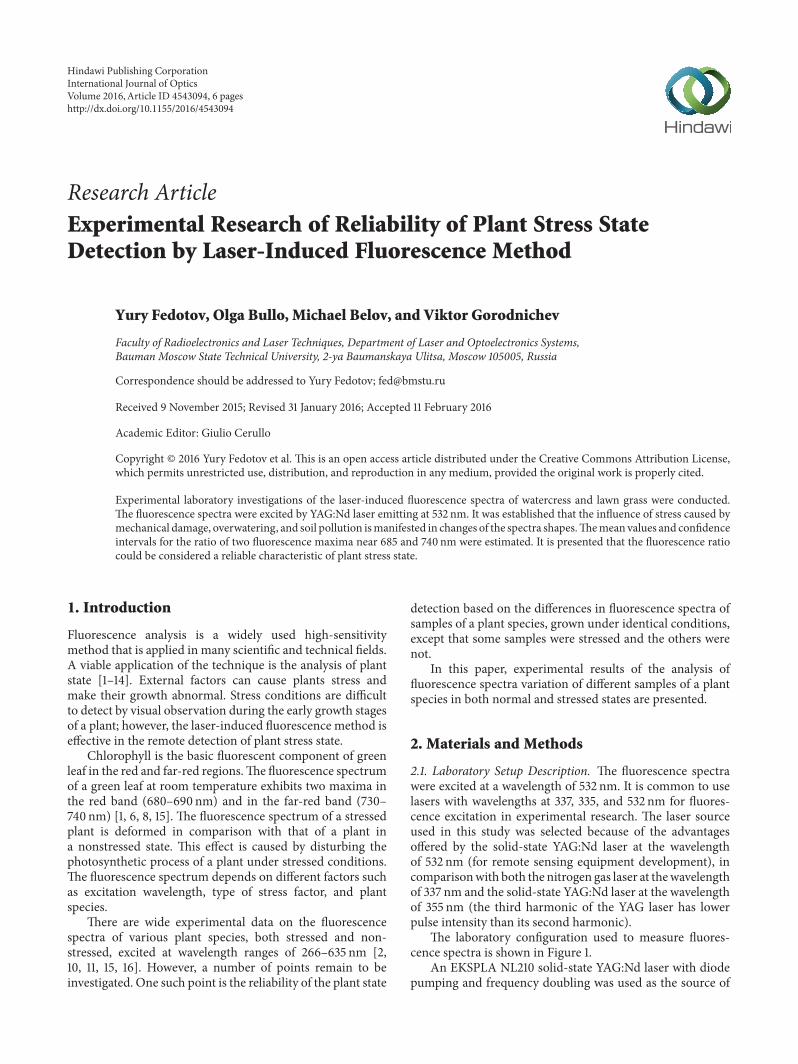
3.3. Fluorescence Spectra of Watercress in Stress State Causedby Overwatering. The laser-induced fluorescence spectra ofwatercress in stressed state caused by overwatering are com-parable with those presented in Figures 3 and 4. Figure 5shows the fluorescence spectra of watercress in stressed statecaused by overwatering during 24 days (different spectracorrespond to different measurements and plant samples).
As it is clearly illustrated in Figure 5 the fluorescencespectra of the watercress in a stressed state caused by over-watering during 24 days differ from those of watercress in anormal state. Furthermore, the spectra of the stressed samples
4 International Journal of Optics
0.0
0.2
0.4
0.6
600 650 700 750 800
Relat
ive i
nten
sity
(a.u
.)
Wavelength (nm)
Figure 5: Fluorescence spectra of different watercress samples instressed state caused by overwatering during 24 days.
0
0.1
0.2
0.3
0.4
0.5
0.6
600 650 700 750 800
Relat
ive i
nten
sity
(a.u
.)
Wavelength (nm)
12
34
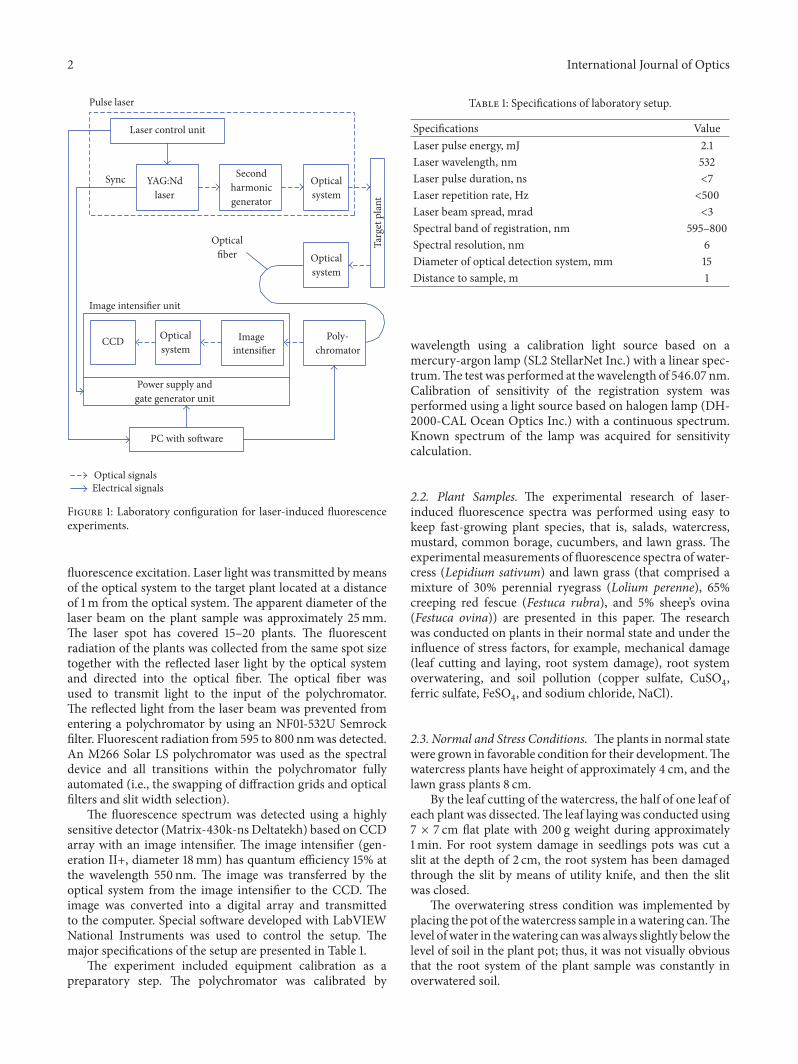
Figure 6: Fluorescence spectra of different watercress samples instressed state caused by overwatering: (1) normal state, (2) 11-dayoverwatering, (3) 17-day overwatering, (4) 24-day overwatering.
fluctuate considerably, comparable with the fluorescencespectra of the watercress stressed by mechanical damage.
Figure 6 shows the laser-induced fluorescence spectra ofwatercress averaged over the number of plant samples andmeasurements (18 measurements for watercress in normalcondition and 9 measurements for watercress in stressedcondition).
Plot 1 in Figure 6 corresponds to the averaged fluores-cence spectrum of watercress in a normal state. Plots 2, 3, and4 in Figure 6 correspond to the averaged fluorescence spectraof watercress in stressed condition caused by overwateringduring 11, 17, and 24 days, respectively. It can be clearlyseen that the influence of the stress factor (overwatering inthis case) accumulates gradually over the time of abnormalwatering, increasing the fluorescence intensity.
The results presented in Figures 2–6 are in agreementwith those of other experimental researches [8, 12] on plantsunder nitrogen stress and soil pollution using a fluorescenceexcitation source at the wavelength of 532 nm.
0.50
0.000.050.100.150.200.250.300.350.400.45
R(685/740)1.200.65 0.70 0.75 0.80 0.85 0.90 0.95 1.00 1.05 1.10 1.15
34
12
Relat
ive f
requ
ency
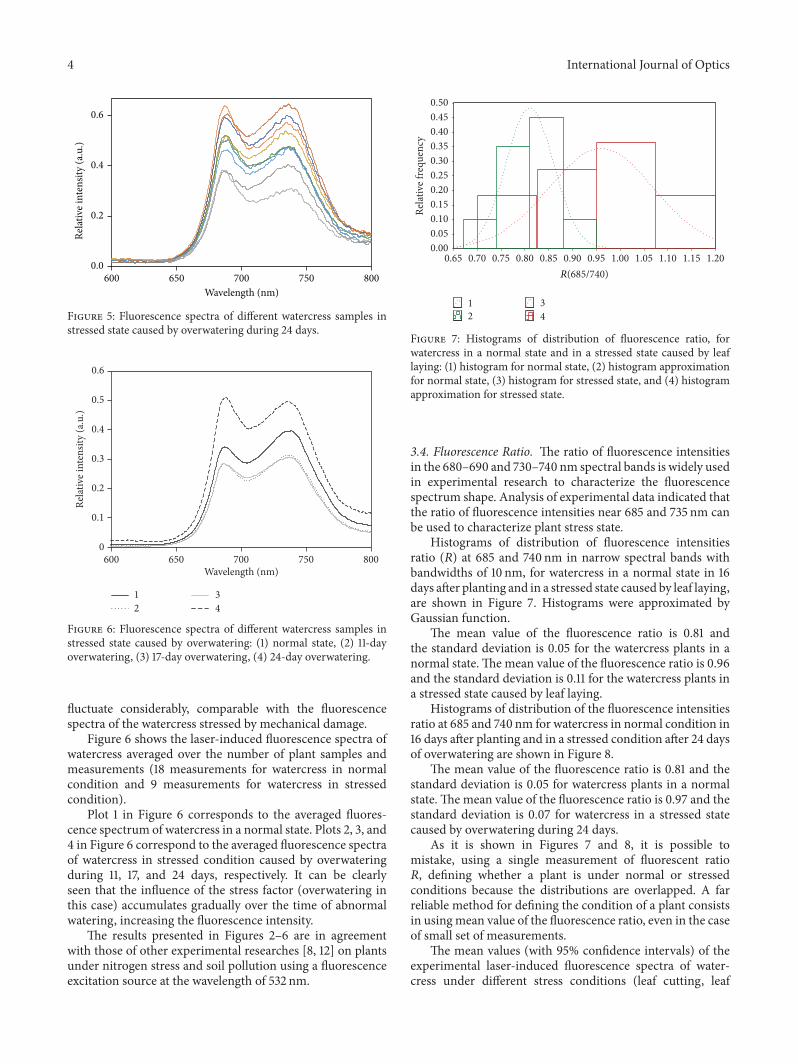
Figure 7: Histograms of distribution of fluorescence ratio, forwatercress in a normal state and in a stressed state caused by leaflaying: (1) histogram for normal state, (2) histogram approximationfor normal state, (3) histogram for stressed state, and (4) histogramapproximation for stressed state.
3.4. Fluorescence Ratio. The ratio of fluorescence intensitiesin the 680–690 and 730–740 nm spectral bands is widely usedin experimental research to characterize the fluorescencespectrum shape. Analysis of experimental data indicated thatthe ratio of fluorescence intensities near 685 and 735 nm canbe used to characterize plant stress state.
Histograms of distribution of fluorescence intensitiesratio (𝑅) at 685 and 740 nm in narrow spectral bands withbandwidths of 10 nm, for watercress in a normal state in 16days after planting and in a stressed state caused by leaf laying,are shown in Figure 7. Histograms were approximated byGaussian function.
The mean value of the fluorescence ratio is 0.81 andthe standard deviation is 0.05 for the watercress plants in anormal state. The mean value of the fluorescence ratio is 0.96and the standard deviation is 0.11 for the watercress plants ina stressed state caused by leaf laying.
Histograms of distribution of the fluorescence intensitiesratio at 685 and 740 nm for watercress in normal condition in16 days after planting and in a stressed condition after 24 daysof overwatering are shown in Figure 8.
The mean value of the fluorescence ratio is 0.81 and thestandard deviation is 0.05 for watercress plants in a normalstate. The mean value of the fluorescence ratio is 0.97 and thestandard deviation is 0.07 for watercress in a stressed statecaused by overwatering during 24 days.
As it is shown in Figures 7 and 8, it is possible tomistake, using a single measurement of fluorescent ratio𝑅, defining whether a plant is under normal or stressedconditions because the distributions are overlapped. A farreliable method for defining the condition of a plant consistsin usingmean value of the fluorescence ratio, even in the caseof small set of measurements.
The mean values (with 95% confidence intervals) of theexperimental laser-induced fluorescence spectra of water-cress under different stress conditions (leaf cutting, leaf

International Journal of Optics 5
0.50
0.000.050.100.150.200.250.300.350.400.45
R(685/740)1.200.65 0.70 0.75 0.80 0.85 0.90 0.95 1.00 1.05 1.10 1.15
34
12
Rela
tive f
requ
ency
Figure 8:Histograms of distribution of fluorescence ratio, forwater-cress in a normal state and stressed state caused by overwatering for24 days: (1) histogram for normal state, (2) histogram approximationfor normal state, (3) histogram of stressed state, and (4) histogramapproximation for stressed state.
laying, root system damage, and root system overwateringduring 11, 17, and 24 days) are shown in Figure 9.
Columns 1, 3, 5, 7, 9, and 11 in Figure 9 correspond tothe plants in a normal state and columns 2, 4, 6, 8, 10, and12 correspond to plants in a stressed state (2: leaf laying, 4:leaf cutting, 6: root system damage, 8: overwatering during11 days, 10: overwatering during 17 days, and 12: overwateringduring 24 days).
The changes of fluorescence spectra for plants in stressconditions described above are typical not only for watercressbut also for other plants in stress conditions caused bydifferent impact. The effect of soil pollution on lawn grass isconsidered below.
The aggregated statistical results (mean values and 95%confidence intervals) of the experimental laser-induced flu-orescence spectra of lawn grass under different stress condi-tions caused by soil pollution (copper sulfate, CuSO
4, ferric
sulfate, FeSO4, and sodium chloride, NaCl) are shown in
Figure 10.Columns 1, 3, 5, 7, and 9 in Figure 10 correspond to lawn
grass in a normal state (experimental research was conductedsix weeks after planting, directly before the soil was polluted).Columns 2, 4, 6, 8, and 10 in Figure 10 correspond tolawn grass in a stressed state; measurements were performed2 weeks after the initial influence of the stress factor forcolumns 2 and 6 and 4 weeks after the initial influence of thestress factor for columns 4, 8, and 10. The stress factor wassoil pollution by sodium chloride, NaCl (5 g per plant sample,columns 2 and 4), ferric sulfate, FeSO
4(3 g per plant sample,
columns 6 and 8), and copper sulfate, CuSO4(2 g per plant
sample, column 10).It is clearly illustrated in Figures 9 and 10 that the
fluorescence ratio (𝑅) is characterized by stable and sufficientdifference. The confidence intervals of the fluorescence ratiofor plants under normal and stressed states were not large(≤0.1 in the majority of the cases). The sum of confidenceintervals of the fluorescence ratio (𝑅) for plants under normaland stressed states is not usually more than the difference
0.0
0.4
0.8
1.2
R(6
85/7
40)
1 3 5 7 92 4 6 8 10 11 12
Figure 9: Fluorescence ratio (𝑅) mean values and 95% confidenceintervals of watercress in normal conditions (columns 1, 3, 5, 7, and9) and under stressed conditions caused by mechanical damage andoverwatering (columns 2, 4, 6, 8, 10, and 12).
0.0
0.2
0.4
0.6
0.8
1.0
R(6
85/7
40)
1 3 5 7 92 4 6 8 10
Figure 10: Fluorescence ratio (𝑅) mean values and 95% confidenceintervals of lawn grass under normal conditions (columns 1, 3, 5,7, and 9) and stressed conditions caused by different soil pollutants(columns 2, 4, 6, 8, and 10).
between ratio 𝑅 for plants in a normal state and ratio𝑅 for plants in a stressed state caused by various factors(mechanical damage, overwatering, and soil polluting).
This means that fluorescence excitation at 532 nm wave-length and the ratio of fluorescence intensities in the red(685 nm) and far-red (740 nm) bands can be used as signa-tures of plant stress state caused by various factors.
4. Conclusions
By the processing of the experimental results of fluorescencespectra (induced by a 532 nm wavelength laser) of plants innormal and stressed states caused by mechanical damage,overwatering, and soil pollution the following conclusionscan be postulated.
(i) The fluorescence spectra of different samples of aplant species revealed repeatability of the spectrashapes. Ratio 𝑅 of the fluorescence intensity at 685and 740 nm demonstrated sufficient stability. How-ever, it is possible to mistake defining the plant stressstate (normal or stressed) using only single measure-ment of ratio 𝑅. We proposed more reliable method

6 International Journal of Optics
to define plant condition using mean value of 𝑅 ratio,which is suitable for small set of measurements.
(ii) The difference between the mean value of ratio 𝑅 fora plant in a normal state and that in a stressed state,in the majority of cases, is greater than the differencebetween ratio 𝑅 values for different samples of oneplant species.
The experimental results obtained allow us to develop aremote laser system for detecting plant stress state. However,to ensure the reliability of themeasurements, it is necessary tocalculate the mean value of ratio 𝑅 for several measurementsfor several plants.
Competing Interests
The authors declare that they have no competing interests.
References
[1] A. S. Ndao, A. Konte, M. Biaye, M. E. Faye, N. A. B. Faye, and A.Wague, “Analysis of chlorophyll fluorescence spectra in sometropical plants,” Journal of Fluorescence, vol. 15, no. 2, pp. 123–129, 2005.
[2] A. Takeuchi, Y. Saito, T. D. Kawahara, and A. Njmura, “Possi-bility of disease process monitoring of plants by laser-inducedfluorescence method,” in Proceedings of the Development andEvaluation of LIFMeasurement Systems, vol. 4153 of Proceedingsof SPIE, pp. 22–29, February 2001.
[3] Y. Saito, “Laser-induced fluorescence spectroscopy/techniqueas a tool for field monitoring of physiological status of livingplants,” in 14th International School on Quantum Electronics:Laser Physics andApplications, 66041W, vol. 6604 ofProceedingsof SPIE, 12 pages, March 2007.
[4] H. A. Hristov, E. G. Borisova, L. A. Avramov, and I. N. Kolev,“Applications of laser-induced fluorescence for remote sensing,”in Proceedings of the 11th International School on Quantum Elec-tronics: Laser Physics and Applications, vol. 4397 of Proceedingsof SPIE, pp. 496–500, Varna, Bulgaria, April 2001.
[5] K. J. Lee, Y. Park, A. Bunkin, R. Nunes, S. Pershin, andK. Voliak,“Helicopter-based lidar system for monitoring the upper oceanand terrain surface,” Applied Optics, vol. 41, no. 3, pp. 401–406,2002.
[6] L. A. Corp, J. E. McMurtrey, E. M. Middleton, C. L. Mulchi, E.W. Chappelle, and C. S. T. Daughtry, “Fluorescence sensingsystems: in vivo detection of biophysical variations in field corndue to nitrogen supply,” Remote Sensing of Environment, vol. 86,no. 4, pp. 470–479, 2003.
[7] M. V. Grishaev, V. V. Zuev, and O. V. Kharchenko, “Fluorescentchannel of the Siberian Lidar Station,” in 15th Symposium onHigh-Resolution Molecular Spectroscopy, 65800U, vol. 6580 ofProceedings of SPIE, 6 pages, December 2006.
[8] G. Matvienko, V. Timofeev, A. Grishin, and N. Fateyeva,“Fluorescence lidar method for remote monitoring of effectson vegetation,” in Lidar Technologies, Techniques, and Measure-ments for Atmospheric Remote Sensing II, 63670F, vol. 6367 ofProceedings of SPIE, 8 pages, October 2006.
[9] J. Belasque, M. C. G. Gasparoto, and L. G. Marcassa, “Detectionof mechanical and disease stresses in citrus plants by fluores-cence spectroscopy,” Applied Optics, vol. 47, no. 11, pp. 1922–1926, 2008.
[10] A. S. Gouveia-Neto, E. A. Silva, R. A. Oliveira et al., “Waterdeficit and salt stress diagnosis through LED induced chloro-phyll fluorescence analysis in Jatropha curcas L. oil plants forbiodisiel,” in Imaging, Manipulation, and Analysis of Biomole-cules, Cells, and Tissues IX, 79020A, vol. 7902 of Proceedings ofSPIE, 10 pages, February 2011.
[11] R. Maurya, S. M. Prasad, and R. Gopal, “LIF technique offersthe potential for the detection of cadmium-induced alterationin photosynthetic activities of Zea Mays L.,” Journal of Photo-chemistry and Photobiology C: Photochemistry Reviews, vol. 9,no. 1, pp. 29–35, 2008.
[12] E. Middleton, J. E. McMurtrey, P. K. Entcheva Campbell, L.A. Corp, L. M. Butchera, and E. W. Chappellea, “Optical andfluorescence properties of corn leaves from different nitrogenregimes,” in Remote Sensing for Agriculture, Ecosystems, andHydrology IV, vol. 4879 of Proceedings of SPIE, pp. 72–83,March2003.
[13] H. K. Lichtenthaler and U. Rinderle, “The role of chlorophyllfluorescence in the detection of stress conditions in plants,”CRCCritical Reviews in Analytical Chemistry, vol. 19, no. 1, pp. 29–85,1988.
[14] G. G. Matvienko, A. I. Grishin, O. V. Kharchenko, and O. A.Romanovskii, “Remote sounding of vegetation characteristicsby laser-induced fluorescence,” inProceedings of the Laser RadarTechnology and Applications IV, vol. 3707 of Proceedings of SPIE,pp. 524–532, Orlando, Fla, USA, 1999.
[15] Z. G. Cerovic, G. Samson, F. Morales, N. Tremblay, and I. Moya,“Ultraviolet-induced fluorescence for plantmonitoring: presentstate and prospects,”Agronomie, vol. 19, no. 7, pp. 543–578, 1999.
[16] A. B. Utkin, R. Felizardo, C. Gameiro, A. R. Matos, and P.Cartaxana, “Laser induced fluorescence technique for environ-mental applications,” in Proceedings of the 2nd InternationalConference on Applications of Optics and Photonics, vol. 9286 ofProceedings of SPIE, Aveiro, Portugal, August 2014.

Submit your manuscripts athttp://www.hindawi.com
Hindawi Publishing Corporationhttp://www.hindawi.com Volume 2014
High Energy PhysicsAdvances in
The Scientific World JournalHindawi Publishing Corporation http://www.hindawi.com Volume 2014
Hindawi Publishing Corporationhttp://www.hindawi.com Volume 2014
FluidsJournal of
Atomic and Molecular Physics
Journal of
Hindawi Publishing Corporationhttp://www.hindawi.com Volume 2014
Hindawi Publishing Corporationhttp://www.hindawi.com Volume 2014
Advances in Condensed Matter Physics
OpticsInternational Journal of
Hindawi Publishing Corporationhttp://www.hindawi.com Volume 2014
Hindawi Publishing Corporationhttp://www.hindawi.com Volume 2014
AstronomyAdvances in
International Journal of
Hindawi Publishing Corporationhttp://www.hindawi.com Volume 2014
Superconductivity
Hindawi Publishing Corporationhttp://www.hindawi.com Volume 2014
Statistical MechanicsInternational Journal of
Hindawi Publishing Corporationhttp://www.hindawi.com Volume 2014
GravityJournal of
Hindawi Publishing Corporationhttp://www.hindawi.com Volume 2014
AstrophysicsJournal of
Hindawi Publishing Corporationhttp://www.hindawi.com Volume 2014
Physics Research International
Hindawi Publishing Corporationhttp://www.hindawi.com Volume 2014
Solid State PhysicsJournal of
Computational Methods in Physics
Journal of
Hindawi Publishing Corporationhttp://www.hindawi.com Volume 2014
Hindawi Publishing Corporationhttp://www.hindawi.com Volume 2014
Soft MatterJournal of
Hindawi Publishing Corporationhttp://www.hindawi.com
AerodynamicsJournal of
Volume 2014
Hindawi Publishing Corporationhttp://www.hindawi.com Volume 2014
PhotonicsJournal of
Hindawi Publishing Corporationhttp://www.hindawi.com Volume 2014
Journal of
Biophysics
Hindawi Publishing Corporationhttp://www.hindawi.com Volume 2014
ThermodynamicsJournal of