Research Article Environmental Application of Telon Blue...
11
Research Article Environmental Application of Telon Blue AGLF Adsorption on Sunflower Pulp: A Response Surface Methodology Approach and Kinetic Study Ferda Gönen and Esra Köylü Chemical Engineering Department, Mersin University, C ¸ iſtlikk¨ oy, 33343 Mersin, Turkey Correspondence should be addressed to Ferda G¨ onen; [email protected] Received 2 October 2015; Revised 26 January 2016; Accepted 3 February 2016 Academic Editor: ´ Angeles V. Del R´ ıo Copyright © 2016 F. G¨ onen and E. K¨ oyl¨ u. is is an open access article distributed under the Creative Commons Attribution License, which permits unrestricted use, distribution, and reproduction in any medium, provided the original work is properly cited. e adsorptive removal of Telon Blue AGLF (TB AGLF) from aqueous solution using sunflower pulp was studied. e effects of pH, adsorbent dose, temperature, and initial dye concentration on the adsorption capacity and the removal % of TB AGLF were investigated. Experimental results showed that sunflower pulp was excellent agroindustrial adsorbent with maximum dye removal efficiency of 97.22% for a very short time (under conditions of 100 mg L −1 initial dye concentration, pH = 3, = 50 ∘ C, and 1 g L −1 of adsorbent dose). e binary effects of initial dye concentration and temperature on the adsorption properties of sunflower pulp were analysed by RSM and two model equations for predicting adsorption capacity and dye removal % of pulp because arbitrarily chosen initial dye concentration and temperature were developed by using response surface methodology (RSM). Experimental values of the adsorption capacity and dye removal % were in good agreement with the predicted values by the improved models. Adsorption experiments and kinetic regression results indicated that the experimental data were well defined with pseudo-second- order kinetic model. 1. Introduction Many harmful organic and inorganic substances such as aromatic compounds, heavy metals, and dyes are present in industrial wastewater. e effluents of the textile, leather, printing, laundry, tannery, rubber, plastic, painting, and other industries produce colored dyes which are known as major water pollutants [1]. Dye colored water is highly visible and have the effects of reduction of light penetration and gas solubility in water [2]. Synthetic dyes consist of complex aro- matic structures which supply them with physicochemical, thermal, and optical properties. A large number of dyes and pigments have toxic property for nature with suspected car- cinogenic and mutagenic effects that affect aquatic biota and humans [3]. Due to all of the detrimental effects, industrial effluents containing dyes need to be treated before being discharged to the aquatic environment [4]. Practically, the treatment of textile wastewater by conventional methods has been found to be ineffective for many wastewater treatment facilities. Traditional textile dyeing process, such liquid- liquid extraction, uses a lot of untreated water, which is then discharged to the environment as water containing dye stuff chemicals. e simplest and the most cost effective treatment method for the removal of color dyes from wastewater must be determined before contacting with unpolluted natural water sources [5]. Coagulation, flocculation, ion exchange, membrane separation, and oxidation are some different treatment technologies which are used to remove dyes from waste effluents [6]. But, several limitations of these methods are high-energy consumption, incomplete pollutant removal, and production of toxic waste products that require further treatment method [7]. Some researchers have demonstrated that biological treatment of textile wastewater has resis- tance to degradation due to the presence of biological inert matter combined with high molecular weight dyestuff [8]. In literature, it has been proved that, of the 18 azo dyes investigated, 11 compounds passed through the activated sludge process practically untreated, 4 (Acid Blue 113, Acid Hindawi Publishing Corporation Journal of Chemistry Volume 2016, Article ID 9621523, 10 pages http://dx.doi.org/10.1155/2016/9621523
Transcript of Research Article Environmental Application of Telon Blue...

Research ArticleEnvironmental Application of Telon BlueAGLF Adsorption on Sunflower Pulp: A Response SurfaceMethodology Approach and Kinetic Study
Ferda Gönen and Esra Köylü
Chemical Engineering Department, Mersin University, Ciftlikkoy, 33343 Mersin, Turkey
Correspondence should be addressed to Ferda Gonen; [email protected]
Received 2 October 2015; Revised 26 January 2016; Accepted 3 February 2016
Academic Editor: Angeles V. Del Rıo
Copyright © 2016 F. Gonen and E. Koylu. This is an open access article distributed under the Creative Commons AttributionLicense, which permits unrestricted use, distribution, and reproduction in any medium, provided the original work is properlycited.
The adsorptive removal of Telon Blue AGLF (TB AGLF) from aqueous solution using sunflower pulp was studied. The effects ofpH, adsorbent dose, temperature, and initial dye concentration on the adsorption capacity and the removal % of TB AGLF wereinvestigated. Experimental results showed that sunflower pulp was excellent agroindustrial adsorbent with maximum dye removalefficiency of 97.22% for a very short time (under conditions of 100mg L−1 initial dye concentration, pH = 3, 𝑇 = 50∘C, and 1 g L−1of adsorbent dose). The binary effects of initial dye concentration and temperature on the adsorption properties of sunflower pulpwere analysed by RSM and two model equations for predicting adsorption capacity and dye removal % of pulp because arbitrarilychosen initial dye concentration and temperature were developed by using response surface methodology (RSM). Experimentalvalues of the adsorption capacity and dye removal % were in good agreement with the predicted values by the improved models.Adsorption experiments and kinetic regression results indicated that the experimental data were well defined with pseudo-second-order kinetic model.
1. Introduction
Many harmful organic and inorganic substances such asaromatic compounds, heavy metals, and dyes are presentin industrial wastewater. The effluents of the textile, leather,printing, laundry, tannery, rubber, plastic, painting, and otherindustries produce colored dyes which are known as majorwater pollutants [1]. Dye colored water is highly visible andhave the effects of reduction of light penetration and gassolubility in water [2]. Synthetic dyes consist of complex aro-matic structures which supply them with physicochemical,thermal, and optical properties. A large number of dyes andpigments have toxic property for nature with suspected car-cinogenic and mutagenic effects that affect aquatic biota andhumans [3]. Due to all of the detrimental effects, industrialeffluents containing dyes need to be treated before beingdischarged to the aquatic environment [4]. Practically, thetreatment of textile wastewater by conventional methods hasbeen found to be ineffective for many wastewater treatment
facilities. Traditional textile dyeing process, such liquid-liquid extraction, uses a lot of untreated water, which is thendischarged to the environment as water containing dye stuffchemicals.The simplest and the most cost effective treatmentmethod for the removal of color dyes from wastewater mustbe determined before contacting with unpolluted naturalwater sources [5]. Coagulation, flocculation, ion exchange,membrane separation, and oxidation are some differenttreatment technologies which are used to remove dyes fromwaste effluents [6]. But, several limitations of these methodsare high-energy consumption, incomplete pollutant removal,and production of toxic waste products that require furthertreatment method [7]. Some researchers have demonstratedthat biological treatment of textile wastewater has resis-tance to degradation due to the presence of biological inertmatter combined with high molecular weight dyestuff [8].In literature, it has been proved that, of the 18 azo dyesinvestigated, 11 compounds passed through the activatedsludge process practically untreated, 4 (Acid Blue 113, Acid
Hindawi Publishing CorporationJournal of ChemistryVolume 2016, Article ID 9621523, 10 pageshttp://dx.doi.org/10.1155/2016/9621523

2 Journal of Chemistry
Red 151, Direct Violet 9, and Direct Violet 28) were adsorbedon the waste activated sludge, and only 3 (Acid Orange 7,Acid Orange 8, and Acid Red 88) were biodegraded [9]. Onthe other hand, physical adsorption is effective in removingnonbiodegradable pollutants. When it is compared in termsof efficiency and ease of use, adsorption was known as themore preferable technique for wastewater treatment thanconventional treatment processes [10]. In addition to beingefficient and easy to operate, this technique is cost effectiveand eco-friendly for dye removal and also insensitive to toxicsubstances [11]. In removal processes of many pollutants byadsorption, activated carbon is known as the most widelyused adsorbent. Due to the reasons of the expensive pro-duction and regeneration, it is still considered as expensive[12, 13]. Therefore, cheaper materials such as the solid wastesobtained from the agricultural industry are needed foradsorption [14]. The advanced research has been carried outto examine the possibility of using a number of low costsubstances including agroindustrial waste as adsorbents, suchas nuts, peanuts, olive wastes, sugar cane bagasse, banana,orange peels, tea leaves, coconut bunch waste, rice, and wheatwaste [15]. Currently, the use of locally produced sunflowermeal as an adsorbent can be quite attractive and supportivefor socioeconomic development. The main purpose of thisstudy was twofold: firstly investigate TB AGLF adsorptionproperties of sunflower pulp as a function of pH, adsorbentdosage, initial dye concentrations, and temperature in a batchsystem and secondly observe if the adsorption capacity andremoval % could be modelled by using RSM as a functionof initial dye concentration and temperature for bringing anew perspective to the wastewater treatment strategies. In thestudy, the reason of selection of TB AGLF as a model dyematerial is the extended use of this dye in textile industryand potential harmful effect to the environment. On theother hand, sunflower pulp is a low cost agroindustrial wasteresidue found in abundance. It is used as animal feed and itis composed of 32% and more than 20% of crude protein andfiber substances, respectively. Functional groups which playa major role in the adsorption of metal ions and dyes fromwastewaters are carboxyl, hydroxyl, sulfhydryl, and amidepresent on the surface of organic sorbents including agricul-tural residues [16–18]. The present study would be the firstreport describing the effects of pH, initial dye concentration,adsorbent dosage and temperature on TB AGLF adsorption,and mechanism of TB AGLF adsorption on sunflower pulp.
2. Material and Methods
2.1. Adsorbent. Sunflower pulp is one of the most producedpulp in Turkey. Sunflower meal is the residual after removalof the oil from sunflower seed oil. There are two types ofsunflower pulp in the market. One of them is mixed pulpthat contains low crude protein and 2-3% oils with high crudecellulose content due to their more shelled.The oil rate in thistype of pulp does not exceed 1.5%. In addition, its proteincontent is higher than that of the other type. The chemicalstructure of sunflower pulp is given in Table 1.
In this experimental study, the waste pulp of sunflowerremaining from the sunflower oil industry was obtained from
Table 1: The chemical structure of sunflower pulp.
Content Partiallyshelled (%)
Shelled(%)
Nonshelled(%)
Water 12 15.7 10.8Crude oil 1.4 1.1 4.9Crude protein 31–35 49.5 19.6Digestible protein 28–32 45 16.3Nitrogen-free extractsubstances 28 28.6 27
Total digestible nutrients 60 70.8 35.6Crude fiber 19.6 5.4 35.9Crude ash 5.7 5.9 5.6Calcium — 0.26 —Phosphorus — 1.22 —
H5C2HN
CH3
CH3H3CNaO3S
N
N
N
H
+
SO−3
N(C2H5)2
Figure 1: The molecular structure of TB AGLF.
Table 2: Some essential properties of TB AGLF.
CAS 6378-87-6Molecular weight 735.85Synonyms Acid Blue 121, Navazol Acid Blue GLMolecular formula C
37
H38
N5
NaO6
S2
𝜆max 610 nm
Aves Oil Factory, Mersin, Turkey. The collected sunflowerpulp was washed with tap water to remove surface adheredparticles and water soluble materials. Then, it was sprayedwith distilled water and dried in an oven at 100∘C to aconstant weight. After grinding process, it was sieved toget the adsorbent having size ≤500𝜇m and stored in drycontainers for use in all experiments.
2.2. Preparation of Dye Stock Solution. TB AGLF dye (pur-chased fromSigmaAldrichCo.)was used in our experiments.Some essential properties and the molecular structure of TBAGLF dye are given in Table 2 and Figure 1. All chemicalsused in the experiments were of reagent grade. Doublydistilled water was used for preparation of all solutions. Dyesolutionswith the concentration range of 25–500mg L−1wereprepared by diluting 1.0 g L−1 of stock solution. Diluted orconcentrated H
2
SO4
and NaOH solutions were used for therequired value the pH of each solution.
Journal of Chemistry 3
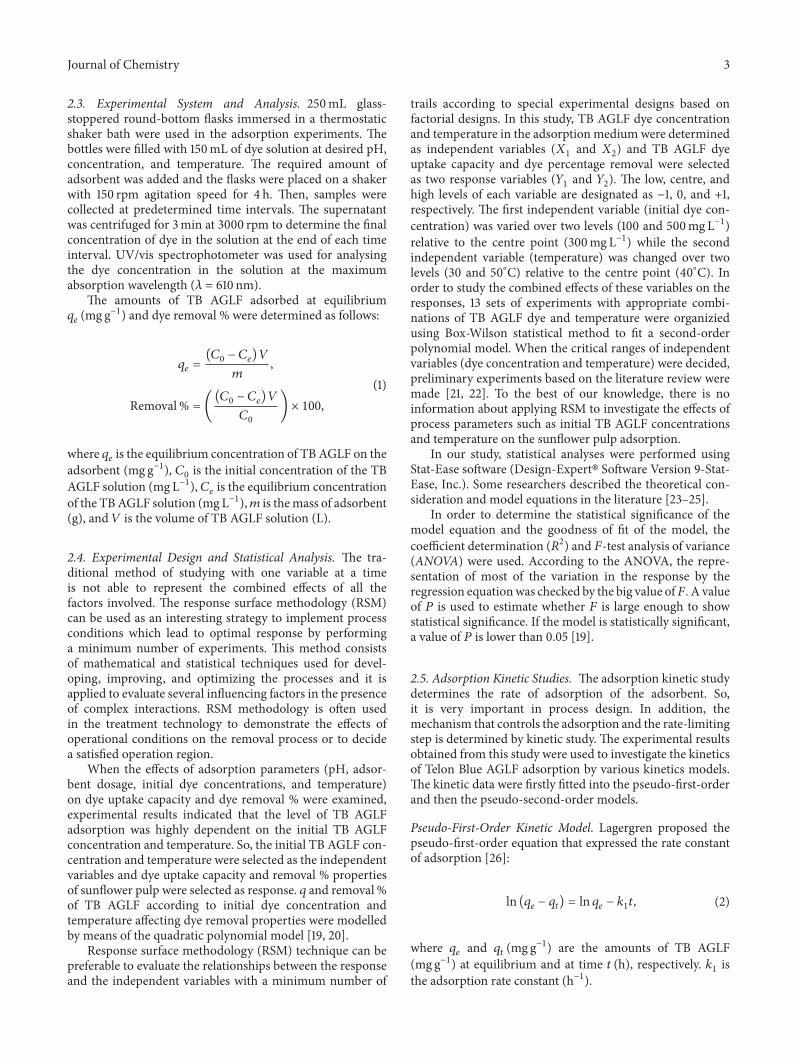
2.3. Experimental System and Analysis. 250mL glass-stoppered round-bottom flasks immersed in a thermostaticshaker bath were used in the adsorption experiments. Thebottles were filled with 150mL of dye solution at desired pH,concentration, and temperature. The required amount ofadsorbent was added and the flasks were placed on a shakerwith 150 rpm agitation speed for 4 h. Then, samples werecollected at predetermined time intervals. The supernatantwas centrifuged for 3min at 3000 rpm to determine the finalconcentration of dye in the solution at the end of each timeinterval. UV/vis spectrophotometer was used for analysingthe dye concentration in the solution at the maximumabsorption wavelength (𝜆 = 610 nm).
The amounts of TB AGLF adsorbed at equilibrium𝑞𝑒
(mg g−1) and dye removal % were determined as follows:
𝑞𝑒
=(𝐶0
− 𝐶𝑒
) 𝑉
𝑚,
Removal% = ((𝐶0
− 𝐶𝑒
) 𝑉
𝐶0
) × 100,
(1)
where 𝑞𝑒
is the equilibrium concentration of TB AGLF on theadsorbent (mg g−1), 𝐶
0
is the initial concentration of the TBAGLF solution (mg L−1), 𝐶
𝑒
is the equilibrium concentrationof the TBAGLF solution (mg L−1),𝑚 is themass of adsorbent(g), and 𝑉 is the volume of TB AGLF solution (L).
2.4. Experimental Design and Statistical Analysis. The tra-ditional method of studying with one variable at a timeis not able to represent the combined effects of all thefactors involved. The response surface methodology (RSM)can be used as an interesting strategy to implement processconditions which lead to optimal response by performinga minimum number of experiments. This method consistsof mathematical and statistical techniques used for devel-oping, improving, and optimizing the processes and it isapplied to evaluate several influencing factors in the presenceof complex interactions. RSM methodology is often usedin the treatment technology to demonstrate the effects ofoperational conditions on the removal process or to decidea satisfied operation region.
When the effects of adsorption parameters (pH, adsor-bent dosage, initial dye concentrations, and temperature)on dye uptake capacity and dye removal % were examined,experimental results indicated that the level of TB AGLFadsorption was highly dependent on the initial TB AGLFconcentration and temperature. So, the initial TB AGLF con-centration and temperature were selected as the independentvariables and dye uptake capacity and removal % propertiesof sunflower pulp were selected as response. 𝑞 and removal%of TB AGLF according to initial dye concentration andtemperature affecting dye removal properties were modelledby means of the quadratic polynomial model [19, 20].
Response surface methodology (RSM) technique can bepreferable to evaluate the relationships between the responseand the independent variables with a minimum number of
trails according to special experimental designs based onfactorial designs. In this study, TB AGLF dye concentrationand temperature in the adsorptionmediumwere determinedas independent variables (𝑋
1
and 𝑋2
) and TB AGLF dyeuptake capacity and dye percentage removal were selectedas two response variables (𝑌
1
and 𝑌2
). The low, centre, andhigh levels of each variable are designated as −1, 0, and +1,respectively. The first independent variable (initial dye con-centration) was varied over two levels (100 and 500mg L−1)relative to the centre point (300mg L−1) while the secondindependent variable (temperature) was changed over twolevels (30 and 50∘C) relative to the centre point (40∘C). Inorder to study the combined effects of these variables on theresponses, 13 sets of experiments with appropriate combi-nations of TB AGLF dye and temperature were organiziedusing Box-Wilson statistical method to fit a second-orderpolynomial model. When the critical ranges of independentvariables (dye concentration and temperature) were decided,preliminary experiments based on the literature review weremade [21, 22]. To the best of our knowledge, there is noinformation about applying RSM to investigate the effects ofprocess parameters such as initial TB AGLF concentrationsand temperature on the sunflower pulp adsorption.
In our study, statistical analyses were performed usingStat-Ease software (Design-Expert� Software Version 9-Stat-Ease, Inc.). Some researchers described the theoretical con-sideration and model equations in the literature [23–25].
In order to determine the statistical significance of themodel equation and the goodness of fit of the model, thecoefficient determination (𝑅2) and 𝐹-test analysis of variance(ANOVA) were used. According to the ANOVA, the repre-sentation of most of the variation in the response by theregression equationwas checked by the big value of𝐹. A valueof 𝑃 is used to estimate whether 𝐹 is large enough to showstatistical significance. If the model is statistically significant,a value of 𝑃 is lower than 0.05 [19].
2.5. Adsorption Kinetic Studies. The adsorption kinetic studydetermines the rate of adsorption of the adsorbent. So,it is very important in process design. In addition, themechanism that controls the adsorption and the rate-limitingstep is determined by kinetic study. The experimental resultsobtained from this study were used to investigate the kineticsof Telon Blue AGLF adsorption by various kinetics models.The kinetic data were firstly fitted into the pseudo-first-orderand then the pseudo-second-order models.
Pseudo-First-Order Kinetic Model. Lagergren proposed thepseudo-first-order equation that expressed the rate constantof adsorption [26]:
ln (𝑞𝑒
− 𝑞𝑡
) = ln 𝑞𝑒
− 𝑘1
𝑡, (2)
where 𝑞𝑒
and 𝑞𝑡
(mg g−1) are the amounts of TB AGLF(mg g−1) at equilibrium and at time 𝑡 (h), respectively. 𝑘
1
isthe adsorption rate constant (h−1).

4 Journal of Chemistry
0102030405060708090
0 1 2 3 4 5 6 7pH
qeq
(mg g
−1)
Figure 2: The effect of initial pH on the adsorption of TB AGLF bysunflower pulp (𝑇: 25∘C, 𝐶
0
: 100mg L−1, 𝑋: 1.0 g L−1, and agitationrate: 150 rpm).
For the pseudo-first-order kinetic model, the kineticparameters can be determined by the plots of (𝑞
𝑒
− 𝑞𝑡
) versus𝑡 at different initial dye concentrations.
Pseudo-Second-Order Kinetic Model. Ho and McKay pro-posed the pseudo-first-order model [27]. This model equa-tion is expressed as
𝑡
𝑞𝑡
=1
𝑘2
𝑞2𝑒
+𝑡
𝑞𝑒
, (3)
where 𝑘2
(gmg−1 h−1) is the rate constant of second-ordermodel.
For the pseudo-second-order kinetic model, the kineticparameters can be evaluated by the plots of 𝑡/𝑞
𝑡
versus 𝑡 atdifferent initial dye concentrations.
3. Results and Discussion
3.1. Effect of Solution pH. The adsorption capacity of adsor-bent is strongly affected by the solution pH. In order toobserve this effect, TB AGLF adsorption using sunflowerpulp was studied in the pH range of 3–8, using an initialdye concentration of 100mg L−1 and an adsorbent amountof 1 g L−1 at 25∘C. Figure 2 indicated that the increase ofpH from 2 to 3 causes an increase in H+ ion concentrationin the adsorption medium, and the surface of the pulpobtains a positive charge by the adsorption of H+ ions.When the pulp surface is positively charged at pH = 3, asignificantly strong electrostatic attraction occurred betweenthe positively charged sites. As the pulp surface site is nega-tive, the adsorbent surface becomes predominantly negativelycharged, leading to a decrease in the adsorption capacity dueto the competition between excess OH− ions and the anionicTB AGL dye molecule for the adsorption sites. In literature,similar results are observed for the adsorption of Congo redon cashew nut shell [28], sunflower seed hull [29], soy mealhull [30].
From Figure 2, it is seen that the adsorption of TB AGLFwas maximum at pH 3.0 (𝑞eq = 85.07mg g−1, removal % =86.09) and the other adsorption experiments were performedat this optimum pH value.
Table 3: The effect of adsorbent dose on the equilibrium uptakecapacities and removal % of TB AGLF by sunflower pulp.
𝑋0
(g L−1) 0.5 1.0 2.0 3.0𝑞eq (mg g−1) 148.53 85.07 42.98 27.77Removal % 76.40 86.09 85.33 84.18
3.2. Effect of Adsorbent Dosage. The adsorption of TB AGLFby sunflower pulp was studied by using different adsor-bent doses (0.50, 1.0, 2.0, and 3.0 g L−1) for the initial dyeconcentration of 100mg L−1 at 25∘C and pH 3.0. It is clearfrom Table 3 that the adsorbent dose was increased, and theadsorption capacity was decreased.
The explanation of this phenomenon is that adsorptionsites remain unsaturated during the adsorption reactionwhereas the number of sites available for adsorption siteincreases by increasing the adsorbent dose [31]. It is evidentthat the particle aggregation is present. In the literature, someinvestigations including other types of dye-sorbent systemsmentioned and criticized the similar behavior for the effect ofadsorbent concentrations on TB AGLF dye sorption capacity[32, 33]. In this study, the maximum adsorption capacityof 148.53mg g−1 was obtained with adsorbent dose of 0.5 g,initial dye concentration of 100mg/L, and initial solutionpH of 3.0. The TB AGLF removal % by sunflower pulp wasdetermined as 76.40% at the same conditions. This removalvalue was higher than that reported in a literature. Usluogluet al. [34] presented the TB AGLF removal % value of 33.0%for corncob activated carbon adsorption [34].
3.3. Effect of Initial TB AGLF Concentration on Temperature-Dependent Adsorption. Theeffect of initial dye concentrationon the adsorption capacity of sunflower pulp was investigatedbetween 100 and 500mg L−1 at three different temperatures. Ifthe concentration and temperature ranges of TB AGLF werecompared with literature, similar results were seen. In 2016,Karimifard and Moghaddam [35] studied RB19 removal atconstant dye concentration of 100mg L−1.They examined thecombined effects of pH, initial dye concetration, and adsor-bent dose by RSM model. Similarly, in 2009, Srinivasan andMurthy [36] used RSM analysis to evaluate response variable(decolorization %) as a function of the independent variablessuch as glucose and ammonium chloride concentrations interms of coded values.When decolorization % of reactive reddye is examined, the concentration range was varied over twolevels (250 and 500mg L−1). In this study, 𝑅2 value of regres-sions model equation shows a good fit of the model withexperimental data. In 2010, Singh et al. [22] examined theeffects of four independent variables, temperature (10–50∘C),initial pH of solution (2–10), initial dye concentration (140–220mg L−1), and adsorbent dose (1–5 g L−1) on Rhodamine Bremoval. It is clear from the literature search that the criticalranges of independent variables consist of appropriate andrealistic combinations of dye concentration and temperature.
The results for the effect of initial TBAGLF concentrationand the temperature are shown in Table 4. As it is seenfrom Table 4, the equilibrium sorption capacity of sunflower

Journal of Chemistry 5
Table 4: Effect of initial TB AGLF dye concentration and temperature on the equilibrium capacity and removal % of sunflower pulp.
30∘C 40∘C 50∘C𝐶0
(mg L−1) 𝑞eq (mg g−1) Removal % 𝐶0
(mg L−1) 𝑞eq (mg g−1) Removal % 𝐶0
(mg L−1) 𝑞eq (mg g−1) Removal %97.94 86.62 88.44 100.29 95.51 95.23 100.59 97.79 97.22273.13 194.85 82.17 228.67 207.35 90.67 223.52 205.88 92.10318.01 248.16 78.03 305.14 261.76 85.78 303.67 265.44 87.41492.65 343.75 69.78 498.16 363.97 73.06 501.84 393.38 78.39
pulp for dye increased notably with increasing initial dyeconcentration up to 500mg L−1 and increasing temperatureup to 50∘C. Then, a slight increase in initial dye concentra-tion at any of the temperature studied did not change theequilibrium sorption capacity. In other words, equilibriumsorption capacity showed a saturation trend at higher dyeconcentrations due to a finite number of surface binding sites.At 25∘C, when the initial dye concentration increased from118.53 to 473.06mg L−1, the equilibrium capacity of adsorbentincreased from 114.87 to 269.40mg g−1. The temperature alsoaffected the equilibrium dye capacity as shown in Table 4.When the temperature was raised from 30 to 50∘C, the uptakecapacity increased from 86.62 to 97.79mg g−1 at 100mg L−1initial dye concentration. From the same table, removal% of dye showed the opposite trend and decreased withthe increasing initial dye concentration. With the rise intemperature from 30 to 50∘C, removal % of dye increasedfrom 88.44 to 97.22% for 100mg L−1 initial dye concentra-tion, respectively. It can be said that adsorption becomesindependent of initial concentration at lower concentrations.The reason of this phenomenon is that the ratio of initialnumber of dye ions to the available sorption sites is low. Inthe case of higher concentrations, because the available sitesof adsorption become fewer, the removal of dye depends onthe initial concentration.
3.4. Response Surface Estimation for the Combined Effects ofInitial Dye Concentration and Temperature on the EquilibriumSorption Capacity and Removal Percentage of Dye. The pur-pose of this study is not only to examine the combined effectsof initial concentration and temperature on dye adsorptionproperties of the sunflower pulp, but also to find the bestmodels that describe dye removal process.
In this analysis, independent variables were initial dyeconcentration and temperature in the adsorption medium.Dependent output response variables were the equilibriumsorption capacity and removal percentage of dye. In orderto examine the combined effects of independent variableson the responses, 13 sets of experiments with appropriatecombinations of initial dye concentrations and temperatureswere carried out according to Box-Wilson statistical method.The first independent variable (initial dye concentration)was varied over two levels (100 and 500mg L−1) relative tothe center point (300mg L−1), while the second independentvariable (temperature) was changed over two levels (30 and50∘C) relative to the center point (40∘C) (Table 5).
Table 5: Experimental range and levels of independent processvariables.
Independent variables Design variables Range and levels−1 0 +1
𝐶0
(mg L−1) 𝑋1
100 300 500𝑇 (∘C) 𝑋
2
30 40 50
In order to estimate the responses of equilibrium sorp-tion capacities and removal % of dye numerically andthe graphical analysis of the model, the statistical softwarepackage Design-Expert 9 was used for the experimentaldata evaluation. For the purpose of the convenience of fitof the model, the coefficient determination (𝑅2) and theanalysis of variances (ANOVA) were used. The experimentalfindings of equilibrium sorption capacity and removal %of dye were adapted to a second-order quadratic equation,giving two numerical correlations to predict the responsesof equilibrium sorption capacity and removal percentages ofdye:
𝑞 = −40.694 + 0.932𝑋1
+ 1.662𝑋2
+ 4.807𝐸
− 003𝑋1
𝑋2
− 7.328𝐸 − 004𝑋1
2
− 0.022𝑋2
2
,
Removal% = 50.484 − 0.041𝑋1
+ 1.986𝑋2
− 2.25𝐸
− 005𝑋1
𝑋2
− 1.227𝐸 − 005𝑋1
2
− 0.019𝑋2
2
,
(4)
where 𝑋1
and 𝑋2
are initial dye concentration (mg L−1)and temperature (∘C), respectively. The values of 𝑞 anddye removal % experimentally obtained and predicted fromthe related empirical models are listed in Table 6. Table 6indicated that, for both independent variables, the calculatedvalues of 𝑞 and removal % agreed very well with the predictedvalues of 𝑞 and removal % at all concentration-temperaturecombinations studied.
In order to assess the accuracy of the model, a differentset of independent experiments was used.
The results for the experimentally obtained and pre-dicted values from the related empirical models at differ-ent concentration-temperature combinations are listed inTable 7. As it is seen from Table 7, the calculated values
6 Journal of Chemistry
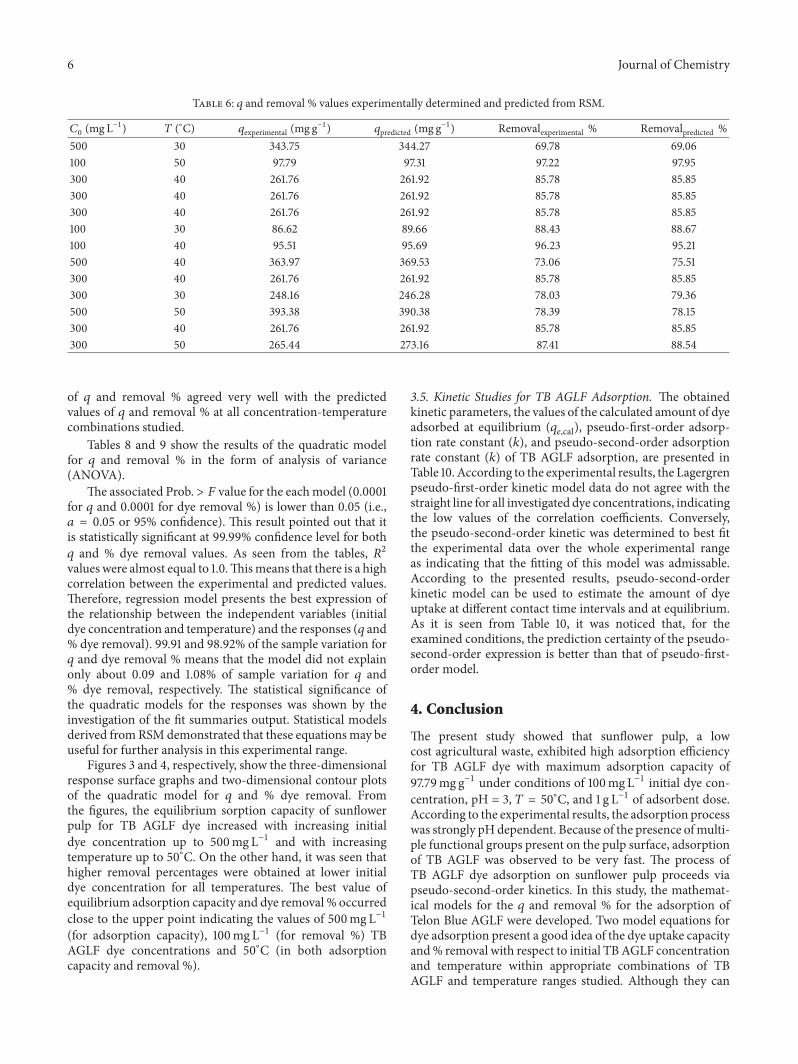
Table 6: 𝑞 and removal % values experimentally determined and predicted from RSM.
𝐶0
(mg L−1) 𝑇 (∘C) 𝑞experimental (mg g−1) 𝑞predicted (mg g−1) Removalexperimental % Removalpredicted %500 30 343.75 344.27 69.78 69.06100 50 97.79 97.31 97.22 97.95300 40 261.76 261.92 85.78 85.85300 40 261.76 261.92 85.78 85.85300 40 261.76 261.92 85.78 85.85100 30 86.62 89.66 88.43 88.67100 40 95.51 95.69 96.23 95.21500 40 363.97 369.53 73.06 75.51300 40 261.76 261.92 85.78 85.85300 30 248.16 246.28 78.03 79.36500 50 393.38 390.38 78.39 78.15300 40 261.76 261.92 85.78 85.85300 50 265.44 273.16 87.41 88.54
of 𝑞 and removal % agreed very well with the predictedvalues of 𝑞 and removal % at all concentration-temperaturecombinations studied.
Tables 8 and 9 show the results of the quadratic modelfor 𝑞 and removal % in the form of analysis of variance(ANOVA).
The associated Prob. > 𝐹 value for the eachmodel (0.0001for 𝑞 and 0.0001 for dye removal %) is lower than 0.05 (i.e.,𝑎 = 0.05 or 95% confidence). This result pointed out that itis statistically significant at 99.99% confidence level for both𝑞 and % dye removal values. As seen from the tables, 𝑅2values were almost equal to 1.0.Thismeans that there is a highcorrelation between the experimental and predicted values.Therefore, regression model presents the best expression ofthe relationship between the independent variables (initialdye concentration and temperature) and the responses (𝑞 and% dye removal). 99.91 and 98.92% of the sample variation for𝑞 and dye removal % means that the model did not explainonly about 0.09 and 1.08% of sample variation for 𝑞 and% dye removal, respectively. The statistical significance ofthe quadratic models for the responses was shown by theinvestigation of the fit summaries output. Statistical modelsderived fromRSMdemonstrated that these equationsmay beuseful for further analysis in this experimental range.
Figures 3 and 4, respectively, show the three-dimensionalresponse surface graphs and two-dimensional contour plotsof the quadratic model for 𝑞 and % dye removal. Fromthe figures, the equilibrium sorption capacity of sunflowerpulp for TB AGLF dye increased with increasing initialdye concentration up to 500mg L−1 and with increasingtemperature up to 50∘C. On the other hand, it was seen thathigher removal percentages were obtained at lower initialdye concentration for all temperatures. The best value ofequilibrium adsorption capacity and dye removal % occurredclose to the upper point indicating the values of 500mg L−1(for adsorption capacity), 100mg L−1 (for removal %) TBAGLF dye concentrations and 50∘C (in both adsorptioncapacity and removal %).
3.5. Kinetic Studies for TB AGLF Adsorption. The obtainedkinetic parameters, the values of the calculated amount of dyeadsorbed at equilibrium (𝑞
𝑒,cal), pseudo-first-order adsorp-tion rate constant (𝑘), and pseudo-second-order adsorptionrate constant (𝑘) of TB AGLF adsorption, are presented inTable 10. According to the experimental results, the Lagergrenpseudo-first-order kinetic model data do not agree with thestraight line for all investigated dye concentrations, indicatingthe low values of the correlation coefficients. Conversely,the pseudo-second-order kinetic was determined to best fitthe experimental data over the whole experimental rangeas indicating that the fitting of this model was admissable.According to the presented results, pseudo-second-orderkinetic model can be used to estimate the amount of dyeuptake at different contact time intervals and at equilibrium.As it is seen from Table 10, it was noticed that, for theexamined conditions, the prediction certainty of the pseudo-second-order expression is better than that of pseudo-first-order model.
4. Conclusion
The present study showed that sunflower pulp, a lowcost agricultural waste, exhibited high adsorption efficiencyfor TB AGLF dye with maximum adsorption capacity of97.79mg g−1 under conditions of 100mg L−1 initial dye con-centration, pH = 3, 𝑇 = 50∘C, and 1 g L−1 of adsorbent dose.According to the experimental results, the adsorption processwas strongly pHdependent. Because of the presence ofmulti-ple functional groups present on the pulp surface, adsorptionof TB AGLF was observed to be very fast. The process ofTB AGLF dye adsorption on sunflower pulp proceeds viapseudo-second-order kinetics. In this study, the mathemat-ical models for the 𝑞 and removal % for the adsorption ofTelon Blue AGLF were developed. Two model equations fordye adsorption present a good idea of the dye uptake capacityand% removal with respect to initial TBAGLF concentrationand temperature within appropriate combinations of TBAGLF and temperature ranges studied. Although they can

Journal of Chemistry 7
Table 7: Experimentally determined and predicted 𝑞 and removal % values at different concentration-temperature combinations to assessthe accuracy of the model.
𝐶0
(mg L−1) 𝑇 (∘C) 𝑞experimental (mg g−1) 𝑞predicted (mg g−1) Removalexperimental % Removalpredicted %25 25 17.06 12.95 82.86 87.2150 25 37.13 37.88 83.89 86.1575 25 59.71 61.90 84.15 85.07100 25 85.07 85.00 86.09 83.98200 25 152.57 168.23 79.05 79.46300 25 218.75 236.82 75.80 74.69500 25 295.96 330.02 62.16 64.4125 30 21.10 15.81 88.31 91.9150 30 42.35 41.34 86.88 90.8575 30 64.56 65.96 88.06 89.77100 30 86.62 89.66 88.44 88.67200 30 194.85 175.30 82.17 84.14300 30 248.16 246.29 78.03 79.36500 30 343.75 344.30 69.78 69.0625 40 21.84 18.24 91.10 98.4750 40 46.25 44.97 93.32 97.4075 40 67.94 70.79 93.81 96.31100 40 95.51 95.69 95.23 95.21200 40 207.35 186.13 90.68 90.65300 40 261.76 261.93 85.78 85.85500 40 363.97 369.55 73.06 75.5125 50 21.32 18.24 93.25 98.4750 50 43.97 44.97 94.47 97.4075 50 69.78 70.79 95.76 96.31100 50 97.79 95.69 97.22 95.21200 50 205.88 186.13 92.11 90.65300 50 265.44 261.93 87.41 85.85500 50 393.38 369.55 78.39 75.51
Table 8: Analysis of variance (ANOVA) for quadratic model for 𝑞.
Sources of variation Sum of squares Degree of freedom Mean square 𝐹 value Probability > 𝐹Model 1.167𝐸 + 005 5 23346.13 1636.72 <0.0001Residual 99.85 7 14.26Lack of fit 99.85 3 33.28Pure error 0.000 4 0.000Total 1.168𝐸 + 005 12𝑅
2
= 0.9991; CV = 3.78%.
Table 9: Analysis of variance (ANOVA) for quadratic model for removal %.
Sources of variation Sum of squares Degree of freedom Mean square 𝐹 value Probability > 𝐹Model 727.51 5 145.50 128.12 <0.0001Residual 7.95 7 1.14Lack of fit 7.95 3 2.65Pure error 0.000 4 0.000Total 735.46 12𝑅
2
= 0.9892; CV = 1.07%.

8 Journal of Chemistry
3035
4045
50
100200
300400
500
0
100
200
300
400q
(mg/
g)
A: concentration (mg/L)B: temperature ( ∘C)
(a)
3035
4045
50
100200
300400
500
60
70
80
90
100
Rem
oval
(%)
A: concentration (mg/L)B: temperature ( ∘C)
(b)
Figure 3: Three-dimensional response surface graphs: (a) combined effects of TB AGLF concentration and temperature on the adsorptioncapacity of sunflower pulp and (b) combined effects of TB AGLF concentration and temperature on percent TB AGLF removal by sunflowerpulp.
100 200 300 400 50030
35
40
45
50q (mg/g)
A: concentration (mg/L)
100
200 300
B: te
mpe
ratu
re(∘
C)
(a)
100 200 300 400 50030
35
40
45
50Removal (%)
A: concentration (mg/L)
70
8090
B: te
mpe
ratu
re(∘
C)
(b)
Figure 4: Two-dimensional contour plots: (a) combined effects of TB AGLF concentration and temperature on the adsorption capacity ofsunflower pulp and (b) combined effects of TB AGLF concentration and temperature on percent TB AGLF removal by sunflower pulp.
be used to find adsorption capacity and dye removal %in mixture containing unstudied concentrations of dye andtemperature, yet extrapolation of these models to actualwastewater treatment systems is inappropriate. Investigationsat an advance level are in progress for the analysis ofadsorption of TB AGLF on sunflower pulp under variousparameters, especially in presence of competing dye or metal
ions. Moreover, in industrial applications, operation undercontinuous flow conditions (especially fixed bed reactors) ismore preferred than a batch operation as continuous systemsare able to be treated with large amount of wastewater. Fora more adequate assessment of the sunflower pulp as anadsorbent, our study will continue to include continuoussystemoperations in the presence of competing ions.Then, by

Journal of Chemistry 9
Table 10: Kinetic model parameters for TB AGLF dye adsorption on sunflower pulp at different initial dye concentrations.
𝐶0
(mg L−1) 𝑞𝑒,exp (mg g−1)
The pseudo-first-order kinetic The pseudo-second-order kinetic𝑘1
(1/min) 𝑞𝑒,𝑐
(mg/g) 𝑅2
𝑘2
(1/min) 𝑞𝑒,𝑐
(mg/g) 𝑅2
25 21.324 0.0083 20.241 0.9630 0.0022 20.143 0.990150 43.971 0.0124 43.470 0.9415 0.0012 41.809 0.983475 69.779 0.0129 69.108 0.9561 0.0010 67.196 0.9898100 97.794 0.0131 96.923 0.9337 0.0013 95.664 0.9982200 205.882 0.0131 204.055 0.9797 0.0004 198.511 0.9968300 265.441 0.0117 261.574 0.9744 0.0002 253.336 0.9898500 393.382 0.0118 387.653 0.9833 0.0001 371.847 0.9869
taking into consideration the influences of these parameters,the most naturalistic models should be improved.
Conflict of Interests
The authors declare that there is no conflict of interestsregarding the publication of this paper.
References
[1] A. Ozcan, C. Omeroglu, Y. Erdogan, and A. S. Ozcan, “Modi-fication of bentonite with a cationic surfactant: an adsorptionstudy of textile dye reactive blue 19,” Journal of HazardousMaterials, vol. 140, no. 1-2, pp. 173–179, 2007.
[2] S. Wang and H. Li, “Dye adsorption on unburned carbon:kinetics and equilibrium,” Journal of Hazardous Materials, vol.126, no. 1–3, pp. 71–77, 2005.
[3] A. R. Gregory, J. Elliot, and P. Kluge, “Ames testing of directblack 38 parallels carcinogenicity testing,” Journal of AppliedToxicology, vol. 1, no. 6, pp. 308–313, 1981.
[4] F. A. Pavan, S. L. P. Dias, E. C. Lima, and E. V. Benvenutti,“Removal of Congo red from aqueous solution by anilinepropy-lsilica xerogel,” Dyes and Pigments, vol. 76, no. 1, pp. 64–69,2008.
[5] C. Park, M. Lee, B. Lee et al., “Biodegradation and biosorptionfor decolorization of synthetic dyes by Funalia trogii,” Biochem-ical Engineering Journal, vol. 36, no. 1, pp. 59–65, 2007.
[6] R. Gong, Y. Ding,M. Li, C. Yang,H. Liu, andY. Sun, “Utilizationof powdered peanut hull as biosorbent for removal of anionicdyes from aqueous solution,” Dyes and Pigments, vol. 64, no. 3,pp. 187–192, 2005.
[7] A. N. Ejhieh and M. Khorsandi, “Photodecolorization oferiochrome black T using NiS-P zeolite as a heterogeneouscatalyst,” Journal of Hazardous Materials, vol. 176, no. 1–3, pp.629–637, 2010.
[8] E. Riyanto, N. Norazizi, and R. O. Mohamed, “Textiles indus-tries wastewater treatment by electrochemical oxidation tech-nique using metal plate,” International Journal of Electrochemi-cal Science, vol. 8, pp. 11403–11415, 2013.
[9] G. M. Shaul, T. J. Holdsworth, C. R. Dempsey, and K. A. Dostal,“Fate of water soluble azo dyes in the activated sludge process,”Chemosphere, vol. 22, no. 1-2, pp. 107–119, 1991.
[10] V.M.Vucurovic, R. N. Razmovski, U.D.Miljic, andV. S. Puskas,“Removal of cationic and anionic azo dyes from aqueoussolutions by adsorption on maize stem tissue,” Journal of the
Taiwan Institute of Chemical Engineers, vol. 45, no. 4, pp. 1700–1708, 2014.
[11] A. E. Nemr, O. Abdelwahab, A. El-Sikaily, and A. Khaled,“Removal of direct blue-86 from aqueous solution by new acti-vated carbon developed fromorange peel,” Journal ofHazardousMaterials, vol. 161, no. 1, pp. 102–110, 2009.
[12] P. S. Kumar, S. Ramalingam, C. Senthamarai, M. Niranjanaa,P. Vijayalakshmi, and S. Sivanesan, “Adsorption of dye fromaqueous solution by cashew nut shell: studies on equilibriumisotherm, kinetics and thermodynamics of interactions,”Desali-nation, vol. 261, no. 1-2, pp. 52–60, 2010.
[13] B. H. Hameed, “Evaluation of papaya seeds as a novel non-conventional low-cost adsorbent for removal of methyleneblue,” Journal of Hazardous Materials, vol. 162, no. 2-3, pp. 939–944, 2009.
[14] C.-S. Zhu, L.-P. Wang, and W.-B. Chen, “Removal of Cu(II)from aqueous solution by agricultural by-product: peanut hull,”Journal of Hazardous Materials, vol. 168, no. 2-3, pp. 739–746,2009.
[15] A. Bhatnagar and M. Sillanpaa, “Utilization of agro-industrialandmunicipal waste materials as potential adsorbents for watertreatment—a review,”Chemical Engineering Journal, vol. 157, no.2-3, pp. 277–296, 2010.
[16] U. Farooq, J. A. Kozinski, M. A. Khan, and M. Athar, “Biosorp-tion of heavy metal ions using wheat based biosorbents—areview of the recent literature,” Bioresource Technology, vol. 101,no. 14, pp. 5043–5053, 2010.
[17] G. McKay, M. El-Geundi, and M. M. Nassar, “Equilibriumstudies for the adsorption of dyes on bagasse pith,” AdsorptionScience and Technology, vol. 15, no. 4, pp. 251–270, 1997.
[18] S. D. Khattri and M. K. Singh, “Colour removal from dyewastewater using sugar cane dust as an adsorbent,” AdsorptionScience and Technology, vol. 17, no. 4, pp. 269–282, 1999.
[19] R.H.Myers andD. C.Montgomery,Response SurfaceMethodol-ogy, JohnWiley & Sons, New York, NY, USA, 2nd edition, 2002.
[20] K. Ravikumar, K. Pakshirajan, T. Swaminathan, and K. Balu,“Optimization of batch process parameters using responsesurface methodology for dye removal by a novel adsorbent,”Chemical Engineering Journal, vol. 105, no. 3, pp. 131–138, 2005.
[21] S. V. I. Srinivasan and D. V. S. Murthy, “Statistical optimizationfor decolorization of textile dyes using Trametes versicolor,”Journal of Hazardous Materials, vol. 165, no. 1–3, pp. 909–914,2009.
[22] K. P. Singh, S. Gupta, A. K. Singh, and S. Sinha, “Experimentaldesign and response surface modeling for optimization of Rho-damine B removal from water by magnetic nanocomposite,”Chemical Engineering Journal, vol. 165, no. 1, pp. 151–160, 2010.

10 Journal of Chemistry
[23] F. Gonen and Z. Aksu, “Use of response surface methodology(RSM) in the evaluation of growth and copper(II) bioaccumu-lation properties ofCandida utilis inmolassesmedium,” Journalof Hazardous Materials, vol. 154, no. 1–3, pp. 731–738, 2008.
[24] I. K. Kapdan, F. Kargia, G. McMullan, and R. Marchant, “Effectof environmental conditions on biological decolorization of tex-tile dyestuff by C. versicolor,” Enzyme andMicrobial Technology,vol. 26, no. 5-6, pp. 381–387, 2000.
[25] N. Hatvani and I. Mecs, “Effects of certain heavy metals on thegrowth, dye decolorization, and enzyme activity of Lentinulaedodes,” Ecotoxicology and Environmental Safety, vol. 55, no. 2,pp. 199–203, 2003.
[26] S. Lagergren, Zur Theorie der Sogenannten Adsorption GelosterStoffe, Kungliga, 1898.
[27] Y. S. Ho and G. McKay, “Sorption of dye from aqueous solutionby peat,” Chemical Engineering Journal, vol. 70, no. 2, pp. 115–124, 1998.
[28] P. Senthil Kumar, S. Ramalingam, C. Senthamarai, M. Niran-janaa, P. Vijayalakshmi, and S. Sivanesan, “Adsorption of dyefrom aqueous solution by Cashew nut shell: studies on equilib-rium isotherm, kinetics and thermodynamics of interactions,”Desalination, vol. 261, no. 1-2, pp. 52–60, 2010.
[29] N. Thinakaran, P. Baskaralingam, M. Pulikesi, P. Panneersel-vam, and S. Sivanesan, “Removal of AcidViolet 17 from aqueoussolutions by adsorption onto activated carbon prepared fromsunflower seed hull,” Journal of Hazardous Materials, vol. 151,no. 2-3, pp. 316–322, 2008.
[30] M. Arami, N. Y. Limaee, N. M. Mahmoodi, and N. S. Tabrizi,“Equilibrium and kinetics studies for the adsorption of directand acid dyes from aqueous solution by soy meal hull,” Journalof Hazardous Materials, vol. 135, no. 1–3, pp. 171–179, 2006.
[31] F. Ghorbani, H. Younesi, S.M. Ghasempouri, A. A. Zinatizadeh,M. Amini, and A. Daneshi, “Application of response surfacemethodology for optimization of cadmium biosorption inan aqueous solution by Saccharomyces cerevisiae,” ChemicalEngineering Journal, vol. 145, no. 2, pp. 267–275, 2008.
[32] V. Vadivelan and K. V. Kumar, “Equilibrium, kinetics, mecha-nism, and process design for the sorption of methylene blueonto rice husk,” Journal of Colloid and Interface Science, vol. 286,no. 1, pp. 90–100, 2005.
[33] M. C. Ncibi, B. Mahjoub, and M. Seffen, “Kinetic and equi-librium studies of methylene blue biosorption by Posidoniaoceanica (L.) fibres,” Journal of HazardousMaterials, vol. 139, no.2, pp. 280–285, 2007.
[34] A. Usluoglu, E. Altintig, and G. Arabaci, “Characterizationof activated carbon prepared from agricultural waste and itsapplications for decolorization of textile dyes,” Current Opinionin Biotechnology, vol. 24, pp. S75–S76, 2013.
[35] S. Karimifard and M. R. A. Moghaddam, “Enhancing theadsorption performance of carbon nanotubes with a multistepfunctionalization method: optimization of Reactive Blue 19removal through response surface methodology,” Process Safetyand Environmental Protection, vol. 99, pp. 20–29, 2016.
[36] S. V. Srinivasan andD. V. S.Murthy, “Statistical optimization fordecolorization of textile dyes using Trametes versicolor,” Journalof Hazardous Materials, vol. 165, no. 1–3, pp. 909–914, 2009.

Submit your manuscripts athttp://www.hindawi.com
Hindawi Publishing Corporationhttp://www.hindawi.com Volume 2014
Inorganic ChemistryInternational Journal of
Hindawi Publishing Corporation http://www.hindawi.com Volume 2014
International Journal ofPhotoenergy
Hindawi Publishing Corporationhttp://www.hindawi.com Volume 2014
Carbohydrate Chemistry
International Journal of
Hindawi Publishing Corporationhttp://www.hindawi.com Volume 2014
Journal of
Chemistry
Hindawi Publishing Corporationhttp://www.hindawi.com Volume 2014
Advances in
Physical Chemistry
Hindawi Publishing Corporationhttp://www.hindawi.com
Analytical Methods in Chemistry
Journal of
Volume 2014
Bioinorganic Chemistry and ApplicationsHindawi Publishing Corporationhttp://www.hindawi.com Volume 2014
SpectroscopyInternational Journal of
Hindawi Publishing Corporationhttp://www.hindawi.com Volume 2014
The Scientific World JournalHindawi Publishing Corporation http://www.hindawi.com Volume 2014
Medicinal ChemistryInternational Journal of
Hindawi Publishing Corporationhttp://www.hindawi.com Volume 2014
Chromatography Research International
Hindawi Publishing Corporationhttp://www.hindawi.com Volume 2014
Applied ChemistryJournal of
Hindawi Publishing Corporationhttp://www.hindawi.com Volume 2014
Hindawi Publishing Corporationhttp://www.hindawi.com Volume 2014
Theoretical ChemistryJournal of
Hindawi Publishing Corporationhttp://www.hindawi.com Volume 2014
Journal of
Spectroscopy
Analytical ChemistryInternational Journal of
Hindawi Publishing Corporationhttp://www.hindawi.com Volume 2014
Journal of
Hindawi Publishing Corporationhttp://www.hindawi.com Volume 2014
Quantum Chemistry
Hindawi Publishing Corporationhttp://www.hindawi.com Volume 2014
Organic Chemistry International
ElectrochemistryInternational Journal of
Hindawi Publishing Corporation http://www.hindawi.com Volume 2014
Hindawi Publishing Corporationhttp://www.hindawi.com Volume 2014
CatalystsJournal of