Research Article Characterizing Radio and Networking...
11
Research Article Characterizing Radio and Networking Power Consumption in LTE Networks Álvaro M. Recio Pérez, Almudena Díaz Zayas, and Pedro Merino University of M´ alaga, Andaluc´ ıa Tech, 29071 M´ alaga, Spain Correspondence should be addressed to Almudena D´ ıaz Zayas; [email protected] Received 22 August 2015; Revised 18 June 2016; Accepted 20 June 2016 Academic Editor: Yuh-Shyan Chen Copyright © 2016 ´ Alvaro M. Recio P´ erez et al. is is an open access article distributed under the Creative Commons Attribution License, which permits unrestricted use, distribution, and reproduction in any medium, provided the original work is properly cited. Power consumption is a key factor in how final users rate the quality of service in mobile networks; however, its characterization is a challenging issue due to the many parameters involved and the complexity of their dependencies. Traditional battery drain testing in the field does not provide a suitable environment to reach accurate conclusions. In this paper we address this problem providing a controlled environment, more compact and accurate than those currently found in the literature, designed to measure the effects that different factors have on the global energy consumption. 1. Introduction In mobile networks, traditional conformance testing for User Equipment (UE) covers RF, electromagnetic compatibility, and protocol aspects of the UE. However operators and device manufacturers are also concerned about the perfor- mance of applications running on a device. Standardization and certification bodies such as the Global Certification Forum (GCF) have enforced testing initiatives for the certifi- cation of applications in order to validate the quality of service offered in combination by the device, the application, and the network. Battery life is also an important customer experience fac- tor for operators because network settings affect smartphone current consumption and users can detect the difference between mobile service providers [1]. erefore battery con- sumption testing is very important for smartphone vendors and mobile operators, as it provides an opportunity for dif- ferentiation. In previous works we have focused on evaluating the impact of mobility issues over the traffic and the quality perceived by final users of a video streaming service carrying out fields tests [2]. With the objective of carrying out exten- sive experiments where repeatability could be ensured we developed PerformNetworks, a highly realistic experimen- tation environment, based on emulation equipment, real antennas, and devices [3, 4]. As the testbed is highly con- figurable, to provide an optimized testing process we need to provide a reduced and representative number of tests. In this paper we focus on defining test cases whose scope is to evaluate power consumption of radio network subsystem and user application traffic. Power consumption profiling is a challenging task because there are many factors which have to be taken into account and that also introduce a certain level of uncertainty even in a controlled testing environment. In this paper we introduce a test environment and a test- ing methodology to extensively measure power consumption of data services in order to characterize its impact on the battery life of smartphones. e contribution of this paper is twofold: (i) As this methodology relies on the use of integrated digital channel emulation, it provides an advantage over other approaches in the literature, where external channel emulators are used to analyze the impact of the radio channel. Not including such additional equipment reduces the number of interconnections and cabling, thus improving the power accuracy and the spectral flatness of radio signals. In addition, the proposed scheme is suitable for all LTE frequency bands as no frequency selective components such as duplexers are required. Hindawi Publishing Corporation Mobile Information Systems Volume 2016, Article ID 2752961, 10 pages http://dx.doi.org/10.1155/2016/2752961
Transcript of Research Article Characterizing Radio and Networking...

Research ArticleCharacterizing Radio and Networking Power Consumption inLTE Networks
Álvaro M. Recio Pérez, Almudena Díaz Zayas, and Pedro Merino
University of Malaga, Andalucıa Tech, 29071 Malaga, Spain
Correspondence should be addressed to Almudena Dıaz Zayas; [email protected]
Received 22 August 2015; Revised 18 June 2016; Accepted 20 June 2016
Academic Editor: Yuh-Shyan Chen
Copyright © 2016 Alvaro M. Recio Perez et al. This is an open access article distributed under the Creative Commons AttributionLicense, which permits unrestricted use, distribution, and reproduction in any medium, provided the original work is properlycited.
Power consumption is a key factor in how final users rate the quality of service in mobile networks; however, its characterization isa challenging issue due to themany parameters involved and the complexity of their dependencies. Traditional battery drain testingin the field does not provide a suitable environment to reach accurate conclusions. In this paper we address this problem providinga controlled environment, more compact and accurate than those currently found in the literature, designed to measure the effectsthat different factors have on the global energy consumption.
1. Introduction
In mobile networks, traditional conformance testing for UserEquipment (UE) covers RF, electromagnetic compatibility,and protocol aspects of the UE. However operators anddevice manufacturers are also concerned about the perfor-mance of applications running on a device. Standardizationand certification bodies such as the Global CertificationForum (GCF) have enforced testing initiatives for the certifi-cation of applications in order to validate the quality of serviceoffered in combination by the device, the application, and thenetwork.
Battery life is also an important customer experience fac-tor for operators because network settings affect smartphonecurrent consumption and users can detect the differencebetween mobile service providers [1]. Therefore battery con-sumption testing is very important for smartphone vendorsand mobile operators, as it provides an opportunity for dif-ferentiation.
In previous works we have focused on evaluating theimpact of mobility issues over the traffic and the qualityperceived by final users of a video streaming service carryingout fields tests [2]. With the objective of carrying out exten-sive experiments where repeatability could be ensured wedeveloped PerformNetworks, a highly realistic experimen-tation environment, based on emulation equipment, real
antennas, and devices [3, 4]. As the testbed is highly con-figurable, to provide an optimized testing process we needto provide a reduced and representative number of tests. Inthis paper we focus on defining test cases whose scope isto evaluate power consumption of radio network subsystemand user application traffic. Power consumption profiling is achallenging task because there aremany factors which have tobe taken into account and that also introduce a certain levelof uncertainty even in a controlled testing environment.
In this paper we introduce a test environment and a test-ing methodology to extensively measure power consumptionof data services in order to characterize its impact on thebattery life of smartphones.
The contribution of this paper is twofold:
(i) As this methodology relies on the use of integrateddigital channel emulation, it provides an advantageover other approaches in the literature, where externalchannel emulators are used to analyze the impactof the radio channel. Not including such additionalequipment reduces the number of interconnectionsand cabling, thus improving the power accuracy andthe spectral flatness of radio signals. In addition, theproposed scheme is suitable for all LTE frequencybands as no frequency selective components such asduplexers are required.
Hindawi Publishing CorporationMobile Information SystemsVolume 2016, Article ID 2752961, 10 pageshttp://dx.doi.org/10.1155/2016/2752961

2 Mobile Information Systems
(ii) Using a power analyzer (as in [5]), also providesbenefit when compared with interposers [6]. It allowsautomated long-term testing without requiring bat-tery chargers that would interfere with the powerdrain measurements.
The paper is organized as follows. In Section 2 we providethe motivation for this paper and a review of literature onVoIP power consumption. Section 3 introduces the proposedmethodology and the testing environment. In Section 4 weprovide a detailed description of the parameters configuredto execute the power consumption tests. Section 5 presentsthe results of the experiments. Finally Section 6 remarks theadvantages of the testing procedure introduced in this paperto provide accurate results in a very realistic environment.
2. Motivation and Background to theEvaluation of VoIP Power Consumption
Voice calls are part of the basic services that users expect frommobile networks. Traditionally, before the arrival of Long-Term Evolution (LTE), voice calls were implemented overcircuit-switched networks, in which the resources needed forthe call are reserved before the call is made. In contrast, LTEis based on an all-IP, packet-switched network. This posesnew challenges, as voice calls must now contendwith variableconditions such as fluctuating bandwidth, packet losses andretransmissions, jitter, and delay. Some of these effects havean impact not only on the quality of service (QoS) but alsoon the energy spent by mobile terminals during a voice call.
Voice over IP (VoIP) is a popular method for the deliveryof voice calls over packet-switched networks. In fact, Voiceover LTE (VoLTE), a system based on VoIP, is the mostpromising alternative studied by 3GPP to provide voice callsover LTE networks [7, 8]. Without loosing generality, inthis paper, we focus on VoIP solutions based on third-partyapplications as a popular alternative until VoLTE is widelydeployed. Users demand as much battery lifetime from theirphones as possible. Maximizing the energy efficiency of theprocedures and applications running on mobile phones istherefore critical.
In recent years, we have observed remarkable changesin how people and cellular networks interact. In addition toa great variety of traffic profiles, such as social networking,multimedia streaming, and peer to peer, new paradigmshave emerged in mobile networking. Offloading frommobileapplications to cloud computing and heterogeneous mobilenetworks are just some examples of increasingly complex sce-narios. Multiple approaches in the literature have addressedthe analysis of energy consumption in different types ofmobile networking, but to the authors’ experience, manyresults are based on oversimplified unrealistic models or theapproach cannot be directly reused when moving to newscenarios of interest. For this reason we have conceived a testenvironment to reference energy analysis using commercialmobile devices operating under controlled yet realistic RFand networking conditions.
Many studies have focused on the impact ofDisconnectedReception (DRX) on energy consumption in VoIP [9, 10]
or including VoIP among other applications [11]; howeverthere are few studies about the effect of propagation andchannel conditions on energy consumption of VoIP, and theyhave relied on complex setups involving multiple elements[6]. In [12], an attempt is made to model latency versusenergy efficiency tradeoffs in mobile to cloud offloading. Inthat paper, there is an attempt to analyze the energy andlatency from a purely analytical perspective. The underlyingassumption is that it is valid to model energy consumptionand latency with mathematical expressions that can then beoptimized. However, our perception is that this approachseems to be far too simple to derive quantitative conclusions,as too many aspects are missing in the modeling process.For example, assuming that throughput will be constant isfundamentally wrong. One only has to look at the impactof latency variations caused by retransmissions in link levelmobile protocols and TCP/IP dynamics reacting to delayvariations and packet losses, in order to realize that thethroughput may experience noticeable fluctuations.
Other works in the literature, use pure statistical analysisbased on preexisting models to derive numerical conclu-sions, without verifying their suggested contributions in realconditions. In [13], simulations are conducted in MATLABusing analytical expressions derived from a Markov model.However the results are not validated against actual mobiledevices nor realistic traffic patterns from real applications.In the test solution we present in this paper, it will bepossible to confirm any theoretical results in a totally realisticenvironment, using commercial devices and applications.
In [14] the outcome of a set of interesting field tests ina set of measurement campaigns in a commercial networkis presented. Unfortunately, inherent to the nature of fieldtests, there is no control on the propagation conditions andnetwork load, thus making it difficult to obtain repeatableresults. Additionally, because the driving experiments arelimited in time, the statistical relevance of the results couldbe discussed. In the current contribution, we suggest tocomplement drive measurements with accurate laboratoryexperiments where both the network and RF propagationconditions are totally controlled by the experimenters.
In [5] the authors also use a power consumption analyzer;however they focus on the analysis of baseband withoutlinking it to the end-to-end data transmission and withouttaking into account fading nor AWGN.
In this paper, we present a characterization of the impacton energy consumption of VoIP in a controlled but realisticenvironment.This allows us to performmultiple experimentsunder specific radio channel conditions, including supportof the emulation of all 3GPP defined channel models andintegrated generation of AWGN (Additive White GaussianNoise). Our research has been carried out as an addition ontop of a testbed we have used successfully in previous studieson VoIP over LTE [15].
3. Testing Environment
In this work we have used PerformNetworks [4], a testbedwhich is part of FIRE (Future Internet Research andExperimentation (FIRE) (https://www.ict-fire.eu/)) initiative
Mobile Information Systems 3
XMPP/AMQP server
Experiment controller (EC)
OML collection server
SSH login
Testsexecution
OEDL experiment
PHY
MAC
RLC
PDCP
Channel emulator
AWGN
+
RF connection
T2010 - eNodeBemulator
N6705B - DC power analyzer
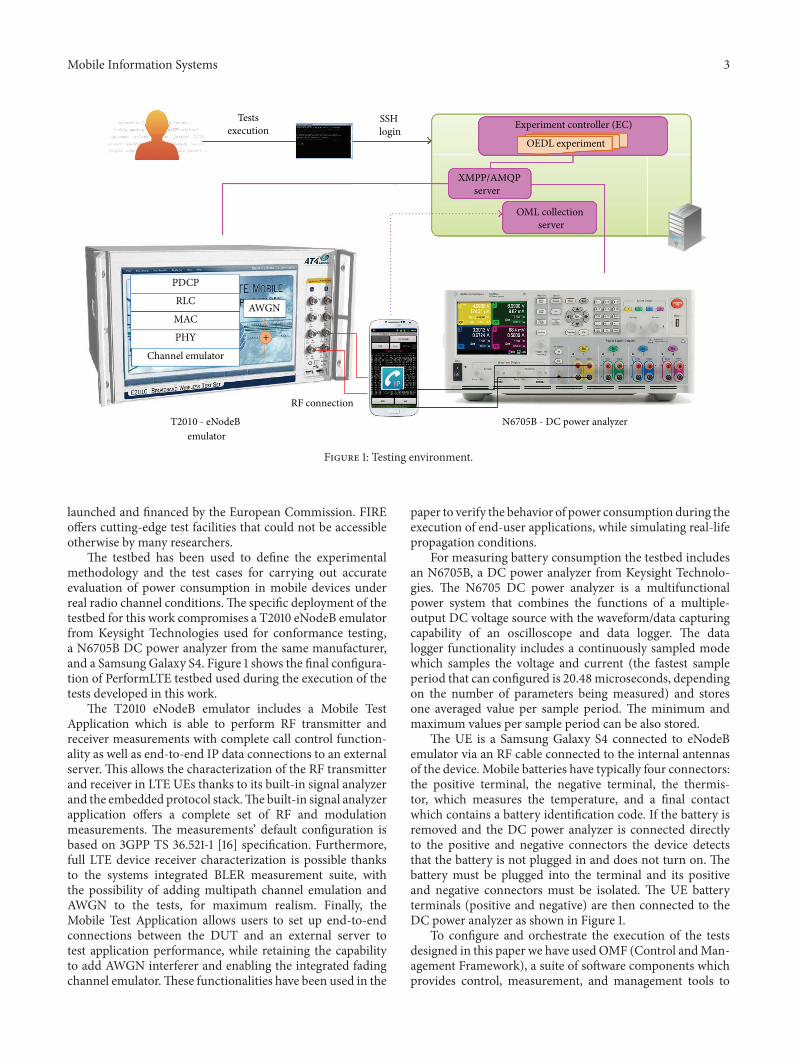
Figure 1: Testing environment.
launched and financed by the European Commission. FIREoffers cutting-edge test facilities that could not be accessibleotherwise by many researchers.
The testbed has been used to define the experimentalmethodology and the test cases for carrying out accurateevaluation of power consumption in mobile devices underreal radio channel conditions.The specific deployment of thetestbed for this work compromises a T2010 eNodeB emulatorfrom Keysight Technologies used for conformance testing,a N6705B DC power analyzer from the same manufacturer,and a Samsung Galaxy S4. Figure 1 shows the final configura-tion of PerformLTE testbed used during the execution of thetests developed in this work.
The T2010 eNodeB emulator includes a Mobile TestApplication which is able to perform RF transmitter andreceiver measurements with complete call control function-ality as well as end-to-end IP data connections to an externalserver. This allows the characterization of the RF transmitterand receiver in LTE UEs thanks to its built-in signal analyzerand the embedded protocol stack.The built-in signal analyzerapplication offers a complete set of RF and modulationmeasurements. The measurements’ default configuration isbased on 3GPP TS 36.521-1 [16] specification. Furthermore,full LTE device receiver characterization is possible thanksto the systems integrated BLER measurement suite, withthe possibility of adding multipath channel emulation andAWGN to the tests, for maximum realism. Finally, theMobile Test Application allows users to set up end-to-endconnections between the DUT and an external server totest application performance, while retaining the capabilityto add AWGN interferer and enabling the integrated fadingchannel emulator.These functionalities have been used in the
paper to verify the behavior of power consumption during theexecution of end-user applications, while simulating real-lifepropagation conditions.
For measuring battery consumption the testbed includesan N6705B, a DC power analyzer from Keysight Technolo-gies. The N6705 DC power analyzer is a multifunctionalpower system that combines the functions of a multiple-output DC voltage source with the waveform/data capturingcapability of an oscilloscope and data logger. The datalogger functionality includes a continuously sampled modewhich samples the voltage and current (the fastest sampleperiod that can configured is 20.48microseconds, dependingon the number of parameters being measured) and storesone averaged value per sample period. The minimum andmaximum values per sample period can be also stored.
The UE is a Samsung Galaxy S4 connected to eNodeBemulator via an RF cable connected to the internal antennasof the device. Mobile batteries have typically four connectors:the positive terminal, the negative terminal, the thermis-tor, which measures the temperature, and a final contactwhich contains a battery identification code. If the battery isremoved and the DC power analyzer is connected directlyto the positive and negative connectors the device detectsthat the battery is not plugged in and does not turn on. Thebattery must be plugged into the terminal and its positiveand negative connectors must be isolated. The UE batteryterminals (positive and negative) are then connected to theDC power analyzer as shown in Figure 1.
To configure and orchestrate the execution of the testsdesigned in this paper we have usedOMF (Control andMan-agement Framework), a suite of software components whichprovides control, measurement, and management tools to
4 Mobile Information Systems
support extensive and repeatable experimentation. We haveextended OMF to support the control of the eNode Bemulator and the DC power analyzer [17]. Our monitoringtool for Android devices, TestelDroid [18] has also beeninstrumented to support the automatic collections of mea-surements through the OMF and OML (OMF MeasurementLibrary) experimentation framework [19].
4. Design of Test Cases for CharacterizingPower Consumption of Radio andNetworking Process
Smartphones have different states. During the suspendedstate the device is in a low powered sleep mode, the appli-cation processor is idle, and only the communication pro-cessor performs the minimum activity required to remainconnected to the network. In the idle state the device is fullyawake, but no application is running. In the active use statethe device is performing a task. This is the state where testcases are defined because the measurement tools used tocapture IP traffic and network information are running in thebackground. The screen is set to the minimum brightness.
For measuring power consumption there are two mainapproaches.The first one is called the component level powermeasurement and is used in the design phase because itrequires access to low level components of the device. Thesecond is the device level power measurement. In this casethe power is measured at the battery connection, obtaining aglobal value of the power consumed.This is the method usedin this paper. As we wish to measure the global consumptionof the device, we have to meticulously configure the testscenario. In order to avoid unpredictable behaviors, cloudsynchronization has been deactivated. Also during the test,the calls are launched programmatically so as to avoid userinteraction and thus further isolate the consumption due toradio and networking processes.
Networking power consumption comprises the RF powerconsumption and that required by the CPU and RAMcomponents for baseband and higher level protocols pro-cessing. CPU and RAM consumption is higher for high datathroughput. In the setup we use a narrow band code whichresults in a IP throughput of 80 kbps.
4.1. LTE Radio Channels Models. In order to evaluate howpropagation issues impact on power consumption we havedefined a set of test scenarios using the LTE channel modelsdefined by the 3GPP.
Signals transmitted on mobile radio channels suffer fromdifferent propagation related effects such as “fading.”
The multipath propagation conditions consist of severalparts:
(i) a delay profile in the form of a tapped delay line, char-acterized by a number of taps at fixed positions on asampling grid; the profile can be further characterizedby the root mean square (r.m.s.) delay spread and themaximum delay spanned by the taps;
Table 1: Summary of delay profiles for LTE channel models (3GPPTS 36.803).
Channel model Number ofpaths
Delayspread(r.m.s)
Maximumdelay
Extended pedestrian A (EPA) 7 45 ns 410 𝜇sExtended vehicular A (EVA) 9 357 ns 2.51 𝜇sExtended typical urban (ETU) 9 991 ns 5𝜇s
(ii) a Doppler spectrum, characterized by a spectrumshape and a maximum Doppler frequency that isdetermined from the mobile speed;
(iii) a set of correlation matrices defining the correlationbetween the UE and BS antennas in case of multi-antenna systems.
Channel models are defined by combining a delay profilewith a Doppler spectrum, with the addition of correlationproperties in case of a multiantenna scenario. These twoconcepts will be explained in the following subsection.
4.1.1. Delay Profiles. The delay profiles are selected to be rep-resentative of low, medium, and high delay spread environ-ments. The profiles for low and medium delay spread arebased on the ITU Pedestrian A and Vehicular A channelmodels, respectively, originally defined for the ITU-R evalua-tion of IMT-2000 [20]. The high delay spread model is basedon the Typical Urbanmodel used forGSM [21] and in some ofthe evaluation work for LTE.The resulting model parametersare summarized in Tables 1 and 2. The models are defined ona (10 ns) sampling grid. They can be adapted to any desiredsampling grid used in a simulation or test setup using theprocedure defined to align sampling grids shown in AnnexB of TR 25.943 [22].
4.1.2. Doppler Frequency. A set of three Doppler frequenciesspanning the requirement range as high, middle, and lowDoppler frequencies are selected in TR 36.803 [23]:
(i) Common high speed scenarios specify mobile speedsmoderately high. It is stated in TR 25.913 [24] thathigh performance should be maintained up tomobilespeeds of 120 km/h. The corresponding maximumDoppler frequency for fc = 2690 km/h is fD = 299Hz,where fc is frequency of the carrier centre and fD isDoppler frequency. Based on this, the high Dopplerfrequency is selected as 300Hz.
(ii) TR 25.913 also states that the E-UTRAN shall supportmobility across the cellular network and should beoptimized for low mobile speed from 0 to 15 km/h.For testing purposes, very low mobile speeds arenot desirable, since testing times may be too long.The lowest Doppler frequency in UTRA propagationconditions is 5.4Hz, corresponding to between 2.3and 7 km/h in the existing frequency bands. Based onthis, the low Doppler frequency is set to 5Hz.

Mobile Information Systems 5
Table 2: Tapped delay line models (3GPP TS 36.803).
Path numberExtended pedestrian A
(EPA)Extended vehicular A
(EVA)Extended typical urban
(ETU)Delay (ns) Power (dB) Delay (ns) Power (dB) Delay (ns) Power (dB)
1 0 0 0 0 0 −12 30 −1 30 −1.5 50 −13 70 −2 150 −1.4 120 −14 90 −3 310 −3.6 200 05 110 −8 370 −0.6 230 06 190 −17.2 710 −9.1 500 07 410 −20.8 1090 −7 1600 −38 1730 −12 2300 −59 2510 −16.9 5000 −7
Table 3: Uplink Doppler frequencies and corresponding UE speeds(operating band 3: 1710–1785MHz).
Maximum Doppler frequency Corresponding UE speed5Hz 3.1 km/h70Hz 43 km/h300Hz 185 km/h
Table 4: Downlink Doppler frequencies and corresponding UEspeeds (operating band 3: 1805–1880MHz).
Maximum Doppler frequency Corresponding UE speed5Hz 2.9 km/h70Hz 41 km/h300Hz 176 km/h
(iii) An intermediate Doppler frequency can be set at thelogarithmic average of the 5 and 900Hz, being 67Hz.Based on this, the medium Doppler frequency is setto 70Hz.
(iv) The LTE requirements for mobility in TR 25.913state that mobility across the cellular network shallbe maintained at speeds of between 120 km/h and350 km/h (or even up to 500 km/h depending on thefrequency band).This special case is called high speedtrain scenario and it is not contemplated here.
The UE speed that the Doppler frequencies will corre-spond to will vary between the operating bands. Tables 3and 4 show the corresponding UE speeds for the carrierfrequencies at the centre of each uplink and downlink forband 3. Informative values for the rest of the bands can beconsulted in [23].
In accordance with these parameters several multipathmodels for cellular systems have been specified for low,medium, and high delay spread environments as shown inTable 5.
4.2. Test Configuration. During the tests we configure in theDCpower analyzer the logging of current, voltage, power, and
their minimum and maximum values. For this configurationthe minimum sampled period is 0.12288ms. This samplingperiodicity provides a time resolution of better than 1ms,which is the minimum transmission interval defined in LTE.
IP traffic is collected at the mobile device by TestelDroid[18], a software tool developed by the University of Malaga.
4.2.1. Base Station Emulator Configuration. T2010 is a genericplatform used not only in conformant RF and signalingtesting but also for design verification. In addition to LTEsignaling and RF connection features, it also integrates chan-nel emulation and digital generation of impairments such asAWGN, which is a critical feature to achieve high accuracywhen setting SNR conditions. Standard multipath fadingprofiles defined by 3GPP are supported so as to emulatereference propagation conditions. MIMO is a key featurein LTE, as it is one of the foundations of the technology’shigh rates and spectral efficiency. T2010 provides up to 4 ×2 integrated MIMO features, thus increasing the range of testpossibilities with interesting network configurations.
As LTE provides a huge flexibility in terms of configura-tion options, we give the settings we have used to allow a like-for-like comparison.
For this experimentwe have used a 15MHz channel band-width. Although LTE standards allow from 1.4MHz to20MHz, 15MHz is a common value in some Spanish oper-ators.
To keep a tighter control on the quality of the DL signalandminimize the impact of thermal noise, theDLpower levelhas beenmaintained well above UE sensitivity.The signal-to-noise ratio (SNR) can thus be better controlled by digitallygenerating additive noise after applying a fading profile in thechannel emulator.
In the 3GPP TR 36.803 v1.1.0 the SNR of reference chan-nels is defined with a low SNR and high SNR. For the highSNR channel it is defined as 18 dB.
The Scheduling Request (SR) configuration index hasbeen set to 7, resulting in a SR periodicity of 10ms. Thisparameter is closely related to the delay in UL transmissions,as it defines the time slots where the UE may apply for newuplink grants.

6 Mobile Information Systems
Table 5: LTE radio channel models defined by the 3GPP.
Delay spread Doppler frequency Model CommentLow Low EPA 5Hz Low delay spread model representing small cell and indoor casesMedium Low EVA 5HzMedium Medium EVA 70Hz
High Medium ETU 70Hz Represents high delay spread environments, with a delay span ofthe same order as the cyclic prefix
High High ETU 300Hz
As we are targeting real time services, at the RLC (RadioLink Control) level we have used Unacknowledged Mode(UM) bearers. UM mode provides reordering up to a con-figurable timer, which has been set to 50ms. Upon expirationof the reordering timer, all the successfully receivedmessagesare delivered to the upper levels even if some previous mes-sages are still missing. In the UM bearers no retransmissionsare done at the RLC level, but note that MACHARQ retrans-missions are still in place. HARQ retransmissions providefast error correction without compromising real time latency,unlike what would happen with AM RLC retransmissions.
The maximum number of HARQ transmissions has beenlimited to 6 both for UL and DL.Thus the maximum delay ofa successful MAC transmission (involving 5 retransmissionsevery 8ms) will be 40ms.
To allow for easier benchmarking and repeatability, weuse a fix modulation and coding scheme. If we used DLscheduling based on the UE reported channel quality, apoorly performing UE, detecting a worse channel quality,could grant more resources than one reporting a betterquality under the same conditions. However, to monitorthe DL quality measured by the UE while minimizing theimpact on the power consumption with frequent PUCCH(Physical Uplink Control Channel) transmissions, periodicCQI (Channel Quality Indication) reporting inMode 1-0 hasbeen enabled with the maximum (160ms) reporting interval.Periodic RI (Rank Indication) reporting configuration index484 has been used, which allows for an RI transmission every8 CQI transmissions.
The UE is also instructed to send RRC level signalingreports of the received power (RSRP) and quality (RSRQ)every 120ms, with filter coefficient fc4.
With respect to the control region, we have used theminimum number of symbols for PDCCH by setting CFI(Control Format Indicator) equal to 1. This allows a bettercoding rate for a given Imcs, when compared with larger CFIvalues.The aggregation level for the user-specific search spacehas been set to 2. This stands for a relatively low overhead (asthe valid values range from 1 to 8) that would allow for a highnumber of users.
In the PHICH (Physical HARQ Indicator Channel) con-figuration, normal duration and one-sixth resources havebeen configured.
The uplink power of the UE has been controlled via openloop power control. The UE adjusts its transmission powerbased on a signaled target power and on the estimation of thepropagation losses. The base station emulator specifies both
the nominal power signaled in the broadcast informationand the actual power received by the UE, thus effectivelycontrolling the actual path losses. The UE has allowed arelatively high tolerance when it comes to estimating pathlosses, but the test equipment provides accurate transmissionpower measurements to confirm the resulting power.
5. Validation: Characterizing the Consumptionof VoIP Service over LTE
In this section the results of the test cases are evaluated inorder to determine whether or not they provide the accuracyrequired to characterize the power consumption of radio andnetworking process.
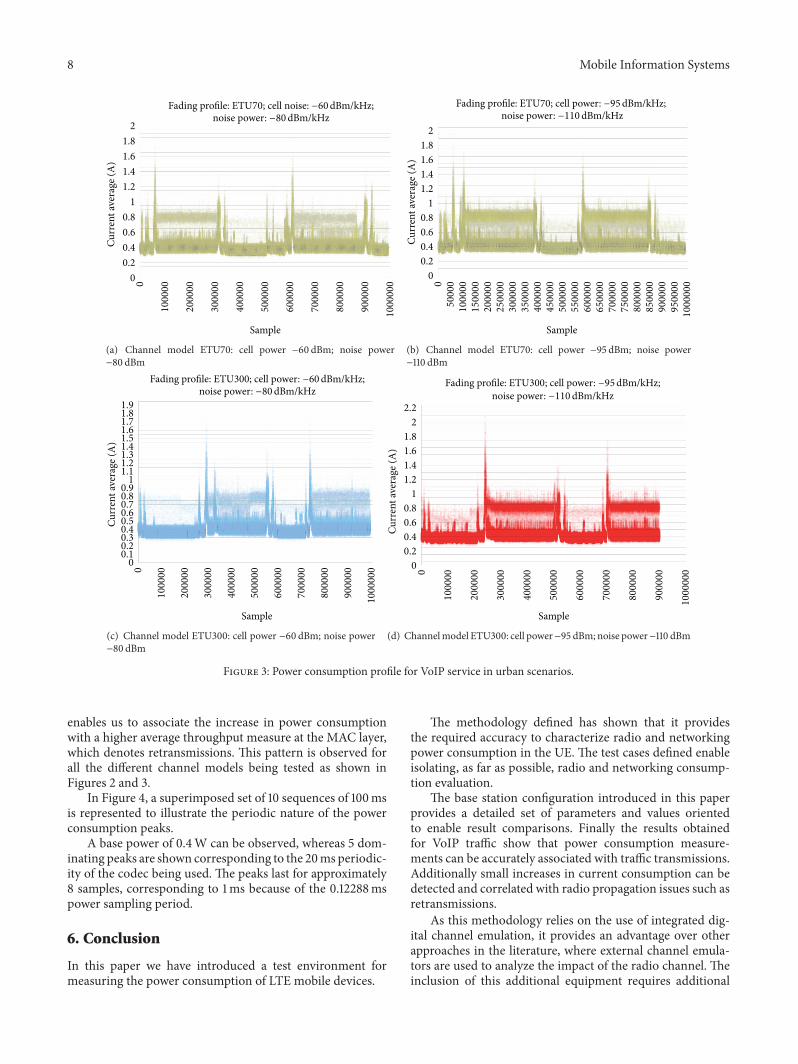
Figures 2 and 3 show the average current consumed dur-ing the sampling interval configured in the power analyzer,0.12288ms. The test cases have been executed under differ-ent conditions of SNR (signal-to-noise ratio) and differentLTE channel models, covering pedestrian (EPA5), vehicular(EVA5, EVA70), and urban (ETU70, ETU300) scenarios.
During the experiments shown in Figures 2 and 3, largeseries of 30 seconds VoIP calls have been carried out every 40seconds. Voltage provided by the DC power analyzer is set to3.8 V. Before the call starts the consumption is stable around0.3 A. The centre of Figure 2(a) shows one. At the beginningand end of each call, large peaks of up to 1.5 A are observed.During the calls, it can be observed that two different currentlevels coexist. Statistically most of the current values areconcentrated around a base current of 0.45A, while a morespare set of values is associated with a higher level of current,around 0.75, which represents an increase in the current of0.3 A. Further analyzing the power dynamic in more detailwill allow us to understand the dependency of the power onthe transmission subframes. For that purpose we correlatethe power consumption information with the actual trafficreceived and transmitted by the UE, as provided by theTestelDroid tool.
The correlation demonstrates that current peaks corre-spond to packet transmission. The configuration of this testcase depicted in Figure 2(a) represents a pedestrian scenariowith a good level of received signal and fair SNR. Comparingthis scenario with a scenario where received signal is low(−95 dBm) we obtain a higher density of the points at thesecond level of current measured during a VoIP call andan increase in the average power consumption of 0.1 A (seeFigure 2(b)).The correlation of the energy consumption withthe measurements provided by the base station emulator

Mobile Information Systems 7
00.20.40.60.8
11.21.41.61.8
20
2000
00
3000
00
1000
00
4000
00
5000
00
6000
00
7000
00
8000
00
9000
00
1000
000
Curr
ent a
vera
ge (A
)
Sample
Fading profile: EPA5; cell power: −60 dBm/kHz;noise power: −80 dBm/kHz
(a) Channel model EPA5: cell power −60 dBm; noise power−80 dBm
Curr
ent a
vera
ge (A
)
0
2000
00
3000
00
1000
00
4000
00
5000
00
6000
00
7000
00
8000
00
9000
00
1000
000
Sample
0
0.2
0.4
0.6
0.8
1
1.2
1.4
1.6
1.8
2
2.2
Fading profile: EPA5; cell power: −95dBm/kHz;noise power: −110dBm/kHz
(b) Channel model EPA5: cell power −95 dBm; noise power −110 dBm
0
2000
00
3000
00
1000
00
4000
00
5000
00
6000
00
7000
00
8000
00
9000
00
1000
000
Sample
00.20.40.60.8
11.21.41.61.8
2
Curr
ent a
vera
ge (A
)
Fading profile: EVA5; cell power: −60 dBm/kHz80dBm/kHznoise: −
(c) Channel model EVA5: cell power −60 dBm; noise power−80 dBm
0
2000
00
3000
00
1000
00
4000
00
5000
00
6000
00
7000
00
8000
00
9000
00
1000
000
Sample
00.20.40.60.8
11.21.41.61.8
2
Curr
ent a
vera
ge (A
)Fading profile: EVA5; cell power: −95dBm/kHz;
noise power: −110dBm/kHz
(d) Channel model EVA5: cell power−95 dBm; noise power −110 dBm
0
2000
00
3000
00
1000
00
4000
00
5000
00
6000
00
7000
00
8000
00
9000
00
1000
000
Sample
Curr
ent a
vera
ge (A
)
00.10.20.30.40.50.60.70.80.91
1.11.21.31.41.51.61.71.8
Fading profile: EVA70; cell power: −60 dBm/kHz;noise power: −80dBm/kHz
(e) Channel model EVA70: cell power −60 dBm; noise power−80 dBm
0
2000
00
3000
00
1000
00
4000
00
5000
00
6000
00
7000
00
8000
00
9000
00
1000
000
Sample
Curr
ent a
vera
ge (A
)
00.10.20.30.40.50.60.70.80.91
1.11.21.31.41.51.61.71.81.92
Fading profile: EVA70; cell power: −95dBm/15kHz;noise power: −110dBm/15kHz
(f) Channel model EVA70: cell power −95 dBm; noise power−110 dBm
Figure 2: Power consumption profile for VoIP service in pedestrian and vehicular scenarios.
8 Mobile Information Systems
0
2000
00
3000
00
1000
00
4000
00
5000
00
6000
00
7000
00
8000
00
9000
00
1000
000
Sample
Curr
ent a
vera
ge (A
)
0
0.2
0.4
0.6
0.8
1
1.2
1.4
1.6
1.8
2
Fading profile: ETU70; cell noise: −60dBm/kHz;noise power: −80dBm/kHz
(a) Channel model ETU70: cell power −60 dBm; noise power−80 dBm
Sample
Curr
ent a
vera
ge (A
)
0
0.2
0.4
0.6
0.8
1
1.2
1.4
1.6
1.8
2
Fading profile: ETU70; cell power: −95dBm/kHz;noise power: −110dBm/kHz
0
50000
100000
150000
200000
250000
300000
350000
400000
450000
500000
550000
600000
650000
700000
750000
800000
850000
900000
950000
1000000
(b) Channel model ETU70: cell power −95 dBm; noise power−110 dBm
0
2000
00
3000
00
1000
00
4000
00
5000
00
6000
00
7000
00
8000
00
9000
00
1000
000
Sample
Curr
ent a
vera
ge (A
)
noise power: −80dBm/kHz
00.10.20.30.40.50.60.70.80.9
11.11.21.31.41.51.61.71.81.9
Fading profile: ETU300; cell power: −60dBm/kHz;
(c) Channel model ETU300: cell power −60 dBm; noise power−80 dBm
0
2000
00
3000
00
1000
00
4000
00
5000
00
6000
00
7000
00
8000
00
9000
00
1000
000
Sample
Curr
ent a
vera
ge (A
)
0
0.2
0.4
0.6
0.8
1
1.2
1.4
1.6
1.8
2
2.2
Fading profile: ETU300; cell power: −95dBm/kHz;noise power: −110dBm/kHz
(d) Channelmodel ETU300: cell power−95 dBm; noise power−110 dBm
Figure 3: Power consumption profile for VoIP service in urban scenarios.
enables us to associate the increase in power consumptionwith a higher average throughput measure at the MAC layer,which denotes retransmissions. This pattern is observed forall the different channel models being tested as shown inFigures 2 and 3.
In Figure 4, a superimposed set of 10 sequences of 100msis represented to illustrate the periodic nature of the powerconsumption peaks.
A base power of 0.4W can be observed, whereas 5 dom-inating peaks are shown corresponding to the 20ms periodic-ity of the codec being used. The peaks last for approximately8 samples, corresponding to 1ms because of the 0.12288mspower sampling period.
6. Conclusion
In this paper we have introduced a test environment formeasuring the power consumption of LTE mobile devices.
The methodology defined has shown that it providesthe required accuracy to characterize radio and networkingpower consumption in the UE. The test cases defined enableisolating, as far as possible, radio and networking consump-tion evaluation.
The base station configuration introduced in this paperprovides a detailed set of parameters and values orientedto enable result comparisons. Finally the results obtainedfor VoIP traffic show that power consumption measure-ments can be accurately associated with traffic transmissions.Additionally small increases in current consumption can bedetected and correlated with radio propagation issues such asretransmissions.
As this methodology relies on the use of integrated dig-ital channel emulation, it provides an advantage over otherapproaches in the literature, where external channel emula-tors are used to analyze the impact of the radio channel. Theinclusion of this additional equipment requires additional

Mobile Information Systems 9
0
0.2
0.4
0.6
0.8
1
1.2
02.
9491
25.
8982
48.
8473
611
.796
4814
.745
617
.694
7220
.643
8423
.592
9626
.542
0829
.491
232
.440
3235
.389
4438
.338
5641
.287
6844
.236
847
.185
9250
.135
0453
.084
1656
.033
2858
.982
461
.931
5264
.880
6467
.829
7670
.778
8873
.728
76.6
7712
79.6
2624
82.5
7536
85.5
2448
88.4
736
91.4
2272
94.3
7184
97.3
2096
0–0.20.2–0.40.4–0.6
0.6–0.80.8–11–1.2
900700
500300 (m
s)
100
Figure 4: Evolution of the power consumption during stationary voice period.
interconnections and cabling, reducing the power accuracyand the spectral flatness of radio signals. Moreover, the pro-posed scheme is suitable for all LTE frequency bands asno frequency selective components such as duplexers arerequired.
Competing Interests
The authors declare that they have no competing interests.
Acknowledgments
This work has been funded by the Government of Andalusia(Grant P11-TIC-7659), the Spanish Ministry of Economy andCompetitiveness (Grant TIN-2012-35669), and FEDER fromthe European Commission. This work was also carried outwith the support of the Fed4FIRE-project (Federation forFIRE), an Integrated project receiving funding from theEuro-pean Unions Seventh Framework Programme for research,technological development, and demonstration under GrantAgreement no. 318389 and with the support of Universityof Malaga, Campus de Excelencia Internacional AndalucıaTech.
References
[1] Nokia Siemens Networks, “From voice over IP to voice overLTE,” White Paper, Nokia Siemens Networks, 2013.
[2] A.Dıaz, P.Merino, andF. J. Rivas, “QoS analysis of video stream-ing service in live cellular networks,” Computer Communica-tions, vol. 33, no. 3, pp. 322–335, 2010.
[3] A. Dıaz, P. Merino, and F. J. Rivas, “Test environment for QoStesting of VoIP over LTE,” in Proceedings of the IEEE NetworkOperations and Management Symposium (NOMS ’12), pp. 780–794, IEEE, Maui, Hawaii, USA, April 2012.
[4] A. Dıaz-Zayas, C. A. Garcıa-Perez, A. M. Recio-Perez, andP. Merino-Gomez, “PerformLTE: a testbed for LTE testing inthe future internet,” in Proceedings of the 13th InternationalConference on Wire and Wireless Internet Communications, pp.46–59, Malaga, Spain, May 2015.
[5] A. R. Jensen, M. Lauridsen, P. Mogensen, T. B. Sørensen, and P.Jensen, “LTE UE power consumption model: for system levelenergy and performance optimization,” in Proceedings of theIEEE Vehicular Technology Conference (VTC Fall ’12), pp. 1–5,Quebec City, Canada, September 2012.
[6] B. Dusza, C. Ide, L. Cheng, and C. Wietfeld, “CoPoMo: a con-text-aware power consumptionmodel for LTE user equipment,”Transactions on Emerging Telecommunications Technologies, vol.24, no. 6, pp. 615–632, 2013.
[7] GSMA, “Permanent Reference Document (PRD) IP Multime-dia Subsystem (IMS) profile for voice and SMS,” GSMA IR92,2012.
[8] K. Andersson, S. A. M. Mostafa, and R. Ui-Islam, “Mobile VoIPuser experience in LTE,” in Proceedings of the 36th Annual IEEEConference on Local Computer Networks (LCN ’11), pp. 785–788,Bonn, Germany, October 2011.
[9] K. Aho, T. Henttonen, J. Puttonen, L. Dalsgaard, and T. Rista-niemi, “User equipment energy efficiency versus LTE networkperformance,” International Journal on Advances in Telecommu-nications, vol. 3, no. 3-4, pp. 1–12, 2010.
[10] M. Polignano, D. Vinella, D. Laselva, J. Wigard, and T. B.Sørensens, “Power savings andQoS impact for VoIP applicationwith DRX/DTX feature in LTE,” in Proceedings of the IEEE73rd Vehicular Technology Conference (VTC Spring ’11), pp. 1–5,Budapest, Hungary, May 2011.

10 Mobile Information Systems
[11] M. Gupta, A. Koc, and R. Vannithamby, “Analyzing mobileapplications and power consumption on smartphone over LTEnetwork,” in Proceedings of the International Conference onEnergy Aware Computing (ICEAC ’11), pp. 1–4, IEEE, Istanbul,Turkey, November 2011.
[12] O. Munoz, A. Pascual Iserte, J. Vidal, and M. Molina, “Energy-latency trade-off for multiuser wireless computation offload-ing,” in Proceedings of the IEEE Wireless Communications andNetworking Conference Workshops (WCNCW ’14), pp. 29–33,Istanbul, Turkey, April 2014.
[13] C.-C. Tseng, H.-C. Wang, F.-C. Kuo, K.-C. Ting, H.-H. Chen,and G.-Y. Chen, “Delay and power consumption in LTE/LTE-A DRX mechanism with mixed short and long cycles,” IEEETransactions on Vehicular Technology, vol. 65, no. 3, pp. 1721–1734, 2015.
[14] A. Elnashar and M. A. El-Saidny, “Extending the battery life ofsmartphones and tablets: a practical approach to optimizing theLTE network,” IEEE Vehicular Technology Magazine, vol. 9, no.2, pp. 38–49, 2014.
[15] F. J. Rivas, A. Dıaz, and P. Merino, “Obtaining more realisticcross-layer qos measurements: a VoIP over LTE use case,”Journal of Computer Networks and Communications, vol. 2013,Article ID 405858, 10 pages, 2013.
[16] Evolved Universal Terrestrial Radio Access (E-UTRA), “UserEquipment (UE) conformance specification; radio transmissionand reception; part 1: conformance testing,” 3GPP TS 36.521-1,2016.
[17] C. A. Garcia-Perez, A. M. Recio-Perez, A. Rios-Gomez, A.Diaz-Zayas, and P. Merino, “Extensive and repeatable exper-imentation in mobile communications with programmableinstruments,” in Proceedings of the 13th International Conferenceon Remote Engineering and Virtual Instrumentation (REV ’16),pp. 30–36, IEEE, Madrid, Spain, Feburary 2016.
[18] A. Alvarez, A. Dıaz, P. Merino, and F. J. Rivas, “Field mea-surements of mobile services with Android smartphones,” inProceedings of the IEEE Consumer Communications and Net-working Conference (CCNC ’12), pp. 105–109, Las Vegas, Nev,USA, January 2012.
[19] A. Dıaz-Zayas, A. M. Recio-Perez, C. A. Garcıa-Perez, andP. Merino, “Remote control and instrumentation of Androiddevices,” in Proceedings of the 13th International Conference onRemote Engineering and Virtual Instrumentation (REV ’16), pp.190–195, Madrid, Spain, Feburary 2016.
[20] ITU-R, “Guidelines for evaluation of radio transmission tech-nologies for IMT-2000,” Recommendation ITU-RM.1225, ITU-R, Geneva, Switzerland, 1997.
[21] 3rd Generation Partnership Project and Technical SpecificationGroup GSM/EDGE Radio Access Network, “Radio transmis-sion and reception,” 3GPP TS 45.005, 2016.
[22] 3rd Generation Partnership Project and Technical SpecificationGroup Radio Access Network, “Deployment aspects,” 3GPP TR25.943, 2016.
[23] 3rd Generation Partnership Project, “User equipment (UE)radio transmission and reception,” 3GPP TR 36.803, 2008.
[24] 3rd Generation Partnership Project, “Requirements for evolvedUTRA and UTRAN,” 3GPP TR 25.913, 2009.

Submit your manuscripts athttp://www.hindawi.com
Computer Games Technology
International Journal of
Hindawi Publishing Corporationhttp://www.hindawi.com Volume 2014
Hindawi Publishing Corporationhttp://www.hindawi.com Volume 2014
Distributed Sensor Networks
International Journal of
Advances in
FuzzySystems
Hindawi Publishing Corporationhttp://www.hindawi.com
Volume 2014
International Journal of
ReconfigurableComputing
Hindawi Publishing Corporation http://www.hindawi.com Volume 2014
Hindawi Publishing Corporationhttp://www.hindawi.com Volume 2014
Applied Computational Intelligence and Soft Computing
Advances in
Artificial Intelligence
Hindawi Publishing Corporationhttp://www.hindawi.com Volume 2014
Advances inSoftware EngineeringHindawi Publishing Corporationhttp://www.hindawi.com Volume 2014
Hindawi Publishing Corporationhttp://www.hindawi.com Volume 2014
Electrical and Computer Engineering
Journal of
Journal of
Computer Networks and Communications
Hindawi Publishing Corporationhttp://www.hindawi.com Volume 2014
Hindawi Publishing Corporation
http://www.hindawi.com Volume 2014
Advances in
Multimedia
International Journal of
Biomedical Imaging
Hindawi Publishing Corporationhttp://www.hindawi.com Volume 2014
ArtificialNeural Systems
Advances in
Hindawi Publishing Corporationhttp://www.hindawi.com Volume 2014
RoboticsJournal of
Hindawi Publishing Corporationhttp://www.hindawi.com Volume 2014
Hindawi Publishing Corporationhttp://www.hindawi.com Volume 2014
Computational Intelligence and Neuroscience
Industrial EngineeringJournal of
Hindawi Publishing Corporationhttp://www.hindawi.com Volume 2014
Modelling & Simulation in EngineeringHindawi Publishing Corporation http://www.hindawi.com Volume 2014
The Scientific World JournalHindawi Publishing Corporation http://www.hindawi.com Volume 2014
Hindawi Publishing Corporationhttp://www.hindawi.com Volume 2014
Human-ComputerInteraction
Advances in
Computer EngineeringAdvances in
Hindawi Publishing Corporationhttp://www.hindawi.com Volume 2014