RESEARCH ARTICLE Advances in using Internet searches to ...skou/papers/Dengue-PLOSCB.pdf · Dengue...
25
RESEARCH ARTICLE Advances in using Internet searches to track dengue Shihao Yang 1 , Samuel C. Kou 1 *, Fred Lu 2 , John S. Brownstein 2,3 , Nicholas Brooke 4 , Mauricio Santillana 2,3 * 1 Department of Statistics, Harvard University, Cambridge, MA, USA, 2 Computational Health Informatics Program, Boston Children’s Hospital, Boston, MA, USA, 3 Harvard Medical School, Boston, MA, USA, 4 The Synergist, Brussels, Belgium * [email protected] (MS); [email protected] (SCK) Abstract Dengue is a mosquito-borne disease that threatens over half of the world’s population. Despite being endemic to more than 100 countries, government-led efforts and tools for timely identification and tracking of new infections are still lacking in many affected areas. Multiple methodologies that leverage the use of Internet-based data sources have been pro- posed as a way to complement dengue surveillance efforts. Among these, dengue-related Google search trends have been shown to correlate with dengue activity. We extend a methodological framework, initially proposed and validated for flu surveillance, to produce near real-time estimates of dengue cases in five countries/states: Mexico, Brazil, Thailand, Singapore and Taiwan. Our result shows that our modeling framework can be used to improve the tracking of dengue activity in multiple locations around the world. Author summary As communicable diseases spread in our societies, people frequently turn to the Internet to search for medical information. In recent years, multiple research teams have investi- gated how to utilize Internet users’ search activity to track infectious diseases around our planet. In this article, we show that a methodology, originally developed to track flu in the US, can be extended to improve dengue surveillance in multiple countries/states where dengue has been observed in the last several years. Our result suggests that our methodol- ogy performs best in dengue-endemic areas with high number of yearly cases and with sustained seasonal incidence. Introduction Dengue fever poses a growing health and economic problem throughout the tropical and sub- tropical world. Dengue is today one of the fastest-growing and most important mosquito- borne viral diseases in the world, with an estimated 390 million infections each year and threatening an estimated 3.9 billion people in 128 countries [1]. Infection often causes high PLOS Computational Biology | https://doi.org/10.1371/journal.pcbi.1005607 July 20, 2017 1 / 14 a1111111111 a1111111111 a1111111111 a1111111111 a1111111111 OPEN ACCESS Citation: Yang S, Kou SC, Lu F, Brownstein JS, Brooke N, Santillana M (2017) Advances in using Internet searches to track dengue. PLoS Comput Biol 13(7): e1005607. https://doi.org/10.1371/ journal.pcbi.1005607 Editor: Marcel Salathe ´, Ecole Polytechnique Federale de Lausanne, SWITZERLAND Received: December 19, 2016 Accepted: June 2, 2017 Published: July 20, 2017 Copyright: © 2017 Yang et al. This is an open access article distributed under the terms of the Creative Commons Attribution License, which permits unrestricted use, distribution, and reproduction in any medium, provided the original author and source are credited. Data Availability Statement: For replicability purposes, all the data used in this study is available at the Harvard Dataverse: doi:10.7910/DVN/ VMMC2A. All the data used in this study were obtained through publicly available URLs. As described in the manuscript, the epidemiological information can be obtained in the following URLs: http://www.epidemiologia.salud.gob.mx/anuario/ html/anuarios.html http://portalsaude.saude.gov. br/index.php/79situacao-epidemiologica-dados- dengue http://www.boe.moph.go.th/boedb/ surdata/disease.php?ds=66 https://www.moh.gov. sg/content/moh_web/home/statistics/
Transcript of RESEARCH ARTICLE Advances in using Internet searches to ...skou/papers/Dengue-PLOSCB.pdf · Dengue...
RESEARCH ARTICLE
Advances in using Internet searches to track
dengue
Shihao Yang1, Samuel C. Kou1*, Fred Lu2, John S. Brownstein2,3, Nicholas Brooke4,
Mauricio Santillana2,3*
1 Department of Statistics, Harvard University, Cambridge, MA, USA, 2 Computational Health Informatics
Program, Boston Children’s Hospital, Boston, MA, USA, 3 Harvard Medical School, Boston, MA, USA, 4 The
Synergist, Brussels, Belgium
* [email protected] (MS); [email protected] (SCK)
Abstract
Dengue is a mosquito-borne disease that threatens over half of the world’s population.
Despite being endemic to more than 100 countries, government-led efforts and tools for
timely identification and tracking of new infections are still lacking in many affected areas.
Multiple methodologies that leverage the use of Internet-based data sources have been pro-
posed as a way to complement dengue surveillance efforts. Among these, dengue-related
Google search trends have been shown to correlate with dengue activity. We extend a
methodological framework, initially proposed and validated for flu surveillance, to produce
near real-time estimates of dengue cases in five countries/states: Mexico, Brazil, Thailand,
Singapore and Taiwan. Our result shows that our modeling framework can be used to
improve the tracking of dengue activity in multiple locations around the world.
Author summary
As communicable diseases spread in our societies, people frequently turn to the Internet
to search for medical information. In recent years, multiple research teams have investi-
gated how to utilize Internet users’ search activity to track infectious diseases around our
planet. In this article, we show that a methodology, originally developed to track flu in the
US, can be extended to improve dengue surveillance in multiple countries/states where
dengue has been observed in the last several years. Our result suggests that our methodol-
ogy performs best in dengue-endemic areas with high number of yearly cases and with
sustained seasonal incidence.
Introduction
Dengue fever poses a growing health and economic problem throughout the tropical and sub-
tropical world. Dengue is today one of the fastest-growing and most important mosquito-
borne viral diseases in the world, with an estimated 390 million infections each year and
threatening an estimated 3.9 billion people in 128 countries [1]. Infection often causes high
PLOS Computational Biology | https://doi.org/10.1371/journal.pcbi.1005607 July 20, 2017 1 / 14
a1111111111
a1111111111
a1111111111
a1111111111
a1111111111
OPENACCESS
Citation: Yang S, Kou SC, Lu F, Brownstein JS,
Brooke N, Santillana M (2017) Advances in using
Internet searches to track dengue. PLoS Comput
Biol 13(7): e1005607. https://doi.org/10.1371/
journal.pcbi.1005607
Editor: Marcel Salathe, Ecole Polytechnique
Federale de Lausanne, SWITZERLAND
Received: December 19, 2016
Accepted: June 2, 2017
Published: July 20, 2017
Copyright: © 2017 Yang et al. This is an open
access article distributed under the terms of the
Creative Commons Attribution License, which
permits unrestricted use, distribution, and
reproduction in any medium, provided the original
author and source are credited.
Data Availability Statement: For replicability
purposes, all the data used in this study is available
at the Harvard Dataverse: doi:10.7910/DVN/
VMMC2A. All the data used in this study were
obtained through publicly available URLs. As
described in the manuscript, the epidemiological
information can be obtained in the following URLs:
http://www.epidemiologia.salud.gob.mx/anuario/
html/anuarios.html http://portalsaude.saude.gov.
br/index.php/79situacao-epidemiologica-dados-
dengue http://www.boe.moph.go.th/boedb/
surdata/disease.php?ds=66 https://www.moh.gov.
sg/content/moh_web/home/statistics/
fever and joint pain, and severe cases can lead to hemorrhage, shock and death. Dengue epi-
demics strain health services and lead to massive economic losses.
Dengue transmission is subject to complex environmental factors influencing the Aedesaegypti and albopictus mosquitoes which spread the disease. A mosquito is able to transmit
dengue within a few weeks of contracting the virus, and a person bitten by such a mosquito
will usually fall ill within a week, with symptoms lasting for up to 10 days afterward [2, 3].
There is a 5-day window when another mosquito can pick up the virus from an infected per-
son [3]. The time scale of these transmission dynamics lends itself to tracking patterns of infec-
tion at a weekly or monthly level. Seasonal conditions such as temperature and precipitation
can affect mosquito feeding rate, development, and lifespan, contributing to annual seasonality
in observed dengue cases [4–8]. Other factors affecting the local or regional level include
human population density and mobility, mosquito control efforts, and the distribution of the
four dengue virus serotypes, adding complications to efforts to model transmission dynamics
[9, 10].
Dengue mortality and morbidity both need to be addressed to reduce this heavy burden.
The World Health Organization has called for better early case detection among other tactics
to reduce dengue mortality, and for the reduction of dengue morbidity through coordinating
epidemiological and entomological surveillance. Timely identification of outbreaks can inform
and help preventative measures to lower infection rates, including mosquito population con-
trol and providing supplies such as screens and nets for mosquito bite prevention. Thorough,
data-informed implementations of these vector control methods have been found effective in
reducing case counts in many locations, but require sustainable investment to prevent resur-
gence [3, 11], highlighting the need for accurate and timely dengue surveillance tools.
However, such a comprehensive, effective and reliable disease surveillance system for den-
gue is not yet available. Governments traditionally rely on hospital-based reporting, a method
that is often lagged and limited with frequent post-hoc revisions, due to communication ineffi-
ciencies across local and national agencies and the time needed to aggregate information from
the clinical to the state level [12, 13]. This lack of timely information limits the identification
and optimization of effective interventions. Measurement difficulties are compounded by the
fact that a majority of dengue cases are asymptomatic [14].
In this context, building an effective disease surveillance tool is essential to being able to
identify and assess the severity of dengue outbreaks and to enable better assessment of the
effectiveness of ongoing interventions. Such tools should provide accurate and consistent mea-
sures of regional or national infection levels, be updated in near real-time, and be immune to
bureaucratic or resource-related delays. To improve accuracy, these tools should use and link
together multiple sources of information, using both traditional and non-traditional sources.
Over the years, a broad range of traditional epidemiological methods have been proposed
by research teams to fill this time gap of information by supplementing official case counts
with now-cast estimation using dengue incidence data from previous seasons. Autoregressive
models, such as Seasonal Autoregressive Integrated Moving Average (SARIMA) model, that
take into account recent and seasonal patterns, have been shown to produce useful disease esti-
mates, some including additional variables such as concurrent weather information [15–19].
Other studies have further examined climate-driven models, finding associations of seasonal
and long-term weather patterns such as El Niño with dengue levels in various countries [5, 20–
22]. In addition, various mechanistic models on the dynamics of dengue transmission have
also been explored, with some recent promise [23]. A comprehensive survey of these methods
are given in Andraud et al. [24]
In parallel and complementary to the aforementioned methodologies, the global spread of
the Internet has opened up the opportunity to investigate whether users’ activity patterns on
Advances in using Internet searches to track dengue
PLOS Computational Biology | https://doi.org/10.1371/journal.pcbi.1005607 July 20, 2017 2 / 14
infectiousDiseasesStatistics/weekly_
infectiousdiseasesbulletin.html http://nidss.cdc.
gov.tw/ch/SingleDisease.aspx?dc=1&dt=
4&disease=94061&position=1 As described in the
manuscript, the input variables (Google search
frequencies for each country) can be obtained from
the website: www.google.com/trends.
Funding: SY, FL, and MS were supported by a
grant from the the Synergist, award 01-2016.
SCK’s research is supported in part by NSF grant
DMS-1510446. The funders had no role in study
design, data collection and analysis, decision to
publish, or preparation of the manuscript.
Competing interests: The authors have declared
that no competing interests exist.
Internet search-engines and social media platforms may lead to reasonable estimates of dengue
infection levels [25–27]. In theory, Internet search tracking is consistent, efficient, and reflects
real-time population trends, giving it strong potential to supplement current epidemiological
methods [13, 28]. Studies have previously demonstrated the feasibility of using Internet search
data to track dengue case counts [25, 27]. Google Dengue Trends (GDT), launched in 2011,
was one of the first tools to quantitatively track dengue activity in multiple regions throughout
the world by leveraging the aggregate Google search patterns of millions of users [25]. Since its
start, the methodology behind GDT has been updated to address flaws found in its sister effort,
Google Flu Trends [29–37], before finally being discontinued in August 2015. An assessment
of GDT in Mexico showed mixed prediction accuracy compared to official case counts, with
strong correlation in some states [38].
Despite progress in the use of both dengue time-series information (time series
approaches [15]) and real-time Internet searches for dengue tracking [25], an approach for
accurate tracking of dengue by combining the respective strengths of each data source has
not been documented to the best of our knowledge. We extend a methodology recently
introduced in the flu surveillance literature to combine dengue-related Google searches with
dengue case count time-series to track dengue activity. Specifically, we evaluate the perfor-
mance of the ARGO model (AutoRegressive model with GOogle search queries as exogenous
variables), as introduced in [35], in tracking dengue in five countries/states around the
globe: Mexico, Brazil, Thailand, Singapore, and Taiwan. These countries were chosen to
explore the applicability of our approach in a diverse set of ecological situations where den-
gue has been identified as an important local threat. Our contribution shows that the lessons
learned to track influenza in data-rich environments, like the United States, can be used to
develop methodologies to track an often-neglected tropical disease, dengue, in data-poor
environments.
Materials and methods
Data
We used two kinds of data sets for our study: (a) historical dengue incidence from govern-
ment-led health agencies and (b) Google search fractions of dengue-related queries, aggregated
at the national-level.
Dengue time-series data. Mexico. Monthly-aggregated dengue case counts data from Jan-
uary 2001 to August 2015 were obtained from Mexico’s Department of Epidemiology. http://
www.epidemiologia.salud.gob.mx/anuario/html/anuarios.html
Brazil. Monthly dengue case counts data from January 2001 to December 2012 were
obtained from the old website of Brazil’s Ministry of Health (http://dtr2004.saude.gov.br/
sinanweb/tabnet/dh?sinannet/dengue/bases/denguebrnet.def) on July 14, 2015. This site is no
longer accessible, since the Ministry has moved to a new website (http://portalsaude.saude.
gov.br/index.php/situacao-epidemiologica-dados-dengue), which now publishes weekly den-
gue data from 2014-present. This site contains annual dengue cases since 1990 but no longer
has the historical monthly data. We confirmed that the annual totals match the sum of case
counts over each year in our dataset.
Thailand. Monthly dengue case count data from January 2003 to August 2015 were
obtained from the Bureau of Epidemiology, Thailand (http://www.boe.moph.go.th/boedb/
surdata/disease.php?ds=66). New data are published in an annual document available on the
site.
Singapore. Weekly dengue case counts from January 10, 2004 to August 29, 2015
were obtained from the Singapore Ministry of Health and were aggregated into months.
Advances in using Internet searches to track dengue
PLOS Computational Biology | https://doi.org/10.1371/journal.pcbi.1005607 July 20, 2017 3 / 14
https://www.moh.gov.sg/content/moh_web/home/statistics/infectiousDiseasesStatistics/
weekly_infectiousdiseasesbulletin.html.
Taiwan. Weekly dengue case counts from January 3, 2009 to March 19, 2016 were obtained
from the Taiwan Ministry of Health and Welfare and were aggregated into months. http://
nidss.cdc.gov.tw/ch/SingleDisease.aspx?dc=1&dt=4&disease=061&position=1.
Online search volume data. Google search fractions for dengue-related queries were
obtained from Google Trends (www.google.com/trends).
Online search term selection. While we initially intended to use Google Correlate (www.
google.com/correlate), which is designed to identify search terms correlating highly with a
given time series over a given country, we found this tool unreliable as many of the search
terms returned were not related at all to dengue. Consequently, we used the Google Trends
(www.google.com/trends) tool to identify the top ten queries most highly correlated with the
term ‘dengue’ in each country, ignoring terms unrelated to dengue (one feature of Google
Trends is that in addition to the trends of a specific term, it gives the top query terms that are
most highly correlated with the specific term). The monthly aggregated search fractions of
these terms were then downloaded within the time period of interest for each country. The
query terms used for each country in this study were later verified by native speakers of each
language and are presented in Table A in S1 Text.
Methods
We used the multivariate linear regression modeling framework ARGO (AutoRegressive
model with GOogle search queries as exogenous variables) [35], previously used to track flu
incidence using flu-related Google searches, to combine information from historical dengue
case counts and dengue-related Google search frequencies with the goal of estimating dengue
activity one month ahead of the publication of official local health reports. ARGO uses a train-
ing set that consists of a two-year moving time window (immediately prior to the month of
estimation) and an L1 regularization approach, to identify the best performing parsimonious
model [39]. This moving window approach allows the model to constantly improve its predic-
tive ability by capturing the changing relationship between Internet search behavior and den-
gue activity.
ARGO model formulation. Our ARGO model assumes that more dengue-related
searches will be observed in times when more people are affected (either experiencing symp-
toms or hearing about someone who may have been infected) by the virus. This is formalized
mathematically via a hidden Markov model in ARGO as explained in [35].
Let yt = log(ct + 1) be the log-transformed dengue case counts ct at time t, and Xk,t the log-
transformed Google search frequency of query term k at time t. Then
yt ¼ my þX
j2J
ajyt� j þX
k2K
bkXk;t þ �t; �t�iid N ð0; s2Þ; ð1Þ
where J is the set of auto-regressive lags, K is the set of Google query terms, and Xt can be
thought of as the exogenous variables to time series {yt} as introduced in [35].
ARGO model parameter estimation. We take J = {1, . . ., 12} [ {24}, i.e., J consists of the
most recent 12 months and the month exactly two years ago. Such choice of J captures the
influence of short and mid-term yearly fluctuations, as well as long-term seasonality previously
shown to have strong predictive power in dengue [15]. We take K = 10, corresponding to the
top ten dengue-related search terms as described in the data subsection.
Advances in using Internet searches to track dengue
PLOS Computational Biology | https://doi.org/10.1371/journal.pcbi.1005607 July 20, 2017 4 / 14
We impose L1 regularity for parameter estimation. In a given month, the goal is to find
parameters μy, α = {αj: j 2 J}, and β = (β1, . . ., β10) that minimize
X
t
yt � my �X
j2J
ajyt� j �X10
k¼1
bkXk;t
!2
þX
j2J
lajjajj þ
X10
k¼1
lbkjbkj ð2Þ
where λαj, λβk are regularization hyper-parameters.
For a given time window, ARGO automatically selects the most relevant variables to gener-
ate an out-of-sample dengue activity estimate. This is achieved by zeroing out regression coef-
ficients of terms that contribute little (or have redundant information) to the estimation. This
approach leads to interpretable results by allowing us to clearly identify which variables had a
role in detection for each month.
All statistical analyses were performed with R, version 3.2.4.
Benchmark models
For comparison with ARGO, we included estimation results from five alternative methods.
These are:
1. A seasonal autoregressive model without Google information, denoted as SAR, using a time
series of the most recent 3 lags, as well as 2 seasonal lags. Specifically, the monthly time
series model is comprised of time lags 1,2,3,12,24: yt = α1yt−1 + α2yt−2 + α3yt−3 + α12yt−12 +
α24yt−24 + �t, �t � N ð0; s2Þ. This model serves as a baseline for estimates made only using
dengue time-series information.
2. Google Dengue Trends [25], which ended in August 2015. Data are obtained from https://
www.google.org/flutrends/about/. Because Google Dengue Trends reported dengue inten-
sity in a scale from 0 to 1, we dynamically rescaled it using a sliding training window to rec-
reate case estimates.
3. A penalized multivariate linear regression model with Google Trends information only
[34], denoted as GT. This is essentially ARGO without autoregressive lags, and incorporates
a common L1 penalty on the Google Trends data;
4. A seasonal autoregressive model with Google Dengue Trends as exogenous variable,
denoted as SAR+GDT. yt = α1yt−1 + α2yt−2 + α3yt−3 + α12yt−12 + α24yt−24 + β log GDTt + �t,
�t � N ð0; s2Þ.
5. A naive method, which simply uses the case count at the previous month as the guess for
the value of the current month.
All benchmark models (except the naive method) were trained by linear regression with slid-
ing two year windows for fair comparison.
Accuracy metrics
We used five accuracy metrics to compare model performance: root mean squared error
(RMSE), mean absolute error (MAE), root mean squared percentage error (RMSPE), mean
absolute percentage error (MAPE), and Pearson correlation.
Mathematically, these accuracy metrics of estimator c for target dengue case count care defined as, RMSE ¼ ½1=n
Pnt¼1ðct � ctÞ
2�1=2
, MAE ¼ 1=nPn
t¼1jct � ctj,
RMSPE ¼ f1=nPn
t¼1½ðct � ctÞ=ct�
2g
1=2, MAPE ¼ 1=n
Pnt¼1jct � ctj=ct .
Advances in using Internet searches to track dengue
PLOS Computational Biology | https://doi.org/10.1371/journal.pcbi.1005607 July 20, 2017 5 / 14
Retrospective estimations
Retrospective out-of-sample estimates of dengue case counts were generated for each country
using ARGO and the five benchmark models, assuming we only had access to information
available at the time of estimation. The time windows in which we assessed the performance of
our dengue estimates for each country were chosen based on the availability of official and
GDT benchmark data.
These time windows are: Brazil from Mar 2006–Dec 2012, Mexico from Mar 2006–Aug
2015, Thailand from Oct 2010–Aug 2015, Singapore from Feb 2008–Aug 2015, and Taiwan
from Jan 2013–Mar 2016.
Results
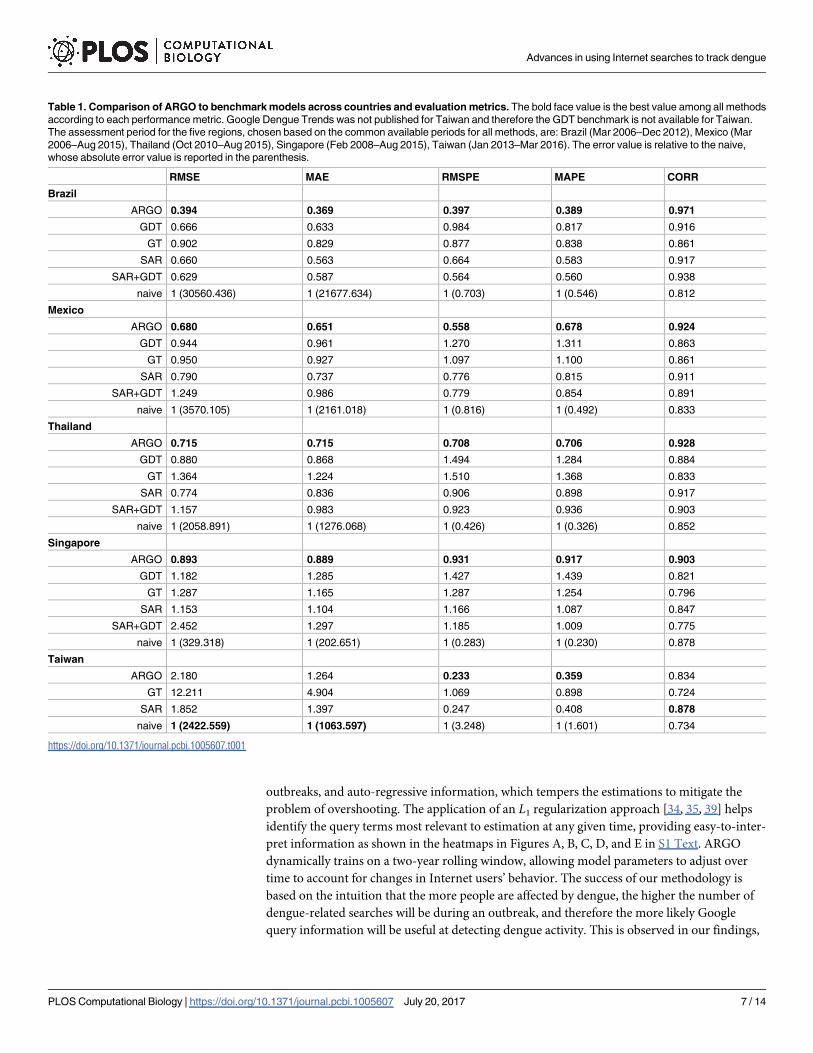
In four of the five countries/states, Brazil, Mexico, Thailand and Singapore, ARGO outper-
formed all benchmark models across essentially all accuracy metrics (RMSE, MAE, RMSPE,
MAPE, correlation). See Table 1. In particular, by incorporating information from the Internet
searches and the dengue time-series, ARGO achieved better results than using either informa-
tion alone. This accuracy improvement is reflected in the decreased errors during both peaks
of dengue activity and off-season/periods with low levels of infection. See Fig 1. Unlike the
seasonal autoregression with GDT model (SAR+GDT), ARGO avoided the significant over-
shooting problem that has been previously noted in Google Trends data ([35], [40]). This is
especially notable between 2006–2008 and 2012–2014 in Mexico, and 2006–2010 in Brazil.
Taiwan shows notably different results. Of all the available models, the naive and seasonal
autoregressive models have the best performance, but neither is clearly effective. The naive
model has the lowest RMSE and MAE, but the worst RMSPE, MAPE and correlation, while
the seasonal model shows the best RMSPE, MAPE and correlation. In comparison, the other
models have a much greater RMSE to MAE ratio, indicating worse performance during high
prevalence relative to the naive model. ARGO does not outperform the benchmarks in this
case.
This result seems to reflect the distinct case count pattern in Taiwan compared to the other
countries. Taiwan experienced little to no dengue prevalence for years until two epidemic
spikes occurred in 2014 and 2015. In contrast, the other countries experience seasonal fluctua-
tions of dengue over their entire estimation windows. This lack of predictability may be the
reason that both seasonal and Google Trends-based models have greater error than the naive
model, significantly over-estimating the 2015 peak for example. Yet overall, these methods
show greater correlation than the naive method, perhaps because they are more responsive.
Because ARGO over-estimates to a greater extent than the autoregressive methodology, this
again reflects previous observations on the tendency of Google data to overshoot.
ARGO dynamically adjusts weights of dengue time-series and Google Trends data to best
fit the most recent dengue behavior (See Fig. A, B, C, D, and E in S1 Text).
Discussion
Our findings confirm that combining historical dengue incidence information with dengue-
related Google search data, in a self-adjusting manner, leads to better near real-time dengue
activity estimates than those obtained with previous methodologies that exploit the informa-
tion separately. This also confirms that the hidden Markov model framework used by ARGO
is appropriate in this context [35].
ARGO’s uniform out-performance of other benchmark methods for Mexico, Brazil, Thai-
land, and Singapore demonstrates its robustness and broad applicability. ARGO achieves
this by balancing the influence of Internet search data, which quickly change in the face of
Advances in using Internet searches to track dengue
PLOS Computational Biology | https://doi.org/10.1371/journal.pcbi.1005607 July 20, 2017 6 / 14
outbreaks, and auto-regressive information, which tempers the estimations to mitigate the
problem of overshooting. The application of an L1 regularization approach [34, 35, 39] helps
identify the query terms most relevant to estimation at any given time, providing easy-to-inter-
pret information as shown in the heatmaps in Figures A, B, C, D, and E in S1 Text. ARGO
dynamically trains on a two-year rolling window, allowing model parameters to adjust over
time to account for changes in Internet users’ behavior. The success of our methodology is
based on the intuition that the more people are affected by dengue, the higher the number of
dengue-related searches will be during an outbreak, and therefore the more likely Google
query information will be useful at detecting dengue activity. This is observed in our findings,
Table 1. Comparison of ARGO to benchmark models across countries and evaluation metrics. The bold face value is the best value among all methods
according to each performance metric. Google Dengue Trends was not published for Taiwan and therefore the GDT benchmark is not available for Taiwan.
The assessment period for the five regions, chosen based on the common available periods for all methods, are: Brazil (Mar 2006–Dec 2012), Mexico (Mar
2006–Aug 2015), Thailand (Oct 2010–Aug 2015), Singapore (Feb 2008–Aug 2015), Taiwan (Jan 2013–Mar 2016). The error value is relative to the naive,
whose absolute error value is reported in the parenthesis.
RMSE MAE RMSPE MAPE CORR
Brazil
ARGO 0.394 0.369 0.397 0.389 0.971
GDT 0.666 0.633 0.984 0.817 0.916
GT 0.902 0.829 0.877 0.838 0.861
SAR 0.660 0.563 0.664 0.583 0.917
SAR+GDT 0.629 0.587 0.564 0.560 0.938
naive 1 (30560.436) 1 (21677.634) 1 (0.703) 1 (0.546) 0.812
Mexico
ARGO 0.680 0.651 0.558 0.678 0.924
GDT 0.944 0.961 1.270 1.311 0.863
GT 0.950 0.927 1.097 1.100 0.861
SAR 0.790 0.737 0.776 0.815 0.911
SAR+GDT 1.249 0.986 0.779 0.854 0.891
naive 1 (3570.105) 1 (2161.018) 1 (0.816) 1 (0.492) 0.833
Thailand
ARGO 0.715 0.715 0.708 0.706 0.928
GDT 0.880 0.868 1.494 1.284 0.884
GT 1.364 1.224 1.510 1.368 0.833
SAR 0.774 0.836 0.906 0.898 0.917
SAR+GDT 1.157 0.983 0.923 0.936 0.903
naive 1 (2058.891) 1 (1276.068) 1 (0.426) 1 (0.326) 0.852
Singapore
ARGO 0.893 0.889 0.931 0.917 0.903
GDT 1.182 1.285 1.427 1.439 0.821
GT 1.287 1.165 1.287 1.254 0.796
SAR 1.153 1.104 1.166 1.087 0.847
SAR+GDT 2.452 1.297 1.185 1.009 0.775
naive 1 (329.318) 1 (202.651) 1 (0.283) 1 (0.230) 0.878
Taiwan
ARGO 2.180 1.264 0.233 0.359 0.834
GT 12.211 4.904 1.069 0.898 0.724
SAR 1.852 1.397 0.247 0.408 0.878
naive 1 (2422.559) 1 (1063.597) 1 (3.248) 1 (1.601) 0.734
https://doi.org/10.1371/journal.pcbi.1005607.t001
Advances in using Internet searches to track dengue
PLOS Computational Biology | https://doi.org/10.1371/journal.pcbi.1005607 July 20, 2017 7 / 14
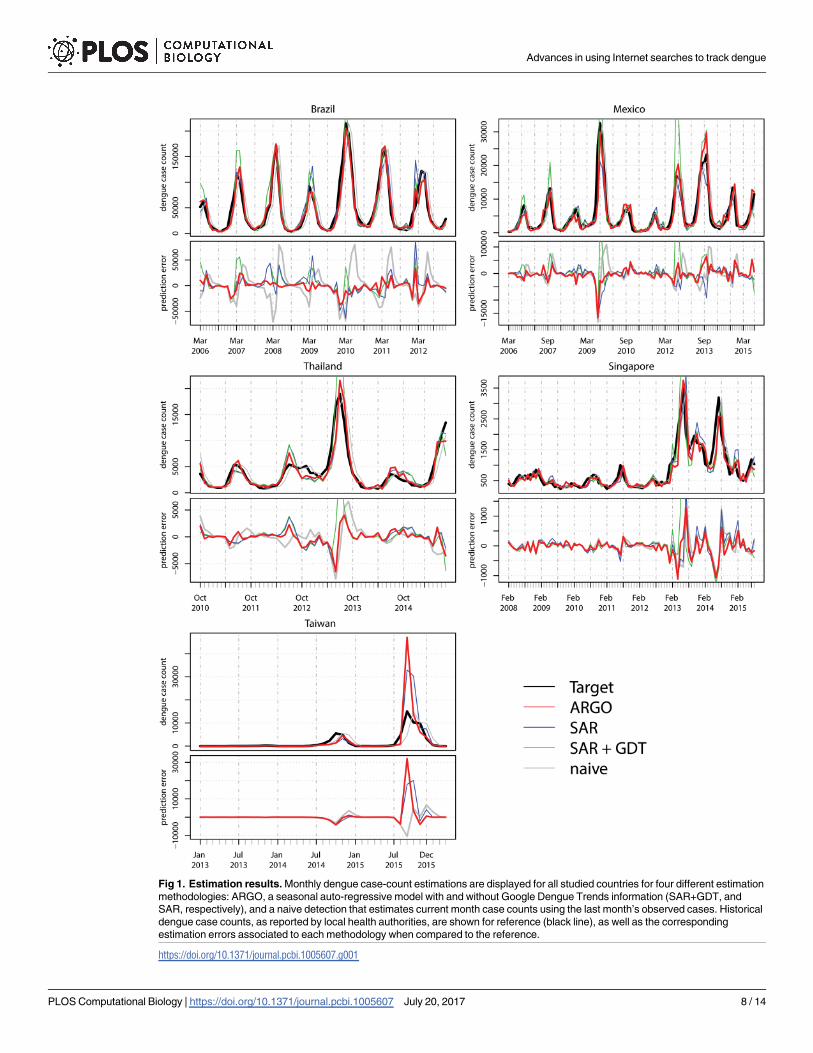
Fig 1. Estimation results. Monthly dengue case-count estimations are displayed for all studied countries for four different estimation
methodologies: ARGO, a seasonal auto-regressive model with and without Google Dengue Trends information (SAR+GDT, and
SAR, respectively), and a naive detection that estimates current month case counts using the last month’s observed cases. Historical
dengue case counts, as reported by local health authorities, are shown for reference (black line), as well as the corresponding
estimation errors associated to each methodology when compared to the reference.
https://doi.org/10.1371/journal.pcbi.1005607.g001
Advances in using Internet searches to track dengue
PLOS Computational Biology | https://doi.org/10.1371/journal.pcbi.1005607 July 20, 2017 8 / 14

where the median yearly dengue case counts are strongly associated with the performance of
our methodology (i.e. the higher the median yearly cases the higher the correlation of ARGO),
as shown in Table 2. This is consistent with earlier findings that dengue virus prevalence is cor-
related with model performance in sub-regions of Mexico [38]. In addition, in Brazil, Mexico,
and Thailand, the countries where our methodology works best, a clear seasonal pattern is
observed in the disease incidence trends over time, as shown in Table 2.
On the other hand, the results from Taiwan illustrate the limitations of our approach. Tai-
wan does not present either an observable seasonal trend or a high number of dengue cases.
As a result, neither ARGO nor the model using only Google search terms reliably track den-
gue. Low dengue-related Internet search activity during most years and sudden public interest
during the outbreaks of 2014 and 2015, causing mis-calibration of the Google Trends data,
may be another contributor. Other unique characteristics of the Taiwan outbreaks are that
they were largely localized in South Taiwan, where Aedes aegypti is resident, and featured viral
strains from neighboring countries rather than endemic strains [45, 46]. Also of interest is that
the increased case counts occurred during periods of significantly increased temperature and
rainfall [46]. The unpredictable character of these outbreaks present challenges for the perfor-
mance of ARGO, and generally of all the methods considered in our comparison, but also
highlight the potential of incorporating environmental predictors such as temperature and
precipitation in our approaches.
While Internet penetration may seem to be an important factor in assessing the quality of
Google Trends data, the statistics from Table 2 show that it alone is not as effective as dengue
prevalence or seasonality in predicting the overall performance of our methodology. As an
example, although Taiwan has high Internet penetration, the dengue case count may be low
enough over most years that dengue-related searches motivated by other medical or educa-
tional purposes may introduce significant noise in the Google-query data. On the other hand,
ARGO shows strong improvement over the seasonal autoregressive model in Brazil and Singa-
pore, two countries with moderate to high Internet access, compared to Mexico and Thailand,
which have low Internet access, suggesting that web penetration is nevertheless still an impor-
tant factor. Finally, the proportion of the population within a country using Google as a search
engine also provides some insight into the performance of ARGO (Table 2). ARGO shows the
lowest correlation in Taiwan, which happens to have the lowest Google market share among
the countries studied here [42].
Despite dengue and flu having very different biological transmission patterns, the fact that
modifications to the ARGO methodology yield robust and accurate dengue estimates indicates
Table 2. Comparison of countries/states.
Characteristics Brazil Mexico Thailand Singapore Taiwan
ARGO correlation 0.971 0.924 0.928 0.903 0.834
Median yearly case count 590,000 48,000 47,000 5,400 1,700
Seasonality (correlation of SAR) 0.917 0.911 0.917 0.847 0.878
Internet penetration [41] 50% 38% 27% 74% 76%
Google market share [42] 97% 93% 99% 84% 42%
Report frequency monthly monthly monthly weekly weekly
Population (avg. in millions) [43, 44] 198 120 67 5.2 23
Median yearly incidence (per 10,000) 29.1 4.1 8.0 10.5 6.8
Country size (103 mi2) 3,290 758 198 0.28 14
Population density (per mi2) [43] 60 160 340 18,700 1,600
GDP (per capita avg. over study period) [43] $10,100 $9,200 $5,800 $55,000 $31,900
https://doi.org/10.1371/journal.pcbi.1005607.t002
Advances in using Internet searches to track dengue
PLOS Computational Biology | https://doi.org/10.1371/journal.pcbi.1005607 July 20, 2017 9 / 14

the strength of our methodological framework. Although the monthly time scale chosen for
this study was originally chosen based on data availability, inspection shows that a monthly
surveillance approach is better suited for the 2-week serial interval of dengue [47].
The dengue activity estimates obtained with our methodology, like estimates from any
novel digital disease detection tool, are not meant to replace dengue information obtained
from traditional healthcare-based disease surveillance; instead, they can help decision-makers
confirm (or deny) suspected disease trends ahead of traditional disease surveillance systems.
Ultimately, the goal of this effort is to take a step closer to the development of an accurate,
real-time modeling platform, where dengue case estimates can be constantly updated to pro-
vide authorities and non-governmental organizations with potentially actionable and close
to real-time data on which they can make informed decisions, as well as providing travelers
visiting high-risk areas with warnings. Such a platform could bring multiple information
sources together, including but not limited to traditional epidemiological case reports, Google
searches, crowd-sourced data, and climate and transportation information, creating a rapid
response and alert system for users based on their specific location. Timely and precise detec-
tion may turn out to play a large role in reducing infections in the near future by influencing
the timing of vector control efforts, hospital and clinical preparation, and providing public and
individual alerts.
The platform would also enable users to verify dengue risk information with their own
observations, creating a positive feedback loop that would continuously improve the accu-
racy of the tool. We are currently implementing two building-blocks that could help shape
such a platform. The first one consists of a webpage Healthmap.org/denguetrends where
dengue estimates produced with the methodology introduced in this manuscript are contin-
uously displayed, and the second one is a crowd-sourced tool (currently in beta) that offers a
user-friendly online chat system which maps dengue cases worldwide, and gives the public
free access to toolkits that help reduce their risk of infection. This second effort is led by
Break Dengue’s “Dengue Track” initiative www.breakdengue.org/dengue-track/. The
potential impact may be far reaching, as the same models could also be used to track and
map other infectious and mosquito-borne diseases, like Zika, malaria, yellow fever or
Chikungunya.
Real-time implementation of our methods requires robust responses to changes in data
quality, availability, and format. For example, Google correlate data shows internal variability
attributed to re-sampling when the tool is accessed at different times. In addition, epidemio-
logical data is not always published consistently by countries, creating lags in reporting that
would make our methodology (which assumes having access to last month’s dengue case
counts) not applicable.
In order to understand the impact of these data limitations, we performed two robustness
studies of ARGO with respect to (1) the variations in Google Trends data, and (2) the availabil-
ity of the most recent dengue case count data. For the first, we obtained multiple data sets con-
taining the search frequencies of the query terms displayed on Table A in S1 Text by accessing
Google Trends 10 different times during a week. We then produced Dengue activity estimates
with ARGO using these 10 data sets as input. Table B in S1 Text shows that ARGO still outper-
forms all other methods in Brazil, Mexico, Thailand and Singapore, despite the random varia-
tions observed in Google Trends data. For the second, we retrained all the models under the
assumption that the dengue case count from the past month was never available due to report-
ing delays. Table C in S1 Text shows that despite the unavailability of the last month dengue
counts, ARGO had competitive predictive performance in the five countries/states when com-
pared to other models (similar to the full data case), suggesting that our methodology is robust
to the time delays in reporting in addition to variations in the input variables.
Advances in using Internet searches to track dengue
PLOS Computational Biology | https://doi.org/10.1371/journal.pcbi.1005607 July 20, 2017 10 / 14
While our methods are designed to self-correct over time, the introduction of an interven-
tion to curb dengue activity that could lead to a reduction in dengue cases, such as vector
control or behavioral education (e.g. use of bed nets), may potentially lead our models to tem-
porarily over-predict incidence. However, once such an intervention has been established and
remains active in a given location, our models will self-correct over time to predict the new lev-
els of dengue activity. Sporadic, nation-wide mosquito control methods would provide a big-
ger challenge to dengue case count predictability and, therefore, our model’s usability.
In light of ARGO’s strengths and limitations, future work should analyze the feasibility of
applying our methodology to other countries, finer spatial resolutions, and temporal resolu-
tions. This will be followed by routine reassessments of our methods to identify changes in
information or potential improvements, including new search terms. As an example of such
a change, Brazil has started publishing weekly dengue case counts since 2014. While our
work used only the monthly resolution for fair comparison among all countries, adapting
our methods to shorter time horizons for regions that provide such information would be
useful.
Information on national-level dengue activity may not be ideal for decision-making at the
local level since this information has been aggregated over a wide variety of potentially hetero-
geneous spatial environments. Future work should explore finer spatial resolution estimations
to identify whether region-specific factors may improve or worsen results, similar to what has
been done in [15, 38]. The five countries/states explored in this study vary on orders of magni-
tudes of size; for example, Brazil, Mexico, and Thailand each spans over 100 million square
miles. As a result, these three countries contain wide ecological diversity and potentially vary-
ing patterns of dengue transmission among different sub-regions. It may be expected, for
example, that Brazil would show different levels of seasonality in tropical compared to temper-
ate areas. The success of finer spatial resolutions would depend on the quality of local case
count and Google Trends data; the former can be affected by reporting efficiency, and the lat-
ter can be subject to Internet availability and Google use in a given region. Using national level
data, on the other hand, has the advantage of smoother incidence curves for extraction and
extrapolation of signal at the cost of more granular information. This is reflected in the obser-
vation that ARGO performed best in the three large countries despite the inherent heterogene-
ity within each country. This fits with our previous observation that a combination of higher
dengue prevalence at the national level, seasonality and Google use in these countries leads to
better results. We believe that these strengths and limitations also apply to extending our meth-
odology to other countries/states besides those studied in the paper.
Producing short-term forecasts of dengue activity, in addition to the nowcast presented
here should also be pursued (See [48] for such an extension for flu forecasting). Our approach
may help produce dengue activity estimates in higher spatial resolutions that can lead to alert
systems for people with an increased risk of exposure to the dengue virus at any given point in
time. It is important to keep in mind that state-level or city-level spatial scales with low dengue
activity may present similar challenges to the applicability of our approach as seen in Taiwan.
The incorporation of other Internet-based data sources [48, 49] and cross-country spatial rela-
tionships should also be exploited in order to improve the accuracy in predictions.
Supporting information
S1 Text. Supporting information text. This file includes: (1) Query terms used for each coun-
try/state as Table A; (2) ARGO hyper-parameters for each country/state; (3) Aggregation from
weekly data to monthly data; (4) Robustness to Google Trends variation as Table B; (5) Sensi-
tivity to the availability of dengue case count in the past month as Table C; (6) Heatmaps of
Advances in using Internet searches to track dengue
PLOS Computational Biology | https://doi.org/10.1371/journal.pcbi.1005607 July 20, 2017 11 / 14

ARGO coefficients for each country/state as Figure A, B, C, D, and E.
(PDF)
Author Contributions
Conceptualization: SCK JSB NB MS.
Data curation: SY FL.
Formal analysis: SY SCK FL MS.
Funding acquisition: NB MS.
Investigation: SY SCK FL MS.
Methodology: SY SCK FL MS.
Project administration: SCK MS.
Software: SY FL.
Supervision: SCK MS.
Validation: SY SCK FL MS.
Visualization: SY FL.
Writing – original draft: SY SCK FL MS.
Writing – review & editing: SY SCK FL JSB NB MS.
References1. World Health Organization. Dengue and severe dengue; 2016. http://www.who.int/mediacentre/
factsheets/fs117/en/.
2. Chan M, Johansson MA. The incubation periods of dengue viruses. PloS one. 2012; 7(11):e50972.
https://doi.org/10.1371/journal.pone.0050972 PMID: 23226436
3. Centers for Disease Control and Prevention. Dengue; 2016. http://www.cdc.gov/dengue/.
4. Ibarra AMS, Ryan SJ, Beltran E, Mejıa R, Silva M, Muñoz A. Dengue vector dynamics (Aedes aegypti)
influenced by climate and social factors in Ecuador: implications for targeted control. PloS one. 2013; 8
(11):e78263. https://doi.org/10.1371/journal.pone.0078263
5. Hii YL, Zhu H, Ng N, Ng LC, Rocklov J. Forecast of dengue incidence using temperature and rainfall.
PLoS Negl Trop Dis. 2012; 6(11):e1908. https://doi.org/10.1371/journal.pntd.0001908 PMID:
23209852
6. Wongkoon S, Jaroensutasinee M, Jaroensutasinee K, et al. Distribution, seasonal variation & dengue
transmission prediction in Sisaket, Thailand. Indian Journal of Medical Research. 2013; 138(3):347.
PMID: 24135179
7. Thai KTD, Anders KL. The role of climate variability and change in the transmission dynamics and geo-
graphic distribution of dengue. Experimental Biology and Medicine. 2011; 236(8):944–954. https://doi.
org/10.1258/ebm.2011.010402 PMID: 21737578
8. Yang HM, Macoris MLG, Galvani KC, Andrighetti MTM, Wanderley DMV. Assessing the effects of tem-
perature on the population of Aedes aegypti, the vector of dengue. Epidemiology and infection. 2009;
137(08):1188–1202. https://doi.org/10.1017/S0950268809002052 PMID: 19192322
9. Padmanabha H, Durham D, Correa F, Diuk-Wasser M, Galvani A. The interactive roles of Aedes
aegypti super-production and human density in dengue transmission. PLoS Negl Trop Dis. 2012; 6(8):
e1799. https://doi.org/10.1371/journal.pntd.0001799 PMID: 22953017
10. Thammapalo S, Chongsuvivatwong V, Geater A, Dueravee M. Environmental factors and incidence of
dengue fever and dengue haemorrhagic fever in an urban area, Southern Thailand. Epidemiology and
Infection. 2008; 136(01):135–143. https://doi.org/10.1017/S0950268807008126 PMID: 17359563
Advances in using Internet searches to track dengue
PLOS Computational Biology | https://doi.org/10.1371/journal.pcbi.1005607 July 20, 2017 12 / 14

11. Achee NL, Gould F, Perkins TA, Reiner RC Jr, Morrison AC, Ritchie SA, et al. A critical assessment of
vector control for dengue prevention. PLoS Negl Trop Dis. 2015; 9(5):e0003655. https://doi.org/10.
1371/journal.pntd.0003655 PMID: 25951103
12. Runge-Ranzinger S, Horstick O, Marx M, Kroeger A. What does dengue disease surveillance contribute
to predicting and detecting outbreaks and describing trends? Tropical Medicine & International Health.
2008; 13(8):1022–1041. https://doi.org/10.1111/j.1365-3156.2008.02112.x
13. Madoff LC, Fisman DN, Kass-Hout T. A new approach to monitoring dengue activity. PLoS neglected
tropical diseases. 2011; 5(5). https://doi.org/10.1371/journal.pntd.0001215 PMID: 21647309
14. World Health Organization and Special Programme for Research and Training in Tropical Diseases,
World Health Organization E Department of Control of Neglected Tropical Diseases, World Health
Organization. Dengue: guidelines for diagnosis, treatment, prevention and control. World Health Orga-
nization; 2009.
15. Johansson MA, Reich NG, Hota A, Brownstein JS, Santillana M. Evaluating the performance of infec-
tious disease forecasts: A comparison of climate-driven and seasonal dengue forecasts for Mexico. Sci-
entific Reports. 2016; 6. https://doi.org/10.1038/srep33707
16. Promprou S, Jaroensutasinee M, Jaroensutasinee K. Forecasting dengue haemorrhagic fever cases in
Southern Thailand using ARIMA Models. Dengue Bulletin. 2006; 30:99.
17. Luz PM, Mendes BVM, Codeco CT, Struchiner CJ, Galvani AP. Time series analysis of dengue inci-
dence in Rio de Janeiro, Brazil. The American journal of tropical medicine and hygiene. 2008; 79
(6):933–939. PMID: 19052308
18. Choudhury ZM, Banu S, Islam AM. Forecasting dengue incidence in Dhaka, Bangladesh: A time series
analysis. 2008;.
19. Eastin MD, Delmelle E, Casas I, Wexler J, Self C. Intra-and interseasonal autoregressive prediction of
dengue outbreaks using local weather and regional climate for a tropical environment in Colombia. The
American journal of tropical medicine and hygiene. 2014; 91(3):598–610. https://doi.org/10.4269/ajtmh.
13-0303 PMID: 24957546
20. Johansson MA, Cummings DAT, Glass GE. Multiyear climate variability and dengue—El Nino southern
oscillation, weather, and dengue incidence in Puerto Rico, Mexico, and Thailand: a longitudinal data anal-
ysis. PLoS Med. 2009; 6(11):e1000168. https://doi.org/10.1371/journal.pmed.1000168 PMID: 19918363
21. Hurtado-Dıaz M, Riojas-Rodrıguez H, Rothenberg SJ, Gomez-Dantes H, Cifuentes E. Short communi-
cation: impact of climate variability on the incidence of dengue in Mexico. Tropical medicine & interna-
tional health. 2007; 12(11):1327–1337. https://doi.org/10.1111/j.1365-3156.2007.01930.x
22. Lu L, Lin H, Tian L, Yang W, Sun J, Liu Q. Time series analysis of dengue fever and weather in Guang-
zhou, China. BMC Public Health. 2009; 9(1):395. https://doi.org/10.1186/1471-2458-9-395 PMID:
19860867
23. Aguiar M, Ballesteros S, Kooi BW, Stollenwerk N. The role of seasonality and import in a minimalistic
multi-strain dengue model capturing differences between primary and secondary infections: complex
dynamics and its implications for data analysis. Journal of theoretical biology. 2011; 289:181–196.
https://doi.org/10.1016/j.jtbi.2011.08.043 PMID: 21907213
24. Andraud M, Hens N, Marais C, Beutels P. Dynamic epidemiological models for dengue transmission: a
systematic review of structural approaches. PloS one. 2012; 7(11):e49085. https://doi.org/10.1371/
journal.pone.0049085 PMID: 23139836
25. Chan EH, Sahai V, Conrad C, Brownstein JS. Using web search query data to monitor dengue epidem-
ics: a new model for neglected tropical disease surveillance. PLoS Negl Trop Dis. 2011; 5(5):e1206.
https://doi.org/10.1371/journal.pntd.0001206 PMID: 21647308
26. Gomide J, Veloso A, Meira Jr W, Almeida V, Benevenuto F, Ferraz F, et al. Dengue surveillance based
on a computational model of spatio-temporal locality of Twitter. In: Proceedings of the 3rd international
web science conference. ACM; 2011. p. 3.
27. Althouse BM, Ng YY, Cummings DAT. Prediction of dengue incidence using search query surveillance.
PLoS Negl Trop Dis. 2011; 5(8):e1258. https://doi.org/10.1371/journal.pntd.0001258 PMID: 21829744
28. Milinovich GJ, Williams GM, Clements ACA, Hu W. Internet-based surveillance systems for monitoring
emerging infectious diseases. The Lancet infectious diseases. 2014; 14(2):160–168. https://doi.org/10.
1016/S1473-3099(13)70244-5 PMID: 24290841
29. Ginsberg J, Mohebbi MH, Patel RS, Brammer L, Smolinski MS, Brilliant L. Detecting influenza epidem-
ics using search engine query data. Nature. 2009; 457(7232):1012–1014. https://doi.org/10.1038/
nature07634 PMID: 19020500
30. Cook S, Conrad C, Fowlkes AL, Mohebbi MH. Assessing Google flu trends performance in the United
States during the 2009 influenza virus A (H1N1) pandemic. PloS one. 2011; 6(8):e23610. https://doi.
org/10.1371/journal.pone.0023610 PMID: 21886802
Advances in using Internet searches to track dengue
PLOS Computational Biology | https://doi.org/10.1371/journal.pcbi.1005607 July 20, 2017 13 / 14
31. Olson DR, Konty KJ, Paladini M, Viboud C, Simonsen L. Reassessing Google Flu Trends data for
detection of seasonal and pandemic influenza: a comparative epidemiological study at three geographic
scales. PLoS Comput Biol. 2013; 9(10):e1003256. https://doi.org/10.1371/journal.pcbi.1003256 PMID:
24146603
32. Copeland P, Romano R, Zhang T, Hecht G, Zigmond D, Stefansen C. Google disease trends: an
update. 2013;.
33. Lazer D, Kennedy R, King G, Vespignani A. The parable of Google flu: traps in big data analysis. Sci-
ence. 2014; 343(6176):1203–1205. https://doi.org/10.1126/science.1248506 PMID: 24626916
34. Santillana M, Zhang DW, Althouse BM, Ayers JW. What can digital disease detection learn from (an
external revision to) Google Flu Trends? American journal of preventive medicine. 2014; 47(3):341–
347. https://doi.org/10.1016/j.amepre.2014.05.020 PMID: 24997572
35. Yang S, Santillana M, Kou SC. Accurate estimation of influenza epidemics using Google search data
via ARGO. Proceedings of the National Academy of Sciences. 2015; 112(47):14473–14478. https://doi.
org/10.1073/pnas.1515373112
36. Pollett S, Boscardin WJ, Azziz-Baumgartner E, Tinoco YO, Soto G, Romero C, et al. Evaluating Google
Flu Trends in Latin America: important lessons for the next phase of digital disease detection. Clinical
Infectious Diseases. 2016; p. ciw657.
37. Santillana M. Perspectives on the future of Internet search engines and biosurveillance systems. Clini-
cal infectious diseases: an official publication of the Infectious Diseases Society of America. 2016;.
38. Gluskin RT, Johansson MA, Santillana M, Brownstein JS. Evaluation of Internet-based dengue query
data: Google Dengue Trends. PLoS Negl Trop Dis. 2014; 8(2):e2713. https://doi.org/10.1371/journal.
pntd.0002713 PMID: 24587465
39. Tibshirani R. Regression shrinkage and selection via the lasso. Journal of the Royal Statistical Society
Series B (Methodological). 1996; p. 267–288.
40. Santillana M, Nsoesie EO, Mekaru SR, Scales D, Brownstein JS. Using clinicians’ search query data to
monitor influenza epidemics. Clinical Infectious Diseases. 2014; 59(10):1446–1450. https://doi.org/10.
1093/cid/ciu647 PMID: 25115873
41. Berkman Klein Center for Internet & Society. Internet Monitor; 2017. Available from: https://
thenetmonitor.org/countries/.
42. Kennedy AF, Hauksson KM. Online Appendix C. In: Global Search Engine Marketing: Fine-Tuning
Your International Search Engine Results. Que Publishing; 2012. Available from: http://ptgmedia.
pearsoncmg.com/images/9780789747884/supplements/9780789747884_appC.pdf.
43. The World Bank. Countries and Economies; 2017. Available from: http://data.worldbank.org/country.
44. Central Intelligence Agency. The CIA World Factbook; 2017. https://www.cia.gov/library/publications/
the-world-factbook/geos/tw.html.
45. Yang CF, Hou JN, Chen TH, Chen WJ. Discriminable roles of Aedes aegypti and Aedes albopictus in
establishment of dengue outbreaks in Taiwan. Acta tropica. 2014; 130:17–23. https://doi.org/10.1016/j.
actatropica.2013.10.013 PMID: 24161880
46. Wang SF, Chang K, Loh EW, Wang WH, Tseng SP, Lu PL, et al. Consecutive large dengue outbreaks
in Taiwan in 2014–2015. Emerging Microbes & Infections. 2016; 5(12):e123. https://doi.org/10.1038/
emi.2016.124
47. Majumder MS, Cohn E, Fish D, Brownstein JS. Estimating a feasible serial interval range for Zika fever.
Bull World Health Organ. 2016; 10.
48. Santillana M, Nguyen AT, Dredze M, Paul MJ, Nsoesie EO, Brownstein JS. Combining search, social
media, and traditional data sources to improve influenza surveillance. PLoS Comput Biol. 2015; 11(10):
e1004513. https://doi.org/10.1371/journal.pcbi.1004513 PMID: 26513245
49. McGough SF, Brownstein JS, Hawkins JB, Santillana M. Forecasting Zika Incidence in the 2016 Latin
America Outbreak Combining Traditional Disease Surveillance with Search, Social Media, and News
Report Data. PLOS Neglected Tropical Diseases. 2017; 11(1):e0005295. https://doi.org/10.1371/
journal.pntd.0005295 PMID: 28085877
Advances in using Internet searches to track dengue
PLOS Computational Biology | https://doi.org/10.1371/journal.pcbi.1005607 July 20, 2017 14 / 14

Advances in using Internet searches to track dengue
Shihao Yang1, S. C. Kou 1,*, Fred Lu 2, John S. Brownstein2,3, Nicholas Brooke 4
Mauricio Santillana2,3, *
1 Department of Statistics, Harvard University, Cambridge, MA, USA
2 Computational Health Informatics Program, Boston Children’s Hospital, Boston, MA,
USA
3 Harvard Medical School, Boston, MA, USA
4 The Synergist, Brussels, Belgium
* Corresponding authors: [email protected]; [email protected]
Supporting Information
Table A. Query terms used for each country/state
Brazil Mexico Thailand Singapore Taiwan
dengue dengue โรคไขเลอดออก dengue 登革熱
sintomas.dengue dengue.dengue.dengue อาการ.โรค.ไขเลอดออก dengue.fever 登革熱噴藥
mosquito el.dengue ไขเลอดออก dengue.symptoms 出血性登革熱
sintomas.da.dengue dengue.sintomas โรค.ไขเลอดออก dengue.singapore 埃及斑蚊
a.dengue sintomas.del.dengue การ.ปองกน.ไขเลอดออก symptoms.dengue.fever 登格熱
mosquito.dengue dengue.hemorragico อาการ.ของ.ไขเลอดออก symptoms.of.dengue 防蚊液
mosquito.da.dengue sintomas.de.dengue สาเหต.ไขเลอดออก dengue.fever.singapore 白線斑蚊
dengue.hemorragica que.es.dengue โครงการ.ไขเลอดออก dengue.mosquito 登革樂
sintomas.de.dengue dengue.clasico สถานการณ.โรค.ไขเลอดออก mosquito dengue fever
sobre.a.dengue dengue.mosquito สถานการณ.ไขเลอดออก dengue.in.singapore 蚊子叮
ARGO hyper-parameters for each country/state
Mexico Since we found the nearest three time lags to have significant predictive effect
on future dengue occurrence, we decided not to penalize these three time lags, setting
λαj= 0, j = 1, 2, 3. We do not have knowledge of the predictive power of the later time
lags, so we set a common penalty for all of them λαj = λα, j ≥ 4. We applied the same
argument to the Google search terms. We further set λα = λβ to reduce the number of
hyper parameters, therefore λαk= λβk
= 0 for k = 1, 2, 3, λαj = λ for j = 4, . . . , 12, 24,
and λβk= λ for k = 4, . . . , 10.
PLOS 1/11
Brazil We found the same pattern for Brazil as for Mexico. Thus, we set
λαk= λβk
= 0 for k = 1, 2, 3, λαj= λ for j = 4, . . . , 12, 24, and λβk
= λ for
k = 4, . . . , 10.
Thailand The first three time lags for Thailand were significant, but none of the
Google terms by themselves were significant. This observation led us to set the
hyper-parameters as λαj= 0 for j = 1, 2, 3, λαj
= λ for j = 4, . . . , 12, 24, and λβk= λ
for k = 1, . . . , 10.
Singapore Singapore showed a similar pattern to Thailand, so we set λαj = 0 for
j = 1, 2, 3, λαj = λ for j = 4, . . . , 12, 24, and λβk= λ for k = 1, . . . , 10.
Taiwan The same argument applied for Taiwan, so we set λαj = 0 for j = 1, 2, 3,
λαj = λ for j = 4, . . . , 12, 24, and λβk= λ for k = 1, . . . , 10.
Aggregation from weekly data to monthly data
We aggregate the Google Trends data from weekly frequency to monthly frequency
using summation. If a fraction of the week belongs to a certain month, the summing
value will be that fraction multiplied by the value reported for that week.
Robustness to Google Trends variation
We include a robustness study to identify the effects of the observed variations in the
(input) data acquired from the Google Trends website. For this, we downloaded 11
copies of data on different days in November 2016, and repeated the implementation of
the methodology described in the main text. Our findings are presented in Table B. The
mean of the 11 evaluation metric values is displayed as well as the standard deviation,
in parenthesis. GDT has no variation since it is taken as exogenous in this study. If we
had access to the raw data GDT is constructed from, we should expect to see similar
variations as well. Autoregressive models do not suffer from these variations since they
do not use Google Trends data as input. As expected, ARGO, which combines Google
Trends data with time series data, suffers less from the variations of the Google Trends
data than the model based on Google Trends data only.
PLOS 2/11

Table B. Sensitivity to Google Trends variation. The mean evaluation metric
value of the 11 different datasets is displayed in the table, as well as the the standard
deviation. All values are absolute.
RMSE MAE RMSPE MAPE CORR
Brazil
ARGO 14602.591(1303.123) 9043.447(746.341) 0.329(0.029) 0.234(0.014) 0.957(0.008)
GDT 20349.593(0) 13725.535(0) 0.692(0) 0.446(0) 0.916(0)
GT 31606.088(3458.28) 20243.862(1716.244) 0.821(0.07) 0.565(0.043) 0.815(0.04)
SAR 20158.471(0) 12215.217(0) 0.467(0) 0.318(0) 0.917(0)
SAR+GDT 19220.295(0) 12732.517(0) 0.397(0) 0.306(0) 0.938(0)
naive 30560.436(0) 21677.634(0) 0.703(0) 0.546(0) 0.812(0)
Mexico
ARGO 2695.046(145.838) 1532.008(79.432) 0.516(0.063) 0.355(0.025) 0.903(0.011)
GDT 3370.184(0) 2076.24(0) 1.036(0) 0.645(0) 0.863(0)
GT 4628.805(456.821) 2528.918(208.179) 1.016(0.13) 0.616(0.045) 0.705(0.065)
SAR 2821.504(0) 1593.552(0) 0.633(0) 0.401(0) 0.911(0)
SAR+GDT 4460.343(0) 2131.342(0) 0.635(0) 0.42(0) 0.891(0)
naive 3570.105(0) 2161.018(0) 0.816(0) 0.492(0) 0.833(0)
Thailand
ARGO 1543.473(129.498) 911.561(43.288) 0.303(0.014) 0.23(0.008) 0.925(0.011)
GDT 1811.26(0) 1107.728(0) 0.636(0) 0.419(0) 0.884(0)
GT 2590.984(499.302) 1582.48(134.678) 0.687(0.068) 0.495(0.04) 0.82(0.05)
SAR 1592.675(0) 1066.51(0) 0.386(0) 0.293(0) 0.917(0)
SAR+GDT 2381.833(0) 1253.851(0) 0.393(0) 0.305(0) 0.903(0)
naive 2058.891(0) 1276.068(0) 0.426(0) 0.326(0) 0.852(0)
Singapore
ARGO 309.492(24.395) 185.639(7.578) 0.282(0.011) 0.22(0.005) 0.895(0.014)
GDT 389.389(0) 260.421(0) 0.404(0) 0.331(0) 0.821(0)
GT 362.286(30.443) 246.596(13.725) 0.398(0.019) 0.323(0.017) 0.866(0.031)
SAR 379.794(0) 223.633(0) 0.33(0) 0.25(0) 0.847(0)
SAR+GDT 807.414(0) 262.783(0) 0.336(0) 0.232(0) 0.775(0)
naive 329.318(0) 202.651(0) 0.283(0) 0.23(0) 0.878(0)
Taiwan
ARGO 2919.016(1284.247) 989.77(258.632) 0.846(0.154) 0.628(0.062) 0.873(0.026)
GT 5031.846(7248.156) 1336.656(1157.202) 4.092(1.126) 1.655(0.272) 0.848(0.062)
SAR 4487.372(0) 1485.911(0) 0.801(0) 0.653(0) 0.878(0)
naive 2422.559(0) 1063.597(0) 3.248(0) 1.601(0) 0.734(0)
PLOS 3/11

Sensitivity to the availability of dengue case count in the past
month
Formulation of ARGO and benchmark models assuming past month
dengue case count is not available
ARGO model We now define the ARGO model as in equation (1) of main text, but
we set J = {2, . . . , 12} ∪ {24} assuming that the most recent month data is not yet
available. We take the same K = 10, which includes the query search frequencies of
both the current and the previous month. The slightly refined model is outlined below.
yt = µy +∑j∈J
αjyt−j +∑k∈K
βk,0Xk,t +∑k∈K
βk,1Xk,t−1 + εt, εtiid∼ N (0, σ2), (1)
The same L1 regularization is imposed to minimize the number of parameters as stated
in the ARGO parameter estimation section. In a given month, the goal is to find
parameters µy, α = {αj : j ∈ J}, and β = (β1,0, ..., β10,0, β1,1, ..., β10,1) that minimize
∑t
yt − µy −∑j∈J
αjyt−j −10∑k=1
βk,0Xk,t −10∑k=1
βk,1Xk,t−1
2
+
∑j∈J
λαj |αj |+10∑k=1
λβk|βk,0|+
10∑k=1
λβk|βk,1|
where λαj , λβkare regularization hyper-parameters. For Brazil, Mexico, and Thailand,
we set λαk= λβk
= 0 for k = 2, 3, λαj = λ for j = 4, . . . , 12, 24, and λβk= λβ1 = λ for
k = 4, . . . , 10. For Singapore and Taiwan, we set λαk= 0 for k = 2, 3, λαj
= λ for
j = 4, . . . , 12, 24, and λβk= λ for k = 1, . . . , 10.
Benchmark models For comparison with ARGO, the benchmark models also
assume dengue case count of the most recent month not available:
1. A seasonal autoregressive model without Google information, denoted as SAR,
using a time series of the most recent 3 months (i.e., 2 lags, because most recent
month is not available), as well as 2 seasonal lags. Specifically, the monthly time
series model is comprised of time lags 2,3,12,24:
yt = α2yt−2 +α3yt−3 +α12yt−12 +α24yt−24 + εt, εt ∼ N (0, σ2). This model serves
as a baseline for estimations made only using dengue time-series information.
2. Google Dengue Trends [25], which ended in August 2015. Data are obtained from
https://www.google.org/flutrends/about/. Because Google Dengue Trends
reported dengue intensity in a scale from 0 to 1, we dynamically rescaled it using
a sliding training window to recreate case estimates.
3. A penalized multivariate linear regression model with Google Trends information
only [34], denoted as GT. This is essentially ARGO without autoregressive lags,
and incorporates a common L1 penalty on the Google Trends data of current
month and most recent month;
PLOS 4/11

4. A seasonal autoregressive model with Google Dengue Trends as exogenous
variable, denoted as SAR+GDT.
yt = α2yt−2 + α3yt−3 + α12yt−12 + α24yt−24 + β1 log GDTt + β2 log GDTt−1 + εt,
εt ∼ N (0, σ2).
5. A naive method, which simply uses the case count two months ago as the
estimation for the value of the current month.
All benchmark models (except the naive method) were trained by linear regression with
sliding two year windows for fair comparison.
Performance comparison
As shown in Table C, ARGO has almost uniform outperformance to other benchmark
models except in Taiwan. The performance of ARGO is similar to our finding in the
main text, suggesting that the method is robust to the availability schedule of the
ground truth data of dengue case count.
PLOS 5/11

Table C. Comparison of ARGO to benchmark models assuming past month dengue case
count is not available
RMSE MAE RMSPE MAPE CORR
Brazil
ARGO 0.357 0.321 0.260 0.285 0.927
GDT 0.419 0.372 0.370 0.364 0.897
GT 0.525 0.470 0.351 0.394 0.866
SAR 0.692 0.569 0.530 0.491 0.762
SAR+GDT 0.826 0.591 0.379 0.410 0.810
naive 1 (54101.159) 1 (40214.762) 1 (1.938) 1 (1.285) 0.423
Mexico
ARGO 0.524 0.536 0.389 0.527 0.872
GDT 0.583 0.593 0.539 0.620 0.833
GT 0.647 0.593 0.573 0.588 0.790
SAR 0.737 0.756 0.946 0.883 0.684
SAR+GDT 2.033 1.192 0.846 0.804 0.711
naive 1 (6231.484) 1 (3900.929) 1 (2.013) 1 (1.089) 0.495
Thailand
ARGO 0.417 0.450 0.466 0.484 0.936
GDT 0.519 0.519 0.792 0.730 0.877
GT 1.432 1.045 1.014 0.917 0.804
SAR 0.907 0.962 1.203 1.060 0.641
SAR+GDT 1.090 0.847 0.743 0.749 0.847
naive 1 (3647.191) 1 (2267.333) 1 (0.832) 1 (0.607) 0.532
Singapore
ARGO 0.748 0.778 0.790 0.836 0.835
GDT 0.782 0.875 0.899 0.979 0.809
GT 1.421 0.904 0.812 0.819 0.765
SAR 1.432 1.433 1.590 1.407 0.491
SAR+GDT 2.634 1.264 1.144 0.964 0.621
naive 1 (513.588) 1 (312.989) 1 (0.463) 1 (0.353) 0.704
Taiwan
ARGO 4.371 2.477 0.086 0.144 0.900
GT 30.431 13.435 0.502 0.436 0.721
SAR 2.238 1.429 0.062 0.119 0.594
naive 1 (3691.033) 1 (1895.974) 1 (21.261) 1 (8.280) 0.395
PLOS 6/11

Heatmaps of ARGO coefficients
Figure A. Dynamic ARGO coefficients for Brazil.
< −0.1 −0.05 0 0.05 > 0.1
Negative coefficient Zero coefficient Positive coefficient
2007 2008 2009 2010 2011 2012 2013
sobre.a.dengue
sintomas.de.dengue
dengue.hemorrágica
mosquito.da.dengue
mosquito
mosquito.dengue
a.dengue
sintomas.da.dengue
sintomas.dengue
dengue
lag_24
lag_12
lag_11
lag_10
lag_9
lag_8
lag_7
lag_6
lag_5
lag_4
lag_3
lag_2
lag_1
(Intercept)
Brazil
PLOS 7/11

Figure B. Dynamic ARGO coefficients for Mexico.
< −0.1 −0.05 0 0.05 > 0.1
Negative coefficient Zero coefficient Positive coefficient
2008 2010 2012 2014 2016
dengue.mosquito
dengue.clasico
que.es.dengue
sintomas.de.dengue
dengue.hemorragico
sintomas.del.dengue
dengue.sintomas
el.dengue
dengue.dengue.dengue
dengue
lag_24
lag_12
lag_11
lag_10
lag_9
lag_8
lag_7
lag_6
lag_5
lag_4
lag_3
lag_2
lag_1
(Intercept)
Mexico
PLOS 8/11
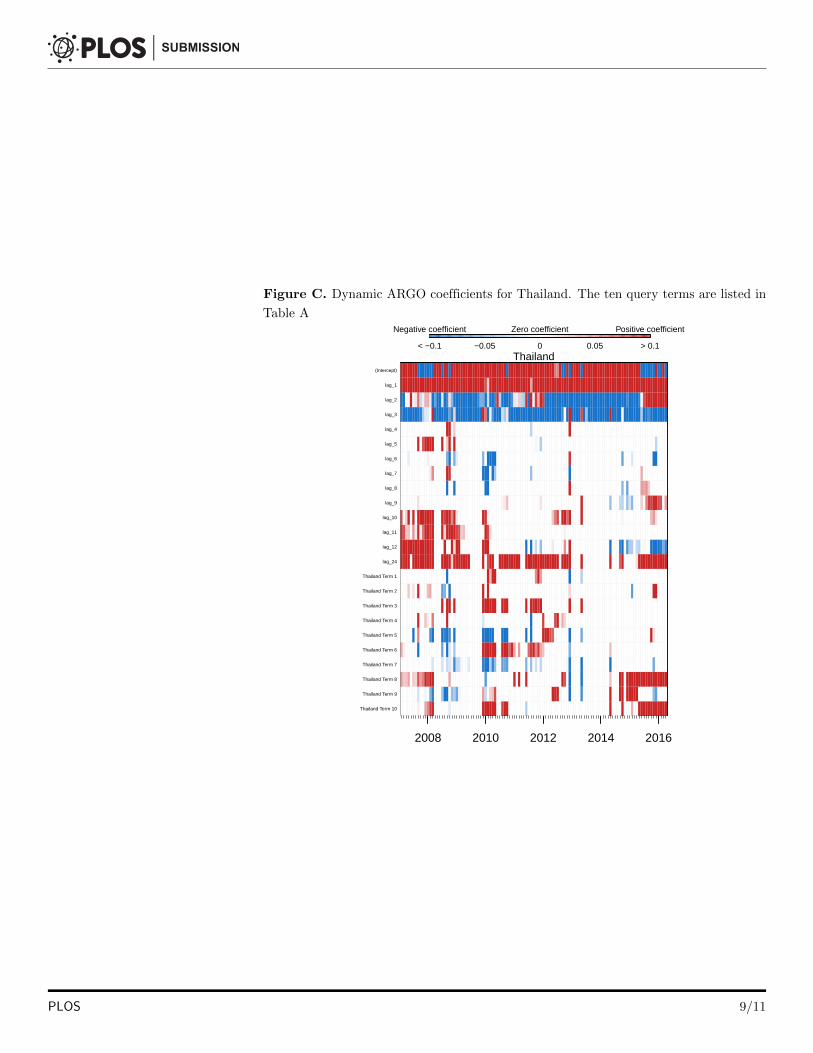
Figure C. Dynamic ARGO coefficients for Thailand. The ten query terms are listed in
Table A
< −0.1 −0.05 0 0.05 > 0.1
Negative coefficient Zero coefficient Positive coefficient
2008 2010 2012 2014 2016
Thailand Term 10
Thailand Term 9
Thailand Term 8
Thailand Term 7
Thailand Term 6
Thailand Term 5
Thailand Term 4
Thailand Term 3
Thailand Term 2
Thailand Term 1
lag_24
lag_12
lag_11
lag_10
lag_9
lag_8
lag_7
lag_6
lag_5
lag_4
lag_3
lag_2
lag_1
(Intercept)
Thailand
PLOS 9/11

Figure D. Dynamic ARGO coefficients for Singapore.
< −0.1 −0.05 0 0.05 > 0.1
Negative coefficient Zero coefficient Positive coefficient
2010 2012 2014 2016
dengue.in.singapore
mosquito
dengue.mosquito
dengue.fever.singapore
symptoms.of.dengue
symptoms.dengue.fever
dengue.singapore
dengue.symptoms
dengue.fever
dengue
lag_24
lag_12
lag_11
lag_10
lag_9
lag_8
lag_7
lag_6
lag_5
lag_4
lag_3
lag_2
lag_1
(Intercept)
Singapore
PLOS 10/11

Figure E. Dynamic ARGO coefficients for Taiwan. The ten query terms are listed in
Table A
< −0.1 −0.05 0 0.05 > 0.1
Negative coefficient Zero coefficient Positive coefficient
2013 2014 2015 2016
Taiwan Term 10
Taiwan Term 9
Taiwan Term 8
Taiwan Term 7
Taiwan Term 6
Taiwan Term 5
Taiwan Term 4
Taiwan Term 3
Taiwan Term 2
Taiwan Term 1
lag_24
lag_12
lag_11
lag_10
lag_9
lag_8
lag_7
lag_6
lag_5
lag_4
lag_3
lag_2
lag_1
(Intercept)
Taiwan
PLOS 11/11