Research Article A Semiautomated Framework for...
12
Hindawi Publishing Corporation Disease Markers Volume 35 (2013), Issue 5, Pages 513–523 http://dx.doi.org/10.1155/2013/613529 Research Article A Semiautomated Framework for Integrating Expert Knowledge into Disease Marker Identification Jing Wang, 1 Bobbie-Jo M. Webb-Robertson, 1 Melissa M. Matzke, 1 Susan M. Varnum, 2 Joseph N. Brown, 2 Roderick M. Riensche, 3 Joshua N. Adkins, 2 Jon M. Jacobs, 2 John R. Hoidal, 4 Mary Beth Scholand, 4 Joel G. Pounds, 2 Michael R. Blackburn, 5 Karin D. Rodland, 2 and Jason E. McDermott 1 1 Computational Biology and Bioinformatics, Pacific Northwest National Laboratory, Richland, WA 99352, USA 2 Biological Sciences Division, Pacific Northwest National Laboratory, Richland, WA 99352, USA 3 Knowledge Discovery and Informatics, Pacific Northwest National Laboratory, Richland, WA 99352, USA 4 Department of Internal Medicine, University of Utah School of Medicine, Salt Lake City, UT 84132, USA 5 Department of Biochemistry and Molecular Biology, University of Texas Medical School, Houston, TX 77030, USA Correspondence should be addressed to Jason E. McDermott; [email protected] Received 19 March 2013; Accepted 13 August 2013 Academic Editor: Sheng Pan Copyright © 2013 Jing Wang et al. is is an open access article distributed under the Creative Commons Attribution License, which permits unrestricted use, distribution, and reproduction in any medium, provided the original work is properly cited. Background. e availability of large complex data sets generated by high throughput technologies has enabled the recent proliferation of disease biomarker studies. However, a recurring problem in deriving biological information from large data sets is how to best incorporate expert knowledge into the biomarker selection process. Objective. To develop a generalizable framework that can incorporate expert knowledge into data-driven processes in a semiautomated way while providing a metric for optimization in a biomarker selection scheme. Methods. e framework was implemented as a pipeline consisting of five components for the identification of signatures from integrated clustering (ISIC). Expert knowledge was integrated into the biomarker identification process using the combination of two distinct approaches; a distance-based clustering approach and an expert knowledge-driven functional selection. Results. e utility of the developed framework ISIC was demonstrated on proteomics data from a study of chronic obstructive pulmonary disease (COPD). Biomarker candidates were identified in a mouse model using ISIC and validated in a study of a human cohort. Conclusions. Expert knowledge can be introduced into a biomarker discovery process in different ways to enhance the robustness of selected marker candidates. Developing strategies for extracting orthogonal and robust features from large data sets increases the chances of success in biomarker identification. 1. Introduction An unprecedented opportunity for identification of disease biomarker candidates has been provided by the advent of high throughput technologies in the past decade [1, 2]. e explo- sive growth of large data sets has been overwhelming in terms of the number, size, format, and complexity [3, 4]. While diversified data sets have led to numerous opportunities and studies for discovering new disease marker candidates, the success of those efforts has been largely disappointing in terms of validating the results across populations [4]. Current strategies for biomarker discovery tend to focus on one of two approaches: data-driven [5] or expert know- ledge-driven [6]. A data-driven approach makes use of large data sets to unearth the underlying structures embedded in the data to facilitate identification of robust features. e value of this purely statistical approach has been evident in the successful identification of cancer biomarkers, for instance, using an artificial neural network (ANN) model for detecting early stage epithelial ovarian cancer with a panel of five serum markers [7]. In contrast, an expert knowledge- driven approach takes advantage of constantly increased
Transcript of Research Article A Semiautomated Framework for...
Hindawi Publishing CorporationDisease MarkersVolume 35 (2013), Issue 5, Pages 513–523http://dx.doi.org/10.1155/2013/613529
Research ArticleA Semiautomated Framework for Integrating ExpertKnowledge into Disease Marker Identification
Jing Wang,1 Bobbie-Jo M. Webb-Robertson,1 Melissa M. Matzke,1
Susan M. Varnum,2 Joseph N. Brown,2 Roderick M. Riensche,3 Joshua N. Adkins,2
Jon M. Jacobs,2 John R. Hoidal,4 Mary Beth Scholand,4 Joel G. Pounds,2
Michael R. Blackburn,5 Karin D. Rodland,2 and Jason E. McDermott1
1 Computational Biology and Bioinformatics, Pacific Northwest National Laboratory, Richland, WA 99352, USA2 Biological Sciences Division, Pacific Northwest National Laboratory, Richland, WA 99352, USA3Knowledge Discovery and Informatics, Pacific Northwest National Laboratory, Richland, WA 99352, USA4Department of Internal Medicine, University of Utah School of Medicine, Salt Lake City, UT 84132, USA5Department of Biochemistry and Molecular Biology, University of Texas Medical School, Houston, TX 77030, USA
Correspondence should be addressed to Jason E. McDermott; [email protected]
Received 19 March 2013; Accepted 13 August 2013
Academic Editor: Sheng Pan
Copyright © 2013 Jing Wang et al. This is an open access article distributed under the Creative Commons Attribution License,which permits unrestricted use, distribution, and reproduction in any medium, provided the original work is properly cited.
Background. The availability of large complex data sets generated by high throughput technologies has enabled the recentproliferation of disease biomarker studies. However, a recurring problem in deriving biological information from large data sets ishow to best incorporate expert knowledge into the biomarker selection process. Objective. To develop a generalizable frameworkthat can incorporate expert knowledge into data-driven processes in a semiautomatedwaywhile providing ametric for optimizationin a biomarker selection scheme. Methods. The framework was implemented as a pipeline consisting of five components for theidentification of signatures from integrated clustering (ISIC). Expert knowledge was integrated into the biomarker identificationprocess using the combination of two distinct approaches; a distance-based clustering approach and an expert knowledge-drivenfunctional selection. Results. The utility of the developed framework ISIC was demonstrated on proteomics data from a study ofchronic obstructive pulmonary disease (COPD). Biomarker candidates were identified in a mouse model using ISIC and validatedin a study of a human cohort. Conclusions. Expert knowledge can be introduced into a biomarker discovery process in differentways to enhance the robustness of selected marker candidates. Developing strategies for extracting orthogonal and robust featuresfrom large data sets increases the chances of success in biomarker identification.
1. Introduction
An unprecedented opportunity for identification of diseasebiomarker candidates has been provided by the advent of highthroughput technologies in the past decade [1, 2]. The explo-sive growth of large data sets has been overwhelming in termsof the number, size, format, and complexity [3, 4]. Whilediversified data sets have led to numerous opportunities andstudies for discovering new disease marker candidates, thesuccess of those efforts has been largely disappointing interms of validating the results across populations [4].
Current strategies for biomarker discovery tend to focuson one of two approaches: data-driven [5] or expert know-ledge-driven [6]. A data-driven approach makes use of largedata sets to unearth the underlying structures embedded inthe data to facilitate identification of robust features. Thevalue of this purely statistical approach has been evidentin the successful identification of cancer biomarkers, forinstance, using an artificial neural network (ANN) model fordetecting early stage epithelial ovarian cancer with a panelof five serum markers [7]. In contrast, an expert knowledge-driven approach takes advantage of constantly increased
514 Disease Markers
understanding in pathophysiological mechanisms of diseasesat bothmolecular and systems levels to extract discriminatingfeatures of diseases [6]. Despite many intense efforts devotedto the field of biomarker discovery, no robust yet generaliz-able framework has been widely accepted by the community.Recent studies have suggested that integrating data-drivenand knowledge-driven approaches rather than exclusivereliance on either can potentially improve the robustness ofselected biomarker candidates and their performances acrosspopulations. For instance, an empirical Bayes method hasbeen used to combine the information on pathways andnetworks into the experimental results of cancer biology[8]. The idea of integrating experimental measurements andexisting knowledge is rational and appealing. However, manychallenges can be recognized immediately and need to beaddressed properly, such as optimal knowledge databases touse, suitable formats of expert knowledge, reasonable waysto integrate these disparate kinds of data, and appropriateselection strategies.
As one of the leading causes of death worldwide, chronicobstructive pulmonary disease (COPD) is a prevalent con-dition that is characterized by progressive and not fullyreversible airflow limitations [9, 10]. No new classes of drugsforCOPD treatment have been approved for use in theUnitedStates in more than twenty years [11]. Despite associationswith multiple pathological components, one hallmark ofCOPD is a persistent inflammatory state that contributesto a progressive decline in lung function [12]. A mousemodel with adenosine deaminase (Ada) deficiency has beenestablished to develop a rapid pulmonary inflammation andprogressive destruction of lung tissue that closely mimicsmany aspects of human COPD and other chronic lungdiseases [13, 14]. Adenosine is a molecule routinely generatedat sites of inflammation and tissue injury. It is a key signalingmolecule involved in multiple intracellular signaling path-ways related to the modulation of inflammatory responses[15, 16]. Ada is the purine catabolic enzyme responsible forconverting adenosine to inosine, which is frequently inducedin response to cell stress or damage and involved in anti-inflammatory, tissue-protective pathways [16, 17].
Accumulating evidence has suggested that elevatedadenosine levels in lung are associated with chronic lungdiseases in both human and animal models [12, 17]. An in-depth understanding of the biological relevance of Ada inlung will benefit our general understanding of COPD.
In this paper, we describe a semiautomated framework,identification of signatures from integrated clustering (ISIC),for merging data-driven and knowledge-driven approachesinto a biomarker selection scheme in an iterative manner,with a defined metric provided for performance evaluation.To demonstrate ISIC, we applied it to proteomics data setsof bronchoalveolar lavage fluid (BALF) and plasma froma mouse model of COPD, the Ada-deficient mouse model[13, 14], to identifymarker candidates of COPD.The resultingcandidates were subsequently validated in a human plasmadata set from a cohort of low bodymass index (BMI) smokerswith COPD and healthy controls. We believe that ISIC isa novel and powerful tool for integrating data types in the
context of biosignature discovery and show that it producesrobust results between a model system and human disease.
2. Methods
2.1. Animal Samples, Patient Samples, and Proteomics DataCollections. Data from the Ada-deficient mice were used forthe initial biomarker identification [13]. Bronchial secretionsand blood plasma from the Ada −/− and Ada +/−mice wereindividually collected and processed as described previously[15]. Human plasma samples were selected from a largecohort (𝑛 = 467) of the Genetics of Addiction program at theUniversity of UtahMedical School [18]. Plasma samples from7 lowBMI smokers withCOPDand 7 lowBMInever smokers(COPD free) were used for the patient and control samples.All BALF and plasma (mouse and human) samples wereprocessed, tryptic digested, separated, and analyzed using liq-uid chromatography-mass spectrometry (LC-MS). Detailedinformation on animal and human sample collections anddata collection is provided in Supplemental Information,which includes Supplemental Methods, brief descriptionsand rationales of the framework, discussion on COPD datasets used in the current study, Supplemental Figures, Sup-plemental Tables, and References. Supplemental Informationavailable online at http://dx.doi.org/10.1155/2013/613529.
2.2. Processing of Proteomic Data Sets. The peptides wereidentified and quantified using a collection of in-house devel-oped tools that are freely available at http://omics.pnl.gov/.For the mouse data, the peak intensity values of the finalidentified peptides were obtained from the analyses of LC-LTQ-Orbitrap spectral data. The raw peak intensity valueswere processed in theMatLab environment, including qualitycontrol, normalization, protein quantification, and compara-tive statistical analyses [19–21]. The final peptide abundanceswere transformed into the log
10scale for the subsequent data
analyses. Quality control was a process performed to identifyand remove the peptides with an insufficient amount of dataacross the set of samples [20], aswell as to identify and removethe LC-MS data sets that showed significant deviations fromthe standard behaviors of all LC-MS analyses [22].The outlierLC-MS data sets were identified at a significance level of0.0001. The peptides were normalized across all technicalreplicates to ensure the least amount of bias introducedinto the data sets [21]. Specifically, the BALF data werenormalized Using a linear combination of order statisticsto determine a subset of peptides [23] followed by meancentering, and the plasma data were normalized using a rankinvariant peptide subset [21] followed by median centering.The normalized log
10abundance values were averaged across
the technical replicates within each biological sample. Thesubsequent protein quantifications were performed usingthe most abundant reference peptide through an R-Rollupmethod [19, 24]. The human plasma data were processedusing the same protocols for the BALF data, as describedabove.
2.3. Significantly Altered Proteins in Mouse BALF and Plasma.The quantified proteins in BALF and plasma were compared
Disease Markers 515
quantitatively and qualitatively between the time-matchedAda +/− and Ada −/− mice (three in each group) at eachof the five time points, respectively. Quantitative comparisonwas performed using a Dunnett adjusted 𝑡-test to assessthe numeric change in the average abundance of a proteinbetween the two phenotypes at the individual time points.Qualitative comparison (the presence or absence of a pro-tein) was implemented by a 𝐺-test, a modified 𝜒2 test ofindependence, which assessed the associations between thepresence/absence of proteins and the phenotypes of the mice[20]. A significantly altered protein was defined if at least oneof the five 𝑡-tests or five 𝐺-tests was statistically significant(𝑃 < 0.05) after Bonferroni multiple hypothesis correction.All the protein abundances were compared with their time-matched counterparts. To provide sufficient replicates for thesubsequent analyses, we combined the significantly alteredproteins from all five time points and grouped them intoeither disease (Ada −/−) or control (Ada +/−) categories forthe BALF and plasma samples, that is, a sample size of 15micein each of the groups.
2.4. Distance-Based Hierarchical Clustering. All clusteringanalyses using the mouse data were performed on the com-plete data set of significantly altered proteins. Missing valueswere imputed at the protein abundance level using a regular-ized expectation-maximization algorithm [25]. The imputa-tion toolbox is freely available at http://www.clidyn.ethz.ch/imputation/index.html. Three different distance matriceswere calculated.The first was based on the protein expressionprofiles and was calculated as Euclidean distance of theprotein abundances in the log
10scale. The second was based
on the functional relationships between the proteins andwas determined by the semantic dissimilarities in the bio-logical process subontology from the Gene Ontology (GO)[26]. The semantic dissimilarity was defined as 1-semanticsimilarity between protein pairs and calculated using thecross-ontological analysis (XOA) tool [27] or the GOSemSimpackage [28] in the R statistical language. The third onewas the joint distance measure of the previous two. It wascalculated as the weighted average of the other two distanceswith weighting factors of 0.25, 0.50, 0.75, or 1 or the averageof their individual logistic functions [29]. A logistic functionis a common sigmoidal function with equation:
𝑓 (𝑥) =
1
1 + 𝑒
−𝑥, (1)
where 𝑥 is associated with a distance matrix, that is, the firstor second distance. Specifically, 𝑥 is expressed as
𝑥 =
6
](𝛿
𝑎𝑖 ,𝑎𝑗− ]) , (2)
where 𝛿𝑎𝑖 ,𝑎𝑗
is a distance or dissimilarity between two pro-teins, ] is a smooth threshold (chosen as the mean of the dis-tance matrix), and 6/] is a heuristically chosen parameter ofthe slope in our calculation [30]. The averaged logistic func-tion of the two distance matrices was used as a candidate ofthe joint distance measures. The numbers of clusters wereempirically determined as 6 and 12 for the BALF and 6 for
the plasma data sets based on their sample sizes. Ward’sminimum variance linkage was used in all hierarchicalclustering [31].
2.5. Expert Knowledge-Driven Disease Model-Related Func-tional Analysis. A biological function-centric approach wasused to determine the functionally enriched biological pro-cesses in the BALF and plasma samples of mice [32].The bio-logical processes are referred to the terms included in the bio-logical process hierarchy in theGO.The significantly changedproteins in the Ada −/−mice (relative to their controls) weremapped to their corresponding genes and compared with alist of all genes in the mouse genome in order to determinethe levels of significance for individual biological processesin the data using a hypergeometric test. The GO terms withthe enrichment𝑃 values smaller than 10−8 (in bothBALF andplasma) were considered as significantly enriched biologicalprocesses in our data sets [32]. For each enriched GO term,we determined its own level (how specific the term is) and itstop-level ancestor (broadest category that includes the term)within the biological process subontology. The level of a GOterm is the number of steps taken to reach the top-mostnode when ascending the GO tree starting from the term ofinterest. The top-level ancestor of a GO term is the ancestorterm that is directly below the top-most node (“biologicalprocess,” GO ID: 8150). The enriched GO terms were thengrouped according to their top-level ancestors and resultedin a number of biological process groups that were enrichedin the Ada −/−mice.
An expert knowledge-driven disease selection was sub-sequently implemented on the enriched GO terms selectedabove. Specifically, a subset of the enriched terms was furtherselected based on expert knowledge on the Ada-deficientmodel, the 𝑃 values of enrichments, and the levels of the GOterms within individual functional groups, that is, the GOterms sharing the same top-level ancestor(s). Those func-tional clusters with their corresponding proteins were thefinal results of this expert knowledge-driven disease-model-related annotation selection. Each of the clusters was rep-resented by either all differentially expressed proteins or,alternatively, the top three most differentially altered proteinsin the cluster between the two phenotypes for the subsequentanalyses in ISIC.
2.6. Bayesian Integration and Classification. A Bayesian inte-gration approachwas applied on clusters to derive the optimalprobability models for the data sets [33]. Four standard sta-tistical algorithms were applied to the individual clusters (orsubsets) generated from the hierarchical clustering or expertknowledge-driven functional annotation to build likelihoodprobabilitymodels: linear discriminant analysis [34], fuzzy k-nearest neighbor [35], multinomial logistic regression [36],and Naıve Bayes [37]. Classification accuracy (CA) was usedto evaluate the performances of the individual subsets andthe integrations of the multiple subsets of each round of theanalyses. CA is a measure of how well predictions matchwith the actual data. Our approach predicts the disease stateof each animal (Ada −/− or Ada +/−), and so true positives(TP; correct predictions of disease) and negatives (TN)
516 Disease Markers
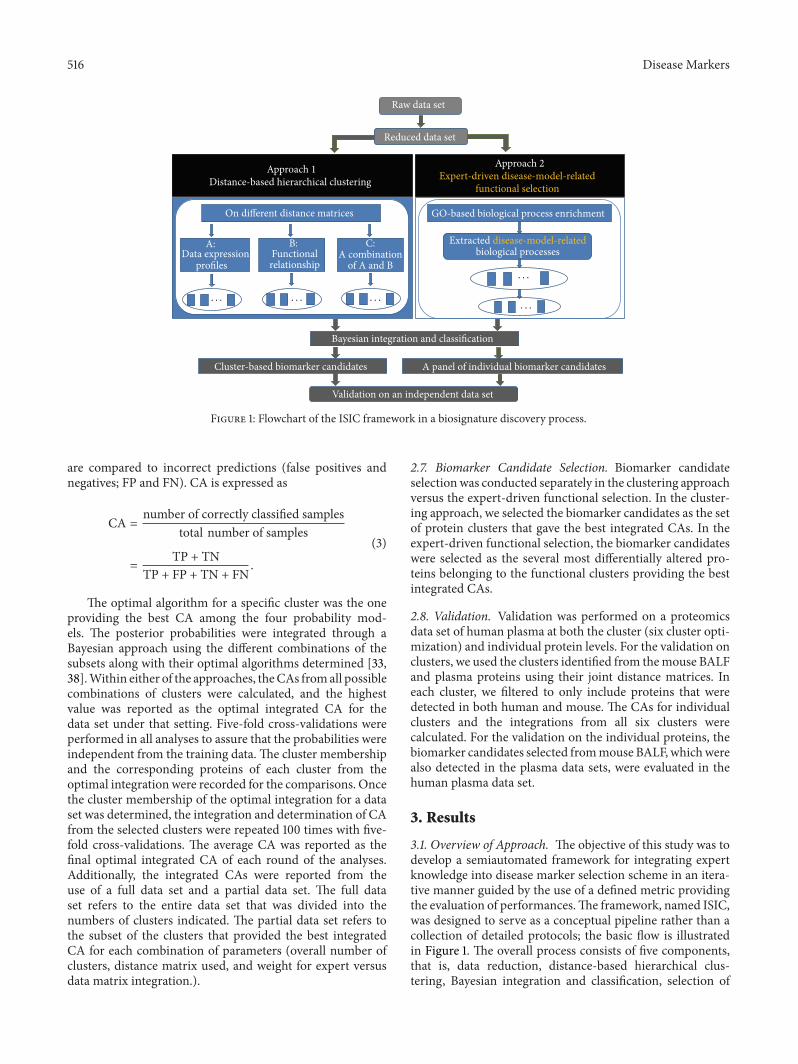
Approach 2Expert-driven disease-model-related
functional selection
GO-based biological process enrichment
Extracted disease-model-related biological processes
Reduced data set
Bayesian integration and classification
Cluster-based biomarker candidates
Validation on an independent data set
Raw data set
A panel of individual biomarker candidates
Approach 1Distance-based hierarchical clustering
On different distance matrices
A: Data expression
profiles
C: A combination
of A and B
B: Functionalrelationship
· · · · · · · · ·
· · ·
· · ·
Figure 1: Flowchart of the ISIC framework in a biosignature discovery process.
are compared to incorrect predictions (false positives andnegatives; FP and FN). CA is expressed as
CA =number of correctly classified samples
total number of samples
=
TP + TNTP + FP + TN + FN
.
(3)
The optimal algorithm for a specific cluster was the oneproviding the best CA among the four probability mod-els. The posterior probabilities were integrated through aBayesian approach using the different combinations of thesubsets along with their optimal algorithms determined [33,38].Within either of the approaches, theCAs fromall possiblecombinations of clusters were calculated, and the highestvalue was reported as the optimal integrated CA for thedata set under that setting. Five-fold cross-validations wereperformed in all analyses to assure that the probabilities wereindependent from the training data. The cluster membershipand the corresponding proteins of each cluster from theoptimal integration were recorded for the comparisons. Oncethe cluster membership of the optimal integration for a dataset was determined, the integration and determination of CAfrom the selected clusters were repeated 100 times with five-fold cross-validations. The average CA was reported as thefinal optimal integrated CA of each round of the analyses.Additionally, the integrated CAs were reported from theuse of a full data set and a partial data set. The full dataset refers to the entire data set that was divided into thenumbers of clusters indicated. The partial data set refers tothe subset of the clusters that provided the best integratedCA for each combination of parameters (overall number ofclusters, distance matrix used, and weight for expert versusdata matrix integration.).
2.7. Biomarker Candidate Selection. Biomarker candidateselectionwas conducted separately in the clustering approachversus the expert-driven functional selection. In the cluster-ing approach, we selected the biomarker candidates as the setof protein clusters that gave the best integrated CAs. In theexpert-driven functional selection, the biomarker candidateswere selected as the several most differentially altered pro-teins belonging to the functional clusters providing the bestintegrated CAs.
2.8. Validation. Validation was performed on a proteomicsdata set of human plasma at both the cluster (six cluster opti-mization) and individual protein levels. For the validation onclusters, we used the clusters identified from themouse BALFand plasma proteins using their joint distance matrices. Ineach cluster, we filtered to only include proteins that weredetected in both human and mouse. The CAs for individualclusters and the integrations from all six clusters werecalculated. For the validation on the individual proteins, thebiomarker candidates selected frommouse BALF, whichwerealso detected in the plasma data sets, were evaluated in thehuman plasma data set.
3. Results
3.1. Overview of Approach. The objective of this study was todevelop a semiautomated framework for integrating expertknowledge into disease marker selection scheme in an itera-tive manner guided by the use of a defined metric providingthe evaluation of performances.The framework, named ISIC,was designed to serve as a conceptual pipeline rather than acollection of detailed protocols; the basic flow is illustratedin Figure 1. The overall process consists of five components,that is, data reduction, distance-based hierarchical clus-tering, Bayesian integration and classification, selection of
Disease Markers 517
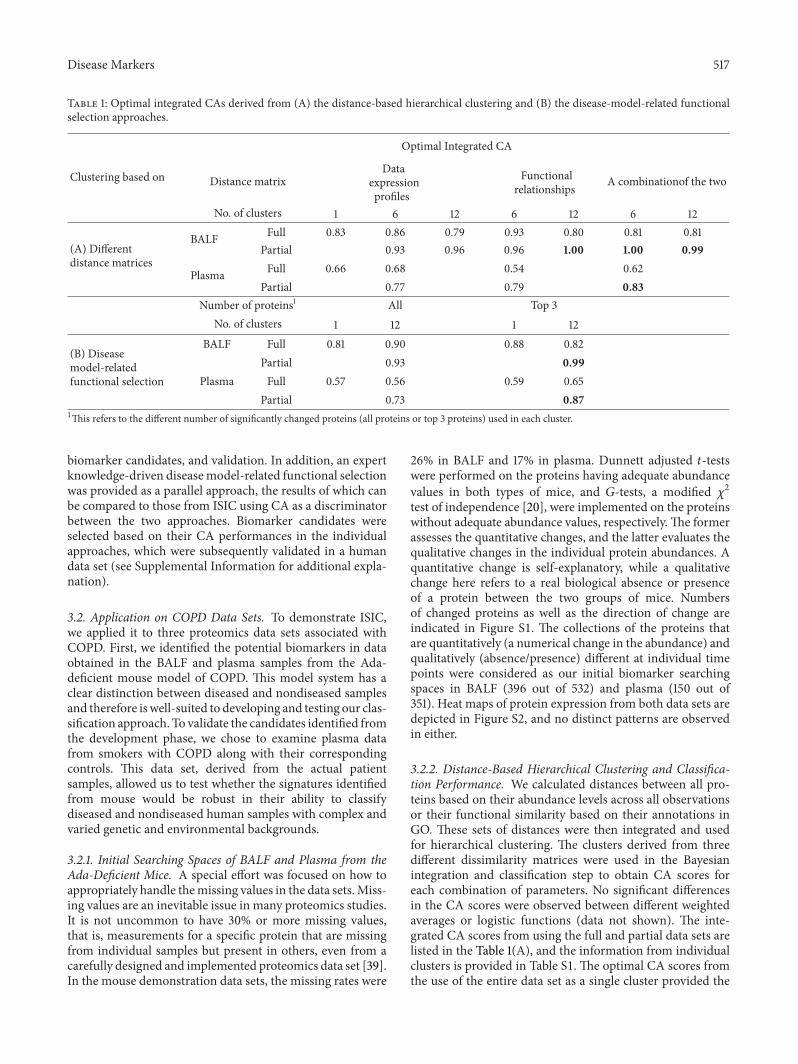
Table 1: Optimal integrated CAs derived from (A) the distance-based hierarchical clustering and (B) the disease-model-related functionalselection approaches.
Clustering based on
Optimal Integrated CA
Distance matrixData
expressionprofiles
Functionalrelationships A combinationof the two
No. of clusters 1 6 12 6 12 6 12
(A) Differentdistance matrices
BALF Full 0.83 0.86 0.79 0.93 0.80 0.81 0.81Partial 0.93 0.96 0.96 1.00 1.00 0.99
Plasma Full 0.66 0.68 0.54 0.62Partial 0.77 0.79 0.83
Number of proteins1 All Top 3No. of clusters 1 12 1 12
(B) Diseasemodel-relatedfunctional selection
BALF Full 0.81 0.90 0.88 0.82Partial 0.93 0.99
Plasma Full 0.57 0.56 0.59 0.65Partial 0.73 0.87
1This refers to the different number of significantly changed proteins (all proteins or top 3 proteins) used in each cluster.
biomarker candidates, and validation. In addition, an expertknowledge-driven diseasemodel-related functional selectionwas provided as a parallel approach, the results of which canbe compared to those from ISIC using CA as a discriminatorbetween the two approaches. Biomarker candidates wereselected based on their CA performances in the individualapproaches, which were subsequently validated in a humandata set (see Supplemental Information for additional expla-nation).
3.2. Application on COPD Data Sets. To demonstrate ISIC,we applied it to three proteomics data sets associated withCOPD. First, we identified the potential biomarkers in dataobtained in the BALF and plasma samples from the Ada-deficient mouse model of COPD. This model system has aclear distinction between diseased and nondiseased samplesand therefore iswell-suited to developing and testing our clas-sification approach. To validate the candidates identified fromthe development phase, we chose to examine plasma datafrom smokers with COPD along with their correspondingcontrols. This data set, derived from the actual patientsamples, allowed us to test whether the signatures identifiedfrom mouse would be robust in their ability to classifydiseased and nondiseased human samples with complex andvaried genetic and environmental backgrounds.
3.2.1. Initial Searching Spaces of BALF and Plasma from theAda-Deficient Mice. A special effort was focused on how toappropriately handle themissing values in the data sets.Miss-ing values are an inevitable issue in many proteomics studies.It is not uncommon to have 30% or more missing values,that is, measurements for a specific protein that are missingfrom individual samples but present in others, even from acarefully designed and implemented proteomics data set [39].In the mouse demonstration data sets, the missing rates were
26% in BALF and 17% in plasma. Dunnett adjusted 𝑡-testswere performed on the proteins having adequate abundancevalues in both types of mice, and 𝐺-tests, a modified 𝜒2test of independence [20], were implemented on the proteinswithout adequate abundance values, respectively. The formerassesses the quantitative changes, and the latter evaluates thequalitative changes in the individual protein abundances. Aquantitative change is self-explanatory, while a qualitativechange here refers to a real biological absence or presenceof a protein between the two groups of mice. Numbersof changed proteins as well as the direction of change areindicated in Figure S1. The collections of the proteins thatare quantitatively (a numerical change in the abundance) andqualitatively (absence/presence) different at individual timepoints were considered as our initial biomarker searchingspaces in BALF (396 out of 532) and plasma (150 out of351). Heat maps of protein expression from both data sets aredepicted in Figure S2, and no distinct patterns are observedin either.
3.2.2. Distance-Based Hierarchical Clustering and Classifica-tion Performance. We calculated distances between all pro-teins based on their abundance levels across all observationsor their functional similarity based on their annotations inGO. These sets of distances were then integrated and usedfor hierarchical clustering. The clusters derived from threedifferent dissimilarity matrices were used in the Bayesianintegration and classification step to obtain CA scores foreach combination of parameters. No significant differencesin the CA scores were observed between different weightedaverages or logistic functions (data not shown). The inte-grated CA scores from using the full and partial data sets arelisted in the Table 1(A), and the information from individualclusters is provided in Table S1. The optimal CA scores fromthe use of the entire data set as a single cluster provided the
518 Disease Markers
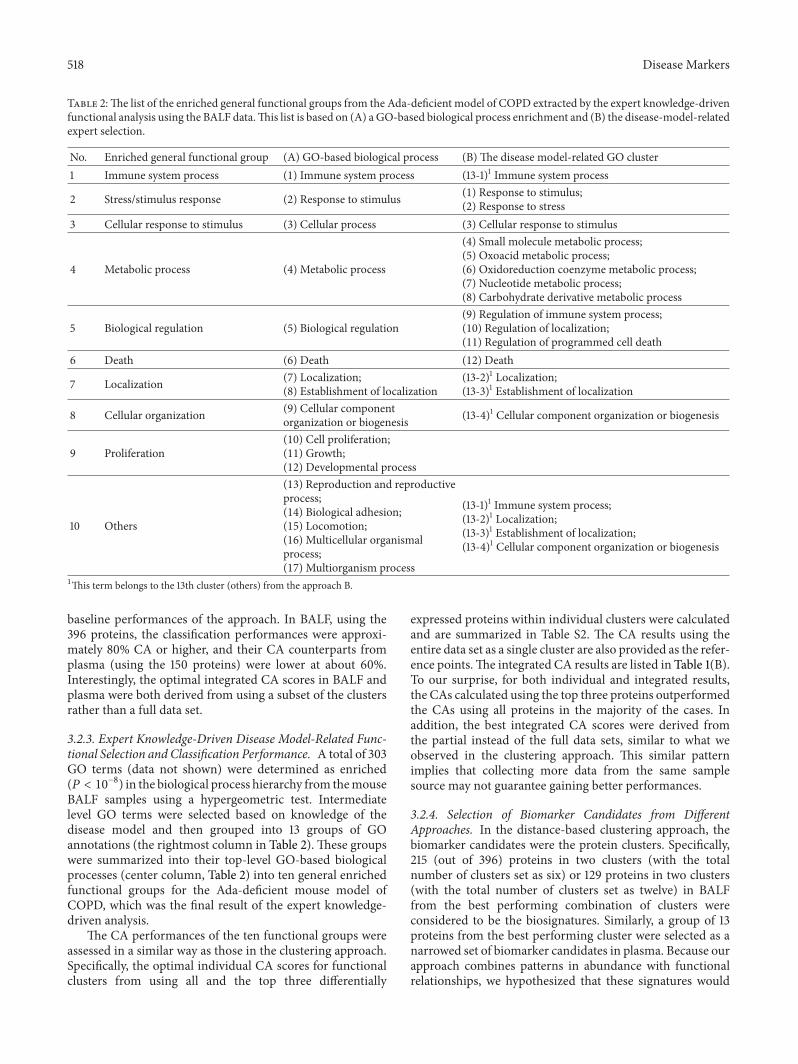
Table 2:The list of the enriched general functional groups from the Ada-deficient model of COPD extracted by the expert knowledge-drivenfunctional analysis using the BALF data.This list is based on (A) a GO-based biological process enrichment and (B) the disease-model-relatedexpert selection.
No. Enriched general functional group (A) GO-based biological process (B) The disease model-related GO cluster1 Immune system process (1) Immune system process (13-1)1 Immune system process
2 Stress/stimulus response (2) Response to stimulus (1) Response to stimulus;(2) Response to stress
3 Cellular response to stimulus (3) Cellular process (3) Cellular response to stimulus
4 Metabolic process (4)Metabolic process
(4) Small molecule metabolic process;(5) Oxoacid metabolic process;(6) Oxidoreduction coenzyme metabolic process;(7) Nucleotide metabolic process;(8) Carbohydrate derivative metabolic process
5 Biological regulation (5) Biological regulation(9) Regulation of immune system process;(10) Regulation of localization;(11) Regulation of programmed cell death
6 Death (6) Death (12) Death
7 Localization (7) Localization;(8) Establishment of localization
(13-2)1 Localization;(13-3)1 Establishment of localization
8 Cellular organization (9) Cellular componentorganization or biogenesis (13-4)1 Cellular component organization or biogenesis
9 Proliferation(10) Cell proliferation;(11) Growth;(12) Developmental process
10 Others
(13) Reproduction and reproductiveprocess;(14) Biological adhesion;(15) Locomotion;(16)Multicellular organismalprocess;(17)Multiorganism process
(13-1)1 Immune system process;(13-2)1 Localization;(13-3)1 Establishment of localization;(13-4)1 Cellular component organization or biogenesis
1This term belongs to the 13th cluster (others) from the approach B.
baseline performances of the approach. In BALF, using the396 proteins, the classification performances were approxi-mately 80% CA or higher, and their CA counterparts fromplasma (using the 150 proteins) were lower at about 60%.Interestingly, the optimal integrated CA scores in BALF andplasma were both derived from using a subset of the clustersrather than a full data set.
3.2.3. Expert Knowledge-Driven Disease Model-Related Func-tional Selection and Classification Performance. A total of 303GO terms (data not shown) were determined as enriched(𝑃 < 10
−8) in the biological process hierarchy from themouse
BALF samples using a hypergeometric test. Intermediatelevel GO terms were selected based on knowledge of thedisease model and then grouped into 13 groups of GOannotations (the rightmost column in Table 2). These groupswere summarized into their top-level GO-based biologicalprocesses (center column, Table 2) into ten general enrichedfunctional groups for the Ada-deficient mouse model ofCOPD, which was the final result of the expert knowledge-driven analysis.
The CA performances of the ten functional groups wereassessed in a similar way as those in the clustering approach.Specifically, the optimal individual CA scores for functionalclusters from using all and the top three differentially
expressed proteins within individual clusters were calculatedand are summarized in Table S2. The CA results using theentire data set as a single cluster are also provided as the refer-ence points.The integrated CA results are listed in Table 1(B).To our surprise, for both individual and integrated results,the CAs calculated using the top three proteins outperformedthe CAs using all proteins in the majority of the cases. Inaddition, the best integrated CA scores were derived fromthe partial instead of the full data sets, similar to what weobserved in the clustering approach. This similar patternimplies that collecting more data from the same samplesource may not guarantee gaining better performances.
3.2.4. Selection of Biomarker Candidates from DifferentApproaches. In the distance-based clustering approach, thebiomarker candidates were the protein clusters. Specifically,215 (out of 396) proteins in two clusters (with the totalnumber of clusters set as six) or 129 proteins in two clusters(with the total number of clusters set as twelve) in BALFfrom the best performing combination of clusters wereconsidered to be the biosignatures. Similarly, a group of 13proteins from the best performing cluster were selected as anarrowed set of biomarker candidates in plasma. Because ourapproach combines patterns in abundance with functionalrelationships, we hypothesized that these signatures would
Disease Markers 519
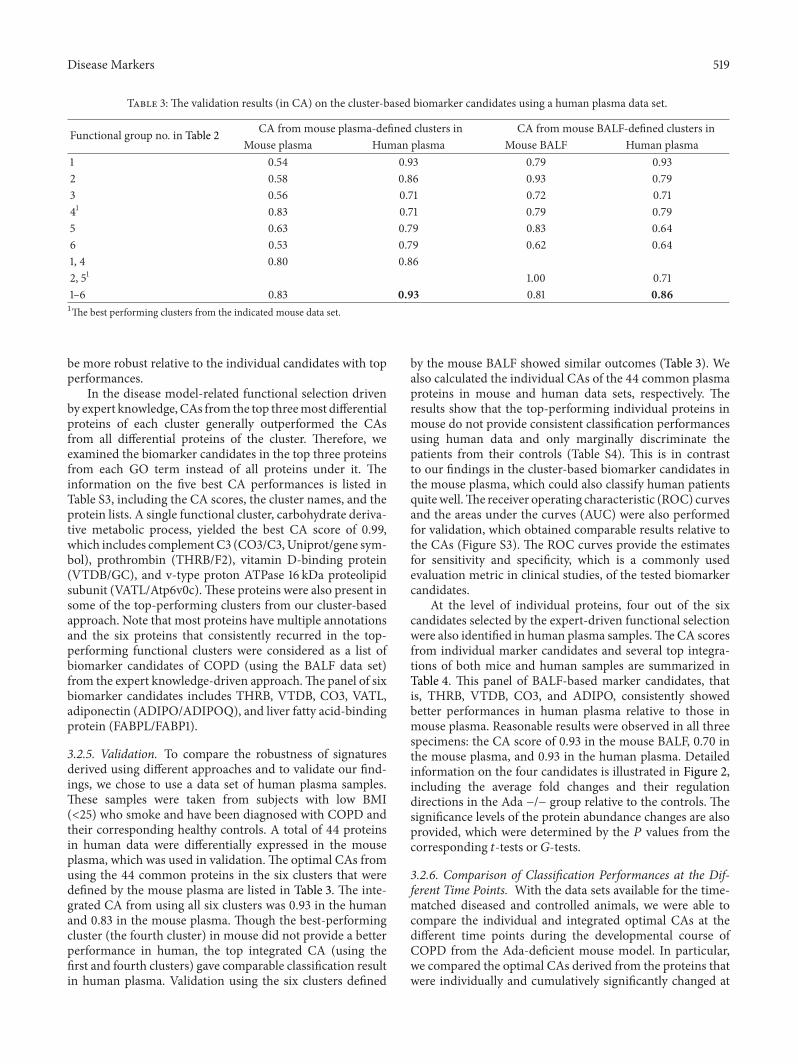
Table 3: The validation results (in CA) on the cluster-based biomarker candidates using a human plasma data set.
Functional group no. in Table 2 CA from mouse plasma-defined clusters in CA from mouse BALF-defined clusters inMouse plasma Human plasma Mouse BALF Human plasma
1 0.54 0.93 0.79 0.932 0.58 0.86 0.93 0.793 0.56 0.71 0.72 0.7141 0.83 0.71 0.79 0.795 0.63 0.79 0.83 0.646 0.53 0.79 0.62 0.641, 4 0.80 0.862, 51 1.00 0.711–6 0.83 0.93 0.81 0.861The best performing clusters from the indicated mouse data set.
be more robust relative to the individual candidates with topperformances.
In the disease model-related functional selection drivenby expert knowledge, CAs from the top threemost differentialproteins of each cluster generally outperformed the CAsfrom all differential proteins of the cluster. Therefore, weexamined the biomarker candidates in the top three proteinsfrom each GO term instead of all proteins under it. Theinformation on the five best CA performances is listed inTable S3, including the CA scores, the cluster names, and theprotein lists. A single functional cluster, carbohydrate deriva-tive metabolic process, yielded the best CA score of 0.99,which includes complement C3 (CO3/C3,Uniprot/gene sym-bol), prothrombin (THRB/F2), vitamin D-binding protein(VTDB/GC), and v-type proton ATPase 16 kDa proteolipidsubunit (VATL/Atp6v0c).These proteins were also present insome of the top-performing clusters from our cluster-basedapproach. Note that most proteins have multiple annotationsand the six proteins that consistently recurred in the top-performing functional clusters were considered as a list ofbiomarker candidates of COPD (using the BALF data set)from the expert knowledge-driven approach.The panel of sixbiomarker candidates includes THRB, VTDB, CO3, VATL,adiponectin (ADIPO/ADIPOQ), and liver fatty acid-bindingprotein (FABPL/FABP1).
3.2.5. Validation. To compare the robustness of signaturesderived using different approaches and to validate our find-ings, we chose to use a data set of human plasma samples.These samples were taken from subjects with low BMI(<25) who smoke and have been diagnosed with COPD andtheir corresponding healthy controls. A total of 44 proteinsin human data were differentially expressed in the mouseplasma, which was used in validation.The optimal CAs fromusing the 44 common proteins in the six clusters that weredefined by the mouse plasma are listed in Table 3. The inte-grated CA from using all six clusters was 0.93 in the humanand 0.83 in the mouse plasma. Though the best-performingcluster (the fourth cluster) in mouse did not provide a betterperformance in human, the top integrated CA (using thefirst and fourth clusters) gave comparable classification resultin human plasma. Validation using the six clusters defined
by the mouse BALF showed similar outcomes (Table 3). Wealso calculated the individual CAs of the 44 common plasmaproteins in mouse and human data sets, respectively. Theresults show that the top-performing individual proteins inmouse do not provide consistent classification performancesusing human data and only marginally discriminate thepatients from their controls (Table S4). This is in contrastto our findings in the cluster-based biomarker candidates inthe mouse plasma, which could also classify human patientsquitewell.The receiver operating characteristic (ROC) curvesand the areas under the curves (AUC) were also performedfor validation, which obtained comparable results relative tothe CAs (Figure S3). The ROC curves provide the estimatesfor sensitivity and specificity, which is a commonly usedevaluation metric in clinical studies, of the tested biomarkercandidates.
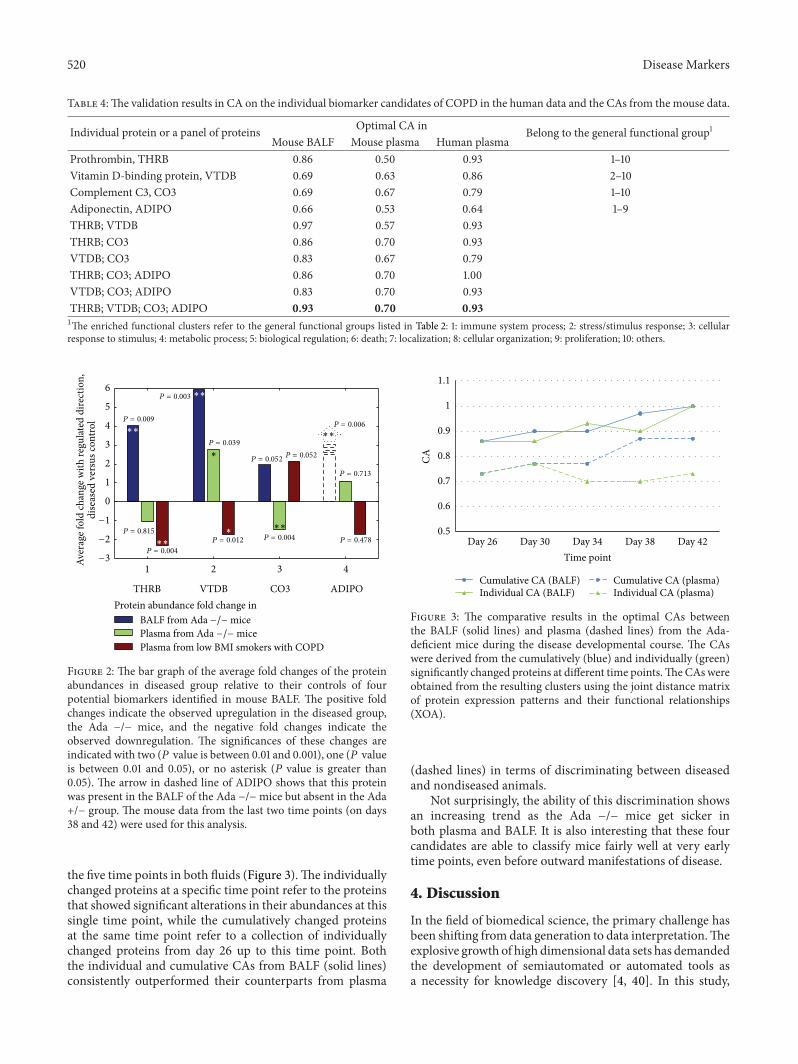
At the level of individual proteins, four out of the sixcandidates selected by the expert-driven functional selectionwere also identified in human plasma samples.TheCA scoresfrom individual marker candidates and several top integra-tions of both mice and human samples are summarized inTable 4. This panel of BALF-based marker candidates, thatis, THRB, VTDB, CO3, and ADIPO, consistently showedbetter performances in human plasma relative to those inmouse plasma. Reasonable results were observed in all threespecimens: the CA score of 0.93 in the mouse BALF, 0.70 inthe mouse plasma, and 0.93 in the human plasma. Detailedinformation on the four candidates is illustrated in Figure 2,including the average fold changes and their regulationdirections in the Ada −/− group relative to the controls. Thesignificance levels of the protein abundance changes are alsoprovided, which were determined by the 𝑃 values from thecorresponding 𝑡-tests or 𝐺-tests.
3.2.6. Comparison of Classification Performances at the Dif-ferent Time Points. With the data sets available for the time-matched diseased and controlled animals, we were able tocompare the individual and integrated optimal CAs at thedifferent time points during the developmental course ofCOPD from the Ada-deficient mouse model. In particular,we compared the optimal CAs derived from the proteins thatwere individually and cumulatively significantly changed at
520 Disease Markers
Table 4:The validation results in CA on the individual biomarker candidates of COPD in the human data and the CAs from the mouse data.
Individual protein or a panel of proteins Optimal CA in Belong to the general functional group1Mouse BALF Mouse plasma Human plasma
Prothrombin, THRB 0.86 0.50 0.93 1–10Vitamin D-binding protein, VTDB 0.69 0.63 0.86 2–10Complement C3, CO3 0.69 0.67 0.79 1–10Adiponectin, ADIPO 0.66 0.53 0.64 1–9THRB; VTDB 0.97 0.57 0.93THRB; CO3 0.86 0.70 0.93VTDB; CO3 0.83 0.67 0.79THRB; CO3; ADIPO 0.86 0.70 1.00VTDB; CO3; ADIPO 0.83 0.70 0.93THRB; VTDB; CO3; ADIPO 0.93 0.70 0.931The enriched functional clusters refer to the general functional groups listed in Table 2: 1: immune system process; 2: stress/stimulus response; 3: cellularresponse to stimulus; 4: metabolic process; 5: biological regulation; 6: death; 7: localization; 8: cellular organization; 9: proliferation; 10: others.
1 2 3 4
THRB VTDB CO3 ADIPOProtein abundance fold change in
−3
−2
−1
0
1
2
3
4
5
6
Aver
age f
old
chan
ge w
ith re
gulat
ed d
irect
ion,
dise
ased
ver
sus c
ontro
l P = 0.009
P = 0.815
P = 0.003
P = 0.039
P = 0.052
P = 0.004
P = 0.004
P = 0.713
P = 0.006
P = 0.478P = 0.012
P = 0.052∗
∗
∗∗
∗∗
∗∗
∗∗
∗∗
Plasma from low BMI smokers with COPD
BALF from Ada −/− micePlasma from Ada −/− mice
Figure 2: The bar graph of the average fold changes of the proteinabundances in diseased group relative to their controls of fourpotential biomarkers identified in mouse BALF. The positive foldchanges indicate the observed upregulation in the diseased group,the Ada −/− mice, and the negative fold changes indicate theobserved downregulation. The significances of these changes areindicated with two (𝑃 value is between 0.01 and 0.001), one (𝑃 valueis between 0.01 and 0.05), or no asterisk (𝑃 value is greater than0.05). The arrow in dashed line of ADIPO shows that this proteinwas present in the BALF of the Ada −/−mice but absent in the Ada+/− group. The mouse data from the last two time points (on days38 and 42) were used for this analysis.
the five time points in both fluids (Figure 3).The individuallychanged proteins at a specific time point refer to the proteinsthat showed significant alterations in their abundances at thissingle time point, while the cumulatively changed proteinsat the same time point refer to a collection of individuallychanged proteins from day 26 up to this time point. Boththe individual and cumulative CAs from BALF (solid lines)consistently outperformed their counterparts from plasma
0.5
0.6
0.7
0.8
0.9
1
1.1
Day 26 Day 30 Day 34 Day 38 Day 42
CA
Time point
Cumulative CA (BALF) Cumulative CA (plasma)Individual CA (BALF) Individual CA (plasma)
Figure 3: The comparative results in the optimal CAs betweenthe BALF (solid lines) and plasma (dashed lines) from the Ada-deficient mice during the disease developmental course. The CAswere derived from the cumulatively (blue) and individually (green)significantly changed proteins at different time points.TheCAswereobtained from the resulting clusters using the joint distance matrixof protein expression patterns and their functional relationships(XOA).
(dashed lines) in terms of discriminating between diseasedand nondiseased animals.
Not surprisingly, the ability of this discrimination showsan increasing trend as the Ada −/− mice get sicker inboth plasma and BALF. It is also interesting that these fourcandidates are able to classify mice fairly well at very earlytime points, even before outward manifestations of disease.
4. Discussion
In the field of biomedical science, the primary challenge hasbeen shifting from data generation to data interpretation.Theexplosive growth of high dimensional data sets has demandedthe development of semiautomated or automated tools asa necessity for knowledge discovery [4, 40]. In this study,
Disease Markers 521
we introduced the ISIC as a framework that is designed forintegrating experimental measurements and expert knowl-edge into disease marker identification in a semiautomatedmanner. One main merit of the ISIC lies in the mannerof integration, which simultaneously combines data- andknowledge-driven information into a quantitative format. Apipeline was assembled accordingly and demonstrated onseveral proteomics data sets of COPD to identify biomarkercandidates of COPD.
The focus of the semiautomated clustering approach is toseparate the initial marker searching candidates, that is, thedifferentially expressed proteins in the data sets, into severaldifferent groups that contain features with similar expres-sion patterns and functionalities within groups. In contrast,the expert-driven functional selection may be somewhatsubjective; however, it can be an efficient way to extracta handful of biomarker candidates with the incorporationof proper knowledge. The classification performances ofthis demonstration of COPD data sets on both approachesobtained comparable results that were both quite good. It isalso worth mentioning that our intention here is to illustratethe individual merits and weaknesses of both approachesin the biomarker selection schemes in order to gain insighton how to comprehensively and efficiently extract valuableinformation from data sets.
Biomarker identification is a process to select a limitednumber of biomolecules that convey the essential biologicalinformation distinguishing a disease state from a nondiseasestate. In the clustering approach, our results show that ourcluster-based biomarkers are much more robust in theirability to classify human patients than the individual proteins.A possible explanation is that features in clusters may capturemore consistent and comprehensive information from datarelative to the individual proteins. We are currently workingto include an extra step of feature selection, which willrigorously identify subsets of proteins with optimal CAs, tofocus smaller biomarker sets.
We found that small sets of proteins could be selectedwith good performance using our expert knowledge-drivenapproach.The biomarker candidates selected in this way havea subjective component but also can potentially filter out thelow quality markers identified from pure statistical processes.Another limitation of expert-driven strategy is that not allgene or gene products have annotations, which eliminates thepossibilities for exploring the functional relationships amongthem in the currently available knowledge databases.
One noticeable consistency of the two approaches is thatall the optimal classification performances, indicated by theoptimal integrated CAs, resulted from using partial instead ofthe full data sets (Table 2).This trendwas particularly strikingwhenusing the top-threemost differentially changedproteinsto represent the individual GO terms in clusters defined bythe expert-knowledge driven functional selection (Table S2).This indicates that simply using more data collected from thesame data source does not guarantee improved performanceand that redundant informationmost likely is included in theadditional data.
As previously emphasized, ISIC is intended to be con-ceptual as well as flexible. The five components function
independently and collaboratively. Each component servesits distinct functionality and is implemented at a differentstage in the biomarker discovery process. The independencebetween them makes it easy to tailor individual compart-ments for specific data sets or to substitute using othermethods with similar functions. The data reduction largelyis a data-dependent process. As a means to group similardata into clusters based on a similarity criterion, the distance-based hierarchical clustering can also be achieved by othergroupingmechanisms, such as k-means, self-organizedmaps,and fuzzy clustering [41]. In the model integration portion,Bayesian integration can be replaced with a support vectormachine [42, 43], decision trees and random forests [44, 45],and artificial neural networks [2], which have been applied inmany types of data integration [4]. In terms of performanceevaluation, CA was chosen mainly due to its suitability incases with more than two categories. An ROC curve and themeasurement of AUC [46] as well as recall and precision[47] are both reasonable substitutions for the CA but mostlylimited to cases with binary responses.
In conclusion, we describe a generalizable frameworkfor integrating expert knowledge into processes of dis-ease biomarker discovery. Our framework, ISIC, consists ofseveral independent and collaborative components and isflexible enough to accommodate addition, subtraction, andmodification of analyses. The integration of data-driven andknowledge-driven information is used in a distance-basedclustering approach in a semiautomated manner. An expert-driven functional selection approach was also performed toselect individual proteins for comparison to our automatedapproach. We identified signatures in a mouse model ofCOPD and subsequently validated them in a human cohort,where they demonstrated a comparable accuracy in discrim-inating patients with COPD from those without COPD.Thiswas in contrast to standard approaches to identify biomarkersin the mouse model, which were not robust in the humancohort. We believe that ISIC represents a generalizableplatform for identification of robust biosignatures fromintegrated data sources.
Acknowledgments
The authors would like to thank Dr. Harish Shankaran forhis help in the functional enrichment analysis. This studywas supported by the Signatures Discovery Initiative, acomponent of the Laboratory Directed Research and Devel-opment Program at Pacific Northwest National Laboratory,a multiprogram national laboratory operated by Battelle forthe U.S. Department of Energy under Contract DE-AC05-76RL01830. The proteomics measurements were conductedin the Proteomics Facility at the Environmental MolecularSciences Laboratory, a DOE BER national scientific userfacility at Pacific Northwest National Laboratory (PNNL)in Richland, WA. Support was also received from the Pul-monary Systems Biology Initiative of the Battelle MemorialInstitute. The work on the patient samples was supportedby funds from National Institutes of Health (NIEHS) (GrantU54-ES016015).
522 Disease Markers
References
[1] D.Ghosh andL.M. Poisson, “‘Omics’ data and levels of evidencefor biomarker discovery,” Genomics, vol. 93, no. 1, pp. 13–16,2009.
[2] B. P. Bradley, “Finding biomarkers is getting easier,” Ecotoxicol-ogy, vol. 21, no. 3, pp. 631–636.
[3] Z. Feng, R. Prentice, and S. Srivastava, “Research issues andstrategies for genomic and proteomic biomarker discovery andvalidation: a statistical perspective,” Pharmacogenomics, vol. 5,no. 6, pp. 709–719, 2004.
[4] J. E. McDermott, J. Wang, H. D. Mitchell et al., “Challenges inbiomarker discovery: combining expert insights with statisticalanalysis of complex omics data,” Expert Opinion on MedicalDiagnostics, vol. 7, no. 1, pp. 37–51, 2013.
[5] T. Wei, B. Liao, L. Ackermann et al., “Data-driven analysisapproach for biomarker discovery using molecular-profilingtechnologies,” Biomarkers, vol. 10, no. 2-3, pp. 153–172, 2005.
[6] L. Chen, C.Wang, I.-M. Shih et al., “Biomarker identification byknowledge-driven multi-level ICA and motif analysis,” in Pro-ceedings of the 6th International Conference onMachine Learningand Applications (ICMLA ’07), pp. 560–566, December 2007.
[7] Z. Zhang, Y. Yu, F. Xu et al., “Combining multiple serum tumormarkers improves detection of stage I epithelial ovarian cancer,”Gynecologic Oncology, vol. 107, no. 3, pp. 526–531, 2007.
[8] S. M. Hill, R. M. Neve, N. Bayani et al., “Integrating biologicalknowledge into variable selection: an empirical Bayes approachwith an application in cancer biology,” BMC Bioinformatics, vol.13, article 94, pp. 94–109, 2012.
[9] D. L. Hoyert, K. D. Kochanek, and S. L. Murphy, “Deaths: finaldata for 1997,”National Vital Statistics Reports, vol. 47, no. 19, pp.1–104, 1999.
[10] A. D. Lopez and C. C. Murray, “The global burden of disease,1990–2020,” Nature Medicine, vol. 4, no. 11, pp. 1241–1243, 1998.
[11] S. R. Rosenberg andR. Kalhan, “Biomarkers in chronic obstruc-tive pulmonary disease,” Translational Research, vol. 159, no. 4,pp. 228–237, 2012.
[12] Y. Zhou, D. J. Schneider, and M. R. Blackburn, “Adenosinesignaling and the regulation of chronic lung disease,” Pharma-cology andTherapeutics, vol. 123, no. 1, pp. 105–116, 2009.
[13] M. R. Blackburn, S. K. Datta, and R. E. Kellems, “Adenosinedeaminase-deficient mice generated using a two-stage geneticengineering strategy exhibit a combined immunodeficiency,”Journal of Biological Chemistry, vol. 273, no. 9, pp. 5093–5100,1998.
[14] H. Zhong, J. L. Chunn, J. B. Volmer, J. R. Fozard, and M.R. Blackburn, “Adenosine-mediated mast cell degranulation inadenosine deaminase-deficient mice,” Journal of Pharmacologyand Experimental Therapeutics, vol. 298, no. 2, pp. 433–440,2001.
[15] M. R. Blackburn, J. B. Volmer, J. L. Thrasher et al., “Metabolicconsequences of adenosine deaminase deficiency in mice areassociated with defects in alveogenesis, pulmonary inflamma-tion, and airway obstruction,” Journal of ExperimentalMedicine,vol. 192, no. 2, pp. 159–170, 2000.
[16] M. R. Blackburn, C. G. Lee, H. W. Young et al., “Adenosinemediates IL-13-induced inflammation and remodeling in thelung and interacts in an IL-13-adenosine amplification path-way,” Journal of Clinical Investigation, vol. 112, no. 3, pp. 332–344,2003.
[17] A. V. Sauer, I. Brigida, N. Carriglio et al., “Autoimmune dys-regulation and purine metabolism in adenosine deaminasedeficiency,” Frontiers in Immunology, vol. 3, pp. 1–19, 2012.
[18] H. Jin, B.-J. Webb-Robertson, E. S. Peterson et al., “Smoking,COPD, and 3-nitrotyrosine levels of plasma proteins,” Environ-mental Health Perspectives, vol. 119, no. 9, pp. 1314–1320, 2011.
[19] M. M. Matzke, J. N. Brown, M. A. Gritsenko et al., “A compar-ative analysis of computational approaches to relative proteinquantification using peptide peak intensities in label-free LC-MS proteomics experiments,” Proteomics, vol. 13, no. 3-4, pp.493–503, 2013.
[20] B.-J. M. Webb-Robertson, L. A. McCue, K. M. Waters et al.,“Combined statistical analyses of peptide intensities and pep-tide occurrences improves identification of significant peptidesfromMS-based proteomics data,” Journal of Proteome Research,vol. 9, no. 11, pp. 5748–5756, 2010.
[21] B.-J. M. Webb-Robertson, M. M. Matzke, J. M. Jacobs, J. G.Pounds, and K. M. Waters, “A statistical selection strategy fornormalization procedures in LC-MS proteomics experimentsthrough dataset-dependent ranking of normalization scalingfactors,” Proteomics, vol. 11, no. 24, pp. 4736–4741, 2011.
[22] M.M.Matzke, K.M.Waters, T. O.Metz et al., “Improved qualitycontrol processing of peptide-centric LC-MS proteomics data,”Bioinformatics, vol. 27, no. 20, Article ID btr479, pp. 2866–2872,2011.
[23] P. Wang, H. Tang, H. Zhang, J. Whiteaker, A. G. Paulovich, andM. Mcintosh, “Normalization regarding non-random missingvalues in high-throughput mass spectrometry data,” PacificSymposium on Biocomputing, pp. 315–326, 2006.
[24] A. D. Polpitiya, W.-J. Qian, N. Jaitly et al., “DAnTE: A statisticaltool for quantitative analysis of -omics data,”Bioinformatics, vol.24, no. 13, pp. 1556–1558, 2008.
[25] T. Schneider, “Analysis of incomplete climate data: estimation ofmean values and covariancematrices and imputation ofmissingvalues,” Journal of Climate, vol. 14, no. 5, pp. 853–871, 2001.
[26] M. Ashburner, C. A. Ball, J. A. Blake et al., “Gene ontology: toolfor the unification of biology.TheGene Ontology Consortium,”Nature Genetics, vol. 25, no. 1, pp. 25–29, 2000.
[27] C. Posse, A. Sanfilippo, B. Gopalan et al., “Cross-ontologicalanalytics: combining associative and hierarchical relations inthe gene ontologies to assess gene product similarity,” inComputational Science, Lecture Notes in Computer Science, pp.871–878, 2006.
[28] G. Yu, F. Li, Y. Qin, X. Bo, Y. Wu, and S. Wang, “GOSemSim: anR package for measuring semantic similarity among GO termsand gene products,” Bioinformatics, vol. 26, no. 7, Article IDbtq064, pp. 976–978, 2010.
[29] D. H. von Seggern, CRC Standard Curves and Surfaces WithMathematica, Applied Mathematics & Nonlinear Science,Chapman and Hall/CRC, London, UK, 2nd edition, 2006.
[30] D. Hanisch, A. Zien, R. Zimmer, and T. Lengauer, “Co-clustering of biological networks and gene expression data,”Bioinformatics, vol. 18, supplement 1, pp. S145–S154, 2002.
[31] J. H. Ward, “Hierarchical grouping to optimize an objectivefunction,” Journal of the American Statistical Association, vol. 58,no. 301, pp. 236–244, 1963.
[32] J. E. McDermott, H. Shankaran, A. J. Eisfeld et al., “Conservedhost response to highly pathogenic avian influenza virus infec-tion in human cell culture,mouse andmacaquemodel systems,”BMC Systems Biology, vol. 5, article 190, pp. 190–212, 2011.
Disease Markers 523
[33] B.-J. M. Webb-Robertson, L. A. McCue, N. Beagley et al., “ABayesian integrationmodel of high-throughput proteomics andmetabolomics data for improved early detection of microbialinfections,” Pacific Symposium on Biocomputing, pp. 451–463,2009.
[34] M. Ahdesmaki and K. Strimmer, “Feature selection in omicsprediction problems using cat scores and false nondiscoveryrate control,” Annals of Applied Statistics, vol. 4, no. 1, pp. 503–519, 2010.
[35] A. F. Atiya, “Estimating the posterior probabilities using the K-nearest neighbor rule,” Neural Computation, vol. 17, no. 3, pp.731–740, 2005.
[36] P. MacCullagh and J. A. Nelder, Generalized Linear Models,Monographs on Statistics and Applied Probability, Chapmanand Hall/CRC, London, UK, 1989.
[37] T. Mitchell, B. Buchanan, G. Dejong et al., “Machine learning,”Annual Review of Computer Science, vol. 4, pp. 417–433, 1989.
[38] N. Beagley, K. G. Stratton, and B.-J.M.Webb-Robertson, “VIBE2.0: visual integration for bayesian evaluation,” Bioinformatics,vol. 26, no. 2, pp. 280–282, 2010.
[39] S. Oh, D. D. Kang, G. N. Brock, and G. C. Tseng, “Biologicalimpact of missing-value imputation on downstream analyses ofgene expression profiles,” Bioinformatics, vol. 27, no. 1, ArticleID btq613, pp. 78–86, 2011.
[40] E. Younesi, L. Toldo, B. Muller et al., “Mining biomarkerinformation in biomedical literature,” BMCMedical Informaticsand Decision Making, vol. 12, article 148, pp. 148–160, 2012.
[41] R. Nugent and M. Meila, “An overview of clustering applied tomolecular biology,” Methods in Molecular Biology, vol. 620, pp.369–404, 2010.
[42] W. S. Noble, “What is a support vector machine?” NatureBiotechnology, vol. 24, no. 12, pp. 1565–1567, 2006.
[43] M. G. Schrauder, R. Strick, R. Schulz-Wendtland et al., “Circu-lating micro-RNAs as potential blood-based markers for earlystage breast cancer detection,” PLoS ONE, vol. 7, no. 1, ArticleID e29770, 2012.
[44] C. Kingsford and S. L. Salzberg, “What are decision trees?”Nature Biotechnology, vol. 26, no. 9, pp. 1011–1013, 2008.
[45] R. Dıaz-Uriarte and S. Alvarez de Andres, “Gene selection andclassification of microarray data using random forest,” BMCBioinformatics, vol. 7, article 3, 2006.
[46] M. H. Zweig and G. Campbell, “Receiver-operating charac-teristic (ROC) plots: a fundamental evaluation tool in clinicalmedicine,” Clinical Chemistry, vol. 39, no. 4, pp. 561–577, 1993.
[47] D. M. V. Powers, “Evaluation: from precision, recall and Fmea-sure to ROC, informedness, markedness & correlation,” Journalof Machine Learning Technologies, vol. 2, no. 1, pp. 37–63, 2011.

Submit your manuscripts athttp://www.hindawi.com
Stem CellsInternational
Hindawi Publishing Corporationhttp://www.hindawi.com Volume 2014
Hindawi Publishing Corporationhttp://www.hindawi.com Volume 2014
MEDIATORSINFLAMMATION
of
Hindawi Publishing Corporationhttp://www.hindawi.com Volume 2014
Behavioural Neurology
EndocrinologyInternational Journal of
Hindawi Publishing Corporationhttp://www.hindawi.com Volume 2014
Hindawi Publishing Corporationhttp://www.hindawi.com Volume 2014
Disease Markers
Hindawi Publishing Corporationhttp://www.hindawi.com Volume 2014
BioMed Research International
OncologyJournal of
Hindawi Publishing Corporationhttp://www.hindawi.com Volume 2014
Hindawi Publishing Corporationhttp://www.hindawi.com Volume 2014
Oxidative Medicine and Cellular Longevity
Hindawi Publishing Corporationhttp://www.hindawi.com Volume 2014
PPAR Research
The Scientific World JournalHindawi Publishing Corporation http://www.hindawi.com Volume 2014
Immunology ResearchHindawi Publishing Corporationhttp://www.hindawi.com Volume 2014
Journal of
ObesityJournal of
Hindawi Publishing Corporationhttp://www.hindawi.com Volume 2014
Hindawi Publishing Corporationhttp://www.hindawi.com Volume 2014
Computational and Mathematical Methods in Medicine
OphthalmologyJournal of
Hindawi Publishing Corporationhttp://www.hindawi.com Volume 2014
Diabetes ResearchJournal of
Hindawi Publishing Corporationhttp://www.hindawi.com Volume 2014
Hindawi Publishing Corporationhttp://www.hindawi.com Volume 2014
Research and TreatmentAIDS
Hindawi Publishing Corporationhttp://www.hindawi.com Volume 2014
Gastroenterology Research and Practice
Hindawi Publishing Corporationhttp://www.hindawi.com Volume 2014
Parkinson’s Disease
Evidence-Based Complementary and Alternative Medicine
Volume 2014Hindawi Publishing Corporationhttp://www.hindawi.com


![Evaluation of a Tetrazolium-based Semiautomated ... · (CANCER RESEARCH 47, 936-942, February 15, 1987] Evaluation of a Tetrazolium-based Semiautomated Colorimetrie Assay: Assessment](https://static.fdocuments.in/doc/165x107/5f5765572ff1b503ec225aa6/evaluation-of-a-tetrazolium-based-semiautomated-cancer-research-47-936-942.jpg)