Research Article A Novel Numerical Algorithm for...
9
Hindawi Publishing Corporation International Journal of Photoenergy Volume 2013, Article ID 718596, 8 pages http://dx.doi.org/10.1155/2013/718596 Research Article A Novel Numerical Algorithm for Optimal Sizing of a Photovoltaic/Wind/Diesel Generator/Battery Microgrid Using Loss of Load Probability Index Hussein A. Kazem and Tamer Khatib Faculty of Engineering, Sohar University, P.O. Box 44, 311 Sohar, Oman Correspondence should be addressed to Tamer Khatib; tamer [email protected] Received 26 January 2013; Accepted 30 March 2013 Academic Editor: David Lee Phillips Copyright © 2013 H. A. Kazem and T. Khatib. is is an open access article distributed under the Creative Commons Attribution License, which permits unrestricted use, distribution, and reproduction in any medium, provided the original work is properly cited. is paper presents a method for determining optimal sizes of PV array, wind turbine, diesel generator, and storage battery installed in a building integrated system. e objective of the proposed optimization is to design the system that can supply a building load demand at minimum cost and maximum availability. e mathematical models for the system components as well as meteorological variables such as solar energy, temperature, and wind speed are employed for this purpose. Moreover, the results showed that the optimum sizing ratios (the daily energy generated by the source to the daily energy demand) for the PV array, wind turbine, diesel generator, and battery for a system located in Sohar, Oman, are 0.737, 0.46, 0.22, and 0.17, respectively. A case study represented by a system consisting of 30 kWp PV array (36%), 18 kWp wind farm (55%), and 5 kVA diesel generator (9%) is presented. is system is supposed to power a 200 kWh/day load demand. It is found that the generated energy share of the PV array, wind farm, and diesel generator is 36%, 55%, and 9%, respectively, while the cost of energy is 0.17 USD/kWh. 1. Introduction Hybrid photovoltaic (PV)/wind/diesel power generating sys- tem installation has played an important role due to the fact that the system is clean, environment friendly, and a secure energy source. Currently, some research works are carried out focusing on optimization of hybrid PV/wind/diesel power generating system so that the capacity of PV array, wind turbine, diesel generator, and storage battery capacity can be optimally selected [1–6]. e hybrid PV/wind/diesel power generating system size and performance strongly depend on metrological variables such as solar energy, ambient temperature, and wind speed, and therefore, to optimize the system, extensive studies related to metrological variables have to be done [1]. Optimization works related to hybrid PV/wind/diesel system can be found in the literature [1– 6]. In [2, 3], hourly meteorological variables such as wind speed, solar energy, and ambient temperature for specific locations in Saudi Arabia are used to design a PV/wind/ diesel generator system. Intuitive mathematical relations have been developed to design the hybrid system but without any optimization. e application of advanced optimization techniques for designing hybrid PV/wind/diesel systems can be found in [4–6]. In [4, 5], the Strength Pareto evolutionary algorithm is used to optimize a PV/wind/diesel generator system by formulating a two objective optimization problem. e objec- tives are to minimize system cost and pollutant emissions. e mathematical models of the energy sources included in the hybrid PV/wind/diesel system and the hourly mete- orological data are used in designing the system. In [6], an iterative method and evolutionary algorithm are applied to optimize a hybrid PV/wind/diesel generating system. Here, a possible design space for the assumed load demand is first configured, and then an iterative method as well as evolutionary algorithm is used to determine the optimum configuration among the design space configurations. e generated design space contains over 6 million possible configurations. It is found that the evolutionary algorithm is faster than the iterative method in finding the optimum
Transcript of Research Article A Novel Numerical Algorithm for...
Hindawi Publishing CorporationInternational Journal of PhotoenergyVolume 2013, Article ID 718596, 8 pageshttp://dx.doi.org/10.1155/2013/718596
Research ArticleA Novel Numerical Algorithm for Optimal Sizing ofa Photovoltaic/Wind/Diesel Generator/Battery MicrogridUsing Loss of Load Probability Index
Hussein A. Kazem and Tamer Khatib
Faculty of Engineering, Sohar University, P.O. Box 44, 311 Sohar, Oman
Correspondence should be addressed to Tamer Khatib; tamer [email protected]
Received 26 January 2013; Accepted 30 March 2013
Academic Editor: David Lee Phillips
Copyright © 2013 H. A. Kazem and T. Khatib. This is an open access article distributed under the Creative Commons AttributionLicense, which permits unrestricted use, distribution, and reproduction in any medium, provided the original work is properlycited.
This paper presents amethod for determining optimal sizes of PV array, wind turbine, diesel generator, and storage battery installedin a building integrated system. The objective of the proposed optimization is to design the system that can supply a building loaddemand atminimumcost andmaximumavailability.Themathematicalmodels for the system components aswell asmeteorologicalvariables such as solar energy, temperature, and wind speed are employed for this purpose. Moreover, the results showed that theoptimum sizing ratios (the daily energy generated by the source to the daily energy demand) for the PV array, wind turbine, dieselgenerator, and battery for a system located in Sohar, Oman, are 0.737, 0.46, 0.22, and 0.17, respectively. A case study represented by asystem consisting of 30 kWp PV array (36%), 18 kWp wind farm (55%), and 5 kVA diesel generator (9%) is presented.This system issupposed to power a 200 kWh/day load demand. It is found that the generated energy share of the PV array, wind farm, and dieselgenerator is 36%, 55%, and 9%, respectively, while the cost of energy is 0.17USD/kWh.
1. Introduction
Hybrid photovoltaic (PV)/wind/diesel power generating sys-tem installation has played an important role due to the factthat the system is clean, environment friendly, and a secureenergy source. Currently, some researchworks are carried outfocusing on optimization of hybrid PV/wind/diesel powergenerating system so that the capacity of PV array, windturbine, diesel generator, and storage battery capacity can beoptimally selected [1–6]. The hybrid PV/wind/diesel powergenerating system size and performance strongly dependon metrological variables such as solar energy, ambienttemperature, and wind speed, and therefore, to optimize thesystem, extensive studies related to metrological variableshave to be done [1]. Optimization works related to hybridPV/wind/diesel system can be found in the literature [1–6]. In [2, 3], hourly meteorological variables such as windspeed, solar energy, and ambient temperature for specificlocations in Saudi Arabia are used to design a PV/wind/diesel generator system. Intuitivemathematical relations have
been developed to design the hybrid system but without anyoptimization.
The application of advanced optimization techniques fordesigning hybrid PV/wind/diesel systems can be found in[4–6]. In [4, 5], the Strength Pareto evolutionary algorithmis used to optimize a PV/wind/diesel generator system byformulating a two objective optimization problem.Theobjec-tives are to minimize system cost and pollutant emissions.The mathematical models of the energy sources includedin the hybrid PV/wind/diesel system and the hourly mete-orological data are used in designing the system. In [6], aniterative method and evolutionary algorithm are applied tooptimize a hybrid PV/wind/diesel generating system. Here,a possible design space for the assumed load demand isfirst configured, and then an iterative method as well asevolutionary algorithm is used to determine the optimumconfiguration among the design space configurations. Thegenerated design space contains over 6 million possibleconfigurations. It is found that the evolutionary algorithmis faster than the iterative method in finding the optimum
2 International Journal of Photoenergy
AC
DC
Wind turbine
Diesel generator
Battery
Charge controller
Load
Main grid
PV array ATS controller
AC/DCconverter
DC/DCconverter
DC/ACconverter
DC/ACconverter
Normal timeDeficit time
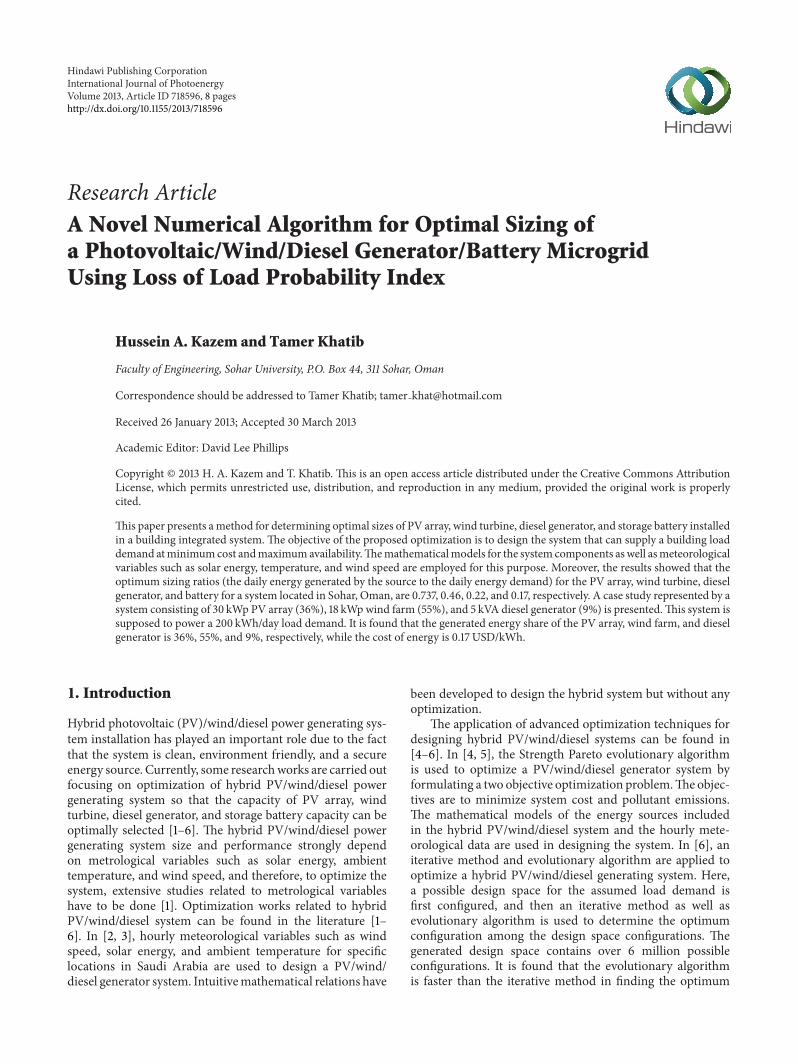
Figure 1: Building integrated hybrid PV/wind/diesel generating system.
design space configuration [6]. However, in this optimizationmethod, the availability of the hybrid system configurationwhich has availability values in the range of 0–100% is notconsidered, and this results in a large size of the designspace. If a specific availability level is considered, the sizeof the design space would have been significantly reduced.In addition, actual values of equipment have been used thusmaking the results limited to the assumed load demand.By using a defined sizing ratio, the method is not casespecific and applicable for any load demand. Finally, in [7–9], the HOMER software has been used to optimally sizehybrid PV/wind/diesel generating systems by considering theweather profile of Malaysia.
In this paper, a novel optimization method taking intoconsideration the maximum availability and the minimumsystem capital cost has been developed for optimal sizing ofa building integrated PV/wind/diesel generating system. Toevaluate the effectiveness and accuracy of the proposed opti-mization method, it is compared with the method employedin the HOMER software. The meteorological data for Soharprovided by Sohar University has been used in this work.
2. Modeling of Energy Sources in the HybridPV/Wind/Diesel Generating System
Theproposed building integratedmultigenerator system con-sisting of PV array, wind turbine, battery storage, and diesel
generator as the main energy sources is shown in Figure 1.The system is designed to supply a building load while theexcess energy will be injected to the grid. The building loadis mainly supplied by the PV array and the wind turbine.When the energy produced by the PV array and the windturbine, is not sufficient to fulfill the load demand, the batterywill cover the energy deficit. However, in case that the energyproduced by the PV array, wind turbine, and the battery is notable to meet the load demand, the diesel generator will coverthe remaining load and charge the battery until reaching itsmaximum state of charge.
The energy produced by a PV module can be calculatedin terms of solar energy and ambient temperature, and it canbe expressed as
𝐸PV (𝑡) = 𝐴PV𝐸sun (𝑡) 𝜂PV (𝑡) 𝜂INV𝜂WIRE, (1)
where 𝐴PV, 𝐸sun, 𝜂PV, 𝜂INV, and 𝜂WIRE are the area of PVarray, solar energy, PVmodule conversion efficiency, inverterconversion efficiency, and wire efficiency, respectively.
However, the effect of temperature on the conversionefficiency of a PV module can be expressed as
𝜂PV (𝑡) = 𝜂PVref[1 − 𝛽 (𝑇
𝐶 (𝑡) − 𝑇𝐶ref)] , (2)
International Journal of Photoenergy 3
Cut-in windspeed speed speed
Rated wind Cut-out wind
Wind speed
Pow
er
Ratedpower
Power inthe wind
Power in anideal machine
Inefficiencies
Idealisedpower output
Typicalcharacteristics ofa wind generator
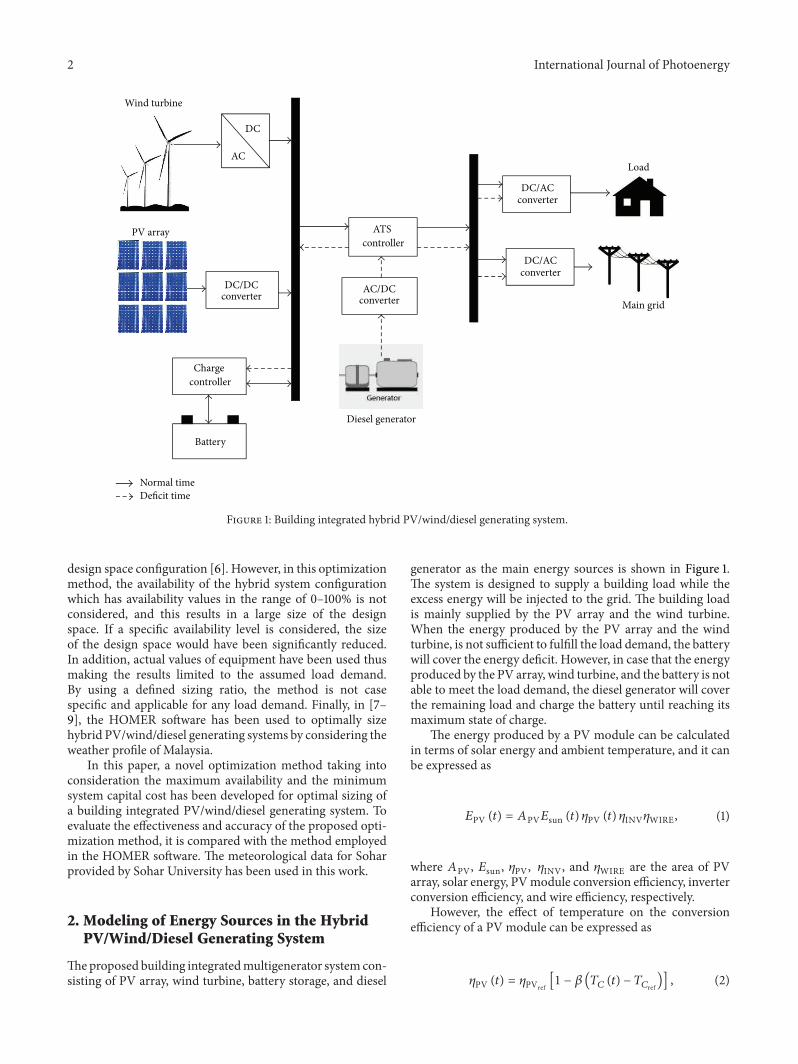
Figure 2: A wind turbine characteristic [10].
where 𝜂PVref, 𝛽, 𝑇𝐶, and 𝑇𝐶ref , are the reference PV module
conversion efficiency, temperature coefficient for the effi-ciency, cell temperature, and reference cell temperature,respectively.
The cell temperature is calculated using the ambienttemperature as follows:
𝑇𝐶 (𝑡) − 𝑇ambient =𝑇Test800
𝐺 (𝑡) , (3)
where𝑇ambient,𝑇Test, and𝐺 are the ambient temperature, tem-perature during testing the PV module, and solar radiation,respectively.
As for the wind generator, its output power is a functionof wind speed as illustrated in Figure 2.
From Figure 2, the wind turbine characteristic can bedescribed as follows:
{{{
{{{
{
0, 𝑉cut out < 𝑉 < 𝑉cut in
𝑃rated , 𝑉 = 𝑉rated
𝑃 = 𝑐1𝑒𝑐2𝑉+ 𝑐3𝑒𝑐4𝑉, 𝑉cut in < 𝑉 < 𝑉rated
}}}
}}}
}
. (4)
The coefficients 𝑐1–𝑐4can be calculated by using a curve fitting
tool such as the MATLAB fitting tool. However, this model isnot suitable to be used in an iterative loop with a small step,and therefore, in this research work, the output energy of awind turbine is done using the wind kinetic energy.
The wind turbine output energy depends on the amountof wind power which hits the blades of a wind turbine. Aswind is made up ofmovingmolecules which havemass, windenergy is in terms of its kinetic energy, and it is given by
Kinetic energy = 12𝑀𝑉2, (5)
where𝑀 is themass of windmolecules (kg) and𝑉 is the windspeed (m/s).
Considering that air has a known density of about1.23 kg/m3, the mass which hits a wind turbine with a sweptarea at each second is given by
𝑀
𝑆= 𝑉(
ms)𝐴𝑊(m2)Air density (
Kgm3) , (6)
where 𝐴𝑊is wind turbine swept area.
Substituting (5) into (6), the power of the wind hitting awind turbine with a certain swept area is given by
𝑃𝑊 =1
2Air density 𝑟2𝜋𝑉3, (7)
where 𝑟 is wind turbine rotor radius.The output energy of wind turbine (𝐸
𝑊) is then calculated
as follows:
𝐸𝑊= 24𝑃
𝑊𝜂𝑊, (8)
where 𝜂𝑊is the conversion efficiency of a wind turbine.
As for the diesel generator, the output energy can becalculated as follows:
𝐸𝐷= rated power ∗ operation hours. (9)
Here, it is assumed that the diesel generator reaches its ratedpower shortly after it starts operating.
3. Proposed Optimization Algorithm
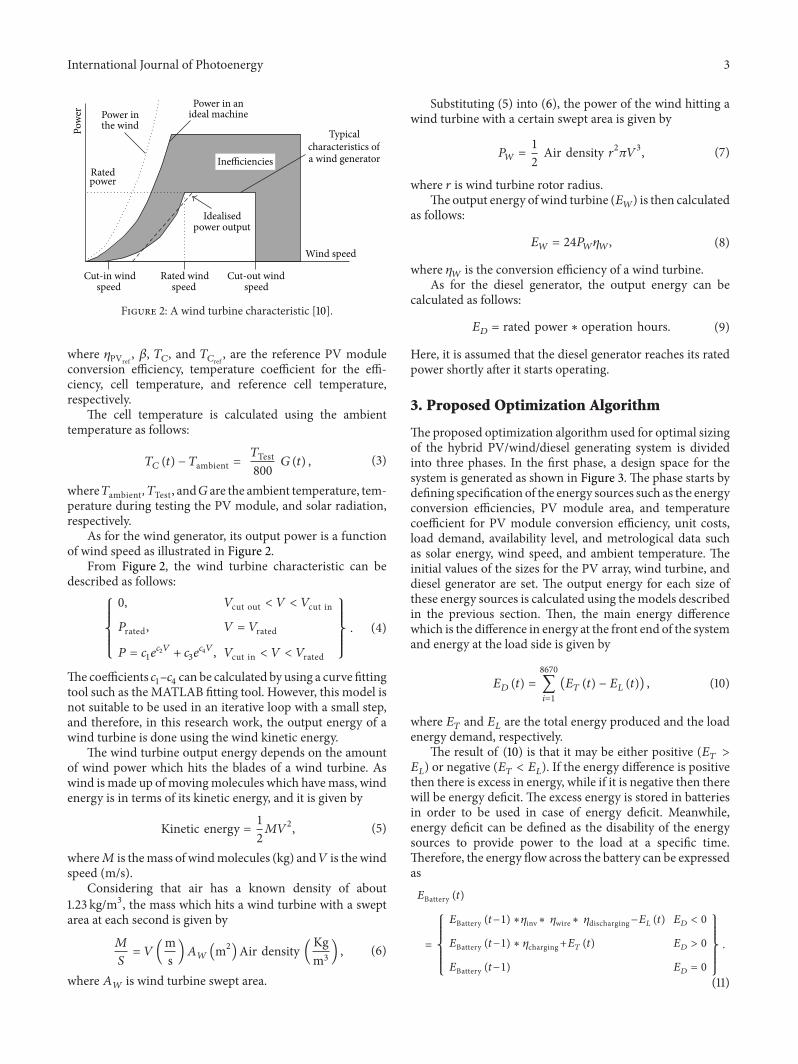
Theproposed optimization algorithm used for optimal sizingof the hybrid PV/wind/diesel generating system is dividedinto three phases. In the first phase, a design space for thesystem is generated as shown in Figure 3. The phase starts bydefining specification of the energy sources such as the energyconversion efficiencies, PV module area, and temperaturecoefficient for PV module conversion efficiency, unit costs,load demand, availability level, and metrological data suchas solar energy, wind speed, and ambient temperature. Theinitial values of the sizes for the PV array, wind turbine, anddiesel generator are set. The output energy for each size ofthese energy sources is calculated using themodels describedin the previous section. Then, the main energy differencewhich is the difference in energy at the front end of the systemand energy at the load side is given by
𝐸𝐷 (𝑡) =
8670
∑
𝑖=1
(𝐸𝑇 (𝑡) − 𝐸𝐿 (𝑡)) , (10)
where 𝐸𝑇 and 𝐸𝐿 are the total energy produced and the load
energy demand, respectively.The result of (10) is that it may be either positive (𝐸𝑇 >
𝐸𝐿) or negative (𝐸𝑇 < 𝐸𝐿). If the energy difference is positivethen there is excess in energy, while if it is negative then therewill be energy deficit. The excess energy is stored in batteriesin order to be used in case of energy deficit. Meanwhile,energy deficit can be defined as the disability of the energysources to provide power to the load at a specific time.Therefore, the energy flow across the battery can be expressedas𝐸Battery (𝑡)
=
{{{{
{{{{
{
𝐸Battery (𝑡−1) ∗𝜂inv∗ 𝜂wire∗ 𝜂discharging−𝐸𝐿 (𝑡) 𝐸𝐷 < 0
𝐸Battery (𝑡−1) ∗ 𝜂charging+𝐸𝑇 (𝑡) 𝐸𝐷> 0
𝐸Battery (𝑡−1) 𝐸𝐷= 0
}}}}
}}}}
}
.
(11)
4 International Journal of Photoenergy
Start
Obtain PV module, wind turbine, and diesel generator specification
Obtain solar energy, temperature, and wind speed data for the selected area
Define location, load demand, units cost, and the desired LLP
Calculate the produced energy by wind turbine
Calculate the produced energy by diesel generator
Store in energy excess array Store in energy deficit array
Calculate battery size
Store in design space array
No
No Yes
Yes
Yes
Yes To phase two
No
No
Set PVarray area 0 : step : max
Calculate the produced energy by PVarray
Set wind turbine rotor diameter 0 : step : max
Set diesel generated size 0 : step : max
Calculate the total energy produced (𝐸𝑇)
Ans >0
[𝐶𝐴; 𝐶𝑊; 𝐶𝐷; 𝐶𝐵]
DG set = max
Wind set = max
PV Set = max
𝐸𝑇—load demand
Figure 3: The first phase of the proposed optimization algorithm.
The battery size (𝐸𝐵) is estimated using the excess energy, and
it is expressed as
𝐸𝐵=∑8750
𝑖=0Excess enery 𝑔
𝑖∗ 𝜂𝐵
𝑉𝐵
, (12)
where 𝜂𝐵and 𝑉
𝐵are the charging efficiency and the battery
voltage, respectively.
Battery To the grid Diesel generator
Energy deficit array
Calculate LLP
Recall weather data and load demand
Yes
No Yes
NoC D
Yes
No
CYes
No
Yes No
Yes
No
Yes
Yes
No
Design space array [𝐶𝐴; 𝐶𝑊; 𝐶𝐷; 𝐶𝐵]
Calculate the energy produced (𝐸𝑇𝑖) by 𝐶𝐴 and 𝐶𝑊
Ans1 <0
SOC = max SOC = min
SOC = max
SOC = max
𝐸𝐷 + Ans1
Ans2 <0
Desired = LLPPossible configuration array
[𝐶𝐴; 𝐶𝑊; 𝐶𝐷; 𝐶𝐵, LLP]
Length of designspace array = max
Recall the possible configurationarray [𝐶𝐴; 𝐶𝑊; 𝐶𝐷; 𝐶𝐵, LLP]
𝐸𝑇𝑖—load demand
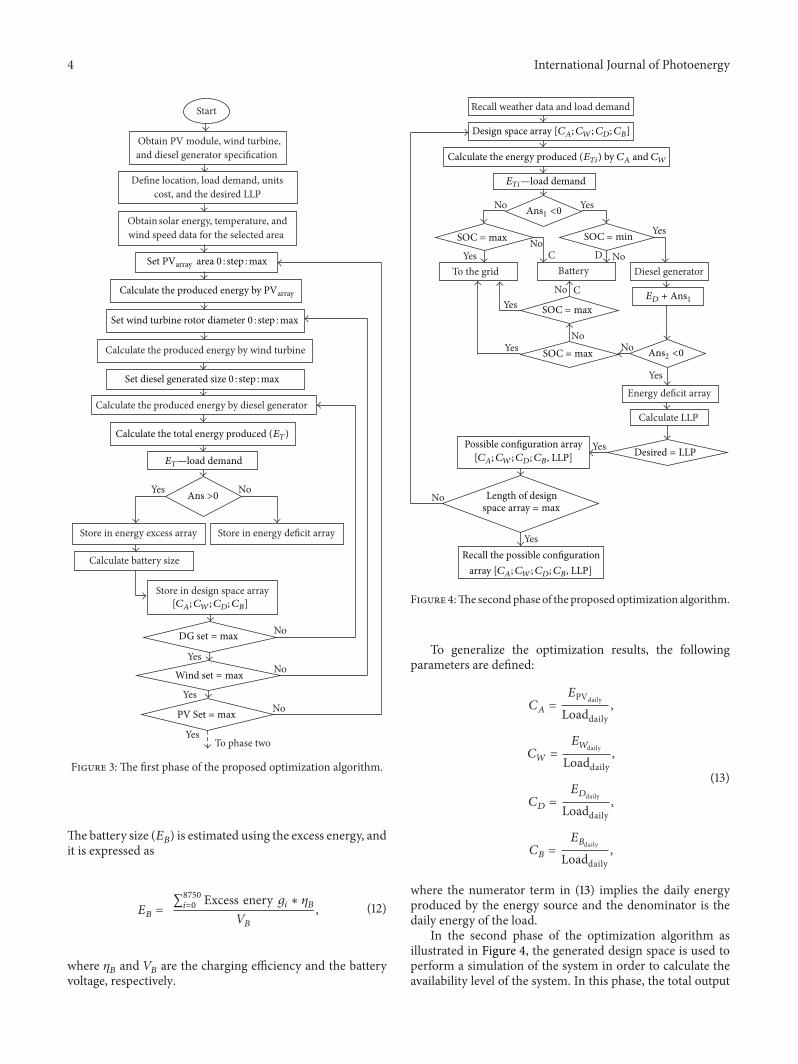
Figure 4:The secondphase of the proposed optimization algorithm.
To generalize the optimization results, the followingparameters are defined:
𝐶𝐴 =
𝐸PVdaily
Loaddaily,
𝐶𝑊 =
𝐸𝑊daily
Loaddaily,
𝐶𝐷=
𝐸𝐷daily
Loaddaily,
𝐶𝐵=
𝐸𝐵daily
Loaddaily,
(13)
where the numerator term in (13) implies the daily energyproduced by the energy source and the denominator is thedaily energy of the load.
In the second phase of the optimization algorithm asillustrated in Figure 4, the generated design space is used toperform a simulation of the system in order to calculate theavailability level of the system. In this phase, the total output
International Journal of Photoenergy 5
power which is generated by the PV array and the windturbine is calculated. Then the energy balance is examinedby subtracting the load demand from the generated power.At this point, if the energy balance is negative (the generatedpower is not able to cover the load demand), the battery stateof charge (SOC) is checked to find out whether the batteryis able to supply energy or not. If the battery SOC is higherthan its minimum value, then the battery is supposed tosupply the remaining load demand subject to not reaching theallowable minimum SOC. On the other hand, if the battery isnot able to supply the load (SOC =Min), the diesel generatoris operated to cover the remaining load and to charge thebattery. However, if both the battery and diesel generator arenot able to cover the remaining load demand, this energyis classified as energy deficit. This procedure is done foreach hourly load demand for a duration of one year, and atthe end of the year, the total energy generated by PV, windturbine, and diesel generator is calculated. In addition, thetotal energy deficit is calculated in order to calculate the lossof load probability. This loop is repeated till reaching themaximum length of the design space array. Finally, all thesystem configurations that investigate the desired availabilitylevel are stored in an array called as the possible configurationarea (Figure 4).
In designing the proposed system, it is important toknow the power supply availability. 100% availability of powersupply means that the power supply is able to cover loaddemand in a year without any interruption. On the otherhand, 0% availability of power supply means that the powersupply is not able to cover load demand in a year at all. Thismeans that high system availability leads to high reliabilityand vice versa. However, high reliability systems incur highinitial cost, and therefore, it is not feasible to design systemswith very high availability rates.The availability of a proposedsystem is expressed in a statistical value which is the lossof load probability (LLP). LLP is the ratio of annual energydeficits to annual load demand, and it is given by
LLP =∑366
𝑖=1Energy deficits
𝑖
∑366
𝑗=1Energy demand𝑗
. (14)
In the third phase of the optimization, the unit costs aredefined for each component in the systems, and the systemcost is calculated. The system cost includes the capital,running, and replacement costs. Finally, the system withminimum cost is considered as the optimum system.
4. Test Results
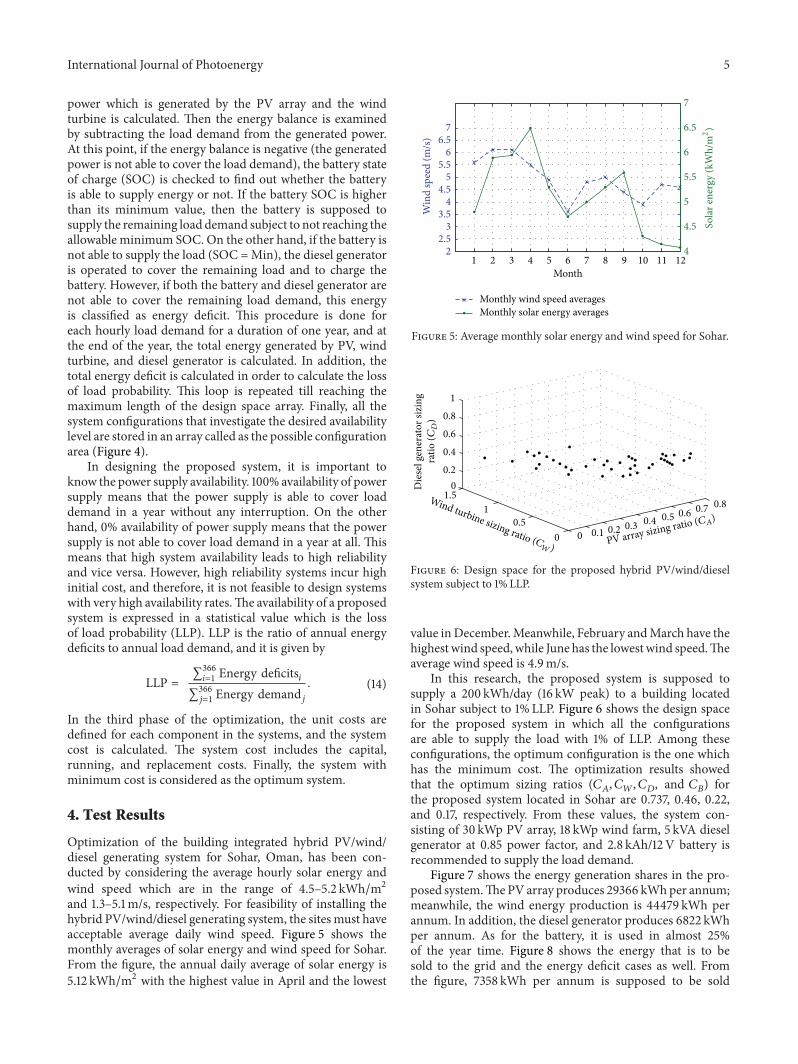
Optimization of the building integrated hybrid PV/wind/diesel generating system for Sohar, Oman, has been con-ducted by considering the average hourly solar energy andwind speed which are in the range of 4.5–5.2 kWh/m2and 1.3–5.1m/s, respectively. For feasibility of installing thehybrid PV/wind/diesel generating system, the sites must haveacceptable average daily wind speed. Figure 5 shows themonthly averages of solar energy and wind speed for Sohar.From the figure, the annual daily average of solar energy is5.12 kWh/m2 with the highest value in April and the lowest
76.5
65.5
54.5
43.5
32.5
21 2 3 4 5 6 7 8 9 10 11 12
Win
d sp
eed
(m/s
)
Month
7
6.5
6
5.5
5
4.5
4
Sola
r ene
rgy
(kW
h/m2)
Monthly wind speed averagesMonthly solar energy averages
Figure 5: Average monthly solar energy and wind speed for Sohar.
1
0.8
0.6
0.4
0.20
1.51
0.50 0 0.1 0.2 0.3 0.4 0.5 0.6 0.7 0.8Wind turbine sizing ratio (𝐶
𝑊 ) PV array sizing ratio (𝐶𝐴)
Die
sel g
ener
ator
sizi
ng
𝐶𝐷
)ra
tio (
Figure 6: Design space for the proposed hybrid PV/wind/dieselsystem subject to 1% LLP.
value inDecember.Meanwhile, February andMarch have thehighestwind speed,while June has the lowestwind speed.Theaverage wind speed is 4.9m/s.
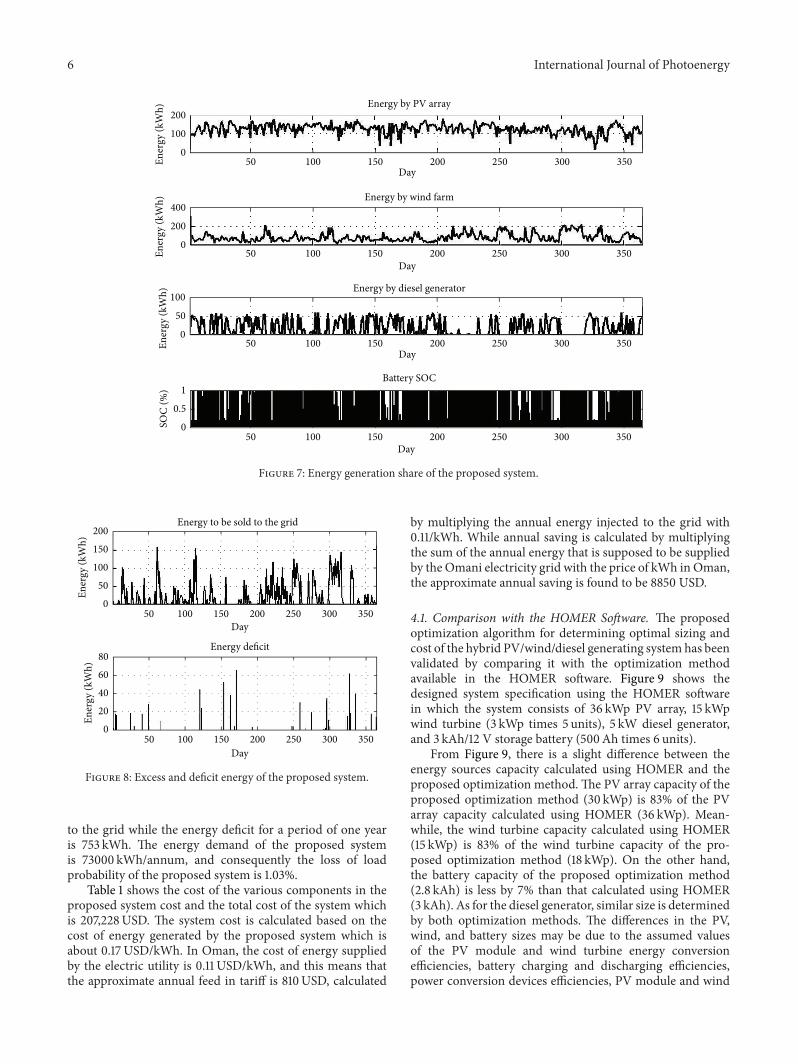
In this research, the proposed system is supposed tosupply a 200 kWh/day (16 kW peak) to a building locatedin Sohar subject to 1% LLP. Figure 6 shows the design spacefor the proposed system in which all the configurationsare able to supply the load with 1% of LLP. Among theseconfigurations, the optimum configuration is the one whichhas the minimum cost. The optimization results showedthat the optimum sizing ratios (𝐶
𝐴, 𝐶𝑊, 𝐶𝐷, and 𝐶
𝐵) for
the proposed system located in Sohar are 0.737, 0.46, 0.22,and 0.17, respectively. From these values, the system con-sisting of 30 kWp PV array, 18 kWp wind farm, 5 kVA dieselgenerator at 0.85 power factor, and 2.8 kAh/12V battery isrecommended to supply the load demand.
Figure 7 shows the energy generation shares in the pro-posed system.ThePV array produces 29366 kWhper annum;meanwhile, the wind energy production is 44479 kWh perannum. In addition, the diesel generator produces 6822 kWhper annum. As for the battery, it is used in almost 25%of the year time. Figure 8 shows the energy that is to besold to the grid and the energy deficit cases as well. Fromthe figure, 7358 kWh per annum is supposed to be sold
6 International Journal of Photoenergy
200
100
050 100 150 200 250 300 350
DayEn
ergy
(kW
h) Energy by PV array
Energy by wind farm
Energy by diesel generator
Battery SOC
400
200
050 100 150 200 250 300 350
Day
Ener
gy (k
Wh)
100
50
050 100 150 200 250 300 350
Day
Ener
gy (k
Wh)
1
0.5
050 100 150 200 250 300 350
Day
SOC
(%)
Figure 7: Energy generation share of the proposed system.
200
150
100
50
050 100 150 200 250 300 350
Day
Ener
gy (k
Wh)
Energy to be sold to the grid
50 100 150 200 250 300 350Day
Ener
gy (k
Wh)
80
60
40
20
0
Energy deficit
Figure 8: Excess and deficit energy of the proposed system.
to the grid while the energy deficit for a period of one yearis 753 kWh. The energy demand of the proposed systemis 73000 kWh/annum, and consequently the loss of loadprobability of the proposed system is 1.03%.
Table 1 shows the cost of the various components in theproposed system cost and the total cost of the system whichis 207,228USD. The system cost is calculated based on thecost of energy generated by the proposed system which isabout 0.17USD/kWh. In Oman, the cost of energy suppliedby the electric utility is 0.11 USD/kWh, and this means thatthe approximate annual feed in tariff is 810USD, calculated
by multiplying the annual energy injected to the grid with0.11/kWh. While annual saving is calculated by multiplyingthe sum of the annual energy that is supposed to be suppliedby the Omani electricity grid with the price of kWh in Oman,the approximate annual saving is found to be 8850 USD.
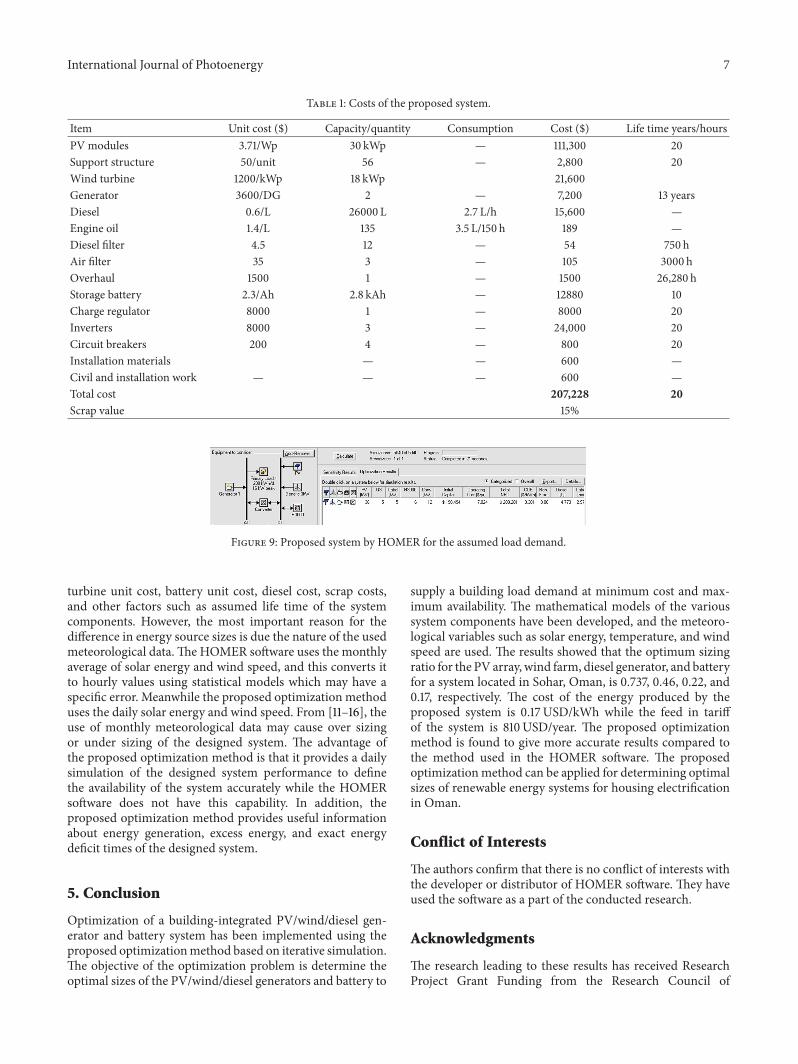
4.1. Comparison with the HOMER Software. The proposedoptimization algorithm for determining optimal sizing andcost of the hybrid PV/wind/diesel generating system has beenvalidated by comparing it with the optimization methodavailable in the HOMER software. Figure 9 shows thedesigned system specification using the HOMER softwarein which the system consists of 36 kWp PV array, 15 kWpwind turbine (3 kWp times 5 units), 5 kW diesel generator,and 3 kAh/12 V storage battery (500Ah times 6 units).
From Figure 9, there is a slight difference between theenergy sources capacity calculated using HOMER and theproposed optimization method.The PV array capacity of theproposed optimization method (30 kWp) is 83% of the PVarray capacity calculated using HOMER (36 kWp). Mean-while, the wind turbine capacity calculated using HOMER(15 kWp) is 83% of the wind turbine capacity of the pro-posed optimization method (18 kWp). On the other hand,the battery capacity of the proposed optimization method(2.8 kAh) is less by 7% than that calculated using HOMER(3 kAh). As for the diesel generator, similar size is determinedby both optimization methods. The differences in the PV,wind, and battery sizes may be due to the assumed valuesof the PV module and wind turbine energy conversionefficiencies, battery charging and discharging efficiencies,power conversion devices efficiencies, PV module and wind
International Journal of Photoenergy 7
Table 1: Costs of the proposed system.
Item Unit cost ($) Capacity/quantity Consumption Cost ($) Life time years/hoursPV modules 3.71/Wp 30 kWp — 111,300 20Support structure 50/unit 56 — 2,800 20Wind turbine 1200/kWp 18 kWp 21,600Generator 3600/DG 2 — 7,200 13 yearsDiesel 0.6/L 26000 L 2.7 L/h 15,600 —Engine oil 1.4/L 135 3.5 L/150 h 189 —Diesel filter 4.5 12 — 54 750 hAir filter 35 3 — 105 3000 hOverhaul 1500 1 — 1500 26,280 hStorage battery 2.3/Ah 2.8 kAh — 12880 10Charge regulator 8000 1 — 8000 20Inverters 8000 3 — 24,000 20Circuit breakers 200 4 — 800 20Installation materials — — 600 —Civil and installation work — — — 600 —Total cost 207,228 20Scrap value 15%
Figure 9: Proposed system by HOMER for the assumed load demand.
turbine unit cost, battery unit cost, diesel cost, scrap costs,and other factors such as assumed life time of the systemcomponents. However, the most important reason for thedifference in energy source sizes is due the nature of the usedmeteorological data.The HOMER software uses the monthlyaverage of solar energy and wind speed, and this converts itto hourly values using statistical models which may have aspecific error. Meanwhile the proposed optimization methoduses the daily solar energy and wind speed. From [11–16], theuse of monthly meteorological data may cause over sizingor under sizing of the designed system. The advantage ofthe proposed optimization method is that it provides a dailysimulation of the designed system performance to definethe availability of the system accurately while the HOMERsoftware does not have this capability. In addition, theproposed optimization method provides useful informationabout energy generation, excess energy, and exact energydeficit times of the designed system.
5. Conclusion
Optimization of a building-integrated PV/wind/diesel gen-erator and battery system has been implemented using theproposed optimizationmethod based on iterative simulation.The objective of the optimization problem is determine theoptimal sizes of the PV/wind/diesel generators and battery to
supply a building load demand at minimum cost and max-imum availability. The mathematical models of the varioussystem components have been developed, and the meteoro-logical variables such as solar energy, temperature, and windspeed are used. The results showed that the optimum sizingratio for the PV array, wind farm, diesel generator, and batteryfor a system located in Sohar, Oman, is 0.737, 0.46, 0.22, and0.17, respectively. The cost of the energy produced by theproposed system is 0.17USD/kWh while the feed in tariffof the system is 810USD/year. The proposed optimizationmethod is found to give more accurate results compared tothe method used in the HOMER software. The proposedoptimizationmethod can be applied for determining optimalsizes of renewable energy systems for housing electrificationin Oman.
Conflict of Interests
The authors confirm that there is no conflict of interests withthe developer or distributor of HOMER software. They haveused the software as a part of the conducted research.
Acknowledgments
The research leading to these results has received ResearchProject Grant Funding from the Research Council of

8 International Journal of Photoenergy
the Sultanate of Oman, Research Grant Agreement no. ORGSU EI 11 010. The authors would like to acknowledge thesupport from the Research Council of Oman. Gratitude isalso expressed to the Faculty of Engineering and Researchand Industry Collaboration Office in Sohar University.
References
[1] T. Khatib, A.Mohamed, K. Sopian, andM.Mahmoud, “Optimalsizing of building integrated hybrid PV/diesel generator systemfor zero load rejection for Malaysia,” Energy and Buildings, vol.43, no. 12, pp. 3430–3435, 2011.
[2] M. A. Elhadidy and S. M. Shaahid, “Parametric study of hybrid(wind + solar + diesel) power generating systems,” RenewableEnergy, vol. 21, no. 2, pp. 129–139, 2000.
[3] M. A. Elhadidy and S. M. Shaahid, “Promoting applications ofhybrid (wind + photovoltaic + diesel + battery) power systemsin hot regions,” Renewable Energy, vol. 29, no. 4, pp. 517–528,2004.
[4] J. L. Bernal-Agustın, R. Dufo-Lopez, and D. M. Rivas-Ascaso,“Design of isolated hybrid systems minimizing costs andpollutant emissions,”Renewable Energy, vol. 31, no. 14, pp. 2227–2244, 2006.
[5] R. Dufo-Lopez, J. Bernal-Agustın, J. Yusta-Loyo et al., “Multi-objective optimization minimizing cost and life cycle emissionsof stand-alone PV-wind-diesel systems with batteries storage,”Applied Energy, vol. 88, no. 11, pp. 4033–4041, 2011.
[6] J. L. Bernal-Agustın and R. Dufo-Lopez, “Efficient design ofhybrid renewable energy systems using evolutionary algo-rithms,” Energy Conversion and Management, vol. 50, no. 3, pp.479–489, 2009.
[7] G. J. Dalton, D. A. Lockington, and T. E. Baldock, “Feasibilityanalysis of stand-alone renewable energy supply options for alarge hotel,” Renewable Energy, vol. 33, no. 7, pp. 1475–1490,2008.
[8] M. Ngan and C. Tan, “Assessment of economic viability forPV/wind/diesel hybrid energy system in southern PeninsularMalaysia,” Renewable and Sustainable Energy Reviews, vol. 16,no. 1, pp. 634–647, 2012.
[9] A. M. A. Haidar, P. N. John, and M. Shawal, “Optimal configu-ration assessment of renewable energy in Malaysia,” RenewableEnergy, vol. 36, no. 2, pp. 881–888, 2011.
[10] G. Boyle, Renewable Energy, OXFORD, 2004.[11] T. Khatib, A.Mohamed,M.Mahmoud, andK. Sopian, “A review
of photovoltaic systems size optimization techniques,” Journal ofRenewable and Sustainable Reviews, vol. 22, pp. 454–465, 2013.
[12] T. Khatib Mohamed A and K. Sopian, “Optimization of aPV/wind micro-grid for rural housing electrification using ahybrid iterative/genetic algorithm: case study of Kuala Tereng-ganu, Malaysia,” Energy and Buildings, vol. 47, pp. 321–331, 2012.
[13] A. Fragaki and T. Markvart, “Stand-alone PV system design:results using a new sizing approach,” Renewable Energy, vol. 33,no. 1, pp. 162–167, 2008.
[14] T. Markvart, A. Fragaki, and J. N. Ross, “PV system sizing usingobserved time series of solar radiation,” Solar Energy, vol. 80,no. 1, pp. 46–50, 2006.
[15] S. M. Shaahid and M. A. Elhadidy, “Prospects of auton-omous/stand-alone hybrid (photo-voltaic + diesel + battery)power systems in commercial applications in hot regions,”Renewable Energy, vol. 29, no. 2, pp. 165–177, 2004.
[16] S. M. Shaahid, I. El-Amin, S. Rehman et al., “Techno-economicpotential of retrofitting diesel power systems with hybrid wind-photovoltaic-diesel systems for off-grid electrification of remotevillages of Saudi Arabia,” International Journal of Green Energy,vol. 7, no. 6, pp. 632–646, 2010.

Submit your manuscripts athttp://www.hindawi.com
Hindawi Publishing Corporationhttp://www.hindawi.com Volume 2014
Inorganic ChemistryInternational Journal of
Hindawi Publishing Corporation http://www.hindawi.com Volume 2014
International Journal ofPhotoenergy
Hindawi Publishing Corporationhttp://www.hindawi.com Volume 2014
Carbohydrate Chemistry
International Journal of
Hindawi Publishing Corporationhttp://www.hindawi.com Volume 2014
Journal of
Chemistry
Hindawi Publishing Corporationhttp://www.hindawi.com Volume 2014
Advances in
Physical Chemistry
Hindawi Publishing Corporationhttp://www.hindawi.com
Analytical Methods in Chemistry
Journal of
Volume 2014
Bioinorganic Chemistry and ApplicationsHindawi Publishing Corporationhttp://www.hindawi.com Volume 2014
SpectroscopyInternational Journal of
Hindawi Publishing Corporationhttp://www.hindawi.com Volume 2014
The Scientific World JournalHindawi Publishing Corporation http://www.hindawi.com Volume 2014
Medicinal ChemistryInternational Journal of
Hindawi Publishing Corporationhttp://www.hindawi.com Volume 2014
Chromatography Research International
Hindawi Publishing Corporationhttp://www.hindawi.com Volume 2014
Applied ChemistryJournal of
Hindawi Publishing Corporationhttp://www.hindawi.com Volume 2014
Hindawi Publishing Corporationhttp://www.hindawi.com Volume 2014
Theoretical ChemistryJournal of
Hindawi Publishing Corporationhttp://www.hindawi.com Volume 2014
Journal of
Spectroscopy
Analytical ChemistryInternational Journal of
Hindawi Publishing Corporationhttp://www.hindawi.com Volume 2014
Journal of
Hindawi Publishing Corporationhttp://www.hindawi.com Volume 2014
Quantum Chemistry
Hindawi Publishing Corporationhttp://www.hindawi.com Volume 2014
Organic Chemistry International
ElectrochemistryInternational Journal of
Hindawi Publishing Corporation http://www.hindawi.com Volume 2014
Hindawi Publishing Corporationhttp://www.hindawi.com Volume 2014
CatalystsJournal of