Research Article A Novel Framework Based on ACO and PSO ...
9
Hindawi Publishing Corporation Mathematical Problems in Engineering Volume 2013, Article ID 796304, 8 pages http://dx.doi.org/10.1155/2013/796304 Research Article A Novel Framework Based on ACO and PSO for RNA Secondary Structure Prediction Gang Wang, 1,2,3 Wen-yi Zhang, 4 Qiao Ning, 4 and Hui-ling Chen 5 1 College of Computer Science and Technology, Jilin University, Changchun 130012, China 2 Key Laboratory of Symbolic Computation and Knowledge Engineering of Ministry of Education, Jilin University, Changchun 130012, China 3 College of GeoExploration Science and Technology, Jilin University, Changchun 130026, China 4 School of Computer Science and Information Technology, Northeast Normal University, Changchun 130024, China 5 College of Physics and Electronic Information, Wenzhou University, Chashan University Town, Wenzhou, Zhejiang, 325035, China Correspondence should be addressed to Hui-ling Chen; [email protected] Received 24 June 2013; Accepted 12 August 2013 Academic Editor: William Guo Copyright © 2013 Gang Wang et al. is is an open access article distributed under the Creative Commons Attribution License, which permits unrestricted use, distribution, and reproduction in any medium, provided the original work is properly cited. Prediction of RNA structure is a useful process for creating new drugs and understanding genetic diseases. In this paper, we proposed a particle swarm optimization (PSO) and ant colony optimization (ACO) based framework (PAF) for RNA secondary structure prediction. PAF consists of crucial stem searching (CSS) and global sequence building (GSB). In CSS, a modified ACO (MACO) is used to search the crucial stems, and then a set of stems are generated. In GSB, we used a modified PSO (MPSO) to construct all the stems in one sequence. We evaluated the performance of PAF on ten sequences, which have length from 122 to 1494. We also compared the performance of PAF with the results obtained from six existing well-known methods, SARNA-Predict, RnaPredict, ACRNA, PSOfold, IPSO, and mfold. e comparison results show that PAF could not only predict structures with higher accuracy rate but also find crucial stems. 1. Introduction RNA functions as an information carrier, catalyst, and regula- tory element, perhaps reflecting its importance in the earliest stages of evolution. e structures of RNAs provide insight into the mechanisms behind these functions. Determining sequence is the first step in determining structure, and many billions of nucleotide sequences are now known. e second step is determining secondary structure, and relatively few classes of RNAs currently have known secondary structures [1]. e RNA secondary structure prediction problem is a critical one in molecular biology. Secondary structure as well as tertiary structure can be determined by X-ray crystallogra- phy and Nuclear Magnetic Resonance (NMR) spectroscopy. Data analysis tools used for prediction of RNA structure are mainly based on dynamic programming [2]. Recently, the metaheuristic methods are widely used to predict RNA secondary structure. ese methods generally include genetic algorithm (GA) [3], particle swarm optimization (PSO) [4], ant colony optimization (ACO) [5], and simulated annealing (SA) [6]. e state-of-the-art methods are introduced as follows. For SA. Shapiro and Wu [7] later modified the algorithm by introducing an annealing mutation operator. Tsang and Wiese [8] presented SARNA-Predict, the permutation-based algorithm for RNA secondary structure prediction based on SA with a simple thermodynamic model and studied mainly its convergence behavior. A performance evaluation of SARNA-Predict in terms of prediction accuracy was made via comparison with eight state-of-the-art RNA prediction algorithms. e results presented in this paper demonstrate
Transcript of Research Article A Novel Framework Based on ACO and PSO ...

Hindawi Publishing CorporationMathematical Problems in EngineeringVolume 2013, Article ID 796304, 8 pageshttp://dx.doi.org/10.1155/2013/796304
Research ArticleA Novel Framework Based on ACO and PSO forRNA Secondary Structure Prediction
Gang Wang,1,2,3 Wen-yi Zhang,4 Qiao Ning,4 and Hui-ling Chen5
1 College of Computer Science and Technology, Jilin University, Changchun 130012, China2 Key Laboratory of Symbolic Computation and Knowledge Engineering of Ministry of Education, Jilin University, Changchun130012, China
3 College of GeoExploration Science and Technology, Jilin University, Changchun 130026, China4 School of Computer Science and Information Technology, Northeast Normal University, Changchun 130024, China5 College of Physics and Electronic Information, Wenzhou University, Chashan University Town, Wenzhou, Zhejiang, 325035, China
Correspondence should be addressed to Hui-ling Chen; [email protected]
Received 24 June 2013; Accepted 12 August 2013
Academic Editor: William Guo
Copyright © 2013 Gang Wang et al. This is an open access article distributed under the Creative Commons Attribution License,which permits unrestricted use, distribution, and reproduction in any medium, provided the original work is properly cited.
Prediction of RNA structure is a useful process for creating new drugs and understanding genetic diseases. In this paper, weproposed a particle swarm optimization (PSO) and ant colony optimization (ACO) based framework (PAF) for RNA secondarystructure prediction. PAF consists of crucial stem searching (CSS) and global sequence building (GSB). In CSS, a modified ACO(MACO) is used to search the crucial stems, and then a set of stems are generated. In GSB, we used a modified PSO (MPSO) toconstruct all the stems in one sequence. We evaluated the performance of PAF on ten sequences, which have length from 122 to1494.We also compared the performance of PAF with the results obtained from six existing well-knownmethods, SARNA-Predict,RnaPredict, ACRNA, PSOfold, IPSO, and mfold. The comparison results show that PAF could not only predict structures withhigher accuracy rate but also find crucial stems.
1. Introduction
RNA functions as an information carrier, catalyst, and regula-tory element, perhaps reflecting its importance in the earlieststages of evolution. The structures of RNAs provide insightinto the mechanisms behind these functions. Determiningsequence is the first step in determining structure, and manybillions of nucleotide sequences are now known. The secondstep is determining secondary structure, and relatively fewclasses of RNAs currently have known secondary structures[1]. The RNA secondary structure prediction problem is acritical one in molecular biology. Secondary structure as wellas tertiary structure can be determined by X-ray crystallogra-phy and Nuclear Magnetic Resonance (NMR) spectroscopy.Data analysis tools used for prediction of RNA structureare mainly based on dynamic programming [2]. Recently,
the metaheuristic methods are widely used to predict RNAsecondary structure.Thesemethods generally include geneticalgorithm (GA) [3], particle swarm optimization (PSO) [4],ant colony optimization (ACO) [5], and simulated annealing(SA) [6]. The state-of-the-art methods are introduced asfollows.
For SA. Shapiro and Wu [7] later modified the algorithmby introducing an annealing mutation operator. Tsang andWiese [8] presented SARNA-Predict, the permutation-basedalgorithm for RNA secondary structure prediction basedon SA with a simple thermodynamic model and studiedmainly its convergence behavior. A performance evaluationof SARNA-Predict in terms of prediction accuracy was madevia comparison with eight state-of-the-art RNA predictionalgorithms. The results presented in this paper demonstrate
2 Mathematical Problems in Engineering
that SARNA-Predict can outperform other state-of-the-artalgorithms in terms of prediction accuracy. Furthermore,there is substantial improvement of prediction accuracy byincorporating a more sophisticated thermodynamic model.
For GA. Benedetti and Morosetti [9] compared the accuracyof an EA against known RNA structures with the objectiveof finding optimal and suboptimal structures that weresimilar. Shapiro et al. [10] modified their EA to study foldingpathways using a massively parallel genetic algorithm. Wieseet al. designed a serial EA, RnaPredict [11], which encodesRNA secondary structures as permutations. RnaPredict wasparallelized via a coarse-grained distributed EA for RNAsecondary structure prediction [12].
For ACO. Yu et al. [13] put forward ACRNA based on ACOfor RNA secondary structure prediction. For a given RNAsequence, the set of all possible stems is obtained, and theenergy of each stem is calculated and stored at the initial stage.Furthermore, a more realistic formula is used to computethe energy of multibranch loop in the following iteration.Then a folding pathway is simulated, including such processesas construction of the heuristic information, the rule ofinitializing the pheromone, the mechanism of choosing theinitial and next stem, and the strategy of updating thepheromone between two different stems.
For PSO. Geis and Middendorf [14] introduced HelixPSOfor finding minimum energy RNA secondary structures.Neethling and Engelbrecht [15] proposed a set-based ParticleSwarm Optimization algorithm to optimize the structure ofanRNAmolecule, using an advanced thermodynamicmodel.Liu et al. [16] proposed an improved PSO (IPSO).The authorsdesigned an efficient objective function according to theminimum free energy, the number of selected stems, and theaverage length of selected stems. A promising experimentalresult was obtained, and the effectiveness and practicabilityof IPSO for RNA secondary structure prediction was shown.Xing et al. [17, 18] proposed PSOfold based on IPSO. Anadaptive parameter controller of PSO based on fuzzy logicis used to improve the balance between exploration andexploitation. Solution conversion strategy (SCS) is designedto enhance the PSO performance in discrete problem such asstem combination.
Themetaheuristicmethods [19, 20]mentioned previouslyonly paid attention to structure of the sequence but ignoredthe searching capability of algorithm. PSOfold is our previouswork with an attempt to enhance the searching range in PSO,but the crucial stems are not considered. In this paper, weproposed PAF to improve the exploration ability and focusedon the influence of the crucial stems.
The main contributions of this paper are described asfollows.
(1) A framework, namely, PAF, was proposed for RNAsecondary structure prediction, which includes CSSand GSB.
(2) In CSS, MACO was proposed to search the crucialstems.
(3) InGSB,MPSOwas designed to construct all the stemsin one sequence.
The rest of the paper is organized as follows. Section 2 brieflyintroduces the theory of ACO and PSO. In Section 3, wepresent the proposed PAF framework and describe the imple-mentation of CSS and GSB. In Section 4, the experimentresults on various public sequences are discussed. Finally, wedraw the conclusions of this paper in Section 5.
2. Basic Theory
2.1. ACO. ACO algorithm is biologically inspired from thebehavior of colonies of real ants, and in particular howthey forage for food. ACO has been formalized into ametaheuristic for combinatorial optimization problems byDorigo and coworkers [21].
In ACO, an ant 𝑘 being in node 𝑖 chooses the next node𝑗 with a probability given by the random proportional ruledefined as follows [22].
(a) State Transition Rule. Consider
𝑃𝑖𝑗 (𝑡) =
{{{
{{{
{
[𝜏𝑖𝑗 (𝑡)] ⋅ [𝜂𝑖𝑗]
𝛽
∑𝑗∈𝐼𝑘
𝑖
[𝜏𝑖𝑗 (𝑡)] ⋅ [𝜂𝑖𝑗]
𝛽if 𝑗 ∈ 𝐼𝑘
𝑖,
0 otherwise,
(1)
where 𝐼𝑘𝑖is its feasible neighborhood. The feasible neighbor-
hood excludes nodes already visited in the partial tour of ant𝑖, and it may be further restricted to a candidate set of thenearest neighbors of a city 𝑖. Once an ant has visited all nodes,it returns to its starting node.
(b) State Updating Rule. After all ants have completed theirsolutions, pheromone evaporation on all nodes is triggeredaccording to (2). The pheromone on each edge is updatedaccording to the following equation:
𝜏𝑖𝑗 (𝑡 + 1) = (1 − 𝜌) ⋅ 𝜏
𝑖𝑗 (𝑡) +
𝑁
∑
𝑘=1
Δ𝜏𝑘
𝑖𝑗(𝑡) , (2)
where𝑚 is the number of ants at each iteration and 𝜌 ∈ (0, 1)is the pheromone evaporation rate. Consider
Δ𝜏𝑘
𝑖𝑗={
{
{
𝑄
𝐿𝑘
if 𝜏𝑖𝑗∈ tour done by ant 𝑘,
0 otherwise,(3)
where 𝐿𝑘denotes the tour length and 𝑄 is a predefined
constant.
2.2. PSO. PSO originated from the simulation of socialbehavior of birds in a flock [23, 24]. In PSO, each particle fliesin the search space with a velocity adjusted by its own flyingmemory and its companion’s flying experience. All particles
Mathematical Problems in Engineering 3
have objective function values which are decided by a fitnessfunction. Consider the following:
V𝑡𝑖𝑑= 𝑤 × V𝑡−1
𝑖𝑑+ 𝑐1× 𝑟1(𝑝𝑡
𝑖𝑑− 𝑥𝑡
𝑖𝑑) + 𝑐2× 𝑟2(𝑝𝑡
𝑔𝑑− 𝑥𝑡
𝑖𝑑) ,
𝑑 = 1, 2, 3, 4, . . . , 𝐷,
(4)
where 𝑐1indicates the cognition learning factor, 𝑐
2indicates
the social learning factor, and 𝑟1and 𝑟2are random numbers
uniformly distributed in𝑈(0, 1). Each particle then moves toa new potential solution based on the following equation:
𝑥𝑡+1
𝑖𝑑= 𝑥𝑡
𝑖𝑑+ V𝑡𝑖𝑑, 𝑑 = 1, 2, . . . , 𝐷. (5)
Kennedy and Eberhart [25] proposed a binary PSO inwhich a particle moves in a state space restricted to 0 and 1 oneach dimension, in terms of the changes in probabilities thata bit will be in one state or the other. Consider the following:
𝑥𝑖𝑑= {
1, rand () < 𝑆 (V𝑖,𝑑) ,
0, otherwise,
𝑆 (V) =1
1 + 𝑒−V.
(6)
The function 𝑆(V) is a sigmoid limiting transformationand rand() is a random number selected from a uniformdistribution in [0.0, 1.0].
3. PAF
3.1. CSS
3.1.1. MACO
(1) State Transition Rule. The task of each ant is to build aset of stems. The ants find an RNA secondary structure viaa probabilistic decision rule to move through adjacent states.An ant selects a stem as follows:
𝑃𝑖=
{{{
{{{
{
[𝜏𝑖]𝛼[𝜂𝑖]𝛽
∑𝑗∈𝐼𝑘
𝑖
[𝜏𝑗]𝛼
[𝜂𝑗]𝛽
if 𝑗 ∈ 𝐼𝑘𝑖,
0 otherwise,
(7)
where 𝛼 and 𝛽 are the regulatory factors, 𝜏𝑖is the amount of
pheromone trail on stem 𝑖, 𝜂𝑖is the priori available heuristic
information, and 𝐼𝑘𝑖is the remaining stems.
(2) State Update Rule. The pheromone trails are updatedaccording to (8) and (9). Consider
𝜏 = (1 − 𝜌) ⋅ 𝜏𝑖+
𝑛
∑
𝑘=1
Δ𝜏𝑘
𝑖, (8)
where 𝜌 is the pheromone trail evaporation rate and 𝜏𝑖is the
quantity per unit of length of the trail substance that is laidon stem 𝑖 by the 𝑘th ant. Also,
Δ𝜏𝑘
𝑖= {
Energy if 𝑘 uses stem 𝑖 in its tour0 otherwise,
(9)
where Energy represents the quality of an ant’s solution. Ifstem 𝑖 is not included, the zero is returned.
3.1.2. Algorithm of MACO. See Algorithm 1.
3.2. GSB
3.2.1. MPSO. MPSO was modified based on our previousstudies IPSO [16] and PSOfold [18] which could predict theRNA secondary structure with excellent performance. Theobjective function is improved according to the size of stemand the number of pseudoknots. Consider the following:
𝑓𝑖= 𝑎𝐸𝑖− 𝑏[
[
∑𝑁
𝑗=1𝛿 (𝑗)
𝑃
]
]
− 𝑐[∑𝑀
𝑘=1𝜑 (𝑘) /𝐿 + 𝑆
𝑊] , (10)
where 𝑎, 𝑏, 𝑐 is the weight; 𝐸𝑖is the free energy for the
secondary structure in the 𝑖th particle; 𝛿 is the number ofpairs of the 𝑗th stem; 𝑃 is the length of possible pairs; 𝜑 isthe size of stem 𝑘 which is higher than 4; 𝑀 is the numberof selected stems; 𝐿 is the total number of stems which arehigher than 4; 𝑆 is the size of pseudoknots; 𝑊 is the size ofpossible pairs.
3.2.2. Algorithm of MPSO. See Algorithm 2.
4. Results
The parameter details of ACRNA are number of ants = 100,number of iterations = 600, 𝜌 = 0.2, 𝛼 = 1, and 𝛽 = 1. For IPSO,number of particles = 100, number of iterations = 600, 𝜔 =0.9, 𝑐1= 2, and 𝑐
2= 2. For PSOfold, number of particles = 100,
number of iterations = 600,𝜔= 0.9, 𝑐1= 2, and 𝑐
2= 2. For CSS,
number of ants = 100, number of iterations = 600, 𝜌 = 0.2,𝛼 = 1, and𝛽 = 1. For GSB, number of particles = 100, numberof iterations = 600, 𝜔 = 0.9, 𝑐
1= 2, and 𝑐
2= 2. To generate the
mfold results presented here, themfoldWeb server version 3.1was used with default settings. One noteworthy setting is thepercentage of suboptimality. This percentage allows the userto control the number of suboptimal structures predicted bymfold. In this experiment, the value was set to return the 5percent lowest energy structures.
The measures used for prediction accuracy on the major-ity of documents currently are sensitivity, specificity, andF-measure. In RNA secondary structure prediction, TP(true positive) indicates the number of base pairs predictedcorrectly; FN (false negative) denotes the number of basepairs which existed in real structure but were not predictedcorrectly; FP (false positive) represents the number of basepairs which existed in no real structure but was mistakenly

4 Mathematical Problems in Engineering
Table 1: RNA sequence details.
Organism Accession number RNA class Length Base pairs in known structureDrosophila virilis X05914 16S rRNA 784 233Xenopus laevis M27605 16S rRNA 945 251Haloarcula marismortui AF034620 5S rRNA 122 38Aureoumbra lagunensis U40258 Group I intron, 16S rRNA 468 113Metahizium anisopliae var. AF197120 Group I intron, 23S rRNA 394 120Hildenbrandia rubra L19345 Group I intron, 16S rRNA 543 138Acanthamoeba griffini U02540 Group I intron, 16S rRNA 556 131Homo sapiens J01415 16S rRNA 954 266Ailurus fulgens Y08511 16S rRNA 964 265Sulfolobus acidocaldarius D14876 16S rRNA 1494 468
Table 2: A comparison of the highest matching base pair structures from PAF and mfold in terms of sensitivity, specificity, and 𝐹-measure.
Sequence Known bps Predicted bps TP FP FN Sensitivity Specificity 𝐹-measurePAF mfold PAF mfold PAF mfold PAF mfold PAF mfold PAF mfold PAF mfold
D. virilis 233 247 252 103 82 144 170 130 151 44.2 35.2 41.7 32.5 42.9 33.8X. laevis 251 235 245 116 113 119 132 135 138 46.2 45.0 49.4 46.1 47.7 45.6H. marismortui 38 31 34 28 29 3 5 10 9 73.7 76.3 90.3 85.3 81.2 80.6A. lagunensis 113 124 133 85 74 39 59 28 39 75.2 65.5 68.6 55.6 71.7 60.2M. anisopliae var. 120 110 116 91 92 19 24 29 28 75.8 76.7 82.7 79.3 79.1 78.0H. rubra 138 141 167 82 83 59 84 56 55 59.4 60.1 58.1 49.7 58.8 54.4A. griffini 131 160 174 102 95 58 79 29 36 77.9 72.5 63.8 54.6 70.1 62.3H. sapiens 266 260 258 124 95 136 163 142 171 46.6 35.7 47.7 36.8 47.2 36.3A. fulgens 265 249 241 99 74 150 167 166 191 37.4 27.9 39.8 30.7 38.5 29.2S. acidocaldarius 468 483 496 281 271 202 225 187 197 60 57.9 58.1 54.6 59.1 56.2Averages 202.3 204 211.6 111.1 100.8 92.9 110.8 91.2 101.5 59.64 55.28 60.02 52.52 59.63 53.66
Table 3: A comparison of the highest matching base pair structures from SARNA-predict, RnaPredict, ACRNA, PAF, PSOfold, and mfold interms of sensitivity and specificity.
Sequence Length SARNA-Predict RnaPredict ACRNA PAF PSOfold mfoldSe Sp Se Sp Se Sp Se Sp Se Sp Se Sp
D. virilis 784 42.1 42.2 27.9 26.9 27.9 26.9 44.2 41.7 42.9 41.5 35.2 32.5X. laevis 945 46.2 48.9 37.1 38.8 45.8 46.9 46.2 49.4 45.6 48.5 45.0 46.1H. marismortui 122 71.1 90.0 71.1 90.0 76.3 78.4 73.7 90.3 71.1 87.1 76.3 85.3A. lagunensis 468 74.3 64.6 60.2 51.9 63.7 54.1 75.2 68.6 76.1 64.7 65.5 55.6M. anisopliae var. 394 63.3 65.0 62.5 62.0 63.3 65.0 75.8 82.7 75.0 74.4 76.7 79.3H. rubra 543 64.5 56.7 57.2 49.1 58.0 47.9 59.4 58.1 58.0 53.0 60.1 49.7A. griffini 556 74.0 58.8 61.8 50.3 73.3 55.2 77.9 63.8 76.3 59.2 72.5 54.6H. sapiens 954 44.7 48.8 33.5 35.6 44.7 48.8 46.6 47.7 44.4 47.2 35.7 36.8A. fulgens 964 35.1 38.9 30.9 33.9 34.3 38.7 37.4 39.8 35.1 39.6 27.9 30.7S. acidocaldarius 1494 52.4 51.9 52.4 51.9 58.3 58.0 60 58.1 58.3 58.0 57.9 54.6Averages 722.4 56.77 56.58 49.46 49.04 54.56 51.99 59.64 60.02 58.28 57.32 55.28 52.52

Mathematical Problems in Engineering 5
Initialize the parameters of MACORandomly initialize the solutions for all the antsWhile current number of iterations <Max iteration
For each ant in the populationFor each stem
Decide whether to select current stem according to (7)End forEvaluate the solution according to the energy.
End forFor each stem in the set
Update the pheromones according to (8) and (9)End for
End while
Algorithm 1
Initialize all the parameters of MPSOWhile current number of iterations <Max iteration
For each particleUpdate its velocityUpdate its positionRestrict position and velocityCalculate fitness and Update local best
End forUpdate the global bestTurn the parameters of MPSO via fuzzy logic controllers
End while
Algorithm 2
70
60
50
40
30
20
70
60
50
40
30
20
Sens
itivi
ty (%
)
0 100 200 300 400 500 600
0 100 200 300 400 500 600
Number of iterations
ACRNAIPSO
PAFPSOfold
Figure 1: Average best sensitivity by running the algorithms 10 timeson A. griffini.
predicted; TN (true negative) stands for the number ofbase pairs which were not matched and predicted correctly.The TN is rarely used in actual measurement because it isgenerally much larger than TP, FN, and FP. Sensitivity (Se)
0 100 200 300 400 500 600
0 100 200 300 400 500 600
Number of iterationsACRNAIPSO
PAFPSOfold
55
50
60
45
40
35
30
25
55
50
60
45
40
35
30
25
Sens
itivi
ty (%
)
Figure 2: Average best sensitivity by running the algorithms 10times on H. rubra.
means the percentage of all base pairs which was correctlypredicted in the real structure; specific (Sp) refers to thepercentage of all predicted base pairs which was correctlypredicted.The general prediction is very difficult for both and
6 Mathematical Problems in Engineering
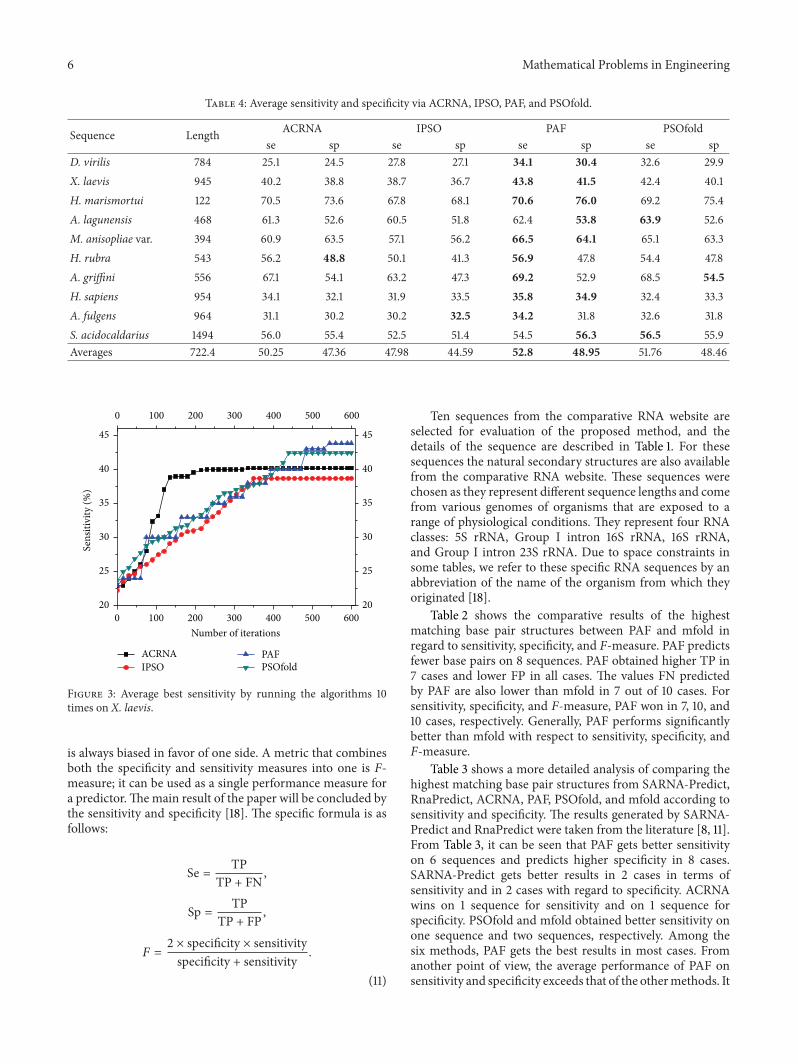
Table 4: Average sensitivity and specificity via ACRNA, IPSO, PAF, and PSOfold.
Sequence Length ACRNA IPSO PAF PSOfoldse sp se sp se sp se sp
D. virilis 784 25.1 24.5 27.8 27.1 34.1 30.4 32.6 29.9X. laevis 945 40.2 38.8 38.7 36.7 43.8 41.5 42.4 40.1H. marismortui 122 70.5 73.6 67.8 68.1 70.6 76.0 69.2 75.4A. lagunensis 468 61.3 52.6 60.5 51.8 62.4 53.8 63.9 52.6M. anisopliae var. 394 60.9 63.5 57.1 56.2 66.5 64.1 65.1 63.3H. rubra 543 56.2 48.8 50.1 41.3 56.9 47.8 54.4 47.8A. griffini 556 67.1 54.1 63.2 47.3 69.2 52.9 68.5 54.5H. sapiens 954 34.1 32.1 31.9 33.5 35.8 34.9 32.4 33.3A. fulgens 964 31.1 30.2 30.2 32.5 34.2 31.8 32.6 31.8S. acidocaldarius 1494 56.0 55.4 52.5 51.4 54.5 56.3 56.5 55.9Averages 722.4 50.25 47.36 47.98 44.59 52.8 48.95 51.76 48.46
ACRNAIPSO
PAFPSOfold
0 100 200 300 400 500 600
0 100 200 300 400 500 600
Number of iterations
45
40
35
30
25
20
45
40
35
30
25
20
Sens
itivi
ty (%
)
Figure 3: Average best sensitivity by running the algorithms 10times on X. laevis.
is always biased in favor of one side. A metric that combinesboth the specificity and sensitivity measures into one is F-measure; it can be used as a single performance measure fora predictor.Themain result of the paper will be concluded bythe sensitivity and specificity [18]. The specific formula is asfollows:
Se = TPTP + FN
,
Sp = TPTP + FP
,
𝐹 =2 × specificity × sensitivityspecificity + sensitivity
.
(11)
Ten sequences from the comparative RNA website areselected for evaluation of the proposed method, and thedetails of the sequence are described in Table 1. For thesesequences the natural secondary structures are also availablefrom the comparative RNA website. These sequences werechosen as they represent different sequence lengths and comefrom various genomes of organisms that are exposed to arange of physiological conditions. They represent four RNAclasses: 5S rRNA, Group I intron 16S rRNA, 16S rRNA,and Group I intron 23S rRNA. Due to space constraints insome tables, we refer to these specific RNA sequences by anabbreviation of the name of the organism from which theyoriginated [18].
Table 2 shows the comparative results of the highestmatching base pair structures between PAF and mfold inregard to sensitivity, specificity, and F-measure. PAF predictsfewer base pairs on 8 sequences. PAF obtained higher TP in7 cases and lower FP in all cases. The values FN predictedby PAF are also lower than mfold in 7 out of 10 cases. Forsensitivity, specificity, and F-measure, PAF won in 7, 10, and10 cases, respectively. Generally, PAF performs significantlybetter than mfold with respect to sensitivity, specificity, andF-measure.
Table 3 shows a more detailed analysis of comparing thehighest matching base pair structures from SARNA-Predict,RnaPredict, ACRNA, PAF, PSOfold, and mfold according tosensitivity and specificity. The results generated by SARNA-Predict and RnaPredict were taken from the literature [8, 11].From Table 3, it can be seen that PAF gets better sensitivityon 6 sequences and predicts higher specificity in 8 cases.SARNA-Predict gets better results in 2 cases in terms ofsensitivity and in 2 cases with regard to specificity. ACRNAwins on 1 sequence for sensitivity and on 1 sequence forspecificity. PSOfold and mfold obtained better sensitivity onone sequence and two sequences, respectively. Among thesix methods, PAF gets the best results in most cases. Fromanother point of view, the average performance of PAF onsensitivity and specificity exceeds that of the othermethods. It
Mathematical Problems in Engineering 7
is demonstrated that PAF is significantly superior to the other5 methods.
In order to validate the stability of the proposed method,we ran ACRNA, IPSO, PAF, and PSOfold ten times andcalculated the average highest matching base pair structuresof each algorithm in terms of sensitivity and specificity. Thedetail results are shown in Table 4. From Table 4, it is easyto see that PAF obtains best sensitivity and specificity on8 sequences and on 7 sequences, respectively. Thus, thisproves that the proposedmethod performs stably onmultiplesequences, considerably surpassing the other methods. Theconvergence progress is shown in Figures 1, 2, and 3. Fromthe figures, we can clearly see that the proposedmethod couldavoid trapping in the local optimum during the iterations.This is because the crucial stems lead the algorithm to theright direction.
5. Conclusion
In this paper, a framework, PAF, was proposed for RNAsecondary structure prediction, which consists of CSS andGSB. In order to preserve crucial structures, MACO in CSSis proposed to find the important stems. MPSO in GSB isdeveloped to generate predicted structures in order to savesearching spaces. The experimental results show that theperformance of the proposed method is significantly betterthan those of the other metaheuristic methods in terms ofsensitivity, specificity, and F-measure. We will try to enhancethe performance of convergence and reduce time complexityin the future.
Acknowledgment
This research was supported by The Chinese Government’sExecutive Program “Instrumentation development and fieldexperimentation” (SinoProbe-09).
References
[1] D.H.Mathews andD.H. Turner, “Prediction of RNA secondarystructure by free energy minimization,” Current Opinion inStructural Biology, vol. 16, no. 3, pp. 270–278, 2006.
[2] S. Ray and S. Pal, “RNA secondary structure prediction usingsoft computing,” IEEE/ACM Transactions on ComputationalBiology and Bioinformatics, vol. 99, pp. 1–16, 2012.
[3] E. Khosravani, G. Moradi, and S. Sajjadifar, “An accuratethermodynamic model to predict phase behavior of clathratehydrates in the absence and presence of methanol based on thegenetic algorithm,” Journal of Chemical Thermodynamics, vol.57, pp. 286–294, 2013.
[4] Y. Liu, G. Wang, H. Chen, H. Dong, X. Zhu, and S. Wang, “Animproved particle swarm optimization for feature selection,”Journal of Bionic Engineering, vol. 8, no. 2, pp. 191–200, 2011.
[5] Y. Li, G.Wang, andH. Chen, “An ant colony optimization baseddimension reduction method for high-dimensional datasets,”Journal of Bionic Engineering, vol. 10, no. 2, pp. 242–250, 2013.
[6] D. F. Ouyang, “Investigating the molecular structures of soliddispersions by the simulated annealing method,” ChemicalPhysics Letters, vol. 554, pp. 177–184, 2012.
[7] B. A. Shapiro and J. C. Wu, “An annealing mutation operator inthe genetic algorithms for RNA folding,”Computer Applicationsin the Biosciences, vol. 12, no. 3, pp. 171–180, 1996.
[8] H. H. Tsang and K. C. Wiese, “SARNA-predict: accuracyimprovement of RNA secondary structure prediction usingpermutation-based simulated annealing,” IEEE/ACM Transac-tions on Computational Biology and Bioinformatics, vol. 7, no. 4,pp. 727–740, 2010.
[9] G. Benedetti and S.Morosetti, “A genetic algorithm to search foroptimal and suboptimal RNA secondary structures,” Biophysi-cal Chemistry, vol. 55, no. 3, pp. 253–259, 1995.
[10] B. A. Shapiro, D. Bengali, W. Kasprzak, and J. C. Wu, “RNAfolding pathway functional intermediates: their prediction andanalysis,” Journal of Molecular Biology, vol. 312, no. 1, pp. 27–44,2001.
[11] K. C. Wiese, A. A. Deschenes, and A. G. Hendriks,“RnaPredict—an evolutionary algorithm for RNAsecondary structure prediction,” IEEE/ACM Transactionson Computational Biology and Bioinformatics, vol. 5, no. 1, pp.25–41, 2008.
[12] K. C. Wiese and A. Hendriks, “Comparison of P-RnaPredictandmfold-algorithms forRNAsecondary structure prediction,”Bioinformatics, vol. 22, no. 8, pp. 934–942, 2006.
[13] J. Yu, C. Zhang, Y. Liu, and X. Li, “Simulating the foldingpathway of RNA secondary structure using the modified antcolony algorithm,” Journal of Bionic Engineering, vol. 7, no. 4,pp. 382–389, 2010.
[14] M. Geis and M. Middendorf, “A particle swarm optimizer forfinding minimum free energy RNA secondary structures,” inProceedings of the IEEE Swarm Intelligence Symposium (SIS ’07),pp. 1–8, Honolulu, Hawaii, USA, April 2007.
[15] M. Neethling and A. P. Engelbrecht, “Determining RNA sec-ondary structure using set-based particle swarm optimization,”in Proceedings of the IEEE Congress on Evolutionary Computa-tion (CEC ’06), pp. 1670–1677, Vancouver, Canada, July 2006.
[16] Y. Liu, H. Dong, H. Zhang, G. Wang, Z. Li, and H. Chen,“Prediction of RNA secondary structure based on particleswarmoptimization,”Chemical Research in Chinese Universities,vol. 27, no. 1, pp. 108–112, 2011.
[17] C. Xing, G. Wang, Y. Wang, W. Shen, Y. Liang, and Z. Ji,“A novel method for RNA secondary structure prediction,”in Proceedings of the 7th International Conference on NaturalComputation (ICNC ’11), pp. 1136–1140, Shanghai, China, July2011.
[18] C. Xing, G. Wang, Y. Wang, Y. Zhou, K. Wang, and L.Fan, “PSOfold: a metaheuristic for RNA folding,” Journal ofComputational Information Systems, vol. 8, no. 2, pp. 915–923,2012.
[19] X. Li and M. Yin, “Application of differential evolution algo-rithm on self-potential data,” PLoS ONE, vol. 7, no. 12, ArticleID e51199, 2012.
[20] X. Li and M. Yin, “An opposition-based differential evolutionalgorithm for permutation flow shop scheduling based ondiversity measure,” Advances in Engineering Software, vol. 55,pp. 10–31, 2013.
[21] M. Dorigo, G. Di Caro, and L.M. Gambardella, “Ant algorithmsfor discrete optimization,” Artificial Life, vol. 5, no. 2, pp. 137–172, 1999.
[22] M.Dorigo, V.Maniezzo, andA. Colorni, “Ant system: optimiza-tion by a colony of cooperating agents,” IEEE Transactions onSystems, Man, and Cybernetics B, vol. 26, no. 1, pp. 29–41, 1996.

8 Mathematical Problems in Engineering
[23] J. Kennedy and R. Eberhart, “Particle swarm optimization,”in Proceedings of the IEEE International Conference on NeuralNetworks, pp. 1942–1948, December 1995.
[24] R. Eberhart and J. Kennedy, “New optimizer using particleswarm theory,” in Proceedings of the 6th International Sympo-sium onMicroMachine and Human Science, pp. 39–43, October1995.
[25] J. Kennedy and R. C. Eberhart, “Discrete binary version ofthe particle swarm algorithm,” in Proceedings of the IEEEInternational Conference on Systems, Man, and Cybernetics, pp.4104–4108, October 1997.

Submit your manuscripts athttp://www.hindawi.com
Hindawi Publishing Corporationhttp://www.hindawi.com Volume 2014
MathematicsJournal of
Hindawi Publishing Corporationhttp://www.hindawi.com Volume 2014
Mathematical Problems in Engineering
Hindawi Publishing Corporationhttp://www.hindawi.com
Differential EquationsInternational Journal of
Volume 2014
Applied MathematicsJournal of
Hindawi Publishing Corporationhttp://www.hindawi.com Volume 2014
Probability and StatisticsHindawi Publishing Corporationhttp://www.hindawi.com Volume 2014
Journal of
Hindawi Publishing Corporationhttp://www.hindawi.com Volume 2014
Mathematical PhysicsAdvances in
Complex AnalysisJournal of
Hindawi Publishing Corporationhttp://www.hindawi.com Volume 2014
OptimizationJournal of
Hindawi Publishing Corporationhttp://www.hindawi.com Volume 2014
CombinatoricsHindawi Publishing Corporationhttp://www.hindawi.com Volume 2014
International Journal of
Hindawi Publishing Corporationhttp://www.hindawi.com Volume 2014
Operations ResearchAdvances in
Journal of
Hindawi Publishing Corporationhttp://www.hindawi.com Volume 2014
Function Spaces
Abstract and Applied AnalysisHindawi Publishing Corporationhttp://www.hindawi.com Volume 2014
International Journal of Mathematics and Mathematical Sciences
Hindawi Publishing Corporationhttp://www.hindawi.com Volume 2014
The Scientific World JournalHindawi Publishing Corporation http://www.hindawi.com Volume 2014
Hindawi Publishing Corporationhttp://www.hindawi.com Volume 2014
Algebra
Discrete Dynamics in Nature and Society
Hindawi Publishing Corporationhttp://www.hindawi.com Volume 2014
Hindawi Publishing Corporationhttp://www.hindawi.com Volume 2014
Decision SciencesAdvances in
Discrete MathematicsJournal of
Hindawi Publishing Corporationhttp://www.hindawi.com
Volume 2014 Hindawi Publishing Corporationhttp://www.hindawi.com Volume 2014
Stochastic AnalysisInternational Journal of

![ACODeRA: A Novel ACO Based on Demand Routing Algorithm for ... · A number of Swarm Intelligence (SI) based, more specially Ant Colony Optimization (ACO) [8-14] based routing algorithms](https://static.fdocuments.in/doc/165x107/5f1063bd7e708231d448df0e/acodera-a-novel-aco-based-on-demand-routing-algorithm-for-a-number-of-swarm.jpg)