Research Article A Global Multilevel Thresholding Using ...
24
Research Article A Global Multilevel Thresholding Using Differential Evolution Approach Kanjana Charansiriphaisan, Sirapat Chiewchanwattana, and Khamron Sunat Department of Computer Science, Faculty of Science, Khon Kaen University, Khon Kaen 40002, ailand Correspondence should be addressed to Khamron Sunat; khamron [email protected] Received 3 October 2013; Revised 23 January 2014; Accepted 3 February 2014; Published 20 March 2014 Academic Editor: Yi-Hung Liu Copyright © 2014 Kanjana Charansiriphaisan et al. is is an open access article distributed under the Creative Commons Attribution License, which permits unrestricted use, distribution, and reproduction in any medium, provided the original work is properly cited. Otsu’s function measures the properness of threshold values in multilevel image thresholding. Optimal threshold values are necessary for some applications and a global search algorithm is required. Differential evolution (DE) is an algorithm that has been used successfully for solving this problem. Because the difficulty of a problem grows exponentially when the number of thresholds increases, the ordinary DE fails when the number of thresholds is greater than 12. An improved DE, using a new mutation strategy, is proposed to overcome this problem. Experiments were conducted on 20 real images and the number of thresholds varied from 2 to 16. Existing global optimization algorithms were compared with the proposed algorithms, that is, DE, rank-DE, artificial bee colony (ABC), particle swarm optimization (PSO), DPSO, and FODPSO. e experimental results show that the proposed algorithm not only achieves a more successful rate but also yields a lower threshold value distortion than its competitors in the search for optimal threshold values, especially when the number of thresholds is large. 1. Introduction resholding is the simplest and most commonly used method of image segmentation. It can be bilevel or multilevel [1]. Both of these types can be classified into parametric and nonparametric approaches [1]. Surveys of thresholding techniques for image segmentation can be found in [2–7]. e surveys revealed that Otsu’s method is a commonly used technique [4, 8]. is method finds the optimal thresholds by maximizing the weighted sum of between-class variances (BCV) [9]. e BCV function is also called Otsu’s function. However, the solution finding process is an exhaustive search and it is a very time-consuming process because the complex- ity grows exponentially with the number of thresholds. Multilevel image thresholding based on Otsu’s function has been used as a benchmark for comparing the capability of evolutionary algorithms (EA). e EA is a nongradient based optimization algorithm. Several algorithms have been widely applied to solve multilevel thresholding. A group of successful works were based on a combination of Otsu’s function with some state-of-the-art algorithms: PSO [10], DE [11], ABC [12], and FOSPSO [13]. Kulkarni and Venayagamoorthy [14] showed that PSO was faster than Otsu’s method in searching the optimal thresholds of multilevel image thresholding. Akay [15] presented a comprehensive comparative study of the ABC and PSO algorithms. e results showed that the ABC algorithm with both the between-class variance and the entropy criterion can be efficiently used in multilevel thresholding. Hammouche et al. [16] focused on solving the image thresholding problem by combining Otsu’s function with metaheuristic techniques, that is, genetic algorithm (GA), PSO, DE, ant colony, simulated annealing, and Tabu search. eir results revealed that DE was the most efficient with respect to the quality of solution. Osuna-Enciso et al. [17] presented an empirical comparative study of the ABC, PSO, and DE algorithms to perform image thresholding using a mixture of Gaussian functions. e results showed that the DE algorithm was superior in performance in minimizing the Hellinger distance and used less evaluations of the Hellinger distance. Ghamisia et al. [18] showed that a global optimal search for optimal threshold values of Otsu’s function was essential for the multilevel segmentation of multispectral and hyperspectral images. Hindawi Publishing Corporation Mathematical Problems in Engineering Volume 2014, Article ID 974024, 23 pages http://dx.doi.org/10.1155/2014/974024
Transcript of Research Article A Global Multilevel Thresholding Using ...

Research ArticleA Global Multilevel Thresholding Using DifferentialEvolution Approach
Kanjana Charansiriphaisan Sirapat Chiewchanwattana and Khamron Sunat
Department of Computer Science Faculty of Science Khon Kaen University Khon Kaen 40002 Thailand
Correspondence should be addressed to Khamron Sunat khamron sunatyahoocom
Received 3 October 2013 Revised 23 January 2014 Accepted 3 February 2014 Published 20 March 2014
Academic Editor Yi-Hung Liu
Copyright copy 2014 Kanjana Charansiriphaisan et al This is an open access article distributed under the Creative CommonsAttribution License which permits unrestricted use distribution and reproduction in any medium provided the original work isproperly cited
Otsursquos function measures the properness of threshold values in multilevel image thresholding Optimal threshold values arenecessary for some applications and a global search algorithm is required Differential evolution (DE) is an algorithm that has beenused successfully for solving this problem Because the difficulty of a problem grows exponentially when the number of thresholdsincreases the ordinaryDE fails when the number of thresholds is greater than 12 An improvedDE using a newmutation strategy isproposed to overcome this problem Experiments were conducted on 20 real images and the number of thresholds varied from 2 to16 Existing global optimization algorithms were compared with the proposed algorithms that is DE rank-DE artificial bee colony(ABC) particle swarm optimization (PSO) DPSO and FODPSO The experimental results show that the proposed algorithm notonly achieves a more successful rate but also yields a lower threshold value distortion than its competitors in the search for optimalthreshold values especially when the number of thresholds is large
1 Introduction
Thresholding is the simplest and most commonly usedmethod of image segmentation It can be bilevel or multilevel[1] Both of these types can be classified into parametricand nonparametric approaches [1] Surveys of thresholdingtechniques for image segmentation can be found in [2ndash7]The surveys revealed that Otsursquos method is a commonly usedtechnique [4 8] This method finds the optimal thresholdsby maximizing the weighted sum of between-class variances(BCV) [9] The BCV function is also called Otsursquos functionHowever the solution finding process is an exhaustive searchand it is a very time-consuming process because the complex-ity grows exponentially with the number of thresholds
Multilevel image thresholding based on Otsursquos functionhas been used as a benchmark for comparing the capability ofevolutionary algorithms (EA)The EA is a nongradient basedoptimization algorithm Several algorithms have been widelyapplied to solvemultilevel thresholdingA group of successfulworks were based on a combination of Otsursquos function withsome state-of-the-art algorithms PSO [10] DE [11] ABC[12] and FOSPSO [13] Kulkarni and Venayagamoorthy [14]
showed that PSO was faster than Otsursquos method in searchingthe optimal thresholds of multilevel image thresholdingAkay [15] presented a comprehensive comparative study ofthe ABC and PSO algorithms The results showed that theABC algorithm with both the between-class variance andthe entropy criterion can be efficiently used in multilevelthresholding Hammouche et al [16] focused on solving theimage thresholding problem by combining Otsursquos functionwith metaheuristic techniques that is genetic algorithm(GA) PSO DE ant colony simulated annealing and Tabusearch Their results revealed that DE was the most efficientwith respect to the quality of solution Osuna-Enciso et al[17] presented an empirical comparative study of the ABCPSO andDE algorithms to perform image thresholding usinga mixture of Gaussian functions The results showed that theDE algorithmwas superior in performance inminimizing theHellinger distance and used less evaluations of the Hellingerdistance Ghamisia et al [18] showed that a global optimalsearch for optimal threshold values of Otsursquos function wasessential for the multilevel segmentation of multispectral andhyperspectral images
Hindawi Publishing CorporationMathematical Problems in EngineeringVolume 2014 Article ID 974024 23 pageshttpdxdoiorg1011552014974024
2 Mathematical Problems in Engineering
The DE algorithm was selected for multilevel imagethresholding It is simple to implement and produces goodresults However based on our experiments DE couldnot reach an optimal solution when it was applied to avery difficult problem Therefore a better DE algorithm isrequired We noticed that the mechanism of vector selectionand the size of the higher ranked population are an importantcriterion for success
The contribution of this paper is as followsDE with the onlooker and ranking-based mutation oper-
ation named 119874(120573)119877-DE is proposed to overcome the draw-back of the DE algorithm for multilevel image thresholdingespecially when the number of thresholds is large Theproposed algorithm homogenizes the onlooker phase of theABC algorithm and the ranking-based mutation operatorof the rank-DE [19] The main advantage of the proposedalgorithm is that a user can adjust the balancing of theexploitation and exploration capabilities of the algorithm
To verify the capabilities of the proposed 119874(120573)119877-DEalgorithm experiments to find the optimal solutions inthe multilevel image thresholding when the number ofthresholds ranged from two to 16 were set up It was foundthat the optimal solutions could be effectively reached usingthe proposed 119874(120573)119877-DE algorithm
The remainder of the paper is organized as followsSection 2 describes the multilevel thresholding problemSection 3 presents a brief review of the differential evolutionalgorithm (DE) In Section 4 the proposed new versionof the DE algorithm with the onlooker and ranking-basedmutation operator algorithm 119874(120573)119877-DE is described indetail Section 5 shows the experimental results of applyingthe proposed method to multilevel segmentation in differentimages Finally the conclusion of the paper is discussed inSection 6
2 Multilevel ThresholdingProblem Formulation
Otsursquos method [9] is based on the maximization of thebetween-class variance Consider a digital image having thesize 119867 times 119882 where 119882 is the width and 119867 is the height Thepixels of a given picture are represented in 119871 gray levels andthey are in 0 1 2 119871 minus 1 The number of pixels at level119894 is denoted by 119899
119894and the total number of pixels by 119873 =
1198991+ 1198992+ sdot sdot sdot + 119899
119871 The gray-level histogram is normalized
and regarded as a probability distribution and is written asfollows
119901119894=
119899119894
119873 119901119894ge 0
119871
sum
119894=1
119901119894= 1 (1)
The total mean of the image can be defined as
120583119879=
119871
sum
119894=1
119894 times 119901119894 (2)
The multilevel thresholding with respect to the given 119899 minus 1
threshold values 119905119895 119895 = 1 119899 minus 1 can be performed as
follows
119865 (119909 119910) =
0 119891 (119909 119910) le 1199051
1
2(1199051+ 1199052) 119905
1lt 119891 (119909 119910) le 119905
2
1
2(119905119899minus2
+ 119905119899minus1
) 119905119899minus2
lt 119891 (119909 119910) le 119905119899minus1
119871 119891 (119909 119910) gt 119905119899minus1
(3)
where (119909 119910) is the coordinate of a pixel and 119891(119909 119910) denotesthe intensity level of a pixel The pixels of a given image willbe divided into 119899 classes 119863
1 119863
119899in this regard
The optimal threshold can be determined by maximizingthe between-class variance function (BCV) 1205902
119861 which can be
defined by
1205902
119861=
119899
sum
119895=1
119908119895(120583119895minus 120583119879)2
(4)
where 119895 represents a specific class in such a way that 119908119895and
120583119895are the probability of occurrence and the mean of class
119895 respectively Equation (4) is also called Otsursquos functionThe probabilities of occurrence 119908
119895of classes 119863
1 119863
119899are
defined by
119908119895=
119905119895
sum
119894=1
119901119894 119895 = 1
119905119895
sum
119894=119905119895minus1+1
119901119894 1 lt 119895 lt 119899
119871
sum
119894=119905119895minus1+1
119901119894 119895 = 119899
(5)
The mean of each class 120583119895can be given by
120583119895=
119905119895
sum
119894=1
119894 times 119901119894
119908119895
119895 = 1
119905119895
sum
119894=119905119895minus1+1
119894 times 119901119894
119908119895
1 lt 119895 lt 119899
119871
sum
119894=119905119895minus1+1
119894 times 119901119894
119908119895
119895 = 119899
(6)
Thus the 119899-level thresholding problem is transformed to anoptimization problem The process is to search for 119899 minus 1
thresholds 119905119895that maximize the value 120593 which is generally
defined as
120593 = max1lt1199051ltsdotsdotsdotlt119905119899minus1lt119871
1205902
119861(119905119895) (7)
3 Differential Evolution Algorithm
The DE algorithm is an evolutionary optimization techniqueproposed by Storn and Price [11]Themain procedures of DEare briefly described as follows
Mathematical Problems in Engineering 3
31 Initialization The DE algorithm starts with a popu-lation of initial solutions each of dimension 119863 119883
119894119892=
(1199091198941 1199091198942 119909
119894119863) 119894 = 1 NP where the index 119894 denotes
the 119894th solution or vector of the population 119892 is thegeneration and NP is the population size The initial pop-ulation (at 119892 = 0) is randomly generated to be within thesearch space constrained by the minimum and maximumbounds 119883min = 119909
1min 1199092min 119909119863min and 119883max =
1199091max 1199092max 119909119863max The 119894th vector 119909
119894is initialized as
follows
1199091198951198940
= 119909119895min + rndreal
119894119895 [0 1) sdot (119909119895max minus 119909119895min) (8)
where rndreal119894119895[0 1) is a uniformly distributed random real
number between 0 and 1 (0 le rndreal119894119895[0 1) lt 1)
32 Mutation Operators The differential mutation operatoris one of the three operators of DE The mutation operator isapplied to generate the mutant vector V
119894for each target vector
119909119894in the current population A mutant vector is generated
according to
V119894119892+1
= 1199091199031 119892
+ 119865 sdot (1199091199032 119892
minus 1199091199033 119892
) (9)
where the randomly chosen indexes random indexes1199031 1199032 1199033
isin 1 2 NP are mutually different randominteger indices and they are also different from the runningindex 119894 Further 119894 119903
1 1199032 and 119903
3are different so that NP ge 4
119865 is a real and constant factor 119865 isin [ 0 2] which controls theamplification of the differential variation 119909
1199031 119892is called the
base vector1199091199032119892
is called the terminal vector1199091199033119892
is called theother vector and (119909
1199032 119892minus 1199091199033 119892
) is called the difference vectorThere have been many proposed mutation strategies for
DE [20 21] Each different strategy has different character-istics and is suitable for a set of problems However thechoice of the best mutation operators for DE is difficultfor a specific problem [22ndash24] The ldquoDErand1binrdquo strategyhas been widely used in DE literature [25ndash28] It is morereliable than the strategies based on the best-so-far solutionsuch as ldquoDEbest1rdquo and ldquoDEcurrent-to-best1rdquo HoweverldquoDErand1binrdquo has slower convergence Simply put it hashigh exploration but low exploitation abilities
33 Crossover DE utilizes the crossover operation to gen-erate new solutions by shuffling competing vectors and toincrease the diversity of the population The classical versionof the DE (DErand1bin) uses the binary crossover Itdefines the following trial vector
119906119894119892+1
= (1199061119894119892+1
1199062119894119892+1
119906119863119894119892+1
) (10)
where 119895 = 1 119863 (119863 = problem dimension) and
119906119895119894119892+1
=
V119895119894119892+1
if (randb (119895) le CR) and 119895 = rnbr (119894)
119909119895119894119892
if (randb (119895) gt CR) and 119895 = rnbr (119894) (11)
CR is the crossover rate isin [0 1] randb(119895) is the 119895th evaluationof a uniform random number generator with outcome isin
[0 1] and rnbr(119894) is a randomly chosen index isin 1 2 119863
that ensures 119906119894119892+1
will get at least one parameter from V119894119892+1
34 Selection Selection determines whether the target or thetrial vector survives to the next generation The selectionoperation is described as
119909119894119892+1
=
119906119894119892
if 119891 (119906119894119892) le 119891 (119909
119894119892)
119909119894119892
if 119891 (119906119894119892) gt 119891 (119909
119894119892)
(12)
where 119891(119909) is the objective function to be minimizedTherefore if the objective of the new trial vector 119891(119906
119894119892)
is equal to or less than the objective of the old trial vector119891(119909119894119892) then 119909
119894119892+1is set to 119906
119894119892 otherwise the old value 119909
119894119892
is retainedThe pseudocode of basic DE with ldquoDErand1binrdquo strat-
egy is shown in Algorithm 1The function rndint[1 119863] returns a uniformly distributed
random integer number between 1 and D rndreal119895[0 1) is a
uniformly distributed random real value of [0 1) The wordldquobetterrdquo in line 17 means ldquoless thanrdquo if the problem requiresminimization see (12) and its explanation and it meansldquogreater thanrdquo if the problem requiresmaximizationThe best119883119894119866 where 119866 is the maximum number of generations is the
solution of the algorithm The word ldquobestrdquo also depends onthe type of problem
4 The Proposed DE with Onlooker Ranking-Based Mutation Operator
In 2013 Gong and Cai [19] proposed a rank-DE algorithmThey claimed that probabilistically selecting the vectors 119909
1199031
and 1199091199032in the mutation operator from the better population
can improve the exploitation ability of basic DE To thebest of the authorsrsquo knowledge rank-DE may however alsolead to premature convergence (this will be shown in theexperiments) That means that the rank-DE has too muchexploitation ability Furthermore it cannot balance betweenthe exploration and the exploitation abilities In order tobalance between the two abilities we propose DE withthe onlooker and ranking-based mutation operator named119874(120573)119877-DEThe proposed algorithm is an improvement of therank-DE by homogenizing the rank-DE with the onlookerphase of ABC algorithm The detail of the 119874(120573)119877-DE algo-rithm is described as follows
41 Ranking Assignment To perform the maximization thefitness of each vector is sorted in ascending order (ie fromworst to best) Then the rank of the 119894th vector 119877
119894 is assigned
based on its sorted ordering as follows
119877order = order order = 1 2 NP (13)
As a result the best vector in the current population willobtain the highest ranking that is NP
4 Mathematical Problems in Engineering
(1) Generate the initial population randomly(2) Evaluate the fitness for each individual in the population(3) while the maximum generation G is not reached do(4) for 119894 = 1 to NP do(5) Select uniform randomly 119903
1= 1199032
= 1199033
= 119894
(6) 119895rand = rndint [1 119863]
(7) for 119895 = 1 to119863 do(8) if rndreal
119895[0 1) le CR or 119895 is equal to 119895rand then
(9) 119906119894119895
= 1199091199031 119895
+ 119865 sdot (1199091199032 119895
minus 1199091199033 119895
)
(10) else(11) 119906
119894119895= 119909119894119895
(12) end if(13) end for(14) end for(15) for 119894 = 1 to NP do(16) Evaluate the offspring 119906
119894
(17) if 119891(119906119894) is better than or equal to 119891(119909
119894) then
(18) Replace 119909119894with 119906
119894
(19) end if(20) end for(21) end while
Algorithm 1 The DE algorithm with ldquoDErand1binrdquo strategy
42 Probabilistic Selection After assigning the ranking foreach vector the selection probability 119901
119894of the 119894th vector 119909
119894
is calculated as
119901119894=
119877119894
NP 119894 = 1 2 NP (14)
43 A New Strategy for Base Vector Terminal Pointand the Other Vector Selections
Definition 1 (a worse population and a better population)Let 120577 be a real value and 0 le 120577 lt 1 A population havingprobability less than 120577 is called a worse population and apopulation having probability greater than or equal to 120577 iscalled a better population
In the rank-DE the base vector 1199091199031and the terminal point
1199091199032
were based on their selection probabilities The othervector in themutation operator119909
1199033 is selected randomly as in
the original DE algorithm The vectors with higher rankings(higher selection probabilities) aremore likely to be chosen asthe base vector or the terminal point in themutation operator
Our investigation revealed that if both 1199091199031and 119909
1199032vec-
tors of rank-DE were chosen from better vectors then thedistribution of the target vector may collapse quickly andpossibly lead to premature convergence Accordingly whenthe rank-DE was applied to a very difficult problem it couldnot reach the optimal solution
If the steps of the DE algorithm are compared with theABC algorithm the population in the current generation canbe considered as the employed bees and the population inthe next generation can be considered as the onlooker beesTo follow the concept of ABC a new vector 119909
1199031 which is
called the base vector chooses a food source with respect to
the probability that is computed from the fitness values ofthe current population The probability value 119901
119905 of which
119909119905is chosen by a base vector 119909
1199031can be calculated by using
the expression given in (14) After a base source 1199091199031
fora new vector is probabilistically chosen both 119909
1199032and 119909
1199033
are also chosen in the same manner as the terminal pointand the other vector selections in the rank-DE The targetvector is created by a mutation formula of DE The mutantvector 119906
119894is created after the target vector is crossed with
a randomly selected vector and then the fitness value iscomputedAs in the ordinaryDE a greedy selection is appliedbetween 119906
119894and 119909
119894 Hence the new population contains better
sources and positive feedback behavior appears This ideacan be expressed as pseudocode as in Algorithm 2 Since theselection of 119909
1199031is the onlooker selection and the selections of
1199091199032and 119909
1199033are brought from the rank-DE then the algorithm
is called onlooker and ranking-based vector selectionThe pseudocode of onlooker and ranking-based vector
selection is shown in Algorithm 2 The differences betweenthe original ranking-based and onlooker and ranking basedselection are highlighted by ldquolArrrdquo
The function minprop(120573) is added to generalize thealgorithm Its output depends on the parameter 120573 Theoutcome can be either a constant value of [0 1) or a valueof the uniform random function rndreal[0 1) The balanceof the exploration and exploitation ability can be set by theparameter 120573 And the function is defined by
minprop (120573)
= 120573 if120573 is a constant and 0 le 120573 lt 1
rndreal [0 1) otherwise(15)
Mathematical Problems in Engineering 5
(1) Input The target vector index 119894 the last index of onlooker 1199031 and 120573 lArr
(2) Output The selected vector indexes 1199031 1199032 1199033
(3) 1199031= 1199031+ 1 if 119903
1gt NP then 119903
1= 1 end if lArr
(4) while minprop(120573) gt 1199011199031
onlooker-like selection lArr
(5) 1199031= 1199031+ 1 if 119903
1gt NP then 119903
1= 1 end if lArr
(6) end while(7) Randomly select 119903
2isin 1NP terminal vector index
(8) while rndreal[0 1) gt 1199011199032or 1199032== 119894 or 119903
2== 1199031do
(9) Randomly select 1199032isin 1NP
(10) end while(11) Randomly select 119903
3isin 1NP the other vector index
(12) while 1199033== 1199032or 1199033== 1199031or 1199033== 119894 do
(13) Randomly select 1199033isin 1NP
(14) end while
Algorithm 2 Onlooker and ranking-based vector selection for DE
(1) Randomly generate the initial population(2) Evaluate the fitness for each individual in the population(3) while the maximum generation G is not reached do(4) Sort and rank the fitness values of population according to (13)(5) Calculate the selection probability for each individual according to (14)(6) 119903
1= 0 lArr
(7) for 119894 = 1 to NP do(8) Select 119903
1 1199032 1199033as shown in Algorithm 2 based on the current 119903
1and 120573 lArr
(9) 119895rand = rndint[1 119863]
(10) for 119895 = 1 to119863 do(11) if rndreal
119895[0 1) le CR or 119895 is equal to 119895rand then
(12) 119906119894119895
= 1199091199031 119895
+ 119865 sdot (1199091199032 119895
minus 1199091199033 119895
)
(13) else(14) 119906
119894119895= 119909119894119895
(15) end if(16) end for(17) end for(18) for 119894 = 1 to NP do(19) Evaluate the offspring 119906
119894
(20) if 119891(119906119894) is better than or equal to 119891(119909
119894) then
(21) Replace 119909119894with 119906
119894
(22) end if(23) end for(24) end while
Algorithm 3 DE with onlooker and ranking-based mutation
44TheDEwithOnlooker-Ranking-BasedMutationOperatorThe procedures in Sections 41 42 and 43 are combinedtogether to create a better DE algorithm The parameter 0 le
120573 lt 1 determines the fraction of the worse population tobe eliminated When 120573 = 0 there is no worse populationeach single vector in the current population will act as thebase vector If 0 lt 120573 lt 1 then each single vector havinga probability less than 120573 is a worse vector and will not beselected as the base vector If 120573 is not a constant or is outside[0 1) each single base vector is an onlooker bee Accordinglythe name of the algorithm is Onlooker(120573) Ranking-BaseDifferential Evolution (119874(120573)119877-DE) To achieve the globalsolution a user can set a proper value for 120573 to control
the balance of the exploration and exploitation abilities ofthe algorithm The pseudocode of 119874(120573)119877-DE is shown inAlgorithm 3 and the differences between the rank-DE and119874(120573)119877-DE are highlighted by ldquolArrrdquo
5 Experiments and Results
51 Experimental Setup The global multilevel thresholdingproblem deals with finding optimal thresholds within therange [0 119871 minus 1] that maximize the BCV function Thedimension of the optimization problem is the number ofthresholds 119899 and the search space is [0 119871minus1]119899Theparameter
6 Mathematical Problems in Engineering
120573 of 119874(120573)119877-DE is rndreal[0 1) or is set to be one of 0001 09 The variation of the proposed 119874(120573)119877-DE wasimplemented and compared with the existing metaheuristicsthat performed image thresholding that is PSO DPSOFODPSO ABC and several variations of DE algorithmsAll the methods were programmed in Matlab R2013a andwere run on a personal computer with a 34GHz CPU 8GBRAM with Microsoft Windows 7 64-bit operating systemThe experiments were conducted on 20 real images The 19images namely starfish mountain cactus butterfly circussnow palace flower wherry waterfall bird police ostrichviaduct fish houses mushroom snowmountain and snakewere taken from the Berkeley Segmentation Dataset andBenchmark [29] The last image namely Riosanpablo is asatellite image ldquoNew ISS Eyes see Rio San Pablordquo March 12013 (httpvisibleearthnasagovviewphpid=80561) Eachimage has a unique gray level histogram These originalimages and their histograms are depictedin Figure 1 Anexperiment of an image with a specific number of thresholdsis called a ldquosubproblemrdquo The number of thresholds inves-tigated in the experiments was 2 3 16 Thus there are20 times 15 subproblems per algorithm Each subproblem wasrepeated 50 times and each time is called a run
To compare with PSO ABC and DEs algorithms theobjective function evaluation is computed for NPtimes119873
119894 where
NP is population size and 119873119894is the number of generations
A population of PSO and the DEs calls Otsursquos function onetime per generation The population size in the PSO andDEs algorithms was set to 50 A bee in the ABC calls Otsursquosfunction two times per generation therefore their number offood sources were set to a half of the PSOrsquos size that is 25The stopping criteria were set by the maximum amount ofgenerations 119866 In this experiment 119866 was set to 50 100 150200 300 400 600 800 1000 1500 2000 3000 4000 5000and 6000 when 119899 was 2 3 4 5 6 7 8 9 10 11 12 13 1415 and 16 respectively For the PSO DPSO and FODPSOalgorithms the parameters were set as per the suggestion in[30] and is shown in Table 1 The other control parameterof the ABC algorithm limit was set to 50 [15] The controlparameters 119865 and CR of the DE algorithms were set to 05and 09 respectively [31 32]
52 Comparison Strategies and Metrics To compare theperformance of different algorithms there are three metrics(1) the convergence rate of algorithms was compared by theaverage of generations (NG) a lower NG means a fasterconvergence rate (2) the stability of algorithmswas comparedby the average of the success rate (SRHM) a higher SRHMmeans higher stability (3) the reliability was compared bythe threshold value distortion measure (TVD) a lower TVDmeans higher reliability The details of the three metrics aredescribed as follows
When all 50 runs of an algorithm performing on animage with a specific number of thresholds are terminatedthe outcomes will be analyzed Run 119903rsquoth is called a successfulrun if there is a generation of 119905 le G such that BCV
119903(119905) ge VTR
Table 1 Essential parameters of the PSO DPSO and FODPSOtaken from [30]
Parameter PSO DPSO FODPSOPopulation 50 50 501205881
15 15 151205882
15 15 15119882 12 12 12119881max 2 2 2119881min minus2 minus2 minus2119909max 255 255 255119909min 0 0 0Min population mdash 10 10Max population mdash 50 50No of swarms mdash 4 4Min swarms mdash 2 2Max swarms mdash 6 6Stagnancy mdash 10 10Fractional coefficient mdash mdash 075
and the number of generations (NG) of the successful run isrecorded Thus the number can be defined by
NG119903= ArgMin
119905
(BCV119903 (119905) ge VTR)
if 119903 is a successful run and otherwise undefined(16)
The average of NG119903from those successful runs is represented
by NG as follows
NG =1
number of successful runssum
All successful runsNG119903
(17)
The ratio of success rate (SR) for which the algorithmsucceeds to reach the VTR for each subproblem is computedas
SR =number of successful runs
total number of runs (18)
The experiments were conducted on 20 images The arith-meticmean (AM) ofNG (NGAM) over the entire set of imageswith a specific number of thresholds is calculated as
NGAM =1
119873sum
All imagesNG (19)
where 119873 is the total number of images NGAM is shown inTable 3 The worst-case scenario is that there is no successfulrun for a subproblem this subproblem is called an ldquounsuc-cessful subproblemrdquo If an algorithm encounters this scenariothe subproblem will be grouped by its number of thresholdsand the number of images in the group will be counted andassigned to 119909 These scenarios will be represented by NA(119909)as shown in Tables 3 and 4
Mathematical Problems in Engineering 7
0
400
800
1200
1600
0
400
800
1200
1600
0
400
800
1200
1600
0
1000
2000
3000
4000
0
500
1000
1500
2000
0
500
1000
1500
2000
2500
0 50 100 150 200 250
0 50 100 150 200 250
0 50 100 150 200 250
0
500
1000
1500
2000
0 50 100 150 200 2500 50 100 150 200 250
0
400
800
1200
1600
2000
0 50 100 150 200 250 0 50 100 150 200 250
0 50 100 150 200 2500
400
800
1200
1600
0 50 100 150 200 250
0 50 100 150 200 250
0
400
800
1200
1600
(1) Starfish (481 times 321) (6) Snow (481 times 321)
(2) Mountain (481 times 321)
(3) Cactus (481 times 321)
(4) Butterfly (481 times 321)
(5) Circus (481 times 321)
(8) Flower (481 times 321)
(9) Wherry (321 times 481)
(7) Palace (321 times 481)
(10) Waterfall (321 times 481)
(a)Figure 1 Continued
8 Mathematical Problems in Engineering
0500
1000150020002500
0 50 100 150 200 2500
500
1000
1500
2000
0 50 100 150 200 250
0
400
800
1200
1600
0 50 100 150 200 2500
400
800
1200
1600
2000
0 50 100 150 200 250
0
400
800
1200
1600
2000
0 50 100 150 200 250
0 50 100 150 200 250
0
500
1000
1500
2000
2500
0 50 100 150 200 250
0500
1000150020002500
0 50 100 150 200 250
0500
10001500200025003000
0
2000
4000
6000
8000
0 50 100 150 200 250
0
400
800
1200
1600
0 50 100 150 200 250
(11) Bird (321 times 481)
(12) Police (321 times 481)
(13) Ostrich (321 times 481)
(14) Viaduct (481 times 321)
(15) Fish (481 times 321)
(16) Houses (481 times 321)
(17) Mushroom (321 times 481)
(19) Snake (481 times 321)
(20) Riosanpablo (720 times 944)
(18) Snow mountain (321 times 481)
(b)
Figure 1 The test images and corresponding histograms
Mathematical Problems in Engineering 9
The average of the success rate over the entire dataset witha specific number of thresholds (SRHM) is averaged by theHarmonic mean HM as follows
SRHM =119873
sumAll images (1SR) (20)
The SRHM is very important in measuring the stability ofan algorithm and it means the ratio of runs that are achievingthe target solution Because the evolutionary methods arebased on stochastic searching algorithms the solutions arenot the same in each run of the algorithm and depend on thesearch ability of the algorithmTherefore the SRHM is vital inevaluating the stability of the algorithms The comparison ofthe stability gives us valuable information in terms of the ratiorepresenting the success rates (SRHM) A higher SRHM meansbetter stability of the algorithm
An algorithm producing SRHM lt 05 means that morethan 50 percent of the independent runs of the algorithmcannot reach the global solution Thus the algorithm thatyields SRHM lt 05 should not be selected to solve theproblemThe experiments were conducted for the number ofthresholds varying from 2 to 16These experiments containedthe maximum number of thresholds such that the algorithmyields SRHM ge 05 which is represented by 119899
05in Table 4
Furthermore the experiments also contained the maximumnumber of thresholds that the algorithm can solve and abovethis value there was the case such that all 50 runs of somesubproblems missed the VTRThis number is represented by119899max In this case the success rate was zero and the associatedSRHM was zero too And the definitions of the two values arepresented in (21)
11989905
= max (119899 | 119899 = number of thresholds that
has SRHM ge 05)
119899max = min (119899 | 119899 = number of thresholds that
has SRHM = 0) minus 1
(21)
Let 119899 be the number of thresholdsThe reliability of a solutionis measured by threshold value distortion measure (TVD)and is computed as
TVD =
sumAll images sumrun119903=1
sum119899
119894=1
1003816100381610038161003816119879lowast
119903119894minus 119879119898
119903119894
1003816100381610038161003816
1 + sumAll images sumrun119903=1
sum119899
119894=11119879lowast119903119894= 119879119898119903119894
times (1 minus SR) times 100
(22)
where119879lowast is the threshold value producing the VTR119879119898 is thethreshold value obtained from the algorithm and 1
119879lowast119903119894= 119879119898119903119894is
the indicator function which is equal to 1 when 119879lowast
119903119894= 119879119898
119903119894and
is zero otherwise TVD is zero if the algorithm can reach theVTR in every run The lower the TVD the more reliable thealgorithm is
521 The Value to Reach (VTR) Following the completionof all of the experiments the best values of the between-classvariance and the corresponding thresholds were collected
2 4 6 8 10 12 14 160
200
400
600
800
1000
1200
Number of thresholds
Tres
hold
val
ue d
istor
tion
PSO 120575 = 6798
ABC 120575 = 1925
DE 120575 = 1561
Rank-DE 120575 = 2176
DPSO 120575 = 6113
FODPSO 120575 = 5525
O R 120575 = 1348
O( )R 120575 = 4 3
O( )R 120575 = 3
O( )R 120575 = 2
O( )R 120575 = 769
O( )R 120575 = 494
O( )R 120575 =
Mutlithresh 120575 = 8686
Figure 2The threshold value distortion (TVD) of algorithms versusnumber of thresholds
and are shown in Table 6 The results are shown image byimage and the numbers of thresholds vary from 2 to 16 Thebetween-class variance values in column 3 are used as theVTR values
522 Results Produced by Local Search Method The multi-thresh function of the Matlab toolbox was conducted on thesame images and number of thresholds as the other searchmethods The capabilities of solving the optimal solutionbetween a local search and a global search will be discussedhere This is the reason we focused on the global searchthat is the proposed 119874(00)119877-DE algorithm Table 2 showsthe between-class variances and threshold values of theldquomountainrdquo image These values were the best outcomes of50 runs produced by the multithresh function in the MatlabR2013a toolbox and by the proposed 119874(00)119877-DE algorithmThe terminated condition of the multithresh function was setby ldquoMaxFunEvalsrdquo = 500000That is themultithresh functionperforms more function calls than that of the 119874(00)119877-DEalgorithm It can be seen from columns 3 and 5 that allthe BCVs produced by the 119874(00)119877-DE algorithm are betterthan the BCVs produced by the multithresh function thedifference of the BCVs is shown in column 7 The differencesin the thresholds from the two algorithms shown in column8 tended to be large if the number of thresholds increased
Figure 2 shows the graph of the TVDof all the images andthresholdsThese results are in the same pattern of the resultsof the ldquomountainrdquo image in Table 2 That means the ability tosearch for the optimal solution of the proposed global searchalgorithm is higher than that of the multithresh functionespecially when the number of thresholds is large This goesto illustrate the difficulty of the problem The problem withthis kind is that it can be multimodal [33] or can be anearly flat top surface [34] The multithresh function solvesthe problem by performing the Nelder-Mead Simplex
10 Mathematical Problems in Engineering
Table2Th
ebestvalueso
fthe
between-cla
ssvaria
ncea
ndthresholds
oftheldquomou
ntainrdquo
imagep
rodu
cedby
them
ultithreshfunctio
nof
theM
atlabtoolbo
xandby
thep
ropo
sedO(00)R-D
Ealgorithm
Then
umbero
fthresho
ldsv
ariesfrom
2to
16
Image
(1)
119899 (2)
Prod
uced
bymultithresh
Prod
uced
bytheO
(00)R-D
Ealgorithm
Objdiff
(7)=
(5)minus(3)
Threshdiff
(8)=
sum|(4)minus(6)|
Between-
class
varia
nce
(3)
Thresholds
(4)
Between-
class
varia
nce
(5)
Thresholds
(6)
Mou
ntain
22372886
60127
2372923
61128
0037
23
2495852
3276130
2496113
3377131
0261
34
2551778
3272109145
2551955
3373109147
0177
45
258015
4316898124158
258033
6326999125159
0182
56
2588264
357598118152175
2596956
244674101126160
8692
122
72598800
337098118141166207
2608807
24467398119
145175
10007
153
82605785
316891105121140
163192
2616294
24467397115135160191
10509
709
2619512
27527595111129148168197
2622314
2037547698116136160191
2802
11410
262039
223467397116
135157175204
232
262719
42036537493106121140
163194
6802
258
112625275
23457293105119
137156175204
228
2630496
2036537493105118134152172201
5221
199
122629641
2239587895109123139156177207247
263318
9183145597693105118
134152172201
3548
246
13263137
22038547494107121139157173193224248
2635290
183145597692103115129144161179207
3918
283
142633865
1936537491103115129144
160174190217245
2637088
17294256728696106117130145161179207
3223
307
15263519
0193350698596107121137152167178190212240
2638449
1728395061758897107118131146162179207
3259
351
162636357
163045597793105118133148162176192209230244
2639616
1727384960748695104113123135149164181209
3259
415
Mathematical Problems in Engineering 11
Table3Th
eaverage
ofmeannu
mbero
fgeneration(N
GAM)a
ndrank
softhe
metho
ds
No
maxGen
FODPS
ODPS
OPS
OABC
Rank
-DE
DE
O(rand)R-
DE
O(09)R-
DE
O(08)R-
DE
O(07)R-
DE
O(06)R-
DE
O(05)R-
DE
O(04)R-
DE
O(03)R-
DE
O(02)R-
DE
O(01)R-
DE
O(00)R-
DE
119899=2
119866=50
NGAM
1833
715713
13218
13202
1053
814713
10117
6394
6903
7636
8208
9147
9261
9901
10709
11631
20850
Rank
1615
1312
914
81
23
45
67
1011
17119899=3
119866=100
NGAM
35200
36210
27479
33210
19488
29049
18958
10492
12296
13587
14807
16969
17107
1810
019546
2174
944
192
Rank
1516
1214
913
81
23
45
67
1011
17119899=4
119866=150
NGAM
4539
158683
49596
63251
31060
4813
029595
14733
1852
620885
22815
26632
26456
28058
3017
533499
7210
0Ra
nk12
1514
1610
138
12
34
65
79
1117
119899=5
119866=200
NGAM
55664
81877
87441
108131
4415
769088
41283
19508
2452
428097
30963
36935
3674
838647
41455
45631
100693
Rank
1214
1517
1013
81
23
46
57
911
16119899=6
119866=300
NGAM
NA(2)
10066
41419
37157328
61935
99700
56405
24623
32687
3816
742608
51003
50281
52089
55729
6174
8138716
Rank
1713
1516
1112
91
23
46
57
810
14119899=7
119866=400
NGAM
NA(1)
NA(1)
192267
236928
86938
142096
75340
2976
341691
49408
5619
367619
67063
69696
74389
8332
6184371
Rank
1716
1415
1112
91
23
46
57
810
13119899=8
119866=600
NGAM
NA(7)
NA(6)
NA(2)
NA(1)
117092
198986
100944
33967
51573
62263
7452
391836
89666
9519
8102552
115583
244880
Rank
1716
1514
1112
81
23
46
57
910
13119899=9
119866=800
NGAM
NA(11)
NA(13)
NA(12)
NA(3)
1510
04264253
125299
41228
6374
279432
90201
113530
110416
11439
7122555
137538
2994
92Ra
nk17
1615
1411
129
12
34
65
78
1013
119899=10
119866=1000
NGAM
NA(11)
NA(16)
NA(16)
NA(7)
NA(1)
3213
731477
70NA(3)
73564
9112
1105020
132968
128999
132691
1418
251579
97356546
Rank
1716
1514
1210
813
12
36
45
79
11119899=11
119866=1500
NGAM
NA(16)
NA(17)
NA(19
)NA(9)
NA(1)
405090
185020
NA(3)
NA(2)
NA(2)
127135
162822
157184
160123
175152
198522
434877
Rank
1716
1514
128
613
1010
14
23
57
9119899=12
119866=2000
NGAM
NA(18)
NA(20)
NA(20)
NA(9)
278743
535542
2299
65NA(4)
NA(5)
135266
16004
7205266
1973
86203814
222094
2515
35574104
Rank
1716
1514
128
613
1110
14
23
57
9119899=13
119866=3000
NGAM
NA(20)
NA(19
)NA(20)
NA(14
)NA(3)
NA(3)
275860
NA(12)
NA(5)
NA(1)
NA(1)
NA(1)
NA(1)
2615
22278082
31646
8726521
Rank
1716
1514
129
213
1110
66
61
34
5119899=14
119866=4000
NGAM
NA(20)
NA(20)
NA(20)
NA(14
)NA(4)
NA(4)
330194
NA(11)
NA(8)
NA(4)
NA(1)
NA(2)
296414
NA(1)
3316
26385951
889711
Rank
1716
1514
129
113
1110
78
65
23
4119899=15
119866=5000
NGAM
NA(20)
NA(20)
NA(20)
NA(19
)NA(13)
NA(5)
3992
28NA(11)
NA(10)
NA(8)
NA(6)
363506
362665
383788
4179
584818
301086001
Rank
1716
1514
138
112
1110
97
65
23
4119899=16
119866=6000
NGAM
NA(20)
NA(20)
NA(20)
NA(18)
NA(10)
NA(8)
NA(4)
NA(18)
NA(11)
NA(9)
NA(5)
NA(1)
NA(2)
4475
704917
72552856
1374438
Rank
1716
1514
129
413
1110
86
75
12
3
Avgfor
119899=2to
16
119899max
NA(119909)
NGAM
5NA(14
6)
38648
6NA(152)
58629
7NA(14
9)
8532
3
7NA(94)
102008
9NA(32)
88995
12
NA(20)
193456
15
NA(4)
144713
9NA(62)
22589
10
NA(41)
3616
7
10
NA(24)
52586
12
NA(13)
66593
12
NA(4)
106519
12
NA(3)
119204
13
NA(1)
143971
16
NA(0)
1677
08
16
NA(0)
190391
16
NA(0)
436499
Rank
1716
1514
129
413
1110
87
65
12
3
12 Mathematical Problems in Engineering
Table4Th
eaverage
successrate(SR
HM)a
ndrank
softhe
metho
ds
No
Multi-
thresh
FODPS
ODPS
OPS
OABC
Rank
-DE
DE
O(rand)R-
DE
O(09)R-
DE
O(08)R-
DE
O(07)R-
DE
O(06)R-
DE
O(05)R-
DE
O(04)R-
DE
O(03)R-
DE
O(02)R-
DE
O(01)R-
DE
O(00)R-
DE
2SR
HM
00977
11
11
11
0999
11
11
11
11
1Ra
nk18
171
11
11
116
11
11
11
11
1
3SR
HM
000
00635
0972
0991
0979
0998
1000
0997
0986
0993
0999
0997
0998
0999
1000
1000
1000
1000
Rank
1817
1613
158
110
1412
610
86
11
11
4SR
HM
000
00379
0742
0934
0833
0987
0995
0986
0897
0945
0972
0971
0986
0993
0992
0991
0998
0997
Rank
1817
1613
157
38
1412
1011
84
56
12
5SR
HM
000
00185
0391
0767
0706
0936
0977
0960
0782
0878
0874
0944
0950
0959
0968
0960
0985
1000
Rank
1817
1614
1510
35
1311
129
87
45
21
6SR
HM
000
0000
00187
0433
0453
0863
0968
0900
0601
0706
0826
0878
0934
0922
0944
0935
0970
0999
Rank
1817
1615
1410
38
1312
119
67
45
21
7SR
HM
000
0000
0000
00153
0164
0696
0884
0835
0366
0561
0675
0741
0840
0851
0883
0914
0949
0998
Rank
1817
1615
1410
48
1312
119
76
53
21
8SR
HM
000
0000
0000
0000
0000
00300
0458
0530
0105
0256
0351
0502
0592
0628
0724
0757
0838
0972
Rank
1817
1614
1411
97
1312
108
65
43
21
9SR
HM
000
0000
0000
0000
0000
00495
0695
0681
0083
0274
0372
0548
0721
0725
0769
0815
0852
0999
Rank
1817
1614
1410
78
1312
119
65
43
21
10SR
HM
000
0000
0000
0000
0000
0000
00381
0375
000
00073
0218
0311
040
90370
046
00578
0686
0998
Rank
1817
1614
1412
67
1311
109
58
43
21
11SR
HM
000
0000
0000
0000
0000
0000
00271
0267
000
0000
0000
00144
040
70316
0424
0584
0704
0999
Rank
1817
1614
1412
78
1310
109
56
43
21
12SR
HM
000
0000
0000
0000
0000
00090
0270
0423
000
0000
00089
0177
040
0040
70501
064
10810
1000
Rank
1817
1614
1412
85
1311
109
76
43
21
13SR
HM
000
0000
0000
0000
0000
0000
0000
00151
000
0000
0000
0000
0000
0000
00254
0267
0381
0974
Rank
1817
1614
1412
65
1310
106
66
43
21
14SR
HM
000
0000
0000
0000
0000
0000
0000
00102
000
0000
0000
0000
0000
00110
000
00253
0494
0993
Rank
1817
1614
1412
74
1310
107
76
53
21
15SR
HM
000
0000
0000
0000
0000
0000
0000
00090
000
0000
0000
0000
00095
0117
0149
0288
046
610
00Ra
nk18
1716
1414
128
413
1010
87
65
32
1
16SR
HM
000
0000
0000
0000
0000
0000
0000
0000
0000
0000
0000
0000
0000
0000
00110
0192
0288
0977
Rank
1817
1614
1412
64
1310
106
66
53
21
Avgfor
119899=2to
16
11989905
119899max
SRHM
lt2
lt2
000
0
3 50376
4 6044
3
5 70454
5 7046
4
7 90665
9 12
0554
9 15
0304
6 90263
7 10
0313
7 10
0530
9 12
0420
9 12
0654
9 12
0625
9 13
0619
12
16
0498
12
16
0656
16
16
0994
Rank
1817
1615
1412
84
1311
109
67
53
21
Mathematical Problems in Engineering 13
Table5Th
eaverage
ofthresholdvalued
istortio
n(TVD)a
ndrank
softhe
metho
ds
No
Multi-
thresh
FODPS
ODPS
OPS
OABC
Rank
-DE
DE
O(rand)R-
DE
O(09)R-
DE
O(08)R-
DE
O(07)R-
DE
O(06)R-
DE
O(05)R-
DE
O(04)R-
DE
O(03)R-
DE
O(02)R-
DE
O(01)R-
DE
O(00)R-
DE
2TV
D7415
32217
000
0000
0000
0000
0000
0000
00050
000
0000
0000
0000
0000
0000
0000
0000
0000
0Ra
nk18
171
11
11
116
11
11
11
11
1
3TV
D163333
41753
2968
7424
1510
0150
000
00270
1004
0519
0075
0246
0171
0075
000
0000
0000
0000
0Ra
nk18
1715
1614
81
1113
126
109
61
11
1
4TV
D2570
8398848
34770
36891
8716
7340
1428
2184
25499
13609
7318
7360
7398
4303
1672
0728
0130
0257
Rank
1817
1516
129
46
1413
810
117
53
12
5TV
D516582
148344
97216
62319
21565
5373
1864
3241
20441
10064
10422
4584
3904
3289
244
13385
1195
000
0Ra
nk18
1716
1514
103
513
1112
98
64
72
1
6TV
D534226
2194
371876
20166775
45728
1953
62528
7761
89938
43666
30923
13010
6524
6023
4136
6129
2421
0050
Rank
1817
1615
1310
38
1412
119
75
46
21
7TV
D5992
50265029
242194
285862
66259
58877
27976
35481
12504
075011
49851
44610
28039
29841
26075
17950
4776
0150
Rank
1816
1517
1211
58
1413
109
67
43
21
8TV
D475458
382076
380124
3096
357276
3120734
90287
89406
218266
143225
130898
99991
76353
82886
57251
57665
26822
2103
Rank
1817
1615
511
98
1413
1210
67
34
21
9TV
D862458
394744
375229
410710
113892
82099
44407
4653
9250470
154662
96417
6819
744
223
3533
326627
23406
12757
0780
Rank
1816
1517
1210
78
1413
119
65
43
21
10TV
D8477
03458536
445765
498328
117664
84541
43991
48474
249147
136935
93935
72288
43883
44110
36700
27978
20213
0164
Rank
1816
1517
1210
68
1413
119
57
43
21
11TV
D9779
76536258
528329
5312
111379
4187267
44944
44973
296513
152195
104092
75115
44461
47564
34944
26231
18782
0083
Rank
1817
1516
1210
67
1413
119
58
43
21
12TV
D1070300
592750
5899
31605280
157169
174580
1091
381012
82388491
258312
196098
150932
101112
82365
79966
51281
23429
000
0Ra
nk18
1615
1710
118
714
1312
96
54
32
1
13TV
D114
2808
5674
425794
957113
82183451
204665
1472
51123438
466508
2990
40216656
178394
114244
114491
9610
481076
52578
1975
Rank
1815
1617
1011
87
1413
129
56
43
21
14TV
D114
864
1632482
660908
770319
205714
21840
81414
31116716
524783
325936
2419
97177121
113426
104073
88593
65908
39647
0564
Rank
1815
1617
1011
87
1413
129
65
43
21
15TV
D124552
97078
35722126
816158
256477
3078
732195
5618246
4605623
428370
343439
2615
22174700
166309
138710
100296
62940
000
0Ra
nk18
1516
179
118
714
1312
106
54
32
1
16TV
D1182989
768714
835747
82800
42490
422797
532116
14195676
605790
416711
3113
142514
08174118
167316
133922
113776
76661
2539
Rank
1815
1716
911
87
1413
1210
65
43
21
Avg
for119899=2
to16
TVD
7398
99387764
378828
402687
1091
93110080
72428
6652
72578
38163884
122229
93652
6217
05919
948476
38387
22823
0578
Growth
rate(120575)
8686
5525
6113
6798
1925
2176
1561
1348
4843
3225
2391
1893
1252
1186
999
769
494
009
Rank
1815
1617
1011
87
1413
129
65
43
21
14 Mathematical Problems in Engineering
Table 6 The between-class variance criterion and the best thresholds for test images
Image 119899 Between-class variance (VTR) Thresholds
Starfish
2 2546885 85 1573 2779925 68 119 1774 2865707 60 101 138 1875 2912859 52 86 117 150 1946 2941728 47 77 105 132 162 2017 2960158 44 71 95 118 142 170 2068 2972356 43 68 90 110 131 153 180 2129 2981138 38 58 78 97 116 136 157 183 21410 2988206 37 56 75 93 110 128 146 167 192 21911 2993348 35 53 71 88 103 119 135 152 172 196 22112 2997352 34 51 68 84 98 112 127 142 158 177 200 22313 3000480 33 48 64 79 93 106 119 133 147 162 181 203 22514 3003076 32 47 62 76 89 101 114 127 140 154 169 187 207 22715 3005235 30 43 56 70 83 95 107 119 131 143 156 171 189 209 22816 3007060 30 42 55 68 80 92 103 114 126 138 150 163 178 195 213 230
Mountain
2 2372923 61 1283 2496113 33 77 1314 2551955 33 73 109 1475 2580336 32 69 99 125 1596 2596956 24 46 74 101 126 1607 2608807 24 46 73 98 119 145 1758 2616294 24 46 73 97 115 135 160 1919 2622314 20 37 54 76 98 116 136 160 19110 2627194 20 36 53 74 93 106 121 140 163 19411 2630496 20 36 53 74 93 105 118 134 152 172 20112 2633189 18 31 45 59 76 93 105 118 134 152 172 20113 2635290 18 31 45 59 76 92 103 115 129 144 161 179 20714 2637088 17 29 42 56 72 86 96 106 117 130 145 161 179 20715 2638449 17 28 39 50 61 75 88 97 107 118 131 146 162 179 20716 2639616 17 27 38 49 60 74 86 95 104 113 123 135 149 164 181 209
Cactus
2 1816448 73 1513 1970112 64 106 1734 2042275 55 87 125 1875 2080884 49 76 102 138 1966 2104147 46 70 93 119 157 2087 2119670 44 65 85 105 131 168 2158 2129358 42 60 77 94 113 138 174 2189 2136162 41 58 74 89 105 125 152 186 22410 2141579 40 56 71 85 99 115 135 161 193 22811 2145397 39 53 66 79 91 104 119 139 165 196 22912 2148282 38 51 64 76 88 100 114 131 152 176 204 23313 2150740 37 49 61 72 83 94 105 118 135 155 178 205 23314 2152626 36 47 58 68 78 88 98 109 122 138 158 181 207 23415 2154162 36 46 56 66 76 85 94 104 115 128 144 164 187 212 23716 2155471 36 46 56 66 75 84 93 102 112 124 138 155 174 195 217 239
Mathematical Problems in Engineering 15
Table 6 Continued
Image 119899 Between-class variance (VTR) Thresholds
Butterfly
2 3873222 84 1553 3990855 81 144 1994 4051357 77 121 167 2075 4092929 60 89 129 172 2096 4119448 59 87 122 161 193 2217 4135937 53 74 98 128 165 195 2228 4148556 53 73 96 123 156 183 203 2289 4156528 52 72 94 118 144 170 190 207 23110 4163794 48 63 80 99 121 147 172 191 208 23111 4168489 47 62 79 98 118 141 164 183 198 213 23412 4172517 46 59 73 89 104 122 144 167 185 199 214 23513 4175487 46 59 72 87 102 118 137 157 175 189 202 216 23614 4177893 44 55 66 79 93 106 121 141 161 178 191 203 217 23715 4179908 44 55 66 78 92 105 119 137 156 173 186 197 208 221 23916 4181559 42 52 61 71 83 95 107 121 139 157 173 186 197 208 221 239
Circus
2 1651257 118 1723 1760512 105 150 1874 1817487 93 132 165 1955 1850243 87 122 152 177 2036 1870083 82 113 141 164 185 2087 1883966 77 104 129 151 171 190 2128 1893450 73 98 122 143 161 178 195 2169 1900592 70 92 114 134 152 168 183 199 21910 1905992 68 89 109 128 145 160 174 188 203 22211 1909887 66 86 105 123 139 153 166 179 192 206 22512 1913079 63 81 98 114 130 145 158 170 182 194 208 22613 1915676 62 79 95 111 126 140 152 164 175 186 197 210 22814 1917756 61 78 94 109 123 136 148 159 170 180 190 201 214 23115 1919524 59 74 88 102 115 128 140 151 161 171 181 191 202 214 23116 1920958 58 73 87 100 113 126 138 149 159 169 178 187 196 206 218 234
Snow
2 5261705 80 1693 5624289 71 139 2074 5729116 50 92 144 2085 5785138 49 91 140 192 2316 5819333 45 81 111 148 194 2327 5835770 43 76 101 127 159 196 2328 5850190 30 55 83 107 133 163 197 2339 5862437 30 55 82 106 129 157 185 211 23710 5870284 29 52 75 94 111 132 159 186 212 23711 5875817 29 52 75 94 111 132 158 183 206 227 24412 5880335 29 52 74 93 109 127 149 169 188 209 228 24413 5884513 23 39 57 76 94 110 128 150 170 188 209 228 24414 5887355 22 37 54 70 84 98 112 129 151 170 188 209 228 24415 5889953 21 36 53 69 83 97 110 124 141 159 175 192 211 229 24516 5891998 21 36 53 69 83 97 110 124 141 159 174 189 207 222 236 248
16 Mathematical Problems in Engineering
Table 6 Continued
Image 119899 Between-class variance (VTR) Thresholds
Palace
2 2623440 99 1653 2791488 84 132 1864 286098 70 103 143 1915 2908165 69 101 138 177 2186 2934330 64 89 117 147 181 2207 2953745 54 75 99 126 153 183 2208 2966250 50 69 89 111 134 158 185 2219 2974719 47 65 81 100 120 141 163 188 22210 2981875 47 64 80 98 117 137 157 178 199 22611 2986898 45 61 75 90 106 123 141 159 179 200 22712 2990579 43 58 69 82 96 111 126 143 160 180 201 22713 2993809 43 58 69 81 95 110 125 141 157 173 190 208 23114 2996112 43 57 68 80 94 108 123 138 153 167 182 199 218 23915 2998213 42 56 66 77 88 100 113 126 140 154 167 182 199 218 23916 2999918 42 55 65 75 86 98 110 123 136 149 162 176 191 205 222 241
Flower
2 1489281 61 1303 1627897 39 77 1414 1685956 36 67 105 1605 1715220 28 49 75 111 1646 1736423 27 47 71 102 143 1927 1752512 26 43 61 83 111 151 1998 1761968 25 42 58 77 99 126 161 2049 1768354 24 40 54 70 88 109 135 167 20710 1772903 23 37 48 60 75 92 112 138 169 20811 1776470 23 36 47 58 72 87 104 124 149 177 21112 1779106 22 34 44 54 65 78 92 108 128 152 179 21213 1781251 20 30 39 48 58 70 83 96 112 131 154 180 21314 1783049 19 29 38 47 56 66 78 90 104 120 139 161 185 21515 1784478 19 29 38 46 54 63 74 85 97 111 128 147 168 190 21816 1785641 19 28 37 45 53 62 72 83 94 106 120 136 155 175 196 222
Wherry
2 3313161 108 1893 3543272 102 161 2184 3599924 83 121 163 2185 3634708 81 118 152 184 2246 3656048 72 103 130 156 186 2257 3668313 68 94 120 139 161 189 2268 3678216 60 83 110 132 152 175 198 2309 3686001 56 77 100 122 138 156 179 201 23110 3691730 56 76 98 120 136 153 174 194 219 24311 3696416 55 74 94 114 130 142 158 178 197 222 24512 3699866 54 72 91 110 126 138 151 168 185 202 225 24613 3702619 52 68 83 100 117 130 140 153 169 185 202 225 24614 3705033 52 68 83 100 117 130 140 152 167 182 197 215 235 24915 3706937 51 66 79 94 110 123 133 142 154 169 184 199 216 235 24916 3708484 49 63 75 89 104 118 129 138 147 159 173 186 200 217 235 249
Mathematical Problems in Engineering 17
Table 6 Continued
Image 119899 Between-class variance (VTR) Thresholds
Waterfall
2 4512801 88 1703 4646137 72 115 1824 4711019 67 103 150 2045 4752267 58 87 119 164 2126 4777063 53 78 104 134 176 2177 4793510 48 70 92 116 147 186 2218 4805756 46 66 86 107 131 163 199 2269 4814097 43 61 79 97 117 141 173 205 22810 4820724 40 57 73 90 108 128 152 182 210 23011 4825739 38 54 69 84 100 117 137 162 191 215 23212 4829689 37 53 67 81 96 111 128 148 173 198 218 23313 4832826 35 50 63 76 89 103 117 133 153 177 201 220 23414 4835371 32 46 58 70 82 95 108 122 138 158 182 204 221 23415 4837537 32 46 57 68 80 92 104 117 131 148 169 191 210 224 23616 4839226 30 43 54 64 74 85 96 108 120 134 151 172 193 211 225 236
Bird
2 901450 71 1223 975230 64 111 1404 1027509 61 104 131 1645 1051482 54 93 119 138 1696 1067992 47 82 108 127 142 1727 1077304 40 70 94 113 129 143 1738 1086005 39 69 93 112 128 141 159 1929 1091341 37 65 88 105 119 131 142 160 19310 1095355 37 64 86 103 117 129 139 149 167 20011 1098475 33 56 77 93 107 119 130 140 150 169 20212 1100749 33 56 77 93 107 119 129 138 146 158 178 20913 1102639 31 52 71 87 100 111 121 130 139 147 159 179 21014 1104132 29 48 66 82 95 107 118 127 134 141 149 161 181 21115 1105446 28 45 62 77 90 101 111 120 128 135 142 150 162 182 21216 1106500 28 45 62 77 90 101 111 120 128 135 141 148 157 171 191 219
Police
2 3647353 74 1503 3844314 70 135 1924 3966225 63 112 158 2095 4013875 61 104 140 174 2146 4047198 32 67 106 141 175 2147 4067996 32 67 104 133 161 186 2198 4084933 29 52 78 106 134 162 187 2199 4094705 29 52 78 103 125 147 169 190 22010 4101702 29 52 78 102 123 143 165 184 203 22811 4108018 28 49 71 90 107 126 146 166 185 204 22912 4112304 28 49 71 89 105 122 139 157 174 189 207 23113 4115165 28 46 62 78 92 106 123 140 158 174 189 207 23114 4117926 28 46 62 78 91 105 120 135 151 166 180 193 210 23215 4120045 28 46 62 78 91 103 116 129 143 158 172 185 197 214 23516 4121861 28 46 62 78 91 103 116 128 142 156 170 182 193 206 223 240
18 Mathematical Problems in Engineering
Table 6 Continued
Image 119899 Between-class variance (VTR) Thresholds
Ostrich
2 1073452 75 1353 1139260 69 101 1494 1178650 65 92 125 1765 1203749 56 78 100 131 1796 1218643 47 65 85 103 133 1817 1228925 47 64 83 100 122 152 1928 1236023 45 59 75 90 104 125 155 1949 1240756 40 52 65 80 94 107 128 157 19510 1244909 40 52 64 78 91 103 119 141 168 20111 1247879 40 51 62 75 87 97 108 125 148 174 20512 1250313 37 48 57 68 80 91 101 112 128 150 175 20613 1252298 31 44 53 63 75 86 95 105 117 134 154 178 20714 1253956 29 42 50 58 68 79 89 98 108 120 137 157 181 20915 1255366 29 42 50 58 67 77 86 94 102 111 124 141 160 183 21016 1256490 28 41 49 57 66 76 85 93 101 110 122 137 155 174 196 219
Viaduct
2 7920458 77 1803 8117991 54 109 1934 8203807 42 84 131 2035 8246806 35 68 103 146 2106 8272775 31 59 88 120 160 2167 8287714 28 53 77 103 132 169 2208 8298322 27 51 75 100 128 164 212 2469 8308240 24 45 66 88 112 139 172 216 24710 8315133 22 41 60 79 99 121 146 178 219 24711 8320032 20 37 54 71 89 108 128 152 183 221 24812 8323799 20 36 52 68 84 101 119 139 162 190 224 24813 8326793 18 33 48 62 77 92 108 125 144 167 195 226 24814 8329119 17 31 44 57 70 84 98 113 129 148 170 197 227 24815 8330983 17 31 44 57 70 84 98 113 129 147 169 195 224 243 25116 8332744 16 29 42 54 66 78 91 104 118 133 151 172 196 224 243 251
Fish
2 3593389 64 1483 3870456 44 104 1774 3972731 34 81 127 1885 4024885 27 63 101 139 1946 4054836 24 56 90 123 156 2057 4075236 22 49 78 107 135 168 2138 4088300 20 44 68 93 118 142 173 2169 4097101 19 40 62 85 107 128 149 178 21810 4103194 18 38 58 78 98 118 137 158 185 22211 4107954 16 34 51 69 88 107 125 143 163 190 22412 4111678 15 31 47 64 82 100 117 133 149 169 195 22713 4114783 14 28 43 58 74 90 106 121 136 152 172 198 22814 4116954 14 28 43 58 73 88 103 117 131 145 160 179 203 23115 4118931 13 25 38 51 64 78 92 106 120 133 147 162 181 205 23216 4120522 13 25 37 49 62 75 89 102 115 127 139 152 168 188 211 235
Mathematical Problems in Engineering 19
Table 6 Continued
Image 119899 Between-class variance (VTR) Thresholds
Houses
2 2543788 56 1163 2627230 53 105 1504 2663698 42 69 110 1525 2694902 39 65 96 130 1586 2708655 39 65 95 127 150 1697 2720263 35 55 74 98 128 151 1708 2726676 35 55 74 98 127 148 164 1849 2732853 32 48 65 80 101 128 148 164 18410 2736510 30 45 60 74 87 106 129 149 164 18411 2739566 30 45 60 73 86 105 128 145 156 168 18712 2742148 29 42 55 68 79 94 112 130 145 156 168 18713 2744071 28 39 51 63 74 84 98 115 131 145 156 168 18714 2745542 28 39 51 63 74 84 98 115 131 145 155 165 176 19315 2746817 27 37 47 58 68 77 86 100 116 131 145 155 165 176 19316 2747991 27 37 47 57 67 76 85 98 113 127 139 147 156 165 176 193
Mushroom
2 1988328 76 1453 2153037 65 110 1744 2237441 59 93 135 1935 2277427 52 78 106 145 1996 2301629 48 71 94 122 157 2057 2317538 46 67 87 110 138 171 2138 2328526 44 62 79 97 118 145 177 2169 2335812 42 58 74 90 107 127 152 181 21810 2340981 41 56 70 84 99 116 136 159 186 22011 2345160 39 52 65 78 92 107 124 144 166 191 22312 2348413 38 51 63 75 87 100 115 132 152 174 199 22713 2350988 38 50 62 74 85 97 110 125 142 160 180 203 22914 2353119 37 48 59 69 79 89 100 113 127 144 162 181 204 23015 2354748 36 46 56 66 75 84 94 105 117 130 146 163 182 205 23016 2356113 36 46 56 65 74 83 92 102 113 125 139 154 169 187 208 232
Snow mountain
2 1912613 85 1493 2135274 79 137 1974 2234669 70 119 154 2045 2288799 55 96 129 160 2066 2317224 52 90 118 142 167 2097 2333078 50 85 111 132 153 174 2128 2344629 45 76 100 120 139 158 177 2149 2352951 44 74 97 116 133 150 167 187 22010 2359175 41 68 90 108 124 140 156 172 193 22511 2364304 38 62 84 102 117 132 146 160 175 196 22712 2367971 34 56 78 96 111 125 139 152 165 179 199 22813 2371208 33 53 73 90 104 117 130 143 155 167 180 200 22914 2373567 32 52 72 89 103 115 127 139 150 161 172 185 205 23215 2375586 31 49 68 84 98 109 120 131 142 153 164 175 188 208 23316 2377255 26 42 59 75 89 101 111 121 132 143 154 165 176 189 209 234
20 Mathematical Problems in Engineering
Table 6 Continued
Image 119899 Between-class variance (VTR) Thresholds
Snake
2 1118615 87 1343 1231320 76 114 1544 1286555 69 101 129 1665 1317027 63 91 115 140 1756 1336172 59 84 105 126 149 1827 1348933 55 78 97 115 133 155 1878 1357665 52 73 91 107 123 140 161 1929 1364159 50 70 87 102 116 131 148 169 19810 1368955 47 65 81 95 108 121 135 151 172 20011 1372626 46 63 78 91 103 115 127 140 156 176 20312 1375513 45 61 75 88 99 110 121 133 146 162 182 20813 1377847 43 58 72 84 95 106 116 127 138 151 166 185 21114 1379736 42 56 69 81 92 102 112 122 132 143 155 170 189 21415 1381282 41 54 66 77 87 97 106 115 124 134 145 157 172 191 21516 1382603 40 52 63 74 84 93 102 111 120 129 139 150 162 177 195 219
Riosanpablo
2 2667020 95 1603 2818660 75 121 1774 2892439 68 102 143 1895 2931654 62 89 121 158 1976 2957018 58 82 107 138 171 2047 2973269 53 74 95 119 147 177 2078 2984972 50 69 87 108 133 159 185 2129 2993359 48 66 83 101 122 145 168 191 21510 2999615 46 63 78 93 110 130 151 173 195 21711 3004374 45 61 75 89 104 121 140 160 180 200 22012 3008082 44 59 72 84 97 112 129 147 166 185 203 22213 3011101 43 57 69 81 93 107 122 138 155 172 189 206 22414 3013465 41 54 66 77 88 100 113 128 144 160 176 192 208 22515 3015423 40 53 64 74 84 95 107 121 135 150 165 180 195 210 22616 3017081 39 51 62 72 82 92 103 115 128 142 156 170 184 198 212 227
method [35] which is a local search method that cannotguarantee an optimal solutionThus its solutions are inferiorto the solution produced by the algorithm using a globalsearch
523 Convergence Rate Comparison The number of gen-erations (NG) is a measure used for the convergence ratecomparisons If the target value VTR is achieved in a lessernumber of generations (NG) it means a faster convergencerate for the algorithm Table 3 shows the average of NG(NGAM) for each specific number of thresholdsThe results ofeach algorithmare represented in the corresponding columnrsquosname In each column the cell containing NGAM starts fromthe row associated with 119899 = 2 until the row associated with119899 = 119899max The cells associated with 119899 = 119899max + 1 to the row
associated with 119899 = 16 are filled by NA(119909) The second lastrow of the table is filled by the triple
(119899maxNA (number of unsuccessful subproblem)
AM (NGAM of 119899 = 2 until 119899 = 119899max)) (23)
The algorithm with the highest 119899max that is the lowestnumber of unsuccessful subproblems and the lowest averageof generation is the winner The ranking of the algorithmsdepends on the ordering of (a
1 b1 c1) and (a
2 b2 c2) as
followsFirst rank on a
1and a
2 Since both a
1and a
2are
numeric the higher value has the higher rankSecond rank on b
1and b
2 If a1is 16 then b
1must
be NA(0) If a1is less than 16 then b
1must be NA
Mathematical Problems in Engineering 21
(number of unsuccessful subproblems) and b2has the
same characteristics as b1 Perform the order of the
two numeric values in reverse the lower value has thehigher rankThird rank on c
1and c
2 They are numeric but the
lower is better perform the order of the two numericvalues in reverseThe lower value has the higher rank
When the ordering is finished assign the numeric value ofldquo1rdquo to the object having the highest rank assign the numericvalue of ldquo2rdquo to the first runner up and so onThese values arerepresented in the last row of the table
If the row having 119899 = 119898 must be ranked it can be donein the samemanner as above with someminormodificationsIf 119898 is less than 119899max the values of the triple pair will be 119898NA(0) NGAM If119898 is greater than 119899max the values of the triplepair will be (119899max NA(119909) infin) Thus the ranking can now beperformed
From the ranking results see the second last row ofTable 3 the convergence rate can be ranked from best toworst in the following order 119874(02)119877-DE 119874(01)119877-DE119874(00)119877-DE 119874(rand)119877-DE 119874(03)119877-DE 119874(04)119877-DE119874(05)119877-DE 119874(06)119877-DE DE 119874(07)119877-DE 119874(08)119877-DErank-DE 119874(09)119877-DE ABC PSO DPSO FODPSO
As can be seen from Table 3 the DE algorithm cannotcomplete the task when 119899 gt 12 and the rank-DE algorithmcannot complete the task when 119899 gt 9 Thus rank-DEcannot compete with DE on searching for global multilevelthresholding
In order for119874(120573)119877-DE to outperform DE then 120573must bein the range of [01 06] or set to rndreal[0 1)
524 Stability Analysis The harmonic mean of the successrate (SRHM) for each specific number of thresholds wascomputed and is presented in Table 4 The results of eachalgorithm are represented in the corresponding columnrsquosname The second row from the bottom shows the harmonicmean of the success rate of each algorithm for all thresholdlevels
In each column the cells containing SRHM start from therow associated with 119899 = 2 to the row associated with 119899 = 119899
05
The cells from the row associated with 119899 = 11989905
+ 1 to the rowassociatedwith 119899 = 119899max are filled by SRHMThe cells from therow associatedwith 119899 = 119899max+1 to the row associatedwith 119899 =
16 are the cells that have SRHM these cells will be excludedfrom the comparisonThe second last row of the table is filledwith the triple
(11989905
119899maxHM (SRHM of 119899 = 2 until 119899 = 119899max)) (24)
The algorithm with the highest 11989905 the highest 119899max and
the highest average success rate is the winner The ranking ofthe algorithms depends on the ordering of (a
1 b1 c1) and (a
2
b2 c2) as follows
First rank on a1and a2
Second rank on b1and b2
Third rank on c1and c2
Because they are numeric the higher value has the higherrank When the ordering is finished the numeric value of ldquo1rdquois assigned to the object having the highest rank the numericvalue of ldquo2rdquo is assigned to the first runner up and so on
If the row having 119899 = 119898must be ranked it can be done inthe samemanner as above with someminor modifications If119898 is less than or equal to 119899
05 the values of the triple pair will
be (119898 119898 SRHM) If 11989905 lt 119898 le 119899max then the values of thetriple pair will be (119899
05 119898 SRHM) If 119898 is greater than 119899max
the values of the triple pair will be (11989905 119899max SRHM) Thus
the ranking can now be performedFrom the ranking results see Table 4 the success rate
can be ranked from best to worst in the following order119874(00)119877-DE 119874(01)119877-DE 119874(02)119877-DE 119874(rand)119877-DE119874(03)119877-DE 119874(05)119877-DE 119874(04)119877-DE DE 119874(06)119877-DE119874(07)119877-DE 119874(08)119877-DE rank-DE 119874(09)119877-DE ABCPSO DPSO FODPSO multithresh
As can be seen from Table 4 the DE algorithm has anSRHM ge 05 until 119899 = 9 and the rank-DE algorithmhas an SRHM ge 05 until 119899 = 7 This result confirmsthat rank-DE cannot compete with DE on searching forglobal multilevel thresholding If the correct 120573 is selectedthe proposed algorithm can work very well For 120573 le 05119874(120573)119877-DE has a higher rank than DE The multithreshfunction cannot compete with any of the other algorithmsIt can also be seen that the proposed 119874(00)119877-DE algorithmhas the best stability because its SRHM is greater than 05when119899 = 2 to 16
525 Reliability Comparison The threshold value distortionaka TVD for each specific threshold is computed shownin Table 5 and depicted in Figure 2 The results of eachalgorithmare illustrated in the corresponding columnrsquos nameThe second last row of Table 5 shows the slope or theapproximated growth rate 120575 of the TVD of each algorithmfor all threshold levels The 120575 is the slope of the robust linearregression computed by the Matlab function ldquorobustfitrdquo Thelower slope exhibits the better reliability The 120575 of eachalgorithm is sorted in descending order From the results thereliability can be ranked from best to worst in the followingorder 119874(00)119877-DE 119874(01)119877-DE 119874(02)119877-DE 119874(03)119877-DE119874(04)119877-DE 119874(05)119877-DE 119874(rand)119877-DE DE 119874(06)119877-DEABC rank-DE 119874(07)119877-DE 119874(08)119877-DE 119874(09)119877-DEDPSO FODPSO PSO multithresh
We can see from these results that rank-DE has a higherapproximatedTVDgrowth rate thanDE119874(120573)119877-DEwith120573 le
05 and 119874(rand)119877-DE are still better than DE 119874(00)119877-DEproduced the best result with a very flat slope and a verylow 119910-intercept The multithresh function yielded a highergrowth rate of solution distortion and a higher 119910-interceptthan the other algorithmsThe higher growth rate of solutiondistortion means the quality of solution drops very fast ifthe number of thresholds increases The higher 119910-interceptmeans that the solution distortion at the lowest number ofthresholds is highThus the global optimization algorithm isrequired for solving the multilevel thresholding
22 Mathematical Problems in Engineering
6 Conclusions
The differential evolution with onlooker (120573) ranking-basedmutation operator 119874(120573)119877-DE algorithm was proposed andapplied to the multilevel image thresholding problem Theobjective of this proposed algorithm was to increase theability for adjusting the balance of the exploitation andexploration abilities Its concept is a combination of theranking-difference evolution and onlooker selection of theABC algorithm The experiments compared the proposed119874(120573)119877-DE algorithm with six existing algorithms PSODPSO FODPSO ABC DE and rank-DE on 20 real imagesof the Berkeley Segmentation Dataset and Benchmark anda satellite image The stability analysis convergence speedand the reliability were measured The results signified thatthe proposed 119874(120573)119877-DE algorithm is more efficient than thesix tested algorithms The onlooker ranking-based mutationoperator is able to enhance the performance of the proposedalgorithm The 119874(120573)119877-DE not only obtained more stabilityanalysis but it also achieved faster convergence rates to reachthe target BCV if a proper value of 120573 is set
For future work based on this paper the proposed119874(120573)R-DE algorithm has one parameter to be set by a userthe mechanism to automatically adapt this parameter is notpresented but is required
Conflict of Interests
The authors declare that there is no conflict of interestsregarding the publication of this paper
Acknowledgment
This work was supported by the Higher Education ResearchPromotion andNational Research University Project ofThai-land Office of the Higher Education Commission throughthe Cluster of Research to Enhance the Quality of BasicEducation
References
[1] W K Pratt Digital Image Processing John Wiley amp Sons NewYork NY USA 1978
[2] J S Weszka ldquoA survey of threshold selection techniquesrdquo Com-puter Graphics and Image Processing vol 7 no 2 pp 259ndash2651978
[3] K S Fu and J K Mui ldquoA survey on image segmentationrdquo Pat-tern Recognition vol 13 no 1 pp 3ndash16 1981
[4] P K Sahoo S Soltani and A K C Wong ldquoA survey ofthresholding techniquesrdquoComputer Vision Graphics and ImageProcessing vol 41 no 2 pp 233ndash260 1988
[5] N R Pal and S K Pal ldquoA review on image segmentation tech-niquesrdquo Pattern Recognition vol 26 no 9 pp 1277ndash1294 1993
[6] A T Abak U Baris and B Sankur ldquoThe performanceevaluation of thresholding algorithms for optical characterrecognitionrdquo in Proceedings of the 4th International Conferenceon Document Analysis and Recognition pp 697ndash700 UlmGermany August 1997
[7] M Sezgin and B Sankur ldquoSurvey over image thresholdingtechniques and quantitative performance evaluationrdquo Journal ofElectronic Imaging vol 13 no 1 pp 146ndash168 2004
[8] SU Lee and S YoonChung ldquoA comparative performance studyof several global thresholding techniques for segmentationrdquoComputer Vision Graphics and Image Processing vol 52 no 2pp 171ndash190 1990
[9] N Otsu ldquoA threshold selection method from gray level his-togramsrdquo IEEE Transactions on Systems Man and Cyberneticsvol 9 no 1 pp 62ndash66 1979
[10] J Kennedy and R Eberhart ldquoParticle swarm optimizationrdquoin Proceedings of the IEEE International Conference on NeuralNetworks (ICNN rsquo95) vol 4 pp 1942ndash1948 Perth AustraliaDecember 1995
[11] R Storn and K Price ldquoDifferential evolution-a simple andefficient heuristic for global optimization over continuousspacesrdquo Tech Rep TR-95-012 International Computer SciencesInstitute Berkeley Calif USA 1995
[12] D Karaboga ldquoAn idea based on honey bee swarm for numericaloptimizationrdquo Tech Rep TR06 ErciyesUniversity EngineeringFaculty Computer Engineering Department 2005
[13] M S Couceiro R P Rocha N M F Ferreira and J A TMachado ldquoIntroducing the fractional-order Darwinian PSOrdquoSignal Image and Video Processing vol 6 no 3 pp 343ndash3502012
[14] R V Kulkarni and G K Venayagamoorthy ldquoBio-inspired algo-rithms for autonomous deployment and localization of sensornodesrdquo IEEE Transactions on Systems Man and Cybernetics Cvol 40 no 6 pp 663ndash675 2010
[15] B Akay ldquoA study on particle swarm optimization and artificialbee colony algorithms for multilevel thresholdingrdquo Applied SoftComputing Journal vol 3 no 6 pp 3066ndash3091 2013
[16] K Hammouche M Diaf and P Siarry ldquoA comparative studyof various meta-heuristic techniques applied to the multilevelthresholding problemrdquo Engineering Applications of ArtificialIntelligence vol 23 no 5 pp 676ndash688 2010
[17] V Osuna-Enciso E Cuevas and H Sossa ldquoA comparison ofnature inspired algorithms for multi-threshold image segmen-tationrdquo Expert Systems with Applications vol 40 no 4 pp 1213ndash1219 2013
[18] P Ghamisia M S Couceiro F Martins and J A BenediktssonldquoMultilevel image segmentation based on Fractional-OrderDarwinian particle swarm optimizationrdquo IEEE Transactions onGeoscience and Remote Sensing vol 52 no 1 pp 1ndash44 2013
[19] W Gong and Z Cai ldquoDifferential evolution with ranking-basedmutation operatorsrdquo IEEE Transactions on Cybernetics vol 43no 6 pp 2066ndash2081 2013
[20] K Price R Storn and J Lampinen Differential Evolution APractical Approach to Global Optimization Springer BerlinGermany 2005
[21] R Storn and K Price Home Page of Differential EvolutionInternational Computer Science Institute Berkeley Calif USA2010
[22] A K Qin and P N Suganthan ldquoSelf-adaptive differentialevolution algorithm for numerical optimizationrdquo in Proceedingsof the IEEE Congress on Evolutionary Computation (CEC rsquo05)pp 1785ndash1791 September 2005
[23] EMezura-Montes J Velazquez-Reyes andC A Coello CoelloldquoA comparative study of differential evolution variants for globaloptimizationrdquo in Proceedings of the 8th Annual Genetic andEvolutionary Computation Conference pp 485ndash492 July 2006
Mathematical Problems in Engineering 23
[24] A K Qin V L Huang and P N Suganthan ldquoDifferential evo-lution algorithm with strategy adaptation for global numericaloptimizationrdquo IEEE Transactions on Evolutionary Computationvol 13 no 2 pp 398ndash417 2009
[25] S Das A Abraham and A Konar ldquoAutomatic clustering usingan improved differential evolution algorithmrdquo IEEE Transac-tions on Systems Man and Cybernetics A vol 38 no 1 pp 218ndash237 2008
[26] J Brest S Greiner B Boskovic M Mernik and V ZumerldquoSelf-adapting control parameters in differential evolution acomparative study on numerical benchmark problemsrdquo IEEETransactions on Evolutionary Computation vol 10 no 6 pp646ndash657 2006
[27] N Noman andH Iba ldquoAccelerating differential evolution usingan adaptive local searchrdquo IEEE Transactions on EvolutionaryComputation vol 12 no 1 pp 107ndash125 2008
[28] R S Rahnamayan H R Tizhoosh and M M A SalamaldquoOpposition-based differential evolutionrdquo IEEETransactions onEvolutionary Computation vol 12 no 1 pp 64ndash79 2008
[29] D Martin C Fowlkes D Tal and J Malik ldquoA databaseof human segmented natural images and its application toevaluating segmentation algorithms and measuring ecologicalstatisticsrdquo in Proceedings of the 8th International Conference onComputer Vision vol 2 pp 416ndash423 July 2001
[30] P Ghamisi M S Couceiro J A Benediktsson and N M FFerreira ldquoAn efficient method for segmentation of image basedon fractional calculus and natural selectionrdquo Expert Systemswith Applications vol 39 pp 12407ndash12417 2012
[31] R Gamperle S D Muller and A Koumoutsakos ldquoA parameterstudy for differential evolutionrdquo in Proceedings of the Advancesin Intelligent Systems Fuzzy Systems Evolutionary Computationvol 10 pp 293ndash298 2002
[32] M Saraswat K V Arya and H Sharma ldquoLeukocyte segmen-tation in tissue images using differential evolution algorithmrdquoSwarm and Evolutionary Computation vol 11 pp 46ndash54 2013
[33] J Kittler and J Illingworth ldquoOn threshold selection usingclustering criteriardquo IEEE Transactions on Systems Man andCybernetics vol 15 no 5 pp 652ndash655 1985
[34] R Guo and S M Pandit ldquoAutomatic threshold selection basedon histogram modes and a discriminant criterionrdquo MachineVision and Applications vol 10 no 5-6 pp 331ndash338 1998
[35] J C Lagarias J A Reeds M H Wright and P E WrightldquoConvergence properties of the Nelder-Mead simplex methodin low dimensionsrdquo SIAM Journal on Optimization vol 9 no 1pp 112ndash147 1998
Submit your manuscripts athttpwwwhindawicom
Hindawi Publishing Corporationhttpwwwhindawicom Volume 2014
MathematicsJournal of
Hindawi Publishing Corporationhttpwwwhindawicom Volume 2014
Mathematical Problems in Engineering
Hindawi Publishing Corporationhttpwwwhindawicom
Differential EquationsInternational Journal of
Volume 2014
Applied MathematicsJournal of
Hindawi Publishing Corporationhttpwwwhindawicom Volume 2014
Probability and StatisticsHindawi Publishing Corporationhttpwwwhindawicom Volume 2014
Journal of
Hindawi Publishing Corporationhttpwwwhindawicom Volume 2014
Mathematical PhysicsAdvances in
Complex AnalysisJournal of
Hindawi Publishing Corporationhttpwwwhindawicom Volume 2014
OptimizationJournal of
Hindawi Publishing Corporationhttpwwwhindawicom Volume 2014
CombinatoricsHindawi Publishing Corporationhttpwwwhindawicom Volume 2014
International Journal of
Hindawi Publishing Corporationhttpwwwhindawicom Volume 2014
Operations ResearchAdvances in
Journal of
Hindawi Publishing Corporationhttpwwwhindawicom Volume 2014
Function Spaces
Abstract and Applied AnalysisHindawi Publishing Corporationhttpwwwhindawicom Volume 2014
International Journal of Mathematics and Mathematical Sciences
Hindawi Publishing Corporationhttpwwwhindawicom Volume 2014
The Scientific World JournalHindawi Publishing Corporation httpwwwhindawicom Volume 2014
Hindawi Publishing Corporationhttpwwwhindawicom Volume 2014
Algebra
Discrete Dynamics in Nature and Society
Hindawi Publishing Corporationhttpwwwhindawicom Volume 2014
Hindawi Publishing Corporationhttpwwwhindawicom Volume 2014
Decision SciencesAdvances in
Discrete MathematicsJournal of
Hindawi Publishing Corporationhttpwwwhindawicom
Volume 2014 Hindawi Publishing Corporationhttpwwwhindawicom Volume 2014
Stochastic AnalysisInternational Journal of
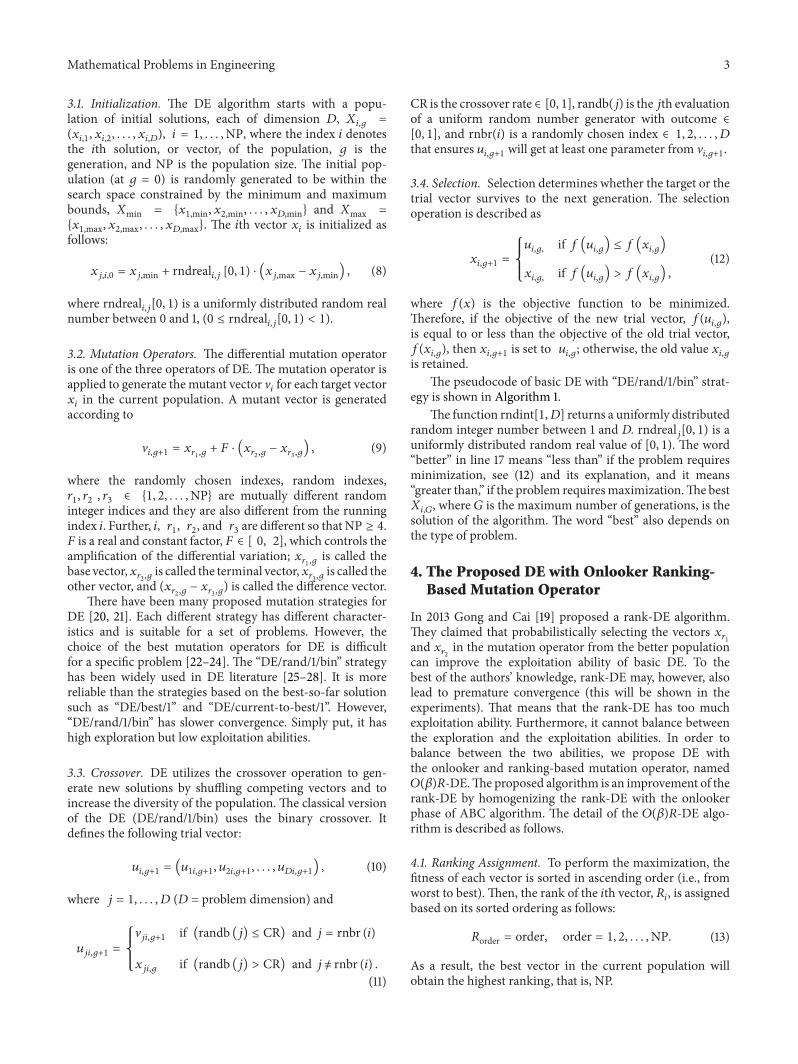
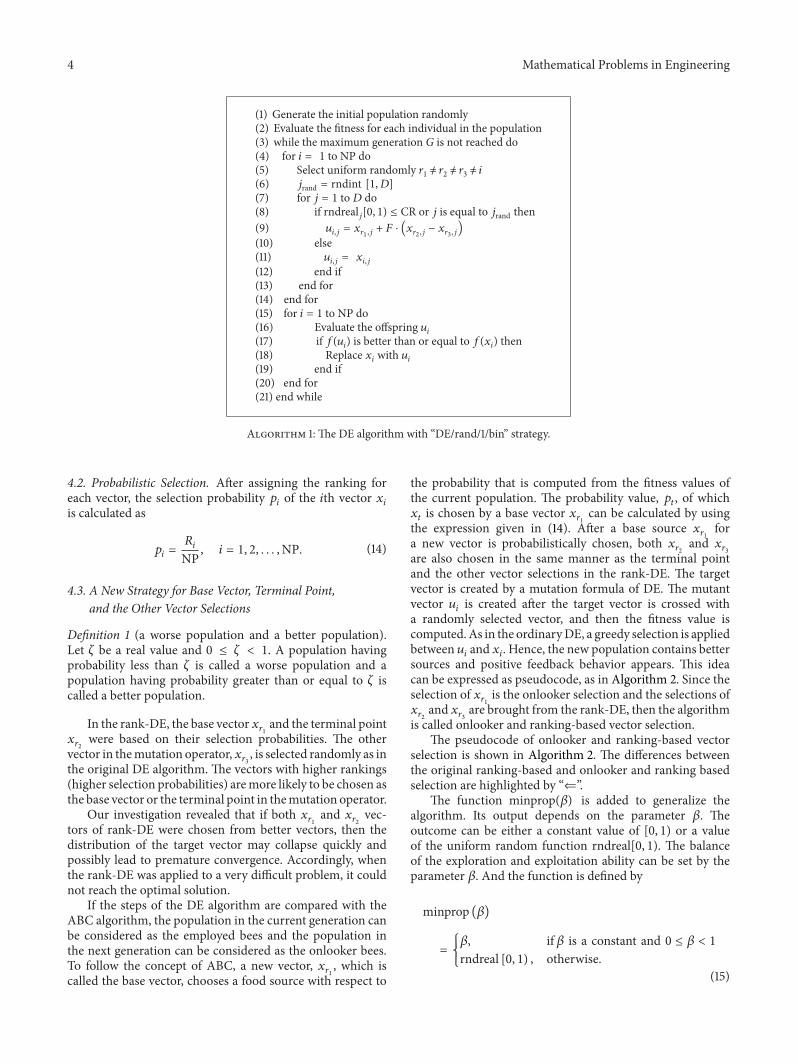
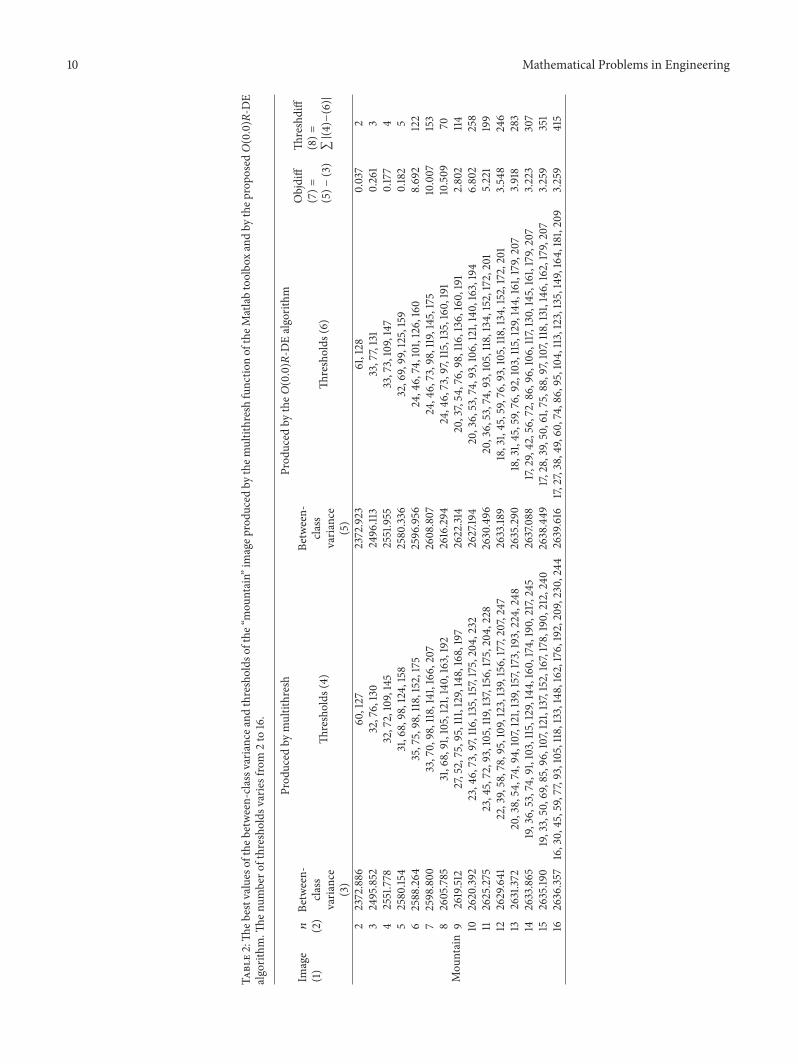
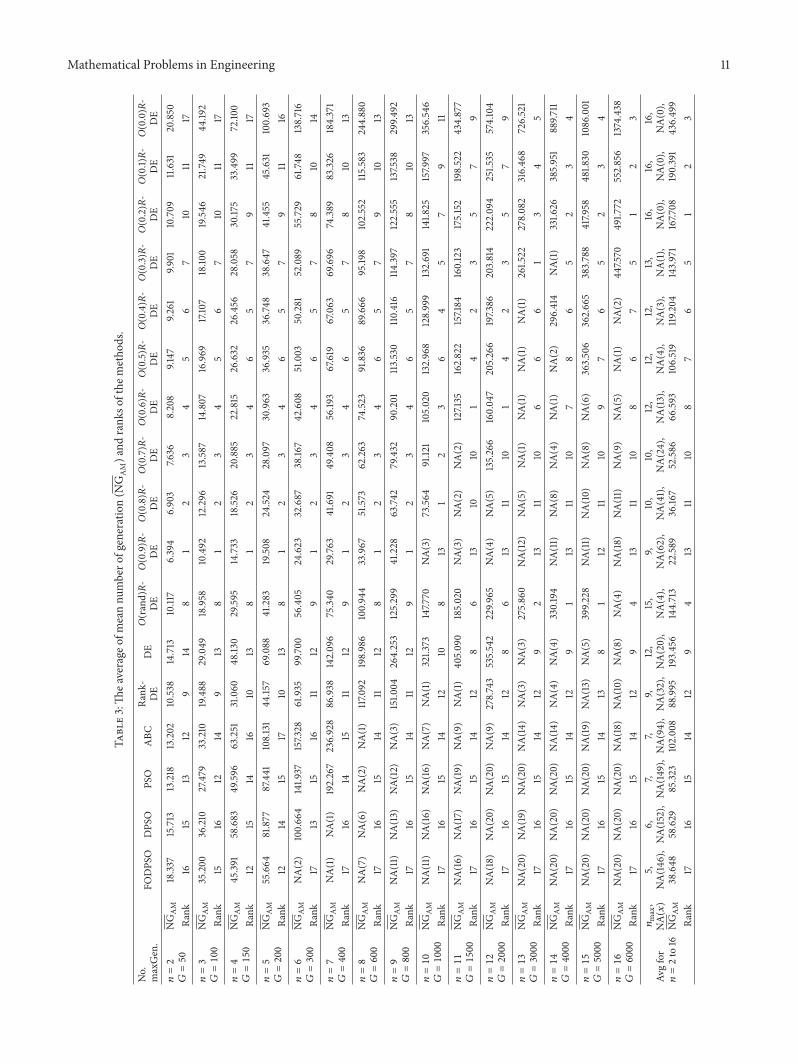
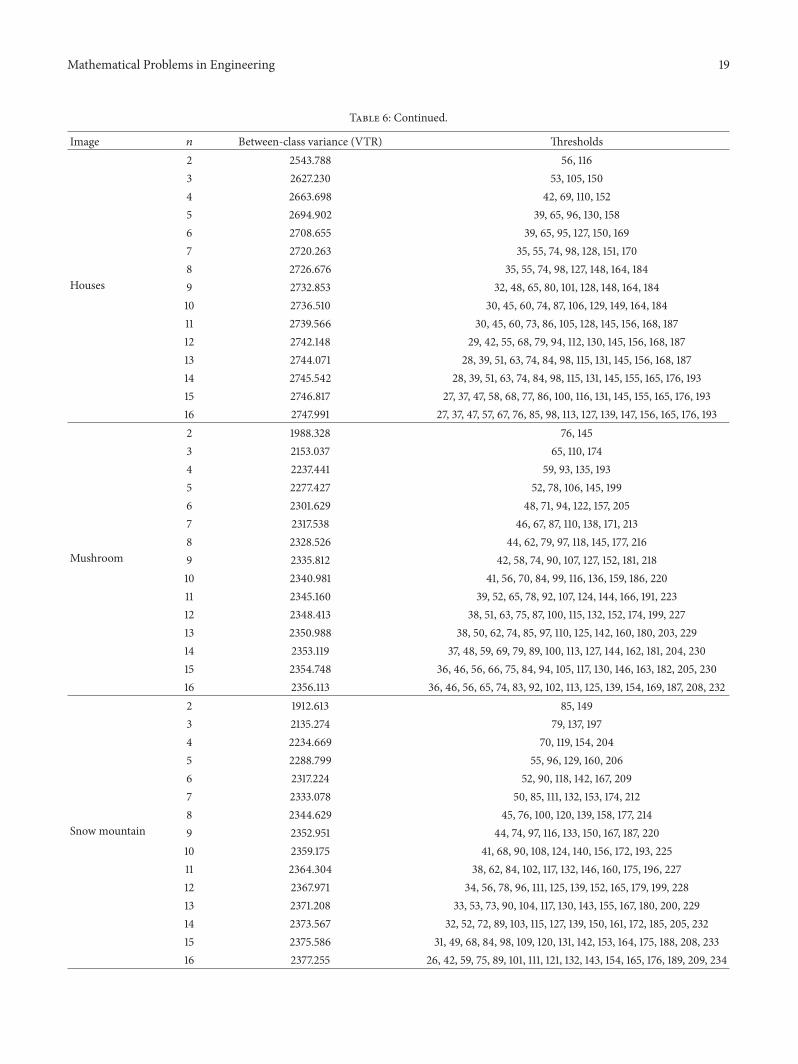


![Survey of Some Multilevel Thresholding Techniques for ... · chemo taxis length, constant rate of elimination and dispersion of bacteria and constant swim and tumbling of bacteria[5,6].](https://static.fdocuments.in/doc/165x107/5e8da16aa5f72c64847a3f1a/survey-of-some-multilevel-thresholding-techniques-for-chemo-taxis-length-constant.jpg)