Research and Development at the National Meteorological ...
23
U.S. DEPARTMENT OF COMMERCE NATIONAL OCEANIC AND ATMOSPHERIC ADMINISTRATION NATIONAL WEATHER SERVICE NATIONAL METEOROLOGICAL CENTER OFFICE NOTE 98 Research and Development at the National Meteorological Center John A. Brown, Jr. Development Division MAY 1974 To be presented at the Second AnnualForecast Research Symposium on 27-28 May, 1974, Toronto, Canada.
Transcript of Research and Development at the National Meteorological ...

U.S. DEPARTMENT OF COMMERCENATIONAL OCEANIC AND ATMOSPHERIC ADMINISTRATION
NATIONAL WEATHER SERVICENATIONAL METEOROLOGICAL CENTER
OFFICE NOTE 98
Research and Development at theNational Meteorological Center
John A. Brown, Jr.Development Division
MAY 1974
To be presented at the Second AnnualForecast Research Symposiumon 27-28 May, 1974, Toronto, Canada.

RESEARCH AND DEVELOPMENT AT THE NATIONAL METEOROLOGICAL CENTER
ABSTRACT
A description of major areas of research of the Development
Division of the National Meteorological Center (NMC) is presented. The
numerical modeling program is pointed in two main directions. One is
in the area of regional modeling for short-range prediction, which
includes efforts in hurricane modeling, planetary boundary layer
modeling, and limited-area fine-mesh modeling in general. The other
is in the area of global or hemispheric modeling for extended-range
predictions which, in the case for NMC, includes both grid-point and
spectral modeling. Associated with both of these are the problems
of parameterization of sub-grid scale processes and the problems of
initial data, which encompass the area of objective analysis,
initialization, and more recently, four-dimensional data assimilation.
The plan for operational model implementation on the newly-
acquired dual IBM 360/195 computer system is presented. The characteristics
of the analysis-forecast systems to be used routinely are discussed.

GI. Introduction
The National Meteorological Center (NMC) can be viewed as the
analysis-forecast arm of the World Meteorological Center (WMC) in Washington,
D.C. The National Environmental Satellite Service and the Environmental
Data Service provide the other types of support required in the WMC. The
Development Division is the primary research body of the NMC. It is the
work of this Division which I intend to first address my remarks. It is,
of course, not possible to describe each research project of the Division.
I have purposely confined my remarks to two major efforts which I think will
be of interest to you. In addition, I will present the current plan of the
operational model configuration for the newly-acquired dual IBM 360/195
system.
II. The Research Organization
The Development Division of the NMC as an organizational component
dates back to 1954 to the days of the Joint Numerical Weather Prediction Unit.
Since those early days, the unit has gone through many different forms. While
it is still changing today, it now consists of approximately 50 staff members,
of whom 40 are meteorologists and mathematicians.
The Division is substructured into four Branches:
Upper Air Branch. The primary function of this Branch, headed by
Frederick Finger, is to conduct investigations of the physical structure and
circulation of the upper atmosphere, e.g., investigations of the midwinter
sudden warming phenomenon in the stratosphere. In addition to determining
instrumental corrections such as due to radiation effects, satellite,
rawinsonde, and rocketsonde compatibility studies are being made.
V
I
i
I
FI
IIt
f
1,
I
I
i11
i
1,
II

0 ' * -2-
Data Assimilation Branch. This group, under the direction of
William Bonner, is responsible for the development, test and evaluation of
data assimilation systems appropriate to operational forecasting. It is
now committed to the Level II and Level III data archiving role for the
Data Systems Test of the Global Atmospheric Research Program. It is also,
directing its attention to determining the impact of some of the new
satellite data systems on operational forecasting. Section III below
briefly describes the first such study for the Vertical Temperature Profile
Radiometer (VTPR) data from NOAA-2.
Global Modeling Branch. Under the direction of John Stackpole,
resources of this Branch are directed towards the research and development
in numerical prediction of improved analysis and forecasting techniques
requiring the use of global modeling methods. Of particular interest is the
_8-layer global model and the spectral analysis system scheduled to be a
major part of the operational numerical weather prediction of the IBM 360/195
system.
Regional Modeling Branch. Headed by Joseph Gerrity, this group is
presently conducting research in the area of limited-area modeling directed
toward the improvement of operational analysis and prediction of small-scale
atmospheric phenomena. The limited-area fine-mesh modeling effort directed
towards the hurricane problem is described in Section IV.
III. The First VTPR Impact Study
Since December 1972, the NMC has been using the VTPR data operationally.
A study was made in March and April of 1973, under a NASA contract, to
_ determine the impact of this particular type of data on the numerical

-3-
prediction system which was operational at that time. These results must
be interpreted as a measure in a short period of time of the effect of this
data on the NMC model environment. They are not to be interpreted as a
measure of an optimally designed system from the standpoints of the satellite
data retrieval method, nor from the numerical analysis-prediction system.
It is intended that this study be used as a benchmark for future testing in
the Center.
The objective analysis method for geopotential heights, temperatures,
winds, surface pressure, tropopause pressure, and moisture is based on the
successive correction technique; e.go, Cressman (1959). A first estimate of
the analysis was based on the most recent 12-hr forecast verifying at the
analysis time. The grid points were corrected by nearby observations through
the judicious use of a distance weighting function. The first guess for
winds, however, was based on a gradient wind approximation using the analyzed
heights. All analyses were made on the 1977-point octagon. For further
details of the analysis method, see McDonell (1973).
The forecast model was the 6-layer primitive equation model, originally
described by Shuman and Hovermale (1968). At the initial time, there were
four layers in the troposphere and two layers in the stratosphere. Moisture
is treated as a thermodynamically active variable in the lowest three layers,
and a simple convective adjustment scheme is used to simulate small-scale
vertical exchange processes. Simple radiative effects, skin friction, and
sensible heat exchange are included. Orographic effects are included through
use of a modified Phillips' sigma (Phillips 1957) vertical coordinate.
-4-
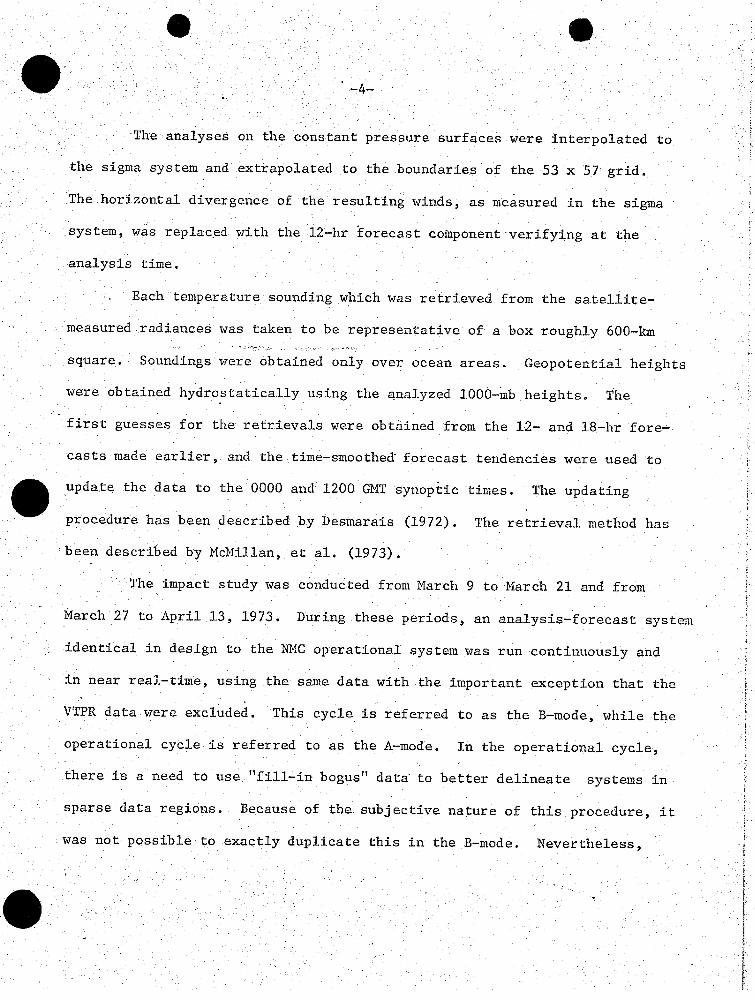
The analyses on the constant pressure surfaces were interpolated to
the sigma system and extrapolated to the boundaries of the 53 x 57 grid.
The horizontal divergence of the resulting winds, as measured in the sigma
system, was replaced with the 12-hr forecast component verifying at the
analysis time.
Each temperature sounding which was retrieved from the satellite-
measured radiances was taken to be representative of a box roughly 600-km
square. Soundings were obtained only over ocean areas. Geopotential heights
were obtained hydrostatically using the analyzed 1000-mb heights. The
first guesses for the retrievals were obtained from the 12- and 18-hr fore-
casts made earlier, and the time-smoothed forecast tendencies were used to
update the data to the 0000 and 1200 GMT synoptic times. The updating
procedure has been described by Desmarais (1972). The retrieval method has
been described by MeIillan, et al. (1973).
The impact study was conducted from March 9 to March 21 and from
March 27 to April 13, 1973. During these periods, an analysis-forecast system
identical in design to the NMC operational system was run continuously and
in near real-time, using the same data with the important exception that the
VTPR data were excluded. This cycle is referred to as the B-mode, while the
operational cycle is referred to as the A-mode. In the operational cycle,
there is a need to use "fill-in bogus" data to better delineate systems in
sparse data regions. Because of the subjective nature of this procedure, it
was not possible to exactly duplicate this in the B-mode. Nevertheless,

w0-5-
experienced synopticians performed this bogusing function independently in
the B-mode system, without prior knowledge of the A-mode results. The
average number of such reports was near 40 per cycle and most of these were
created for the Pacific Ocean region.
The average number of VTPR reports in the A-mode analyses was 88
per 12-hr cycle in the data base collected 3 hours and 30 minutes after
synoptic observation times. At the 10-hour data cutoff time, this number
was 100.
The resulting analyses and forecasts of the A- and B-modes were
compared both subjectively and statistically. The root-mean-square, mean,
and standard deviation of the differences for the height, temperature, and
.wind at the ten analysis levels to 100 mb for the entire octagon grid and
for five subregions were computed. Since the analyses were essentially the
same over the continents, forecasts were verified against the A-mode
analyses. Over the oceans, the forecasts were verified mainly against
radiosonde reports. The forecast height gradients were also verified together
with the precipitation forecasts at 60 observing stations in the United
States and southern Canada.
The root-mean-square 500-mb analyzed height differences averaged
15 m in the Atlantic and 25 m in the Pacific. This compares with 40 m for
two analyses 12 hours apart in the Pacific region. Figure 1 shows the 500-mb
analysis differences for the second period of this study for three subregions.
Note that the root-mean-square difference over North America was only 4 m.
The April 4 case, where a maximum root-mean-square difference in the Pacific

*O f ; d ::: :: : :0 :-6-
region reached 57 m, was studied in great detail. Note that this large
difference diminished rapidly in the analyses which followed.
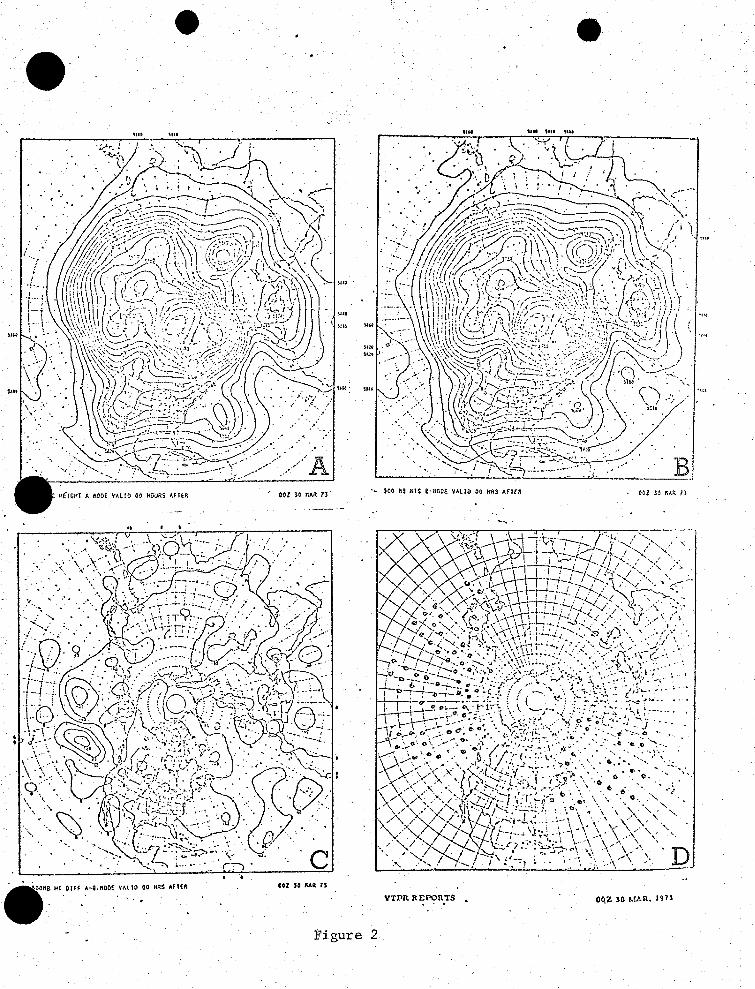
Figure 2 shows the March 30 500-mb analyses of the A- and B-modes,
-their differences, and the VTPR data coverage. Figure 3 shows the 500-mb
forecast differences out to 48 hours. Figures 4 and 5 show the same
results for the April 4 case.
This report is not intended to be a full documentation of the impact
study, but only a brief presentation of the study performed by Dr. Bonner
and his staff. Therefore, rather than show the many forecast verification
statistics, I will only state the general conclusions of the study. In this
particular experiment, the VTPR data played a relatively minor role in the
A-mode, or operational system. Unfortunatley, from the evidence obtained
we cannot state that the data were beneficial. We also cannot say that the
evidence was detrimental. During most of the test periods, the analyses were
surprisingly similar. With few exceptions, there were apparently sufficient
conventional data in the B-mode to guide the monitoring synopticians towards
a similar solution for the analysis. It became quite evident that the
bogusing function is a powerful tool available to the synoptician. Un-
fortunately, this effect could not easily be isolated from the VTPR effect.
For example, the extreme southward displacement of the jet on April 4 in the
A-mode was the result of a combination of VTPR and bogus reports.
The main conclusion of this study is that the VTPR data gave no new
information which could be utilized by this analysis-forecast system. At this
point, one can only speculate why this was the case. In any event, we must

-7-
be aware that this particular impact study.was made only 10 weeks after the
data were first available operationally. This was a test with an operational
numerical system designed primarily for the utilization of conventional,
-synoptic-type data. The results of such experiments, however, can be used
to guide us in our efforts to construct systems which are capable of better
separating the signal from the noise of.these new observing systems.
The detailed report of this study is presently available in the form
of a contract report (Staff Members, Data Assimilation Branch, XMC, 1973).
IV. Hurricane Modeling
An effort is underway to test the present state-of-the-science of
hurricane modeling for operational purposes. A four-man team, under the
direction of John Hovermale, was organized in the summer of 1973 to
accomplish this. The short-term objective is to design, construct, and test
an analysis-forecast system (first generation system) suitable for operational
implementation on the IBM 360/195 computer system. It is to be used primarily
for short-range predictions (24 to 36 hours) of hurricane motion, particularly
for storms threatening populated coastal areas, and secondarily for predicting
the associated amounts of precipitation in them. The results of studies by
Miller, et al., (1972), Mathur (1974), and Ceselski (1974) have demonstrated
that models with fairly coarse spatial resolution can produce skillful track
forecasts.
The long-term objective of this group is to embark into promising
avenues of research to raise the level of forecast skill. This could involve
.a.search for improved grid nesting techniques, cumulus convection parameterization
techniques, and improved methods of obtaining the initial atmospheric state.

S, -8-
A coordinated effort has been planned with scientists from other NOAA groups
(National Hurricane Research Laboratory, National Hurricane Center, and the
Geophysical Fluid Dynamics Laboratory) to develop a second generation
hurricane prediction model for operational forecasting. It is intended that
this analysis-forecast system also be used to serve the needs of the
Environmental Research Laboratories. It is generally believed that the
ultimate requirements for accurate forecasting can only come with such three-
dimensional numerical systems with a high resolution grid which resolves the
details of the storm core and incorporates a sufficiently large domain to
capture the interactions of nearby meteorological systems.
In the construction of the first generation model, operationally
tested methods will be used whenever possible. For example, a finite-
difference system will be used which is known to be reliable for short-range
forecasting purposes. The numerical grid will be of uniform spatial
resolution, rather than one which increases in resolution towards the core
of the storm. However, it was recognized from the beginning that testing of
untried methods for objective analysis would have to be undertaken.
Dr. Hovermale and his staff have now constructed a 10-layer primitive
equation model using the Phillips sigma vertical coordinate. This model will
contain a 60-km 51 x 51 grid which will move with the center of the storm.
The lateral boundary conditions will be obtained from the most recent
operational coarse mesh model predictions. The computer program is written
so that horizontal and vertical grid resolution can be easily varied to adapt

O -9-0
to a running time of about 1 hour on the IBM 360/195. It is furthermore
modularized to allow for ease in testing the effects of various formulations
of the physical processes. The original version has Kuo's (1965) method of
parameterizing cumulus convection incorporated. Also, the semimomentum
differencing system is used (Shuman and Stackpole, 1968).
*A two-dimensional, axially symmetric version of the three-dimensional
model has also been constructed. It is used to perform experiments
inexpensively prior to testing in the three-dimensional version. It will
also be used in representing the vortex initially in a four-dimensional data
assimilation technique.
In the four-dimensional data assimilation process, estimates of the
analyses at synoptic times will be obtained for a short time period (say up
_ to 24 hours) prior to the initial time, to . These will be first spatially
interpolated from coarse mesh analyses and reanalyzed on the fine mesh grids
using isentropic analysis techniques. The two-dimensional version of the
model will be used to prescribe the initial guess in the vicinity of the
vortex. The three-dimensional model will then be integrated from to-24 to
to, treating the analyzed fields as grid point "data." The forecast state
will be nudged towards these analyzed states through a fictitious term in each
prediction equation of the form KV2(I - A). Here a represents the
predicted value of a parameter, and aA represents the "data", and K is a
coefficient to be determined. K could be a function of time, maximizing
near the valid time of the "data." In the predictions beyond to, these
fictitious terms must be rapidly vanishing in a way that the shock is minimized.

0 O-10-
Dr. Hovermale is also considering the use of the fictitious terms
mentioned above in the blending of the lateral boundaries of the fine-mesh
grid with the coarse-mesh forecasts. He has been successful in
incorporating this idea into a primitive equation barotropic system.
We plan to test the three-dimensional hurricane system presently
under development on midlatitude disturbances as well. A modified version of
this system will be tested for possible future implementation for operational
short-range forecast guidance.
V. NMC's Operational Modeling Plans
The dual IBM 360/195 NOAA computer system was installed in Suitland
in early 1974. It is to replace two of the three CDC 6600 computers. A
large portion of the NMC staff, particularly in the Automation Division,
are committed to the job of converting the entire operational system to the
new computer configuration.
The operational analysis-forecast system to be eventually implemented
on the 360/195 system is given in Table 1. The times shown are the times
(hours + minutes) after the synoptic data times 0000 and 1200 GMT. The HUF
analysis system is a global-type objective analysis technique developed by
Thomas Flattery. It is a three-dimensional technique in which data are fit
to a set of spectral (Hough) functions in the horizontal dimensions and to a
set of empirical orthogonal functions in the vertical dimension. The fit is
accomplished through a process of minimizing the mean-square differences
between the analysis and the observations. Twenty-four Hough functions with

S .:f :0:: a:: 0:Xa^: ll: 0:: : 0 :w: S -11-
24 zonal wave components each are used together with 7 vertical functions.
Further details of the analysis technique can be found in Flattery (1967
and 1970) and Technical Procedures Bulletin No. 105 (1974).
SC refers to the present successive correction analysis technique
used operationally (l4cDonell 1973). The 6L PE is the operational 6-layer
primitive equation model. It differs from the CDC 6600 version mainly in
that the horizontal grid is expanded from a 53 x 57 to a 65 x 65 grid array.
This change puts the lateral wall further south, yielding a larger valid
forecast domain. The main reasons for running the6L PE at 2+00 are (1) to
produce forecast guidance to 48 hours for meeting tighter deadlines brought
about by continual daylight savings time, (2) to maintain a forecast
product for Model Output Statistics (until the statistics can be accumulated
on the new models), and (3) to establish with the LFM a vehicle through
which we can develop and test a two-way interacting nested grid system.
The 8L GLOBAL is a new global forecast model presently under develop-
ment (Stackpole, et al., 1974). 8L HEM is the hemispheric version of the
model. Initially, the model resolves the atmosphere with six equipartitioned
layers in the troposphere and two layers in the stratosphere. Material
surfaces exist at the top and bottom of the atmosphere and at the tropopause.
A computational cap is present which is similar to that in the 6L PE. This
vertical configuration is subject to change pending the outcome of testing.
The model contains a latitude-longitude grid. The stringent linear stability
criterion brought about by the converging meridians at the poles is relaxed
through use of an averaging technique for the tendencies along the latitude

-12-
circles on each side of the grid points. Moisture equations are integrated
in the lowest five layers of the model. In the initial version, the physics
of the model will be similar to those of the 6L PE. An intensive testing
period is planned prior to implementation of the 8L HEM at the 3+20 time.
In the interim, the prediction model will be the present 65 x 65 version of
the 6L PE.
The global system to be run at 10+00 will allow for the collection
of data arriving after the main forecast cycle at 3+20. Twelve-hour fore-
casts from this model will be used for the first estimates of the analyses
at the 1+30, 2+00, and 3+20 times. The global forecast system can also be
used to provide the first estimates of the vertical temperature profiles
for retrieving the temperatures from the satellite measured radiances._
it is also intended to be used to fill the upper air forecast requirements
of the Air Transport Association.
The details of the numerical systems presented in Table 1 are still
to be taken as tentative estimates since some of the new systems are yet to
be fully tested.

PredictionModel
Barotropic
6L PE
LFM
8L HEM
8L GLOBAL
Horizontal Resolution .
381 km
381 km
381/2 km
2 degree
2½ degree
Area Domain
1977-pt Octagon
Northern Hemisphere(65 x 65 pt grid)
North America(53 x 45 pt grid)
Northern Hemisphere
Global
ForecastPeriod
48 hrs
48 hrs
36 hrs
48/96 hrs
24 hrs
Table 1. NMC's operational model system planned for the IBM 360/195 NOAA computer system
S
Time
1+30
2+00
3+20
10+00
Analysis
HUF
HUF
SC
HUF
HUF
I1.!
. - . I .I . - . , , I I I � d � � � , , , . I � I . I . - , . I .1 � I � , , -., , , , ?- , - 4' 1. , ... "- , - � , s � - , � 4 , . , . I-- ,- - � 7 L, 1 7� .4 -. � ; .
-14-
REFERENCES
Ceselski, B., 1974: Cumulus convection in weak and strong tropical
disturbances. (To be published).
Cressman, G. P., 1959: An operational objective analysis system.
Mon. Wea. Rev., 86, 367-374.
Desmarais, A., 1972:. Updating asynoptic data for use in objective analyses.
NOAA Tech. Memo., NWS NMC-51, 19 pp.
Flattery, T. W., 1967: Hough functions. Technical Report No. 21 to the
National Science Foundation (Grant NSF-GP-471), University of
Chicago, Department of the Geophysical Sciences.
Flattery, T. W., 1970: Spectral Models for Global Analysis and Forecasting.
Proceedings of the Sixth AWS Technical Exchange Conference, U.S.
Naval Academy, September 21-24. Air Weather Service Technical
Report 242, 42-49.
Kuo, H. L., 1965: On formation and intensification of tropical cyclones
through latent heat release by cumulus convection. J. Atmos. Sci.,
22, 40-63.
Mathur, M. B., 1974: A multiple grid primitive equation model to simulate
the development of an asymmetric hurricane (Isbell 1964). J. Atmos.
Sci., 31, 371-393.
IMcDonell, J. E., 1973: Notes on operational objective analysis procedures.
Prepared for Advanced Prediction Techniques Course at National
Weather Service Headquarters. 66 pp.

*,0000 f; flufy .0 , 00-15-
McMillin, et al., 1973: Satellite infrared soundings from NOAA spacecraft.
NOAA Tech. Report, NESS 65, 112 pp.
Miller, B. I., P. P. Chase, and B. R. Jarvinen, 1972: Numerical prediction
of tropical weather systems. Mon. Wea. Rev., 100, 825-835.
Phillips, N. A., 1957: A coordinate system having some special advantages
for numerical forecasting. J. Meteor., 14, 184-185.
Shuman, F. G., and J. B. Hovermale, 1968: An operational six-layer
primitive equation forecast model. J. Appl. Meteor., 7, 525-547.
Shuman, F. G., and J. D. Stackpole, 1968: The currently operational NMC
model, and results of a recent simple numerical experiment.
Proceedings of the WMO/IUGG Symposium on Numerical Weather Prediction
in Tokyo, Nov. 26-Dec. 4. II - (85-98).
Stackpole, J. D., L. W. Vanderman, and F. G. Shuman, 1974: The NMC 8-layer
global primitive equation model on a latitude-longitude grid. GARP
Publications Series (to be published).
Staff Members, Data Assimilation Branch, National Meteorological Center,
National Weather Service. NASA Contract S-70252-AG Report. 82 pp.
Technical Procedures Bulletin No. 105: A description of the Flattery global
analysis method. National Weather Service, Silver Spring, Md. 20910.
9 pp.

-16-
LIST OF FIGURES
The root-mean-square differences (meters) between the A- and
B-mode analyses for 500-mb geopotential heights as a function
of time during the second period of the investigation. Below
is given the total number of VTPR reports received each
12 hours in the Pacific region (upper row) and in the Atlantic
region (lower row).
0000 GMT March 30, 1973.
A. -500-mb height analysis for A-mode.
B. 500-mb height analysis for B-mode.
C. 500-mb height difference A-mode minus B-mode (meters).
D. Locations of VTPR reports in the A-mode.
0000 GMT March 30, 1973. 500-mb height forecast difference
A-mode minus B-mode (meters).
A. 12-hr.
B. 24-hr.
C. 36-hr.
D. 48-hr.
Same as Figure 2, but for 0000 GMT April 4, 1973.
Same as Figure 3, but for 0000 GMT April 4, 1973.
Figure 1.
Figure 2.
Figure 3.
Figure 4.
Figure 5.

RMS DIFFERENCES',. A-MOOE va,'8 FOR 500MB' GEOPOTENTIAL HEiGHTS '
…...NOflTU AMERICA
F~~~~~~~~~~~~~~~~~~~~~~~~~~~~~~~~~~~~~~~~~~~~~~~~~~~~~~~~~~~~~~'
I'~~~~
-. _ . x ' , ~ ./~ /,.', i-.- ' x, ...... ,:..,, ./,,,.. /. I\ ; ,,__~ i \\.. \ i' ; --·~~~ , ' : ' ql'~,'~
I % ./ ' .I ! %%-
·. % o %%I. . ; I
I
I .·t - I
! ! , I I.
27 28 ' 29 *30MARCH 1973
31 1APRIL
.. MEAN sTi). DEV.NO. AMER. 4.29 4201ATL. 14.76 ± 4.70PAC - 0717 4- In 17
I . 5\ -/·%Vp
I'""'
i..I I I
II ' %-..J
i*~ 1I %- . - . I. I ~% %_- % . I . S01
%111 % " % .- ,~~~~-S.---
I I I ' 1I I I I -
2 3 4 5 6 . 7 8 9 10 It 12
i i I I I I'i. .I I I ~, I I32 31 M 67 39 60 50 64 43 48 49 37 46 54 32 39 M 47 42 57 58 60 45 59 :41 64 37 53' 42 6Z 43 59 38 71
ZS 2 M 515 28 32 40 51 30 4,0 36 3,2 31 39? 39 35 M 4 0i , 46 142 4 3 7. 3 4 4, 36 44 4 35 4 56, "Fig - i~~igr 1
-A
60
50
40
30
20
10
'
V To R. o FP SVTPR RPTS. I
A-i11.
I
I
.013
Ir
0
0- $00 ht 01E C-NODF VALID 00 PAS AFIER * 005 30 0r0 7M
.H OIFf A-Q.No0o VAtID 00 MRS IFTER
VTPR xREPORTS . ocZ 30 M}AR. 1975
Figure 2
*O0 SO RAft ?$

- f~~~~~~fy
: i: ., 0 dl:: -19-
.'
* ~~~~~~~~~~.: i :
:~~~~~~~~~~~~~~~
·...l .... : .: >a~'.-.
rF A-B MDDES vA~ln lZ HOURS AFTE Soo3 MAR 73 soo Mg HT DIfF A-B MODES VALID 24 HOURS AFTER
,~ - :
5' '
)I F A 8 M DS aAI Dt HO R S AF E
:. . .. . Figur e -
.· a :. .
·~~~~~~~ ; ' '..'->;: . "'f .:a..~...' '
.*: : :, .,Z: ... ,..·
.. .- ·
- C.TIFF. A-B MOE.A.DT.0..A.R02.0MR7
50M T0FFAAMSS AI SROM FE
~ '~. -'-.- Figure 3
O02 30 MAR 73
p
I �
t
I.
I
IIIIi
I
I
i
IIi
IitI
IIa
I
II
i
ItIaI
tII
Iiii
.i
iII
I
I
I
�iI
$0O MB HT I
002 30 MAR 73'

*;~~~~~ _ : :-20-
0~~~~~~~~-~ . , : :
500 He HEIGHT .A rOOE VALI 00 HOURS AFTER H002 O APR 73 ..
(f· 't .OURS*AFTER QoZ .
·.... .' .. " ,/, a, /, *,
- 0O0 HEIGHT DI OeCDE S VALID 00 HUSAFTER 00 R 4 OT 75YR REPHSH O RT S O ,4AP.17
':~,,~~L. "' u I(,·. ,~: .- - . ' , . : , ~ , ~, -.-.
,q. .~- ......
~~~~~~~~~~K' 4~~t fl~p ~~ H RODEO R~~~tIO RD HOURS AFTER ROT 04 APR 73 - VTPJO REPORTS OOZ 4 APR. 1973~,~' ~,'
Figure 4
iIiIiI
q
t
I
i
i
I11
IiIII
k
i
IiiI
i
tJ!
I
i

k: ,�' \�-U!
2 &
- .L�
K- 1() F
SO FIB HT DIFF A-B RODES VALJD.Z4 HOURS AFTER OOZ 04 APR 73
: R S R A T A -S R O S E S S A L T S I S o z oF E
500 MB HT DIFF A-B HODES VALID 36 HOURS AFTER OOZ OT APR 73 500 BR RT OIFF A-B RODES VALID AR HOURS AFTER CORHE#T. ~ OZ 04 AP
Figure 5
-21-
f
K? -
>' I) �
I
If
I
IfII
I
fiE
I
i
J�1.
I1,t
II
f
i
t
I
II
II
I