
RES-E-NEXT Next Generation of RES-E Policy...
102
RES-E-NEXT Next Generation of RES-E Policy Instruments M. Miller, L. Bird, J. Cochran, M. Milligan, M. Bazilian National Renewable Energy Laboratory E. Denny, J. Dillon, J. Bialek, M. O’Malley Ecar Limited K. Neuhoff DIW Berlin Study commissioned by IEA-RETD www.iea-retd.org [email protected] 4 July 2013
Transcript of RES-E-NEXT Next Generation of RES-E Policy...
RES-E-NEXT Next Generation of RES-E Policy Instruments
M. Miller, L. Bird, J. Cochran, M. Milligan, M. Bazilian National Renewable Energy Laboratory
E. Denny, J. Dillon, J. Bialek, M. O’Malley Ecar Limited
K. Neuhoff DIW Berlin
Study commissioned by IEA-RETD www.iea-retd.org [email protected]
4 July 2013

ii
IEA-RETD RES-E-NEXT 04 July 2013
iii
Acknowledgements The authors would like to extend their gratitude to the members of the RES-E-NEXT Project Steering Group: Michael Paunescu (Natural Resources Canada), Simon Müller (International Energy Agency), Georgina Grenon (Ministry for Sustainable Development, France), Henriette Schweizerhof (Federal Ministry for the Environment, Nature Protection and Nuclear Safety, Germany), Kaoru Yamaguchi (Institute for Energy Economics, Japan), Kjell Sand (SINTEF, Norway), David de Jager (Ecofys), and Kristian Petrick (All Green Energies).
The authors would also like to thank those who participated in the March 21, 2013 RES-E-NEXT workshop in Dublin, Ireland. Finally, the authors would like to thank colleagues who provided comments and suggestions for improvement, including David Hurlbut (NREL), Jeffrey Logan (NREL), Doug Arent (NREL), Jon O’Sullivan (EirGrid). All errors remain our own.
About IEA-RETD The International Energy Agency’s Implementing Agreement on Renewable Energy Technology Deployment (IEA-RETD) is a policy-focused, cross-cutting platform that brings together the experience and best practices of some of the world’s leading countries in renewable energy with the expertise of renowned consulting firms and academia.
The mission of IEA-RETD is to accelerate the large-scale deployment of renewable energies. It is currently comprised of nine countries: Canada, Denmark, France, Germany, Ireland, Japan, the Netherlands, Norway, and the United Kingdom. Hans Jørgen Koch, Deputy State Secretary, Ministry of Climate and Energy, Danish Energy Agency, serves as Chair of the RETD.
The IEA-RETD Implementing Agreement is one of a number of Implementing Agreements on renewable energy under the framework of the International Energy Agency (IEA). The creation of the IEA-RETD Implementing Agreement was announced at the International Renewable Energy Conference in Bonn, 2004. For further information please visit: www.iea-retd.org .
About the Consortium The National Renewable Energy Laboratory (NREL) is the U.S. Department of Energy's primary national laboratory for renewable energy and energy efficiency research and development. NREL develops renewable energy and energy efficiency technologies and practices, advances related science and engineering, and transfers knowledge and innovations to address the nation's energy and environmental goals. For more information please visit www.nrel.gov.
Ecar Limited is an Ireland-based energy consulting and research company which provides the expertise the energy sector needs to plan and implement wholesale electricity markets, large scale deployment of renewable energy generation and emerging power system operating strategies. Ecar offers project consulting, training, and research services to government agencies, regulators, power system and electricity market operators, and wholesale electricity market participants. For more information please visit http://ecarenergy.com.

IEA-RETD RES-E-NEXT 04 July 2013
iv
List of Acronyms AC alternating current AESO Alberta Electric System Operator CAES compressed air energy storage CAISO California independent system operator CCGT combined cycle gas turbine CER Commission for Energy Regulation, Ireland CfD contracts for difference CHP combined heat and power CREZ competitive renewable energy zone DC direct current DFIG doubly fed induction generators DLR dynamic line rating DR demand response DSM demand-side management DSO distribution system operator ECAR EDUCAUSE Center for Applied Research EIA U.S. Energy Information Administration ENTSO-E European Network of Transmission Operators ERCOT Electric Reliability Council of Texas FiT feed-in tariff FP7 Seventh Framework Program GIVAR Grid Integration of Variable Renewables GW gigawatt GWh gigawatt-hour HVDC high-voltage direct current IEA-RETD International Energy Agency’s implementing agreement
on Renewable Energy Technology Deployment IRP integrated resource planning IRRE insufficient ramping resource expectation kV kilovolt LMP locational marginal pricing LOLE loss of load expectation MAE mean absolute error MWh megawatt-hour

IEA-RETD RES-E-NEXT 04 July 2013
v
NTC net transfer capacity NYISO New York Independent System Operator OCGT open-cycle gas turbine PPA power purchase agreement PUCT Public Utility Commission of Texas PV photovoltaic RE renewable energy RES-E renewable sources of electricity RTO regional transmission organisation SA Southern Australia SEM single electricity market SMS superconducting magnetic storage SPS special protection scheme TSO transmission system operator TTC total transfer capacity TWh terawatt hour WILMAR Wind Power Integration in Liberalised
Electricity Markets

IEA-RETD RES-E-NEXT 04 July 2013
vi
Executive Summary The rapid deployment of renewable sources of electricity (RES-E) is transforming power systems globally. This trend is likely to continue with large increases in investment and deployment of RES-E capacity over the coming decades. Several countries now have penetration levels of variable RES-E generation (i.e., wind and solar) in excess of 15% of their annual electricity generation; and many jurisdictions (e.g., Spain, Portugal, Ireland, Germany, and Denmark; and, in the United States, Colorado) have experienced instantaneous penetration levels of more than 50% variable generation.1 These penetration levels of variable RES-E have prompted many jurisdictions to begin modifying practices that evolved in an era of readily dispatchable, centralised power systems.
Providing insights for the transition to high levels of variable RES-E generation is the focus of this document, which is the final report of the RES-E-NEXT project commissioned by the International Energy Agency’s implementing agreement on Renewable Energy Technology Deployment (IEA-RETD). It presents a comprehensive assessment of issues that will shape power system evolution during the transition to high levels of variable RES-E generation. While policy will be a central tool to sustain the growth of RES-E capacity and to enable power system transitions, the scope of the report extends beyond policy considerations to include the related domains of regulation, power market design, and system operation protocols. This broad scope is in recognition that a changing resource mix with greater penetration levels of variable RES-E has broad implications for grid operations, wholesale and retail power markets, and infrastructure needs.
The next decade will be a critical transition period for power system stakeholders, as global deployment of RES-E capacity (and especially variable RES-E capacity) continues to scale-up in many regions of the world. To address increased penetration levels of RES-E in power systems and the new challenges that could emerge, coordinated portfolios of policies, market designs, regulations, and operational protocols are essential. The goal for policymakers is to facilitate investment in RES-E technologies and to enable efficient and reliable system operation, cost-effective service delivery, and continued public acceptance.
Although the factors that impact the speed and scale of RES-E deployment manifest uniquely in each power system, in the transition to high shares of variable RES-E this report identifies four critical domains and the changing drivers that will shape next-generation policy for each. These domains are introduced in Table I, and comprise the major sections of this report.
1 RES-E technologies include: bioenergy, direct solar energy, geothermal energy, hydropower, ocean energy, and wind energy. These technologies can be (i) variable and—to some degree—unpredictable, (ii) variable and predictable, (iii) constant, or (iv) controllable (IPCC 2011). Technologies that are variable and unpredictable are the most challenging for system operators. Variable RES-E sources include wind, solar, and ocean energy. As the focus in this report is primarily on policy considerations for wind and solar deployment, these are referred to as variable RES-E.
2013–2025 is a critical
policy transition period.

IEA-RETD RES-E-NEXT 04 July 2013
vii
Table I. RES-E Policy Domains and Drivers
Policy Domain First-Generation Drivers Next-Generation Drivers
Securing RES-E generation Rapid capacity addition Managing market and system
interactions; cost containment
Securing grid
infrastructure
Enabling rapid capacity
addition
Coordination; enabling flexibility;
cost and risk allocation; public
acceptance
Short-term security of
supply: Flexibility
Understanding RES-E impacts
on flexibility requirements
Assessing flexibility requirements;
identifying solutions; implementing
incentives
Long-term security of
supply: Adequacy
Least-cost security of supply;
market liberalisation
Modifying regulatory paradigms for
adequacy with greater RES-E
penetration levels
Key Challenges and Emerging Solutions The drivers of energy system transition vary by context and, in response, compelling policy approaches and solutions are emerging around the world. This report investigates the landscape of challenges and offers potential solutions in these key domains of RES-E policy.
Securing New RES-E Generation Greater penetration levels require transitional policies to sustain the growth of RES-E capacity. Considerations that will shape these transitional policies include changing investment environments, evolving market designs, and emerging system-operation constraints, each of which are unique to specific power systems. For example, RES-E capital costs are declining at different rates for each technology and in each jurisdiction—altering the economics of low-carbon incentives. Wholesale markets could experience increased price volatility and general price depression, introducing price and volume risk for conventional and RES-E generators alike. Depending on system flexibility, curtailments (spilled energy) could increase as RES-E achieves a greater share of supply, thereby reducing expected revenue streams and creating revenue uncertainty that can impact financing. These interactions complicate the role and design of policies to secure new RES-E.
During the transition period, policies to secure RES-E investments will evolve from a focus on adding capacity to more nuanced designs that also reduce investment risk, minimise policy costs, minimise grid impacts, and achieve greater integration within market contexts. The elements of such next-generation policy designs are evident in IEA-RETD member countries (Canada, Denmark, France, Germany, Ireland, Japan, Netherlands, Norway, and the United Kingdom) and beyond. Various support schemes, for example, now include elements to better reflect underlying technology cost declines (e.g., German tariff-reduction schedules), and to incentivise RES-E generators to provide grid-support services currently provided by conventional generators (e.g., voltage and frequency support incentives in Spanish feed-in tariffs). Complementary mechanisms also can be enacted to assist in integrating RES-E generation into system operations. Examples include incentivizing stronger consideration of location of
IEA-RETD RES-E-NEXT 04 July 2013
viii
new RES-E generation capacity to alleviate congestion (e.g., locational pricing), requiring RES-E to contribute to advanced forecasting (e.g., grid requirements in Spain and Germany), and integrating RES-E generation into dispatch optimisation (e.g., U.S. Midwest Independent System Operator Dispatchable Intermittent Resources category).
Securing Grid Infrastructure Substantial investments in grid infrastructure will likely be required to maintain grid reliability and security—in particular with large deployments of variable RES-E. Broad, smart, and strong grids can reduce the variability of RES-E generation by allowing plants to be geographically dispersed, improve system flexibility, alleviate congestion, access new locations of RES-E, and facilitate competition among generators. Grid expansion, however, faces significant challenges with respect to, inter alia,
coordination, securing rights of way, public acceptance, allocating costs, and the difference in timescale between generation and transmission investments.
A variety of policy solutions have been implemented or are emerging to address barriers to transmission investments. These include evaluating transmission proposals in aggregate (e.g., the Irish Gate System), designating specific transmission corridors for RES-E (e.g., Texas Competitive Renewable Energy Zones), and examining practices for managing congestion in interconnected networks (e.g., locational pricing, net transfer capacities). In addition to evolving processes to encourage and coordinate transmission investments, robust distribution infrastructure is particularly important in systems with growing distributed photovoltaic (PV) generation. Several policy, operational, and technology solutions are emerging to improve the performance of distribution networks under high variable RES-E penetration levels, such as locational signals to guide PV deployment, active network management, requirements for reactive power control by PV inverters, and distributed electricity storage.
Short-Term Security of Supply: Enhancing System Fle xibility Variable RES-E generation typically requires more power-system flexibility to maintain system balance. Although flexibility always has been necessary in power systems—both to accommodate fluctuations in loads and to manage supply interruptions—systems with significant variable RES-E generation require additional flexibility to accommodate greater fluctuations in power generation.
Flexibility can be derived from a number of sources on both the supply side and the demand side, as well as via operational practices and market designs. Specific options can include larger balancing areas, advanced methods of scheduling and dispatching generators, additional reserves, faster market operations, increased demand response, more flexible conventional generation units, and storage. Key points for policymakers to consider include evaluating flexibility requirements, accurately assessing system capabilities and constraints, prioritizing various solutions based on system constraints, and incentivizing appropriate solutions to enhance system flexibility. Modifications of existing mechanisms—such as energy-only markets, capacity payment mechanisms, and capacity markets—could be designed to encourage flexibility in a technology-neutral way, emphasizing instead specific performance requirement specifications. Regulatory approaches increasingly will take into account flexibility and grid capabilities in the process of evaluating market design and cost-recovery mechanisms.
Long-Term Security of Supply: Securing Generation A dequacy Generation adequacy measures the capability of the power system to supply aggregate demand in all the steady states in which the power system may exist considering standard conditions. The nature of standard conditions and adequacy criteria vary by jurisdiction, leading to a wide variety of solutions to measure and ensure generation adequacy. High variable RES-E penetration levels will likely affect the

IEA-RETD RES-E-NEXT 04 July 2013
ix
functioning of power markets and, by extension, the procurement of generation adequacy. For example, although the precise effects greatly depend on local factors, substantial amounts of zero marginal cost generation might challenge existing wholesale market and security of supply mechanisms. Additionally, substantial distributed RES-E generation (i.e., rooftop solar photovoltaic) could impact the revenue streams of conventional utilities, challenging balance sheets and investment. Policy and regulatory approaches to address concerns about capacity adequacy run risks of introducing cross-subsidies or distorting energy market paradigms, therefore interventions warrant careful consideration of follow-on impacts in other domains of market function.
With high levels of RES-E, the type of capacity in the system is increasingly important. This means that the forward capacity that is required also must possess the level of flexibility needed to operate the power system with the increased level of variability and uncertainty that RES-E brings to the system. Thus, the issues of long-term and short-term security of supply are two dimensions of the same problem.
Linking Policy to Stages of Power System Transition The aforementioned issues comprise the central focus of this report. They are provided as a way to effectively conceptualise the issues, but it is recognised that there is considerable overlap and interaction between them. The relative importance of each issue, and the scale and timing of policy action, is highly sensitive to local context. The generation mix, grid conditions, market structure, and operational practices all affect how higher penetration levels of RES-E interact with the power system. For these reasons, impacts and solutions differ across jurisdictions. Additionally, in each of the four domains described above, effecting change requires the cultivation of support from the public and from various power system stakeholders (e.g., utilities, system operators, regulators, generators, investors). Such institutional and relational issues become important with regard to the cost of RES-E support, siting of RES-E and grid-expansion projects, growth of demand-side flexibility programs, and potential changes in market design.
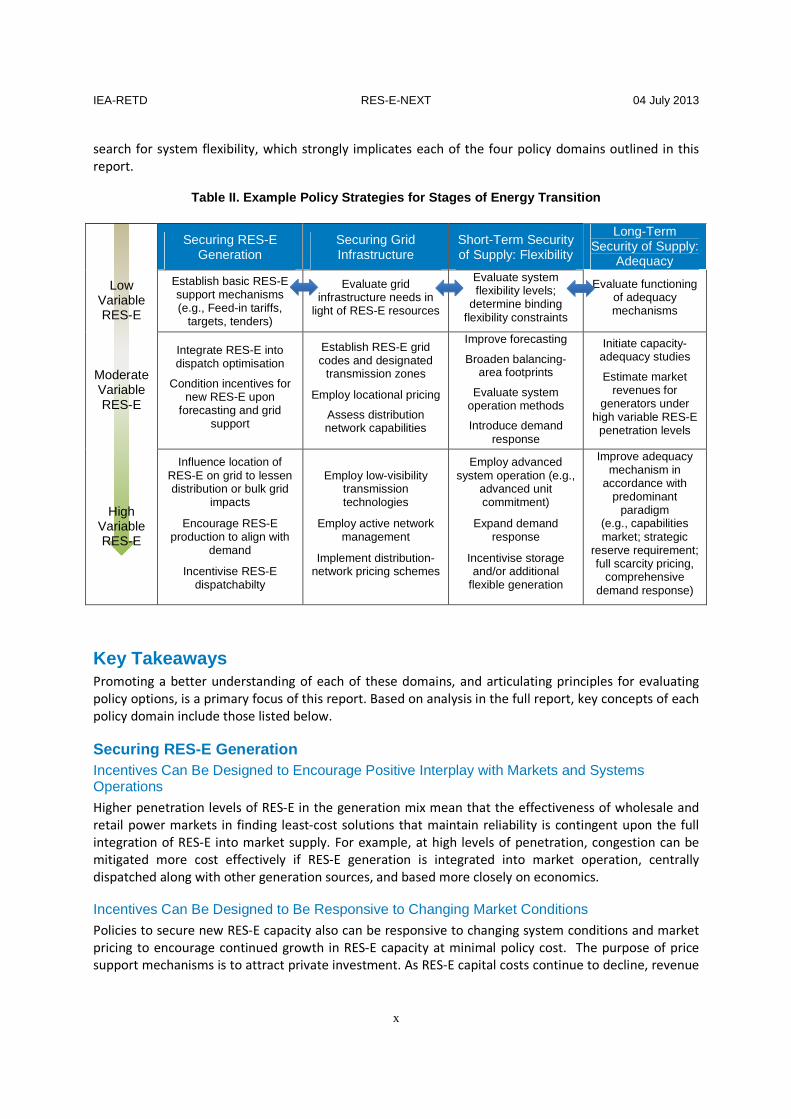
Table II illustrates example actions and strategies for securing RES-E generation, securing grid infrastructure, enhancing system flexibility, and securing adequacy of supply. These illustrative policy options are organised according to their relevance to the various stages of power system transition, from low to high variable RES-E penetration levels. The example actions are just some of the options that have been demonstrated around the world, and are discussed in greater detail in the body of this report.
As illustrated in Table II, conceptual boundaries among the four policy domains of this report begin to erode at moderate and high penetration levels of variable RES-E. As the energy transitions deepen and interactions become more obvious, new, integrated policy approaches will be required. The interdependency between RES-E policy and other parts of the power system is not new, but first-generation RES-E policy had the luxury of largely ignoring major system interaction, focusing instead on the optimal design and implementation of individual policy instruments. In contrast, next-generation RES-E policy development is a more dynamic process, oriented around anticipating and managing novel energy-system impacts that arise as policy interactions increase. One example can be found in the
Growing inter-dependency
is the hallmark of next-generation RES-E policy.
IEA-RETD RES-E-NEXT 04 July 2013
x
search for system flexibility, which strongly implicates each of the four policy domains outlined in this report.
Table II. Example Policy Strategies for Stages of E nergy Transition
Securing RES-E
Generation Securing Grid Infrastructure
Short-Term Security of Supply: Flexibility
Long-Term Security of Supply:
Adequacy
Low Variable RES-E
Establish basic RES-E support mechanisms (e.g., Feed-in tariffs,
targets, tenders)
Evaluate grid infrastructure needs in
light of RES-E resources
Evaluate system flexibility levels;
determine binding flexibility constraints
Evaluate functioning of adequacy mechanisms
Moderate Variable RES-E
Integrate RES-E into dispatch optimisation
Condition incentives for new RES-E upon
forecasting and grid support
Establish RES-E grid codes and designated
transmission zones
Employ locational pricing
Assess distribution network capabilities
Improve forecasting
Broaden balancing-area footprints
Evaluate system operation methods
Introduce demand response
Initiate capacity-adequacy studies
Estimate market revenues for
generators under high variable RES-E
penetration levels
High Variable RES-E
Influence location of RES-E on grid to lessen distribution or bulk grid
impacts
Encourage RES-E production to align with
demand
Incentivise RES-E dispatchabilty
Employ low-visibility transmission technologies
Employ active network management
Implement distribution-network pricing schemes
Employ advanced system operation (e.g.,
advanced unit commitment)
Expand demand response
Incentivise storage and/or additional
flexible generation
Improve adequacy mechanism in
accordance with predominant
paradigm (e.g., capabilities market; strategic
reserve requirement; full scarcity pricing,
comprehensive demand response)
Key Takeaways Promoting a better understanding of each of these domains, and articulating principles for evaluating policy options, is a primary focus of this report. Based on analysis in the full report, key concepts of each policy domain include those listed below.
Securing RES-E Generation Incentives Can Be Designed to Encourage Positive Interplay with Markets and Systems Operations
Higher penetration levels of RES-E in the generation mix mean that the effectiveness of wholesale and retail power markets in finding least-cost solutions that maintain reliability is contingent upon the full integration of RES-E into market supply. For example, at high levels of penetration, congestion can be mitigated more cost effectively if RES-E generation is integrated into market operation, centrally dispatched along with other generation sources, and based more closely on economics.
Incentives Can Be Designed to Be Responsive to Changing Market Conditions
Policies to secure new RES-E capacity also can be responsive to changing system conditions and market pricing to encourage continued growth in RES-E capacity at minimal policy cost. The purpose of price support mechanisms is to attract private investment. As RES-E capital costs continue to decline, revenue
IEA-RETD RES-E-NEXT 04 July 2013
xi
stream certainty will become more important to investment decisions. Rules governing curtailment, energy imbalances, gate closures, and scheduling can have substantial impacts on RES-E project economics and revenue streams, and will merit greater consideration when designing RES-E support policies.
Incentives Can Be Designed to Proactively Respond to Changing Grid Needs Because RES-E investments can occur rapidly and the generators can be operational for decades, policies to support new RES-E generation will need to be forward looking to anticipate future grid needs and encourage positive grid interactions. For example, RES-E technologies installed in the near term could be equipped to provide grid support services (i.e., frequency and inertial response, voltage control) in future years once RES-E technologies comprise a larger fraction of the overall generation mix. Policies to support new RES-E can make incentives contingent on proactively providing such services.
Securing Grid Infrastructure Centralised Coordination Has a Role in Transmission-Network Development
Experience in various jurisdictions suggests that complex transmission extension can be challenging and slow in the absence of some form of central coordination. Achieving this coordination appropriately in accordance with various market paradigms is a focal point of policy and regulation.
Various Policy and Technology Approaches Can Help Reduce Public Acceptance Risk
Various time-tested approaches can minimise public opposition to grid extension. For example, active stakeholder engagement allows public concerns to be identified and mitigation achieved. To the extent undergrounding or partial undergrounding of new grid lines can be accomplished in a cost-effective manner, this also can help reduce opposition to development.
Improved Congestion-Management Practices Are Important Complements to Grid Extension In organised wholesale power markets, market-based congestion management practices—such as locational pricing—not only help to manage congestion, but can incentivise investment at key points of the grid and fairly allocate costs, thus extracting greater value from grid infrastructure.
Deferral of Grid Investment Creates Value Options to defer grid investment create both immediate value—money not spent—as well as option value—allowing new grid, distributed generation, and storage technologies to emerge. A number of effective technology solutions exist to defer upgrades, such as dynamic line rating technology, special protection schemes, and active network management.
Enhancing Flexibility Flexibility Requirements and Solutions are Highly Dependent on System Characteristics Additional flexibility is needed with high penetrations of variable RES-E generation. There is no “generic” limit on variable RES-E due to flexibility constraints, and the share of variable RES-E that can be accommodated depends on the specific characteristics of each individual power system. Flexibility can be derived from various sources, and to the extent that reserve generation capacity is required, it can often be provided by existing generators that have reduced their output.
IEA-RETD RES-E-NEXT 04 July 2013
xii
Further Progress in Market Design Could Unlock Flexibility Modifying market products and practices can unlock existing sources of flexibility. For example, market-design elements such as fast market operation, widespread locational pricing, and demand-side bidding could provide economically efficient pathways to incentivise flexible capability.
Mechanisms Rewarding Flexible Capabilities Will Be a Key Part of Enhancing Flexibility The development of appropriate incentives to spur investment in flexibility will be crucial in market-oriented power systems. Next-generation incentives can be designed to encourage diverse system elements to provide flexibility, including demand-side, grid, storage, and supply-side resources.
Methods of Quantifying Flexibility Needs Require Further Development Broadly speaking, methods of quantifying flexibility needs still are in very early stages of development. Accurate assessments of flexibility needs support appropriate policy responses, and thus deserve further investigation.
Securing Generation Adequacy Administrative Intervention to Achieve Adequacy in Energy Markets Is Unlikely to Diminish in the Near Term A variety of energy market designs are in force around the world, and all entail some degree of administrative oversight. A long-standing debate has existed about the appropriate role of administrative intervention to ensure generation adequacy. Today and moving forward, the adequacy debate includes the additional dimension of variable RES-E. Most of the major options for ensuring generation adequacy compensate generators not only for delivered electricity but also for availability on the system. Next generation solutions might require a growing level of administrative intervention into energy markets. Reducing the distortive impacts of such interventions will be a central challenge to designing effective adequacy solutions.
Adequacy Solutions Will Have Complex and Significant Impacts on Various Power System Stakeholders Capacity adequacy solutions impact the risk landscape for both conventional and RES-E power plant investors, as well as demand-side resources. Further, cross-border trade impacts will be significant in the absence of harmonisation. Extensive stakeholder engagement can mitigate adverse impacts.
Principles for Integrated Power System Policy The present report reviews the many ways that high RES-E futures impact various parts of power system policy. This reflects the fact that RES-E policy considerations no longer are best viewed in isolation, but rather as a fundamental component of integrated power system policy. In support of this transition, five cross-cutting principles are identified to guide energy policy development through the transition to high RES-E futures. These principles can serve as an organizing framework to guide the transition to integrated next-generation power-system policies, not only in IEA-RETD member countries, but in all countries considering high RES-E futures.
RES-E policy considerations are a
fundamental component of next-generation power
system policy.
IEA-RETD RES-E-NEXT 04 July 2013
xiii
Harmonizing Policy, Market, and Technical Operation The three-way relationship among policy, technical operation, and market function will be increasingly complex and important. Anticipating and managing systemic interactions across these domains will form the foundation of integrated power system policy.
Rediscovering Coordination High RES-E futures likely will require increased coordination in various forms, warranting a renewed focus on the purview and posture of regulatory authority, as well as improved communications and working relationships between all power system stakeholders.
Bolstering Confidence in Regulatory and Market Para digms Some degree of market and regulatory change likely is required to accommodate large penetration levels of variable RES-E. We conclude that these changes will be evolutionary rather than revolutionary. Successful next-generation power system policy will allow this evolution without undermining confidence in the basic market and regulatory paradigms.
Sustaining Public Support Policy approaches to sustaining public support will evolve as levels of RES-E grow. Depending on local circumstances, policy design likely will focus increasingly on cost-containment and minimisation of RES-E infrastructure impacts.
Guiding Innovation Across power systems, technology and business model innovation will unlock cost-effective solutions to support the transition to high RES-E futures. Next-generation power-system policy must ensure that the right frameworks are in place to encourage and guide innovation.
The Path Forward It is important to recognise that policy interactions, and the specific avenues open to decision makers, are strongly constrained by local conditions—the regulatory, system, and geographic context of power systems. Effective responses can take the form of strategically tailored energy policy portfolios,
attuned to the dynamic local complexity of the transition period to high shares of variable RES-E. Despite the diversity of power systems, across all jurisdictions next-generation policy portfolios will require improved coordination and innovative analytical processes, such as those to more precisely model and estimate flexibility requirements. Given the diversity of power systems and constraining factors, elaborating comprehensive policy portfolios for specific contexts is beyond the scope of this report. It is hoped, however, that the framework and principles articulated in this paper can lay the groundwork for such future investigations.
RES-E policy options and interactions are strongly shaped by
local conditions.
IEA-RETD RES-E-NEXT 04 July 2013
xiv
Table of Contents 1 Introduction ................................................................................................................................ 1 2 Securing RES-E Generation ........................................................................................................... 3
2.1 RES-E Policies to Secure New Generation: New Challenges at Higher Penetration Levels............. 4 2.1.1 Integration into Markets ................................................................................................ 4 2.1.2 Grid Operations .............................................................................................................. 4
2.2 Policy Mechanisms to Maintain Growth at High RES-E Penetration Levels ................................... 5 2.2.1 Maintaining Investment Certainty for RES-E and Minimising the Cost of Incentives (“Cost
Aware” Policies) ............................................................................................................. 5 2.2.1.1 FiTs with Flexible Adjustment ................................................................................... 6 2.2.1.2 Tenders for Long-Term Contracts ............................................................................. 6 2.2.1.3 Reducing Financing Costs ......................................................................................... 7 2.2.1.4 Financing Mechanisms to Support RES-E .................................................................. 7 2.2.1.5 Leasing and New Business Models ........................................................................... 8
2.2.2 Encouraging Positive Interplay of RES-E with Markets (“Market Aware” Policies) ........... 8 2.2.2.1 Feed-in Premium Incentives Linked to Wholesale Power Prices ................................ 8 2.2.2.2 Capacity Payments ................................................................................................... 9 2.2.2.3 Policies that Address RES-E Energy Imbalances ......................................................... 9 2.2.2.4 Policies That Address Compensation for Curtailment ............................................. 10
2.2.3 Addressing the Impacts of Variable and Uncertain Generation on Grid Operations Through Policies to Secure New RES-E (“Grid Aware” Policies) ...................................... 11
2.2.3.1 Price Support Coupled with Requirements for Grid-Support Capabilities ................ 12 2.2.3.2 Price Support Linked to Congestion or Grid Benefits ............................................... 12 2.2.3.3 Price Support Linked to Encouraging Production to Align with Demand .................. 13 2.2.3.4 Price Support Coupled with Forecasting Data Provision Requirements ................... 13 2.2.3.5 Price Support that Requires Energy to Be Integrated into Dispatch Optimisation .... 13 2.2.3.6 Price Support Linked to Dispatchability .................................................................. 13
2.3 Policy Combinations to Achieve Greater Impact ........................................................................ 14 2.4 Conclusions and Recommendations for Securing RES-E Generation .......................................... 16
2.4.1 Encouraging Positive Interplay with Markets and System Operations ........................... 16 2.4.2 Responding to Changing Market Conditions ................................................................. 17 2.4.3 Responding Proactively to Changing Grid Needs ........................................................... 17 2.4.4 Addressing Other Integration Hurdles .......................................................................... 17
3 Securing Grid Infrastructure ....................................................................................................... 19 3.1 The Importance of Grid Infrastructure ...................................................................................... 19
3.1.1 Reducing Variability ...................................................................................................... 19 3.1.2 Enhancing Flexibility ..................................................................................................... 19 3.1.3 Facilitating Competition ............................................................................................... 19
3.2 Policies to Address the Practical Challenges of Grid Expansion .................................................. 20 3.2.1 Irish Gate System ......................................................................................................... 20 3.2.2 Competitive Renewable Energy Zones .......................................................................... 21 3.2.3 Contestable Infrastructure Markets .............................................................................. 22 3.2.4 Congestion Management in Interconnected Networks ................................................ 23
3.2.4.1 Net Transfer Capacities .......................................................................................... 23 3.2.4.2 Locational Pricing ................................................................................................... 24
3.2.5 Allocating Scarce Transmission Capacity ....................................................................... 25 3.2.5.1 Non-Firm Access .................................................................................................... 25

IEA-RETD RES-E-NEXT 04 July 2013
xv
3.2.5.2 Connect and Manage ............................................................................................. 26 3.2.5.3 Economic Connection Test ..................................................................................... 26
3.3 Technology and Smart Grid Solutions ........................................................................................ 27 3.3.1 Dynamic Line Rating ..................................................................................................... 27 3.3.2 Special Protection Schemes .......................................................................................... 28 3.3.3 Active Network Management ....................................................................................... 28
3.4 Changes to Grid Infrastructure to Improve Public Acceptance ................................................... 29 3.4.1 Underground AC Cable ................................................................................................. 29 3.4.2 High-Voltage Direct Current Transmission .................................................................... 30 3.4.3 HVDC Supergrid ............................................................................................................ 32
3.5 The Role of Grid Infrastructure in Ensuring Reliability................................................................ 33 3.5.1 Ensuring System Inertia and Dynamic Stability .............................................................. 33 3.5.2 Supporting Stability and Control Through Grid Codes and Standards ............................ 35
3.6 Conclusions and Recommendations for Ensuring Grid Capacity ................................................. 36 4 Enhancing System Flexibility....................................................................................................... 38
4.1 The Need for More System Flexibility ........................................................................................ 38 4.2 Sources of Flexibility ................................................................................................................. 39
4.2.1 Demand-Side Management .......................................................................................... 39 4.2.2 Additional Reserve Capacity ......................................................................................... 43
4.2.2.1 Level of Additional Reserve—General Description .................................................. 44 4.2.2.2 Level of Additional Reserve—Research Review....................................................... 44 4.2.2.3 Level of Additional Reserve—Cost .......................................................................... 45
4.2.3 More Flexible Conventional Plant ................................................................................. 45 4.2.4 Changes in System Operation Practices ........................................................................ 46
4.2.4.1 Faster Market Operation and Shorter Gate Closure Time ....................................... 47 4.2.4.2 Advanced Methods of Unit Commitment ............................................................... 47 4.2.4.3 Dynamic Reserve Requirements ............................................................................. 48 4.2.4.4 Stochastic Unit Commitment .................................................................................. 48
4.2.5 Interconnection (Grid) .................................................................................................. 48 4.2.6 Storage ......................................................................................................................... 48
4.3 Flexibility Assessment Methodologies ....................................................................................... 51 4.3.1 NERC method ............................................................................................................... 52 4.3.2 IEA GIVAR method ........................................................................................................ 53 4.3.3 IRRE method ................................................................................................................ 53
4.4 Current Practices to Reward and Incentivise Flexibility Around the World ................................. 54 4.4.1 Capacity Markets .......................................................................................................... 55 4.4.2 Other Market Instruments ............................................................................................ 55
4.5 Conclusions and Recommendations for Enhancing Flexibility .................................................... 57 5 Securing Generation Adequacy ................................................................................................... 58
5.1 Conventional Generation Revenues Under High RES-E Penetration Levels ................................ 58 5.1.1 Reduction of Conventional Generators Utilisation Factor ............................................. 59 5.1.2 Reduced Energy Prices ................................................................................................. 59 5.1.3 Increased Flexible System Capacity and Grid Support ................................................... 60 5.1.4 Increased Operation and Increased Emissions Costs ..................................................... 61
5.2 Capacity Adequacy, Conventional Generator Revenues, and Market Structure ......................... 61 5.3 Discussion and Conclusions ....................................................................................................... 64
6 Synthesis and Discussion ............................................................................................................ 66 6.1 Harmonising Policy, Market, and Technical Operation .............................................................. 67
IEA-RETD RES-E-NEXT 04 July 2013
xvi
6.1.1 Designing RES-E Remuneration Schemes to Minimise Operational Impact and Market Distortion ..................................................................................................................... 67
6.1.2 Designing RES-E Remuneration Schemes to Create Flexibility for Future Changes to Market and System-Operation Rules ............................................................................ 67
6.1.3 Designing Network Protocols to Maximise Utilisation of Existing Resources ................. 67 6.1.4 Rigorous Performance Standards for Demand Response as a RES-E Balancing Resource67
6.2 Rediscovering Coordination ...................................................................................................... 68 6.3 Bolstering Confidence in the Regulatory Paradigm .................................................................... 68
6.3.1 Securing RES-E Generation ........................................................................................... 70 6.3.2 Flexibility and Adequacy Policies .................................................................................. 70 6.3.3 Carbon Markets and the RES-E Investment Case ........................................................... 71
6.4 Sustaining Public Support .......................................................................................................... 72 6.4.1 “Who Pays”—Achieving Efficient Cost Allocation .......................................................... 72 6.4.2 Anticipating Investment Winners and Losers ................................................................ 73 6.4.3 Balancing Revenue Certainty with Cost Containment ................................................... 73
6.5 Guiding Innovation ................................................................................................................... 73 6.5.1 Improving Transparency of Policy Complexity ............................................................... 73 6.5.2 Promoting Flexibility in a Technology-Neutral Manner ................................................. 74 6.5.3 Encouraging Business Model Experimentation ............................................................. 74
6.6 Conclusion: Common Forces Driving Next Generation Policy ..................................................... 74 7 References ................................................................................................................................. 76

IEA-RETD RES-E-NEXT 04 July 2013
xvii
List of Figures Figure 1. Variable RES-E generation as share of total generation IEA-RETD member countries, 2000–2011. Source: IEA 2012 ............................................................................................................................ 1 Figure 2. The impact of smoothing for wind power over varying number of sites; transmission is necessary to achieve this smoothing (based on data from EirGrid) ........................................................ 20 Figure 3. Illustration of price separation in an LMP market .................................................................... 24 Figure 4. Simplified schematic diagram of an HVDC link ......................................................................... 31 Figure 5. Relative costs of AC and DC transmission as a function of total line length for overhead lines; relative costs are shown for Europe, China, and India. Data source: Van Heretem and Ghandhar 2010 . 31 Figure 6. HVDC link from Scotland to Wales and England; adapted from http://www.westernhvdclink.co.uk ....................................................................................................... 32 Figure 7. Simplified results from EirGrid's All-Island Facilitation of Renewables Studies; points on the graph represent system operating points defined in terms of load plus exports and wind plus imports. Source: EirGrid 2010 .............................................................................................................................. 35 Figure 8. Flexibility needs and services. Adapted from Alvarez 2011 ...................................................... 38 Figure 9. Net load (bottom blue line) under “straightforward” and “challenging” RES-E generation profiles. Source: GE Energy 2010 ........................................................................................................... 39 Figure 10. Storage technologies by capacity and discharge time. Source: adapted from Arup (2012), IFP
(2013), Watson et al. (2012) .................................................................................................................. 50 Figure 11. Decision framework for capacity adequacy instruments (adapted from Hogan and Gottstein 2011) ..................................................................................................................................................... 56 Figure 12. Estimated annual load factors of combined-cycle gas turbine and coal/lignite plant in different countries and regions of Europe (adapted from Poyry 2011) ................................................................. 59 Figure 13. Transition principles for integrated power-system policy ...................................................... 66 Figure 14. General market paradigms in operation around the world .................................................... 70 Figure 15. Selected flexibility and adequacy policies within market paradigms ...................................... 71 Figure 16. Four key landscape dimensions acting on RES-E policy .......................................................... 75
List of Tables Table I. RES-E Policy Domains and Drivers .............................................................................................. vii Table II. Example Policy Strategies for Stages of Energy Transition ........................................................... x Table 1. Comparison Between Feed-In Tariffs and Tenders for Long-Term Contracts ............................... 6 Table 2. Policies to Maintain Investment Certainty for RES-E and Minimise Policy Costs .......................... 8 Table 3. Policies to Encourage Positive Interplay of RES-E with Markets................................................. 11 Table 4. Sample Integration Challenges and Policies that Secure RES-E and Address These Challenges .. 13 Table 5. Potential Effectiveness of Policy Options to Secure New RES-E and Address Cost, Market Interactions, and Grid Impacts ............................................................................................................... 15 Table 6. Advantages and Challenges of Irish Gate System ...................................................................... 21 Table 7. Advantages and Challenges of Competitive Renewable Energy Zones....................................... 22 Table 8. Advantages and Challenges of Contestable Infrastructure Markets .......................................... 22 Table 9. Advantages and Challenges of Net Transfer Capacities ............................................................. 24 Table 10. Advantages and Challenges of Locational Marginal Pricing ..................................................... 25 Table 11. Advantages and Challenges of Non-Firm Access ..................................................................... 26 Table 12. Advantages and Challenges of the Connect and Manage Approach ........................................ 26 Table 13. Advantages and Challenges of the Economic Connection Test ................................................ 27 Table 14. Advantages and Challenges of Dynamic Line Rating ................................................................ 28
IEA-RETD RES-E-NEXT 04 July 2013
xviii
Table 15. Advantages and Challenges of Special Protection Schemes ..................................................... 28 Table 16. Advantages and Challenges of Active Network Management.................................................. 29 Table 17. Underground Cable Lengths for IEA-RETD Member Countries* Source: Cigre 2007 ................. 29 Table 18. Advantages and Challenges of Underground AC Cables .......................................................... 30 Table 19. Advantages and Challenges of HVDC Connections .................................................................. 32 Table 20. Advantages and Challenges of the HVDC Supergrid ................................................................ 33 Table 23. Average Demand Response Costs Compared to Average Grid-Scale Battery Costs (Watson et al. 2012) ..................................................................................................................................................... 40 Table 24. Sources of Commercial and Industrial Demand Response and Typical Response Times (Watson et al. 2012) ............................................................................................................................................ 41 Table 25. Smart-Meter Deployment Rates in IEA-RETD Member Countries Plus the United States and Spain (Sources: IEA DSM 2012; Greentech Media 2012; IEE 2012) ......................................................... 42 Table 26. Advantages and Challenges of Demand-Side Management As a Flexibility Resource ............... 43 Table 27. Advantages and Challenges of Carrying Additional Reserve Capacity to Provide Flexibility ...... 45 Table 28. Conventional Generation Characteristics Source: EurElectric 2011 ......................................... 45 Table 29. Advantages and Challenges of More Flexible Conventional Generation .................................. 46 Table 21. Storage Technologies, Costs, and Performance Characteristics Sources: Stadler 2012; ARUP 2012; Poonpun and Jewell 2008 ............................................................................................................ 49 Table 22. Advantages and Challenges of Storage as a Flexibility Source ................................................. 51 Table 30. Illustration of NERC Flexibility Intensity Metric (Adapted from NERC 2010) ............................ 52 Table 31. Advantages and Challenges of Flexibility Metrics .................................................................... 54 Table 32. Examples of Market Design for Resource Adequacy (adapted from Brattle Group 2010) ........ 55 Table 33. Advantages and Challenges of Capacity Mechanisms .............................................................. 63

IEA-RETD RES-E-NEXT 04 July 2013
1
1 Introduction Over the past 20 years, the generation of electricity from renewable energy sources (RES-E) has increased dramatically around the world, and is beginning to impact electricity systems significantly. The energy transition is becoming tangible. Accordingly, many countries are preparing for the next phase of deployment and integration of RES-E. New policy questions are arising, particularly with regard to the design of incentive mechanisms, long-range network plans, the operation of energy markets, and the nature of regulation. Well-crafted policy strategies can anticipate the interplay among these domains, helping to sustain and accelerate the energy transition. This report investigates the principles and technical considerations that will provide the foundation for next-generation RES-E policies. The primary sources of RES-E that are experiencing large-scale deployment worldwide are variable sources of renewable energy, mainly wind and solar power. Variable sources of RES-E pose unique challenges, and are the primary focus of this report.
Variable RES-E capacity and generation has grown steadily in IEA-RETD jurisdictions (Canada, Denmark, France, Germany, Ireland, Japan, Netherlands, Norway, and the United Kingdom). Figure 1 illustrates the growth of variable RES-E generation as a share of total generation in IEA-RETD member countries from 2000 to 2011.Three IEA-RETD member countries generate more than 10% of their total electricity generation from variable RES-E sources (Denmark, Germany, Ireland). Total penetration in other IEA-RETD countries is more modest, but growth rates are holding steady or accelerating. Accumulated experience will provide important insights across the IEA-RETD membership. Perhaps more urgently, as shares of variable RES-E continue to grow in IEA-RETD member countries, the path ahead will begin to challenge some of the long-held conventional wisdom regarding the planning and operation of power systems. The time is right for a rigorous examination of this conventional wisdom, with an eye toward crafting next-generation policy frameworks that reflect the current state of knowledge.
Figure 1. Variable RES-E generation as share of tot al generation
IEA-RETD member countries, 2000–2011. Source: IEA 2012
Estimates of required investment to realise low-carbon electricity systems range widely, but commonly indicate several trillion dollars of cumulative global expenditures from 2013 to 2025. These investments are spread across grid infrastructure, conventional generation, and RES-E generation, with most scenarios suggesting that grid infrastructure and RES-E generation capacity comprise the majority of this expenditure (IEA WEO 2012). Given the critical nature of private-sector investment in achieving this

IEA-RETD RES-E-NEXT 04 July 2013
2
large investment, coordinated, effective, and sustained policies that guide and facilitate investment in infrastructure and new capacity are critical for the next phase of RES-E development.
In IEA-RETD countries and beyond, a variety of regulatory paradigms are in place, which strongly shape how planning and investment are coordinated for generation, transmission, and distribution. In highly deregulated contexts, power system investments are dispersed across various actors, with little or no central planning. In these settings, the important policy questions include: How should investments in grid extension and RES-E generation be coordinated, or facilitated if coordination is not possible? Who should coordinate? How should systems meet capacity adequacy requirements while increasing system flexibility? How should investments be allocated across generation, grids, and flexibility resources?
In vertically integrated contexts, decision making and authority are less distributed. In these contexts, the important policy questions include: How can regulators encourage RES-E investment and changes to system operation? What regulatory models can incentivise demand-side participation? How can system flexibility be enhanced through vertically integrated utilities?
Across the spectrum of regulatory paradigms, fundamental changes are underway. Some vertically integrated contexts are considering concrete moves toward market-based mechanisms to support greater RES-E growth (e.g., Japan, China, and Mexico). Some highly deregulated jurisdictions are considering modifications to liberalised market structures to better coordinate planning for low-carbon systems (i.e., the United Kingdom, Alberta in Canada, Texas in the United States). Thus, it is not accurate to say that the pathway to achieving low-carbon power systems is determined by regulatory frameworks. Rather, they are dynamically evolving together.
This report investigates both the technical and policy issues underlying these questions, with a focus on four interrelated challenges: securing RES-E generation; securing grid infrastructure; enhancing flexibility; and securing capacity adequacy (Sections 2, 3, 4, and 5, respectively). Each section reviews a selection of innovative policies, strategies, and governance approaches that are either already in place or currently emerging around the world.
Section 6 synthesises the report, discusses interactions across the power sector, suggests principles to guide energy transition policy development across various political and institutional contexts, and briefly concludes with suggestions for further research and international collaboration.
IEA-RETD RES-E-NEXT 04 July 2013
3
2 Securing RES-E Generation Globally, at least 118 countries have established targets for RES-E generation, and select countries have established aggressive long-term goals for RES-E to supply a significant share of electricity demand. Denmark, for example, aims for 100% RES-E generation by 2050, and Germany aims for 80% (REN21 2012). Despite the fact that RES-E now accounted for just over half of new global electric capacity in 2012 (REN21 2013), a policy imperative remains to further increase the share of electricity supplied by RES-E.
Thus far, the growth in RES-E stems largely from favourable policies, such as feed-in tariffs (FiTs), renewable portfolio standards, tenders, and tax incentives. These were designed to help overcome the initial barrier to RES-E—its cost differential with conventional generation. Although the costs of conventional generation usually do not reflect externalities, the costs of RES-E are increasingly competitive.
Meanwhile, increasing penetration levels of RES-E have generated new concerns—primarily how to maintain rapid RES-E supply growth with decreasing support costs, and challenges with respect to technical and market operations of systems with high penetration levels of RES-E. These changes in turn could impact future power prices and thus revenue opportunities for electricity-generating plants.
Given the capital-intensive nature of renewable energy projects, financing costs are critical, and uncertainty about future revenues from power sales can increase these costs. Access to sufficient financial capital to support investment has been a challenge in recent years in some jurisdictions, particularly with the global financial crisis. Many European utilities also are facing financial challenges that are reflected in their share prices, due to factors including increased debt, reduced demand due to the recession, and low wholesale power prices from oversupply of generation (Buchanan 2013). Therefore, with increasing penetration of renewable energy sources, the emphasis of mechanisms to secure RES-E generation likely will shift from supporting initial uptake to ensuring robust market opportunities for RES-E and effectively integrating to the grid each additional gigawatt-hour (GWh) of RES-E supply.
This section explores the critical issues in designing the next generation of cost-effective and transformative policies to secure new RES-E generation, with a particular focus on the IEA-RETD countries. As organised in this section, the critical issues of focus are:
• What are some of the financial and technical concerns that arise with securing new RES-E at greater penetration levels?
• How can policy help maintain growth of RES-E at greater penetration levels and minimise costs to consumers and public budgets in a manner that also facilitates positive market and grid integration?
• How can policies be combined to achieve greater impact?
• What considerations can help policymakers guide the design and implementation of policies to secure RES-E at high penetration levels?

IEA-RETD RES-E-NEXT 04 July 2013
4
2.1 RES-E Policies to Secure New Generation: New Ch allenges at Higher Penetration Levels
Continued investments in new RES-E will necessarily occur within a changing context of power markets and grid operations, which—as described in Section 3 through Section 5—are evolving in response to higher penetration levels of RES-E. Policies to support new RES-E generation could improve the investment climate for RES-E by anticipating these changing contexts and, where possible, encourage RES-E to contribute positively to market and grid operations. This section reviews two specific types of challenges that could emerge with high RES-E penetration levels and which RES-E support policies for new generation could address, namely market integration and grid operations.
2.1.1 Integration into Markets Continued growth of RES-E deployment—especially at utility scales—depends largely on a project developer’s ability to secure bankable revenue streams, which is a primary objective of existing remuneration mechanisms such as RES-E-specific tenders or FiTs. Improving access to financing and reducing its costs also are critical to near-term continued growth in deployment (Weiss and Marin 2012). But, as capital costs for RES-E decline and price support policies begin to phase out, RES-E developers will have to increasingly rely on wholesale markets and power purchase agreements (PPAs) to generate revenue streams. Under high penetration levels of RES-E, however, even if RES-E is competitively priced or receives fixed remuneration per megawatt-hour delivered, design features of the remuneration scheme could create revenue uncertainty due to the following factors.2
• RES-E power plant output could fall short of expectations due to increasing levels of curtailment if the power system is insufficiently flexible or if curtailment rules are not optimised for RES-E or addressed in the remuneration mechanism.
• RES-E power plants might be penalised for energy imbalances and could be required to provide additional grid-support services.
To the extent that the integration of greater amounts of renewables creates revenue uncertainty, it can be expected that project developers and investors will slow their investment in RES-E for a given remuneration level.
Also, for jurisdictions with centralised power markets, the efficiency of the system operation improves with integration of renewables in day-ahead and real-time market clearing processes. The ability for wholesale power markets to remain viable at high RES-E penetration levels depends, in part, on the integration of RES-E into market operations.3
2.1.2 Grid Operations High penetration levels of RES-E can affect grid and system operations. Possible impacts include:
• Added supply-side variability and uncertainty from non-dispatchable RES-E. These can increase the need for system flexibility to keep load and generation in balance, and increase the need for some ancillary services. Further, if RES-E generation occurs during low-load periods, it can pose
2 Revenue uncertainty also can stem from high penetration levels of zero-marginal cost generation on the system, lowering wholesale power prices and likely degrading expected annual revenue of generators. This topic is discussed further in Section 5. 3 The broader consideration of centralised power markets at high RES-E penetration levels is discussed in detail in Section 5 and Section 6.
IEA-RETD RES-E-NEXT 04 July 2013
5
operational challenges. Variability and uncertainty can be reduced in some cases through the use of advanced forecasting or if RES-E generation is located in geographically diverse areas of the grid to minimise variability.
• The need for RES-E to provide grid ancillary services, such as voltage support, frequency response, balancing services, and inertial response. Today, these typically are provided by conventional generation. Greater penetration levels of RES-E in the generation mix will require RES-E to provide these grid services as well.
• Increased congestion on the distribution system from distributed generation, such as PV, if too many systems are installed on a particular distribution circuit.
The next section reviews policy options to secure RES-E while meeting these challenges.
2.2 Policy Mechanisms to Maintain Growth at High RE S-E Penetration Levels
Some countries, such as Germany and Spain, already have achieved significant penetration levels of RES-E and have modified policies to secure RES-E in response to rising costs and potential technical challenges to grid integration. This section discusses these policy evolutions, with a focus on existing and emerging policy options that:
• maintain investment certainty for RES-E and minimise the cost of incentives;
• encourage positive interplay with markets; and
• address the impacts of variable and uncertain generation on grid operations and planning.
2.2.1 Maintaining Investment Certainty for RES-E an d Minimising the Cost of Incentives (“Cost Aware” Policies)
Maintaining growth in RES-E generation requires that RES-E projects secure low-cost financing by demonstrating adequate certainty of future revenues. This can be achieved through a variety of approaches, including FiTs, RES-E tenders, quotas, fiscal incentives, and provision of public finance or guarantees. Often, jurisdictions have a variety of policies in place to help advance the deployment of renewable technologies (Kitzing et al. 2012). Of these options, the trend has been toward adoption of FiTs in the European Union, Japan, and Ontario, Canada (Bürer and Wüstenhagen 2009; Kitzing et al. 2012). Japan introduced a FiT in 2009, following other policy attempts to support RES-E (Suwa and Jupesta 2012). Ontario, Canada, in 2009 shifted from tendering schemes to a FiT.
Price support incentives have been highly effective at enabling deployment and have become more prevalent in recent years (Kitzing et al. 2012). A variety of measures can be used with these policies to contain and reduce costs over time, and often multiple methods are used within a single policy mechanism. Strategies for containing costs and reducing price support payments could depend in part on the level of maturity of the RES-E industry in a particular jurisdiction, the technology type, the penetration level, the power market structure, rules affecting RES-E generation, policies or factors that affect the competitiveness of RES-E, and the quality of the RES-E resources (e.g., amount of wind, solar radiation). Primary implementation challenges are the inherent uncertainty in the rate of technology cost reductions and shifting market conditions. These make it challenging to set appropriate degression levels (i.e., reducing the payment over time), and other targets designed to limit costs. The following cost aware policies are illustrative of policies that have been adopted in regions with strong growth of
IEA-RETD RES-E-NEXT 04 July 2013
6
RES-E, and which can be modified to address the challenges of grid operation as described in Section 2.2.3.
2.2.1.1 FiTs with Flexible Adjustment For policies that remunerate for generated electricity, such as the FiT, the main challenge thus far has been the appropriate formulation and adjustment of the tariff level in response to dynamic global markets and rapid changes in costs, particularly for solar PV. Compounding this challenge, in many jurisdictions, the process for tariff formulation is politicised.
Innovative solutions include market-responsive mechanisms for tariff adjustments. FiTs can be designed to reduce payment levels over time on fixed trajectories or in response to deployment volumes so as to meet a specific deployment target. A clear and stable trajectory of tariff levels can allow the RES-E industry to more effectively adjust to declining incentives. Alternatively, by establishing a clear process or mechanism to adjust the tariff level in response to deployment volumes, the system can respond to global market dynamics (Couture et al. 2010). To contain costs of its FiT, Germany instituted degression schedules to lower the per-kilowatt-hour incentive level based on deployment volumes (Grau 2012).
A risk to revenue certainty with this approach is that projects could move to final stages of development and—due to greater-than-anticipated deployment volumes or project delays, for example—not qualify for the expected tariff. Also, a fixed degression does not necessarily align payments with current market conditions and could lead to periods of overpayment if RES-E prices decline rapidly (as was seen with solar PV), or could lead to periods of no investment if incentives drop too rapidly.
2.2.1.2 Tenders for Long-Term Contracts Competitive tenders that secure long-term, bilateral RES-E contracts can contain costs by procuring only what is needed, creating competition, minimizing remuneration levels, and enabling administrators to keep up with market pricing in a rapidly changing cost environment (Bird et al. 2012). In South Africa, a recent tender scheme successfully encouraged 1,400 MW of RES-E capacity, at a cost per MW that is less than that offered by an earlier unsuccessful FiT (Fritz 2012). An example approach to minimizing policy costs is a reverse-auction mechanism, in which prospective developers can bid the required remuneration level needed to support the project for a specified duration. One disadvantage of competitive auction mechanisms is the greater uncertainty surrounding whether the project will qualify for the incentive and the greater transaction costs associated with preparing and competing bids. Additionally, the use of tender auctions must address the concern that developers might provide unrealistically low bids for projects that do not come to fruition, but which push out viable projects.
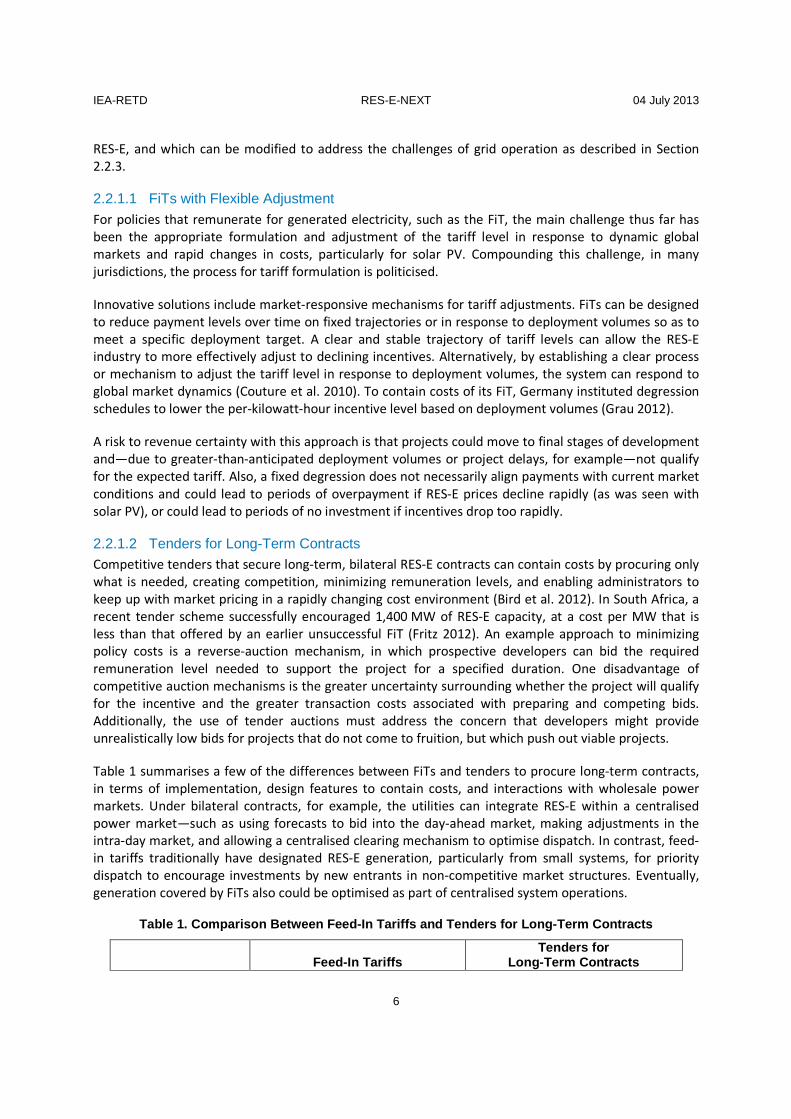
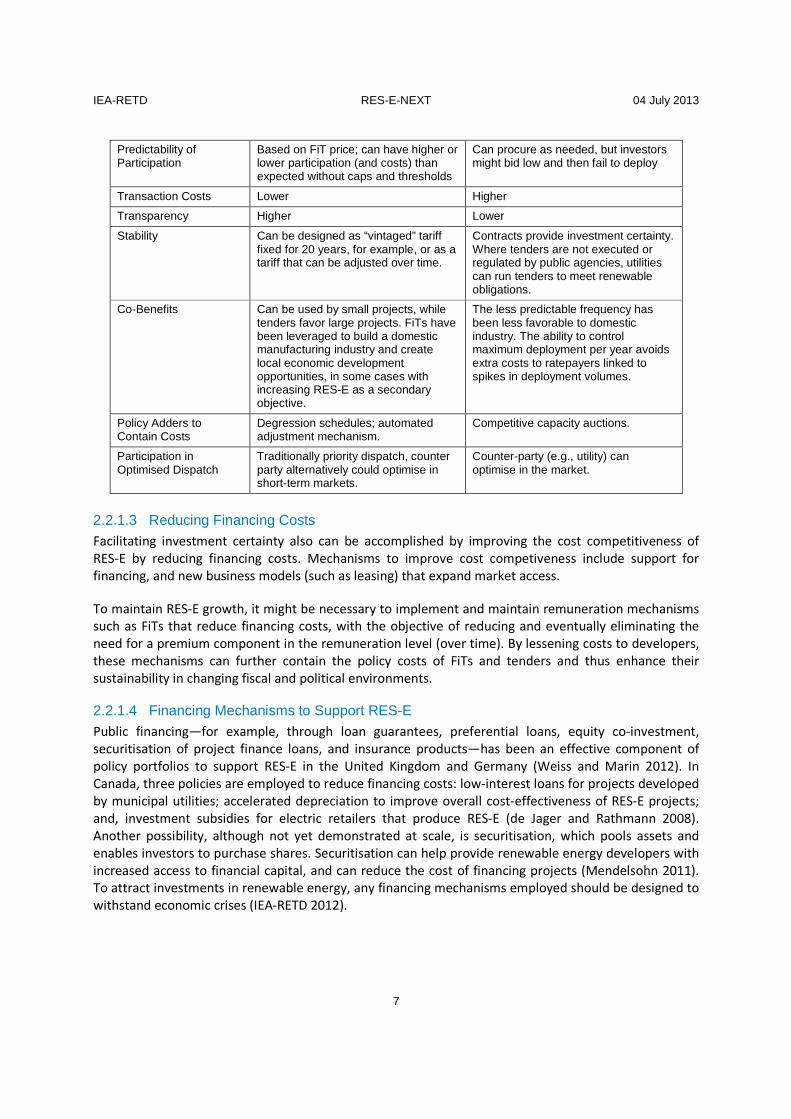
Table 1 summarises a few of the differences between FiTs and tenders to procure long-term contracts, in terms of implementation, design features to contain costs, and interactions with wholesale power markets. Under bilateral contracts, for example, the utilities can integrate RES-E within a centralised power market—such as using forecasts to bid into the day-ahead market, making adjustments in the intra-day market, and allowing a centralised clearing mechanism to optimise dispatch. In contrast, feed-in tariffs traditionally have designated RES-E generation, particularly from small systems, for priority dispatch to encourage investments by new entrants in non-competitive market structures. Eventually, generation covered by FiTs also could be optimised as part of centralised system operations.
Table 1. Comparison Between Feed-In Tariffs and Ten ders for Long-Term Contracts
Feed-In Tariffs
Tenders for Long-Term Contracts
IEA-RETD RES-E-NEXT 04 July 2013
7
2.2.1.3 Reducing Financing Costs Facilitating investment certainty also can be accomplished by improving the cost competitiveness of RES-E by reducing financing costs. Mechanisms to improve cost competiveness include support for financing, and new business models (such as leasing) that expand market access.
To maintain RES-E growth, it might be necessary to implement and maintain remuneration mechanisms such as FiTs that reduce financing costs, with the objective of reducing and eventually eliminating the need for a premium component in the remuneration level (over time). By lessening costs to developers, these mechanisms can further contain the policy costs of FiTs and tenders and thus enhance their sustainability in changing fiscal and political environments.
2.2.1.4 Financing Mechanisms to Support RES-E Public financing—for example, through loan guarantees, preferential loans, equity co-investment, securitisation of project finance loans, and insurance products—has been an effective component of policy portfolios to support RES-E in the United Kingdom and Germany (Weiss and Marin 2012). In Canada, three policies are employed to reduce financing costs: low-interest loans for projects developed by municipal utilities; accelerated depreciation to improve overall cost-effectiveness of RES-E projects; and, investment subsidies for electric retailers that produce RES-E (de Jager and Rathmann 2008). Another possibility, although not yet demonstrated at scale, is securitisation, which pools assets and enables investors to purchase shares. Securitisation can help provide renewable energy developers with increased access to financial capital, and can reduce the cost of financing projects (Mendelsohn 2011). To attract investments in renewable energy, any financing mechanisms employed should be designed to withstand economic crises (IEA-RETD 2012).
Predictability of Participation
Based on FiT price; can have higher or lower participation (and costs) than expected without caps and thresholds
Can procure as needed, but investors might bid low and then fail to deploy
Transaction Costs Lower Higher
Transparency Higher Lower
Stability Can be designed as “vintaged” tariff fixed for 20 years, for example, or as a tariff that can be adjusted over time.
Contracts provide investment certainty. Where tenders are not executed or regulated by public agencies, utilities can run tenders to meet renewable obligations.
Co-Benefits Can be used by small projects, while tenders favor large projects. FiTs have been leveraged to build a domestic manufacturing industry and create local economic development opportunities, in some cases with increasing RES-E as a secondary objective.
The less predictable frequency has been less favorable to domestic industry. The ability to control maximum deployment per year avoids extra costs to ratepayers linked to spikes in deployment volumes.
Policy Adders to Contain Costs
Degression schedules; automated adjustment mechanism.
Competitive capacity auctions.
Participation in Optimised Dispatch
Traditionally priority dispatch, counter party alternatively could optimise in short-term markets.
Counter-party (e.g., utility) can optimise in the market.
IEA-RETD RES-E-NEXT 04 July 2013
8
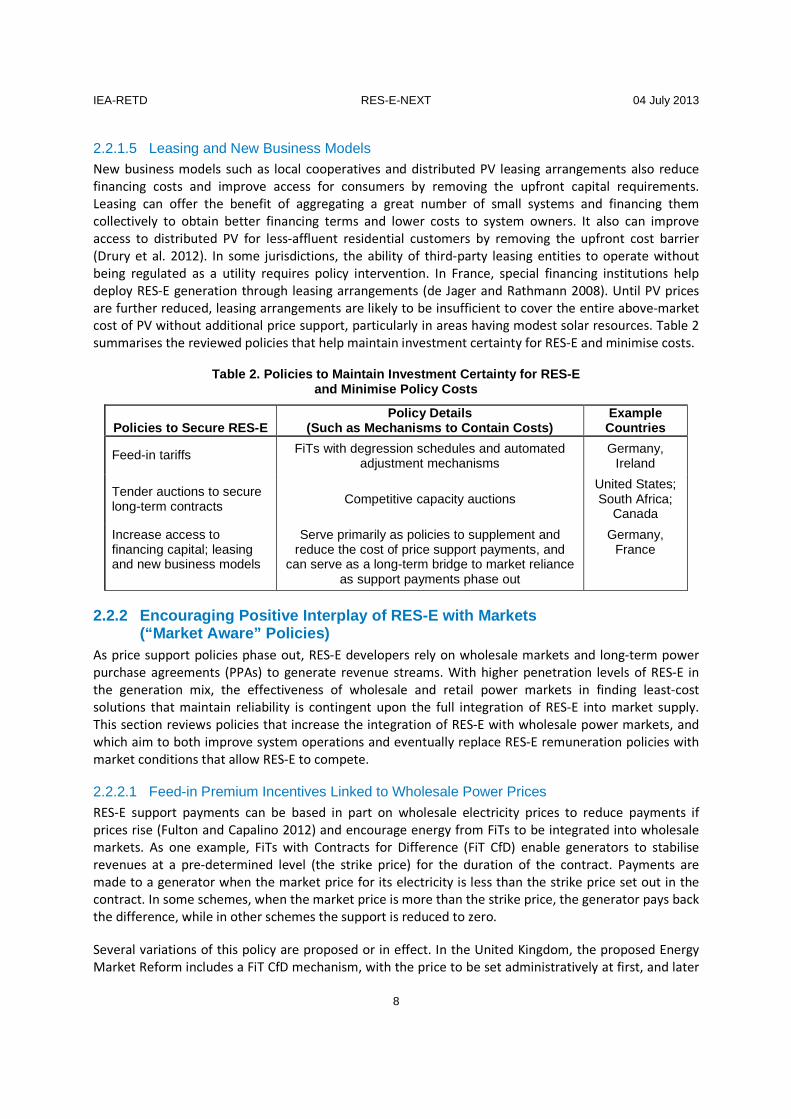
2.2.1.5 Leasing and New Business Models New business models such as local cooperatives and distributed PV leasing arrangements also reduce financing costs and improve access for consumers by removing the upfront capital requirements. Leasing can offer the benefit of aggregating a great number of small systems and financing them collectively to obtain better financing terms and lower costs to system owners. It also can improve access to distributed PV for less-affluent residential customers by removing the upfront cost barrier (Drury et al. 2012). In some jurisdictions, the ability of third-party leasing entities to operate without being regulated as a utility requires policy intervention. In France, special financing institutions help deploy RES-E generation through leasing arrangements (de Jager and Rathmann 2008). Until PV prices are further reduced, leasing arrangements are likely to be insufficient to cover the entire above-market cost of PV without additional price support, particularly in areas having modest solar resources. Table 2 summarises the reviewed policies that help maintain investment certainty for RES-E and minimise costs.
Table 2. Policies to Maintain Investment Certainty for RES-E and Minimise Policy Costs
2.2.2 Encouraging Positive Interplay of RES-E with Markets (“Market Aware” Policies)
As price support policies phase out, RES-E developers rely on wholesale markets and long-term power purchase agreements (PPAs) to generate revenue streams. With higher penetration levels of RES-E in the generation mix, the effectiveness of wholesale and retail power markets in finding least-cost solutions that maintain reliability is contingent upon the full integration of RES-E into market supply. This section reviews policies that increase the integration of RES-E with wholesale power markets, and which aim to both improve system operations and eventually replace RES-E remuneration policies with market conditions that allow RES-E to compete.
2.2.2.1 Feed-in Premium Incentives Linked to Wholesale Power Prices RES-E support payments can be based in part on wholesale electricity prices to reduce payments if prices rise (Fulton and Capalino 2012) and encourage energy from FiTs to be integrated into wholesale markets. As one example, FiTs with Contracts for Difference (FiT CfD) enable generators to stabilise revenues at a pre-determined level (the strike price) for the duration of the contract. Payments are made to a generator when the market price for its electricity is less than the strike price set out in the contract. In some schemes, when the market price is more than the strike price, the generator pays back the difference, while in other schemes the support is reduced to zero.
Several variations of this policy are proposed or in effect. In the United Kingdom, the proposed Energy Market Reform includes a FiT CfD mechanism, with the price to be set administratively at first, and later
Policies to Secure RES-E Policy Details
(Such as Mechanisms to Contain Costs) Example
Countries
Feed-in tariffs FiTs with degression schedules and automated adjustment mechanisms
Germany, Ireland
Tender auctions to secure long-term contracts Competitive capacity auctions
United States; South Africa;
Canada
Increase access to financing capital; leasing and new business models
Serve primarily as policies to supplement and reduce the cost of price support payments, and
can serve as a long-term bridge to market reliance as support payments phase out
Germany, France
IEA-RETD RES-E-NEXT 04 July 2013
9
through a competitive process, such as by tender (Weiss and Marin 2012). The Spanish support scheme has offered a choice between a fixed FiT and a market-premium option with a cap and floor price. The FiT also includes a demand-oriented option with time-differentiated tariffs for a few of the dispatchable RES-E technologies. In Germany, RES-E generators have access to a 20-year guaranteed payment. Generators also can opt to sell directly into the wholesale power market and receive a market premium matching the gap between the FiT level and the wholesale power price (Fulton and Capalino 2012). Thus, RES-E projects are expected to be exposed to short-term power markets, and the simple and transparent FiT serves as fallback option that continues to help secure access to low-cost financing.
2.2.2.2 Capacity Payments
Forward capacity markets (and other approaches to ensuring resource adequacy) offer payments that are designed to incentivise sufficient installed capacity.4 Although, in the past, these payments were reserved for dispatchable generation, with increasing RES-E penetration many capacity mechanisms now provide incentives to encourage new non-dispatchable RES-E capacity. Non-dispatchable RES-E—such as wind and solar—can contribute to capacity, but at values far less than their installed capacity. For example, wind could have a 10% to 15% capacity value and solar could have 25% to 30% (NREL 2010). Capacity value can vary considerably across jurisdictions, however, based on resource quality, the demand profile, and calculation method (Keane et al. 2011). Also, the values decline with increasing market shares of the respective technologies. In comparison, the capacity values for natural gas power plants are in the order of 95% with firm access to the gas network. Although capacity values vary from year to year for wind and solar, this also is true for thermal plants, which have varying forced outage rates that influence their capacity values. Further analysis is required to understand the ability of RES-E projects to finance their investment if the capacity factor attributed to the technology band is adjusted with increasing RE penetration within the refinancing period.
2.2.2.3 Policies that Address RES-E Energy Imbalances
The need to pay imbalance penalties when scheduled generation from RES-E deviates from actual generation delivered in wholesale power markets can significantly affect RES-E project economics. Countries address energy imbalance penalties in different ways. In Spain, for example, RES-E producers that opt for support through the market premium are responsible for balancing, but only deviations that exacerbate the total system imbalances are charged to generators. If RES-E producers opt for the fixed FiT, costs of deviations from forecasted levels that exceed a tolerance band incur a charge at the level of 10% of the average electricity tariff (Ragwitz and Huber 2005). Thus, incentives for the provision of accurate wind forecasts are provided without exposing wind projects to excessive risks of high imbalance costs. In other settings, transmission system operators (TSOs) socialise all imbalance costs from RES-E generators, although this is likely to be less feasible at high penetration levels.
Aside from the rules governing imbalance penalty payments, other factors such as grid operations and market design—described in sections 3 and 4, respectively—can influence the magnitude of energy imbalance payments. From the perspective of RES-E projects, for example, shorter gate-closure times reduce the likelihood of energy imbalance penalties if sufficient flexible-generation resources are available in short-term markets, because RES-E generators can provide more accurate bids closer to real time.5 Similarly, jurisdictions in which the TSO conducts high-resolution, centralised forecasting in effect could reduce the uncertainty of bidding in energy markets. In both of these cases (shorter gate closure
4 Resource adequacy and capacity markets are discussed in greater detail in Section 5 of this report. 5 As noted in section 4.2.5.1, however, this will not work well in markets where significant volumes of energy are traded through bilateral contracts
IEA-RETD RES-E-NEXT 04 July 2013
10
times and high-quality, centralised forecasting), the impacts of market and system operation have a positive effect on the competitiveness of RES-E in wholesale power markets.
2.2.2.4 Policies That Address Compensation for Curtailment Future policies that help secure RES-E increasingly will need to address the potential for curtailment and how to compensate generators. Curtailment is likely to increase in future years as more variable RES-E is added to the grid. Banks will have difficulty evaluating the impact of network constraints on project revenue. Therefore, to be on the safe side, they will likely assume the highest risk of curtailment, which decreases the expected rate of return. Without a policy to compensate curtailed energy, financing is provided based on the highest possible rate of curtailment, but if less curtailment occurs then the
remuneration has been set too highat the expense of consumers. The economic impacts of curtailment can be minimised to some degree if RES-E generators are able to provide positive reserves (i.e., increase generation output to help balance the system).
A wide range of approaches has been used to address curtailment to date, including the following.
• Canada: The Alberta Electric System Operator will curtail wind generation when there are transmission constraints or for voltage-related issues (Rogers et al. 2010). In Ontario, the system operator has developed a stakeholder process to develop curtailment procedures. A proposal is under consideration to use congestion settlement credits for curtailed variable generators with dispatch requirements (Independent Electricity System Operator 2012).
• Denmark: The use of negative pricing in the wholesale market provides a transparent and market-based mechanism to reduce RES-E output during periods of low load, and reduce the need for curtailment. Denmark only allows curtailment of wind generators if thermal units are running at minimum capacity, although recent legislation has acknowledged that this might have to change in the future if large off-shore facilities are developed. Wind generators are compensated for curtailment except for those that are determined using day-ahead methods (Cochran et al. 2012).
• Germany: Photovoltaic systems of all sizes (not just large systems) must now have the ability to turn off during periods of grid instability (Fulton and Capilano 2012). Curtailments for wind power plants have to be compensated for, unless system stability is at risk.
• Great Britain: Plants are compensated for curtailment based on the price of their bids to the balancing mechanism.
• Ireland: Wind is curtailed if the system operator deems that the security of the system requires it. This includes for transmission congestion or if the total proportion of asynchronous generation (wind6 and high-voltage direct current (HVDC) imports) would account for more than 50% of total generation (system demand plus exports). Work is underway to address technical issues that could allow this limit to be increased to 75% (see Section 3 for more information). The curtailment order is: Peat stations, large combined heat and power plants, hydro plants, and wind. Within these categories, the current practice is to curtail by order of most recent installation, but this practice presently is under review by the Irish energy regulator. Today, if wind generators are curtailed, then they are compensated in the energy market for their full available output, but support payments are not provided to curtailed generation. The circumstances under which wind generation receives compensation also currently is under review (SEMC 2012; Rogers et al. 2010, p. 7).
6 The behavior of wind turbines in synchronous AC systems is discussed in more detail in Section 3.5.1.
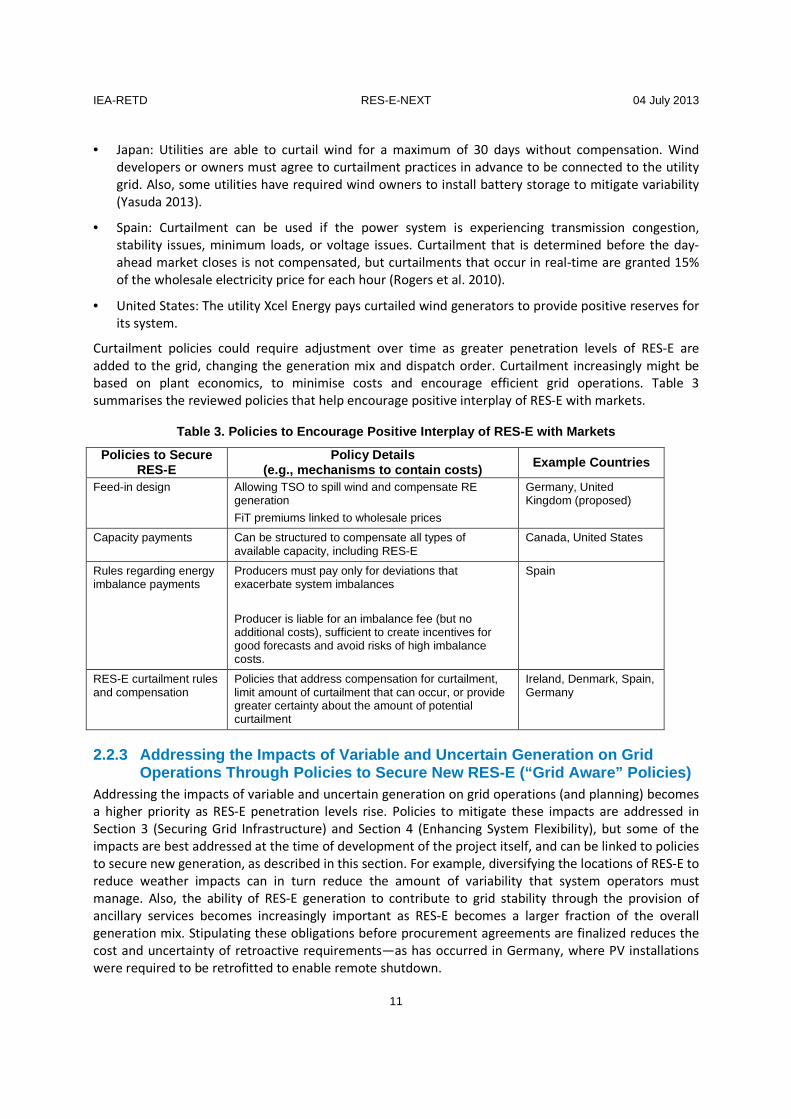
IEA-RETD RES-E-NEXT 04 July 2013
11
• Japan: Utilities are able to curtail wind for a maximum of 30 days without compensation. Wind developers or owners must agree to curtailment practices in advance to be connected to the utility grid. Also, some utilities have required wind owners to install battery storage to mitigate variability (Yasuda 2013).
• Spain: Curtailment can be used if the power system is experiencing transmission congestion, stability issues, minimum loads, or voltage issues. Curtailment that is determined before the day-ahead market closes is not compensated, but curtailments that occur in real-time are granted 15% of the wholesale electricity price for each hour (Rogers et al. 2010).
• United States: The utility Xcel Energy pays curtailed wind generators to provide positive reserves for its system.
Curtailment policies could require adjustment over time as greater penetration levels of RES-E are added to the grid, changing the generation mix and dispatch order. Curtailment increasingly might be based on plant economics, to minimise costs and encourage efficient grid operations. Table 3 summarises the reviewed policies that help encourage positive interplay of RES-E with markets.
Table 3. Policies to Encourage Positive Interplay o f RES-E with Markets
Policies to Secure RES-E
Policy Details (e.g., mechanisms to contain costs) Example Countries
Feed-in design Allowing TSO to spill wind and compensate RE generation
FiT premiums linked to wholesale prices
Germany, United Kingdom (proposed)
Capacity payments Can be structured to compensate all types of available capacity, including RES-E
Canada, United States
Rules regarding energy imbalance payments
Producers must pay only for deviations that exacerbate system imbalances
Producer is liable for an imbalance fee (but no additional costs), sufficient to create incentives for good forecasts and avoid risks of high imbalance costs.
Spain
RES-E curtailment rules and compensation
Policies that address compensation for curtailment, limit amount of curtailment that can occur, or provide greater certainty about the amount of potential curtailment
Ireland, Denmark, Spain, Germany
2.2.3 Addressing the Impacts of Variable and Uncert ain Generation on Grid Operations Through Policies to Secure New RES-E (“G rid Aware” Policies)
Addressing the impacts of variable and uncertain generation on grid operations (and planning) becomes a higher priority as RES-E penetration levels rise. Policies to mitigate these impacts are addressed in Section 3 (Securing Grid Infrastructure) and Section 4 (Enhancing System Flexibility), but some of the impacts are best addressed at the time of development of the project itself, and can be linked to policies to secure new generation, as described in this section. For example, diversifying the locations of RES-E to reduce weather impacts can in turn reduce the amount of variability that system operators must manage. Also, the ability of RES-E generation to contribute to grid stability through the provision of ancillary services becomes increasingly important as RES-E becomes a larger fraction of the overall generation mix. Stipulating these obligations before procurement agreements are finalized reduces the cost and uncertainty of retroactive requirements—as has occurred in Germany, where PV installations were required to be retrofitted to enable remote shutdown.
IEA-RETD RES-E-NEXT 04 July 2013
12
Ultimately, wholesale energy markets with cost-reflective transmission pricing and ancillary services markets ultimately might be able to provide price signals that are adequate to address many grid issues and encourage cost-effective solutions across all market participants. To the extent that markets currently cannot fully address some of these issues, however, near-term policy solutions might be required to ensure that RES-E generators directly mitigate grid impacts. Over time these policies could be phased out, if and when wholesale markets are able to address grid needs through prices that incentivise flexibility, congestion management, and ancillary services. Absent an effective market that guides investments, the following policy options could be considered to complement existing policy price support schemes to reduce the impacts of RES-E on the grid.
2.2.3.1 Price Support Coupled with Requirements for Grid-Support Capabilities RES-E generators increasingly will have to provide certain types of grid support, such as frequency response, voltage support, and inertial response. Generators also need the ability to respond to regulation signals to help provide grid stability. Wind turbines, for example, are able to provide a pseudo–inertial response, although few models provide this service today. Similarly, advanced inverters for distributed PV could provide voltage regulation and low-voltage ride through. In some jurisdictions, larger PV systems already are required to do so, although smaller systems might not have this requirement (Hoke and Komor 2012). Some of these capabilities involve additional upfront capital costs. In the near term, generators won’t be able to rationalise such expenditures, because they might not be able to participate or fully recoup costs in ancillary services markets. Existing policy support mechanisms could be modified to either require generators to have these capabilities to qualify for the price support or to offer bonus payments for generators that have these capabilities. Such mechanisms would facilitate faster adoption by RES-E generators to ensure that a sufficient number of generators are equipped to provide grid support as needed in the future.
2.2.3.2 Price Support Linked to Congestion or Grid Benefits
Policy mechanisms could be used to influence the location of RES-E development to minimise variability and system impact. The ability for distribution feeders to handle PV generation can vary (Hoke and Komor 2012). To address grid concerns at the distribution level, price support payments could decline as distribution feeders reach certain penetration levels or overcome other distribution-level challenges. For example, bonus payments could be offered for distributed generation to be located in areas with high peak demand (such as cities), or where new distributed generation could defer transmission upgrades. Alternatively, price support payments can be reduced for projects located in less-desirable areas of the grid, or where renewable penetration levels already are high and variability would be amplified. In Germany, for example, to encourage development of PV systems in areas of grid congestion, generators are compensated for curtailment at a reduced FiT rate (Fulton and Capilano 2012). In the United States (in New York) bonus payments are provided for distributed PV developed in areas that are deemed by the utility to be of high priority because of congestion, or where PV could defer transmission upgrades (Bird et al. 2012).
Such policies could influence the location of RES-E investments at the expense of utilising the highest quality solar and wind resources, and might only be warranted if net costs are less than those for grid upgrades. Further, one consideration for the adoption of this type of policy is the interaction with transmission pricing schemes. If resulting in conflicting price signals, then providing separate location-based bonuses for substantial amounts of RES-E could undermine the effectiveness of efficient transmission pricing regimes designed to minimise congestion.

IEA-RETD RES-E-NEXT 04 July 2013
13
2.2.3.3 Price Support Linked to Encouraging Production to Align with Demand Orienting a system so that the output aligns more closely with the load is another strategy for minimizing grid impacts, particularly for PV systems. In some cases, PV systems can be oriented to encourage greater production later in the day, when peak loads occur at the expense of greater total output. Thus, to encourage system owners to orient PV systems to optimise production profile rather than full-load production hours, owners would require compensation for lost output. Dynamic pricing is one mechanism for incentivizing optimal output. Greater payments for PV output can be made during peak demand periods, for example, to encourage production during these periods. Some California utilities have begun using this incentive (Hoke and Komor 2012).
2.2.3.4 Price Support Coupled with Forecasting Data Provision Requirements Price support payments can be provided contingent upon the provision of data for the use of centralised RES-E generation forecasts to be used by grid operators. For example, the provision of real-time production data, turbine availability, and wind-measurements can enable better calibration of regional wind forecasts. Although these requirements could be incorporated in conjunction with financial support mechanisms, they also could be stipulated as part of interconnection agreements or grid codes.
2.2.3.5 Price Support that Requires Energy to Be Integrated into Dispatch Optimisation Incorporating RES-E generation into centralised dispatch has the potential to improve system efficiencies. In most locations, production from generators supported by feed-in tariffs is absorbed into the power grid without being integrated into centralised markets or system operations. Requiring this energy to be integrated into a centralised market would enable RES-E to be bid into day-ahead and intraday markets, and be optimised with other generation through, for example, locational pricing (which, in turn, would reduce congestion).
2.2.3.6 Price Support Linked to Dispatchability Policies can specifically target the adoption of RES-E technologies that are dispatchable and can provide balancing services, such as biomass or hydro. Encouraging dispatchable RES-E could be accomplished through technology-specific price support payments or by differentiating support payments based on dispatchability. As an example of the latter, subsidies could be provided based on whether the energy is dispatchable base load, non-dispatchable peak or non-dispatchable off-peak, as in the case of California’s renewable auction mechanism (CPUC 2013).
Technology-differentiated price support could be beneficial for ensuring diversification, particularly when the maturity of RES-E technologies differs widely. Nevertheless, allowing market-based solutions to optimise the technology mix to provide adequate grid flexibility could result in reduced overall cost. Although policy support mechanisms could be required to encourage deployment of some forms of dispatchable RES-E in the near term, wholesale markets—through capacity and flexibility markets—might be sufficient in the long term. For example, dispatchable RES-E technologies are able to benefit from capacity markets more readily than non-dispatchable RES-E. Table 4 summarises the reviewed policies that secure RES-E and address integration challenges.
Table 4. Sample Integration Challenges and Policies that Secure RES-E and Address These Challe nges
Integration Challenge Example Polic ies that Support New RES-E
and Address the Integration Challenge Example Count ries
Grid stability
Incentives that require or include additional financial Spain

IEA-RETD RES-E-NEXT 04 July 2013
14
Integration Challenge Example Polic ies that Support New RES-E
and Address the Integration Challenge Example Count ries compensation for RES-E generators that provide grid
support
Congestion, both transmis-sion and distribution
Location-based price support for distributed generation to be located in congested areas or where new distributed generation could defer transmission
or distribution upgrades
New York bonus payments for PV
Increased variability on the system
Requirements that RES-E be centrally dispatchable NordPool, CWE, Germany
Price support linked to dispatchability (e.g., biomass) or peak
Germany United States (California)
Lack of generation alignment with load
Price support to encourage suboptimal PV orientation to align output with peaks
United States
2.3 Policy Combinations to Achieve Greater Impact To maintain RES-E deployment at greater penetration levels, a blend of cost-aware, market-aware, and grid-aware policies could be necessary. Table 5 provides a qualitative assessment of the potential effectiveness in deploying new RES-E, minimising costs, encouraging positive interplay of RES-E with the power system and markets, and contributing positively to the grid.

IEA-RETD RES-E-NEXT 04 July 2013
15
Table 5. Potential Effectiveness of Policy Options to Secure New RES-E and Address Cost, Market Interactions, and Grid Impacts
Policy Option
Potential to Encourage
RES-E Deployment
Potential to Minimise Costs
(Policy- and System-wide)
Potential to Encourage
Positive Inter-play of RES-E with Markets and System Operations
Potential to Contribute
Positively to the Grid
Cost-Aware Policies
FiTs with flexible adjustment High Moderate If Combined
Tender auctions for long-term contracts Moderate to High Moderate If Combined
Financing mechanisms Low Moderate If Combined
Leasing and new business models Low to Moderate High N/A
Market-Aware Policies
FiTs linked to wholesale power prices Moderate Low High If Combined
Capacity payments Low to Moderate Low to Moderate Moderate Low
Imbalance payment rules Moderate Low to Moderate High Low to Moderate
Curtailment with compensation Moderate Low High Low to Moderate
Grid-Aware Policies
Price support coupled requirements to provide grid support
If Combined Moderate to Higha Moderate High
Price support linked to congestion or grid impacts If Combined Low to Moderatea Moderate Moderate to High
Price support linked to requirements for forecasting data If Combined Moderatea Moderate High
Price support linked to requirements that RES-E be centrally dispatched If Combined Moderate to Higha High High
Support for dispatchable RES-E technologies
Moderate to High Low to Moderatea Low High
a Includes cost savings from operational changes
The specific optimal design for implementing various policy options depends on the institutional, regulatory, and market context of individual jurisdictions. Equally important for determining appropriate policy design is the relative penetration of RES-E, maturity of the RES-E industry, the characteristics of the grid, and the types of existing generation sources. These factors vary considerably across jurisdictions; therefore it is impossible to prescribe a particular set of policy instruments that can be broadly applied. Further, policies likely will require adjustment over time as grid needs change. A key issue for policymakers is to ensure that adjustments are made in a timely manner and with sufficient foresight to encourage a smooth transition to higher RES-E penetration levels on the grid.
Historically, various policy instruments have been used to encourage the deployment of RES-E generation. Their effectiveness often is guided by their stability, ability to limit development risks, success in enabling developers to access financing and interconnect with the grid, and ability to remove development barriers. Next-generation policies also must address a range of barriers to deployment, but the specific barriers and concerns shift with greater RES-E penetration levels. Although Table 5 shows

IEA-RETD RES-E-NEXT 04 July 2013
16
that policies such as financing mechanisms, imbalance payment rules, and curtailment practices can have a modest ability to directly encourage RES-E deployment, they also can have substantial influence on project economics. Their design increasingly will impact confidence in future revenue streams and thus the ability to access low-cost financing options.
With respect to policy cost, the broader effects on grid infrastructure and operations increasingly will require consideration. Policies that secure new RES-E that contributes positively to the grid and system operations, for example, can result in substantial cost savings that reduce the overall policy cost. As penetration levels of RES-E increase, it might be beneficial for power systems to take a more holistic approach in thinking about costs. Table 5 assesses the potential for various policies examined here to reduce policy costs. It is important to note that, although some of the policies (such as wholesale market rules) have a modest ability to limit overall policy costs, they could gain importance with greater RES-E penetration levels, particularly if RES-E increasingly is required to compete with conventional generators in wholesale markets.
As noted, the impact of RES-E on the grid correlates to the level of penetration of RES-E and the existing infrastructure and operational practices. This section focuses on potential modifications to policies to secure new RES-E that can alleviate or avoid grid challenges, based on experience in jurisdictions with higher penetration levels of RES-E. The options presented here can be implemented relatively quickly and easily because they involve modifications to existing policy instruments, but these policy options do not supplant the need for potentially more costly and time-intensive grid infrastructure investments that could be required (as discussed in Section 4). Incorporating grid concerns in policy support mechanisms can be used in conjunction with other complementary strategies for investing in grid infrastructure and efficiently operating the power system to accommodate higher penetration levels of RES-E.
A tailored mix of cost-, market-, and grid-aware policies might be required, and policymakers must decide which combinations of policies and what level of complexity is appropriate for a specific context. Policy clarity is important. If, for example, the interactions between price support schemes and curtailment policies are unclear, market participants may find it challenging to understand the market, limiting investment. The existence of multiple policies is not uniformly bad — in many instances multiple policies can reduce risks for investors. Also, a combination of policies might be necessary to address distinct development challenges. It therefore is essential to clearly identify goals for—and key barriers to—providing a structure for combinations of policy instruments.
2.4 Conclusions and Recommendations for Securing RES-E Generation
Maintaining growth in RES-E capacity at greater levels of generation will likely require two critical
changes to today’s policies to secure new RES-E while minimising costsincreased integration with wholesale and retail power markets, and proactively addressing grid requirements. Although specific policy portfolios will be unique to each jurisdiction, the following key considerations can help guide policymakers in the design of next-generation policy instruments.
2.4.1 Encouraging Positive Interplay with Markets a nd System Operations Higher penetration levels of RES-E in the generation mix mean that the effectiveness of wholesale and retail power markets in finding least-cost solutions that maintain reliability is contingent upon the full integration of RES-E into market supply. For example, congestion can be more cost-effectively mitigated
IEA-RETD RES-E-NEXT 04 July 2013
17
if RES-E generation is integrated into markets and centrally dispatched along with other generation sources based on economics; preferential dispatch will be difficult to maintain at high penetration rates. In many jurisdictions, the integration of RES-E requires that modifications to market rules and operations be indifferent to resource type, and incentivise attributes that support reliability, such as flexibility.
2.4.2 Responding to Changing Market Conditions Policies to secure new RES-E must be responsive to changing market conditions and market pricing to encourage continued growth in RES-E capacity at minimal policy cost. The purpose of price support mechanisms is to attract private investment. Today, support mechanisms are focused on bridging the cost differential with conventional generation. At greater penetration of RES-E—when RES-E capital costs could be more competitive—the certainty of revenue streams likely will increase in importance relative to average energy prices in investment decisions. Rules governing curtailment, energy imbalances, gate closures, and scheduling can have a substantial impact on RES-E project economics and revenue streams. Traditional feed-in tariffs, on a per kilowatt-hour basis, might be insufficient in providing revenue certainty if they do not account for potentially more frequent curtailments with higher RES-E penetration levels. Since curtailment decisions based only on generator economics lead to more economically optimal solutions for grid operations, such systems will likely be more sustainable over time. In this light, prioritizing RES-E revenue certainty over market and system operation considerations would likely distort the operation of other domains and be unsustainable in the long run. Instead, it is suggested that RES-E be integrated with a focus on system optimisation, and from there use specific policies to increase revenue certainty more narrowly, for example, through compensation during times of curtailments. In addition, other broader policy best practices, such as use of advanced forecasting and larger balancing areas, could in turn reduce system imbalances and mitigate the physical and financial impacts of variability from individual generators (see Section 3, Section 4).
2.4.3 Responding Proactively to Changing Grid Needs Grid needs can change with higher penetration levels of variable RES-E generation. Because RES-E investments can occur rapidly and the generators can be operational for decades, policies to support new RES-E generation will need to be forward looking to anticipate future grid needs and encourage positive grid interactions. The mechanisms to address grid challenges will depend on the specifics of the individual system, which will be influenced by its generation mix, operational practices, transmission availability, and grid strength. For example, RES-E technologies installed in the near term could be equipped to provide grid support services (i.e., frequency and inertial response, voltage control) in future years once RES-E technologies comprise a larger fraction of the overall generation mix. Policies to support new RES-E can make such support contingent on providing these services.
2.4.4 Addressing Other Integration Hurdles Other grid challenges also can be addressed to some degree through policies to secure new RES-E. Absent effective market mechanisms, for example, support payments can be designed to influence the geographic location of RES-E to minimise distribution impacts, transmission system congestion, or the variability of generation. To aid in system operations, policies to support PV generation could be designed to fit power demand profiles rather than to maximise total generation. Policymakers also increasingly will have to consider the impacts of policies that secure RES-E on the shrinking conventional generation, which today provides necessary services for grid and system operations. Greater penetration levels of RES-E on the system could make dispatchable (renewable) resources increasingly valuable.

IEA-RETD RES-E-NEXT 04 July 2013
18
No single policy solution can capture the range of incentives needed to support RES-E growth—at contained costs and with minimal impacts on the electric grid. The effectiveness or appropriateness of policy solutions can vary by jurisdiction in light of many factors, including its power market, existing generation fleet, financing availability, and regulatory environment. Thus a variety of solutions and policy design options likely will be required.
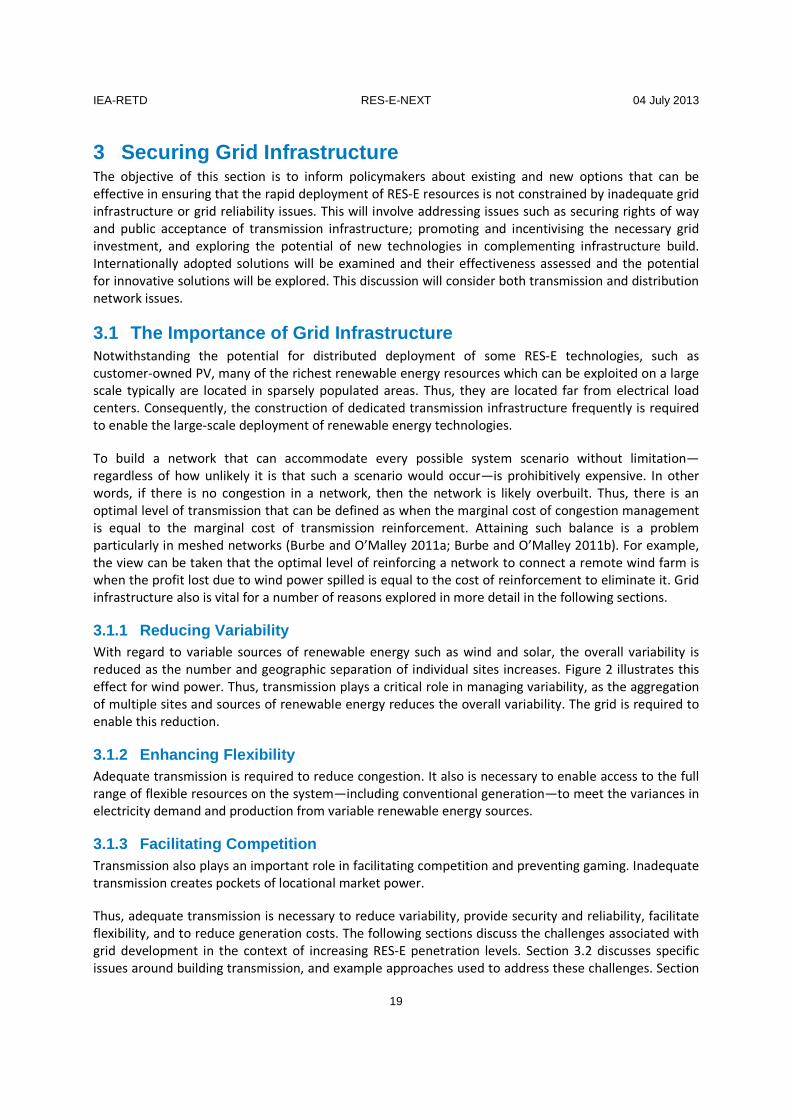
IEA-RETD RES-E-NEXT 04 July 2013
19
3 Securing Grid Infrastructure The objective of this section is to inform policymakers about existing and new options that can be effective in ensuring that the rapid deployment of RES-E resources is not constrained by inadequate grid infrastructure or grid reliability issues. This will involve addressing issues such as securing rights of way and public acceptance of transmission infrastructure; promoting and incentivising the necessary grid investment, and exploring the potential of new technologies in complementing infrastructure build. Internationally adopted solutions will be examined and their effectiveness assessed and the potential for innovative solutions will be explored. This discussion will consider both transmission and distribution network issues.
3.1 The Importance of Grid Infrastructure Notwithstanding the potential for distributed deployment of some RES-E technologies, such as customer-owned PV, many of the richest renewable energy resources which can be exploited on a large scale typically are located in sparsely populated areas. Thus, they are located far from electrical load centers. Consequently, the construction of dedicated transmission infrastructure frequently is required to enable the large-scale deployment of renewable energy technologies.
To build a network that can accommodate every possible system scenario without limitation—regardless of how unlikely it is that such a scenario would occur—is prohibitively expensive. In other words, if there is no congestion in a network, then the network is likely overbuilt. Thus, there is an optimal level of transmission that can be defined as when the marginal cost of congestion management is equal to the marginal cost of transmission reinforcement. Attaining such balance is a problem particularly in meshed networks (Burbe and O’Malley 2011a; Burbe and O’Malley 2011b). For example, the view can be taken that the optimal level of reinforcing a network to connect a remote wind farm is when the profit lost due to wind power spilled is equal to the cost of reinforcement to eliminate it. Grid infrastructure also is vital for a number of reasons explored in more detail in the following sections.
3.1.1 Reducing Variability With regard to variable sources of renewable energy such as wind and solar, the overall variability is reduced as the number and geographic separation of individual sites increases. Figure 2 illustrates this effect for wind power. Thus, transmission plays a critical role in managing variability, as the aggregation of multiple sites and sources of renewable energy reduces the overall variability. The grid is required to enable this reduction.
3.1.2 Enhancing Flexibility Adequate transmission is required to reduce congestion. It also is necessary to enable access to the full range of flexible resources on the system—including conventional generation—to meet the variances in electricity demand and production from variable renewable energy sources.
3.1.3 Facilitating Competition Transmission also plays an important role in facilitating competition and preventing gaming. Inadequate transmission creates pockets of locational market power.
Thus, adequate transmission is necessary to reduce variability, provide security and reliability, facilitate flexibility, and to reduce generation costs. The following sections discuss the challenges associated with grid development in the context of increasing RES-E penetration levels. Section 3.2 discusses specific issues around building transmission, and example approaches used to address these challenges. Section
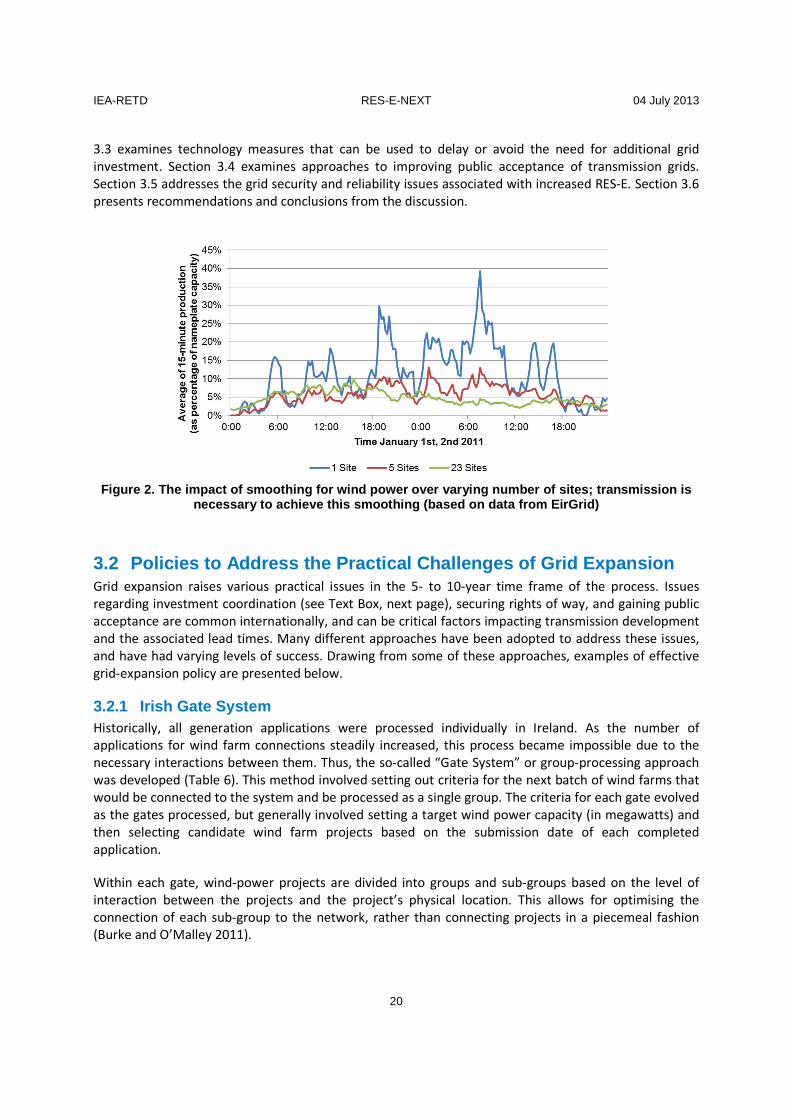
IEA-RETD RES-E-NEXT 04 July 2013
20
3.3 examines technology measures that can be used to delay or avoid the need for additional grid investment. Section 3.4 examines approaches to improving public acceptance of transmission grids. Section 3.5 addresses the grid security and reliability issues associated with increased RES-E. Section 3.6 presents recommendations and conclusions from the discussion.
Figure 2. The impact of smoothing for wind power ov er varying number of sites; transmission is necessary to achieve this smoothing (based on data from EirGrid)
3.2 Policies to Address the Practical Challenges of Grid Expansion Grid expansion raises various practical issues in the 5- to 10-year time frame of the process. Issues regarding investment coordination (see Text Box, next page), securing rights of way, and gaining public acceptance are common internationally, and can be critical factors impacting transmission development and the associated lead times. Many different approaches have been adopted to address these issues, and have had varying levels of success. Drawing from some of these approaches, examples of effective grid-expansion policy are presented below.
3.2.1 Irish Gate System Historically, all generation applications were processed individually in Ireland. As the number of applications for wind farm connections steadily increased, this process became impossible due to the necessary interactions between them. Thus, the so-called “Gate System” or group-processing approach was developed (Table 6). This method involved setting out criteria for the next batch of wind farms that would be connected to the system and be processed as a single group. The criteria for each gate evolved as the gates processed, but generally involved setting a target wind power capacity (in megawatts) and then selecting candidate wind farm projects based on the submission date of each completed application.
Within each gate, wind-power projects are divided into groups and sub-groups based on the level of interaction between the projects and the project’s physical location. This allows for optimising the connection of each sub-group to the network, rather than connecting projects in a piecemeal fashion (Burke and O’Malley 2011).
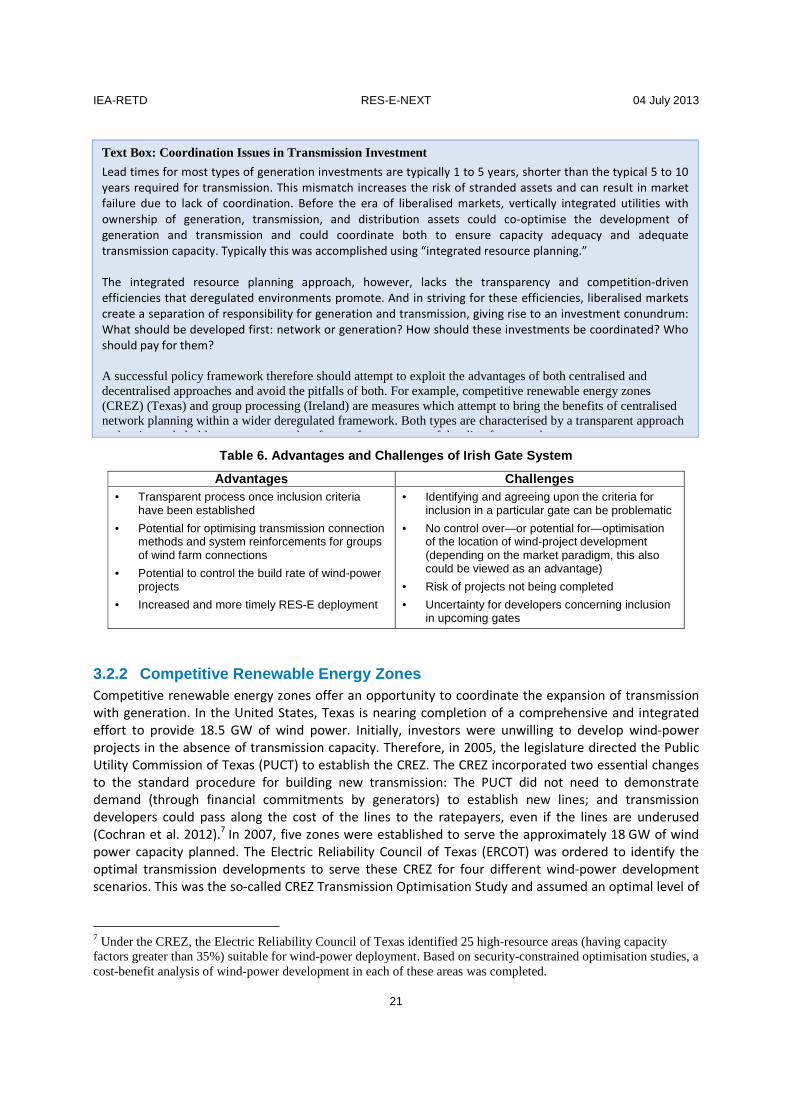
IEA-RETD RES-E-NEXT 04 July 2013
21
Table 6. Advantages and Challenges of Irish Gate Sy stem
Advantages Challenges • Transparent process once inclusion criteria
have been established
• Potential for optimising transmission connection methods and system reinforcements for groups of wind farm connections
• Potential to control the build rate of wind-power projects
• Increased and more timely RES-E deployment
• Identifying and agreeing upon the criteria for inclusion in a particular gate can be problematic
• No control over—or potential for—optimisation of the location of wind-project development (depending on the market paradigm, this also could be viewed as an advantage)
• Risk of projects not being completed
• Uncertainty for developers concerning inclusion in upcoming gates
3.2.2 Competitive Renewable Energy Zones Competitive renewable energy zones offer an opportunity to coordinate the expansion of transmission with generation. In the United States, Texas is nearing completion of a comprehensive and integrated effort to provide 18.5 GW of wind power. Initially, investors were unwilling to develop wind-power projects in the absence of transmission capacity. Therefore, in 2005, the legislature directed the Public Utility Commission of Texas (PUCT) to establish the CREZ. The CREZ incorporated two essential changes to the standard procedure for building new transmission: The PUCT did not need to demonstrate demand (through financial commitments by generators) to establish new lines; and transmission developers could pass along the cost of the lines to the ratepayers, even if the lines are underused (Cochran et al. 2012).7 In 2007, five zones were established to serve the approximately 18 GW of wind power capacity planned. The Electric Reliability Council of Texas (ERCOT) was ordered to identify the optimal transmission developments to serve these CREZ for four different wind-power development scenarios. This was the so-called CREZ Transmission Optimisation Study and assumed an optimal level of
7 Under the CREZ, the Electric Reliability Council of Texas identified 25 high-resource areas (having capacity factors greater than 35%) suitable for wind-power deployment. Based on security-constrained optimisation studies, a cost-benefit analysis of wind-power development in each of these areas was completed.
Text Box: Coordination Issues in Transmission Investment
Lead times for most types of generation investments are typically 1 to 5 years, shorter than the typical 5 to 10 years required for transmission. This mismatch increases the risk of stranded assets and can result in market failure due to lack of coordination. Before the era of liberalised markets, vertically integrated utilities with ownership of generation, transmission, and distribution assets could co-optimise the development of generation and transmission and could coordinate both to ensure capacity adequacy and adequate transmission capacity. Typically this was accomplished using “integrated resource planning.”
The integrated resource planning approach, however, lacks the transparency and competition-driven efficiencies that deregulated environments promote. And in striving for these efficiencies, liberalised markets create a separation of responsibility for generation and transmission, giving rise to an investment conundrum: What should be developed first: network or generation? How should these investments be coordinated? Who should pay for them?
A successful policy framework therefore should attempt to exploit the advantages of both centralised and decentralised approaches and avoid the pitfalls of both. For example, competitive renewable energy zones (CREZ) (Texas) and group processing (Ireland) are measures which attempt to bring the benefits of centralised network planning within a wider deregulated framework. Both types are characterised by a transparent approach and active stakeholder engagement—key factors for any successful policy framework.

IEA-RETD RES-E-NEXT 04 July 2013
22
curtailment of 2% (Kirby 2007). This study identified the transmission reinforcements required to allow target levels of wind power to be developed and exported to the grid.
Although creating a CREZ seems to be an effective solution to the challenge of ensuring adequate grid infrastructure to support RES-E development, its replicability is uncertain, as its lone successful application (in the ERCOT system) is—like most systems—unique from a regulatory and financial perspective. Successes in other systems are required to draw general conclusions.
Table 7. Advantages and Challenges of Competitive R enewable Energy Zones
Advantages Challenges • Can effectively control location of wind power
deployment
• Effectively supports wind power development
• Streamlined permissions process for transmission project development, with 44% of projects completed within 4 years
• Requires political will and a relatively straightforward regulatory environment
• Stranded asset risk: Wind development in the Texas CREZ has been less than expected, primarily due to low natural gas prices and political uncertainty over the production tax credit; therefore ratepayers must absorb the cost of underutilised transmission lines
3.2.3 Contestable Infrastructure Markets Contestable infrastructure markets allow for the construction of new transmission and interconnector capacity on a merchant basis. This was an early idea of liberalised power markets (Hogan 1992). The European regulations applying to merchant infrastructure are contained in the EU regulation on cross-border exchanges that came into effect on July 1, 2004. Merchant interconnections are permitted subject to a number of conditions, except in cases where transmission capacity is scarce. The first merchant interconnector in Europe was approved in 2005 (Estlink, between Finland and Estonia). The first merchant transmission infrastructure in the United States was the Linden Variable Frequency Transformer, linking the PJM and New York Independent System Operator (NYISO) markets, it was connected in 2009. The BritNed HVDC link between England and Netherlands is another example of a merchant interconnector arbitraging price differences between the two countries. BritNed has been in commercial operation since 2011.
The business case for “pure” merchant transmission development relies heavily on significant price differentials between or within markets. It therefore is likely that true merchant investment only will become an option long after the need for interconnection is identified. Additionally, the EU regulations pertaining to merchant transmission are such that it is permitted rather than actively encouraged. A possible reason for this is the potential for exposure of systems to the risk of price differentials failing to cover costs in the long term and asset costs becoming socialised. The advantages and challenges of contestable infrastructure markets are listed in Table 8.
Table 8. Advantages and Challenges of Contestable I nfrastructure Markets
Advantages Challenges • No upfront costs to the consumer
• Developer bears more risk
• Promotes innovation in grid-extension business models
• Likely to be considered an option only after a condition of price separation has existed for a long period
• Might involve policy and regulation of various jurisdictions

IEA-RETD RES-E-NEXT 04 July 2013
23
3.2.4 Congestion Management in Interconnected Netw orks In most energy markets, a market clearing process derives a market schedule by processing bids for provision of energy that are submitted by generators. A least-cost market schedule is derived, which generally minimises the cost of meeting the forecasted demand for a particular trading interval based on bid prices. This market schedule generally won’t satisfy the TSO’s requirements for transmission security and congestion, so it is re-dispatched with generators being compensated by the system operator for the difference between their instructed schedule and the market schedule. In Europe, the operation of the power system is distinct from the operation of the market. Energy is traded though bilateral contracts and the market, and system operation is handled by TSOs.
The following sections describe the two most common methods for dealing with these differences daily, in the context of large-scale RES-E integration.
3.2.4.1 Net Transfer Capacities In Europe, transmission congestion between regions is handled using net transfer capacities (NTCs), which represent the maximum possible transfer between two systems without violating security requirements. Net transfer capacities differ from commercial transfer limits used in cross-border trading mechanisms in that they are not based only on the available capacity of a physical interconnector but also consider the security of the systems at either end. They are computed periodically based on current and forecasted system conditions for each system and with consideration of scheduled market flows.
A fundamental quantity used in these calculations is the total transfer capacity (TTC). The TTC is the maximum exchange between two systems that would be possible without violating operational security constraints and if all future system conditions were known perfectly. A security margin then is derived to account for uncertainties in future operating conditions (such as variable RES-E production or customer demand) and is applied to the TTC. This yields the NTC between regions. ENTSO-E describes the NTC as “the maximum exchange program between two areas compatible with security standards applicable in both areas and taking into account the technical uncertainties on future network conditions” (ENTSO 2012).
The net transfer capacity system in its current form, however, does not include a framework for coordinating system operations when actual system flows deviate significantly from those assumed during the calculation of NTCs; for example, as a result of unexpectedly high (or low) wind power production. Thus, unscheduled flows arising from re-dispatch, differences in demand, and variable generation occurring between gate closure and real time can cause problems in managing inter-area flows and congestion.
For example, Poland and the Czech Republic regularly experience unscheduled flows from Germany that often result from unpredicted wind generation in Northern Germany. Poland is considering installing phase-shifting transformers to mitigate these unscheduled flows. This is a quite expensive and suboptimal alternative to a coordinated regional (or pan-European) dispatch.
The advantages and challenges of NTCs are listed in Table 9.

IEA-RETD RES-E-NEXT 04 July 2013
24
Table 9. Advantages and Challenges of Net Transfer Capacities
Advantages Challenges • No implementation costs
• Simple calculations
• Potential for tighter coordination between TSOs to mitigate some impacts associated with unscheduled flows
• Many improvements to NTCs planned, with potential for addressing some problems
• Not very effective at incentivizing transmission investment
• Does not resolve imbalances
• Might not reflect current operating conditions
• Does not address internal congestion issues or impacts thereof, such as loop flows
3.2.4.2 Locational Pricing In centralised, pool-type markets, a single price for energy is determined based on bids from generators for the provision of energy. This approach, however, does not attempt to assess the physical realisability of the energy schedule that results. In Locational Marginal Pricing (LMP) or “nodal” pricing markets, a price for serving energy at each location (which might correspond in geographical resolution from a region or transmission station) is determined. The methodology for deriving locational prices considers the limitations of the transmission system. If the power-transfer capacity between locations is not a limiting factor (i.e., there is no congestion), then the price for each location is equal. If transfer capacities are limiting (i.e., congestion occurs), however, then price separation occurs and results in different energy prices at each location. This generally results in a closer agreement between the market schedule derived from locational marginal prices and the actual real-time dispatch, as more information about the physical system is captured within the market-scheduling process.
Figure 3. Illustration of price separation in an LM P market
In Figure 3, scenario A, the cheapest way to serve demand is to schedule G1 and G2, the two cheapest generators, with the resulting uniform price of €30 (USD$39.22) per megawatt-hour. In scenario B, representing an LMP market, the limited transfer capacity between the two nodes means that the more expensive G3 must run, resulting in different prices at each node.
Single-system dispatch that considers more of the physical limitations of the transmission system—as in the LMP framework—automatically incentivises cooperation and coordination among systems and makes visible the sources of congestion. The costs of congestion would be allocated to the congested party. This is contrary to the present arrangements in Europe, which are not transparent and which
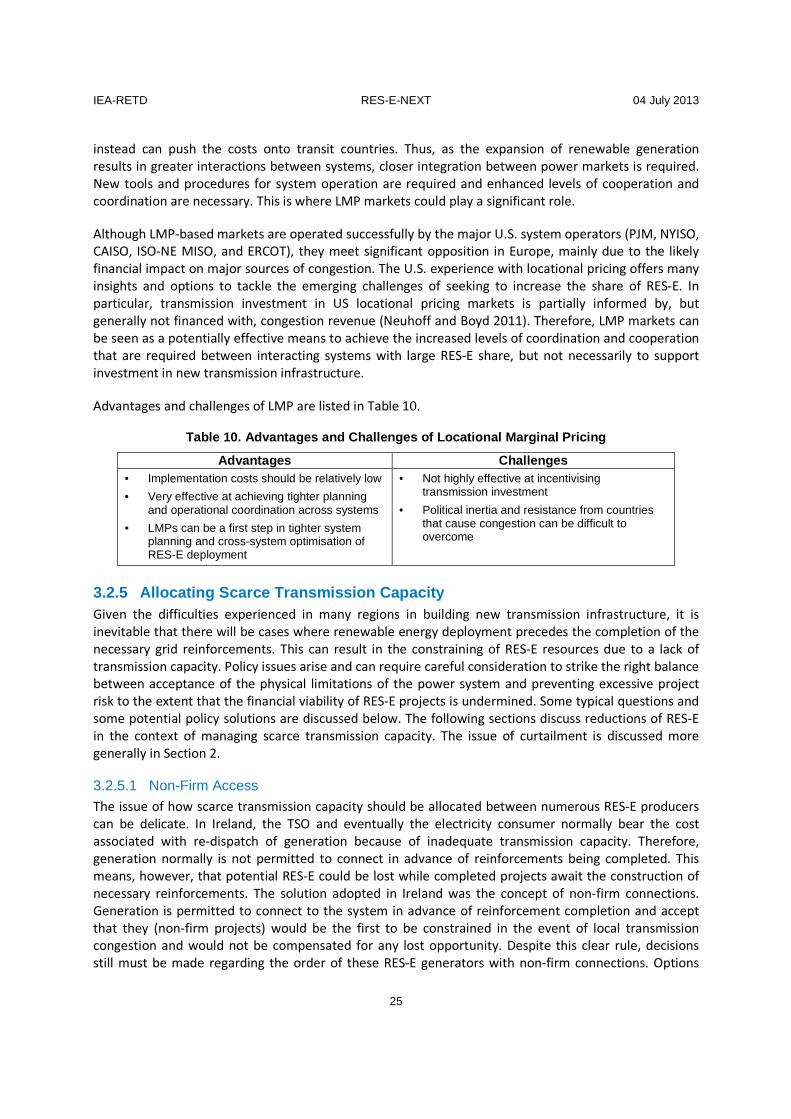
IEA-RETD RES-E-NEXT 04 July 2013
25
instead can push the costs onto transit countries. Thus, as the expansion of renewable generation results in greater interactions between systems, closer integration between power markets is required. New tools and procedures for system operation are required and enhanced levels of cooperation and coordination are necessary. This is where LMP markets could play a significant role.
Although LMP-based markets are operated successfully by the major U.S. system operators (PJM, NYISO, CAISO, ISO-NE MISO, and ERCOT), they meet significant opposition in Europe, mainly due to the likely financial impact on major sources of congestion. The U.S. experience with locational pricing offers many insights and options to tackle the emerging challenges of seeking to increase the share of RES-E. In particular, transmission investment in US locational pricing markets is partially informed by, but generally not financed with, congestion revenue (Neuhoff and Boyd 2011). Therefore, LMP markets can be seen as a potentially effective means to achieve the increased levels of coordination and cooperation that are required between interacting systems with large RES-E share, but not necessarily to support investment in new transmission infrastructure.
Advantages and challenges of LMP are listed in Table 10.
Table 10. Advantages and Challenges of Locational M arginal Pricing
Advantages Challenges • Implementation costs should be relatively low
• Very effective at achieving tighter planning and operational coordination across systems
• LMPs can be a first step in tighter system planning and cross-system optimisation of RES-E deployment
• Not highly effective at incentivising transmission investment
• Political inertia and resistance from countries that cause congestion can be difficult to overcome
3.2.5 Allocating Scarce Transmission Capacity Given the difficulties experienced in many regions in building new transmission infrastructure, it is inevitable that there will be cases where renewable energy deployment precedes the completion of the necessary grid reinforcements. This can result in the constraining of RES-E resources due to a lack of transmission capacity. Policy issues arise and can require careful consideration to strike the right balance between acceptance of the physical limitations of the power system and preventing excessive project risk to the extent that the financial viability of RES-E projects is undermined. Some typical questions and some potential policy solutions are discussed below. The following sections discuss reductions of RES-E in the context of managing scarce transmission capacity. The issue of curtailment is discussed more generally in Section 2.
3.2.5.1 Non-Firm Access The issue of how scarce transmission capacity should be allocated between numerous RES-E producers can be delicate. In Ireland, the TSO and eventually the electricity consumer normally bear the cost associated with re-dispatch of generation because of inadequate transmission capacity. Therefore, generation normally is not permitted to connect in advance of reinforcements being completed. This means, however, that potential RES-E could be lost while completed projects await the construction of necessary reinforcements. The solution adopted in Ireland was the concept of non-firm connections. Generation is permitted to connect to the system in advance of reinforcement completion and accept that they (non-firm projects) would be the first to be constrained in the event of local transmission congestion and would not be compensated for any lost opportunity. Despite this clear rule, decisions still must be made regarding the order of these RES-E generators with non-firm connections. Options
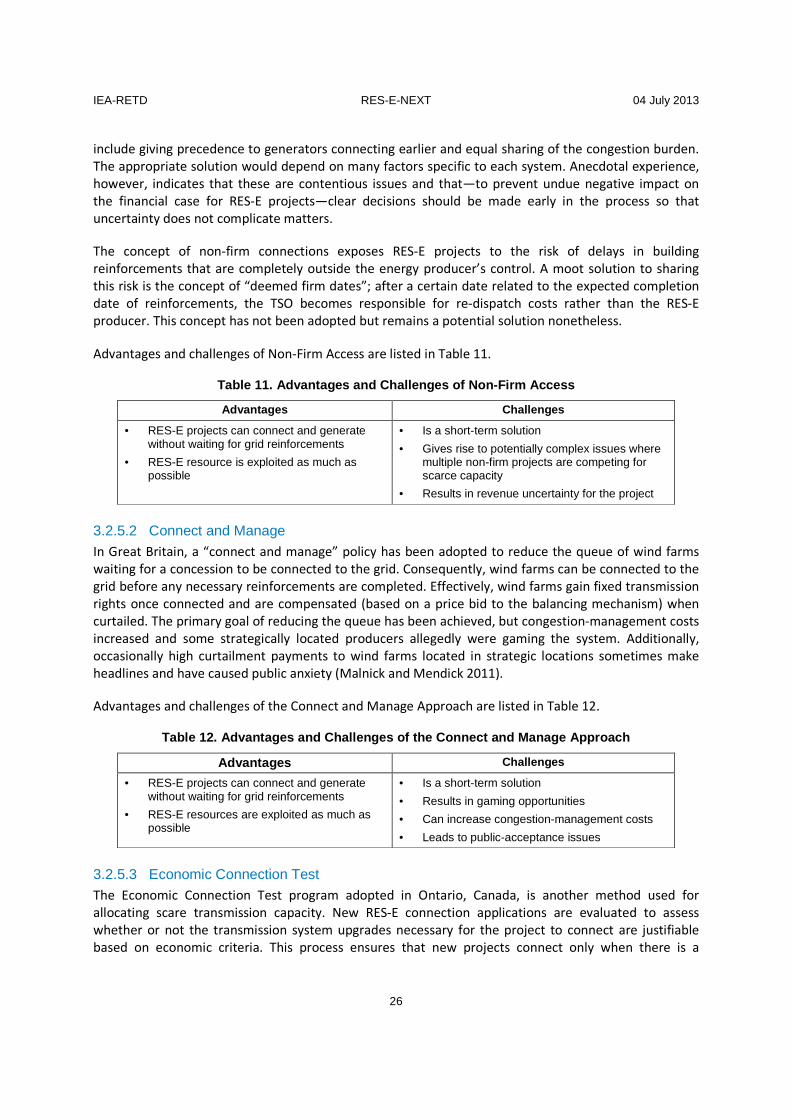
IEA-RETD RES-E-NEXT 04 July 2013
26
include giving precedence to generators connecting earlier and equal sharing of the congestion burden. The appropriate solution would depend on many factors specific to each system. Anecdotal experience, however, indicates that these are contentious issues and that—to prevent undue negative impact on the financial case for RES-E projects—clear decisions should be made early in the process so that uncertainty does not complicate matters.
The concept of non-firm connections exposes RES-E projects to the risk of delays in building reinforcements that are completely outside the energy producer’s control. A moot solution to sharing this risk is the concept of “deemed firm dates”; after a certain date related to the expected completion date of reinforcements, the TSO becomes responsible for re-dispatch costs rather than the RES-E producer. This concept has not been adopted but remains a potential solution nonetheless.
Advantages and challenges of Non-Firm Access are listed in Table 11.
Table 11. Advantages and Challenges of Non-Firm Acc ess
Advantages Challenges
• RES-E projects can connect and generate without waiting for grid reinforcements
• RES-E resource is exploited as much as possible
• Is a short-term solution
• Gives rise to potentially complex issues where multiple non-firm projects are competing for scarce capacity
• Results in revenue uncertainty for the project
3.2.5.2 Connect and Manage In Great Britain, a “connect and manage” policy has been adopted to reduce the queue of wind farms waiting for a concession to be connected to the grid. Consequently, wind farms can be connected to the grid before any necessary reinforcements are completed. Effectively, wind farms gain fixed transmission rights once connected and are compensated (based on a price bid to the balancing mechanism) when curtailed. The primary goal of reducing the queue has been achieved, but congestion-management costs increased and some strategically located producers allegedly were gaming the system. Additionally, occasionally high curtailment payments to wind farms located in strategic locations sometimes make headlines and have caused public anxiety (Malnick and Mendick 2011).
Advantages and challenges of the Connect and Manage Approach are listed in Table 12.
Table 12. Advantages and Challenges of the Connect and Manage Approach
Advantages Challenges
• RES-E projects can connect and generate without waiting for grid reinforcements
• RES-E resources are exploited as much as possible
• Is a short-term solution
• Results in gaming opportunities
• Can increase congestion-management costs
• Leads to public-acceptance issues
3.2.5.3 Economic Connection Test The Economic Connection Test program adopted in Ontario, Canada, is another method used for allocating scare transmission capacity. New RES-E connection applications are evaluated to assess whether or not the transmission system upgrades necessary for the project to connect are justifiable based on economic criteria. This process ensures that new projects connect only when there is a
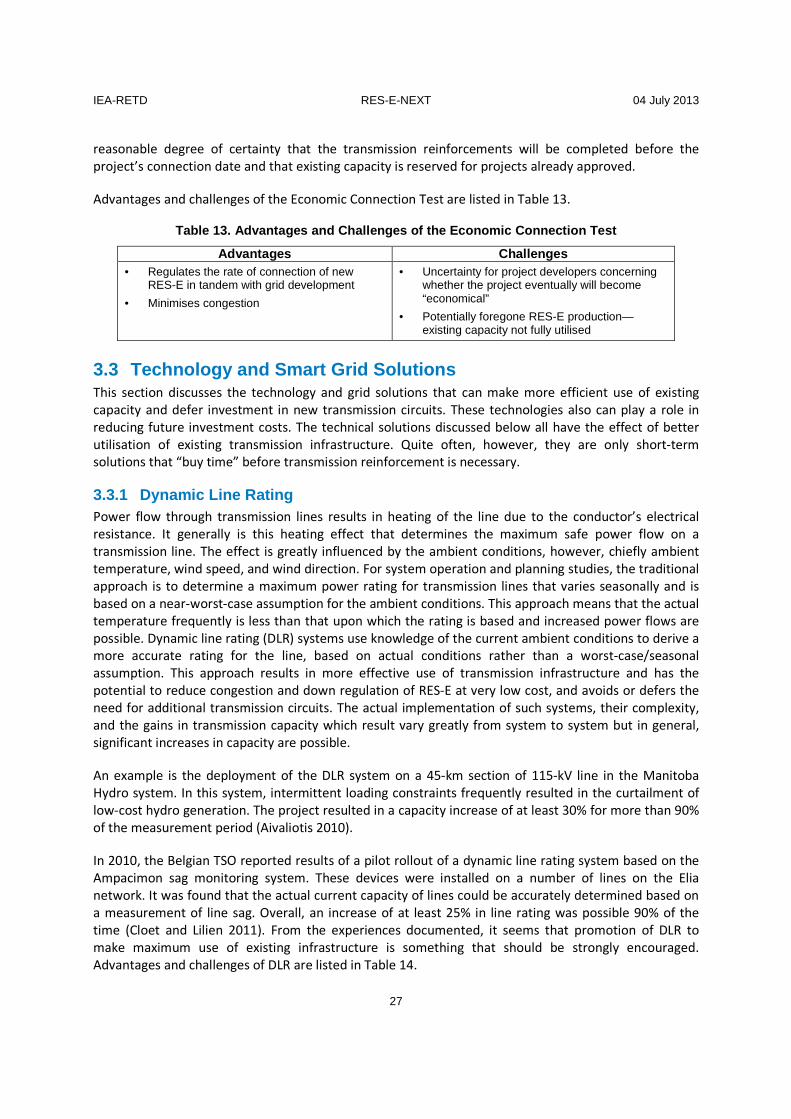
IEA-RETD RES-E-NEXT 04 July 2013
27
reasonable degree of certainty that the transmission reinforcements will be completed before the project’s connection date and that existing capacity is reserved for projects already approved.
Advantages and challenges of the Economic Connection Test are listed in Table 13.
Table 13. Advantages and Challenges of the Economic Connection Test
Advantages Challenges • Regulates the rate of connection of new
RES-E in tandem with grid development
• Minimises congestion
• Uncertainty for project developers concerning whether the project eventually will become “economical”
• Potentially foregone RES-E production—existing capacity not fully utilised
3.3 Technology and Smart Grid Solutions This section discusses the technology and grid solutions that can make more efficient use of existing capacity and defer investment in new transmission circuits. These technologies also can play a role in reducing future investment costs. The technical solutions discussed below all have the effect of better utilisation of existing transmission infrastructure. Quite often, however, they are only short-term solutions that “buy time” before transmission reinforcement is necessary.
3.3.1 Dynamic Line Rating Power flow through transmission lines results in heating of the line due to the conductor’s electrical resistance. It generally is this heating effect that determines the maximum safe power flow on a transmission line. The effect is greatly influenced by the ambient conditions, however, chiefly ambient temperature, wind speed, and wind direction. For system operation and planning studies, the traditional approach is to determine a maximum power rating for transmission lines that varies seasonally and is based on a near-worst-case assumption for the ambient conditions. This approach means that the actual temperature frequently is less than that upon which the rating is based and increased power flows are possible. Dynamic line rating (DLR) systems use knowledge of the current ambient conditions to derive a more accurate rating for the line, based on actual conditions rather than a worst-case/seasonal assumption. This approach results in more effective use of transmission infrastructure and has the potential to reduce congestion and down regulation of RES-E at very low cost, and avoids or defers the need for additional transmission circuits. The actual implementation of such systems, their complexity, and the gains in transmission capacity which result vary greatly from system to system but in general, significant increases in capacity are possible.
An example is the deployment of the DLR system on a 45-km section of 115-kV line in the Manitoba Hydro system. In this system, intermittent loading constraints frequently resulted in the curtailment of low-cost hydro generation. The project resulted in a capacity increase of at least 30% for more than 90% of the measurement period (Aivaliotis 2010).
In 2010, the Belgian TSO reported results of a pilot rollout of a dynamic line rating system based on the Ampacimon sag monitoring system. These devices were installed on a number of lines on the Elia network. It was found that the actual current capacity of lines could be accurately determined based on a measurement of line sag. Overall, an increase of at least 25% in line rating was possible 90% of the time (Cloet and Lilien 2011). From the experiences documented, it seems that promotion of DLR to make maximum use of existing infrastructure is something that should be strongly encouraged. Advantages and challenges of DLR are listed in Table 14.

IEA-RETD RES-E-NEXT 04 July 2013
28
Table 14. Advantages and Challenges of Dynamic Line Rating
Advantages Challenges • Significant capacity increases possible at very
low cost as compared to new infrastructure
• No public-acceptance issues
• Short lead times
• Slight increase in system risk
• Increased operational complexity
• Potentially only a short-term solution
3.3.2 Special Protection Schemes Traditionally, power systems have been run in a preventive mode, and run in such a way that any contingency would not endanger security of supply and cause a blackout. This mode of operation is quite secure but is high cost. Recently, however, there is movement toward a corrective mode of operation, whereby a contingency that could pose a risk to security of supply is dealt with by a special protection scheme (SPS). In effect, contingencies are dealt with if they happen, and a possibility of them happening does not restrict system operation. This makes it possible to run the system more economically, but with an increased risk of a blackout should the SPS fail.
Generally, special protection schemes are systems that carry out a series of automatic actions in response to a predefined system event, and avoid potential damage to system components as a result of a specific outage. Without special protection schemes, the pre-event transfer capacity of the transmission element in question would be lower. Thus, an SPS generally increases the transfer capacity of the network. An example of an SPS would be an inter-trip scheme where, upon the loss of a particular circuit, generators feeding that circuit are automatically disconnected to prevent another circuit being overloaded. This avoids having to run the generator at a lower level to avoid overloading transmission circuits upon specific contingencies. Special protection schemes come at the cost of increased system risk, however, as automatic actions could fail to operate or might operate incorrectly (McCalley and Fu 1999). Thus, an SPS must be used with caution, and the risks quantified and weighed against the benefits. Very often, an SPS is an interim measure that can be deployed in lieu of completion of reinforcement works. In other situations, an SPS can be deployed as a long-term solution.
The acceptability and use of special protection schemes varies greatly from system to system, and consideration must be given to the increase in overall system risk, system characteristics, system size, and other schemes in place locally. Given the low cost of such schemes in comparison to the new transmission, however, these schemes warrant consideration.
Advantages and challenges of Special Protection Schemes are listed in Table 15.
Table 15. Advantages and Challenges of Special Prot ection Schemes
Advantages Challenges • Low cost
• Short lead times
• No public-acceptance issues
• Might only be short-term solutions
• Proliferation of multiple SPS increases system risk and narrows options locally
3.3.3 Active Network Management In addition to DLR and SPS, there is an emerging range of solutions proposed to overcome transmission constraints. These include the use of dynamic pricing, demand response, and storage to alleviate network constraints. Typically, control systems are used in conjunction with controllable resources such
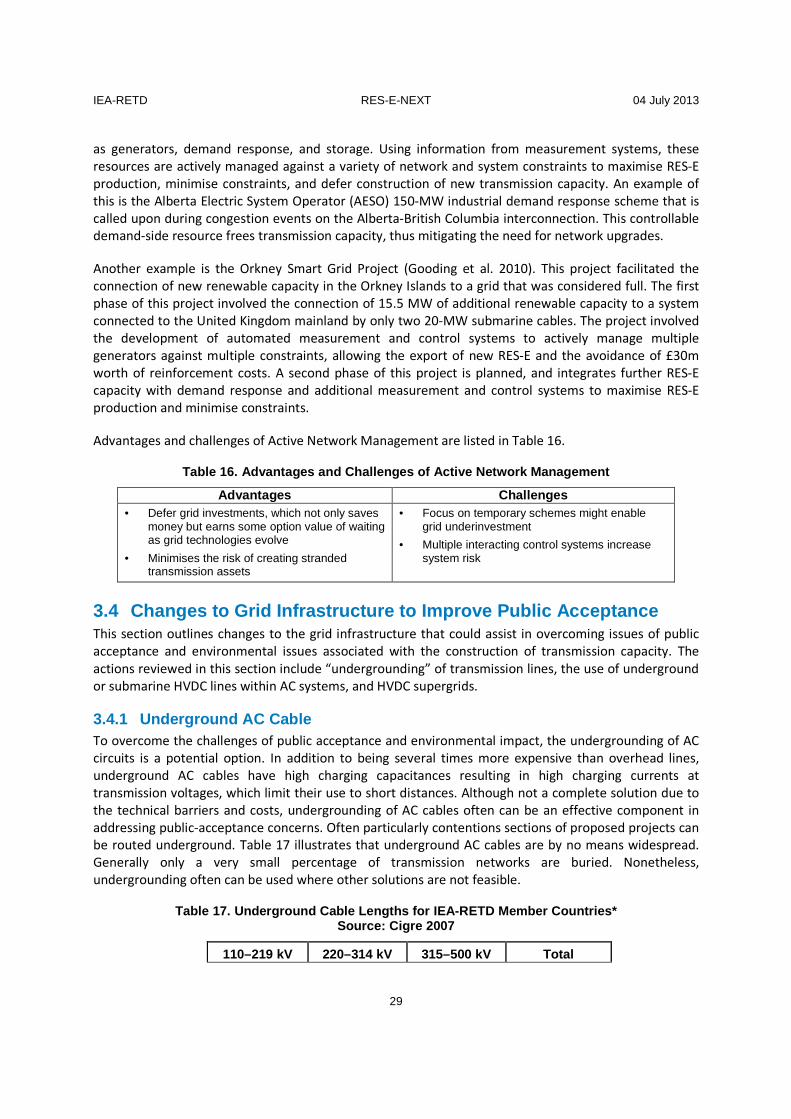
IEA-RETD RES-E-NEXT 04 July 2013
29
as generators, demand response, and storage. Using information from measurement systems, these resources are actively managed against a variety of network and system constraints to maximise RES-E production, minimise constraints, and defer construction of new transmission capacity. An example of this is the Alberta Electric System Operator (AESO) 150-MW industrial demand response scheme that is called upon during congestion events on the Alberta-British Columbia interconnection. This controllable demand-side resource frees transmission capacity, thus mitigating the need for network upgrades.
Another example is the Orkney Smart Grid Project (Gooding et al. 2010). This project facilitated the connection of new renewable capacity in the Orkney Islands to a grid that was considered full. The first phase of this project involved the connection of 15.5 MW of additional renewable capacity to a system connected to the United Kingdom mainland by only two 20-MW submarine cables. The project involved the development of automated measurement and control systems to actively manage multiple generators against multiple constraints, allowing the export of new RES-E and the avoidance of £30m worth of reinforcement costs. A second phase of this project is planned, and integrates further RES-E capacity with demand response and additional measurement and control systems to maximise RES-E production and minimise constraints.
Advantages and challenges of Active Network Management are listed in Table 16.
Table 16. Advantages and Challenges of Active Netwo rk Management
Advantages Challenges • Defer grid investments, which not only saves
money but earns some option value of waiting as grid technologies evolve
• Minimises the risk of creating stranded transmission assets
• Focus on temporary schemes might enable grid underinvestment
• Multiple interacting control systems increase system risk
3.4 Changes to Grid Infrastructure to Improve Publi c Acceptance This section outlines changes to the grid infrastructure that could assist in overcoming issues of public acceptance and environmental issues associated with the construction of transmission capacity. The actions reviewed in this section include “undergrounding” of transmission lines, the use of underground or submarine HVDC lines within AC systems, and HVDC supergrids.
3.4.1 Underground AC Cable To overcome the challenges of public acceptance and environmental impact, the undergrounding of AC circuits is a potential option. In addition to being several times more expensive than overhead lines, underground AC cables have high charging capacitances resulting in high charging currents at transmission voltages, which limit their use to short distances. Although not a complete solution due to the technical barriers and costs, undergrounding of AC cables often can be an effective component in addressing public-acceptance concerns. Often particularly contentions sections of proposed projects can be routed underground. Table 17 illustrates that underground AC cables are by no means widespread. Generally only a very small percentage of transmission networks are buried. Nonetheless, undergrounding often can be used where other solutions are not feasible.
Table 17. Underground Cable Lengths for IEA-RETD Me mber Countries* Source: Cigre 2007
110–219 kV 220–314 kV 315–500 kV Total

IEA-RETD RES-E-NEXT 04 July 2013
30
Country Cable (km)
OHL** (km)
Cable (km)
OHL (km)
Cable (km)
OHL (km)
Cable (km)
OHL (km)
% Underground
Cable
Canada 398 24,342 153 19,786 16 12,847 567 56,975 1.0%
Denmark 515 3650 0 55 52 1300 567 5,005 10.2%
France 1 1064 903 25,416 2 21,007 906 47,487 1.9%
Germany 4,972 76,630 45 26,790 65 18,200 5,082 12,1620 4.0%
Ireland 171 4,643 106 1723 0 438 277 6,804 3.9%
Japan 1,769 34,732 1,440 20,594 123 15,879 3,332 71,205 4.5%
The Netherlands 1,068 5,495 6 677 7 1,997 1,081 8,169 11.7%
United Kingdom 2,967 23,192 496 6,321 166 11,122 3,629 40,635 8.2%
* Data for Norway was unavailable.
** OHL = overhead line
Notably, Denmark and the Netherlands have used underground AC cable at rates in excess of 10%. This is driven by the Dutch government’s stipulation in its “Third Electricity Supply Structure Plan” that there should be no increase in the total length of overhead lines having voltages of 110 kV and greater. Further, Denmark has committed to a significant high-voltage transmission system undergrounding policy (Cochran et al. 2012; EnerginetDK 2008). Of note, both the Dutch and Danish systems are spatially small, meaning that undergrounding AC lines is somewhat less challenging than it is for systems with much greater distances to span.
Advantages and challenges of underground AC cables are listed in Table 18.
Table 18. Advantages and Challenges of Underground AC Cables
Advantages Challenges • Low visual impact
• Minimal public-acceptance issues
• Potentially faster implementation
• High cost
• Limited to short distances
3.4.2 High-Voltage Direct Current Transmission High-voltage direct current (HVDC) technology involves the conversion of alternating current (AC) to direct current (DC) using power electronic converter stations, the transmission of power over high-voltage overhead lines and underground cables, and conversion of current back to AC at the other end (Figure 4). This method generally is used for bulk power transmission, interconnections, or undersea cables.
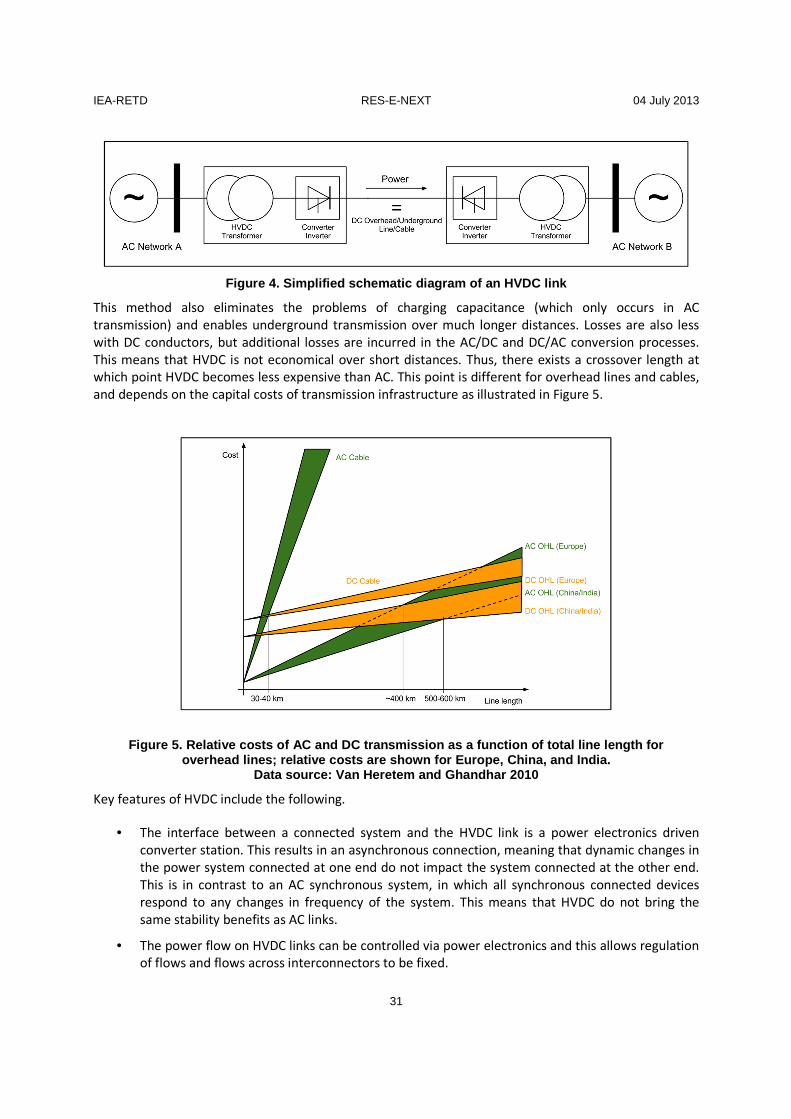
IEA-RETD RES-E-NEXT 04 July 2013
31
Figure 4. Simplified schematic diagram of an HVDC l ink
This method also eliminates the problems of charging capacitance (which only occurs in AC transmission) and enables underground transmission over much longer distances. Losses are also less with DC conductors, but additional losses are incurred in the AC/DC and DC/AC conversion processes. This means that HVDC is not economical over short distances. Thus, there exists a crossover length at which point HVDC becomes less expensive than AC. This point is different for overhead lines and cables, and depends on the capital costs of transmission infrastructure as illustrated in Figure 5.
Figure 5. Relative costs of AC and DC transmission as a function of total line length for overhead lines; relative costs are shown for Europe , China, and India.
Data source: Van Heretem and Ghandhar 2010
Key features of HVDC include the following.
• The interface between a connected system and the HVDC link is a power electronics driven converter station. This results in an asynchronous connection, meaning that dynamic changes in the power system connected at one end do not impact the system connected at the other end. This is in contrast to an AC synchronous system, in which all synchronous connected devices respond to any changes in frequency of the system. This means that HVDC do not bring the same stability benefits as AC links.
• The power flow on HVDC links can be controlled via power electronics and this allows regulation of flows and flows across interconnectors to be fixed.

IEA-RETD RES-E-NEXT 04 July 2013
32
• HVDC underground cables can be run for much longer lengths than AC cables.
In areas where public acceptance is a prohibitive issue or suitable corridors for overhead lines cannot be secured, underground or submarine HVDC cables can be a solution for bulk power transmission. HVDC circuits can be used to support the underlying AC systems thereby increasing the overall power transmission capacity. Figure 6 shows the so-called “bootstrap” in the United Kingdom (Westernlink 2012). This aim of this project is to reinforce the heavily congested North-South corridor with a submarine HVDC link from Scotland to Wales and England. Construction began in 2013 with completion expected in 2015.
Advantages and challenges of HVDC Connections are listed in Table 19.
Figure 6. HVDC link from Scotland to Wales and Engl and; adapted from http://www.westernhvdclink.co.uk
Table 19. Advantages and Challenges of HVDC Connect ions
Advantages Challenges • Low visual impact (if underground)
• Minimised visual impact (if aboveground)
• Reduced public-acceptance issues
• Alleviation of system constraints
• Control capabilities of converters can be used to improve dynamic stability
• High costs over short distances
• Challenging HVDC technology at higher power and voltage levels; not all effects can be predicted
3.4.3 HVDC Supergrid The HVDC supergrid extends the concept of the HVDC link to a network of potentially interconnected HVDC links. This concept has been proposed mainly in the context of creating HVDC networks for the interconnection of off-shore wind farms and cross-border interconnections.

IEA-RETD RES-E-NEXT 04 July 2013
33
A major obstacle to HVDC-meshed networks has been the lack of an HVDC breaker that can safely interrupt high DC currents. Alternating current has the convenient feature of passing through a zero-current point once each cycle, which enables a “safe” interruption with minimum impact. Direct current does not have this characteristic; thus, for an interruption to occur safely, any DC link first must be disconnected from the AC side of the converter. This is acceptable for point-to-point DC links but likely unacceptable for DC networks, as it means de-energising the whole network if a fault affects any of the lines. As of early 2013, major manufacturers claim to have developed high voltage DC circuit breakers, yet the HVDC breaker is not yet available commercially and remains a new and largely untested technology.
Advantages and challenges of the HVDC supergrid concept are listed in Table 20.
Table 20. Advantages and Challenges of the HVDC Sup ergrid
Advantages Challenges • Low visual impact (if underground)
• Minimised visual impact (if above ground)
• Reduced public-acceptance issues
• Increased interconnection
• Alleviation of system constraints
• Allows increased deployment of RES-E, especially offshore
• High costs
• Developing, unproven technology
• Increased system risk and reduced system stability
• Increased operational complexity
• Lack of political support
• Inability to finance the large investment
3.5 The Role of Grid Infrastructure in Ensuring Rel iability This section highlights aspects of grid reliability that, if left unaddressed, could significantly limit the system’s amount of renewable generation. Much work in this area is recent and the issues encountered in one system might not manifest in another. Nonetheless, the experiences noted here do serve as indications of issues that could arise in RES-E high-penetration scenarios.
3.5.1 Ensuring System Inertia and Dynamic Stability In small or islanded synchronous systems—such as Ireland, Great Britain, and Texas—issues of dynamic stability could limit the instantaneous penetration of wind and solar PV8 power, and thus limit the effective penetration of RES-E and increase the costs of meeting RES-E targets (EirGrid 2010). It should be emphasised that, in this section, “penetration” refers to penetration of RES-E in the whole interconnection, not just in one area or country within the interconnection. The problems discussed here therefore might not limit penetration of RES-E in Denmark, for example, which forms only a small part of the main European interconnection.
Although much literature is devoted to balancing costs and managing congestion, in the near term these issues are not likely to fundamentally limit the amount of RES-E that can be accommodated on power systems. Closer examination of the engineering fundamentals is required to understand those issues that do have the potential to limit the amount of variable RES-E that can be accommodated on power grids. This is because power system operation traditionally is based around the synchronous generators used in conventional power stations (e.g., hydro, nuclear, thermal). Most wind farms are connected asynchronously to the system by means of induction generators, and photovoltaic cells (PVs) are
8 Wind and solar PV have similar impacts but in terms of solutions the kinetic energy stored in the rotating masses of the wind turbines could provide solutions that solar PV cannot (Doherty et al. 2010; Ruttledge et al. 2012).

IEA-RETD RES-E-NEXT 04 July 2013
34
connected to the grid by power-electronic DC-AC inverters. This change in the fundamental characteristics of generation technology results in reduced power system inertia. Wind turbines, at best, are weakly coupled to the grid and PV inverters have no inertia. Maintaining adequate system inertia is necessary for frequency control—maintaining stable power system operation following a sudden and unexpected loss of a large power in-feed (a power station or interconnector). There exist some mitigation measures for inadequate system inertia—for example wind turbines or interconnectors capable of providing “synthetic inertia”—but these are in the research stage and have not been thoroughly tested (the needs for this and other such services are discussed in Section 2).
The other main issue of concern is dynamic stability, as variable RES-E generation equipment—especially doubly fed induction generators (DFIG) and PV inverters—react differently than synchronous generators to power system disturbances. A related and well-known issue identified about 10 years ago was the inability of wind farms to continue production through a voltage drop following a network short-circuit. In response, all modern wind farms are now required to be equipped with the so-called “fault ride through capability.” These dynamic stability issues are likely to present themselves sooner in small systems with large amounts of variable asynchronous generation, such as Ireland’s system and other small island systems.
In 2010, EirGrid commissioned a series of studies examining the system stability impacts of up to 100% instantaneous-penetration levels of wind power. More than 60 individual combinations of instantaneous wind power, demand level, imports, and exports were considered and more than 8,000 individual simulations were performed to investigate frequency stability, voltage stability, and dynamic rotor-angle stability of the system.
In Figure 7, the green area represents areas of operation where no issues were identified. The orange area represents ranges of operating points where issues were identified and mitigation measures were identified. The red area represents ranges of operating points in which fundamental stability issues were identified and the only known solutions involve radical untested operational strategies.

IEA-RETD RES-E-NEXT 04 July 2013
35
Figure 7. Simplified results from EirGrid's All-Isl and Facilitation of Renewables Studies; points on the graph represent system operating poin ts defined in terms of
load plus exports and wind plus imports. Source: Ei rGrid 2010
The studies concluded that the main issues limiting the instantaneous penetration of wind power are frequency stability and dynamic stability. In the case of frequency stability, disconnection of wind farms for rates of change of frequency in excess of 0.5Hz/s posed a material threat to the stability of the system. In the case of dynamic stability, a reactive current injection from wind farms during a fault could mitigate the issue substantially.
In general, it was found that the system could be operated safely up to 50% instantaneous penetration of wind power but that, beyond this level, actions are required to ensure the stability of the system. These actions include revising protection policies, such that wind generation and conventional generation remain connected for rates of change of frequency in excess of 0.5Hz/s and mandating that a reactive current injection come from wind farms during a fault.
It should be emphasised that the challenges discussed here currently are relevant only for smaller isolated systems—such as Ireland, Great Britain, and Texas—that have high penetration of RES-E. Countries or areas—such as Denmark—that are part of large AC interconnections that have a large fleet of synchronous generators will not be affected to the same extent.
3.5.2 Supporting Stability and Control Through Grid Codes and Standards Grid codes (known in North America as interconnection standards) are the rules and standards that set out the requirements for any entity that connects to the grid. Historically, the unbundling of power systems led to a need to ensure the safe and secure operation of the power system. A set of transparent technical rules that clearly stated the expectations and requirements for all third-party-connected equipment was required. The initial appearance of wind turbines on power systems necessitated new
2000
3000
4000
5000
6000
7000
8000
0 1000 2000 3000 4000 5000 6000 7000 8000
Loa
d +
Ex
po
rts
(MW
)
Wind + HVDC Imports (MW)No operational issues identified Operational issues identified, mitigation measures identified Fundamental stability issues identified, untested solutions Scenario operating points
IEA-RETD RES-E-NEXT 04 July 2013
36
requirements, because turbines were a new technology with different capabilities and different impacts on the system. Early requirements were characterised by a do-no-harm approach; however, this wasn’t always achieved. The proliferation of wind turbines and new RES-E technologies in general has necessitated a transition to requirements that reflect the need for RES-E technologies to participate in power-system stability and control.
In the past few years, many new requirements have appeared in grid codes for RES-E technologies. The nature, extent, and formulation of these requirements, however, in many cases have been ambiguous, disparate, and inconsistent. It is not within the scope of this report to evaluate these efforts or to provide specific requirements for grid codes for a range of countries with different characteristics, but some general recommendations can be drawn from recent experience. There has been a push for harmonizing requirements, most notably the program created by the European Network of Transmission Operators (ENTSO-E) to develop a harmonised set of grid code requirements for all the systems of Europe (ENTSO-E 2012). Although this attempts to achieve uniformity in the nature and formulation of requirements, it still permits significant parameterisation to allow for different requirements that reflect the specific needs of particular systems.
The ENTSO-E work referenced above and other work (e.g., EirGrid 2010; EirGrid 2011; ECAR, AEMO 2011), reinforce the general need to move toward requirements which reflect the need for RES-E technologies to participate in system stability and control, for example, providing a reactive current injection to support the system during a fault.
3.6 Conclusions and Recommendations for Ensuring Gr id Capacity This section presents key conclusions drawn from international grid-development issues associated with increased RES-E penetration levels.
• Some degree of centralised coordination has been shown to be successful for transmission
network development. In particular, the CREZ approach in Texas has proven to be a very effective program, with 40% of necessary grid build occurring in fewer than four years. There are questions regarding its replicability in other systems, however. The Irish Gate system is another effective model that centralises responsibility for grid-development planning for a target level of renewables, but without predicating project locations.
• Public-acceptance issues have the potential to significantly delay transmission development projects. Emerging social, political, and technology measures can help reduce this risk.
o Active stakeholder engagement, such as that employed in the development of CREZ plans, allows public concerns to be considered at an early stage of the program. This enables the risks to be managed and mitigations to be identified.
o Undergrounding or partial undergrounding of new AC circuits is an option for minimizing opposition to development and reducing lead times. Undergrounding of new high-voltage circuits is standard policy in some countries (e.g., Denmark the Netherlands). There exist technical factors that limit underground sections of high-voltage AC circuits to short lengths.
o HVDC “bootstrapping,” as seen with the Westernlink project linking Scotland to England and Wales, can be an option for reinforcing networks where the development of overhead AC lines is not possible and (due to public acceptance and other issues such as the distances involved) undergrounding is not possible.

IEA-RETD RES-E-NEXT 04 July 2013
37
• Improved congestion-management practices are important complements to grid extension. Locational pricing is used successfully in North American markets to manage congestion and allocate costs; however, there is significant resistance to adoption of this approach in parts of Europe.
• Deferral of grid investment creates immediate value (money isn’t spent) as well as option
value (allowing new grid technologies to emerge). A number of effective technology solutions exist which can avoid or defer investment in additional network capacity, including the following.
o Dynamic line rating technology can release additional network capacity that is realised by more accurate knowledge of ambient conditions.
o Special protection schemes in some cases can automate corrective system actions making additional circuits unnecessary, but at the expense of additional system risk (which must be evaluated).
o Active network management techniques that can make use of dynamic pricing, demand response, and storage to alleviate network constraints are effective in reducing congestion levels.
Together, the approaches discussed above can reduce the likelihood that grid constraints will impede the growth of variable RES-E generation. The specific policy and regulatory strategies to incentivise these approaches vary by context, but together this array of approaches can help eliminate barriers to securing grid infrastructure.
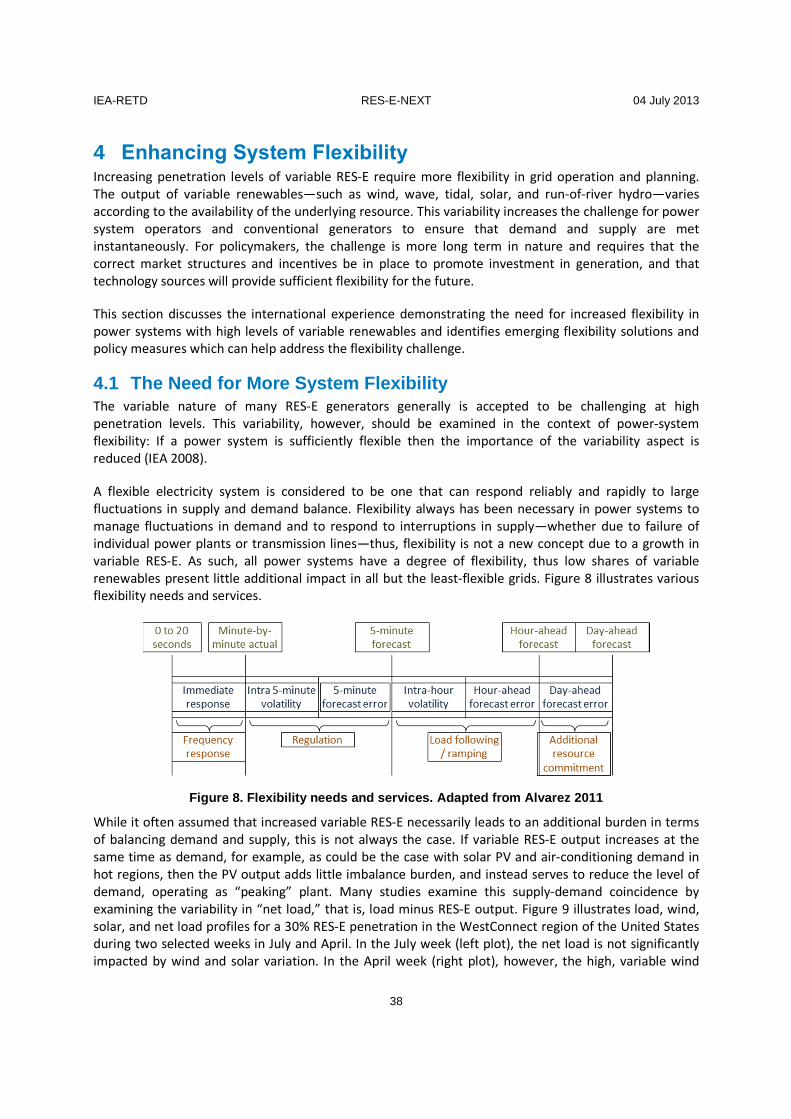
IEA-RETD RES-E-NEXT 04 July 2013
38
4 Enhancing System Flexibility Increasing penetration levels of variable RES-E require more flexibility in grid operation and planning. The output of variable renewables—such as wind, wave, tidal, solar, and run-of-river hydro—varies according to the availability of the underlying resource. This variability increases the challenge for power system operators and conventional generators to ensure that demand and supply are met instantaneously. For policymakers, the challenge is more long term in nature and requires that the correct market structures and incentives be in place to promote investment in generation, and that technology sources will provide sufficient flexibility for the future.
This section discusses the international experience demonstrating the need for increased flexibility in power systems with high levels of variable renewables and identifies emerging flexibility solutions and policy measures which can help address the flexibility challenge.
4.1 The Need for More System Flexibility The variable nature of many RES-E generators generally is accepted to be challenging at high penetration levels. This variability, however, should be examined in the context of power-system flexibility: If a power system is sufficiently flexible then the importance of the variability aspect is reduced (IEA 2008).
A flexible electricity system is considered to be one that can respond reliably and rapidly to large fluctuations in supply and demand balance. Flexibility always has been necessary in power systems to manage fluctuations in demand and to respond to interruptions in supply—whether due to failure of individual power plants or transmission lines—thus, flexibility is not a new concept due to a growth in variable RES-E. As such, all power systems have a degree of flexibility, thus low shares of variable renewables present little additional impact in all but the least-flexible grids. Figure 8 illustrates various flexibility needs and services.
Figure 8. Flexibility needs and services. Adapted from Alvarez 2011
While it often assumed that increased variable RES-E necessarily leads to an additional burden in terms of balancing demand and supply, this is not always the case. If variable RES-E output increases at the same time as demand, for example, as could be the case with solar PV and air-conditioning demand in hot regions, then the PV output adds little imbalance burden, and instead serves to reduce the level of demand, operating as “peaking” plant. Many studies examine this supply-demand coincidence by examining the variability in “net load,” that is, load minus RES-E output. Figure 9 illustrates load, wind, solar, and net load profiles for a 30% RES-E penetration in the WestConnect region of the United States during two selected weeks in July and April. In the July week (left plot), the net load is not significantly impacted by wind and solar variation. In the April week (right plot), however, the high, variable wind
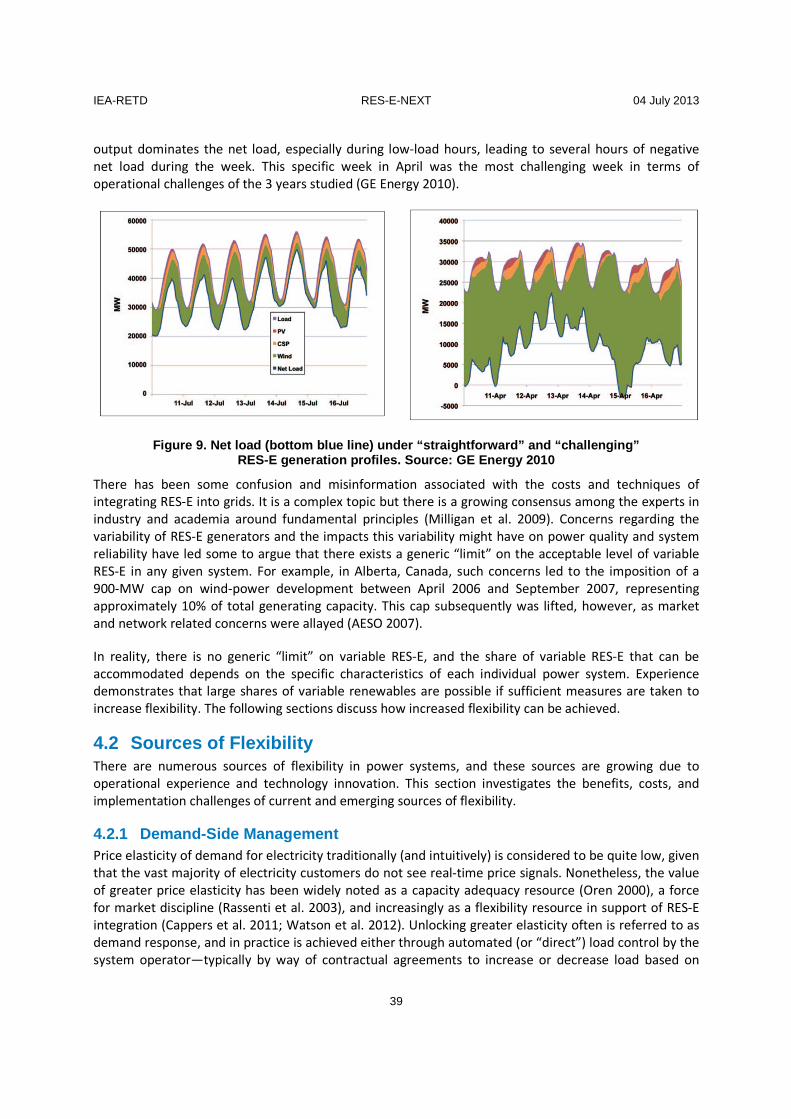
IEA-RETD RES-E-NEXT 04 July 2013
39
output dominates the net load, especially during low-load hours, leading to several hours of negative net load during the week. This specific week in April was the most challenging week in terms of operational challenges of the 3 years studied (GE Energy 2010).
Figure 9. Net load (bottom blue line) under “straig htforward” and “challenging” RES-E generation profiles. Source: GE Energy 2010
There has been some confusion and misinformation associated with the costs and techniques of integrating RES-E into grids. It is a complex topic but there is a growing consensus among the experts in industry and academia around fundamental principles (Milligan et al. 2009). Concerns regarding the variability of RES-E generators and the impacts this variability might have on power quality and system reliability have led some to argue that there exists a generic “limit” on the acceptable level of variable RES-E in any given system. For example, in Alberta, Canada, such concerns led to the imposition of a 900-MW cap on wind-power development between April 2006 and September 2007, representing approximately 10% of total generating capacity. This cap subsequently was lifted, however, as market and network related concerns were allayed (AESO 2007).
In reality, there is no generic “limit” on variable RES-E, and the share of variable RES-E that can be accommodated depends on the specific characteristics of each individual power system. Experience demonstrates that large shares of variable renewables are possible if sufficient measures are taken to increase flexibility. The following sections discuss how increased flexibility can be achieved.
4.2 Sources of Flexibility There are numerous sources of flexibility in power systems, and these sources are growing due to operational experience and technology innovation. This section investigates the benefits, costs, and implementation challenges of current and emerging sources of flexibility.
4.2.1 Demand-Side Management Price elasticity of demand for electricity traditionally (and intuitively) is considered to be quite low, given that the vast majority of electricity customers do not see real-time price signals. Nonetheless, the value of greater price elasticity has been widely noted as a capacity adequacy resource (Oren 2000), a force for market discipline (Rassenti et al. 2003), and increasingly as a flexibility resource in support of RES-E integration (Cappers et al. 2011; Watson et al. 2012). Unlocking greater elasticity often is referred to as demand response, and in practice is achieved either through automated (or “direct”) load control by the system operator—typically by way of contractual agreements to increase or decrease load based on

IEA-RETD RES-E-NEXT 04 July 2013
40
signals from the system operator—or through voluntary response to price signals. The former class of methods (direct load control and contractual agreements) are well established in the United Kingdom (e.g., National Grid Short Term Operating Reserves), Canada (e.g., Alberta’s Load Shed Service for Imports), and in various Regional Transmission Organisations (RTOs) in the United States, but operate mainly as an emergency (i.e., peak shaving) resource. Such programs increasingly are under active con-sideration to serve as flexibility resources for RES-E integration (Navigant 2012). They also are the focus of many research and demonstration projects in North America, Europe, and Japan.9
Demand flexibility has been demonstrated as a RES-E integration resource in the ERCOT system in Texas, where approximately 207 industrial customers (representing up to 2.5 GW of load resources) currently participate in the ancillary services markets (Wattles 2012). ERCOT does not currently allow load resources to submit offers into the real-time Security Constrained Economic Dispatch system, but is evaluating a modification whereby loads with certain performance characteristics could participate by submitting locational marginal prices and being dispatched based on their opportunity cost (Wattles 2011). Such real-time participation would further increase demand-side participation in faster flexibility operations that could increase under greater penetration levels of variable RES-E (Kirby et al. 2011).
Depending upon the specific type of demand-side management, capital costs can be significantly less than storage costs. Table 23 illustrates a recent estimate of cost differential.
Table 23. Average Demand Response Costs Compared to Average Grid-Scale Battery Costs (Watson et al. 201 2)
Grid-Scale Battery Technology
Demand Response Costs Compared to Various Grid-Scale Battery Costs
DR Cost* €/kW ($/kW)
Battery Cost ** €/kW ($/kW)
DR Cost of Battery (% cost)
Lithium-Ion High Power €177 ($230) €1,577 ($2,050) 11%
Advanced Lead Acid €177 ($230) €1,615 ($2,100) 11%
Lithium-Ion High Energy €177 ($230) €2,115 ($2,750) 8%
Vanadium Redox Battery €177 ($230) €1,827 ($2,375) 10%
Zinc Bromine €177 ($230) €1,250 ($1,625) 14%
Sodium Sulfur (NaS) €177 ($230) €2,692 ($3,500) 7%
Zinc-Air Battery €177 ($230) €2,019 ($2,625) 9%
* DR (demand response) cost = Deployed cost of demand response, average (Wikler et al. 2009) ** Battery costs = Deployed cost, average (Seto 2010)
Cost considerations aside, key operational differences between demand response (DR) and storage reside in the level of certainty about the rapidity of response, verifiability, and replicability. Industrial and commercial loads currently are the main sources of fast-acting demand response resources, due to their magnitude and controllability. Most of the various RTOs in the United States, especially PJM, ERCOT, ISO-NE, and CAISO, have large and active market participation by such customers (Brattle Group 2011). As a flexibility resource, demand response must meet stringent requirements regarding response time, minimum magnitude, reliability, and verifiability, all of which limit the overall magnitude of
9 See, e.g., http://www.eirgrid.com/operations/ds3/ (accessed June 4, 2013) and http://www.cee.dtu.dk/English/ research/projects/30_iPower.aspx (accessed June 4, 2013).

IEA-RETD RES-E-NEXT 04 July 2013
41
available DR potential. These requirements vary by jurisdiction, but typically are driven by the performance specifications of conventional non-spinning reserves, spinning reserves, regulation up and down, and other ancillary services. Table 24 illustrates some typical end-uses, ramp-down processes, and response-time capabilities.
Table 24. Sources of Commercial and Industrial Dema nd Response and Typical Response Times (Watson et al. 2012)
End Use Type Ramp Down Switching Off Response Time
Heating, Ventilation, and Air Conditioning
Chiller Systems Setpoint Adjustment 15 min.
Package Unit Setpoint Adjustment Disable
Compressors 5 sec. to 5 min.
Lighting Dimmable Reduce Lighting
Levels 5 sec. to 5 min.
On/Off Bi-Level/Off 5 sec. to 5 min.
Refrigerated/Frozen Warehouse Setpoint Adjustment 15 min.
Data Centres Setpoint Adjustment,
Reduce CPU Processing
15 min.
Agricultural Pumping
Turn Off Selected Pumps 5 sec. to 5 min.
Wastewater Turn Off Selected Pumps
5 sec. to 5 min.
Although commercial and industrial loads represent a current area of focus for providing rapid, ancillary service-type flexibility, residential and small commercial loads represent another, less mature option—albeit potentially much greater in aggregate capacity terms than that of commercial and industrial loads. By displaying price signals to consumers, it is anticipated that discretionary load could be voluntarily moved to off-peak price periods, potentially providing flexibility to the constrained electricity system.
Even though greater in the aggregate, from a system-operation perspective, residential loads present more uncertainty regarding response time, reliability, and replicability. Aggregation (e.g., via a third-party energy service vendor) is one likely solution to this problem, but has transaction costs to market, contract, and effectively control loads. Policy and regulation play an important role in supporting the business case for demand response aggregation.
Millions of smart-metering installations have been rolled out in a number of countries with varying effects, opening up the potential for access to these demand-side resources for power system flexibility. Table 25 illustrates high-level smart-meter deployment figures across the IEA-RETD member countries.
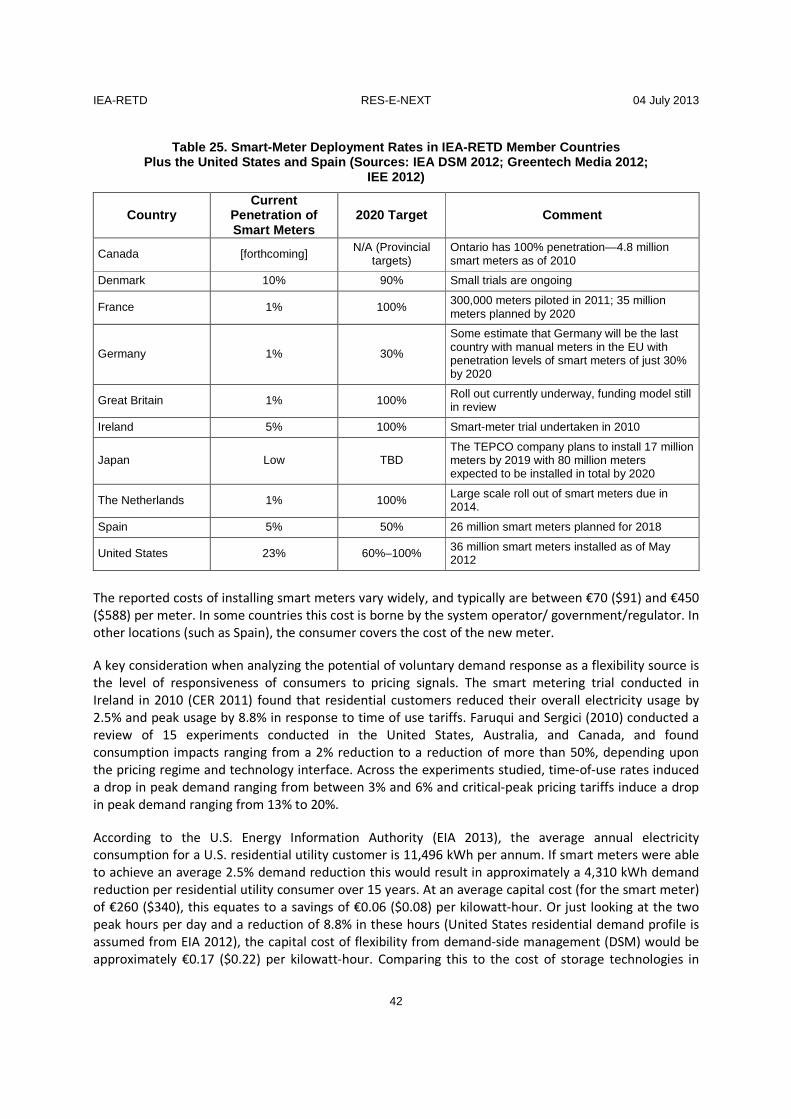
IEA-RETD RES-E-NEXT 04 July 2013
42
Table 25. Smart-Meter Deployment Rates in IEA-RETD Member Countries Plus the United States and Spain (Sources: IEA DSM 2012; Greentech Media 2012;
IEE 2012)
Country Current
Penetration of Smart Meters
2020 Target Comment
Canada [forthcoming] N/A (Provincial targets)
Ontario has 100% penetration—4.8 million smart meters as of 2010
Denmark 10% 90% Small trials are ongoing
France 1% 100% 300,000 meters piloted in 2011; 35 million meters planned by 2020
Germany 1% 30%
Some estimate that Germany will be the last country with manual meters in the EU with penetration levels of smart meters of just 30% by 2020
Great Britain 1% 100% Roll out currently underway, funding model still in review
Ireland 5% 100% Smart-meter trial undertaken in 2010
Japan Low TBD The TEPCO company plans to install 17 million meters by 2019 with 80 million meters expected to be installed in total by 2020
The Netherlands 1% 100% Large scale roll out of smart meters due in 2014.
Spain 5% 50% 26 million smart meters planned for 2018
United States 23% 60%–100% 36 million smart meters installed as of May 2012
The reported costs of installing smart meters vary widely, and typically are between €70 ($91) and €450 ($588) per meter. In some countries this cost is borne by the system operator/ government/regulator. In other locations (such as Spain), the consumer covers the cost of the new meter.
A key consideration when analyzing the potential of voluntary demand response as a flexibility source is the level of responsiveness of consumers to pricing signals. The smart metering trial conducted in Ireland in 2010 (CER 2011) found that residential customers reduced their overall electricity usage by 2.5% and peak usage by 8.8% in response to time of use tariffs. Faruqui and Sergici (2010) conducted a review of 15 experiments conducted in the United States, Australia, and Canada, and found consumption impacts ranging from a 2% reduction to a reduction of more than 50%, depending upon the pricing regime and technology interface. Across the experiments studied, time-of-use rates induced a drop in peak demand ranging from between 3% and 6% and critical-peak pricing tariffs induce a drop in peak demand ranging from 13% to 20%.
According to the U.S. Energy Information Authority (EIA 2013), the average annual electricity consumption for a U.S. residential utility customer is 11,496 kWh per annum. If smart meters were able to achieve an average 2.5% demand reduction this would result in approximately a 4,310 kWh demand reduction per residential utility consumer over 15 years. At an average capital cost (for the smart meter) of €260 ($340), this equates to a savings of €0.06 ($0.08) per kilowatt-hour. Or just looking at the two peak hours per day and a reduction of 8.8% in these hours (United States residential demand profile is assumed from EIA 2012), the capital cost of flexibility from demand-side management (DSM) would be approximately €0.17 ($0.22) per kilowatt-hour. Comparing this to the cost of storage technologies in
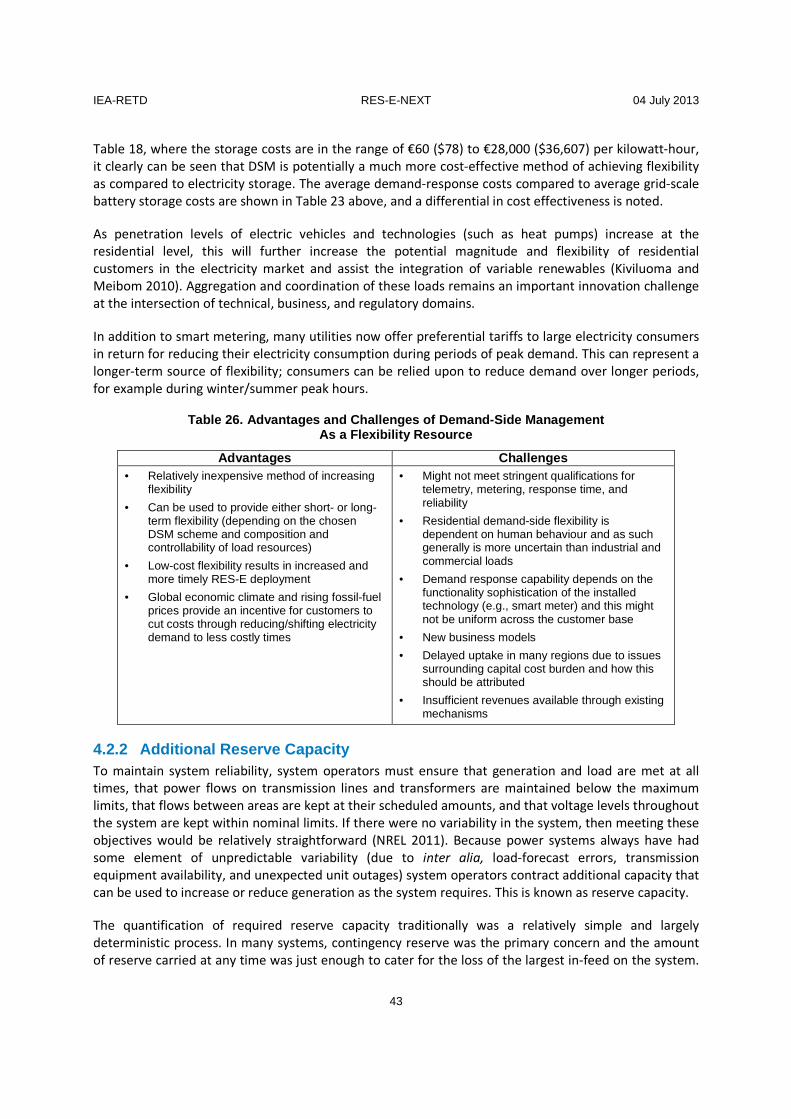
IEA-RETD RES-E-NEXT 04 July 2013
43
Table 18, where the storage costs are in the range of €60 ($78) to €28,000 ($36,607) per kilowatt-hour, it clearly can be seen that DSM is potentially a much more cost-effective method of achieving flexibility as compared to electricity storage. The average demand-response costs compared to average grid-scale battery storage costs are shown in Table 23 above, and a differential in cost effectiveness is noted.
As penetration levels of electric vehicles and technologies (such as heat pumps) increase at the residential level, this will further increase the potential magnitude and flexibility of residential customers in the electricity market and assist the integration of variable renewables (Kiviluoma and Meibom 2010). Aggregation and coordination of these loads remains an important innovation challenge at the intersection of technical, business, and regulatory domains.
In addition to smart metering, many utilities now offer preferential tariffs to large electricity consumers in return for reducing their electricity consumption during periods of peak demand. This can represent a longer-term source of flexibility; consumers can be relied upon to reduce demand over longer periods, for example during winter/summer peak hours.
Table 26. Advantages and Challenges of Demand-Side Management As a Flexibility Resource
Advantages Challenges • Relatively inexpensive method of increasing
flexibility
• Can be used to provide either short- or long-term flexibility (depending on the chosen DSM scheme and composition and controllability of load resources)
• Low-cost flexibility results in increased and more timely RES-E deployment
• Global economic climate and rising fossil-fuel prices provide an incentive for customers to cut costs through reducing/shifting electricity demand to less costly times
• Might not meet stringent qualifications for telemetry, metering, response time, and reliability
• Residential demand-side flexibility is dependent on human behaviour and as such generally is more uncertain than industrial and commercial loads
• Demand response capability depends on the functionality sophistication of the installed technology (e.g., smart meter) and this might not be uniform across the customer base
• New business models
• Delayed uptake in many regions due to issues surrounding capital cost burden and how this should be attributed
• Insufficient revenues available through existing mechanisms
4.2.2 Additional Reserve Capacity To maintain system reliability, system operators must ensure that generation and load are met at all times, that power flows on transmission lines and transformers are maintained below the maximum limits, that flows between areas are kept at their scheduled amounts, and that voltage levels throughout the system are kept within nominal limits. If there were no variability in the system, then meeting these objectives would be relatively straightforward (NREL 2011). Because power systems always have had some element of unpredictable variability (due to inter alia, load-forecast errors, transmission equipment availability, and unexpected unit outages) system operators contract additional capacity that can be used to increase or reduce generation as the system requires. This is known as reserve capacity.
The quantification of required reserve capacity traditionally was a relatively simple and largely deterministic process. In many systems, contingency reserve was the primary concern and the amount of reserve carried at any time was just enough to cater for the loss of the largest in-feed on the system.
IEA-RETD RES-E-NEXT 04 July 2013
44
This approach does not guarantee a secure system at all times, but rather assumes any loss of supply greater than the largest in-feed is so infrequent that it is deemed unnecessary to carry extra reserve continuously. When such an event does occur, the system will have to shed some load. This simple approach to quantifying reserve needs has proven successful in many systems all over the world (NREL 2011).
As penetration levels of variable RES-E grow, however, there are concerns that the uncertain nature of the RES-E power output will mean that amounts greater than the largest in-feed are lost more frequently, as significant unpredicted RES-E variations can coincide with large generator trips or other system events. Thus, by carrying additional reserve capacity, there will be more flexibility in the system to deal with any unanticipated changes in RES-E output. The key is determining how much and what type of additional reserve is required with additional variable RES-E (Doherty and O’Malley 2005).
Systems differ in the types of resources they have available, the system load characteristics, the size and frequency response characteristics, and the transmission network. The philosophy on how each system operator deals with risk also can be quite different. As a result of these variances, system operators around the world have differing definitions for categories of reserves and the required capacity required in each category (NREL 2011).
4.2.2.1 Level of Additional Reserve—General Description
There is a common misconception that renewables need to be backed-up on a one-to-one reserve basis. This assumption is incorrect, however, for a number of reasons. As outlined in the Section, a variety of solutions can reduce the reserve requirements. Additionally, not all RES-E is unpredictable and variable. Biomass generation, for example, can be scheduled for operation in the market just like any other conventional unit. Thus, assuming that the biomass generator is not the largest in-feed on the system, it is unlikely that it will negatively impact required reserve capacity. Similarly, tidal generation is variable but is completely predictable. Thus it is unlikely to contribute to any additional reserve requirements.
4.2.2.2 Level of Additional Reserve—Research Review Some level of additional reserves will be required as levels of installed variable RES-E reach significant penetration levels. This amount varies by system, however, and it is incorrect to assume that every megawatt of variable RES-E must be matched by an additional megawatt of reserve capacity. NREL (2011) conducted a comprehensive review of international research on the impact of variable RES-E on operating reserves in both Europe and the United States.
The results varied from system to system, but the general conclusions were as follows.
• No additional contingency reserves (reserve providing instantaneous response) are required with increased penetration levels of variable RES-E, as the unpredictable variability of RES-E is not an issue in the time frame of contingency reserves.
• Additional capacity will be required in the categories of regulating, following, and ramping reserves as the penetration levels of variable RES-E increase. The level of estimated additional capacity required varies across studies, but in all cases is significantly less than a 1:1 relationship with variable RES-E penetration.
A summary of the research presented in NREL (2011) suggests that, for simulated results of a variety of wind penetration levels in various jurisdictions, the increase in required reserves is as follows. Regulation reserve requirements increase by between 0.4% and 3.43% of installed variable RES-E (i.e.,

IEA-RETD RES-E-NEXT 04 July 2013
45
an increase of 100 MW in installed wind increases regulation reserve requirements by 0.4 MW to 3.43 MW). Load following reserves increase by 0.2% to 11% of installed RES-E; and ramping reserve increases by 9% to 12% of installed RES-E. The ranges shown are due to differing methodologies employed and different definitions of reserve categories (in other words, a high requirement in one category for a particular system usually is combined with a lower requirement in another category). In sum, although there will be an increase in the requirement to carry some categories of reserve, for any given system the maximum estimated increase is approximately 12% to 15% in total of the installed level of RES-E.
4.2.2.3 Level of Additional Reserve—Cost
The cost of carrying reserves is based on a number of components: The level of required reserves; the source of the reserve capacity; and the manner in which the reserve is contracted (i.e., reserve market considerations). As shown above, although variable RES-E increases the requirement to carry reserve capacity in certain categories, the additional capacity required could be minimal. The cost of these additional reserves is very system specific, but has been estimated at approximately €1,500 ($1,961) to €3,500 ($4,576) per annum per megawatt installed of variable RES-E (Denny and O’Malley 2007; Morales et al. 2009). Also, if additional reserve can be provided by DSM rather than by storage or conventional units, then it could be achieved at lower cost.
Table 27. Advantages and Challenges of Carrying Add itional Reserve Capacity to Provide Flexibility
Advantages Challenges • System operators are experienced at
scheduling and calling on reserve capacity
• Increase in flexibility in the system which might improve overall system reliability
• Increased and more timely RES-E deployment
• Opportunities for conventional generators and DSM to capture increased revenues through reserve markets
• Additional system costs
• In countries with growing demand, it could require the construction of additional generation / storage capacity to meet increased reserve requirements
• It is unclear how additional reserve capacity should be incentivised and rewarded
• The lack of experience with high penetration levels of RES-E lead some commentators to dramatically overestimate the levels of required additional reserves
4.2.3 More Flexible Conventional Plant Flexibility on the power system also can be increased through the installation of more flexible conventional or dispatchable renewable generation or by altering the operation of existing plant. Flexible generation refers to units that can alter their output more rapidly in response to system requirements. This can entail being able to ramp-up/ramp-down output rapidly, to shut down/start up quickly, and to have lower minimum operating levels. Table 28, below, highlights the typical characteristics for a range of conventional generating units.
Table 28. Conventional Generation Characteristics Source: EurElectric 2011
Nuclear Coal Lignite CCGT Pumped Storage
Start-Up Time “Cold” ~ 40 hrs. ~ 6 hrs. ~ 10 hrs. < 2 hrs. ~ 0.1 hrs.
Start-Up Time “Warm” ~ 40 hrs. ~ 3 hrs. ~ 6 hrs. < 1.5 hrs. ~ 0.1 hrs.

IEA-RETD RES-E-NEXT 04 July 2013
46
Load Gradient “Nominal Output” ~ 5%/min. ~ 2%/min. ~ 2%/min. ~ 4%/min. > 40%/min.
Minimal Shutdown Time None None None None ~ 10 hrs.
Minimal Possible Load (% of Maximum Capacity) 50% 40% 40% < 50% ~ 15%
Beyond adding new flexible plant, there is accumulated international experience with retrofitting conventional thermal generators and altering operating procedures so as to increase flexibility. Ontario Power Generation has significant operational experience retrofitting and running formerly base-load coal plants into both load-following and “super-peaker” modes. Various 500-MW coal plants near Lake Erie can dramatically reduce their minimum loads to 80 MW to 90 MW (less than 20% of nameplate capacity), allowing for far greater flexibility than a traditional legacy plant. Furthermore, these plants are regularly shut down and restarted once or even twice per day (“two-shifting” and “four-shifting,” respectively). The costs of transitioning these plants are substantial but not prohibitive for a typical generation owner (Ontario Power Generation 2013). 10 This experience suggests that significant additional flexibility can be derived from conventional generators already in place.
In addition to large-scale generating units providing flexibility, smaller-scale distributed generation such as micro–combined heat and power (CHP) units also could provide flexibility. Micro-CHP often is used by businesses and residential customers as a heating source. These CHP units could provide flexibility by increasing or decreasing heat output according to the needs of the electricity system.
Table 29. Advantages and Challenges of More Flexibl e Conventional Generation
Advantages Challenges • Utilises existing resources
• Can be constructed or accessed reasonably quickly
• Reliable flexibility source
• If the flexible generation units are not already installed on the system this could be an expensive method of increasing flexibility
• No consensus on how to appropriately design a market instrument to incentive investment in generation (flexible or otherwise) (discussed further in Section 5)
• Incentives for existing thermal plants could lead to excess retention of legacy generation
• Utilizing fossil generators in load-following or peaking role results in lower heat rates and potentially higher NOx and SOx emissions per kilowatt-hour
4.2.4 Changes in System Operation Practices Changes in system operation practices can unlock significant system flexibility, such as faster market operation and advanced methods of unit commitment.
10 Despite the flexibility of these coal stations, for environmental reasons Ontario has plans to phase out coal generation by 2014. http://www.scientificamerican.com/article.cfm?id=ontario-phases-out-coal-fired-power (accessed June 4, 2013).

IEA-RETD RES-E-NEXT 04 July 2013
47
4.2.4.1 Faster Market Operation and Shorter Gate Closure Time Intra-day centrally cleared markets that operate quickly, with 5-minute or 15-minute dispatch intervals, have demonstrated an ability to more quickly respond to changes in net load than markets with slower intraday dispatch (Corbus et al. 2010). By centrally dispatching the system in shorter increments, conventional generator ramping to balance the system and overall reserve requirements can be reduced. Furthermore, achieving system balancing through short intra-day market trading is more efficient than balancing in real time, as the latter typically relies heavily on more expensive conventional generators (Weber 2010).
Shorter gate-closure times in centrally dispatched markets also allow for shorter-term scheduling and thus reduce both load and RES-E generation forecast errors, allowing more accurate and efficient market operation. Generally, day-ahead wind forecasts have errors in the range of 15% to 20% mean absolute error (MAE) for a single wind plant, but these errors diminish dramatically nearing real-time operation. RES-E forecasts are not the only source of inefficiency that can be resolved by shorter gate closure. Hodge et al. (2013) also find that, in various large U.S. systems, day-ahead and two-day-ahead load forecasting errors do not follow a normal distribution, suggesting that generally there will be more frequent significant forecasting errors that occur than are assumed. Similar to wind forecast errors, load forecast errors can lead to under-committing of generating units in the day-ahead market, again leading to more expensive, fast-acting units having to come online during real-time operation. Whether due to load or RES-E variability, by reducing forecast errors in unit commitment, shorter gate-closure time has a general effect of reducing the costs of achieving flexibility.
As faster markets typically reward flexibility on both supply-side and demand-side resources, two complementary design elements are locational pricing and true scarcity pricing. Such designs strive toward principles of efficient electricity market design, in which bid-based, security-constrained, economic dispatch is paired with locational prices. Such markets are in operation in Australia and in various systems in the United States (PJM, NYISO, CAISO, ERCOT, MISO) and, to an extent, through zonal pricing in the Nordic countries in Europe. In such systems, prices for energy and ancillary services more accurately reflect the underlying physical flows within electricity systems (Hogan 2012). Locational (or “nodal”) pricing is discussed in more detail in Section 3.
Although shorter gate closer could provide a valuable source of flexibility in centrally dispatched markets, reducing gate-closure time is less suitable in a system with a prevalence of bilateral market arrangements, where re-dispatch often is required closer to real-time to manage system constraints. In Germany, for example, longer gate closure is required in the bilateral market because the TSO needs to pursue load-flow calculations, coordinate with neighboring TSOs, and pursue significant re-dispatch between gate-closure time and real-time to resolve transmission constraints. Thus, moving gate closure in a bilateral market closer to real-time would negatively impact the function of the re-dispatch mechanism and present potentially serious system security consequences.
4.2.4.2 Advanced Methods of Unit Commitment Unit commitment and economic dispatch are used in system operation and planning to determine which generators should be scheduled to meet the future demand at least cost, subject to generator constraints (such as maximum and minimum output levels) and system requirements (such as required reserve levels). Unit commitment requires sophisticated optimisation techniques, as decisions must be made about which units to switch on and, once operational, what output levels are optimal. These on/off and operating decisions can be complicated by factors such as minimum up-times and down-times for generators and the time required to restart a unit after shut down.

IEA-RETD RES-E-NEXT 04 July 2013
48
Recently, adaptations to the traditional unit-commitment paradigm have allowed the impacts of uncertainty to be assessed in addition to the impacts of variability only, which traditional methods already capture well. Two such adaptations are discussed below—dynamic reserve requirements and stochastic unit commitment.
4.2.4.3 Dynamic Reserve Requirements Unit commitment models can account for reserve requirements and schedule generation in such a way as to ensure that sufficient reserve is provided. As discussed in Section 4.2.3, variable RES-E increases the reserve requirement of the system. Conservative unit-commitment models simply increase the total reserve requirement at all hours as installed RES-E increases. A more efficient method is to have a dynamic reserve requirement that changes on an hour-to-hour basis as the level of RES-E output changes. This is known as dynamic reserve, and it can be incorporated into the unit-commitment modeling to provide a lower-cost dispatch (King et al. 2011; Kiviluoma et al. 2012). Dynamic calculation of reserves has the advantage that only as much reserve as is needed actually is carried. In contrast, increased static reserve requirements based on the worst-case scenario—or near worst case—can result in excess reserve being carried for much of the time.
4.2.4.4 Stochastic Unit Commitment Stochastic unit commitment differs from traditional unit commitment in that it considers the uncertainties associated with variable and unpredictable RES-E through the application of stochastic methods to the optimisation problem to better capture the uncertainty of future RES-E output and demand. One such example is the Wind Power Integration in Liberalised Electricity Markets (WILMAR) model described in Meibom et al. (2011). Rather than using a single RES-E forecast and demand forecast, the WILMAR model utilises a range of potential outcomes for RES-E output and demand—with associated probabilities—and decides how to operate the other generating units on the system accordingly. This generally results in a schedule that is more robust with respect to a range of possible future outcomes for RES-E output, rather than consideration of only one expected forecast (Tuohy and O’Malley 2009). This robustness makes the schedule more flexible.
The WILMAR model also allows for RES-E forecasts to be updated. This enables the model to reschedule generating units based on the most recent forecast data available. This approach can produce more flexible and cost-effective schedules. Statistical approaches such as this generally involve greater computation times due to the consideration of multiple scenarios.
4.2.5 Interconnection (Grid) Transmission and interconnection play a significant role with regard to flexibility. Transmission networks and interconnection allow greater aggregation of variable production resulting in reduced net variability. Networks also play a vital role in terms of accessing flexibility. These issues are discussed in greater detail in Section 3, Securing Grid Infrastructure.
4.2.6 Storage Storage is one of the most-cited technologies for its potential to increase flexibility on a grid (Elzinga et al. 2012). Electrical energy is stored when it is not needed in another form (e.g., chemical), and when there is excess renewable generation (i.e., when all necessary conventional generation on the system is running at minimum load during low-demand periods), or when prices are low or negative due to oversupply or line congestion. Later, energy is discharged when needed.
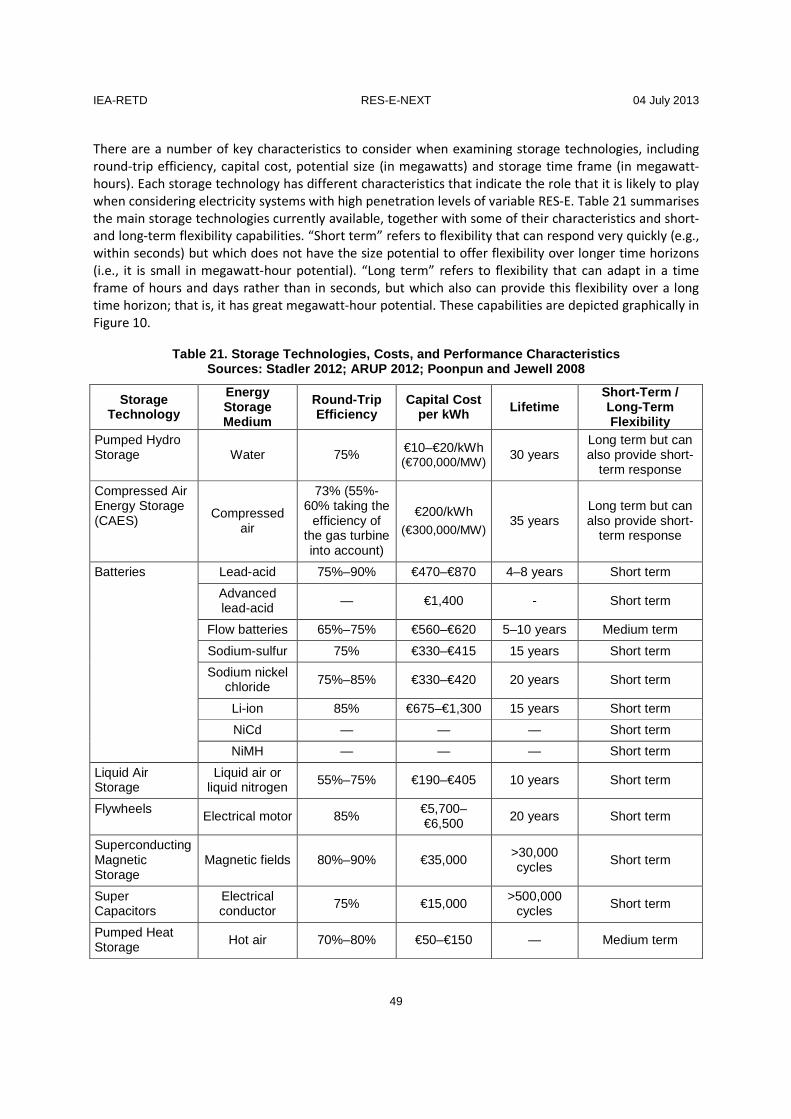
IEA-RETD RES-E-NEXT 04 July 2013
49
There are a number of key characteristics to consider when examining storage technologies, including round-trip efficiency, capital cost, potential size (in megawatts) and storage time frame (in megawatt-hours). Each storage technology has different characteristics that indicate the role that it is likely to play when considering electricity systems with high penetration levels of variable RES-E. Table 21 summarises the main storage technologies currently available, together with some of their characteristics and short- and long-term flexibility capabilities. “Short term” refers to flexibility that can respond very quickly (e.g., within seconds) but which does not have the size potential to offer flexibility over longer time horizons (i.e., it is small in megawatt-hour potential). “Long term” refers to flexibility that can adapt in a time frame of hours and days rather than in seconds, but which also can provide this flexibility over a long time horizon; that is, it has great megawatt-hour potential. These capabilities are depicted graphically in Figure 10.
Table 21. Storage Technologies, Costs, and Performa nce Characteristics Sources: Stadler 2012; ARUP 2012; Poonpun and Jewel l 2008
Storage Technology
Energy Storage Medium
Round-Trip Efficiency
Capital Cost per kWh Lifetime
Short -Term / Long-Term Flexibility
Pumped Hydro Storage Water 75% €10–€20/kWh
(€700,000/MW) 30 years Long term but can also provide short-
term response
Compressed Air Energy Storage (CAES)
Compressed air
73% (55%-60% taking the
efficiency of the gas turbine into account)
€200/kWh (€300,000/MW)
35 years Long term but can also provide short-
term response
Batteries Lead-acid 75%–90% €470–€870 4–8 years Short term
Advanced lead-acid — €1,400 - Short term
Flow batteries 65%–75% €560–€620 5–10 years Medium term
Sodium-sulfur 75% €330–€415 15 years Short term
Sodium nickel chloride 75%–85% €330–€420 20 years Short term
Li-ion 85% €675–€1,300 15 years Short term
NiCd — — — Short term
NiMH — — — Short term
Liquid Air Storage
Liquid air or liquid nitrogen 55%–75% €190–€405 10 years Short term
Flywheels Electrical motor 85%
€5,700–€6,500 20 years Short term
Superconducting Magnetic Storage
Magnetic fields 80%–90% €35,000 >30,000 cycles Short term
Super Capacitors
Electrical conductor 75% €15,000
>500,000 cycles Short term
Pumped Heat Storage Hot air 70%–80% €50–€150 — Medium term

IEA-RETD RES-E-NEXT 04 July 2013
50
Storage Technology
Energy Storage Medium
Round-Trip Efficiency
Capital Cost per kWh Lifetime
Short -Term / Long-Term Flexibility
Hydrogen Water converted to
hydrogen and oxygen
40% €700–€1,100 10–20 years Short term to medium term
Power to Gas Hydrogen 70% — 20+ years Long term
Blank cells indicate that no reliable information sources could be found or that the technology still is in its infancy and data is unavailable.
From a policy perspective, the economic value of storage and the likelihood of vibrant private-sector investment are important. Relative to demand-side resources and new-build flexible generation, storage requires relatively high capital cost; therefore, investment depends on long-term secured revenue streams, posing a critical consideration for policymakers interested in having more storage in grid systems. Sioshanshi et al. (2009) and Denholm et al. (2009) investigate various storage business models in U.S. markets, focusing on energy arbitrage, regulation service, and contingency reserves. The general finding is that no single business model currently provides adequate return on investment given storage capital costs and uncertainty and the level of expected revenues. Most analysis to date has focused on the energy arbitrage capabilities of storage, but more recent attention is centered on the provision of ancillary services (Ma et al. 2011; Ma et al. 2013).
Figure 10. Storage technologies by capacity and dis charge time. Source: adapted from Arup (2012), IFP (2013), Watso n et al. (2012)
Batteries
10 kW 1 MW 10 MW 1 GW 1 TW
Sec
ond
s M
inut
es
Ho
urs
D
ays
High-Power Supercapacitors
Superconducting Magnetic Storage
High-Power Flywheels
High-Energy Supercapacitors
Pumped Heat
Liquid Air Compressed-Air Energy Storage
Pumped Hydro
Hydrogen
Power to Energy

IEA-RETD RES-E-NEXT 04 July 2013
51
The challenging economics of storage indicate that either storage operators would have to participate in multiple (potentially conflicting) markets (Ma et al. 2011), would require targeted subsidies, or would have to be operated as a public service by system operators or wind-plant owners. This poses a challenge for policymakers: the value of storage will only increase as the penetration of RES-E on the system increases—but to allow for large-scale use of storage at this point, technology already must have been explored, demonstrated, and deployed in preceding years. Capacity adequacy is discussed further in Section 5; however, large-scale storage providing long-term flexibility could be considered as a mechanism to provide longer-term capacity adequacy. Also, the flexibility benefits that storage provides can be achieved through other flexibility measures, as discussed in the previous sections. Thus, it is important to value storage in any given system against the available alternatives. Table 22 lists advantages and challenges of storage as a flexibility source.
Novel storage business models are under investigation by various European distribution system operators (DSOs) under the Seventh Framework Program (FP7) Smart Grid demonstration track. Although more than 23 different business models applications have been identified for a single storage device on the low-voltage system, as of early 2013 there still is significant uncertainty as to their feasibility (ERDF 2013).
Table 22. Advantages and Challenges of Storage as a Flexibility Source
Advantages Challenges • Some technologies are mature, reliable, and
commercially operational
• Can be used to provide either short- or long-term flexibility (depending on the chosen technology)
• Increased and more timely RES-E deployment
• Can be very expensive with uncertain return on investment
• Some technologies, such as pumped hydro or compressed air energy storage (CAES) require site-specific locations, limiting potential
• Environmental concerns (in particular with pumped hydro and CAES)
• Planning and political challenges of constructing large-scale storage
• Many technologies still are in their infancy and are not yet commercially viability
• Many technologies are very small in scale and are unlikely to make a significant contribution to the flexibility challenge
• All storage technologies involve a round-trip energy loss related to the efficiency of the energy conversion processes involved
• Some storage technologies are limited to a certain number of cycles (charge/discharge) over their lifetime
4.3 Flexibility Assessment Methodologies The technologies and operating practices discussed herein can increase flexibility on the electricity power system. Key questions for ongoing research, however, include “How can the flexibility of a system be measured?” and “How much flexibility actually is needed with increased RES-E?” There currently are no standard metrics for measuring flexibility. This section highlights the most recent literature in the area of flexibility-assessment methodologies and the requirements for increased flexibility with
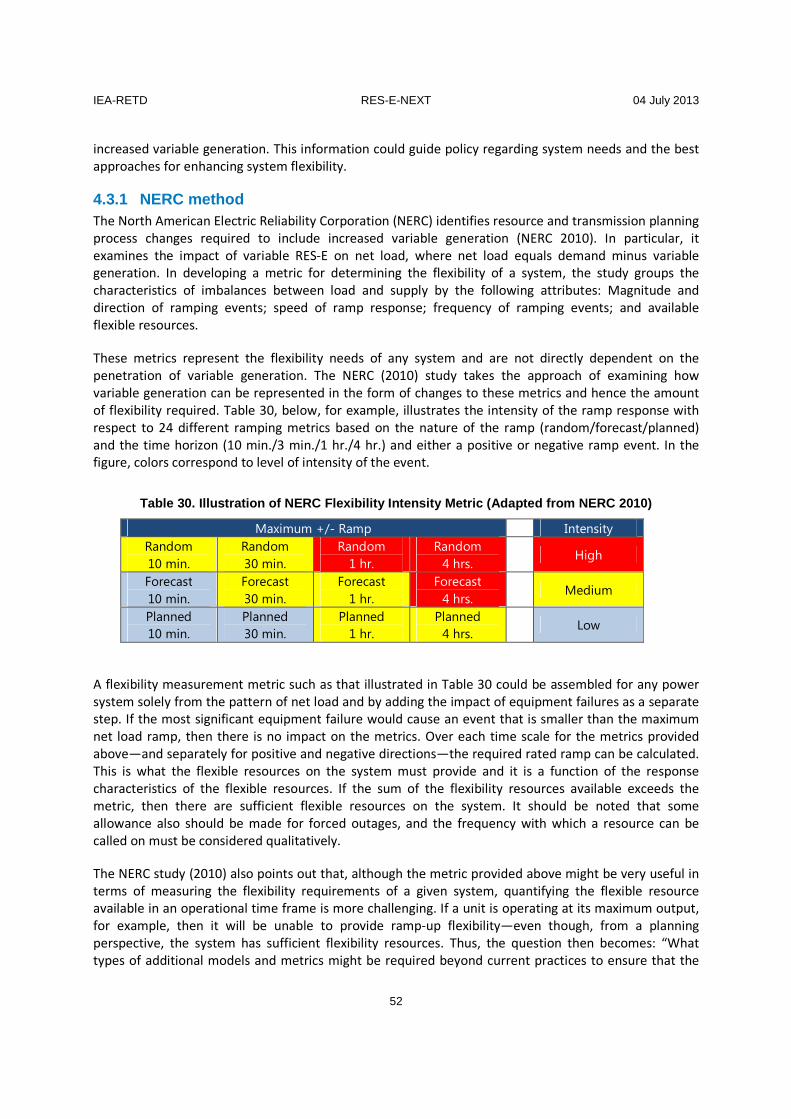
IEA-RETD RES-E-NEXT 04 July 2013
52
increased variable generation. This information could guide policy regarding system needs and the best approaches for enhancing system flexibility.
4.3.1 NERC method The North American Electric Reliability Corporation (NERC) identifies resource and transmission planning process changes required to include increased variable generation (NERC 2010). In particular, it examines the impact of variable RES-E on net load, where net load equals demand minus variable generation. In developing a metric for determining the flexibility of a system, the study groups the characteristics of imbalances between load and supply by the following attributes: Magnitude and direction of ramping events; speed of ramp response; frequency of ramping events; and available flexible resources.
These metrics represent the flexibility needs of any system and are not directly dependent on the penetration of variable generation. The NERC (2010) study takes the approach of examining how variable generation can be represented in the form of changes to these metrics and hence the amount of flexibility required. Table 30, below, for example, illustrates the intensity of the ramp response with respect to 24 different ramping metrics based on the nature of the ramp (random/forecast/planned) and the time horizon (10 min./3 min./1 hr./4 hr.) and either a positive or negative ramp event. In the figure, colors correspond to level of intensity of the event.
Table 30. Illustration of NERC Flexibility Intensit y Metric (Adapted from NERC 2010)
Maximum +/- Ramp Intensity
Random
10 min.
Random
30 min.
Random
1 hr.
Random
4 hrs. High
Forecast
10 min.
Forecast
30 min.
Forecast
1 hr.
Forecast
4 hrs. Medium
Planned
10 min.
Planned
30 min.
Planned
1 hr.
Planned
4 hrs. Low
A flexibility measurement metric such as that illustrated in Table 30 could be assembled for any power system solely from the pattern of net load and by adding the impact of equipment failures as a separate step. If the most significant equipment failure would cause an event that is smaller than the maximum net load ramp, then there is no impact on the metrics. Over each time scale for the metrics provided above—and separately for positive and negative directions—the required rated ramp can be calculated. This is what the flexible resources on the system must provide and it is a function of the response characteristics of the flexible resources. If the sum of the flexibility resources available exceeds the metric, then there are sufficient flexible resources on the system. It should be noted that some allowance also should be made for forced outages, and the frequency with which a resource can be called on must be considered qualitatively.
The NERC study (2010) also points out that, although the metric provided above might be very useful in terms of measuring the flexibility requirements of a given system, quantifying the flexible resource available in an operational time frame is more challenging. If a unit is operating at its maximum output, for example, then it will be unable to provide ramp-up flexibility—even though, from a planning perspective, the system has sufficient flexibility resources. Thus, the question then becomes: “What types of additional models and metrics might be required beyond current practices to ensure that the

IEA-RETD RES-E-NEXT 04 July 2013
53
flexibility requirements that result from variable generations are adequately captured in system planning studies?”
4.3.2 IEA GIVAR method The International Energy Agency Grid Integration of Variable Renewables (GIVAR) project (IEA 2011) examines the balancing capability of existing flexible resources. The GIVAR project developed a flexibility assessment method known as the FAST method. The FAST method outlines four steps to determine the flexibility of the system and thereby the potential share of variable RES-E in a given system. These four steps are: (1) Assess the maximum technical ability of the flexibility sources available; (2) Determine to what extent certain attributes of the power system in question will constrain the flexible resource; (3) Calculate the maximum flexibility required on the system which is a combination of fluctuations in demand, variable RES-E output, and contingencies; and (4) bring together all of the previous steps to establish the present variable renewable penetration potential of the system in question.
Potentially an easily adaptable methodology, this GIVAR study does have some significant shortcomings.
• The complementarity of fluctuating demand with variable RES-E is not included
• The analysis does not fully account for the smoothing effect on variability of geographical and RES-E technology spread
• The opportunity to curtail the RES-E output is not addressed
All three assumptions are likely to exaggerate the flexibility requirements of the area assessed, and therefore reduce RES-E potential values. Further, the analysis looks only at transmission-level RES-E power plants.
4.3.3 IRRE method Lannoye, Flynn, and O’Malley (2012) propose a new metric—insufficient ramping resource expectation (IRRE)—to measure power system flexibility for use in long-term planning. It is derived from traditional generation adequacy metrics. The proposed IRRE flexibility metric measures the ability of a system to use its resources to meet both predicted and unpredicted net load changes. The proposed IRRE metric measures a system’s flexibility by accounting for: time horizons, where the time horizon is defined as the duration of the net load change; the direction of the change in net load; the magnitude and frequency of occurrence of net load changes; and resources available to meet upward and downward changes
The calculated IRRE for a given system is the expected number of observations when the power system cannot cope with the changes in net load, predicted or unpredicted. Calculating the IRRE follows a similar method to calculating a traditional Loss of Load Expectation (LOLE), however, rather than forming a distribution of the unavailable generation capacity, a distribution of the available flexible resources is formed for each direction and time horizon. As with the LOLE calculation, the probability that the system has insufficient ramp resources at each observation also is considered. Calculation of the IRRE for all selected time horizons provides an understanding of the ability of a system’s resources to meet the variability requirements of its net load. Interestingly, Lannoye, Tuohy, Flynn, and O’Malley (2012) in their test case find that the addition of variable RES-E could decrease the IRRE of a system over certain time horizons, and require increased flexibility in others.
Rather than estimating total flexibility requirements, other studies focus on the comparison of flexibility technologies. For example, Tuohy and O’Malley (2011) investigate the level of pumped hydro storage

IEA-RETD RES-E-NEXT 04 July 2013
54
required with increasing levels of wind penetration on the Irish system in 2020. The study found that storage is not justified until wind penetration levels reach approximately 50% of demand. It also demonstrates that improvements in wind-power forecasting and the inclusion of wind-power forecasts in unit-commitment decisions reduce the need for storage on the system. Denholm et al. (2009) suggest that power systems can reduce minimum load constraints (thereby lessening the probability of curtailment) through generator modification or changes in operational practice, which might be more economical than storage.
Table 31. Advantages and Challenges of Flexibility Metrics
Advantages Challenges • Identify potential flexibility challenges for
future power systems with high penetration levels of variable RES-E
• Assist in the design of optimal flexibility incentives
• This is a relatively new area of research and no clear winning flexibility assessment metric exists of yet
• All proposed metrics are highly data intensive
• Although a flexibility metric can inform operators and policymakers about the level of flexibility required, it does not ensure that this flexibility is provided
4.4 Current Practices to Reward and Incentivise Fle xibility
Around the World To some extent, wherever there are wholesale energy markets, generators that can meet peak demand at times of scarce supply are rewarded for flexibility. As this need for flexibility grows to accommodate greater shares of RES-E, however, new types of flexibility could be required. There presently is a debate whether flexibility will be rewarded in traditional market designs. This section discusses some potential instruments to adequately reward flexibility. Note, however, that there is no consensus as to whether these will be required in the future, as existing structures might be adequate.
As discussed in Section 4.2, there are many potential sources of flexibility. This section highlights market mechanisms to incentivise the development of sources. Thus, the key challenge is to determine the most cost-effective way to achieve flexibility for each individual system. It also should be noted that the incentivisation of flexibility should not be done in isolation, but rather in parallel with ensuring that the other requirements of power-system security are met.
For example, various jurisdictions are facing dual shortages of capacity and flexibility, and in some jurisdictions the two goals are in tension. In systems approaching capacity shortages, for example, coal-fired power stations might be attractive from a perspective of local resources but might not offer the best solution for the provision of flexibility required for accommodating large shares of RES-E generation. Conversely, least-cost options for flexibility resources (e.g., demand response or balancing area coordination) might not provide the firm capacity to meet adequacy requirements.
Flexibility in power systems is incentivised in various ways around the world. Some of these mechanisms are indirect—in other words they are not primarily designed to reward flexibility but might do so anyway. Examples include capacity payments, strategic reserve requirements, and sub-hourly energy markets that reward fast operation. The benefits of the latter are discussed in Section 4.2.5.1. Other mechanisms are direct; they are explicitly designed to reward flexibility. Direct remuneration schemes are gaining attention, and this section evaluates the strengths and weaknesses of various approaches.

IEA-RETD RES-E-NEXT 04 July 2013
55
4.4.1 Capacity Markets Capacity markets traditionally are designed to incentivise investment to ensure security of supply and are discussed further in Section 5 of this report. Capacity markets also are under consideration as a mechanism to incentivise flexibility, however, and the discussion herein focuses on them in this context. Capacity markets are designed to remunerate market participants for committing a volume of firm capacity to generate power or reduce demand by an equivalent amount during hours of system pressure (Gottstein and Skillings 2012). Table 32 indicates various jurisdictions where energy-only and energy-plus-capacity market designs are operating.
Table 32. Examples of Market Design for Resource Ad equacy (adapted from Brattle Group 2010)
Without Resource Adequacy
Requirement
With Resource Adequacy
Requirement
Energy-Only Model Energy-Plus-Capacity Model
ERCOT, AESO, Australia’s NEM,
NordPool, Great Britain, and other
European Union markets
Capacity Payments Capacity Requirements
Argentina; Chile;
Columbia; Peru; Ireland;
Spain; South Korea; and
Ontario, Canada
United States (CAISO, SPP,
SYPP, PJM, NEPOOL, MISO,
NYISO, ISO-NE); Australia’s
SWIS; and Brazil
The common critique of such markets is that they do not by default remunerate flexible capacity, either on the demand-side or the supply-side. Experience with the forward capacity markets in the United States, such as that implemented by PJM, reveals that a concerted effort to design market rules to remunerate capability resources not only on the supply-side but also on the demand-side has engaged sizeable customer participation (Gottstein and Schwarz 2012). It is not clear, however, that this demand capacity can serve as the fast-acting flexibility that might be required in the future (discussed in Section 4.2.2, above).
In light of these observations, new principles could be required to incentivise the types of flexible capacity that benefit high RES-E systems. Gottstein and Skillings (2012) suggest a candidate set of criteria and utilise them to review a capacity market proposal for the United Kingdom. These criteria hint at next-generation considerations for capacity markets, including securing a wide range of capabilities (not just least-cost capacity), treating demand-side resources equally, rewarding the use of existing resources, rewarding the use of low-emissions technologies, and promoting innovation. The difficulty in implementing these criteria in practice highlights some of the challenges associated with capacity/flexibility market design and implementation, and are further discussed in Section 5.
4.4.2 Other Market Instruments In some systems, the flexibility incentives arise within the current market structures (e.g., energy prices at times of operational stress when flexible plant can profit) and in others systems new and innovative markets are being created for flexibility products. The California Independent System Operator (CAISO), for example, is finalizing the design of a flexible ramping product. In Ireland, EirGrid currently is investigating a new ramping product (EirGrid 2013; Xu and Tretheway 2013). In other markets, such as in

IEA-RETD RES-E-NEXT 04 July 2013
56
Texas, economic dispatch is done on a 5-minute basis, which significantly diminishes the need for a separate ramping incentive (discussed in Section 4. 2.5.1).
Given the diversity of system contexts and this plethora of design options, decision frameworks can assist policymakers to select flexible capacity options. Figure 11 illustrates one of the more recent and comprehensive decision guides, adapted from Hogan and Gottstein (2011).
Figure 11. Decision framework for capacity adequacy instruments (adapted from Hogan and Gottstein 2011)
Figure 11 suggests that, under low penetration levels of variable RES-E, a deterministic methodology is the most appropriate. This is a methodology that is similar to traditional unit-commitment techniques for power systems with static reserve requirements and does not necessarily take into account the stochastic nature of the RES-E resource. Hogan and Gottstein (2011) recommend that, with high penetration levels of variable RES-E, more sophisticated probabilistic (or stochastic) methods be employed, such as stochastic unit commitment with dynamic reserve targets, as described in Section 4.2.5.2.
In terms of incentivising the required level of flexibility, Hogan and Gottstein (2011) present two potential mechanisms. The first “Enhanced Services Market Mechanism” is an expansion of the traditional ancillary services market to procure the target mix of flexible resources. This mechanism is conceived to operate in systems without capacity mechanisms, however, it also could be operated in parallel with a simple capacity mechanism. The second “Apportioned Forward Capacity Mechanisms,” involves apportioning the existing capacity mechanism into tranches based on the target mix of resource capabilities. This method envisages that all flexible resources would bid into the highest-value tranche for which they qualify. The most flexible tranche then is cleared first, followed by the second, and so on,
Variable renewables market share?
Deterministic methodology with recent experience
Probabilistic experience with
production model
Rate of growth? Capacity mechanism?
Plan for more complex
methodology
Monitor trends in variable RES-E
production
Capacity mechanism?
Option
Apportioned forward capacity
mechanism*
Simple capacity mechanism +
enhanced services markets
Enhanced services market
mechanisms
Apportioned forward capacity
mechanism*
Enhanced services market
mechanisms
*Traditional ancillary services
can be addressed via long-
term ancillary services
auctions rather than via the
capacity mechanism
Yes
NoYes
No
Low
High Low
High

IEA-RETD RES-E-NEXT 04 July 2013
57
until the required level of flexibility is achieved. The demand curves for each tranche reflect the relative values of the resources specified, with the clearing price for each successive tranche expected to be lower than the last.
4.5 Conclusions and Recommendations for Enhancing F lexibility A very wide array of flexibility sources is currently in place and some innovative solutions are emerging around the world. The costs, benefits, and implementation barriers of each are highly sensitive to local circumstances, and should be the subject of extended evaluation and discussion by policymakers, system operators, and market participants. There also is significant uncertainty about future directions, as methods of quantifying flexibility needs and incentivizing appropriate solutions are still at a very early stage of development.
In parallel, definitions of capacity adequacy are changing as variable RES-E grows and the appeal of flexibility evaluation is increasing. Whereas, peak system demand—which generally is predictably seasonal—once drove reliability margins, under very high variable RES-E penetration levels critical reliability events might occur under very different circumstances, for example, when customer demand is rising rapidly and variable RES-E generation is falling rapidly (Gottstein and Skillings 2012). If not managed properly, reliability events also might occur when customer demand is minimal, thermal fleets are running at minimum load, and variable RES-E generation rises dramatically. Such events might be rare, but they are far less predictable, and demand new solutions in system operation and the activation of demand response and storage.
In this context, some observers suggest that mechanisms rewarding flexible capabilities are likely to be a key part of evolution towards high RES-E futures. Gottstein and Skillings (2012) provide a design-criteria checklist for such mechanisms. Notably, capability-based mechanisms, rewarding the capability of system units to provide flexibility, will be marked by an explicit acknowledgment of the value of demand-side, grid, and storage, instead of a focus on supply-side resources with all else being an afterthought. The degree to which demand-side resources can mitigate flexibility concerns, however, is very unique to local system characteristics.
Another perspective is that further progress in energy-only market design—namely very fast energy-only markets with widespread locational pricing and demand-side bidding—is the most economically efficient way to incentivise flexible capability. Theoretically, such markets, which would clear every minute and not have price caps, would very effectively reward and incentivise flexibility. If a fast response is needed, then the price quickly goes up and a flexible resource would get that price. However, the degree to which such markets would effectively incentivise investment in capacity resources and provide a secure signal for such investment is still an open question. These issues are discussed further in Section 5. Again, the optimal path will vary by context, and the range of solutions is growing. What remains certain is that the need to incentivise flexibility will be increasingly acute in high variable RES-E futures.

IEA-RETD RES-E-NEXT 04 July 2013
58
5 Securing Generation Adequacy Optimal market-based mechanisms to ensure generation adequacy have been the subject of debate for at least ten years (see for example Cramton and Stoft 2006; Singh 2000), and pre-date the era of high penetrations of variable RES-E. As RES-E generation has grown, one of the key concerns for conventional generation operators and owners—and, by extension, market operators and regulators—is the impact of RES-E growth on conventional generation revenues. If high RES-E penetration levels negatively impact revenues, new investment in conventional generation resources may be inhibited. This raises concerns that insufficient generation capacity could reduce long-term security of supply. In periods when generation capacity does not meet demand and all available demand response is exhausted, the system operator must disconnect a fraction of electricity users. This is termed a “rolling brown-out.”
Across liberalised markets, however, rolling brown-outs linked to inadequate generation adequacy rarely are observed—arguably due to regulators and policymakers anticipating the political repercussions and therefore pursuing ad hoc interventions to access additional generation resources. Such interventions can involve costly solutions and also can negatively impact market credibility. To avoid such emergency interventions, the challenge is to determine the most efficient and cost-effective way to incentivise investment in new capacity, without relying exclusively on the traditional incentive mechanism—namely maximising hours of operation.
The question of how to ensure resource adequacy—a sufficient level of generating capacity to meet demand at some future date—can be difficult to resolve. Although it is relatively easy to calculate whether a system has sufficient capacity to meet a specific long-term reliability level, ensuring that this capacity is maintained is an important and sometimes difficult problem to solve. In a power system with high levels of RES-E, this problem can be more difficult to solve because some RES-E generation, such as wind and solar power, deliver a relatively small percentage of rated capacity toward resource adequacy.
This section discusses the potential impact of high penetration levels of RES-E on conventional generation revenue and also the impact of market design on capacity adequacy. Both of these issues significantly impact the cost and type of new generation connecting to any system. Section 5.1 discusses the interaction between conventional generator revenues and high RES-E penetration levels and Section 5.2 discusses generator revenues, capacity adequacy, and market structure. Section 5.3 concludes with a discussion of policy options.
5.1 Conventional Generation Revenues Under High RES -E Penetration Levels
An increase in RES-E with zero/low marginal cost on an electricity system will alter the operation of the conventional generating units on the system. Like any generation addition to the system, this change in operation has the potential to alter revenues for conventional units that could have been built under different assumptions about future operating levels. Although the focus of this discussion is the impact of RES-E penetration levels on potential conventional generator revenues, note that any generation—renewable or conventional—that has a lesser marginal cost than existing units has the potential to negatively impact the revenues of existing generators (Milligan et al. 2011). In the United States in the early 2000s, for example, new combined-cycle gas turbine (CCGT) units competed against and replaced less-efficient coal-powered stations and, as a result, had a negative impact on the revenues of coal-powered stations. It could be the case, however, that RES-E and cheaper new conventional units impact the existing plant mix in different ways, given the non-dispatchable nature of many RES-E technologies.
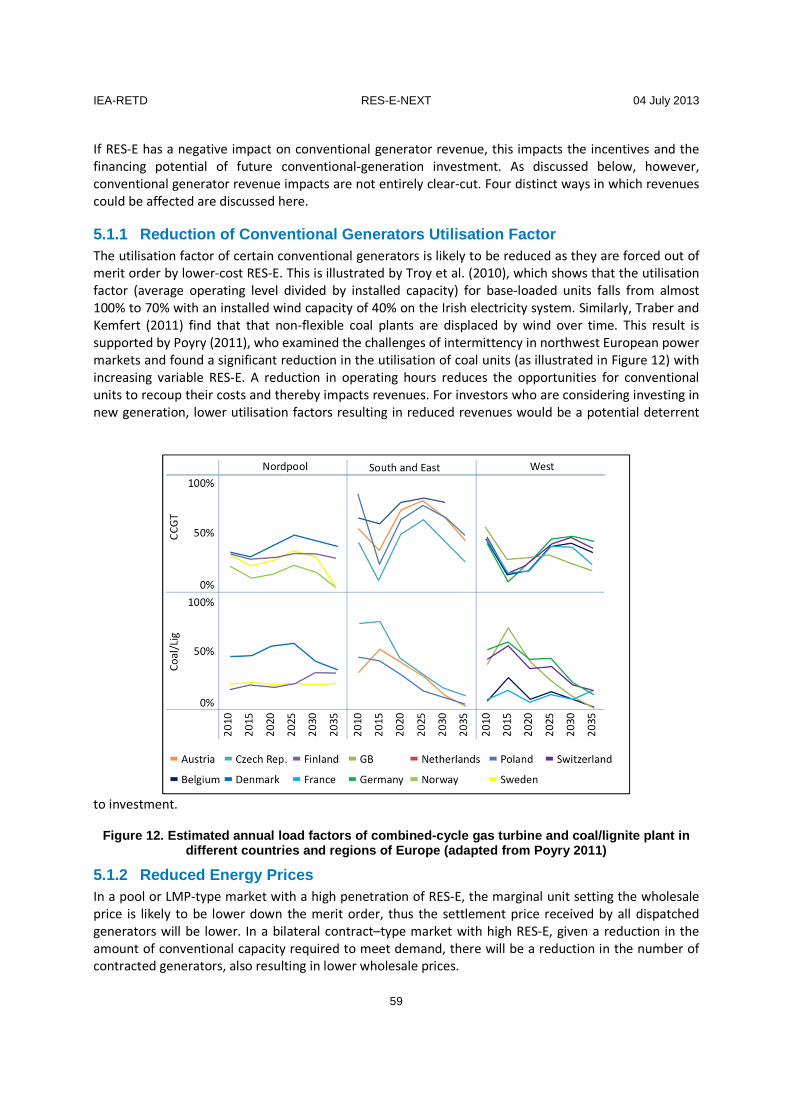
IEA-RETD RES-E-NEXT 04 July 2013
59
If RES-E has a negative impact on conventional generator revenue, this impacts the incentives and the financing potential of future conventional-generation investment. As discussed below, however, conventional generator revenue impacts are not entirely clear-cut. Four distinct ways in which revenues could be affected are discussed here.
5.1.1 Reduction of Conventional Generators Utilisat ion Factor The utilisation factor of certain conventional generators is likely to be reduced as they are forced out of merit order by lower-cost RES-E. This is illustrated by Troy et al. (2010), which shows that the utilisation factor (average operating level divided by installed capacity) for base-loaded units falls from almost 100% to 70% with an installed wind capacity of 40% on the Irish electricity system. Similarly, Traber and Kemfert (2011) find that that non-flexible coal plants are displaced by wind over time. This result is supported by Poyry (2011), who examined the challenges of intermittency in northwest European power markets and found a significant reduction in the utilisation of coal units (as illustrated in Figure 12) with increasing variable RES-E. A reduction in operating hours reduces the opportunities for conventional units to recoup their costs and thereby impacts revenues. For investors who are considering investing in new generation, lower utilisation factors resulting in reduced revenues would be a potential deterrent
to investment.
Figure 12. Estimated annual load factors of combine d-cycle gas turbine and coal/lignite plant in different countries and regions of Europe (adapted from Poyry 2011)
5.1.2 Reduced Energy Prices In a pool or LMP-type market with a high penetration of RES-E, the marginal unit setting the wholesale price is likely to be lower down the merit order, thus the settlement price received by all dispatched generators will be lower. In a bilateral contract–type market with high RES-E, given a reduction in the amount of conventional capacity required to meet demand, there will be a reduction in the number of contracted generators, also resulting in lower wholesale prices.
IEA-RETD RES-E-NEXT 04 July 2013
60
Holtinnen (2005) shows an average decrease in the spot price of electricity of €2 ($2.62) per megawatt-hour for 10 terawatt-hours (TWh) per annum of wind power for the NordPool market. Sensfuß et al. (2008) estimate that a wind penetration of approximately 10% in 2006 (52 TWh) in Germany results in a reduction of average spot price of €7.83 ($10.25) per megawatt-hour (approximately 15%), compared to a situation with no wind. Moesgaard and Morthorst (2007) analyse spot prices between 2004 and 2007 in Western Denmark and concluded that they were reduced by 5% to 15% as a result of a 20% to 25% penetration of wind power. On the basis of the existing research on wholesale electricity prices and RES-E, Steggals et al. (2011) conclude that wind has a negative impact on average spot prices on the order of 1% for every 1% of additional wind penetration. Thus, the combination of fewer operating hours and a reduction in spot prices could dramatically reduce the revenues received by conventional generators in the energy market.
An exception to the majority of the research to date on RES-E and energy prices, however, is found in a study conducted by the regulatory authorities in Ireland (CER and UREGW 2009). In that study, high-wind scenarios (up to 42%) in systems with a high proportion of open-cycle gas turbines (OCGTs), prices were 10% greater than in the absence of wind generation, with marginal prices being driven by an increase in the utilisation of the flexible high-cost OCGTs. As shown in Section 4, increasing penetration levels of RES-E cause an increase in the requirement for more flexibility. To the extent flexibility is provided through resources such as high–marginal cost OCGT units, it in fact could increase wholesale electricity prices even in the presence of high penetration levels of RES-E.
Overall, the impact of RES-E on conventional generation revenues, and hence incentives for future investment in conventional generation, is not clear-cut. In the longer term it is to be expected that surplus generation assets are retired, and power prices will recover. Simulation studies suggest that the price duration curve becomes more peaked—such that conventional assets might reduce their operation hours but recover greater margins during the remaining operation hours.
5.1.3 Increased Flexible System Capacity and Grid Support
As discussed, increases in RES-E require an increase in the flexible capacity on the system, and an increase in grid support services such as frequency response, voltage support, inertial response, and the ability to respond to regulation signals to help provide grid stability. Depending on the market structure of a given system, the provision of these services could provide a revenue stream for conventional generators that could potentially offset lost revenues in the energy market and provide sufficient incentives for future investment. Holtinnen (2005) estimates that the reserve price in the Nordpool market would increase by €0.1 to €0.2 ($0.13 to $0.26) per megawatt-hour for a 10% wind penetration and €0.2 to €0.5 ($0.26 to $0.66) per megawatt-hour for 20% penetration.
A case study of the forward-capacity markets in the United States, for example, “followed the money” to examine what types of resources were receiving the capacity payments under that market design. The study found that the vast majority of the revenues went to existing high-emitting fossil-fueled generators (Gottstein and Schwarz 2010). Existing fossil-fueled resources (gas, oil, coal-fired) received 70% of the $42 billion in capacity payment revenues under those auctions and the corresponding market design (Bowring 2011). Recent history, however, also has raised important questions regarding the depth of the ancillary services markets. One U.S. flywheel storage firm recently entered into the NY-ISO regulation service market with 20 MW of new capacity in 2011. One year later the company was bankrupt, due in part to the dramatic decline in ancillary service prices (LaMonica 2011).

IEA-RETD RES-E-NEXT 04 July 2013
61
5.1.4 Increased Operation and Increased Emissions C osts An increase in the variable operation of conventional unit could increase emissions due to lower efficiencies at lower loads and an increase in fuel consumption during start-up and shut-down (Denny and O’Malley 2009). This increase in emissions could result in increased emissions costs—either through the purchase of emissions credits or through penalties—which negatively impacts net revenues.
Di Cosmo and Malaguzzi Valeri (2012) consider the impact on conventional generation total profits of wind penetration levels of up to 30% in the Irish electricity market. The results indicate that, although conventional generator profits decrease, this decline is only about 1% to 2%. The study did not consider potential revenues from additional ancillary service provision, however, thus the net impact on conventional generation profits could be even less than the estimated 1% to 2%. This indicates that, although RES-E might have an impact on conventional generation revenues, the scale of this impact could be minimal. Also, the source of conventional generator revenue could change, with increased revenue being earned in ancillary service markets.
This discussion illustrates that increased RES-E potentially can decrease conventional generation revenues through lower utilisation rates and possibly through reduced wholesale electricity prices (although in some cases electricity prices have been shown to increase or pricing structures have become more peaked which would increase revenues). In some cases, increased revenues could be gained through an increase in the demand for ancillary services and through interactions with emissions markets.
How the four factors described above will interact and ultimately influence net revenues for conventional generation—and, consequently, incentives for future investment in conventional generation—depends not only on the level of installed RES-E but more importantly on the underlying market structure. The impact of market structure on conventional generation revenues and incentives for future investment is discussed in the following section.
5.2 Capacity Adequacy, Conventional Generator Reven ues, and Market Structure
Analysis techniques to assess resource adequacy have been adapted for systems using wind energy, and these methods can also be applied to solar energy (Ibanez and Milligan 2012). Historically, these adequacy methods have focused solely on the question of whether there is sufficient capacity to meet the load, with no consideration of the performance characteristics of that capacity. With high levels of RES-E, the type of capacity also is important. This means that the forward capacity that is required also must possess the level of flexibility needed to operate the power system with the increased level of variability and uncertainty that RES-E brings to the system. Thus, the issues of capacity adequacy and flexibility are two dimensions of the same problem. Although flexibility needs are widely recognised in power systems with high levels of variable renewable (as discussed in Section 4), methods for assessing flexibility still are emerging, and the state of the art for analysis therefore still is immature.
The main consideration when contemplating investment in generation assets on a power system is the return on investment. Although there are uncertainties surrounding operating costs relating to forecasted fuel prices, one of the key uncertainties is forecasted generator revenues. One of the main determinants of generator revenues (either in the presence or absence of RES-E) is the underlying market design. The rules pertaining to how electricity prices are determined in the energy market, and the presence or absence of any parallel-capacity markets to a large extent drive generator revenues.

IEA-RETD RES-E-NEXT 04 July 2013
62
These factors therefore affect incentives to pursue investments and impact the ability to finance investments.
Even though electricity prices and market structure determine revenues, it is not possible to identify a single market design that ensures sustainable electricity prices and secure capacity investment. Australia, for example, has a gross pool energy market where generators bid in 5-minute intervals and spot prices are determined using half-hourly averages. This electricity market is energy-only and thus does not have a parallel capacity market. In Australia, the price cap is set rather high and spot prices can exhibit significant variations. On 4th January 2013, for example, the spot price in Southern Australia (SA) fluctuated between AUS $37.54 (U.S. $35.59) per megawatt-hour and AUS $4,203.38 (U.S. $3,984.80) per megawatt-hour (AEMO 2013). This is an energy-only market, therefore, the wholesale electricity price is the only mechanism by which conventional generators can recover costs. In Australia, the regulator has allowed the wholesale price to vary widely to reflect periods when the system is under capacity pressure, thereby enabling conventional generators to recover sufficient revenues during these high-price periods to satisfactorily cover costs.
Alberta, Canada, also has an energy-only electricity market and does not employ any regulatory mechanisms to ensure a particular level of resource adequacy. The incentives for new generation capacity are provided only in the form of sufficiently high prices in the energy market. Despite the energy-only wholesale market, end-user electricity prices in Alberta are not excessive and in 2010 were less than the Canadian average of 10.16 cents per kilowatt-hour (TransAlta 2013). This largely is a result of regulator involvement capping wholesale prices at $1,000 per megawatt-hour. In fact, Brattle (2013) recommends that the Alberta price cap be increased to up to $7,500 per megawatt-hour to better reflect the value of lost load and to introduce a scarcity pricing function to increase prices when operating reserves are low. Brattle (2013) claims that these measures are necessary to ensure sufficient capacity investment in the future, as it is estimated that approximately 530 MW per annum of additional capacity will be required in Alberta between 2013 and 2029 to manage planned retirements of existing units and increases in demand.
Thus, to ensure sufficient incentives for future conventional generation capacity in an energy-only market, regulators must ensure that average prices are sufficiently high to ensure that available generators can recover their costs. Demand-side response can set market-clearing prices above the marginal costs of conventional generation, and thus also can contribute to hours during which conventional generation can recover fixed costs. Thus, it is the overall system configuration that determines whether a specific price level for a wholesale price cap undermines the ability of generators to recover their investment costs—which could cause capacity-adequacy issues. Other market designs reward capacity and availability through a separate market mechanism and thereby incentivise the necessary level of installed capacity for the future and maintain less-volatile energy prices.
Since 2007, Ireland has had a dual energy and capacity payment mechanism. Due to its small size and a fear of overly volatile energy prices, it was determined that energy prices alone would be insufficient to incentivise and reward conventional generation. As such, a capacity payment scheme was employed in parallel with a regulated bid-based energy market. Irish conventional generating units can earn revenues not only through the energy market but also through capacity payments. This appears to have provided sufficient incentives for generation investment. According to the latest generation adequacy report (Eirgrid 2012), Ireland has sufficient capacity to meet reliability targets up to 2021. Whether this is due to the market structure or a reduction in forecasted demand growth due a reduction in economic growth, however, is unclear. Even though the volatility in the energy market is relatively low, total

IEA-RETD RES-E-NEXT 04 July 2013
63
wholesale electricity prices (including both the energy and capacity components) in Ireland are among the highest in Europe.
Capacity markets can be considered an insurance premium against capacity shortfalls. In other words, if policymakers are concerned about the ability of conventional generators to recover sufficient revenues in the energy market to cover the costs, and about the additional impact that this might have on future capacity adequacy, then they can introduce a capacity market to reduce this risk. Advocates of capacity markets argue that the greater costs associated with running a second market outweigh the risks of a potential capacity shortage in the future. Hence, the cost of the capacity market is considered to be like an insurance premium protecting against future capacity shortfalls.
Although the presence of capacity markets could reduce price volatility in the energy market and help alleviate the problem of “missing money,” capacity markets also have three main drawbacks:
First, they tend to lock-in and incentivise a particular conventional technology type for the future and limit the potential for investment in alternative and innovative technologies. In Ireland, for example, the capacity market is tightly regulated. The Irish regulator determines the size of capacity payments based on calculations of what the least-cost new conventional generator on the system should be and the level of capacity required (SEMC 2012). Arguably, to incentivise innovative technologies and to avoid a lack of diversity in the capacity mix, capacity markets should be designed in such a way that they are “technology blind,” as long as certain requirements are met, for example maximum CO2 emissions.
Another hurdle for variable renewable energy sources (such as wind and solar) to clear is that the capacity credit they qualify for depends on the characteristics of the system, as discussed in section 2.2.4.2. The value of such a capacity credit depends on the design of market arrangements—that is, the market structure and liquidity can limit the value of capacity credits produced by variable renewable energy sources and hence limit the potential revenue variable RES-E can earn in capacity mechanisms.
A third drawback of pursuing a capacity market mechanism is that the longer-term contracting periods involved in many designs, and the vested interests of beneficiaries defending an existing mechanism can contribute to a lock-in situation of a particular market design for the future foreclosing on other—potentially more innovative—market mechanisms. Section 6 discusses a number of electricity market paradigms and notes that, by opting for a capacity market, other potential market design options are excluded from future consideration. Table 33 summarises the advantages and challenges of capacity mechanisms.
Table 33. Advantages and Challenges of Capacity Mec hanisms
Advantages Challenges • Reduction in energy revenue uncertainty
• Reduced volatility of wholesale energy prices
• Potentially increased investment in capacity
• Mechanisms for incentivizing particular types of generation
• Increased cost over energy-only market
• Locks in particular technology type
• Uncertainty about capacity value of variable RES-E implies that it might not be as beneficial for these generation sources as for conventional units
• Locks in particular market design
IEA-RETD RES-E-NEXT 04 July 2013
64
5.3 Discussion and Conclusions The transition to RES-E futures adds new dimensions to the long-standing debate about whether generation assets can adequately recover fixed costs from selling electric power in energy-only electricity markets. This debate includes several potential sources of uncertainty—which can result in different conclusions across time and regions—including the following.
• Regulatory Credibility. Will the regulator or government be sufficiently committed to the market design to not intervene during periods of very high prices?
• Inelastic Demand. How great is the demand-side response potential— and will it be accessed with policy frameworks and market dynamics? Demand-side response contributes to clearing prices above marginal costs of fossil-generation assets, and thus reduces the need for very high—and thus politically potentially difficult to support—prices in energy-only markets.
• Uncertainty. Will banks and project developers view scarcity revenues as sufficiently bankable for financing of generation investment? Will new entrants to the market contribute to price collapse, rendering scarcity pricing ineffective and putting investment at risk?
These aspects were noted well before the advent of significant penetration levels of variable RES-E. In countries that have dedicated additional effort to the decarbonisation of the power sector, there are new twists to the question of how to recoup fixed costs in light of market evolution and RES-E growth, including the following:
• Increased Volatility. High shares of RES-E could increase the volatility of net-power demand, adding uncertainty to revenue streams. This provides an argument in favour of additional (capacity-linked) remuneration to energy-only markets.
• Demand-Side Mechanism. Increasing policy support for demand-side mechanisms and storage promises to deliver greater short-term demand elasticity, thus increasing the number of hours a year that power prices will be set (by the demand side) above the marginal generation costs of the marginal plant, reducing the need for additional capacity-linked support mechanisms.
• Challenge of Capacity Mechanism. Defining a capacity value for variable RES-E is a challenge and uncertainty surrounding calculations creates concerns that capacity mechanisms might not offer fair or predictable remuneration to RES-E generators. Even if RES-E generators are covered under dedicated support mechanisms, this raises the sensitive topic of further RES-E support requirements.
• Implications of Capacity Mechanisms. As increasing shares of revenues are delivered through capacity mechanisms instead of energy-only markets, new administrative procedures are required for all interfaces of the power market, especially: demand-side, heating markets, uprates, electrified transport, international power exchange, and storage. As power prices under administrative regimes would not reflect the full value of flexibility on offer, market participants negotiate what type of capacity remuneration they qualify for with the regulator.
So far, empirical analysis does not provide clear-cut answers to these questions. Several approaches have been suggested and can be grouped into four broad categories, listed below.
• Capacity Payments. In Ireland, for example, the cost of peaking generation units is offered on a fixed basis to all generation that provides power during peak periods.

IEA-RETD RES-E-NEXT 04 July 2013
65
• Capacity Markets. Some entities are made responsible to contract sufficient (equivalent) firm capacity to meet peak demand. Capacity resources typically include new or existing generation, imports, or demand response.
• Strategic Reserves. The TSO or other entity contracts on behalf of regulator for peaking capacity or demand resources. These resources only are entered into the market above a predefined strike price, thus ensuring investment in peaking assets—arguably the most difficult to finance in energy markets.
• Measures to Strengthen Energy-Only Markets. A good example is the support for longer-term energy contracting. Contracts in Europe, for example, currently are 1 to 3 years ahead of power sale. Longer-term contracts would allow the annual variations of energy revenue to be leveled.
From a coordination point of view, each of these options implies some level of administrative intervention into energy markets. Further, each implies medium or high risk to power plant investors, and has complex implications for demand-side resources (Newell et al. 2012) and inter-regional trade. Administrative coordination of energy markets is unlikely to diminish in the near term, rather it likely will increase.

IEA-RETD RES-E-NEXT 04 July 2013
66
No policy or technology revolu-
tions are necessary—but evolution is
crucial.
6 Synthesis and Discussion At relatively low levels of generation, few operational issues arise due to RES-E, allowing the consideration of broader, systemic issues to be deferred. In high-RES-E systems around the world, that luxury is receding, and next-generation RES-E policies increasingly are shaped by broader systemic considerations. In light of the broad array of solutions outlined in this report—including demand-side policy, inter-regional transmission projects, and market design rules, to name a few—it is evident that RES-E futures will impact all parts of power-system policy. In a sense, next-generation “RES-E policy” is a misnomer. Rather, RES-E considerations are becoming a fundamental component of next-generation “power-system policy.”
Building upon the survey of innovative approaches described above, the main contention of the present report is that existing electricity system infrastructure, operation, and market designs provide a fundamentally sound basis for accommodating significantly greater levels of RES-E generation. No technical or policy revolutions are necessary to achieve high-RES-E futures. Evolution, however, is
crucial. The preceding sections investigated the wide array of innovative options available to policymakers and other stakeholders. Formerly these could have been implemented in a piecemeal fashion. Moving forward, as the impact of RES-E on power-system operation grows,
policy harmonization anticipating policy interactions and proactively
anticipating changewill help maintain RES-E growth in an evolving power system. Understanding the interactions between evolutionary
forces and specific RES-E policy domains can serve both to clarify real options, and to promote more nuanced understanding of policy interaction.
To synthesise and conclude this analysis, five key principles that embody the transition from narrow RES-E policy to a broad power systems perspective are provided. These principles are illustrated in Figure 13.
Figure 13. Transition principles for integrated pow er-system policy
These principles can serve as an organizing framework to guide the transition to integrated next-generation power-system policies. The remainder of the report discusses each principle in turn.
IEA-RETD RES-E-NEXT 04 July 2013
67
6.1 Harmonising Policy, Market, and Technical Opera tion Technical and market operation constraints are increasingly complex and important in RES-E policy formation, especially as they combine to impact RES-E investor revenue and system reliability. Some illustrative examples of this principle are discussed below.
6.1.1 Designing RES-E Remuneration Schemes to Minim ise Operational Impact and Market Distortion
Remuneration schemes for RES-E can interact with operations and market function. At very high instantaneous penetration levels, for example, priority dispatch requirements constrain the options available to system operators and result in stability concerns on grids. As discussed in Section 5, renewable certificates also might artificially depress wholesale costs. Moving forward, remuneration schemes should be designed with high-penetration levels in mind, considering the physics of grid operation and potential distortions to markets.
6.1.2 Designing RES-E Remuneration Schemes to Creat e Flexibility for Future Changes to Market and System-Operation Rules
Rules governing congestion management, energy imbalances, gate closures, and dispatch and scheduling can combine to have a substantial impact on RES-E project economics. The design of remuneration schemes can create opportunity for such changes by providing stable revenues to existing renewable energy installations (for example through compensation for penalties incurred from system operation).
6.1.3 Designing Network Protocols to Maximise Utili sation of Existing Resources Well-crafted network protocols are a critical area of focus to support improved utilitsation of existing grid resources. Some regions with significant interconnection and flexibility have exceeded 50% instantaneous wind generation without issues. Less-flexible systems might benefit from network protocols that mitigate flexibility constraints. EirGrid’s All Island Facilitation of Renewables Studies (EirGrid 2010), for example, revealed grid changes that would be necessary to allow more than 50% instantaneous wind generation on the Irish synchronous system. Changes include the revision of islanding protection for both conventional generators and distribution-connected wind farms, and mandating a reactive current injection from wind farms during transmission faults. Targeted changes to grid codes and network protocols can allow for the existing grid infrastructure to accommodate more RES-E generation.
6.1.4 Rigorous Performance Standards for Demand Res ponse as a RES-E Balancing Resource
The potential for demand participation to support RES-E integration holds significant promise, but also faces significant barriers. To realise this promise, policies to encourage demand-response participation should closely adhere to system operational requirements. Various systems increasingly are utilizing DR, for example, not simply as an emergency measure but as a service that can be called upon to accommodate RES-E ramp events. These early examples reveal lessons learned for other jurisdictions, specifically that these markets work well when stringent requirements are set for substituting DR for combustion turbines or other fast-moving conventional balancing resources. Although “fast” demand response holds significant potential as a cost-effective flexibility resource, it also has much greater requirements than typically conceived of for voluntary-demand response, including telemetry for real-time communications, metering, and control; short notification times; automated response to control signals; and increases in the frequency and duration of dispatch.
IEA-RETD RES-E-NEXT 04 July 2013
68
6.2 Rediscovering Coordination Power system transformation is emerging in the wake of three decades of electricity market liberalisation in most IEA-RETD economies. Importantly, restructuring efforts are not primarily motivated by the goal of decarbonizing power systems, which only emerged later as an impetus. Restructuring has provided some significant dividends for RES-E—limiting the market power of incumbent generators, and achieving greater consumer engagement with electricity consumption—but it also has introduced challenges that will be felt acutely in the next generation of RES-E deployment.
One of the most important challenges is the fragmented responsibility for coordinated planning, due to the separation of generation, transmission, distribution, and retail market segments. Markets and policies should be designed so that they elicit behaviour from the multiple actors that results in a well-designed system that works well, maintaining reliability at minimum cost. This need not be strictly an optimal solution in each regard (which would be impossible), but the further it strays from the optimal solution, the more significant the upward pressure exerted on consumer prices and downward pressure on reliability (making it worse). The coordination challenge is a general feature of restructuring, but it particularly impacts the achievement of RES-E futures. Co-optimizing the objectives of liberalisation and RES-E deployment introduces complex problems of policy and market design.
One byproduct of restructuring is the waning of formal integrated resource planning (IRP), which once was a fundamental responsibility of vertically integrated utilities. Typical IRP planning processes spanned generation capacity, grid extension, demand-side resources, and retail operations. In the transition from central control to market competition, policymakers have worked to provide substitute institutions (e.g., ENTSO-E) and processes to enhance multi-stakeholder coordination. These efforts generally have met with mixed results. As RES-E grows, the coordination lacuna will become more acute, as highlighted in various sections of this report. Some specific challenges outlined in the preceding sections that would benefit from greater coordination include the following.
• Optimising the geographic deployment of distributed and large-scale RES-E generation to maximise the capacity of existing networks.
• Coordinating and sequencing large-scale transmission investments to access remote RES-E generation resources.
• Identifying and incentivising the flexibility options which span generation, grid, advanced system operation, demand-side resources, and storage.
It could be argued that these and other coordination issues reinforce the need for more assertive regulation, or even market “re-integration.” Others could argue that the benefits of continued restructuring are worth the costs, that assertive regulation distorts markets, and that coordination is best left to voluntary efforts by stakeholders. The optimal path varies by context, but all liberalised, high-RES-E jurisdictions likely must proactively address this tension in coming years. In most cases this will require increasing communications and improving collaboration between market and system stakeholders.
6.3 Bolstering Confidence in the Regulatory Paradig m Confidence in the stability of the market and regulatory structures is necessary for creating a positive investment and planning environment. Some degree of market and regulatory change is required to accommodate large penetration levels of variable RES-E. Successful next-generation RES-E policy will
IEA-RETD RES-E-NEXT 04 July 2013
69
allow market and regulatory evolution without undermining confidence in the basic paradigms. This section outlines the likely focal points of regulatory evolution.
Broadly speaking, there are three fundamental market paradigms in place around the world, and most markets adhere to these basic structures.
• Energy-Only Market. These markets place few or no restrictions on bids, and generator revenue primarily is generated via the energy market payment. Such markets do not have additional payments (e.g., uplift or capacity mechanisms) to supplement this revenue. An example of such a market is the Australian market, but most continental European markets also fall into this category.
• Energy Markets with a Capacity Mechanism. These markets feature an additional capacity mechanism that provides revenue to generators on top of the energy payment. Thus, generators typically bid into the energy market to cover variable operating costs with the capacity mechanism contributing to the fixed costs. This can—in equilibrium—reduce the revenue required from wholesale prices, and in the longer term might result in a corresponding reduction in wholesale energy prices. The Single Electricity Market (SEM) in Ireland,11 the Spanish electricity market, and the PJM market in the United States are examples of this paradigm.
• Cost-Based Regulated Markets. These energy markets feature vertically integrated utilities and some degree of independent power production. These markets typically restrict generators to charge consumers prices reflecting total costs. Such markets are found in Japan and parts of Canada.
Although idealised, or “pure” versions of these paradigms exist in the literature, real-world markets feature some deviations from these pure paradigms to account for specific circumstances, preferences, or transition arrangements. This landscape of “pure” and “real-world” market paradigms is illustrated in Figure 14.
It is essential for market participants to understand which paradigm will be in place over the medium- and long-term, allowing a better basis for strategic investment. This historically has been the case and continues to be so under high-RES-E futures. The current questions are: What new modifications to market paradigms might be precipitated by high shares of RES-E? Which are acceptable without degrading system function or undermining investor confidence in the stability of the basic paradigm? Various policy options in the four domains interact with market paradigms in various ways. These interactions are investigated below.
11 Bids in the SEM market are regulated so it also contains elements of a regulated cost-based market.

IEA-RETD RES-E-NEXT 04 July 2013
70
Figure 14. General market paradigms in operation ar ound the world
6.3.1 Securing RES-E Generation In general, the policies to secure RES-E discussed in Section 2 are compatible with each market paradigm. Feed-in tariffs, for example, have been used in Germany because it was a vertically integrated environment. They still are used successfully in Germany today as it moves towards an energy-only market. Likewise, tenders for RES-E are used in many U.S. markets that include capacity markets. Other instruments such as financial support mechanisms or priority dispatch—which frequently complement feed-in-tariffs in terms of providing renewable support—likewise are compatible with all three market paradigms.
6.3.2 Flexibility and Adequacy Policies In the planning time frame, additional mechanisms might be required to ensure adequate capacity and flexibility as discussed in Section 4 and Section 5. Some (but not all) of these mechanisms are specific to a particular market paradigm as discussed below and illustrated in Figure 15.
• Provision of System Services. Independent of paradigm, remuneration for provision of system services is required both to incentivise performance and ensure that generators receive sufficient revenues to provide service.
• Grid Code Requirements. The standards necessary for a secure and reliable power grid generally are independent of the energy market paradigm.
• Strategic Reserves. Strategic reserves involve procuring capacity on the system which is withheld from the market or bid in a very high price and is reserved for emergency situations. This type of mechanism can interact well with energy-only markets without undermining the

IEA-RETD RES-E-NEXT 04 July 2013
71
fundamental principle. This type of arrangement is redundant, however, in cost-based regulated markets where a capacity mechanism exists.
• Demand-Side Measures. The potential for the demand side to contribute toward integration of renewables remains largely untapped in many markets. Thus, it is relevant to discuss the compatibility of measures that attempt to unlock demand response with the various market paradigms. Incentive mechanisms such as peak-reduction schemes designed to unlock demand-side response are compatible with both energy-only markets and cost-based regulated markets. If a capacity market already exists, then demand-side windows that are tailored to the capabilities of the demand side are compatible in these markets and initially might offer additional remuneration for demand-side response.
• Capabilities Markets. Market arrangements designed to incentivise certain performance capabilities or technology types by means of a payment based on capacity can be considered a type of capacity market. Thus, they are incompatible with energy-only markets or cost-based regulated markets, and their use would represent a fundamental shift away from these paradigms.
Figure 15. Selected flexibility and adequacy polici es within market paradigms
6.3.3 Carbon Markets and the RES-E Investment Case Although market paradigms shape investment behavior, investment decisions also are made—in some contexts, in light of both RES-E incentives and carbon prices. Conventional economic and policy thinking tends to prefer a single, price-based instrument to provide signals to reduce externalities, such as expanding RES-E generation purely through energy-only markets coupled with a carbon-price signal. In the real world, pragmatic constraints are always in play (Bennear and Stavins 2007; Rodrik 2008; Krugman 2013), typically leading to “second-best” configurations of multiple policy instruments. Carbon pricing in the presence of RES-E incentives are an example of this configuration.
IEA-RETD RES-E-NEXT 04 July 2013
72
Insofar as RES-E support instruments and carbon pricing remain in place to secure investment in RES-E, minimizing negative interactions is critical to bolstering investor confidence. Managing confidence in carbon pricing in the European Union has been difficult in its own right. Subsequent to the European Union setting the 2020 targets for emission and renewables in 2007/2008, a building surplus of carbon dioxide is anticipated to reach 2.6 gigatonnes in 2015. This is primarily linked to lower emissions than anticipated linked during the economic crisis—170 metric tons per year and 1.7 gigatonnes of international offset credits—that are being provided faster and at lower than anticipated costs to the European Union (Neuhoff et al. 2012).
This situation along with uncertain political support for the scheme has driven carbon prices to record-low levels. For these reasons carbon prices are unlikely to immediately rise to the level required to completely replace targeted RES-E support schemes. Thus, dedicated technology-specific renewable energy support mechanisms offer an opportunity to initiate the deployment of higher-cost technologies (such as solar or off-shore wind) even when they in many instances are not yet cost competitive at carbon price levels in the range of €20 per ton of carbon dioxide.
In light of these conditions, it is pragmatic for policymakers to continue to rely on RES-E generation support instruments as the main mechanisms for providing a positive investment case for RES-E generation. At the very least, there is greater revenue certainty with targeted RES-E policies. Furthermore, policy risk around RES-E generation schemes might be easier to anticipate and manage than the various risks (e.g., international politics, uncertain supply and demand, liquidity risk) associated with carbon prices.
6.4 Sustaining Public Support In Europe, Canada, and the United States, the cost (real or perceived) of RES-E remuneration schemes has risen in public perception, and in some cases public support has softened. In Japan, the Fukushima Daichi nuclear accident has increased public support for RES-E. Whether positive or negative, public sentiment is crucial to next-generation RES-E policy.
Keeping in mind that externalised costs of conventional generation rarely are accounted for and likely exceed the costs of RE support and energy-system transition, issues of cost containment and allocation likely will become stronger forces acting on next-generation RES-E policies. These new motivations are especially evident with regard to securing RES-E generation, but also are evident in the context of ensuring flexibility and grid extension. Some key principles in this regard include those listed below.
6.4.1 “Who Pays”—Achieving Efficient Cost Allocatio n Although all sources of energy—conventional or RES-E—incur some level of integration cost (Milligan et al. 2011) the question of “who pays” becomes increasingly important, especially with regard to the price signals sent by various policy designs, and their overall effect on energy consumption on the one hand and public support on the other. From an economic viewpoint, ratepayer-funded (as opposed to taxpayer-funded) RES-E remuneration more efficiently achieves RES-E deployment goals, as energy prices more clearly reflect the cost of RES-E, encouraging efficiency.
Cost allocation also is important with regard to distribution network reinforcement. For example, questions often arise about whether only PV owners or the entire community of ratepayers should pay for grid reinforcement in jurisdictions where “net metering” is the prevailing remuneration scheme for private PV ownership. Jurisdictions that socialise these costs across the entire rate base tend to promote faster growth of PV deployment.
IEA-RETD RES-E-NEXT 04 July 2013
73
At the transmission-network level, cost allocation also is important. From a technical and economic perspective, locational pricing (where energy prices vary according to local network conditions) is widely regarded to be the most efficient method in place for pricing network congestion. Yet transitions to locational pricing generally create financial winners and losers, as some jurisdictions will be revealed to be producing congestion without paying for it, and others will be revealed to be bearing congestion costs without compensation. Further, the idea of different electricity prices for different consumers marks a change from normal operations. As such, there is significant resistance to locational pricing schemes. Nonetheless, net system benefits—in terms of overall cost reduction, more transparent cost allocation, and better price signals for generation and transmission investment—are positive, a fact which warrants consideration from policymakers.
6.4.2 Anticipating Investment Winners and Losers Numerous policy instruments hold the potential to create winners and losers in the power-system investment community, raising unique questions of cost allocation. Capacity markets hold the potential to solve the “missing money” problem in wholesale markets, for example. At the same time, however, they could depress wholesale prices in the aggregate—in effect, transferring revenues from one class of generators to another. Similarly, significant demand response participation could degrade the revenue streams of plants built in expectation of recovering costs during peak hours. For contexts in which policy changes are anticipated to create winners and losers, policymakers should consider intermediate steps to soften the impact of such changes.
6.4.3 Balancing Revenue Certainty with Cost Contain ment Next-generation RES-E policies must be nimble to react equitably to changing market conditions and grid needs; however, policies also must provide stability to ensure some degree of revenue certainty. Thus, policymakers must strike a balance between providing policy stability to encourage investment and deployment of RES-E, and responding to changing market conditions, costs, and rules governing power-system operations.
6.5 Guiding Innovation The body of this report highlighted numerous areas in which innovation in the realms of technology, business models, market design, and project development likely will be vital to the transition to high RES-E systems, including:
• Large-scale residential and small commercial demand response aggregation
• Viable business models for DSOs under high-RES-E futures
• Private investment in merchant transmission projects
• Viable storage and energy services business models
• Novel financing structures for RES-E generation projects.
Across all four domains—generation, grid, flexibility, and adequacy—innovation reduces incremental costs of the RES-E transition. These innovations do not happen at speed and scale without appropriate guiding policies in place. Principles that might guide next-generation policy are described below.
6.5.1 Improving Transparency of Policy Complexity To promote innovation and ensure continued growth and development of RES-E technologies over time, combinations of multiple policies might be necessary to address the interrelated aspects of new RES-E,
IEA-RETD RES-E-NEXT 04 July 2013
74
grid infrastructure, system flexibility, and adequacy. Overly complex policies that cannot be easily understood by investors and entrepreneurs will dampen the investment capital available to support industry growth. If policy complexity cannot be further minimised, policymakers could instead better clarify and make transparent to investors the interactions among policies, for example, the interactions among price-support schemes with policies to integrate RES-E into dispatch operations. Policies should be structured so that the implications on cost and financing of investments can be easily understood.
6.5.2 Promoting Flexibility in a Technology-Neutral Manner Next-generation RES-E policy should promote technology-neutral innovation in search of flexibility. For example, with higher penetration levels of variable RES-E on the system, there is a greater need for dispatchable resources. Conventional solutions would provide incentives that, directly or indirectly, favour supply-side technologies (e.g., gas turbines) that can be dispatched and provide balancing services for the grid. Next-generation policies instead would articulate desired performance characteristics, and attempt to neutrally incentivise the deployment of whatever systems provide the desired characteristics. This is most relevant to demand-side and storage resources competing for flexibility market share. Next-generation market design principles will promote competition by the widest range of flexibility options.
6.5.3 Encouraging Business Model Experimentation Business model innovation is key to next-generation RES-E investment, and examples have shown some promise in overcoming the various financial and regulatory barriers that stand in the way. Independent generators face business-model challenges as wholesale market revenues decline. Complementary markets for energy—for example heat—could bolster balance sheets.
Many distribution system operators are facing a cash squeeze due to declining revenue, as both energy efficiency and customer-owned generation increase, and capital expenditure requirements to refurbish old grids and reinforce grids with high penetration levels of variable RES-E also increase. The health and vigour of DSOs becomes increasingly important as distributed generation grows—old and weak low-voltage grids will work against widespread distributed generation.
Transitions to “network service” and “energy service” models likely will be part of the solution, yet DSOs often are conservative in nature and face various regulatory hurdles to changes in their business models. Affiliations of progressive DSOs already have begun to devise new principles for future business models. Increased action on this issue from policymakers and regulators also will become more important.
6.6 Conclusion: Common Forces Driving Next Generati on Policy Despite the diversity of power systems around the world, next generation RES-E policy will be a product of common forces. For all power systems aiming to integrate significant levels of variable RES-E, whether in China, Brazil, Japan, Canada, Ireland, the United Kingdom, or continental Europe, four forces shape power system evolution: regulatory paradigms, system operation, public perception, and the investment community (see Figure 16).
These forces already are producing compelling policy approaches around the world, providing a guide for policymakers looking ahead. A number of jurisdictions are integrating the complex interactions described in this report more fully into power-system planning processes. Operational experience has dispelled many prior assumptions about variable RES-E integration: Grid operators routinely integrate very large shares of variable RES-E into everyday operations. Investors and project developers have

IEA-RETD RES-E-NEXT 04 July 2013
75
weathered difficult economic straits to deploy tens of thousands of megawatts of RES-E capacity and various forces including tax credits, feed-in tariffs, market liberalisation have encouraged unprecedented new entry and diversity into the generation portfolio. Additionally, hundreds of pilot projects are underway around the world to test innovative technical and business model innovations.
Figure 16. Four key landscape dimensions acting on RES-E policy
Variable RES-E penetration levels matching those in Denmark and Ireland remain years off in most IEA-RETD jurisdictions, which suggests that a new round of learning-by-doing over the 2013–2025 timeframe will be available to inform the second wave of countries entering high RES-E futures. This next generation of RES-E policy will be marked not by revolution, but by evolution, innovation, and energy systems integration. Drawing upon ideas that have emerged in different parts of the world, RES-E policy will be most notable in that it will be fully integrated into broader power-system policy. Fortunately—as explored in this report—the foundations for this paradigm shift are in place.
IEA-RETD RES-E-NEXT 04 July 2013
76
7 References Aivaliotis, S. K. (2010). Dynamic Line Ratings for Optimal and Reliable Power Flow. Accessed June 6, 2013: http://www.ferc.gov/EventCalendar/Files/ 20100623162026-Aivaliotis,%20The%20Valley%20Group%206-24-10.pdf.
Alberta Electric System Operator (AESO 2007). “Alberta Government Unleashes Province’s Wind Power, AESO, Alberta.” Accessed June 6, 2013: www.aeso.ca/downloads/ News_Release_Wind_Announcement_-_September_26.pdf.
Alvarez, A. (2011). “A Planner’s Insights About the Need for Operating Flexibility Reserves for Higher Penetration of Variable Generation.” WECC webinar presentation (October 2011). Accessed March 2, 2013: http://www.wecc.biz/Planning/TransmissionExpansion/RTEP/20111020/ Lists/Presentations/1/Reserve%20Webinar_10_20_2011_%20PGaE%20Presentation.pdf.
Arup (2012). “A five minute guide to electricity storage.” Accessed June 6, 2013: http://www.arup.com/Publications/5_minute_guide_to_electricity_storage.aspx.
Bennear, L. S.; Stavins, R. N. (2007). “Second-Best Theory and the Use of Multiple Policy Instruments.” Environmental and Resource Economics 37(1); pp. 111–129. doi:10.1007/s10640-007-9110-y.
Bird, L.; Reger, A.; Heeter, J. (2012). “Distributed Solar Incentive Programs: Recent Experience and Best Practices for Design and Implementation.” NREL/TP-6A20-56308. Golden, CO: National Renewable Energy Laboratory. Accessed March 5, 2013: http://www.nrel.gov/docs/fy13osti/56308.pdf.
Bowring, J. (2011). “PJM Market Review: January through November, 2010.” Power Point Slide 37. Accessed June 6, 2013: http://www.monitoringanalytics.com/reports/Presentations/2011/ IMM_MC_SOM_Jan_thru_Nov_2010_20110127.pdf.
Brattle Group (2010). “Resource Adequacy and Renewable Energy in Competitive Wholesale Electricity Markets” Discussion paper by Serena Hesmondhalgh, Johannes Pfeifenberger and David Robinson. September 2010. Accessed June 6, 2013: http://www.brattle.com/_documents/ uploadlibrary/upload878.pdf.
Brattle Group (2011). “Demand Response Overview.” Presented to the Alberta Electricity System Operator (March 2011). Accessed June 6, 2013: www.aeso.ca/downloads/ Brattle_RTO_DR_Review_Final.pdf.
Buchanan, Alistair. (2013) Will GB’s Lights Stay on and Will the Gas Keep Flowing: A Look at the Next
Decade? OFGEM Presentation, February 19, 2013. Accessed June 6, 2013: http://www.ofgem.gov.uk/ Media/keyspeeches/Documents1/LECTURE%20-%2019TH%20FEBRUARY%202013.pdf.
Bürer, J.B.; Wüstenhagen, R. (2009). “Which Renewable Energy Policy is a Venture Capitalist’s Best Friend? Empirical Evidence from a Survey of International Cleantech Investors.” Energy Policy (37); pp. 4997–5006.
Burke, D.J.; O’Malley, M.J. (2011). “A Study of Optimal Non-Firm Wind Capacity Connection to Congested Transmission Systems.” IEEE Transactions on Sustainable Energy (2); pp. 167 176.

IEA-RETD RES-E-NEXT 04 July 2013
77
California Public Utilities Commission (CPUC 2013). “Renewable Auction Mechanism.” Accessed June 1, 2013: http://www.cpuc.ca.gov/PUC/energy/Renewables/hot/ Renewable+Auction+Mechanism.htm.
Cappers, P.; Mills, A.; Goldman, C.; Wiser, R.; Eto, J. (2011). Mass Market Demand Response and Variable
Generation Integration Issues: A Scoping Study. LBNL-5063E, October 2011. Accessed June 6, 2013: emp.lbl.gov/sites/all/files/lbnl-5063e.pdf.
Cigre WG B1.07 (2007). Statistics of AC Underground Cables in Power Networks. Cigre Technical Brochure. Accessed June 6, 2013: www.landsnet.is/uploads/1065.pdf.
Cloet, E.; Lilien, J-l (2011). “Uprating Transmission Lines through the use of an innovative real-time monitoring system.” 2011 IEEE PES 12th International Conference on Transmission and Distribution
Construction, Operation and Live-Line Maintenance (ESMO); May 16–19, 2011; pp. 1, 6.
Cochran, J.; Bird, L.; Heeter, J.; Arent, D. (2012) Integrating Variable Renewable Energy in Electric Power
Markets: Best Practices from International Experience. NREL/TP-6A00-53732. Golden, CO: National Renewable Energy Laboratory. Accessed June 6, 2013: http://www.nrel.gov/docs/ fy12osti/53732.pdf.
Cochran, J.; Bird, L.; Heeter, J.; Arent, D. (2012). Integrating Variable Renewable Energy in Electric Power
Markets: Best Practices from International Experience. May 1, 2012. Accessed June 6, 2013: http://www.nrel.gov/docs/fy12osti/53732.pdf.
Commission for Energy Regulation (CER) and Utility Regulator Energy Gas Water (UREGW) (2009). “Impact of High Levels of Wind Penetration in 2020 on the Single Electricity Market (SEM).”
Commission for Energy Regulation, Ireland (CER 2011). “Electricity Smart Metering Customer Behavior Trials Findings Report” (CER11080a). Accessed June 6, 2013: http://www.cer.ie/en/information-centre-reports-and-publications.aspx?article=5dd4bce4-ebd8-475e-b78d-da24e4ff7339.
Corbus, D.; King, J.; Mousseau, T.; Zavadil, R.; Heath, B.; Hecker, L.; Moland, G. (2010). Eastern Wind Integration and Transmission Study. NREL/CP-550-46505. Golden, CO: National Renewable Energy Laboratory. Accessed June 6, 2013: http://www.nrel.gov/docs/fy09osti/46505.pdf.
Couture, T. D.; Cory, K.; Kreycik, C.; Williams, E. (2010). Policymaker’s Guide to Feed-in Tariff Policy
Design. NREL/TP-6A2-44849. Golden, CO: National Renewable Energy Laboratory. Accessed March 5, 2013: http://www.nrel.gov/docs/fy10osti/44849.pdf.
Cramton, P. and Stoft, S. The Convergence of Market Designs for Adequate Generating Capacity. Report for California Electricity Oversight Board. April, 2006. Accessed June 18, 2013: http://works.bepress.com/cramton/34
de Jager, D.; Rathmann, M. (2008). Policy Instrument Design to Reduce Financing Costs in Renewable
Energy Technology Projects. Ecofys International BV. Accessed March 5, 2013: http://iea-retd.org/wp-content/uploads/2011/10/Policy_Main-Report.pdf.
Denny, E.; O’Malley, M. (2007). “Quantifying the Net Benefits of Grid Integrated Wind.” IEEE
Transactions on Power Systems 22 (2); pp. 605 – 615.
IEA-RETD RES-E-NEXT 04 July 2013
78
Denny, E.; O’Malley, M. (2009). “The Impact of Carbon Prices on Generation Cycling Costs.” Energy
Policy (37); pp. 1204–1212.
Doherty, R.; Mullane, A.; Lalor, G.; Burke, D.; Bryson, A.; O’Malley, M.J. (2010). “An Assessment of the Impact of Wind Generation on System Frequency Control.” IEEE Transactions on Power Systems (25); pp. 452–460.
Doherty, R.; O’Malley, M. (2005). “A New Approach to Quantify Reserve Demand in Systems with Significant Installed Wind Capacity.” IEEE Transactions on Power Systems 20 (2); pp. 587–595.
Drury, E.; Miller, M.; Macal, C.; Graziano, D.; Heimiller, D.; Ozik, J.; Perry, T. (2012). “The Transformation of Southern California’s Residential Photovoltaics Market through Third-Party Ownership.” Energy Policy (42); pp. 681-690.
ECAR, Australian Energy Market Operator (AEMO) (2011). Wind Integration: International Experience—
Review of Grid Codes. Accessed June 6, 2013: http://www.aemo.com.au/Electricity/ Planning/Related-Information/~/media/Files/Other/planning/0400-0050%20pdf.ashx.
EirGrid (2010). All Island TSO Facilitation of Renewables Studies, EirGrid, 2011. Accessed June 6, 2013: http://www.eirgrid.com/media/FacilitationRenewablesFinalStudyReport.pdf.
EirGrid (2011) Ensuring a Secure, Reliable and Efficient Power System in a Changing Environment,
EirGrid, 2011. Accessed June 6, 2013: http://www.eirgrid.com/media/ Ensuring_a_Secure_Reliable_and_Efficient_Power_System_Report.pdf.
EirGrid (2013). “Delivering a Secure Sustainable Electricity System (DS3).” Accessed June 5, 2013: http://www.eirgrid.com/operations/ds3/.
Électricité Réseau Distribution France (ERDF 2013). Personal communication with authors.
Elzinga, D.; Dillon, J.; O’Malley, M.J.; Lampreia, J. (2012). “The Role Electricity Storage in Providing Electricity System Flexibility.” Electricity in a Climate Constrained World. Paris: International Energy Agency.
EnerginetDK (2008). Technical Report on the Future Expansion and Undergrounding of the Electricity
Transmission Grid, Summary. April 2008. 28 pp. Accessed June 6, 2013: https://selvbetjening.preprod.energinet.dk/NR/rdonlyres/CC966C3A-FE78-41D8-9DC7-6B455210B502/0/TechnicalReportSummary.pdf.
ENTSO-E (2012). ENTSO-E’s Network Code Development Process, 2012. Accessed June 12, 2013: https://www.entsoe.eu/fileadmin/user_upload/_library/Association/120217_Network_Codes_Development_Process.pdf.
Eurelectric (2011). Flexible Generation: Backing Up Renewables. Accessed June 6, 2013: http://www.eurelectric.org/media/61388/flexibility_report_final-2011-102-0003-01-e.pdf.
Faruqui, A.; Sergici, S. (2010). “Household Response to Dynamic Pricing of Electricity—A Survey of the Empirical Evidence. Brattle group working paper series. Accessed June 6, 2013: http://ssrn.com/abstract=1134132.
IEA-RETD RES-E-NEXT 04 July 2013
79
Fritz, W. (2012) “Renewable Energy Feed in Tariffs, REBID, SASGI and the Smart Grid. Cape Peninsula University of Technology.” Energize (October); pp: 77-78. Accessed June 12, 2013: http://eepublishers.co.za/images/upload/energize_2012/09_ST_01_Renewable-energy.pdf
Fulton, Mark; Capalino, Reid. (2012) The German Feed-In Tariff: Recent Policy Changes. Deutsche Bank Group: DB Climate Change Advisors. Accessed March 5, 2013: http://www.dbresearch.com/ PROD/DBR_INTERNET_EN-PROD/PROD0000000000294376/ The+German+Feed-in+Tariff%3A+Recent+Policy+Changes.pdf.
GE Energy (2010). Western Wind and Solar Integration Study. NREL/SR-550-47434. Golden, CO: National Renewable Energy Laboratory.
Gooding, A., MacLeman, D. (2010). “The Application of Active Network Management to the Future Smart Grid.” Smart Grid 2010: Making it a Reality. IET Conference on Components, Circuits, Devices &
Systems 2010. May 25–26, 2010, London, England.
Gottstein, M., and Skillings, S.A. (2012). Beyond Capacity Markets - Delivering Capability Resources to
Europe's Decarbonised Power System. IEEE 2012. Accessed June 6, 2013: www.raponline.org/document/download/id/4854.
Gottstein, M.; Schwartz, L. (2012). The Role of Forward Capacity Markets in Increasing Demand-Side and Other Low-Carbon Resources: Experience and Prospects. The Regulatory Assistance Project, May 2010. Accessed June 12, 2013: http://www.raponline.org/document/download/id/91.
Grau, T. (2012). “Responsive Adjustment of Feed-in Tariffs to Dynamic PV Technology Development.” Discussion Papers 118. Berlin: DIW Berlin German Institute for Economic Research. Accessed June 6, 2013: http://www.diw.de/documents/publikationen/73/diw_01.c.392871.de/dp1189.pdf.
Greentech Media (2012). “Japan’s Tepco to Install 17 Million Smart Meters.” Accessed June 6, 2013: http://www.greentechmedia.com/articles/read/Japans-Tepco-To-Install-17M-Smart-Meters.
Hodge, B.-M.; Lew, D.; Milligan, M. (2013). “Short-Term Load Forecasting Error Distributions and Implications for Renewable Integration Studies.” Preprint. Presented at the IEEE Green Technologies Conference; April 4–5, 2013, Denver, Colorado. NREL/CP-5500-57340. www.nrel.gov/docs/fy13osti/57340.pdf.
Hogan, M., Gottstein, M. (2011) What Lies Beyond Capacity Markets? Delivering Least-Cost Reliability
Under the New Resource Paradigm. Regulatory Assistance Project. Accessed June 6, 2013: www.raponline.org/document/download/id/6041.
Hogan, W.W. (1992). “Contract Networks for Electric Power Transmission.” Journal of Regulatory
Economics (4); pp. 211-242.
Hogan, W.W. (2012). Electricity Scarcity Pricing Through Operating Reserves: An ERCOT Window of
Opportunity. Accessed June 6, 2013: www.hks.harvard.edu/fs/whogan/Hogan_ORDC_110112.pdf .
Hoke, A.; Komor, P. (2012). “Maximizing the Benefits of Distributed Photovoltaics.” Electricity Journal 25(3): pp. 1040-61.
IEA-RETD RES-E-NEXT 04 July 2013
80
Ibanez, E.; Milligan, M. (2012). “Impact of Transmission on Resource Adequacy in Systems with Wind and Solar Power.” IEEE Power and Energy Society General Meeting; July 22–26, 2012, San Diego, California.
IEA DSM (2012). “Smart Metering: Subtask 5, Report no 5.” Accessed June 12, 2013: http://www.ieadsm.org/Publications.aspx?ID=18.
IEA Renewable Energy Technology Deployment (2012). Six Policy Actions for Accelerated Deployment of
Renewable Energy. Accessed June 6, 2013: http://iea-retd.org/wp-content/uploads/2012/03/IEA-RETD_SixPolicyActions.pdf.
IEA WEO (2012) World Energy Outlook. Accessed June 6, 2013: http://www.worldenergyoutlook.org/publications/weo-2012/.
IEE (2012). Utility-Scale Smart Meter Deployments, Plans, and Proposals. IEE Report May 2012. Accessed June 6, 2013: http://www.edisonfoundation.net/iee/ Documents/IEE_SmartMeterRollouts_0512.pdf.
IFP (Energies nouvelle) (2013). “Mass Storage of Energy.” Panorama 2013. Accessed June 6, 2013: http://www.ifpenergiesnouvelles.com/publications/notes-de-synthese-panorama/panorama-2013.
Independent Electricity System Operator (December 2012). “Dispatch Technical Working Group Summary. SE-91 Renewable Integration.” Accessed May 9, 2013: http://www.ieso.ca/imoweb/ pubs/consult/se91/se91-20121213-DTWG_SummaryPresentation.pdf.
International Energy Agency (IEA 2008). Empowering Variable Renewables: Options for Flexible
Electricity Systems, in Support of the G8 Plan of Action. Accessed June 6, 2013: http://www.iea.org/ publications/freepublications/publication/Empowering_Variable_Renewables.pdf.
International Energy Agency (IEA 2010). Grid Integration of Variable Renewables: The FAST
Methodology. February 2010. Accessed June 12, 2013: www.iea.org/Textbase/npsum/Harness_Renewables2011SUM.pdf
International Energy Agency (IEA 2011). Harnessing Variable Renewables, A Guide to the Balancing
Challenge. Accessed June 6, 2013: http://www.iea.org/Textbase/npsum/ Harness_Renewables2011SUM.pdf .
Keane, A.; Milligan, M.; D’Annuzio, C.; Dent, C.; Dragoon, K.; Hasche, B.; Holttinen, H.; Samaan, N.; Soder, L.; O’Malley, M.J. (2011). “Capacity Value of Wind Power.” IEEE Transactions on Power Systems (26:2); pp. 564–572.
King, J.; Kirby, B.; Milligan, M.; Beuning, S. (2011). “Flexibility Reserve Reductions from an Energy Imbalance Market with High Levels of Wind Energy in the Western Interconnection.” 100 pp.; NREL/TP-5500-52330. Golden. CO: National Renewable Energy Laboratory.
Kirby, B.; O’Malley, M.J.; Ma, O.; Cappers, P.; Corbus, D.; Kiliccote, S.; Onar, O.; Starke, M.; Steinberg, D. (2011) “Load Participation in Ancillary Services. Workshop Report. U.S. Department of Energy, 2011.” Accessed June 6, 2013: http://www1.eere.energy.gov/analysis/pdfs/ load_participation_in_ancillary_services_workshop_report.pdf.
IEA-RETD RES-E-NEXT 04 July 2013
81
Kirby, B.J. (2007). Evaluating Transmission Costs and Wind Benefits in Texas: Examining the ERCOT CREZ
Transmission Study. Electric Power System Consulting, USA. Accessed June 6, 2013: http://www.consultkirby.com/files/Evaluating_Transmission_Costs_In_Texas.pdf .
Kitzing, L.; Mitchell, C.; Morthorst, P.E. (2012). “Renewable Energy Policies in Europe: Converging or Diverging?” Energy Policy (51); pp. 192-201.
Kiviluoma, J., Meibom, P., Tuohy, A., Troy, N., Milligan, M., Lange, B., O’Malley, M. (2012). Short-Term Energy Balancing With Increasing Levels of Wind Energy. IEEE Transactions on Sustainable Energy, 3(4), 769–776. doi:10.1109/TSTE.2012.2209210
Kiviluoma, J.; Meibom, P. (2010). Influence of wind power, plug-in electric vehicles, and heat storages on power system investments. Energy, 35(3): 1244-1255.
Krugman, P. (2013). Blog entry: “Minimum Wage Economics.” Accessed June 6, 2013: http://krugman.blogs.nytimes.com/2013/02/16/minimum-wage-economics/.
LaMonica, M. (2011). “Flywheel Storage Maker Beacon Power Declares Bankruptcy.” CNet. October 31, 2011. Accessed June 6, 2013: http://news.cnet.com/8301-11128_3-20127778-54/flywheel-storage-maker-beacon-power-declares-bankruptcy/.
Lannoye, E.; Flynn, D.; O’Malley, M. (2012). “Evaluation of Power System Flexibility.” IEEE Transactions
on Power Systems (27); pp. 922 – 931.
Lannoye, E.; Tuohy, A.; Flynn, D.; O’Malley, M. (2012). “Electric Power System Flexibility for Variable Renewable Integration.” Energy Policy (in review).
Ma, J.; Silva, V.; Belhomme, R.; Kirschen, D. (2012). Evaluating and Planning Flexibility in Sustainable Power. IEEE transactions on Sustainable Energy, in press, 2012.
Ma, O.; Alkadi, N.; Cappers, P.; Denholm, P.; Dudley, J.; Goli, S.; Hummon, M.; Kilicotte, S.; MacDonald, J.; Matsony, N.; Olsen, D.; Rose, C.; Sohn, M. D.; Starke, M.; Kirby B.; O’Malley, M.J. (2013). “Demand Response for Ancillary Services.” IEEE Transactions on Smart Grid (in press, 2013).
Ma, O.; O’Malley, M.J.; Cheung, K.; Larochelle, P. (2011). Analytic Challenges to Valuing Energy Storage. Workshop Report. U.S. Department of Energy. http://www1.eere.energy.gov/analysis/pdfs/ analytic_challenges_to_valuing_energy_storage_workshop_report.pdf.
Malnick, E. and R. Mendick (2011). “Wind farm paid £1.2M to produce no electricity,” The Telegraph, 20/09/2011.
McCalley, D.; Fu, W. (1999). “Reliability of Special Protection Schemes.” IEEE Transaction on Power
Systems (14: 4);.
Meibom, P.; Barth, R.; Hasche, B.; Brand, H.; Weber, C.; O´Malley, M.J. (2011). “Stochastic Optimisation Model to Study the Operational Impacts of High Wind Penetration Levels in Ireland.” IEEE Transactions
on Power Systems (26); pp. 1367–1379.

IEA-RETD RES-E-NEXT 04 July 2013
82
Mendelsohn, M. (2011). “Securitization: A Dirty Word, or a New Opportunity for Renewable Energy?” November, 28, 2011. Accessed June 6, 2013: https://financere.nrel.gov/finance/content/securitization-and-secondary-markets-renewable-energy.
Milligan, M. et al. (2011). “Cost-Causation and Integration Cost Analysis for Variable Generation.” NREL/TP-5500-51860. June 2011 Golden, CO: National Renewable Energy Laboratory. Accessed June 12, 2013: www.nrel.gov/docs/fy11osti/51860.pdf
Milligan, M., Porter, K., DeMeo, E., Denholm, P., Holttinen, H., Kirby, B., Miller, N., Mills, A., O’Malley, M.J., Schuerger, M. and Soder, L. (2009) Wind Power Myths Debunked”, IEEE Power & Energy, pp 89-99, Vol. 7, No 6.
Morales, J. et al. (2009). “Economic Valuation of Reserves in Power Systems with High Penetration of Wind Power.” IEEE Transactions on Power Systems (24: 2); pp. 900-910.
National Renewable Energy Laboratory (NREL 2011). “Operating Reserves and Variable Generation.” NREL/TP-5500-51978. Accessed June 5, 2013: http://www.nrel.gov/docs/ fy11osti/51978.pdf.
National Renewable Energy Laboratory (NREL) (2010). Western Wind and Solar Integration Study. Prepared by GE Energy. Golden, CO: National Renewable Energy Laboratory. Accessed June 6, 2013: http://www.nrel.gov/electricity/transmission/western_wind.html.
Navigant (2012). “Potential Role of Demand Response Resources in Maintaining Grid Stability and Integrating Variable Renewable Energy under California’s 33 Percent Renewable Portfolio Standard.” Prepared for California’s Demand Response Measurement & Evaluation Committee (DRMEC). July 20, 2012.
Neuhoff, K.; Boyd, R. (2011). “Technical Aspects of Nodal Pricing.” CPI Workshop Report. Berlin: CPI.
Neuhoff, K.; Schopp, A.; Boyd, R.; Stelmakh, K.; Vasa, A. (2012). “Banking of Surplus Emissions Allowances: Does the Volume Matter?” Discussion Papers of DIW Berlin 1196, DIW Berlin, German Institute for Economic Research.
North American Electric Reliability Corporation (NERC 2010). “Flexibility Requirements and Potential Metrics for Variable Generation: Implications for System Planning Studies.” Accessed June 5, 2012: www.uwig.org/IVGTF_Task_1_4_Final.pdf.
Ontario Power Generation (2013). Personal correspondence with the authors.
Oren, S. (2000). “Capacity Payments and Supply Adequacy in a Competitive Electricity Market.” Presentation delivered to VII SEPOPE, Curitiba-Parana Brazil, May 21-26, 2000.
Pearson, I. et al. (2012). Unconventional Gas: Potential Market Impacts in the European Union. JRC scientific and policy reports. Accessed June 6, 2013: http://ec.europa.eu/energy/studies/energy_en.htm.
Poonpun, P., Jewell, W.T. (2008). “Analysis of the Cost per Kilowatt Hour to Store Electricity.” IEEE
Transactions on Energy Conversion 23(2); pp 520–534.
IEA-RETD RES-E-NEXT 04 July 2013
83
Poyry (2011). “The Challenges of Intermittency In North West European Power Markets—The Impacts When Wind and Solar Deployment Reach Their Target Levels.” Accessed June 6, 2013: http://www.poyry.com/sites/default/files/imce/files/intermittency_-_march_2011_-_energy.pdf.
Ragwitz, M.; Huber, C. (2005). Feed-In Systems in Germany and Spain and a Comparison. Fraunhofer Institut für Systemtechnik und Innovationsforschung. Accessed June 6, 2013: http://www.renewwisconsin.org/ policy/ARTS/MISC%20Docs/Feed-In%20Systems%20in%20Germany%20and%20Spain.pdf.
Rassenti, S. J.; Smith, V. L.; Wilson, B. J. (2003). “Controlling Market Power and Price Spikes in Electricity Networks: Demand-Side Bidding.” Proceedings of the National Academy of Sciences, 100(5), 2998–3003. doi:10.1073/pnas.0437942100.
REN21 (2013). Renewables 2013 Global Status Report. REN 21 Secretariat. Paris, France. Accessed June 25, 2013: http://www.ren21.net/Portals/0/documents/Resources/GSR/2013/GSR2013_lowres.pdf
Rodrik, D. (2008). Second-Best Institutions. National Bureau of Economic Research, Working Paper 14050. Accessed June 6, 2013: http://www.nber.org/papers/w14050.
Rogers, J.; Fink, S.; Porter, K. (2010). Examples of Wind Energy Curtailment Practices. NREL/SR-550-48737. Golden, CO: National Renewable Energy Laboratory. Accessed March 5, 2013: http://www.nrel.gov/docs/fy10osti/48737.pdf.
Ruttledge, L.; Miller, N. W.; O’Sullivan, J.; Flynn, D. (2012). “Frequency Response of Power Systems with Variable Speed Wind Turbines.” IEEE Transactions on Sustainable Energy (3:4); pp. 683-691.
Singh, H. (2000). Call Options for Energy: A Market Based Alternative to ICAP. Accessed June 18, 2013: http://stoft.com/metaPage/lib/Singh-2000-10-Options-ICAP.pdf
Single Electricity Market Committee (SEMC 2012). “Treatment of Curtailment in Tie-Break Situations.” Accessed June 6, 2013: http://www.allislandproject.org/GetAttachment.aspx?id=1390439a-56ba-41cf-bce9-deb389db9bb6.
Sioshansi, R.; Denholm, P.; Jenkin, T.; Weiss, J. (2009). “Estimating the Value of Electricity Storage in PJM: Arbitrage and Some Welfare Effects.” Energy Economics, 31(2), 269–277. doi:10.1016/j.eneco.2008.10.005.
Stadler, I. (2012). “Introduction of Energy Storage into Energy Systems. Old Markets, New Market Models, Support Schemes: Approaches Derived from Technological Requirements.” Eurosolar Journal Solarzeitalter. February 2012.
Suwa, A.; Jupesta, J. (2012). “Policy Innovation for Technology Diffusion: A Case-Study of Japanese Renewable Energy Public Support Programs.” Journal of Sustainability Science (7); pp. 185–197.
Tuohy, A.; Meibom, P.; Denny, E.; O’Malley, M.J. (2009). “Unit Commitment for Systems with Significant Installed Wind Penetration.” IEEE Transactions on Power Systems (24); pp. 592–601.
Tuohy, A.; O’Malley, M. (2011). “Pumped Storage in Systems with Very High Wind Penetration.” Energy
Policy 39: pp. 1965-1974.
IEA-RETD RES-E-NEXT 04 July 2013
84
U.S. Energy Information Authority (EIA 2013). Residential Energy Consumption Survey. Accessed June 6, 2013: http://www.eia.gov/consumption/residential/.
Van Heretem, D.; Ghandhari, M. (2010). “Multi-Terminal VSC HVDC for the European Supergrid: Obstacles.” Renewable and Sustainable Energy Reviews (14).
Watson, D.; Matson, N.; Page, J.; et al. (2012). Fast Automated Demand Response to Enable the
Integration of Renewable Resources. CEC/LBNL, 2012. Accessed March 2, 2013: http://drrc.lbl.gov/publications/view/431.
Wattles, P. (2011). “Residential & Small Commercial Demand Response.” ERCOT presentation to Gulf Coast Power Association. October 5, 2011.
Wattles, P. (2012). “Demand Response and ERCOT Grid Reliability.” ERCOT presentation to Energy Efficiency Forum. May 23, 2012. Accessed June 6, 2013: http://www.ercot.com/content/news/ presentations/2012/ERCOT_EEForum_2012.pdf.
Weber, C. (2010). “Adequate Intraday Market Design to Enable the Integration of Wind Energy into the European Power Systems.” Energy Policy, 38(7), 3155–3163. doi:10.1016/j.enpol.2009.07.040.
Weiss, J.; Marin, P. (2012). Reforming Renewable Support in the United States: Lessons from National
and International Experience. The Brattle Group. Accessed March 5, 2013: http://www.brattle.com/_documents/UploadLibrary/Upload1113.pdf.
Westernlink (2013). Accessed June 6, 2013: http://www.westernhvdclink.co.uk/.
Xu, L. and Tretheway, D. “Flexible Ramping Products.” California ISO, Accessed: June 5, 2013: http://www.caiso.com/Documents/DraftFinalProposal-FlexibleRampingProduct.pdf.