Requirements -...
25
„ Salters Advanced Chemistry 2000 – see Copyright restrictions 171 Investigating amines and amino acids In this activity you will compare the properties of amines and amino acids, using butylamine as an example of an amine and glycine as an example of an amino acid. EP2.1 What you do Carry out the tests in Part 1 on butylamine, an example of an amine. Then carry out a similar series of tests in Part 2 on glycine, an example of an amino acid. Before you start, read through the tests and draw up a suitable table in which to record your observations. Your table should allow you to compare the behaviour of the two compounds. Part 1: Reactions of an amine 1 Solubility Add a few drops of butylamine (CARE Highly flammable; irritant vapour) to 1 cm depth of water in a test-tube. a Is butylamine soluble in water? Explain any solubility in terms of interactions between the particles concerned. b Record the pH of any solution which has been formed. Write an equation to explain any change to the pH of the water. 2 Adding acid and alkali Add a few drops of concentrated hydrochloric acid (CARE Corrosive) to the butylamine solution from test 1. Make a note of any changes, including smell, before and after addition of the acid (CARE Take very great care when smelling the vapours. Just gently waft your hand over the mouth of the test-tube towards your nose. Keep your head well away from the tube. Do this experiment very cautiously.). Then add about 2 cm depth of 2 mol dm –3 sodium hydroxide solution (CARE Corrosive) and shake the tube gently; again, note any changes. c Write equation(s) for any changes you have noted. 3 Reaction with copper(II) sulphate Add a few drops of butylamine to 1 cm depth of copper(II) sulphate solution in a test-tube. Make a note of any changes which occur. Requirements ● Universal Indicator paper ● test-tubes (8) and rack ● butylamine (2 cm 3 ) ● glycine (aminoethanoic acid) (2 g) ● concentrated hydrochloric acid (a few drops) ● sodium hydroxide solution, 2 mol dm –3 (10 cm 3 ) ● hydrochloric acid, 0.01 mol dm –3 (1 cm 3 ) ● sodium hydroxide solution, 0.01 mol dm –3 (2 cm 3 ) ● copper(II) sulphate solution, 0.1 mol dm –3 (2 cm 3 ) ● ethanoyl chloride (2 cm 3 ) CARE Butylamine and ethanoyl chloride are volatile and have unpleasant, highly flammable vapours. Use the bottles in a fume cupboard and avoid inhaling the vapours. butylamine ethanoyl chloride hydrochloric acid sodium hydroxide solution IRRITANT CARE Eye protection must be worn. HIGHLY FLAMMABLE CORROSIVE HIGHLY FLAMMABLE CORROSIVE CORROSIVE WEAR EYE PROTECTION A2 LEVEL
Transcript of Requirements -...

„ Salters Advanced Chemistry 2000 – see Copyright restrictions 171
Investigating amines andamino acids
In this activity you will compare the properties of
amines and amino acids, using butylamine as an
example of an amine and glycine as an example of an
amino acid.
EP2.1
What you doCarry out the tests in Part 1 on butylamine, an example of an amine. Then carryout a similar series of tests in Part 2 on glycine, an example of an amino acid.Before you start, read through the tests and draw up a suitable table in which torecord your observations. Your table should allow you to compare the behaviourof the two compounds.
Part 1: Reactions of an amine
1 Solubility Add a few drops of butylamine (CARE Highly flammable; irritantvapour) to 1 cm depth of water in a test-tube.
a Is butylamine soluble in water? Explain any solubility in terms of
interactions between the particles concerned.
b Record the pH of any solution which has been formed. Write an
equation to explain any change to the pH of the water.
2 Adding acid and alkali Add a few drops of concentrated hydrochloric acid(CARE Corrosive) to the butylamine solution from test 1. Make a note ofany changes, including smell, before and after addition of the acid (CARE
Take very great care when smelling the vapours. Just gently waft your handover the mouth of the test-tube towards your nose. Keep your head wellaway from the tube. Do this experiment very cautiously.). Then add about2 cm depth of 2 mol dm–3 sodium hydroxide solution (CARE Corrosive) andshake the tube gently; again, note any changes.
c Write equation(s) for any changes you have noted.
3 Reaction with copper(II) sulphate Add a few drops of butylamine to1 cm depth of copper(II) sulphate solution in a test-tube. Make a note of anychanges which occur.
Requirements� Universal Indicator paper� test-tubes (8) and rack� butylamine (2 cm3)� glycine (aminoethanoic acid) (2 g)� concentrated hydrochloric acid (a few drops)� sodium hydroxide solution, 2 mol dm–3 (10 cm3)� hydrochloric acid, 0.01 mol dm–3 (1 cm3)� sodium hydroxide solution, 0.01 mol dm–3 (2 cm3)� copper(II) sulphate solution, 0.1 mol dm–3 (2 cm3)� ethanoyl chloride (2 cm3)
CARE Butylamine and ethanoyl chloride are volatile and
have unpleasant, highly flammable vapours. Use the
bottles in a fume cupboard and avoid inhaling the vapours.
butylamine
ethanoyl chloride
hydrochloric acid
sodium hydroxide solution
IRRITANT
CARE Eye protection
must be worn.
HIGHLY
FLAMMABLE
CORROSIVE HIGHLY
FLAMMABLE
CORROSIVE
CORROSIVE
WEAR EYE
PROTECTION
A2 LEVEL

INVESTIGATING AMINES AND AMINO ACIDSEP2.1
172 „ Salters Advanced Chemistry 2000 – see Copyright restrictions
d Write down the formula of any new copper-containing particles which
may have been formed.
4 Adding ethanoyl chloride Place 10 drops of butylamine in a dry test-tube.Add 10 drops, one drop at a time, of ethanoyl chloride (CARE Highlyflammable and corrosive. Can react violently).
e Make a note of the results, and write an equation for any reaction
which occurs.
Add 1 cm depth of water to the tube and carefully stir the mixture. Then add3 cm depth of 2 mol dm–3 sodium hydroxide solution. Warm the mixture, andhold a piece of moistened pH paper at the mouth of the test-tube.
f Explain any change to the pH paper in terms of the process occurring
in the test-tube.
Part 2: Reactions of an amino acid
5 Solubility Add a few crystals of glycine to 1 cm depth of water in a test-tube.
g Is glycine soluble in water? Explain any solubility in terms of
interactions between the particles concerned.
h Record the pH of any solution which has been formed.
6 Adding acid and alkali Add 1 cm depth of 0.01 mol dm–3 hydrochloricacid, in two separate 0.5 cm depth portions, to the glycine solution from test 5. Then add 2 cm depth of 0.01 mol dm–3 sodium hydroxide in fourseparate 0.5 cm depth portions. Record the pH after each addition.
i Use your knowledge of the acid-base properties of an amino acid like
glycine to explain how the pH of the solution behaves during the
addition of acid or alkali.
7 Reaction with copper(II) sulphate Add a few crystals of glycine to 1 cmdepth of copper(II) sulphate solution in a test-tube. Make a note of anychanges which occur.
j Compare the behaviour of butylamine and glycine with copper(II)
sulphate solution.
8 Adding ethanoyl chloride Place a few crystals of glycine into a dry test-tube, and repeat the procedure in test 4.
k Compare the behaviour of butylamine and glycine with ethanoyl
chloride.
Comparison
l Make a note of the similarities between the reactions of butylamine
(an amine) and glycine (an amino acid).
m Explain any differences in the chemical properties of the two types of
compound.
n Suggest why butylamine is a low-boiling liquid but glycine is a high-
melting crystalline solid.
A2 LEVEL

„ Salters Advanced Chemistry 2000 – see Copyright restrictions 173
What’s in aspartame?
EP2.2 Is this activity you will apply your skills at
chromatography to help you investigate the conditions
needed for the hydrolysis of peptide bonds. You will be
looking at a simple example: aspartame, a dipeptide
used as an artificial sweetener. You will be
investigating what concentration of acid, and what
reflux time, are needed to hydrolyse the dipeptide.
IntroductionPeptide bonds in proteins can be hydrolysed by refluxing with hydrochloric acid.You will use the artificial sweetener aspartame as a substitute for a protein in thisactivity. Aspartame is the methyl ester of the dipeptide Asp Phe. The ester link inaspartame will also be hydrolysed under these conditions, so you will getaspartic acid and phenylalanine just as you would from the dipeptide itself.
The skeletal formula for aspartame is shown below.
Requirements� aspartame, eg Searle ‘Canderel’ tablets (1–3 tablets)� hydrochloric acid: various concentrations, eg 4 mol dm–3,
2 mol dm–3, 1 mol dm–3 (25 cm3 each)� 10 cm3 measuring cylinder� apparatus for heating under reflux, eg 50 cm3 pear-shaped
flask and water condenser� anti-bumping granules� apparatus for paper chromatography� 250 cm3 beaker� butan-1-ol (20 cm3)� glacial ethanoic acid (4 cm3)� separating funnel� aspartic acid solution,
0.01 mol dm–3 small amounts� phenylalanine solution, for chromatography
0.01 mol dm–3
� ninhydrin in butan-1-ol, 0.5% solution in spray bottle� mortar and pestle� hair dryer� protective gloves
butan-1-ol
ethanoic acid
hydrochloric acid
ninhydrin solution
HARMFUL
ÏÌÓ
H
aspartame
OCH3
O
N
H2N
HO
O
O
aspartame
CARE Eye protection
must be worn.
CORROSIVE
FLAMMABLE
CORROSIVE
WEAR EYE
PROTECTION
WEAR
PROTECTIVE
GLOVES
CARE Ninhydrin solution
must be used in a fume
cupboard. Gloves must be
worn. Wash the solution off
with lots of soap and water
if it contacts your skin.
HARMFUL FLAMMABLE
A2 LEVEL

WHAT’S IN ASPARTAME?EP2.2
174 „ Salters Advanced Chemistry 2000 – see Copyright restrictions
What you doYou are to investigate what concentration of acid and what reflux time aresufficient to hydrolyse the aspartame in one tablet.
You can use your skill at chromatography to analyse your reaction productsto find out whether the free amino acids are present in reasonable quantities.(Some tablets contain phenylalanine with the aspartame so you must detect both
phenylalanine and aspartic acid to be sure hydrolysis has occurred.)The chromatography solvent can be made by shaking together butan-1-ol
(CARE Harmful and flammable), glacial ethanoic acid (CARE Corrosive; avoidinhaling the vapour) and water in the ratio 5:1:4 by volume in a separatingfunnel. When the mixture settles, two layers will form. Use the upper, non-aqueous layer as your solvent.
Amino acids can be detected by spraying the paper with ninhydrin solution(CARE Harmful, flammable; observe the safety warnings above) and thenwarming the paper, for example using a hair dryer. Do not use a flame. Thespots may be slow to develop. Circle them with pencil when they appear, as theywill fade.
QUESTION
Write an equation for the hydrolysis of aspartame, showing the
skeletal formulae of the three products formed.
A2 LEVEL
„ Salters Advanced Chemistry 2000 – see Copyright restrictions 175
Number ofH atoms on
adjacent Shape of signalC atoms
0 single peak – singlet
1 two close peaks – doublet
2 three close peaks – triplet
3 four close peaks – quartet
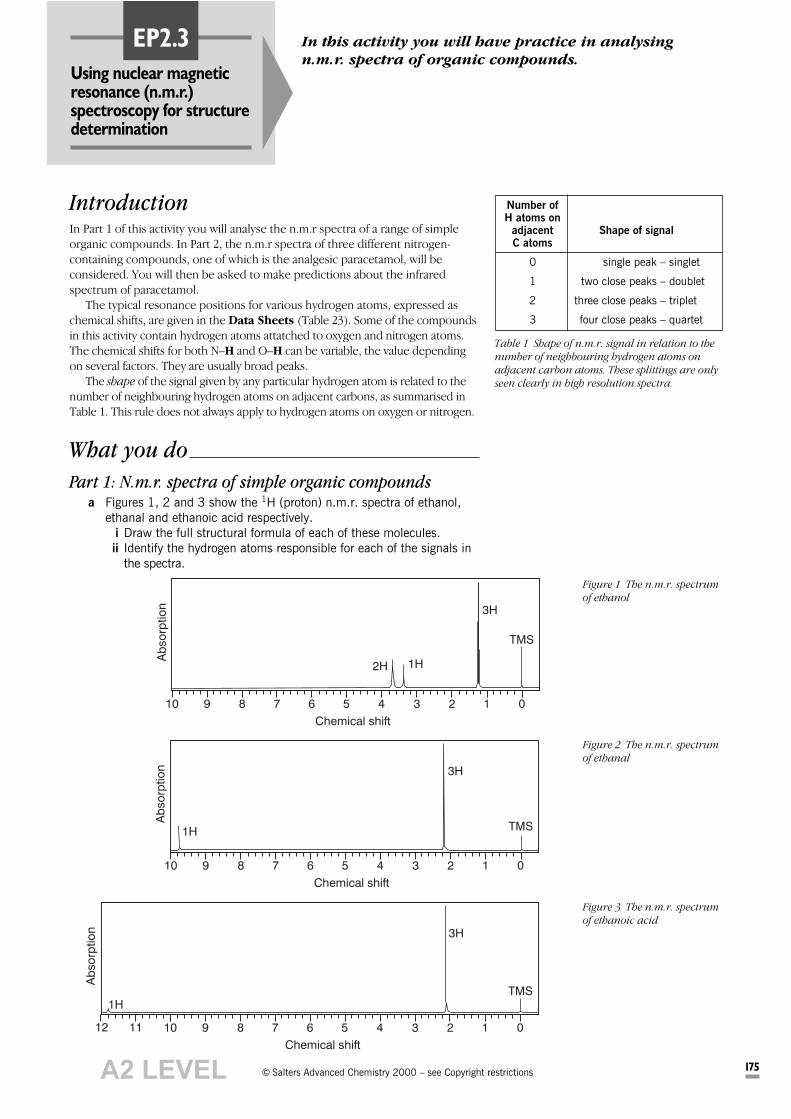
Figure 1 The n.m.r. spectrum
of ethanol
012345678910
TMS
3H
1H2H
Chemical shift
Ab
so
rptio
n
012345678910
TMS
3H
1H
Chemical shift
Ab
so
rptio
n
Figure 2 The n.m.r. spectrum
of ethanal
Figure 3 The n.m.r. spectrum
of ethanoic acid
012345678910
TMS
3H
1H
Chemical shift
1112
Ab
so
rptio
n
Using nuclear magneticresonance (n.m.r.) spectroscopy for structuredetermination
In this activity you will have practice in analysing
n.m.r. spectra of organic compounds.EP2.3
IntroductionIn Part 1 of this activity you will analyse the n.m.r spectra of a range of simpleorganic compounds. In Part 2, the n.m.r spectra of three different nitrogen-containing compounds, one of which is the analgesic paracetamol, will beconsidered. You will then be asked to make predictions about the infraredspectrum of paracetamol.
The typical resonance positions for various hydrogen atoms, expressed aschemical shifts, are given in the Data Sheets (Table 23). Some of the compoundsin this activity contain hydrogen atoms attatched to oxygen and nitrogen atoms.The chemical shifts for both N–H and O–H can be variable, the value dependingon several factors. They are usually broad peaks.
The shape of the signal given by any particular hydrogen atom is related to thenumber of neighbouring hydrogen atoms on adjacent carbons, as summarised inTable 1. This rule does not always apply to hydrogen atoms on oxygen or nitrogen.
What you do
Part 1: N.m.r. spectra of simple organic compoundsa Figures 1, 2 and 3 show the 1H (proton) n.m.r. spectra of ethanol,
ethanal and ethanoic acid respectively.
i Draw the full structural formula of each of these molecules.
ii Identify the hydrogen atoms responsible for each of the signals in
the spectra.
Table 1 Shape of n.m.r. signal in relation to the
number of neighbouring hydrogen atoms on
adjacent carbon atoms. These splittings are only
seen clearly in high resolution spectra.
A2 LEVEL
USING NUCLEAR MAGNETIC RESONANCE (n.m.r.) SPECTROSCOPY FOR STRUCTURE DETERMINATIONEP2.3
176 „ Salters Advanced Chemistry 2000 – see Copyright restrictions
012345678910
TMS
3H
1H
Chemical shift
2H
Ab
so
rptio
n
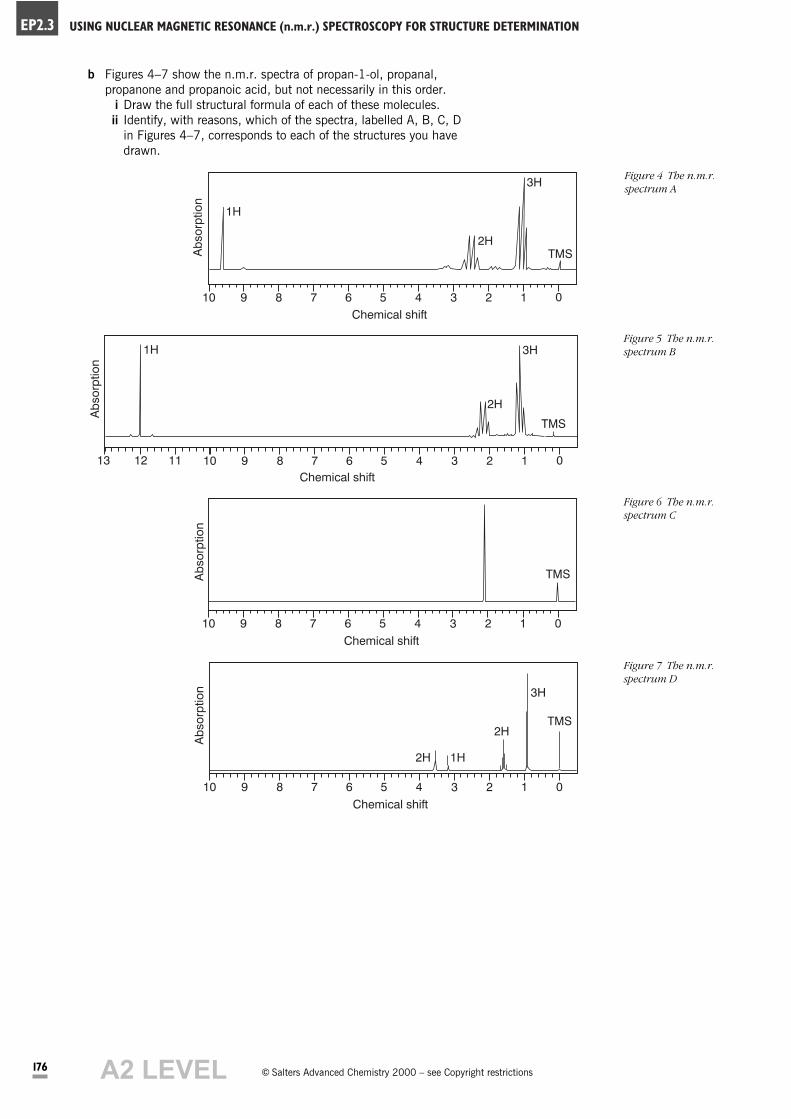
b Figures 4–7 show the n.m.r. spectra of propan-1-ol, propanal,
propanone and propanoic acid, but not necessarily in this order.
i Draw the full structural formula of each of these molecules.
ii Identify, with reasons, which of the spectra, labelled A, B, C, D
in Figures 4–7, corresponds to each of the structures you have
drawn.
Figure 7 The n.m.r.
spectrum D
Ab
so
rptio
n
012345678910
TMS
3H
1H
Chemical shift
2H
2H
Figure 4 The n.m.r.
spectrum A
012345678910
TMS
3H1H
Chemical shift
111213
2H
Ab
so
rptio
n
Figure 5 The n.m.r.
spectrum B
Ab
so
rptio
n
012345678
TMS
Chemical shift
910
Figure 6 The n.m.r.
spectrum C
A2 LEVEL
„ Salters Advanced Chemistry 2000 – see Copyright restrictions 177
EP2.3USING NUCLEAR MAGNETIC RESONANCE (n.m.r.) SPECTROSCOPY FOR STRUCTURE DETERMINATION
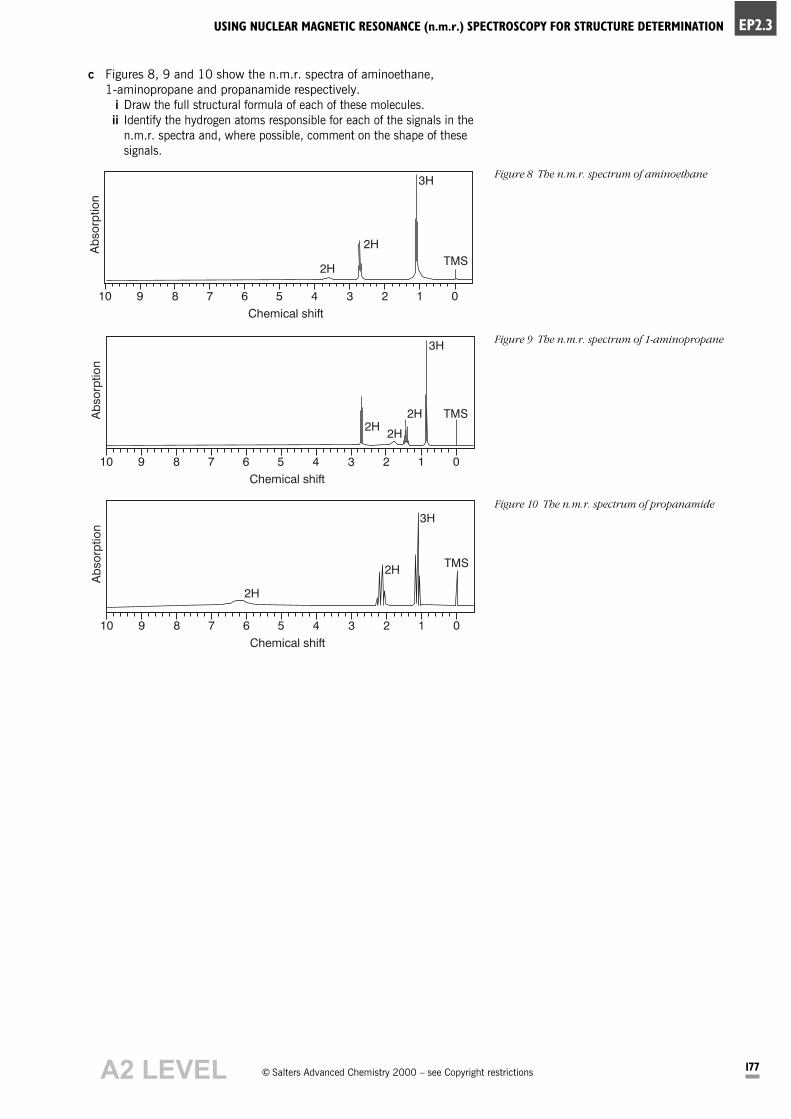
c Figures 8, 9 and 10 show the n.m.r. spectra of aminoethane,
1-aminopropane and propanamide respectively.
i Draw the full structural formula of each of these molecules.
ii Identify the hydrogen atoms responsible for each of the signals in the
n.m.r. spectra and, where possible, comment on the shape of these
signals.
Figure 8 The n.m.r. spectrum of aminoethane
Ab
so
rptio
n
012345678910
TMS
3H
Chemical shift
2H
2H
Figure 9 The n.m.r. spectrum of 1-aminopropane
Ab
so
rptio
n
012345678910
TMS
3H
Chemical shift
2H
2H2H
Ab
so
rptio
n
012345678910
Chemical shift
TMS
3H
2H
2H
Figure 10 The n.m.r. spectrum of propanamide
A2 LEVEL

e For the analgesic paracetamol, structure 2, use the information in the
Data Sheets to predict the main features of its i.r. spectrum.
USING NUCLEAR MAGNETIC RESONANCE (n.m.r.) SPECTROSCOPY FOR STRUCTURE DETERMINATIONEP2.3
178 „ Salters Advanced Chemistry 2000 – see Copyright restrictions
Figure 11 The n.m.r. spectrum E
Ab
so
rptio
n
012345678910
TMS
3H
1H
Chemical shift
1H
2H 2H
Figure 12 The n.m.r. spectrum F
Ab
so
rptio
n
012345678910
TMS
3H
Chemical shift
2H
2H
2H
2H
Figure 13 The n.m.r. spectrum G
Ab
so
rptio
n
012345678910
TMS
3H
Chemical shift
1H1H1H
1H1H1H
Part 2: N.m.r. spectra of other nitrogen-containingcompounds
d Use the information provided in the Data Sheets, together with your
knowledge of n.m.r. spectra in Part 1 to match the following
structures 1–3 with the n.m.r. spectra E–G in Figures 11–13.
NH2CH3CH2O 1
NHHO C CH3
O
2
NH C CH3
O
3
HO
A2 LEVEL
179
The shapes of a-aminoacids
This activity reinforces your reading of ChemicalIdeas 3.3 and 3.6 on the shapes of molecules and
optical isomerism.
„ Salters Advanced Chemistry 2000 – see Copyright restrictions
EP2.4
Requirements� molecular model kit� molecular modelling software (optional)
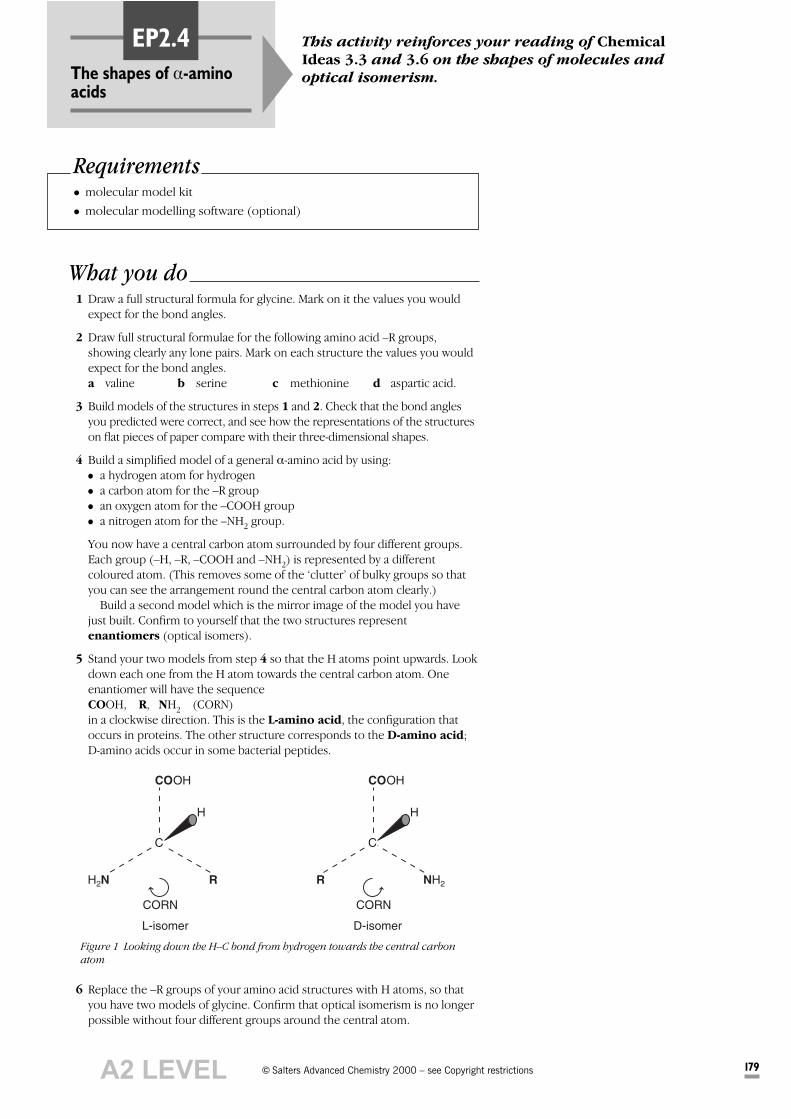
Figure 1 Looking down the H–C bond from hydrogen towards the central carbon
atom
C
COOH
H2N R
CORN
L-isomer
C
COOH
NH2R
CORN
D-isomer
HH
6 Replace the –R groups of your amino acid structures with H atoms, so thatyou have two models of glycine. Confirm that optical isomerism is no longerpossible without four different groups around the central atom.
What you do1 Draw a full structural formula for glycine. Mark on it the values you would
expect for the bond angles.
2 Draw full structural formulae for the following amino acid –R groups,showing clearly any lone pairs. Mark on each structure the values you wouldexpect for the bond angles.a valine b serine c methionine d aspartic acid.
3 Build models of the structures in steps 1 and 2. Check that the bond anglesyou predicted were correct, and see how the representations of the structureson flat pieces of paper compare with their three-dimensional shapes.
4 Build a simplified model of a general a-amino acid by using:� a hydrogen atom for hydrogen� a carbon atom for the –R group� an oxygen atom for the –COOH group� a nitrogen atom for the –NH2 group.
You now have a central carbon atom surrounded by four different groups.Each group (–H, –R, –COOH and –NH2) is represented by a differentcoloured atom. (This removes some of the ‘clutter’ of bulky groups so thatyou can see the arrangement round the central carbon atom clearly.)
Build a second model which is the mirror image of the model you havejust built. Confirm to yourself that the two structures representenantiomers (optical isomers).
5 Stand your two models from step 4 so that the H atoms point upwards. Lookdown each one from the H atom towards the central carbon atom. Oneenantiomer will have the sequenceCOOH, R, NH2 (CORN)in a clockwise direction. This is the L-amino acid, the configuration thatoccurs in proteins. The other structure corresponds to the D-amino acid;D-amino acids occur in some bacterial peptides.
A2 LEVEL

„ Salters Advanced Chemistry 2000 – see Copyright restrictions 180
A testing smell
EP2.5 This activity makes use of a naturally occurring pair
of enantiomers to illustrate how optical isomers can
have different properties.
What you do1 Label the test-tubes and their stoppers X, Y and Z. Place about a quarter of a
piece of chewing gum into one of the tubes, and about 10 caraway seeds intoanother. Make sure you keep a record of which material goes into which tube.
2 Then place either another piece of chewing gum or another 10 carawayseeds into the third tube. Seal all three tubes with the correct stoppers.
3 Get other members of your group to close their eyes and smell the contentsof each tube in turn, telling you which tubes smell the same and which isdifferent.
What it meansThe principal smell of chewing gum is due to L-carvone which smells ofspearmint. Caraway seeds smell of the enantiomer, D-carvone. It is claimed thatabout 20% of people cannot distinguish between these two smells.
Requirements� spearmint chewing gum (a half of a piece)� caraway seeds, crushed (about 20)� test-tubes wrapped in foil or paper to obscure their contents� stoppers or clingfilm
CH2
C
CH2
CH
C
C
CH3
O C
H
CH3
CH2
CH2
C
CH2
CH
C
C
CH3
OC
H
CH3
CH2
QUESTIONS
a Which two functional groups are present in carvone?
b i Draw skeletal formulae for D- and L-carvone.
ii On your skeletal formulae, use an asterisk (*) to denote the chiral
carbon atom.
c i What is the molecular formula of carvone?
ii Write down the molecular formula of the product of the reaction
of D-carvone with bromine molecules, Br2(l).
iii Would you expect L-carvone to react in the same way with
bromine? Explain your answer.
iv Draw a skeletal formula for the product of the reaction in c ii.
v How many chiral carbon atoms are there in the structure in c iv?
Mark each one with an asterisk.
d D- and L-carvone are different in the way they smell to the majority
of people. Suggest a reason why the enantiomers produce different
responses from the smell receptors in the body.
e Work out the percentage of people in your class survey who fail to
detect a difference between the two forms of carvone. How does
your result compare with the figure of 20% quoted earlier in this
activity? Comment on the fairness of the comparison.
L-carvone D-carvone
A2 LEVEL
„ Salters Advanced Chemistry 2000 – see Copyright restrictions 181
Taking note of proteins
This activity will help you summarise the information
in the first part of Storyline EP2.EP2.6
Making a summaryVery early in this course, in the unit The Elements of Life, you probablycarried out an activity – ‘Making the most of your study of chemistry’ (Activity
EL2.2) – about recording information. This introduced the idea of writing‘branched notes’.
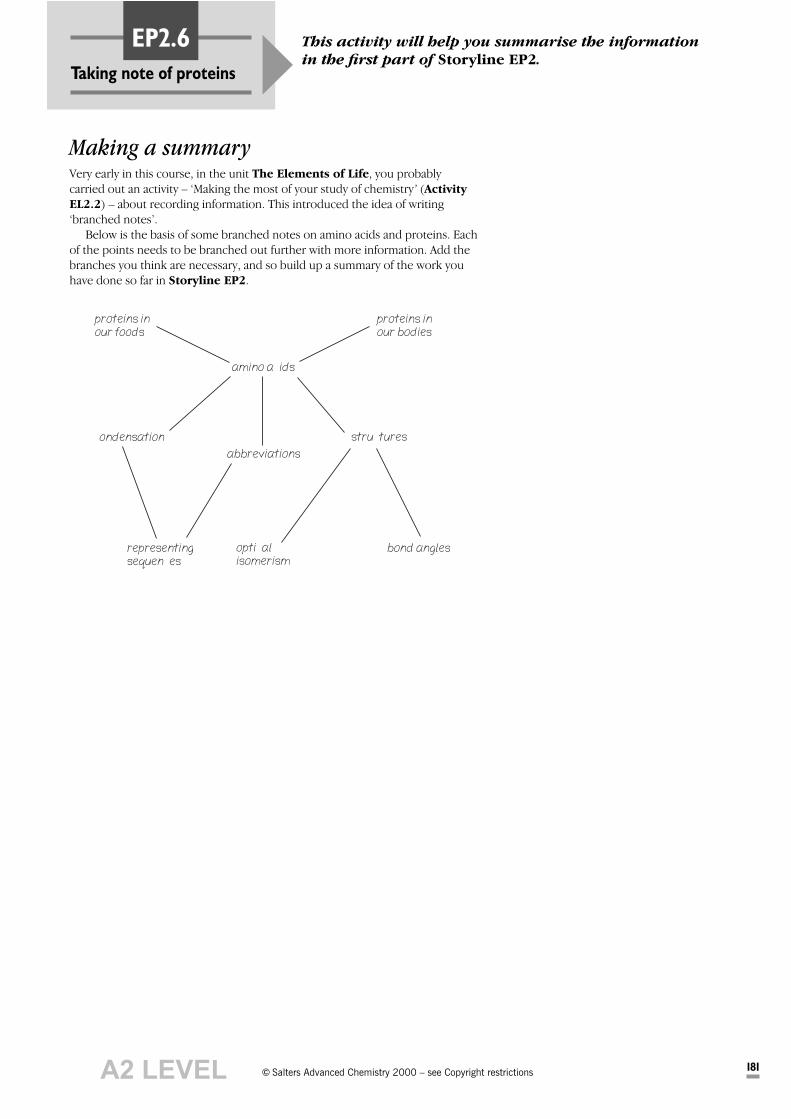
Below is the basis of some branched notes on amino acids and proteins. Eachof the points needs to be branched out further with more information. Add thebranches you think are necessary, and so build up a summary of the work youhave done so far in Storyline EP2.
proteins inour foods
proteins inour bodies
amino acids
condensation
abbreviations
structures
representingsequences
opticalisomerism
bond angles
A2 LEVEL

„ Salters Advanced Chemistry 2000 – see Copyright restrictions 182
Modelling DNA
EP2.7 The double-helix arrangement of DNA can be
explained in terms of intermolecular forces. This
activity helps you work out these explanations, and
become more familiar with the DNA structure.
Base pairing1 Refer to Storyline EP2 and use a molecular model kit to build models of
the structures of the four bases in DNA. Leave spare bonds to indicate theconnections to the sugar–phosphate ‘backbone’.
2 Try different combinations of pairs of bases to investigate which moleculesform strong hydrogen bonds with one another. Remember:� the bonds to the sugar–phosphate ‘backbone’ must be at opposite sides of
the bases� the hydrogen bonds should be about 50% longer than the covalent bonds� the bases interact in a flat arrangement.
3 Draw diagrams for the structures of the base pairs which fit well together.
The double helix4 Use the plastic-coated wire, plastic straws and pegs supplied to make a
ladder like the one shown in Figure 1. Use about 15 pegs on each side.a What feature of DNA is represented by:
i the plastic-coated wire?
ii the straws?
5 Twist your model to form a double helix with ten straws to a turn – that isthe eleventh straw should lie directly over the first straw. This represents theextent to which DNA is twisted.
6 Compare your model with the space-filling representation of DNA shown inFigure 2.
7 You might take the opportunity to investigate the DNA structure further byusing a molecular visualisation package (eg RASMOL).
b What do you notice about the region in the centre of the double helix
– the region occupied by the bases? (These are shown as unshaded
atoms in the figure.)
c Explain why the DNA double helix could not be twisted more tightly
than it is.
d As you have seen, hydrogen bonding is responsible for the
interactions between the bases in a direction across the axis of the
double helix – in other words, horizontally in Figure 2. Explain what
type of intermolecular bonding is responsible for the interactions
between the bases along the axis of the double helix – in other words,
vertically in Figure 2.
e Your answer to d should help you to understand why the DNA double
helix is twisted to the extent shown by your model. Explain why a
less tightly twisted DNA double helix would be unlikely to form.
Figure 2 Space-filling model of DNA
Requirements� molecular model kit� plastic-coated wire, e.g. RS30 ¥ 0.25 mm strand (1 m)� plastic pegs, eg Cochrane’s ‘Minit’ peg, type a (30)� plastic straws to fit pegs, 10 cm (15)� RASMOL molecular visualisation application and files of nucleic acid
structures (optional)
Figure 1 Building a double helix
A2 LEVEL
„ Salters Advanced Chemistry 2000 – see Copyright restrictions 183
Life reveals its twistedsecret
This activity will give you practice at composing a
piece of scientific writing from a range of source
materials.
EP2.8
What you doImagine that it is 1953. Francis Crick and James Watson have just announced amomentous discovery about the structure of DNA. You have beencommissioned to write an article of 400–500 words for a science magazine. Yourarticle should review the various structures which have been proposed for DNA,and explain why the Crick-Watson structure seems most appropriate.
To help you, you have collected together some clippings from books andmagazines, and some brief details about the principal research scientists in thefield. You may include illustrations in your article. Remember – your audiencewill have some understanding of science, though they will not be experts in thisparticular field.
When you have finished, write a short abstract (no more than 50 words)which summarises the main points of your article.
Setting the sceneBy the early 1950s, protein structure had been well worked out. Several groupswere turning their attention to DNA, the one remaining cell polymer with anunknown structure.
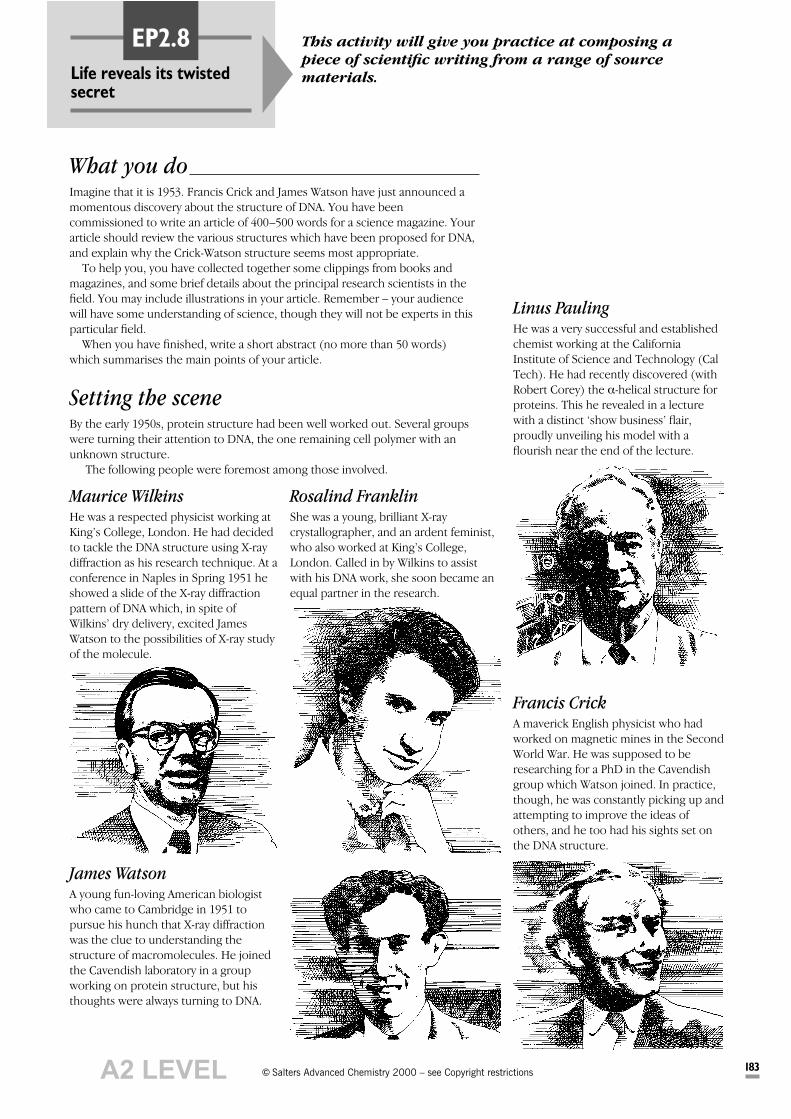
The following people were foremost among those involved.
Maurice WilkinsHe was a respected physicist working atKing’s College, London. He had decidedto tackle the DNA structure using X-raydiffraction as his research technique. At aconference in Naples in Spring 1951 heshowed a slide of the X-ray diffractionpattern of DNA which, in spite ofWilkins’ dry delivery, excited JamesWatson to the possibilities of X-ray studyof the molecule.
Rosalind FranklinShe was a young, brilliant X-raycrystallographer, and an ardent feminist,who also worked at King’s College,London. Called in by Wilkins to assistwith his DNA work, she soon became anequal partner in the research.
Linus PaulingHe was a very successful and establishedchemist working at the CaliforniaInstitute of Science and Technology (CalTech). He had recently discovered (withRobert Corey) the a-helical structure forproteins. This he revealed in a lecturewith a distinct ‘show business’ flair,proudly unveiling his model with aflourish near the end of the lecture.
James WatsonA young fun-loving American biologistwho came to Cambridge in 1951 topursue his hunch that X-ray diffractionwas the clue to understanding thestructure of macromolecules. He joinedthe Cavendish laboratory in a groupworking on protein structure, but histhoughts were always turning to DNA.
Francis CrickA maverick English physicist who hadworked on magnetic mines in the SecondWorld War. He was supposed to beresearching for a PhD in the Cavendishgroup which Watson joined. In practice,though, he was constantly picking up andattempting to improve the ideas ofothers, and he too had his sights set onthe DNA structure.
A2 LEVEL

LIFE REVEALS ITS TWISTED SECRETEP2.8
184 „ Salters Advanced Chemistry 2000 – see Copyright restrictions
The clippingsRosalind Franklin’s early ideas about DNA (November1951)
The general characteristics of the diagram suggest that the DNA chains arein a helical form.
… The results suggest a helical structure (which must be very closelypacked) containing probably 2, 3 or 4 co-axial nucleic acid chains perhelical unit, and having the phosphate groups near the outside.
Crick and Watson’s 3-chain model (1951/1952)Decisions had to be made about the number of polynucleotide chainswithin the DNA molecule. Superficially, the X-ray data were compatiblewith two, three, or four strands. It was all a question of the angle and radiiat which the DNA strands twisted about the central axis.
… we had decided upon models in which the sugar-phosphatebackbone was in the center of the molecule.
… we looked at the pros and cons of one, two, three, and four chains,quickly dismissing one-chain helices as incompatible with the evidence inour hands. As to the forces that held the chains together, the best guessseemed to be salt bridges in which divalent cations like Mg++ held togethertwo or more phosphate groups. Admittedly there was no evidence thatRosy’s samples contained any divalent ions, and so we might be sticking ournecks out. … with luck, the addition of magnesium or possibly calcium ionsto the sugar-phosphate backbone would quickly generate an elegantstructure, the correctness of which would not be debatable.
… a shape began to emerge which brought back our spirits. Threechains twisted about each other in a way that gave rise to crystallographicrepeat every 28 Å along the helical axis.
Note: An ångström (Å) is 1 ¥ 10–10m, so 28 Å is 2.8 nm.
Franklin’s response to the Crick-Watson 3-chain model(1952)
Wilkins was invited to Cambridge to witness the triumph; William Seeds, whoworked with Wilkins, came along, and Rosalind and Gosling as well. Thesession was opened by Crick with an exposition of helical diffraction theory,a subject upon which he was very expert, and went on to a description of themodel, of which Rosalind plainly did not think much. Her disdain of itWatson accounts for on the grounds that what was proposed was a helicalstructure, while Rosalind did not admit that a shred of evidence existed toindicate that DNA was helical – a curious statement, considering that veryshortly before she had presented a good deal of evidence suggesting that theB form of DNA was exactly that. What she did object to in the proposedstructure – and aggressively, we are told – was that the three-chain modelhad its phosphate groups held together by Mg++ ions in a way she thoughtunlikely, considering that by her calculations the Mg++ ions would besurrounded by tight shells of water molecules.
And as Watson was required to confess, her objections, though veryannoying, were not mere perversity.
A. Sayre 1975. Rosalind Franklin and
DNA (New York: Norton, pp. 125–6). Reprinted 1978.
James D. Watson 1968. The Double Helix
(London: Weidenfeld & Nicolson, pp. 77–89). With new introduction, 1999(London: Penguin Books).
A. Sayre 1975. Rosalind Franklin and
DNA (New York: Norton, pp. 135–6).Reprinted 1978.
A2 LEVEL

„ Salters Advanced Chemistry 2000 – see Copyright restrictions 185
EP2.8LIFE REVEALS ITS TWISTED SECRET
Pauling’s 3-helix model (1952/1953)We have formulated a structure for the nucleic acids which is compatiblewith the main features of the X-ray diagram and with the generalprinciples of molecular structure, and which accounts satisfactorily forsome of the chemical properties of the substances. The structure involvesthree intertwined helical polynucleotide chains. Each chain, which isformed by phosphate di-ester groups and linking b-D-ribofuranose[D-ribose] or b-D-deoxyribofuranose [D-deoxyribose] residues with 3', 5'linkages, has approximately twenty-four nucleotide residues in seven turnsof the helix. The helixes have the sense of a right handed screw. Thephosphate groups are closely packed about the axis of the molecule, withthe pentose residues surrounding them, and the purine and pyrimidinegroups projecting radially, their planes being approximately perpendicularto the molecular axis. The operation that converts one residue to the nextresidue in the polynucleotide chain is rotation by about 105° andtranslation by 3.4 Å.
A detailed description of the structure is appearing in the February1953 issue of the Proceedings of the National Academy of Sciences of the
United States of America.
Watson’s response to Pauling’s ideas (1953)At once I felt something was not right. I could not pinpoint the mistake,however, until I looked at the illustrations for several minutes. Then Irealized that the phosphate groups in Linus’ model were not ionized, butthat each group contained a bound hydrogen atom and so had no netcharge. Pauling’s nucleic acid in a sense was not an acid at all. Moreover,the uncharged phosphate groups were not incidental features. Thehydrogens were part of the hydrogen bonds that held together the threeintertwined chains. Without the hydrogen atoms, the chains wouldimmediately fly apart and the structure vanish.
Everything I knew about nucleic-acid chemistry indicated thatphosphate groups never contained bound hydrogen atoms.
Pauling’s later commentsI calculated the number of polynucleotide chains per unit to be exactlythree. This result surprised me, because I had expected the value 2 if thenucleic acid fibres really represented genes … During the next month Istrove to find a way of arranging the polynucleotide chains in a triplehelix, and was successful, although the structure was described as “anextraordinarily tight one, with little opportunity for change in positions ofthe atoms” …
In hindsight, it is evident that I made a mistake … in having decided tostudy the triple helix rather than the double helix. … I am now astonishedthat I began work on the triple helix structure, rather than on the doublehelix. I had not forgotten … that the gene might consist of twocomplementary molecules, but for some reason, not clear to me now, thetriple chain structure apparently appealed to me, possibly because theassumption of a three-fold axis simplified the search for an acceptablestructure.
Crick and Watson’s crucial paperThey acknowledge the contribution of Rosalind Franklin and Maurice Wilkins atthe end of the paper. (See next sheet.)
Linus Pauling, Robert B. Corey 1953.Structure of the Nucleic Acids. In Nature,February 21, vol. 171, p.346.
James D. Watson 1968. The Double Helix
(London: Weidenfeld & Nicolson, p. 160).With new introduction, 1999 (London:Penguin Books).
Linus Pauling 1974. Molecular Basis ofBiological Specificity. In Nature, vol. 248, p. 771.
A2 LEVEL

LIFE REVEALS ITS TWISTED SECRETEP2.8
186 „ Salters Advanced Chemistry 2000 – see Copyright restrictions
MOLECULAR STRUCTURE OF
NUCLEIC ACIDS
A Structure for Deoxyribose Nucleic Acid
WE wish to suggest a structure for the salt of deoxyribose nucleic acid (D.N.A). This
structure has novel features which are of considerable biological interest.A structure for nucleic acid has already been
proposed by Pauling and Corey1. They kindly made their manuscript available to us in advance of publication. Their model consists of three inter-twined chains, with the phosphates near the fibre axis, and the bases on the outside. In our opinion, this structure is unsatisfactory for two reasons: (1) We believe that the material which gives the X-ray diagrams is the salt, not the free acid. Without the acidic hydrogen atoms it is not clear what forces would hold the structure together, especially as the negatively charged phosphates near the axis will repel each other. (2) Some of the van der Waals distances appear to be too small.Another three-chain structure has also been sug-
gested by Fraser (in the press). In his model the phosphates are on the outside and the bases on theinside, linked together by hydrogen bonds. This structure as described is rather ill-defined, and for
this reason we shall not commenton it.We wish to put forward a
radically different structure forthe salt of deoxyribose nucleicacid. This structure has two helical chains each coiled roundthe same axis (see diagram). Wehave made the usual chemicalassumptions, namely, that eachchain consists of phosphate di-ester groups joining ß-D-deoxy-ribofuranose residues with 3',5'linkages. The two chains (but not their bases) are related by adyad perpendicular to the fibreaxis. Both chains follow right-handed helices, but owing to the dyad the sequences of theatoms in the two chains run in opposite directions. Each chain loosely resembles Fur-berg’s2 model No. 1; that is, the bases are on the inside of the helix and the phosphates onthe outside. The configuration of the sugar and the atoms near it is close to Furberg’s ‘standard configuration’, thesugar being roughly perpendi-cular to the attached base. There
is a residue on each chain every 3·4 A. in the z-direc-tion. We have assumed an angle of 36° between adjacent residues in the same chain, so that the structure repeats after 10 residues on each chain, thatis, after 34 A. The distance of a phosphorus atom fromthe fibre axis is 10 A. As the phosphates are on theoutside, cations have easy access to them.The structure is an open one, and its water content
is rather high. At lower water contents we wouldexpect the bases to tilt so that the structure couldbecome more compact.The novel feature of the structure is the manner
in which the two chains are held together by the purine and pyrimidine bases. The planes of the basesare perpendicular to the fibre axis. They are joinedtogether in pairs, a single base from one chain beinghydrogen-bonded to a single base from the otherchain, so that the two lie side by side with identical z-co-ordinates. One of the pair must be a purine and
the other a pyrimidine for bonding to occur. Thehydrogen bonds are made as follows: purine position 1 to pyrimidine position 1; purine position 6 to pyramidine position 6.If it is assumed that the bases only occur in the
structure in the most plausible tautomeric forms (that is, with the keto rather than the enol con-figurations) it is found that only specific pairs of bases can bond together. These pairs are: adenine(purine) with thymine (pyrimidine), and guanine(purine) with cytosine (pyrimidine).In other words, if an adenine forms one member of
a pair, on either chain, then on these assumptions the other member must be thymine; similarly for guanine and cytosine. The sequence of bases on a single chain does not appear to be restricted in any way. However, if only specific pairs of bases can beformed, it follows that if the sequence of bases on one chain is given, then the sequence on the otherchain is automatically determined.It has been found experimentally3,4 that the ratio
of the amounts of adenine to thymine, and the ratio of guanine to cytosine, are always very close to unityfor deoxyribose nucleic acid. It is probably impossible to build this structure
with a ribose sugar in place of the deoxyribose, as the extra oxygen atom would make too close a van der Waals contact.The previously published X-ray data5,6 on deoxy-
ribose nucleic acid are insufficient for a rigorous testof our structure. So far as we can tell, it is roughlycompatible with the experimental data, but it must be regarded as unproved until it has been checkedagainst more exact results. Some of these are given in the following communications. We were not awareof the details of the results presented there when wedevised our structure, which rests mainly though notentirely on published experimental data and stereo-chemical arguments.It has not escaped our notice that the specific
pairing we have postulated immediately suggests apossible copying mechanism for the genetic material.Full details of the structure, including the con-
ditions assumed in building it, together with a set of co-ordinates for the atoms, will be published elsewhere.We are much indebted to Dr. Jerry Donohue for
constant advice and criticism, especially on inter-atomic distances. We have also been stimulated by a knowledge of the general nature of the unpublishedexperimental results and ideas of Dr. M. H. F.Wilkins, Dr. R. E. Franklin and their co-workers atKing’s College, London. One of us (J. D. W.) has beenaided by a fellowship from the National Foundationfor Infantile Paralysis.
J. D. WatsonF. H. C. Crick
Medical Research Council Unit for the Study of the Molecular Structure of
Biological Systems.Cavendish Laboratory, Cambridge.
April 2.
1 Pauling, L., and Corey, R. B.. Nature, 171, 346 (1953); Proc. U.S.Nat. Acad. Sci., 39, 84 (1953).
2 Furberg, S., Acta Chem. Scand., 6, 634 (1952).3 Chargaff, E., for references see Zamenhof, S., Brawerman, G. and
Chargaff, E., Biochim. et Biophys. Acta, 9, 402 (1952).4 Wyatt, G. R., J. Gen. Physiol., 36, 201 (1952).5 Astbury. W. T., Symp. Soc. Exp. Biol. 1, Nucleic acid, 66 (Camb.
Univ. Press, 1947).6 Wilkins, M. H. F., and Randell, J. T., Biochim. et Biophys. Acta,
10, 192 (1953).
NATURE
NO. 4356 April 25, 1953
This figure is purely diagrammatic. The tworibbons symbolize the two phosphate—sugarchains, and the horizon-tal rods the pairs ofbases holding the chains together. The vertical line marks the fibre axis.
A2 LEVEL
„ Salters Advanced Chemistry 2000 – see Copyright restrictions 187
Testing for glucose
Diabetes can be diagnosed by detecting glucose in the
urine. The test must be specific to avoid confusion
with other compounds which may be present. The
specificity of an enzyme in its reaction with a
particular substrate is therefore a useful basis for
such a test. In this activity you can find out about the
specificity of the enzyme glucose oxidase and
investigate some of its other properties.
EP6.1
What you doCarefully read the instructions which come with the glucose test strips, andmake sure you know how they work (see also Storyline EP6).
1 The glucose solution you are supplied with has a similar concentration to theglucose in the urine of someone who is diabetic. Check that the test stripswork with the glucose solution.
2 Investigate how the activity of the enzyme glucose oxidase is affected bychanging:
� pH� temperature� substrate (the sugar used).
Record your results in the form of a table.
3 You might like to go on to refine your experiments in order to discover inmore detail how the enzyme’s activity depends on pH and temperature.
4 Summarise your findings and suggest explanations for the effects you havenoted.
Requirements� glucose test strips (such as ClinistixTM or DiastixTM)� hydrochloric acid, 1 mol dm–3
� sodium hydroxide solution, 1 mol dm–3
� glucose solution, 0.02 mol dm–3
� solutions or samples of other sugars
sodium hydroxide solutionIRRITANT
CARE Eye protection
must be worn.WEAR EYE
PROTECTION
A2 LEVEL
„ Salters Advanced Chemistry 2000 – see Copyright restrictions 188
Succinatedehydrogenase(Optional extension)
EP6.2 In this activity you will use models to investigate the
binding of a substrate to the active site of an enzyme.
This will help you to understand why enzymes are so
specific, and how some compounds can act as enzyme
inhibitors.
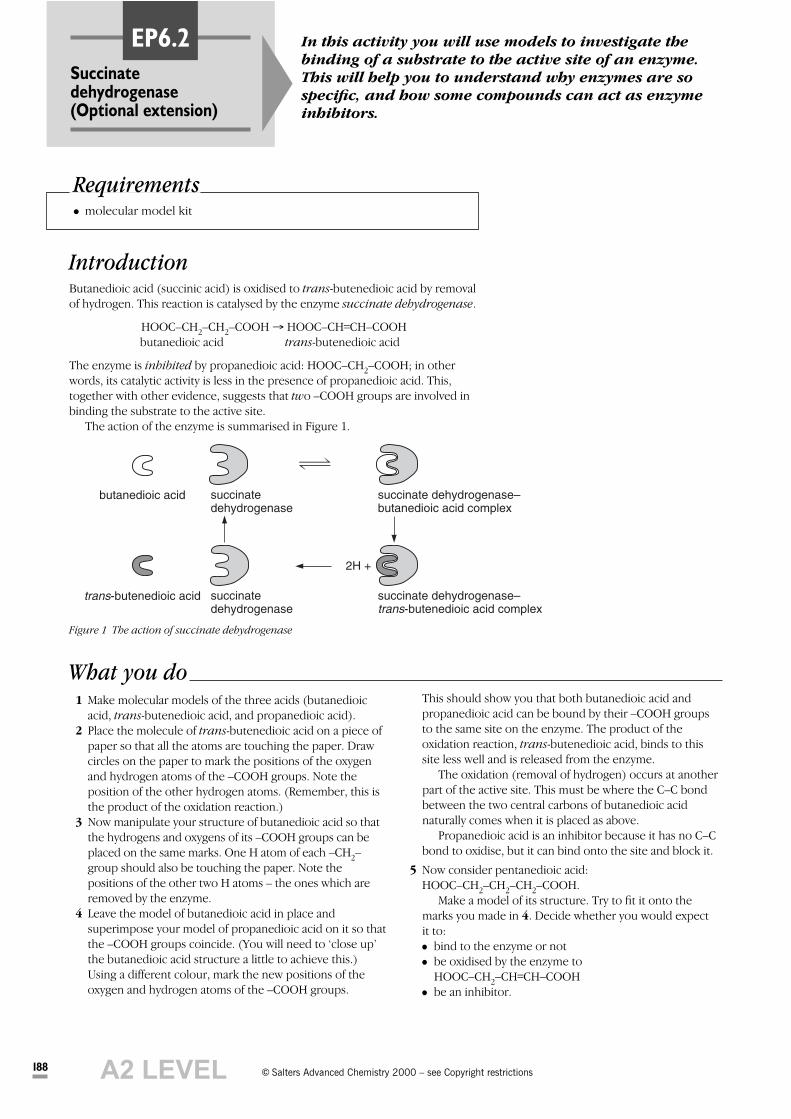
IntroductionButanedioic acid (succinic acid) is oxidised to trans-butenedioic acid by removalof hydrogen. This reaction is catalysed by the enzyme succinate dehydrogenase.
HOOC–CH2–CH2–COOH Æ HOOC–CH––CH–COOHbutanedioic acid trans-butenedioic acid
The enzyme is inhibited by propanedioic acid: HOOC–CH2–COOH; in otherwords, its catalytic activity is less in the presence of propanedioic acid. This,together with other evidence, suggests that two –COOH groups are involved inbinding the substrate to the active site.
The action of the enzyme is summarised in Figure 1.
Requirements� molecular model kit
succinate dehydrogenase
butanedioic acid succinate dehydrogenase–butanedioic acid complex
succinate dehydrogenase
trans-butenedioic acid succinate dehydrogenase–trans-butenedioic acid complex
2H +
1 Make molecular models of the three acids (butanedioicacid, trans-butenedioic acid, and propanedioic acid).
2 Place the molecule of trans-butenedioic acid on a piece ofpaper so that all the atoms are touching the paper. Drawcircles on the paper to mark the positions of the oxygenand hydrogen atoms of the –COOH groups. Note theposition of the other hydrogen atoms. (Remember, this isthe product of the oxidation reaction.)
3 Now manipulate your structure of butanedioic acid so thatthe hydrogens and oxygens of its –COOH groups can beplaced on the same marks. One H atom of each –CH2–group should also be touching the paper. Note thepositions of the other two H atoms – the ones which areremoved by the enzyme.
4 Leave the model of butanedioic acid in place andsuperimpose your model of propanedioic acid on it so thatthe –COOH groups coincide. (You will need to ‘close up’the butanedioic acid structure a little to achieve this.)Using a different colour, mark the new positions of theoxygen and hydrogen atoms of the –COOH groups.
What you doThis should show you that both butanedioic acid andpropanedioic acid can be bound by their –COOH groupsto the same site on the enzyme. The product of theoxidation reaction, trans-butenedioic acid, binds to thissite less well and is released from the enzyme.
The oxidation (removal of hydrogen) occurs at anotherpart of the active site. This must be where the C–C bondbetween the two central carbons of butanedioic acidnaturally comes when it is placed as above.
Propanedioic acid is an inhibitor because it has no C–Cbond to oxidise, but it can bind onto the site and block it.
5 Now consider pentanedioic acid:HOOC–CH2–CH2–CH2–COOH.
Make a model of its structure. Try to fit it onto themarks you made in 4. Decide whether you would expect it to:� bind to the enzyme or not� be oxidised by the enzyme to
HOOC–CH2–CH––CH–COOH� be an inhibitor.
Figure 1 The action of succinate dehydrogenase
A2 LEVEL
„ Salters Advanced Chemistry 2000 – see Copyright restrictions 189
The effect of enzymeand substrate concentrations on therate of a reaction
In this activity you will follow the progress of a
catalysed reaction by measuring the volume of gas
produced as the reaction proceeds. You will use the
initial rates of a series of experiments to find the
orders of the reaction with respect to enzyme and
substrate.
EP6.3
IntroductionIn this activity, the substrate is hydrogen peroxide (H2O2) and the enzyme iscatalase. You will use yeast as a source of catalase.
Hydrogen peroxide is formed as a waste product of metabolism by manyorganisms. It is toxic and must be rapidly removed from the cells. The enzymecatalase catalyses the decomposition of hydrogen peroxide to produce waterand oxygen.
2H2O2(aq) Æ 2H2O(l) + O2(g)
The reaction can be monitored by measuring the volume of oxygen produced asthe reaction proceeds, and plotting a graph of the volume of oxygen producedagainst time. You can find the rate of the reaction (in terms of the volume ofoxygen produced per second) at any time by measuring the gradient of thecurve.
You may like to practise your IT skills and make use of graph-plottingcomputer software to plot your results. It is usually best, however, to draw thebest-fitting line or curve by hand.
It is important when investigating rates of reaction to vary one factor at a
time. All other factors which could affect the rate should be kept constant.
What you doIt will be best to work in groups. One group should tackle Part 1 while anothergroup does Part 2. Combine your results at the end.
Take the opportunity to use a spreadsheet to collect your data. The graph-plotting function will help you to find the initial rate of each reaction.
Part 1: Varying the concentration of hydrogen peroxide
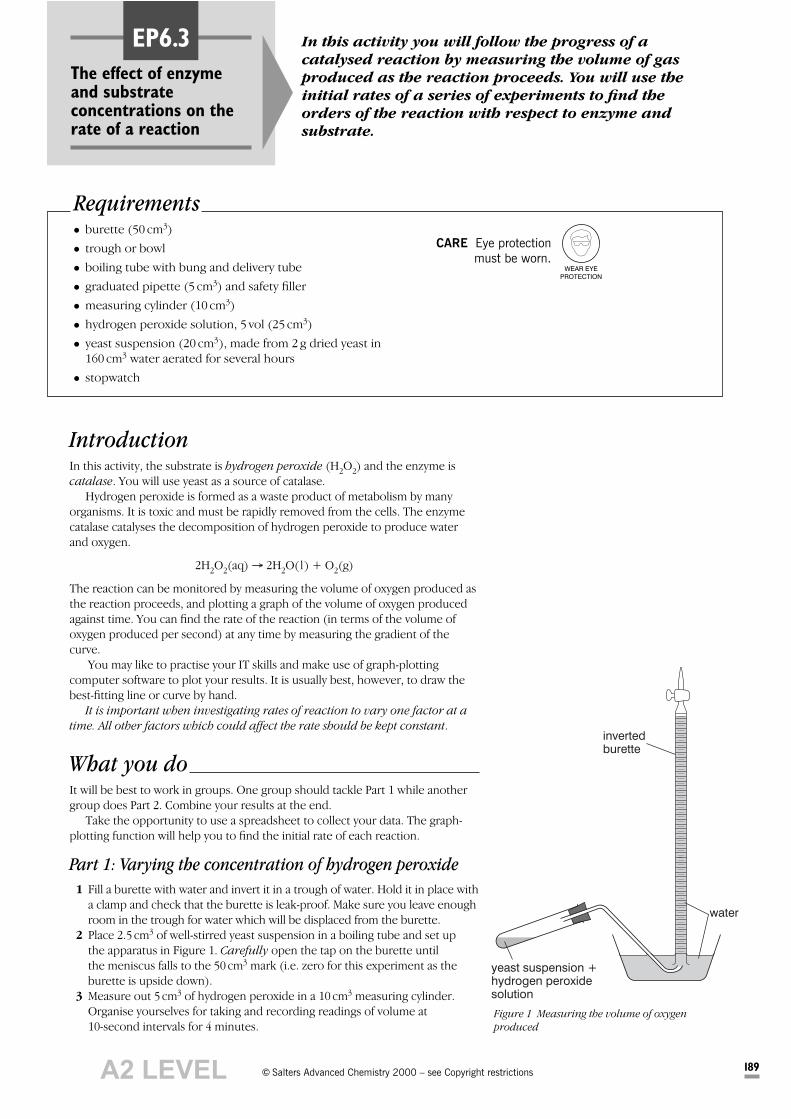
1 Fill a burette with water and invert it in a trough of water. Hold it in place witha clamp and check that the burette is leak-proof. Make sure you leave enoughroom in the trough for water which will be displaced from the burette.
2 Place 2.5 cm3 of well-stirred yeast suspension in a boiling tube and set up the apparatus in Figure 1. Carefully open the tap on the burette until the meniscus falls to the 50 cm3 mark (i.e. zero for this experiment as theburette is upside down).
3 Measure out 5 cm3 of hydrogen peroxide in a 10 cm3 measuring cylinder.Organise yourselves for taking and recording readings of volume at 10-second intervals for 4 minutes.
Requirements� burette (50 cm3)� trough or bowl� boiling tube with bung and delivery tube� graduated pipette (5 cm3) and safety filler� measuring cylinder (10 cm3)� hydrogen peroxide solution, 5 vol (25 cm3)� yeast suspension (20 cm3), made from 2 g dried yeast in
160 cm3 water aerated for several hours� stopwatch
invertedburette
yeast suspension +hydrogen peroxidesolution
water
Figure 1 Measuring the volume of oxygen
produced
WEAR EYE
PROTECTION
CARE Eye protection
must be worn.
A2 LEVEL

THE EFFECT OF ENZYME AND SUBSTRATE CONCENTRATIONS ON THE RATE OF A REACTIONEP6.3
190 „ Salters Advanced Chemistry 2000 – see Copyright restrictions
4 Add 5 cm3 of hydrogen peroxide to the yeast suspension and quickly replacethe bung. Zero time is counted as the time the first bubble appears in theburette. Take a reading of the volume of gas in the burette every 10 secondsfor 4 minutes.
5 Wash out the boiling tube, refill the burette, and repeat steps 1–4 four moretimes, using:
4 cm3 H2O2 + 1 cm3 distilled H2O3 cm3 H2O2 + 2 cm3 distilled H2O2 cm3 H2O2 + 3 cm3 distilled H2O1 cm3 H2O2 + 4 cm3 distilled H2O
in the measuring cylinder. Everything else should be the same in eachexperiment.
6 Plot the volume of O2 given off (vertical axis) against time (horizontal axis)for each experiment, drawing all the curves on the same axes.
QUESTIONS
a How does the rate of the reaction change as the reaction proceeds?
Explain why the rate changes in this way.
b Draw a tangent to each curve at t = 0. This represents the initial
rate of the reaction: its rate at the start. How does the initial rate of
the reaction vary with the starting concentration of hydrogen
peroxide?
c Measure the gradient of each tangent. Plot the initial rate for each
experiment against the volume of hydrogen peroxide used. (The
volume of hydrogen peroxide is proportional to its concentration
since the total volume is kept constant.) What is the order of the
reaction with respect to hydrogen peroxide?
Part 2: Varying the concentration of enzyme
7 Follow the procedure in steps 1–4 in Part 1.8 Wash out the boiling tube, refill the burette, and repeat steps 1–4 four more
times, using:
2.0 cm3 yeast + 0.5 cm3 distilled H2O1.5 cm3 yeast + 1.0 cm3 distilled H2O1.0 cm3 yeast + 1.5 cm3 distilled H2O0.5 cm3 yeast + 2.0 cm3 distilled H2O
in the boiling tube. Everything else should be the same in each experiment.9 Plot the volume of O2 given off (vertical axis) against time (horizontal axis)
for each experiment, drawing all the curves on the same axes.
QUESTIONS
d How does the rate of the reaction change as the reaction proceeds?
Explain why the rate changes in this way.
e Draw a tangent to each curve at t = 0. This represents the initial
rate of the reaction: its rate at the start. How does the initial rate of
the reaction vary with the starting concentration of the enzyme? You
can assume that the starting concentration of the enzyme is
proportional to the volume of yeast used, since the total volume was
kept constant.
f Measure the gradient of each tangent. Plot the initial rate for each
experiment against the volume of yeast used. What is the order of
the reaction with respect to the enzyme?
A2 LEVEL
„ Salters Advanced Chemistry 2000 – see Copyright restrictions 191
Using the iodine clockmethod to find the orderof a reaction
This activity illustrates another way in which the
initial rate method can be used to determine the
order of a reaction with respect to one of the
reactants.
EP6.4
About the reactionPeroxodisulphate(VI) ions and iodide ions react together in solution to formsulphate(VI) ions and iodine.
S2O82–(aq) + 2I–(aq) Æ 2SO4
2–(aq) + I2(aq)
Both reactants and the sulphate ions are colourless, so the progress of thereaction can be measured by following the colour of the iodine produced. Theiodine can be detected even more clearly by placing some starch in the reactionmixture: iodine forms an intense blue-black complex with starch.
One way of measuring the initial rate of the reaction is to measure how longthe reaction takes to produce a small, fixed amount of iodine. By answering thequestions which accompany this activity, you can work out what amount ofiodine has been chosen here, and what fraction of the extent of reaction thisrepresents.
You can make the time taken to produce a particular amount of iodine reallyobvious if you add thiosulphate ions to the reaction mixture at the start.Thiosulphate ions turn iodine back to iodide ions.
2S2O32–(aq) + I2(aq) Æ S4O6
2–(aq) + 2I–(aq)
So, no starch-iodine colour will appear until all the thiosulphate has been usedup. What you see is a colourless reaction mixture sitting there as though nothingis happening; then, suddenly, it turns blue. If you measure how long that takes,you know how long it took to use up all the thiosulphate and, therefore, howlong it took to produce the equivalent amount of iodine.
This method of studying reaction rates is sometimes called the clock method,and this experiment is an example of an iodine clock experiment. You are goingto use it to investigate how the reaction rate depends on the concentration ofiodide ions in the reaction mixture.
You may like to practise your IT skills and make use of graph-plottingcomputer software to plot your results. It is usually best, however, to draw thebest-fitting line or curve by hand.
Requirements� 0–110∞C thermometer� boiling tubes (5)� test-tubes� burettes (or graduated pipettes 1 cm3, 2 cm3 and 5 cm3)� potassium iodide solution, 1.00 mol dm–3 (15 cm3)� potassium peroxodisulphate(VI) (K2S2O8) solution,
0.0400 mol dm–3 (10 cm3)� sodium thiosulphate (Na2S2O3) solution,
0.0100 mol dm–3 (10 cm3)� freshly made starch solution (5 cm3)� stopwatch
potassium peroxodisulphate(VI)
solutionHARMFUL
CARE Eye protection
must be worn.
OXIDISING
WEAR EYE
PROTECTION
A2 LEVEL
USING THE IODINE CLOCK METHOD TO FIND THE ORDER OF A REACTIONEP6.4
192 „ Salters Advanced Chemistry 2000 – see Copyright restrictions
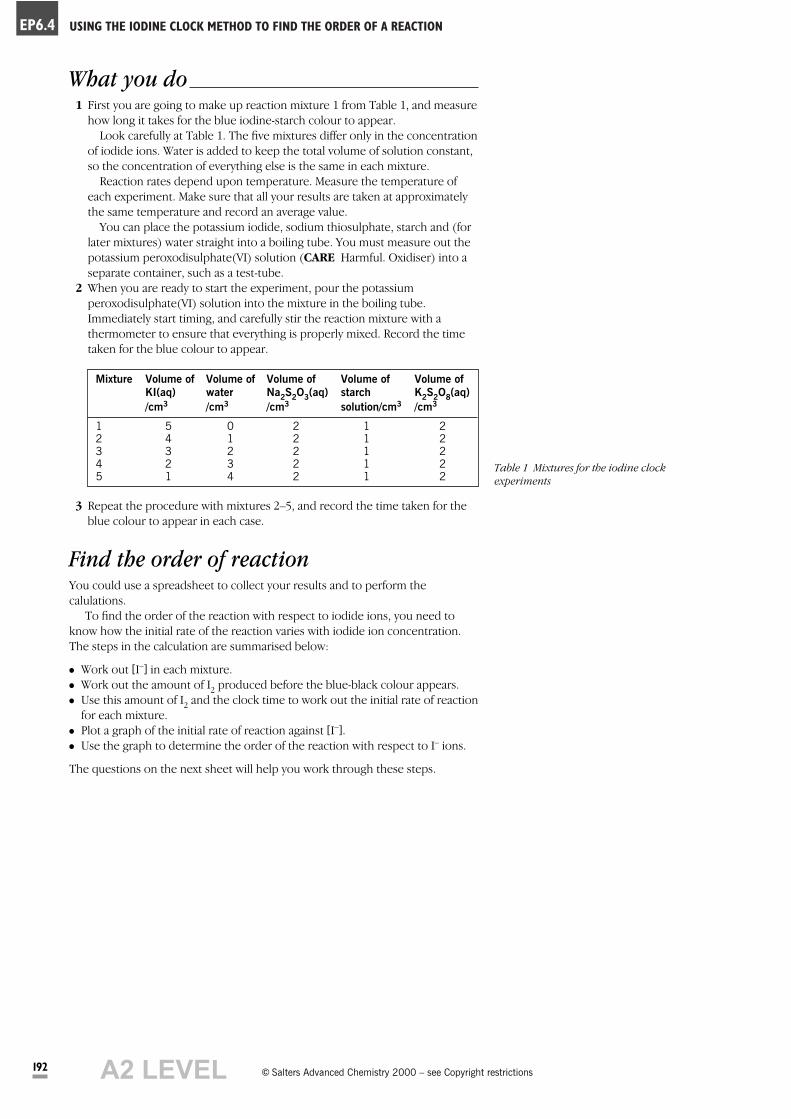
What you do1 First you are going to make up reaction mixture 1 from Table 1, and measure
how long it takes for the blue iodine-starch colour to appear.Look carefully at Table 1. The five mixtures differ only in the concentration
of iodide ions. Water is added to keep the total volume of solution constant,so the concentration of everything else is the same in each mixture.
Reaction rates depend upon temperature. Measure the temperature ofeach experiment. Make sure that all your results are taken at approximatelythe same temperature and record an average value.
You can place the potassium iodide, sodium thiosulphate, starch and (forlater mixtures) water straight into a boiling tube. You must measure out thepotassium peroxodisulphate(VI) solution (CARE Harmful. Oxidiser) into aseparate container, such as a test-tube.
2 When you are ready to start the experiment, pour the potassiumperoxodisulphate(VI) solution into the mixture in the boiling tube.Immediately start timing, and carefully stir the reaction mixture with athermometer to ensure that everything is properly mixed. Record the timetaken for the blue colour to appear.
Mixture Volume of Volume of Volume of Volume of Volume of
KI(aq) water Na2S
2O
3(aq) starch K
2S
2O
8(aq)
/cm3 /cm3 /cm3 solution/cm3 /cm3
1 5 0 2 1 22 4 1 2 1 23 3 2 2 1 24 2 3 2 1 25 1 4 2 1 2
3 Repeat the procedure with mixtures 2–5, and record the time taken for theblue colour to appear in each case.
Find the order of reactionYou could use a spreadsheet to collect your results and to perform thecalulations.
To find the order of the reaction with respect to iodide ions, you need toknow how the initial rate of the reaction varies with iodide ion concentration.The steps in the calculation are summarised below:
� Work out [I–] in each mixture.� Work out the amount of I2 produced before the blue-black colour appears.� Use this amount of I2 and the clock time to work out the initial rate of reaction
for each mixture.� Plot a graph of the initial rate of reaction against [I–].� Use the graph to determine the order of the reaction with respect to I– ions.
The questions on the next sheet will help you work through these steps.
Table 1 Mixtures for the iodine clock
experiments
A2 LEVEL

„ Salters Advanced Chemistry 2000 – see Copyright restrictions 193
EP6.4USING THE IODINE CLOCK METHOD TO FIND THE ORDER OF A REACTION
QUESTIONS
a Draw up a results table using the headings below:
Mixture Concentration of Clock Rate Temp
I–(aq)/mol dm–3 time /s /mol dm–3s–1 / °C
Table 2 Results table
b Calculate values for the concentrations of iodide ions in the five
reaction mixtures. Record these in the table, together with the
corresponding times for the blue-black colour to appear (the clock
times).
c Which reactant, I– or S2O
82–, is in excess in the reaction mixtures?
The reactant not in excess will be used up in the reaction. It
determines the total amount of iodine which can be produced.
d What is the total amount in moles of iodine which can be produced
by each of the reaction mixtures?
e i What amount in moles of thiosulphate ions is added to each
reaction mixture?
ii What amount of iodine will be used up by thiosulphate ions
during the course of each experiment?
iii What percentage of the extent of reaction is studied during the
experiments? (For the clock method to work well, the extent of
reaction studied should be no more than 10–15% of the total
extent of the reaction.)
f The initial rate of the reaction can be measured in mol dm–3 I2
produced per second.
i For each mixture, divide your answer to e ii by the time taken for
the appearance of the blue colour, and so calculate the initial
rate (in mol dm–3 s–1) at which each mixture reacts.
ii Record the reaction rates in the table.
g i Plot a graph of rate against concentration of iodide ions
(horizontal axis).
ii What is the order of reaction with respect to iodide ions?
h A similar series of experiments shows that the reaction is first order
with respect to S2O
82– ions.
i Write a rate equation for the reaction of peroxodisulphate(VI) ions
and iodide ions.
ii What is the overall order of the reaction?
iii Calculate the rate constant for the reaction using the gradient of
the graph you obtained in g i. Make sure you give the correct
units and the temperature at which your measurements were
made.
A2 LEVEL

„ Salters Advanced Chemistry 2000 – see Copyright restrictions 194
Enzyme kinetics
EP6.5 Accurate results in experiments involving enzymes
can be hard to obtain. This activity provides you with
two exercises, based on accurate data, which should
help to reinforce your work about the rates of enzyme-
catalysed reactions. Use Storyline EP6 to help you
explain your results.
IntroductionThe enzyme urease catalyses the hydrolysis of urea.
H2N–CO–NH2(aq) + H2O(l) Æ CO2(aq) + 2NH3(aq)
In the exercises which follow, the initial rate of reaction was measured by findingthe number of moles of urea which had been hydrolysed during the first threeminutes of the reaction. The average rate over the first three minutes, in units ofmol dm–3 min–1, was then found.
Exercise 1The results described in Table 1 represent a series of experiments in whichthe concentration of urea (the substrate) was varied but the concentration ofurease (the enzyme) was kept constant.
Plot a graph of the reaction rate against the substrate concentration (horizontal axis).
a When the substrate concentration is high, what is the approximate
order of reaction with respect to substrate?
b The following mechanism has been proposed for enzyme-catalysed
reactions (E = enzyme, S = substrate, P = product):
E + S Æ ES Æ EP Æ E + P
Explain why your answer to a tells you that the first step in this
mechanism is not the rate-determining step at high substrate
concentration.
c At high substrate concentrations, all the enzyme active sites are
occupied. This is known as active site saturation. Explain how this
idea supports your answers to a and b.
d At lower substrate concentrations, there is a change in the way the
rate depends on concentration. At very low substrate concentrations,
the reaction is approximately first order with respect to the substrate.
Suggest a reason for this.
Exercise 2The results in Table 2 come from an experiment in which the concentration ofurea (the substrate) was kept fixed and the concentration of urease (theenzyme) was varied. This was achieved by adding different volumes of ureasesolution to the reaction mixture, and keeping the total volume constant bymaking up with the appropriate volume of water.
Plot a graph of the reaction rate against the volume of urease solution, which is ameasure of the urease concentration (horizontal axis).
e What is the order of reaction with respect to the enzyme?
f Describe how your answer to e can be explained in terms of the
mechanism proposed in b.
Concentration of urea/mol dm–3 Rate/mol dm–3min–1
0 00.005 1.7 ¥ 10–6
0.010 2.3 ¥ 10–6
0.020 3.2 ¥ 10–6
0.050 4.4 ¥ 10–6
0.100 5.9 ¥ 10–6
0.200 7.2 ¥ 10–6
0.300 7.7 ¥ 10–6
0.400 8.0 ¥ 10–6
0.500 8.1 ¥ 10–6
Table 1
Volume of urease solution/cm3 Rate/mol dm–3min–1
0 00.050 0.6 ¥ 10–6
0.100 0.8 ¥ 10–6
0.200 1.8 ¥ 10–6
0.300 3.2 ¥ 10–6
0.500 4.8 ¥ 10–6
1.000 10.4 ¥ 10–6
1.500 14.9 ¥ 10–6
2.000 19.5 ¥ 10–6
Table 2
A2 LEVEL

„ Salters Advanced Chemistry 2000 – see Copyright restrictions 195
Check your notes onEngineering Proteins
This activity helps you get your notes in order at the
end of this unit.EP7
Use this list as the basis of a summary of the unit bycollecting together the related points and arranging them ingroups. Check that your notes cover the points and areorganised in appropriate ways. Remember that you will becoming back to some of the ideas in later units.
Most of the points are covered in the Chemical Ideas,with supporting information in the Storyline or Activities.However, if the main source of information is the Storylineor an Activity, this is indicated.
� Proteins are condensation polymers formed from aminoacid monomers.
� The general structure of amino acids.
� The acid–base properties of amino acids and theformation of zwitterions.
� The formation and hydrolysis of the peptide link betweenamino acid residues in proteins (Storyline EP2; Activity
EP2.2).
� The importance of amino acid sequence in determiningthe properties of proteins, and the diversity of proteins inliving things (Storyline EP2).
� Stereo-isomers: cis-trans and optical isomers(enantiomers).
� The use of the term chiral as applied to a molecule.
� How nuclear magnetic resonance (n.m.r.) spectroscopycan be used for the elucidation of molecular structure.
� The interpretation of n.m.r. spectra for simple compoundsgiven relevant information (Activity EP2.3).
� The expression for the equilibrium constant, Kc, for a givenreaction.
� The way in which changes of temperature and pressureaffect the magnitude of the equilibrium constant.
� The use of values of Kc, together with given data onequilibrium concentrations, to calculate the compositionof equilibrium mixtures.
� The primary, secondary and tertiary structures of proteins(Storyline EP4).
� The role of hydrogen bonds and other intermolecularforces in determining the structure and properties ofproteins (Storyline EP4).
� The double helix structure of DNA in terms of asugar–phosphate backbone and attached bases (Storyline
EP2).
� The significance of hydrogen bonding in the pairing ofbases in DNA, and the replication of genetic information(Storyline EP2; Activities EP2.7 and EP2.8).
� How DNA encodes for the amino acid sequence in aprotein.
� The use of empirical rate equations of the form: rate = k[A]m[B]n where m and n are integers.
� The meaning of the terms: rate of reaction, rate constant,order of reaction (both overall and with respect to a givenreagent).
� Experimental methods for measuring the rate of reactions.
� How to use experimental data to find the order of areaction (zero, first or second order).
� How to use given data to calculate half-lives for a reaction.
� The industrial importance of enzymes (Storyline EP6).
� The characteristics of enzyme catalysis, including:specificity, temperature and pH sensitivity, and inhibition(Storyline EP6).
� The specificity of enzymes in terms of a simple ‘lock andkey’ model of enzyme action.
� The technique of ‘genetic engineering’ and its applications(Storyline EP3 and EP5).
A2 LEVEL