REQUEST FOR ADDITIONAL EVIDENCE FROM THE RÉGIE...
41
REQUEST FOR ADDITIONAL EVIDENCE FROM THE RÉGIE DE L'ÉNERGIE (THE RÉGIE) IN RELATION TO THE APPLICATION SEEING AUTHORIZATION OF A RETURN ON EQUITY AND AN EQUITY SHARING MECHANISM RETURN ON EQUITY 1. Reference: Exhibit B-0007, pages 26-27. Preamble: “Credit ratings are based on the utility's business risk profile (which includes an assessment of the regulatory environment in which the utility operates) and its financial risk profile. Companies with similar credit ratings have been determined by the rating agency to have similar levels of business and financial risk. This concept has been adopted by regulatory agencies, including the Federal Energy Regulatory Commission ("FERC"), which has found that "it is reasonable to use the proxy companies' corporate credit rating as a good measure of investment risk, since this rating considers both financial and business risk. The basis for choosing proxy group companies with credit ratings of A- or higher is that absent the government debt guarantee, the credit rating for Hydro-Québec would be several notches lower. 29 29 In August 2012, Moody's Investors Service indicated that its Baseline Credit Assessment for Hydro-Quebec would be Baal (S&P equivalent BBB+) absent the government debt guarantee from the Province of Quebec. See Moody's credit report for Hydro-Québec, issued August 6, 2012, at page. 2." Requests: 1.1 Please file a copy of the Moody's report for Hydro-Québec which refers to page 27 of the report by Concentric Energy Advisors (Concentric). 1.2 Please file the Moody's Investors Service report dated August 2009, entitled "Regulated Electric and Gas Utilities" - Rating Methodology (34 pages). 1.3 Please provide, in the form of an Excel file, the history of the rates of return, at a minimum on a monthly basis, for the last 25 years, for BBB- and A-rated corporate bonds for government-owned utilities, as well as the rates for 10- and 30-year bonds issued by the Government of Québec, the Government of Canada and the U.S. Treasury. Please provide this information for both Canadian and US markets.
Transcript of REQUEST FOR ADDITIONAL EVIDENCE FROM THE RÉGIE...

REQUEST FOR ADDITIONAL EVIDENCE FROM THE RÉGIE DE
L'ÉNERGIE (THE RÉGIE) IN RELATION TO THE APPLICATION SEEING
AUTHORIZATION OF A RETURN ON EQUITY AND AN
EQUITY SHARING MECHANISM
RETURN ON EQUITY
1. Reference: Exhibit B-0007, pages 26-27.
Preamble:
“Credit ratings are based on the utility's business risk profile (which includes an
assessment of the regulatory environment in which the utility operates) and its financial
risk profile. Companies with similar credit ratings have been determined by the rating
agency to have similar levels of business and financial risk. This concept has been
adopted by regulatory agencies, including the Federal Energy Regulatory Commission
("FERC"), which has found that "it is reasonable to use the proxy companies' corporate
credit rating as a good measure of investment risk, since this rating considers both
financial and business risk.
The basis for choosing proxy group companies with credit ratings of A- or higher is that
absent the government debt guarantee, the credit rating for Hydro-Québec would be
several notches lower.29
29 In August 2012, Moody's Investors Service indicated that its Baseline Credit Assessment for
Hydro-Quebec would be Baal (S&P equivalent BBB+) absent the government debt guarantee from the
Province of Quebec. See Moody's credit report for Hydro-Québec, issued August 6, 2012, at page. 2."
Requests:
1.1 Please file a copy of the Moody's report for Hydro-Québec which refers to page
27 of the report by Concentric Energy Advisors (Concentric).
1.2 Please file the Moody's Investors Service report dated August 2009, entitled
"Regulated Electric and Gas Utilities" - Rating Methodology (34 pages).
1.3 Please provide, in the form of an Excel file, the history of the rates of return, at a
minimum on a monthly basis, for the last 25 years, for BBB- and A-rated
corporate bonds for government-owned utilities, as well as the rates for 10- and
30-year bonds issued by the Government of Québec, the Government of Canada
and the U.S. Treasury. Please provide this information for both Canadian and US
markets.

2. References: (i) Exhibit B-0007, page 51;
(ii) Exhibit B-0007, Exhibit JMC-5, Appendix 1.
Preamble:
"Based on the lower equity ratios and the weaker credit metrics of HQD and HQT,
Concentric concludes that these companies have greater financial risk than either the
Canadian proxy group or the U.S. electric utility proxy group. Specifically, the actual
credit metrics for HQD and HQT (as shown on Exhibit JMC-5) are not consistent with
Hydro-Québec's current S&P rating of A+."
Request:
2.1 Please provide the data and source for each, and the detail calculations used to
compete the table of Exhibit JMC 5, Appendix 1, of Exhibit 1-HQTD-2,
Document 1.
3. References: (i) Exhibit B-0007, pages 89-90;
(ii) Exhibit B-0007, Exhibits JMC-9 to JMC-11.
Preamble:
"Yes, projected earnings growth rates are generally available. For example, analysts'
five-year earnings growth rates are publicly available from Zacks' Investor Services for
U.S. companies. Thomson First Call (as reported on Yahoo! Finance), which is a public
source, and SNL Financial, a subscription-based service, publish earnings growth rates
for both Canadian and U.S. companies. All of these services provide consensus estimates
that compile projections of earnings growth from several analysts. Value Line, which is a
subscription based publication, provides three-to-five-year projected earnings, dividend
and book value growth rates based on the expectations of an individual analyst." [...]
"SNL Financial began compiling consensus earnings growth estimates for Canadian
utility companies in February of 2012. In addition, Thomson First Call also provides
long-term growth estimates for Canadian utilities."

Requests:
3.1 For the Canadian and U.S. proxy groups, please provide detailed growth estimates
used including, for each source (Zacks, First Call, SNL and Value Line) the mean
and median growth estimates, over one and five years, the highest value and the
lowest estimate, as well as the number of analysts who provided estimates.
3.2 Please provide Exhibit JMC-10, Appendix 4, for the Canadian proxy group.
4. References: (i) Exhibit B-0007, pages 27-28;
(ii) Exhibit B-0007, Exhibit JMC-1;
(iii) Exhibit B-0007, Exhibit JMC-3, Appendix 1;

(iv) NEB decision respecting TransCanada Pipelines, RH-003-
2011, pages 1, 3 and 16;
(v) National Bank Financial's March 28, 2013 analytical report
on Trans Canada Corporation.
Preamble:
(i) At pages 27-28, Concentric noted: "As shown on Exhibit JMC-1, in 2011, the
average company in the Canadian utility proxy group derived approximately 61 percent
of its operating income from regulated utility operations and 59 percent of its revenues
from regulated utility service. Two companies, however, have substantial non-electric
and/or unregulated operations, which have different business risks than the regulated
electric transmission and distribution business."
The aforementioned two companies are Enbridge and TransCanada Corporation.
(ii) In Exhibit JMC-1, Concentric's table indicates that TransCanada has neither
income nor revenues from the transmission or distribution of electricity, or other energy,
on a cost-of- service basis.
2011 % Regulated Operating Income and Revenues
Utility % Operating
Income
% Revenues
Consolidated Edison 98% 38%
Northeast Utilities 101% 99%
NextEra Energy 64% 69%
Southern Co. 930% 95%
Wisconsin Energy 61% 99%
Xcel Energy 100% 99%
U.S. Proxy Group Average 86% 92%
Utility % Operating
Income
%Revenues
Canadian Utilities Ltd. 60% 36%
Emera. Inc. 94% 92%
Enbridge Inc. (1) 22% 13%
Fortis Inc. 91% 93%
TransCanada Corp. (2) 0% 0%
Valener 98% 97%
Canadian Proxy Group Average 61% 59%
Note: Percentage of operating income may exceed 100% due to losses at affiliates.
(1) Does not include operating income or revenues from gas transmission.
(2) TransCanada has no income or revenues from regulated utility service. Gas
transmission income and revenue was not considered in our analysis.
(iii) Despite this fact, Concentric includes TransCanada in the Canadian proxy group
of companies. The Régie notes that, in Exhibit JMC-3, Appendix 1, TransCanada has the
highest authorized rate of return on equity (RROE) of the group, at 11.50%, and its
inclusion raises the average RROE of the sample by 29 basis points, from 8.90% to
9.19%.

(iv) In its March 2013 decision respecting TransCanada PipeLines, the NEB stated:
(page 1) "The Mainline is in an unprecedented position. No major NEB regulated natural
gas transmission pipeline has ever been affected by market forces to the extent that the
Mainline is now affected. Throughput on the Mainline has decreased significantly, and as
a result, Mainline tolls have increased substantially over a short period of time.
The future of the Mainline depends on how TransCanada is able to respond to the
changes to its business environment. The Mainline faces increasing competition for gas
supply from intra-Alberta demand, other ex-Western Canada Sedimentary Basin (WCSB)
pipelines and new markets for WCSB gas. The Mainline competes with pipelines from
emerging shale and tight gas basins in the United States of America (U.S.), which deliver
gas to eastern markets. The Mainline must adjust to this new environment because
eastern consumers may not renew contracts for long-haul service and bypass
infrastructure may be built.
Tolls cannot continue to increase each year in response to throughput decline. Costs
associated with throughput variation have been passed to remaining Firm
Transportation service (FT) shippers. Those shippers have borne all of the costs of, and
the risk associated with, competition. If this were to continue, the Mainline’s
competitiveness could further erode and exacerbate the root cause of throughput
declines.
Our decision
The multi-year fixed tolls approach we have adopted stops the toll increases. Our
Decision sets the FT toll from Empress, Alberta to Dawn, Ontario at $1.42/gigajoule
(GJ), compared to the 2013 Status Quo toll of $2.58/GJ. We expect this toll to remain in
effect through 2017. Recognizing the increased business risk that the Mainline is facing,
we have approved the Mainline’s return on equity (ROE) at 11.5 per cent on a 40 per
cent equity ratio. We have also approved an incentive mechanism that would further
increase the Mainline’s profits if annual net revenues are higher than forecast."
"We recognize that throughput, cost and revenue forecasts may not be realized. We have
compensated the Mainline through a higher allowed return for the increased variability
risk it will face due to its cash flows being more dependent on the accuracy of its
throughput forecast than in the past. [...]
(page 3)
"If larger-than-forecast cost deferrals were to occur, they could represent a
materialization of the Mainline’s fundamental risk and costs could be disallowed. If costs
were disallowed, it would not mean that TransCanada did not have a reasonable
opportunity to recover costs, but rather that events did not turn out as forecast or that
this opportunity was not seized by TransCanada. A potential outcome is that the Mainline
would suffer a loss – just like any other business that faces competition." [Emphasis
added]
At page 16 of the NEB decision, Table 2-1 clearly indicates the toll reductions decided by
the Regulator, reductions that could reach 49% compared to the status quo.

Table 2-1
Comparison of 2013 Tolls under the
Restructuring Proposal and Status Quo (S/GJ)
Toll Path 2013 RP 2013 SQ
Sask./Man. Border to Dawn, Ontario (Union SWDA) 1.18 -
Sask./Man. Border to Toronto, Ontario (Enbridge CDA) 1.33 -
Alberta System to Dawn (Union SWDA) 1.47 2.74
Alberta System to Toronto (Enbridge CDA) 1.61 3.18
Alberta-Sask. Border (Empress, AB) to Dawn (Union SWDA) 1.52 2.58
Alberta-Sask. Border (Empress, AB) to Toronto (Enbridge CDA) 1.67 3.03
(v) TransCanada's Increased risk profile has not gone unnoticed by financial analysts,
as evidenced in National Bank Financial's March 28, 2013 report concerning
TransCanada Corporation entitled: "NEB announces five-year Cnd Mainline decision:
Fixed tolls = cash flow risk profile bumps up."
Requests:
4.1 Please file National Energy Board document: Reasons for Decision, Transcanada
Pipelines Limited, NOVA Gas Transmission Ltd. and Foothills Pipe Lines Ltd.
RH-003-2011, published in March 2013.
4.2 Please file the National Bank Financial research report concerning TransCanada
Corporation, dated March 28, 2013, entitled "NEB announces five-year Cnd
Mainline decision: Fixed tolls = cash flow risk profile bumps up".
4.3 Given the foregoing observations, including the recent NEB decision, please
explain why, in your view, TransCanada Corporation's level of risk is comparable
to that of HQTD.

4.4 More generally, please justify the inclusion of TransCanada Corporation in the
Canadian electric utilities proxy group.
5. References: (i) Exhibit B-0007, pages 103-104;
(ii) Valener, Results for the second quarter of its 2013 fiscal year,
Speaker's notes, page 3;
(iii) Valener, Results for the second quarter of its 2013 fiscal year,
Slide 5;
(iv) Valener, 2012 Annual Report, pages l4, 168-169.
Preamble:
(i) "Retention of earnings causes an increase in the book value per share and, other factors
being equal, increases the amount of earnings that is generated per share of common
stock. For example, a company that is expected to earn a return of 9 percent and retain
80 percent of its earnings might be expected to have a growth rate of 7.2 percent,
computed as follows:
0.80 x 9% =7.2%
On the other hand, another company that is also expected to earn 9 percent but only
retains 20 percent of its earnings might be expected to have a growth rate of 1.8 percent,
computed as follows:
0.20 x 9% =1.8%"
(ii) "Turning to dividends, during the second quarter, Valener paid dividends of $9.4
million to its common shareholders, either in cash or in shares for those who elected to
take advantage of the dividend reinvestment plan. For the current quarter, Valener 's
Board maintains a dividend of $0.25 per common share, payable next July 15. As
planned, Valener will have paid to its shareholders an annualized dividend of $1.00 per
share for fiscal 2013.

The distribution to be paid by Gaz Métro to Valener this coming July will be the last one
to include the enhanced distribution established back in 2010, at the time of Gaz Métro's
reorganization which saw the creation of Valener. The total amount of that enhanced
distribution will have represented $20 million over a three-year period ending next
September 30th.
As communicated at the time of our reorganization, and as shown on page 5, the game
plan is now to use the cash flows generated by phase I of the Seigneurie de Beaupré wind
power projects to allow Valener to maintain its $1 annual dividend over time. The 272
MW project is on time and on budget. The commissioning is expected to be in December
2013. Any timing difference would be covered by Valener's committed credit facility,
which is currently largely unused." [Emphasis added]
Certain observations cannot not be readily reconciled with a dividend growth forecast of
7% per annum applied by Concentric in Exhibits JMC-11, Schedules 4 to 6:
(a) Valener has not argued for an increase in its dividend of $1.00 since its creation.
Furthermore, Société en commandite Gaz Métro has not argued for an increase in its
declared distribution per unit since 2003, the latter was even reduced from $1.36 in
2003 to $1.12 in 2012.
(b) Valener has not covered its dividend for three years, both as regards net profits and
cash flows from operating activities, and the shortfall for three years amounts to $20
million. Furthermore, in its May 13, 2013 communication to analysts and investors
(as in its previous communications), Valener management does not talk about
increasing its dividend, but only maintaining it at the same level of $1.00 "over
time".
(c) In slide 5 of the quarterly presentation of its results, Valener management indicates
to investors that for the coming years (2014 and subsequent years) the $1.00
dividend should be just covered (distribution rate of approximately 95%).
(d) Return on shareholder equity realized by Valener in 2012 was only 4.4%, and at
best its retention rate of expected earnings is 5% (1-95%) in 2014, which would
give an imputed internal growth rate of 0.2% (4.4%* 5%).
(e) Merely by including Valener in the Canadian proxy group, given the dividend
growth assumptions used by Concentric, increases the group's average return on
equity by over 50 basis points. For example, in Exhibit JMC-11, Appendix 5, the
average return on equity would be 9.10% by including Valener, and 8.57% by
excluding it.
Requests:
5.1 Please file a copy of the Valener speaker's notes for the teleconference held on
May 13, 2013, following publication of the results for the second quarter of its
2013 fiscal year (available on the company's website).
5.2 Please file a copy of the slides presented to investors during the teleconference
held on May 13, 2013, following publication of their financial performance for
the second quarter of fiscal 2013 (available on the company's website).
5.3 Please file a copy of Valener's 2012 Annual Report.
5.4 Considering the foregoing observations, please demonstrate how annual dividend
growth in the order of 7% per year is possible for each of the next 5 years, as used
in Exhibit JMC-11, Appendices 4 to 6.
6. Reference: Exhibit B-0007, pages 92-95.
Preamble:
Page 92:
"Q. What is "optimism bias" in the earnings growth rate forecasts of security analysts,
and how would it affect an estimate of the ROE?
A. Optimism bias is related to the alleged tendency for analysts to forecast earnings
growth rates that are higher than are actually achieved If optimism bias were present
in analysts' earnings forecasts, it could create an upward bias in the estimated cost of
capital that results from the DCF approach."

Q. Is it reasonable to believe that analysts' earnings growth estimates currently may be
overly optimistic or may represent a conflict of interest?
A. No. Several regulatory changes have been implemented that are designed to provide
fair disclosure and eliminate analysts' bias. On August 15, 2000, the U.S. Securities and
Exchange Commission ("SEC') adopted Regulation FD to address the selective
disclosure of information by publicly traded companies and other issuers. Regulation FD
provides that when an issuer discloses material information, the issuer must publicly
disclose that information to all investors at the same time. In this way, the new rule aims
to promote full and fair disclosure." [...]
Page 94:
"Q. Has any research been conducted to measure whether analyst forecast bias exists
since the Global Settlement was implemented?
A. Yes. A 2010 article in Financial Analyst Journal found that analyst forecast bias has
declined significantly or disappeared entirely since the Global Settlement:
Introduced in 2002, the Global Settlement and related regulations had an even
bigger impact than Reg FD on analyst behavior. After the Global Settlement, the
mean forecast bias declined significantly, whereas the median forecast bias
essentially disappeared. Although disentangling the impact of the Global
Settlement from that or related rules and regulations aimed at mitigating analysts'
conflicts of interest is impossible, forecast bias clearly declined around the time
the Global Settlement was announced. These results suggest that the recent efforts
of regulators have helped neutralize analysts' conflicts of interest.112
"
Request:
6.1 Please file the article from the Financial Analyst Journal quoted in the answer at
page 95 of the Concentric report.
7. Reference: Exhibit B-0007, page 25.
Preamble:
"Q. Did you also consider a third proxy group of government-owned electric utilities in
Canada?
A. Yes. Since HQD and HQT are divisions of a government-owned crown
corporation, Concentric also selected a group of municipal and provincial government-
owned Canadian electric distribution and transmission utilities for purposes of
comparing the authorized ROE of HQD and HQT to those entities.
That group consists of the following six companies:
British Columbia Hydro
ENMAX Corp.
EPCOR Utilities, Inc.
Hydro One Networks
Manitoba Hydro
Saskatchewan Power"
Request:
7.1 Please provide, for each of the above six companies, the authorized return on
equity, the date the Regulator's decision concerning that return was rendered, the
earned return on equity realized, as well as the proportion of equity accepted by
the Regulator.
8. Reference: Exhibit B-0007, pages 25-26.
Preamble:
In order to establish HQTD's American proxy group, Concentric proceeded as follows:
"As a starting point, Concentric utilized the 48 companies that Value Line classifies as
Electric Utility Companies to ensure that the company is considered to be primarily
engaged in electric utility operations. From that group, Concentric screened for
companies that:
Have credit ratings from S&P of at least A-;
Pay dividends;
Have earnings growth rates from at least two utility industry analysts;
Derived at least 60 percent of their revenue from regulated operations in the period
from 2009-2011;
Derived at least 60 percent of their regulated revenue from electric utility operations
in the period from 2009-2011;
Are not considered a small capitalization company; and,
Are not involved in a merger or other transformative transaction that had a material
effect on the company's stock price during the evaluation period.
Q. What companies met those screening criteria?
A. The following six companies met those criteria:
Consolidated Edison Inc.

Next Era Energy, Inc.
Northeast Utilities.
Southern Company.
Wisconsin Energy Corp.
Xcel Energy Inc."
Requests:
8.1 Please file, in the form of electronic files, the Form 10-K reports filed with the
United States Securities and Exchange Commission, for the last fiscal year of
each company selected.
8.2 Please file, in the form of electronic files, for each subsidiary in the suggested
sample, the last decision concerning the return on equity for each company in the
U.S. proxy group rendered by their respective regulators.
VARIANCE ACCOUNTS
9. References: (i) Exhibit B-0004, page 24;
(ii) Exhibit B-0007, pages A-21 and A-22.
Preamble:
(i) "Furthermore, the Transmission Provider and the Distributor maintain the
following variance accounts set up to ensure fair treatment of the parties and to cover
significant factors beyond their control. These accounts are as follows:
Transmission Provider
• variance account for revenue from point-to-point transmission services;
• variance account for pension costs;;
Distributor
• "pass-on" account for the purchase of electricity;
• variance account for native-load transmission service;
• smoothing account for transmission and distribution revenue for weather
conditions;
• variance account for fuel costs;
• variance account for load retention rates;
• variance account for pension costs;
• variance account for major outage costs;
• variance account for costs related to the Bureau de l’efficacité et de l’innovation
énergétiques."
(ii) "[...] Table 13 summarizes the percentage of operating companies (based on
number of customers) in the Canadian and U.S. proxy groups that has some form of cost
recovery mechanism for each of these costs."
Table 13: Cost Recovery Mechanisms
Cost HQD HQT Canadian
Proxy Group
U.S. Proxy
Group
Pension expenses Yes Yes 69% 36%
Bad Debt expenses No No 5% 13%
Storm Cost Recovery Limited142 No 0% 79%
Interest Rate Change No No 9% 17%
Energy Efficiency/ DSM No N/A 81% 76%

Requests:
9.1 Please complete the summary presented in Table 13 (reference (ii)) in relation to
all existing variance accounts of the Transmission Provider and Distributor
(reference (i)).
9.2 Considering the first three variance accounts (pass-on, native-load transmission
and weather conditions) which alone affect approximately 70% of the
Distributor's revenue requirements, please elaborate on the Distributor's level of
risk.

9.3 Do the proposals pertaining to the cost of debt presented in Exhibit B-0004, page
26 and the creation of a variance account for "Interest Rate Change" presented in
Table 13 (reference (ii)), have a similar impact on the Transmission Provider's
level of risk and that of the Distributor? Please elaborate and quantify.
9.4 Please indicate if the new method for establishing expenses for bad debts
presented in the Distributor's 2013 rate case (Matter No. R-3814-2012, Exhibit B-
0024, page 39, Appendix E) and authorized by the Régie (Decision D-2013-037,
page 81) has reduced the Distributor's risk, compared to the method used in
previous rate cases.
R9.4
The method to establish the bad debt expense (BDE) presented in connection with the Distributor’s File R-3814-2012 and authorized by the Régie in its Decision D-2013-037 consists in assessing the BDE in terms of projected sales. The BDE was previously assessed according to cost growth factors (according to the parametric formula) and specific elements.
This new method is further in line with the development of the economic context, the best indicator of which available to the Distributor is the volume of projected sales. This element thus proves to be a better driver to forecast the BDE than the progression of or change in operating costs, which, in the Distributor’s opinion, will provide a better estimate of the BDE. This being the case, the fact of obtaining a more accurate BDE estimate does not impact the Distributor’s risk. This risk is further tied to multiple factors that could have an upward or downward impact on the actual level of the BDE, such as the actual number of customers having moved without leaving any {forwarding} address, the specific aging of accounts receivable, the growing level of household debt or, there again, bankruptcies, and these factors remain unchanged.

This example indicates the efforts made to fine-tune the forecast models by including therein the latest and most pertinent data and knowledge in order to obtain the best possible forecasts.
EARNINGS SHARING MECHANISM (ESM)
10. References: (i) Exhibit B-0004, page 22;
(ii) Follow ups-D-2012-024 and D-2012-059, Consultation on the
financial policy and earnings sharing mechanism, page 10;
(iii) Exhibit B-0007, Exhibit JMC-4, Schedule 5.
Preamble:
(i) "Robert C. Yardley, in his testimony produced in Exhibit HQTD-2, Document 2,
described the general principles of the ESM structure and the regulatory context in which
they apply.
The most common ESMs may include some or all of the following elements:
• A definition of the ROE calculation, expressed as a percentage, for the purposes
of applying the sharing formula and, specifically, the period to which the
calculation applies (normally 12 months);
• Thresholds expressed as a percentage defining a deadband within which
deviations are either fully absorbed or retained by the regulated enterprise; a
number of ESMs observed do not have a deadband;
• For the portion of earnings deviations outside the deadband, a ratio establishes
the percentage allotted to the regulated enterprise and the percentage allotted to
customers;
• More complicated ESMs can be multi-tiered defined by several thresholds and
various sharing ratios, for example, a first sharing threshold may have a sharing
ratio of 75% for the regulated enterprise, a second threshold, a sharing ratio of
50% and a third, 25% or 0%;
• Methods for attributing earnings to customers in subsequent years.
If the sharing thresholds and sharing ratios result in the same sharing percentage for a
negative or positive deviation of the same size, the ESM is considered a symmetric ESM;
otherwise it is an asymmetric ESM." [Emphasis added]
(ii) "Hydro-Québec willing to facilitate discussions concerning ESMs using a
benchmark study documenting the different variants adopted in other jurisdictions. The
interested parties will be asked to comment on those approaches. Although the ESM
concept is not per se complex, choices concerning an ESM's parameters can be complex
and the subject of diverging points of view." [Emphasis added]
(iii) The expert's evidence presented a table showing, for each company in the
Canadian and U.S. Proxy group and for the Distributor and the Transmission Provider, a
summary of the features of the respective rate regulation and the method for sharing
overearnings. The Régie understands that the table is the result of a more exhaustive
analysis of the ESMs or other mechanisms prevailing in the comparable companies.

Requests:
Questions 10.1 to 10.3 are also addressed to Robert C. Yardley
10.1 Please file the benchmark study of ESMs for companies in the Canadian and U.S.
proxy groups. Please indicate for each company:
A description of the authorized ESM;
Indication of the regulatory framework: Cost of service or Incentive Mechanism;
The authorized rate of return;
Whether or not the ESM is conditional on the achievement of certain performance
indicators, if so, identify them;
If the ESM is associated with a regulatory closing of books process;
Other relevant information.
10.2 Please explain and comment on the mechanisms observed that do not have a
deadband (reference (i)).

10.3 Considering that overearnings can be explained by forecast errors and efficiency
gains, please comment on the likelihood of a 50% /50% overearnings sharing
mechanism without a deadband, for the Transmission Provider and the Distributor and their customers.

11. Reference: Exhibit B-0004, page 24.
Preamble:
"The existence of a deadband, within which positive deviations are fully retained by the
Transmission Provider and the Distributor, is for them fundamental in order to maintain
sufficient incentive to achieve efficiency gains. As regards the sharing percentage of 50%
for any greater deviation, the Transmission Provider and the Distributor are of the view
that this is a reasonable sharing in order to achieve the objectives of fairness,
maintenance of efficiency incentives and simplicity of application. It also takes into
account that they will fully absorb negative deviations.
The proposed asymmetric ESM would reduce the regulatory burden by avoiding
contestations of management decisions when the mechanism is applied in negative
deviation situations. Dealing with positive deviations globally without distinguishing the
factors that contributed to such deviations, irrespective of whether or not they are within
the control of the regulated divisions, would also streamline the process." [Emphasis
added]
Request:
11.1 Please comment on the fact that the deadband within which positive deviations
are fully retained by the Transmission Provider and the Distributor also includes
forecasts differences that are not the result of gains in efficiency.

12. Reference: Exhibit B-0004, page 25.
Preamble:
"However, the Transmission Provider and the Distributor propose that the current
process for reviewing their respective costs of service and performance be maintained.
This regular review process, implemented by the Régie in their rate applications, allows
for yearly monitoring of changes in costs as well as efficiency and quality-of-service
indicators for each division respecting many variables." [Emphasis added]
Requests:
12.1 Please comment on the possibility of the ESM being conditional on the
achievement of certain performance indicators. If yes, identify them.
The Transmission Provider and the Distributor wish to add the following additional information:
The regulatory regime currently in place already includes a set of performance and quality of service indicators. The monitoring of these indicators provides, among other things, assurances that these

performance measures are not implemented to the detriment of the quality of the service.
In this respect, the Transmission Provider’s performance indicators are concerned with customer satisfaction, the reliability of the service, cost behaviour and environmental indicators.
In its rate applications, the Transmission Provider presents the analysis of the indicators retained by the Régie, according to requirements expressed by it in its decisions. A history of the results is also presented.
With regard to the Distributor’s performance indicators, they deal with customer satisfaction, the reliability of the electrical service, the quality of the service and safety.
Like the Transmission Provider, the Distributor provides a detailed follow-up of each of its performance indicators in its annual reports and their progression over a five-year period in each of its rate files.
Globally, the results in recent years for the Transmission Provider and the Distributor show that the performance of the two divisions does not constitute an issue.
Moreover, during this period, the divisions posted significant recurring efficiency gains, directly taken into account in the determination of the required revenue and thus fully transferred to the customer base.
The concern according to which such gains can be realized to the detriment of the quality of the rendered service, does not rest on any factual data. The Transmission Provider and the Distributor reiterate and underscore that the ESM is basically intended to respond to the Régie’s request to deal with performance variances. Thus, in the opinion of the divisions, it is not justified to make the ESM conditional upon the achievement of performance targets.
It is, in fact, accepted that the quality of the service and the search for efficiency are not the subject of any arbitration for the government-owned crown corporation, i.e., Hydro-Québec. For the Transmission Provider and the Distributor, achieving performance and efficiency targets that benefit all their customers is indisputable. All decisions on efficiency actions are already made from this perspective and they are intended to include the mean annual growth of costs while globally maintaining the same quality of service and reliability.
For all these elements, in addition to those raised in Exhibit HQTD-2, Document 2 (B-0008), page 17, the Transmission Provider and the Distributor estimate that an application of the ESM conditional upon the achievement of performance targets is neither useful nor appropriate.
12.2 Please comment on the possibility, in the annual review process concerning the
respective costs and performance of the Transmission Provider and the

Distributor, of considering the use of certain existing indicators to determine the
annual deadband applied in the ESM.
The Transmission Provider and the Distributor wish to assert the following additional elements.
The ESM proposed by the Transmission Provider and the Distributor, the purpose of which is to respond to the Régie’s request to deal with performance variances, tallies, among other things, with an objective of the straightforwardness of regulatory enforcement and relief to deal with this question. Its structure, of which the deadband forms part, was developed to strike and maintain a fair balance in terms of the risk assumed by the divisions, while promoting the pursuit of efficiency gains.
However, the divisions are of the opinion that the yearly determination of the deadband in terms of various variables, including the results of the performance indicators, would not fail to give rise to debates that would be counter to the referred regulatory straightforwardness and relief, in addition to introducing a considerable issue of continuity regarding the application of the ESM from one year to the next.
Consequently, the Transmission Provider and the Distributor feel that it is not desirable to complicate the application of the ESM by a yearly re-evaluation of its parameters in terms of the results of the performance indicators.
Lastly, the Transmission Provider and the Distributor refer the Régie to the answer to Request 12.1 on the appropriateness and difficulties of linking the sharing mechanism to performance indicators.
12.3 Please indicate the regulatory framework in which the Régie will examine
overearnings and make adjustments, as the case may be, for the purpose of the
ESM.

The Transmission Provider and the Distributor wish to assert the following additional elements.
In Exhibit HQTD-1, Document 1 (B-0004), pages 25 and 26, the divisions propose a management of performance variances as follows:
• the recognition of the actual performance variance in connection with the annual year-end report;
• the payment of the variance noted in a non-rate base variance account in the rate file;
• the treatment in a subsequent year’s rate application.
Pursuant to Section 75 of the Act respecting the Régie de l’Energie, the Régie has required annual reports from the Transmission Provider and the Distributor annually since 2001.
The annual reports already set out the detailed financial and commercial results of the regulated divisions as well as the performance indicators, in accordance with Decision D-2002-175 rendered by the Régie in File R-3482-2002 as well as in subsequent decisions stipulating its requirements over time. Furthermore, the Régie has all the leeway needed to send any request for information to the divisions enabling it to determine the compliance of these reports in order to declare its satisfaction therewith pursuant to its review.
The divisions are of the opinion that this tried and tested strict regulatory framework is adapted to draw up the annual statement of performance variances and determine the amounts that must or must not be remitted to the customer base pursuant to the ESM that will be approved.
The addition of a new phase, such as a regulatory closing in the course of a public hearing, would potentially introduce new delays and would weigh down the process to review the annual results as currently ongoing. In addition, the Transmission Provider and the Distributor are of the opinion that the application of the ESM as proposed does not require the addition of any such phase.

For these reasons, the Transmission Provider and the Distributor do not favour the application of a regulatory closing to analyze the performance variances noted each year.
12.4 In addition to lightening the regulatory burden, please indicate the advantages and
disadvantages of implementing a regulatory closing of books associated with the
ESM.
R12.4
Besides the advantages associated with the regulatory relief, the Transmission Provider and the Distributor point out the lack of need to foresee such a phase given the proposed simple variance processing mechanism. Also see the answer to Request 12.3.
12.5 Please indicate what the Transmission Provider and Distributor's position would
be regarding a review of the overearnings pertaining to the ESM in a regulatory
closing of books.
R12.5
See the answers to Requests 12.3 and 12.4.
13. References: (i) Transmission Provider's 2007-2012 Annual Reports,
Exhibit HQT-2, Document 1.1;
(ii) Distributor's 2007-2012 Annual Reports, Exhibit HQD-2,
Document 3.
Preamble:
(i) In its 2007-2012 annual reports filed under section 75, the Transmission Provider
presented a comparison of recognized regulatory performance and revenue requirements,
and explained the main differences.
The Régie has prepared the following table based on information in the Transmission
Provider's 2007-2012 annual reports:

Table 13.1
Source of the Transmission Provider's 2007-2012 earnings deviations (in $M)
REVENUE
AR 2012 AR 2011 AR 2010 AR 2009 AR 2008 AR 2007
Transmission -0.1 0.0 0.0 0.0 0.0 0.0
EXPENSES
Net operating expenses -46.6 -50.5 -58.1 -40.0 -21.5 22.3
Direct gross expenses -46.0 -32.2 -46.6 -31.1
Shared service expenses -11.4 -14.7 1.9 11.5
Capitalized costs 10.7 -11.9 -24.3 -23.1
Intersegment customer expenses 0.1 -2.9 0.9 2.7
Régie Decision 11.2 10.0 0.0
Other expenses -49.0 7.3 -3.6 14.9 -2.4 7.3
Power transmission purchases -4.0 -4.3 -6.4 5.8 -1.0 -1.4
Depreciation and amortization -45.2 14.9 13.6 15.1 -6.9 11.1
Taxes -1.9 -4.1 -10.6 -7.2 4.3 -2.4
Other intersegment customer expenses 2.1 0.8 -0.2 1.2 1.2
VA – pension expenses
-1.0 16.8
External customers and other units
-6.7 -10.9 -11.5 -10.2 -5.1 -0.8
Accretion expense 0.3
Cost of debt -49.1 -29.6 -14.7 -48.3 -2.7 34.6
Total expenses -152.1 -66.9 -87.9 -83.6 -31.7 63.4
Earnings deviations 152.0 66.9 87.9 83.6 31.7 -63.4
AR: Annual report
(ii) In its 2007-2012 annual reports filed under section 75, the Distributor presented a
comparison of recognized regulatory performance and revenue requirements, and
explained the main deviations.
The Régie has prepared the following table based on information in the Distributor's
2007-2012 annual reports.

Table 13.2
Source of Distributor's 2007-2012 earnings deviations (in $M)
REVENUE
AR 2012 AR 2011 AR 2010 AR 2009 AR 2008 AR 2007
Electricity sales net of electricity purchases
33.1 37.6 78.3 -4.1 -18.7 8.1
Revenues other than sales of electricity
-7.1 -8.3 13.8 30.5 31.6 21.9
External customers -9.3 -11.3 9.9 18.8 21.3 21.0
Intersegment customers 2.2 2.5 3.7 11.7 10.3 0.9
Interest credit – Gov't. refund 0.0 0.5 0.2 0.0 0.0 0.0
Total revenues 26.0 29.3 92.1 26.4 12.9 30.0
EXPENSES
Operating expenses -26.4 -22.8 -26.7 -38.9 -3.6 -11.5
Direct gross expenses -22.6 -7.3 -85.2 -85.4 -1.2 -0.3
Shared service expenses -20.5 -7.2 54.1 40.9 -2.5 -1.9
Capitalized costs 42.9 6.9 11.5 10.1 11.2 -0.6
Revenue-Cost recovery (1) -26.2 -15.2 -7.1 -4.5 -11.1 -8.7
Corporate costs -3.5 -8.3 -12.5 -9.8 -4.6 -3.5
Other expenses -31.9
-28.3
-24.8
-1.3
-6.6
8.3
Depreciation and amortization -24.9 -25.4 -19.7 2.3 0.1 18.1
DEA – Major Projects -5.6 -0.1 1
Taxes -1.4 -2.8 -5.1 -3.6 -1.4 -2.5
Fuel purchases 0.0 0.0 0.0 0.0 -5.3 -7.3
Accretion expense -0.1
Cost of debt -23.5 -12.5 -15.3 -29.3 -1.1 27.3
Total expenses -85.4 -71.9 -79.3 -79.3 -13.7 20.6
Earnings deviations 111.4 101.2 171.4 105.7 26.6 9.4 Note 1: Reclassified as per the presentation requested in rate case 2013 (R-3814-2012) and authorized in D-2013-037.
AR: Annual report
Requests:
13.1 Please confirm or complete, as the case may be, the information on earnings
deviations for 2007-2012 period of the Transmission Provider and Distributor
respectively, presented in references (i) and (ii).
R13.1
The Transmission Provider validated table 13.1 and confirms that the performance variance data for the 2007-2012 period is correct.
The Distributor validated table 13.2 and confirms that the performance variance data for the 2007-2012 period is correct.
13.2 Please indicate if the source of variances in the Transmission Provider's and
Distributor's operating expenses is attributable to efficiency gains and/or forecast
variances. Please quantify.
R13.2
The variances relating to operating costs stem in all cases from variances between forecasts and actual costs noted for a given year. However, some of these variances stem from unexpected efficiency gains, but are difficult, even impossible in certain cases, to distinguish from forecast variances.
In fact, the Transmission Provider and the Distributor make decisions on a daily basis and globally and dynamically manage their costs while respecting the budget established according to a parametric method and recognized by the Régie. In this context, expenses over and above the amount allotted for certain budgetary items must be offset by cost-cutting in other budgetary items.
The Transmission Provider and the Distributor present a global change analysis of their operating costs in their respective annual reports for 2007 to 2012 .
13.3 Please indicate if the Transmission Provider's and the Distributor's depreciation
and amortization variances derive primarily from commissioning lead times, and
if so, indicate if the variances are attributable to efficiency gains or forecast
differences. Please explain.
R13.3
Depreciation variances are mainly attributable to the following elements:
• Value of commissioned capital assets;
• Commissioning delays;
• Useful life review;
• Value of net costs related to the disposal of fixed assets and intangible assets.
The change in the value of commissioned capital assets can be explained by efficiency gains and forecast variances. However, even with reasonable effort, the Transmission Provider and the Distributor cannot differentiate these two types of variances.
The variances due to commissioning delays, useful life review and the value of net costs related to the disposal of fixed assets and intangible assets are attributable to forecast variances.
An analysis of the depreciation expense change is presented in Exhibit HQD-2, Document 3, and in Exhibit HQT-2, Document 1.1, of the Transmission Provider’s and the Distributor’s annual reports for 2007 to 2012.

13.4 Please indicate if the cost-of-debt variances for the Transmission Provider and
Distributor would be reduced if the Régie accepted the update as proposed by the
applicants during the rate case.
R13.4
The goal of this proposal is, in point of fact, to reduce the variances relating to the costs of borrowed capital. This update is, if you will, a re-evaluation of the projected debt cost by taking into account the debt existing on a more recent date and by updating the assumptions regarding expected loans and interest rates. Moreover, this update will allow for an incorporation of the most recent financing completed during the reference year. This new evaluation would take rate and volume changes into account in the numerator and denominator of the cost of the debt.
While established for the purpose of reducing the variances relating to the costs of borrowed capital, the new cost obtained would remain a projection and would not eliminate all the variances with the actual debt cost.
Currently, when the financial policy is filed, the evaluation of the cost of the debt takes into account the debt existing as at April 30 of the reference year, new expected loans, as established on such same date, and the economic variables obtained from Consensus Forecasts published in May.
The proposal to update the cost of the debt would take into account the debt existing as at October 31 of the reference year, thus incorporating the new financing completed during the months of May to October. Likewise, any other financial transaction carried out during this period, in connection with the management of the debt, would be considered. Thus, considering these recent transactions as well as market developments, a new projection of the loans would be drawn up and used in the revised calculation of the cost of the debt. Lastly, the rates would be established based on Consensus Forecasts for November. For the rate forecasts applicable to Hydro-Québec, the methodology in effect in previous rate files would be applied.
This proposal is in keeping with a context where the update should be submitted to the Régie de l’énergie and to the intervening parties. Also, as the information request period would be over at the time of its filing, the Transmission Provider and the Distributor propose that the topic be discussed at the later hearing, namely the Distributor’s, usually held in December. A subsequent update would not enable the Régie and the intervening parties to question the Distributor and the Transmission Provider on this review of the costs of the borrowed capital. Lastly, a simultaneous update would allow the Transmission Provider and the Distributor to submit the same revised borrowed capital costs knowing that they will obtain the same actual debt cost. In addition, to update on just one date would simplify the process.

13.5 Please comment on the causes of the Distributor's variances pertaining to sales of
electricity net of purchases of electricity, specifically respecting growth in the
number of accounts resulting from forecasted housing starts, the increase in
electric heating customers, and increased production by industrial customers.
Please indicate the extent to which they are attributable to efficiency gains or to
forecast differentials.
R13.5
The volume variances in electricity sales to the residential customer base (Rate D) are, among other things, due to an unexpected growth in the number of subscribers, including the increase in the number of residential customers using electric heating. It results, in particular, from variances between actual and planned housing starts that varied between 5,400 and 16,400 per year over the 2007 – 2012 period.
The sales variances relating to the big business customer base (Rate L) are caused by industrial customer production cuts in 2007, 2008 and 2009. Weak world-wide demand, increased competition by emerging economies and the economic slowdown in 2008 followed by the recession in 2009 account for the drop in sales greater than expected, in particular, in the pulp and paper sector. Moreover, the economic recovery in 2010 as well as the temporary Rate L contract awarded to the Rio Tinto Alcan customer over the 2010-2011 period, to make up for the low flow coefficient in its reservoirs, basically account for the positive forecast variances notwithstanding the rationalizations in the pulp and paper sector.
As the Distributor mentioned in rate file R-3814-2012 of Exhibit HQD-13, Document 7, in response to question 1 by the CFIB, additional forecasting tools consisting in multiple linear regression models were developed for each consumer sector in order to improve precision forecasts. These models directly integrate economic and demographic variables like housing starts, employee compensation or economic statistics relating to industrial sectors, like pulp and paper, mines, metal processing and other manufacturing sectors.
(…)

TESTIMONY OF ROBERT C. YARDLEY OF CEA CONCERNING ESMs
The following questions are addressed to Mr. Robert C. Yardley:
14. Reference: Exhibit B-0008, pages 5 and 6.
Preamble:
"Q. What are the key parameters of an ESM?
A. The ESM begins with the calculation of realized earnings for a preceding twelve-
month period and this calculation is typically performed for each year of a multi year
rate plan. Some adjustments could be necessary (such as the exclusion of revenue, cost,
or plant items) to ensure a valid comparison between the authorized and realized ROE.
Using this comparison as a starting point, ESMs are defined by two key parameters (1)
the size of a "deadband" around the authorized ROE, and (2) the "customer sharing
percentage" or the sharing of earnings with customers that applies when realized
earnings fall outside of the deadband."
Request:
14.1 Please indicate what exclusions could be necessary in the comparison of the
authorized and realized rates of return (ROE) as the point of departure in the ESM
of the Transmission Provider and that of the Distributor.
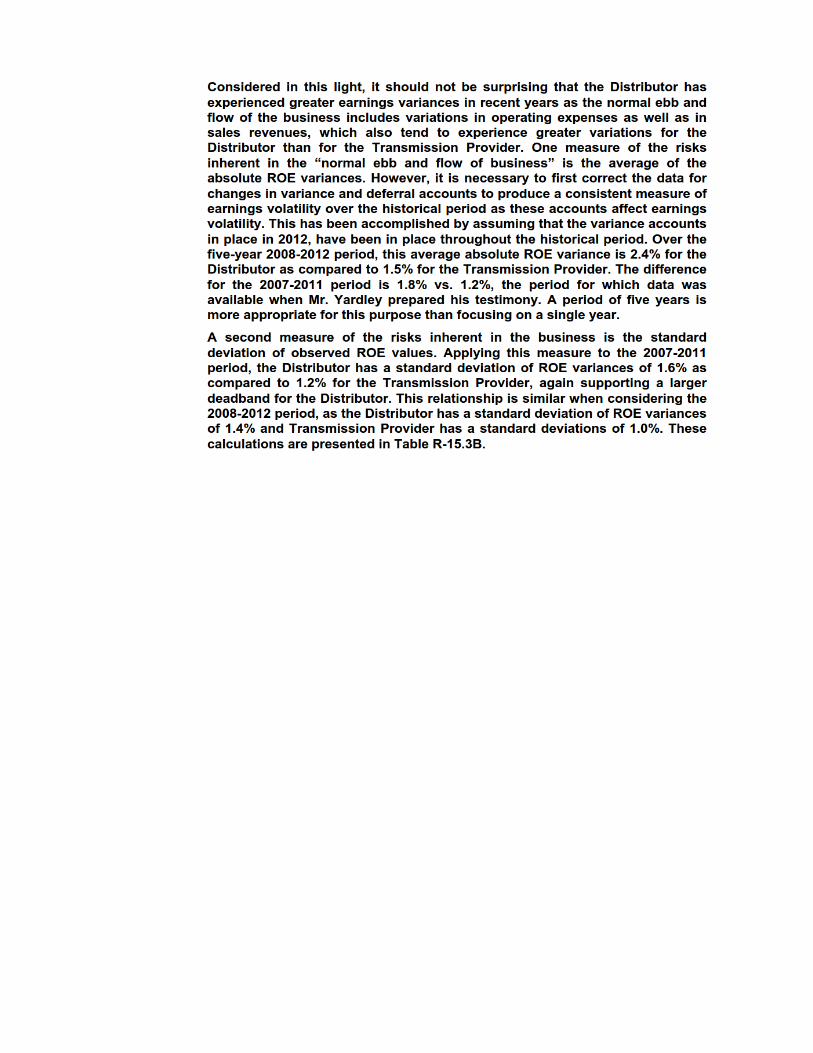
15. Reference: Exhibit B-0008, page 6.

Preamble:
"One of the purposes of having a deadband is to reflect the normal ebb and flow of the
business and provide an incentive for the utility to manage costs throughout its
operations. A second, but related purpose is to provide an incentive for the utility to
implement initiatives that are designed to achieve operating efficiencies. These factors
contribute to the evaluation of the size of the deadband."
Requests:
15.1 Please explain and discuss what factors would be taken into account respecting
the deadband to reflect the normal ebb and flow of the business of both the
Distributor and the Transmission Provider.
15.2 Please explain, separately for the Transmission Provider and the Distributor, the
nature and form of the incentive presented by having a deadband in the ESM.
Please explain how that deadband would induce the Transmission Provider and
Distributor to initiate projects oriented towards achieving greater or further
efficiency gains.

15.3 Please explain the relationship between the factors discussed in 15.1 and the size
of the deadbands attributed to the Transmission Provider (50 basis points) and au
Distributor (100 basis points) in the joint proposal that has been presented.
15.4 Please comment on the fact that the deadband within which positive variances are
fully retained by the Transmission Provider and the Distributor also include
forecast variances that are not the result of efficiency gains.
16. Reference: Exhibit B-0008, page 11.
Preamble:
"Q. Are there any circumstances that are unique to either HQD or HQT (or both) that
might affect the design of an ESM?
A. There are several circumstances that are relevant for purposes of designing an ESM
for HQD and HQT. These include:
the recent earnings experience;
the practice of filing annual rate cases based on cost-of-service principles; and
the presence of variance and deferral accounts."
Requests:
16.1 Please explain if the recurrence of forecast variances due to conservative forecasts
are part of the circumstances that are unique to the Transmission Provider and the
Distributor. Please discuss if such variances are included in the design of the
Transmission Provider's and Distributor's ESM as proposed.

16.2 For the other regulated companies in the Canadian and U.S. reference groups
please discuss the treatment by their regulatory authorities of forecast variances
observed in their respective ESMs.
17. Reference: Exhibit B-0008, pages 11 and 12.
Preamble:
"As presented in Table 1, HQD and HQT have each been able to earn in excess of their
authorized ROE over the past five years, with the exception of HQT in 2007."
Requests:
17.1 For illustration purposes, please complete table 1 in the Preamble indicating the
information presented in the 2012 annual report filed recently by the
Transmission Provider and the Distributor and provide details of the ESM
proposed by the applicants, applicable as of 2007, for each year (basis point of the
shortfall, of the deadband, of the 50% attributed to the applicants and of the 50%
attributed to customers).
Table 1
Realized v. Authorized ROE
HQT HQD
2007 -1.28% +0.31%
2008 +0.85% +0.90%
2009 +1.77% +3.16%
2010 +1.69% +4.94%
2011 +1.44% +2.80%
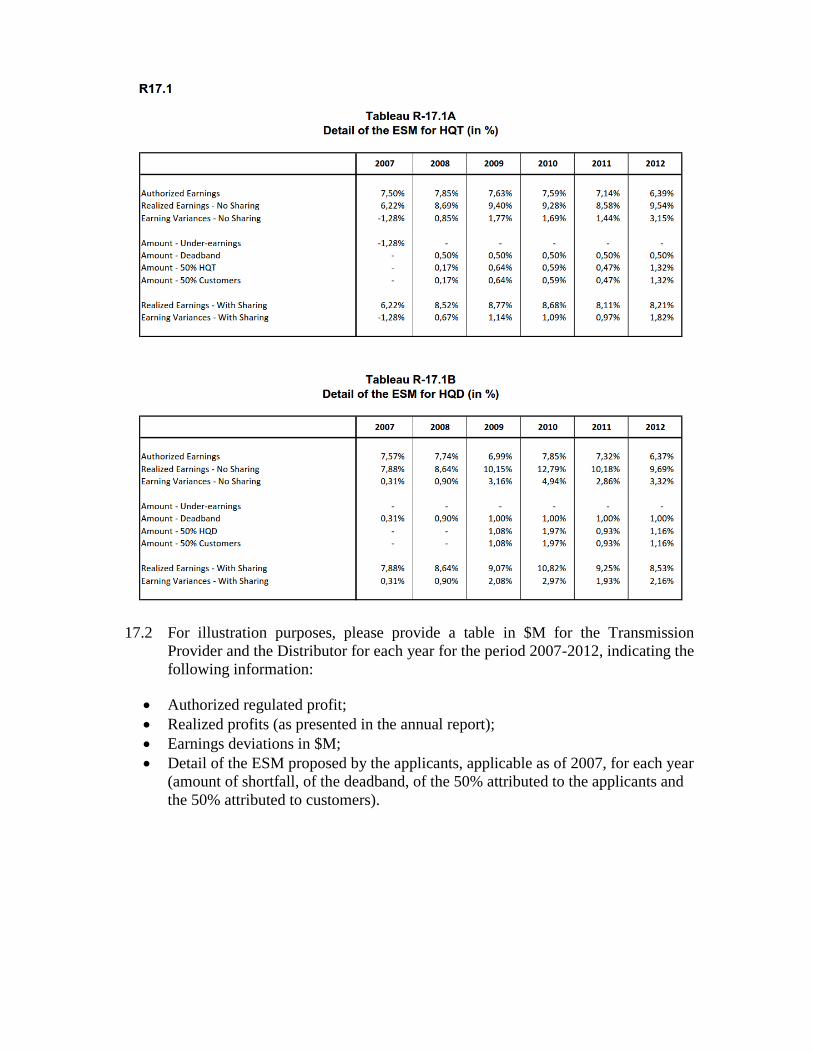
17.2 For illustration purposes, please provide a table in $M for the Transmission
Provider and the Distributor for each year for the period 2007-2012, indicating the
following information:
Authorized regulated profit;
Realized profits (as presented in the annual report);
Earnings deviations in $M;
Detail of the ESM proposed by the applicants, applicable as of 2007, for each year
(amount of shortfall, of the deadband, of the 50% attributed to the applicants and
the 50% attributed to customers).

18. References: (i) Exhibit B-0008, page 16;
(ii) Exhibit B-0008, pages 12 and 13; (iii) Tables 13.1 and 13.2 presented in the Régie's question 13.
Preamble:
"Third, I recommend that the ESMs for HQD and HQT each have a deadband before
upside sharing begins. Specifically, I recommend a +100 basis point deadband for HQD
and a +50 basis point deadband for HQT. The wider deadband for HQD reflects the
greater sensitivity of HQD's earnings to variations in revenues and Operating Expenses.
I believe that a meaningful upside deadband is appropriate in recognition that HQD and
HQT will be absorbing all of the downside risk. At the same time, my proposed deadband
is responsive to the earnings variability concerns expressed by the Régie and interested
parties while maintaining an adequate incentive to achieve efficiency gains that will
benefit customers in the future."

"Q. Are there any reasons why HQD might have experienced greater earnings
variability than HQT?
A. There are at least two reasons why HQD has experienced greater earnings variability
than HQT over the past five years.
First, HQT is relatively insulated from variations in revenues. Approximately 90% of
HQT's revenues are provided by HQD (native load transmission service) and are fixed
on an annual basis. The remaining 10% of HQT revenues (point-to-point transmission
services) are subject to a variance account. HQD experiences variances from sales levels
that are either higher or lower than the sales levels relied upon to calculate rates.
Second, a much larger proportion of HQD's net revenues (i.e., net of supply costs) derive
from Operating Expenses. As a result, HQD's earnings are more sensitive to percentage
changes in Operating Expenses."
(iii) The Régie prepared the following Table based on the Distributor's and
Transmission Provider's 2007-2012 annual reports.
Table 18.1
Distributor and Transmission Provider's 2007-2012 earnings deviations
excluding variations in revenues (in $M) AR 2012 AR 2011 AR 2010 AR 2009 AR 2008 AR 2007 2007-2012
Average
HQD overearnings 111.4 101.2 171.4 105.7 26.6 9.4 87.6
Variances for sales of electricity
net of electricity purchases 33.1 37.6 78.3 -4.0 -18.8 8.1 22.4
78.3 63.6 93.1 109.7 45.4 1.3 65.2
HQT overearnings 152.0 66.9 87.9 83.6 31.7 -63.4 59.8
Variances for transmission
revenues
-1.0
0.0
0.0
0.0
0.0 0.0 -0.2
153.0 66.9 87.9 83.6 31.7 -63.4 60.0
AR: Annual report
The Régie notes that had it not been for the earnings deviations, the Distributor's and
Transmission Provider's overearnings are comparable, except for 2012.
Requests:
18.1 Please confirm that 100 basis points for the Transmission Provider represents
approximately $50 M, and for the Distributor, approximately $35 M.
18.2 Considering the Transmission Provider and Distributor's 2012 overearnings, please
explain if the different deadband for the Transmission Provider and the

Distributor, namely 50 basis points and 100 basis points respectively, remains
relevant.
18.3 Considering the information presented in reference (iii), please justify the different
deadband for the Transmission Provider and the Distributor, namely 50 basis
points and 100 basis points respectively.
19. References: (i) Exhibit B-0008, page 17;
(ii) Transmission Provider's 2012 Annual Report, Exhibit HQT-2,
Document 11;
(iii) Distributor's 2012 Annual Report, Exhibit HQD-9, Document 2;
(iv) Matter No. R-3777-2012, Exhibit B-0010;
(v) Matter No. R-3814-2012, Exhibit B-0025.
Preamble:
(i) "Q. Have you considered whether it is appropriate to implement a more formalized set
of operational performance measures or "service quality plan" to accompany the
implementation of an ESM for HQD and HQT?
A. Operational performance measures serve a critical role for utilities in identifying
potential areas of improvement and in driving internal performance. They also serve as
indicators to regulators that there may be an area of the utility business that merits
further scrutiny. However, taking the next step by formally linking performance to
financial results by including a set of penalties and rewards requires careful
consideration. Establishing such a linkage is not a trivial exercise. They require
agreement on the performance to be measured, development of a penalty and/or reward
structure and reporting requirements, and the specific measurement calculation to be
applied to each measure. For new measures, the utility will have to implement new
business and information processes to capture the necessary data, at a cost to ratepayers.
Establishing the proper benchmark is perhaps the most challenging aspect as it often
depends on utility-specific circumstances. Establishing a benchmark that is too rigorous
may unfairly penalize the utility or provide an incentive to over-invest to meet the
benchmark and then recover these costs from customers.
This effort may be justified for multi year rate plans where the regulator may not have an
opportunity to raise service quality concerns in an annual rate case, as is possible with
respect to HQD and HQT." [Emphasis added]

(ii) In its 2012 annual report filed under section 75, the Transmission Provider
presented its performance measure results.
(iii) In its 2012 annual report filed under section 75, the Distributor presented its
performance measure results.
In its 2012 rate case, the Transmission Provider presented the change in its performance
measures.
(v) In its 2013 rate case, the Distributor presented the changes in its efficiency and
performance measures.
Requests:
19.1 Considering that the Transmission Provider and the Distributor have presented
changes in their performance measures via their annual reports and their rate cases,
and apart from the difficulties that such an exercise may present both as regards
measures and results sought, please indicate why the applicants' ESM would not
be conditional on the achievement of certain performance measures.
19.2 Please indicate which existing or new performance measures the Transmission
Provider and the Distributor would use in an ESM.


![à c.J. - publicsde.regie-energie.qc.capublicsde.regie-energie.qc.ca/projets/272/DocPrj/R-3897-2014-C-EBM... · 66 INFORMATION COMMISSIONER v. CANADA (RCMP) [2003] 1 S.C.R. Information](https://static.fdocuments.in/doc/165x107/5bbfecc209d3f22e7d8d0163/a-cj-66-information-commissioner-v-canada-rcmp-2003-1-scr-information.jpg)
![regie-energie.qc.ca - [2002] 2 S.C.R. [2002] 2 R.C.S. …publicsde.regie-energie.qc.ca/projets/272/DocPrj/R-3897...558 SIERRA CLUB v. CANADA (MINISTER OF FINANCE) [2002] 2 S.C.R. [2002]](https://static.fdocuments.in/doc/165x107/5fc64a62f0e6a312631c07d9/regie-2002-2-scr-2002-2-rcs-publicsderegie-558-sierra-club-v.jpg)