Republic of Rwanda - MINECOFIN · · 2015-04-17The main contributors to Q1 growth were...
27
September 2014 Republic of Rwanda: A Model of Reform-Driven, Market-Based, Sustainable Development Investor Presentation
Transcript of Republic of Rwanda - MINECOFIN · · 2015-04-17The main contributors to Q1 growth were...

September 2014
Republic of Rwanda: A Model of Reform-Driven, Market-Based, Sustainable Development
Investor Presentation
Key Achievements over the last two decades
Political stability,
rule of law and
zero tolerance
for corruption
Rapid economic
growth and
reduction in
poverty
Market-friendly
policy
environment
Economy
resilient to
external
shocks
Comprehensive
program of
investment in
energy, agriculture,
ICT, tourism
Low level of
government
debt
Rapid growth built
on prudent fiscal
and monetary
policies and
structural reforms

1. Country Overview
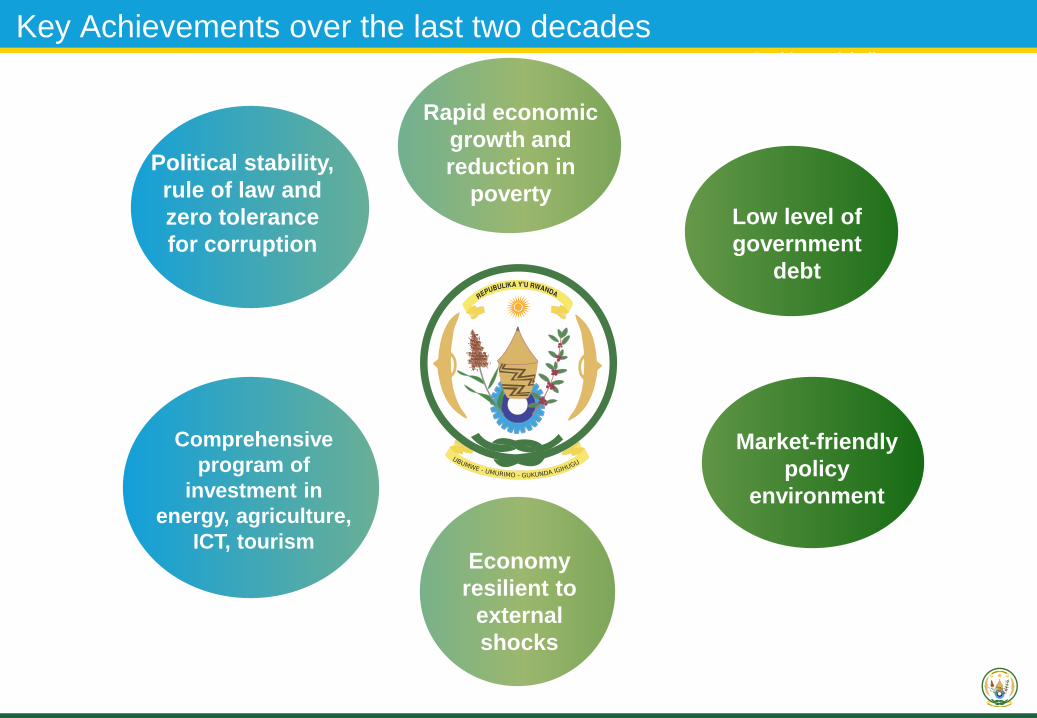
Rwanda at a Glance
“Rwanda…almost tripled its per capita GDP in the last decade; and has used
donor funds efficiently (as acknowledged by the donors themselves and
international financial institutions). Rwanda has also posted strong performance
under the IMF's policy support instrument (PSI) and has reduced poverty rates to
45% in 2010/11, from 57% in 2005/06. A low public debt burden, as a result of debt
relief from the HIPC and MDRI programs, also supports the ratings.”
(S&P, Rating Report – 2013)
Fitch’s rating is supported by solid economic policies and a track record of
structural reforms, macroeconomic stability and low government debt (27.8 % of
GDP in 2013). Fitch's central scenario is that Rwanda will continue to attract
significant budget support flows, reflecting its strong track record in poverty
reduction and control of corruption.”
(Fitch, Rwanda Report - 2014)
1. National Institute of Statistics Rwanda (NISR).
2. Source: MINECOFIN; NISR; NBR for exchange rate (RwF 667.7 / US$ is 2013 average)
3. NISR 2012 Database.
4. UNICEF - Literacy rate, adult total (% of people ages 15 and above) 2011(Latest Available).
5. Source: MINECOFIN (provisional estimate)
6. World Bank Doing Business Report 2014.
7. Fitch. S&P
8. BNR
Capital Kigali
Population 10.5 million (2012)1
Nominal GDP RwF 4915 billion (2013, approx. US$ 7.3 billion)2
GDP Growth 4.7 % (2013)3
Literacy Rate 71%4
External Debt (% of GDP) 21.5% ( End 2013)5
Time to Start a Business 2 days6
Credit Rating B+(stable), B(positive)
CurrencyRwandan Franc (682.54 FRW = 1US$ as of End June 2014)
8
Rwanda in the heart of AfricaKey Facts 2012-2014
Source: Fitch and S&P
Rating Considerations Rwanda and the International Community
Performance of the 1st review under the IMF-supported program
remains satisfactory. Structural reforms advanced as planned, and
the government is moving ahead with much-needed revenue
mobilization efforts.
Rwanda is also a member of the African Development Bank Group
Rwanda is one of the most business-friendly countries in Africa
Ranked 2nd among the Sub-Saharan Africa countries, after
Mauritius, and 32nd globally, out of 189 countries included in the
World Bank’s Doing Business Report 2014.
Rwanda is member of EAC, COMESA and Commonwealth.
Foreign Currency Local Currency Outlook
B B Positive
B+ B+ Stable
East Africa is one
of the fastest
growing regions in
Africa National Boundary
Province Boundary
National Paved Road
District Boundary
National Park

Rwanda’s Perfect Development Hat Trick
GDP Per Capita (US$)
Sustained economic growth has lifted more than
1 million people out of poverty
Stable inflation %
• Rapid Economic Growth and Macroeconomic Stability: resilient to
shocks
• Government efficiency and control of corruption
• Inclusive development model
- Important poverty reduction and reduced inequality
- Increased access to services: Health, Education, Financial inclusion
Rwanda’s development hat trick over last 2 decades
6.6%
-10.4%
-41.9%
11.5% 8.4% 13.2% 9.2% 11.2% 7.3%
7.8%
8.8%
77% 60.4%57%
44.90%
-60.0%
-40.0%
-20.0%
0.0%
20.0%
40.0%
60.0%
80.0%
100.0%
19
92
19
93
19
94
19
95
19
96
19
97
19
98
19
99
20
00
20
01
20
02
20
03
20
04
20
05
20
06
20
07
20
08
20
09
20
10
20
11
20
12
GDP growth (%) Population below poverty line
Source: MINECOFIN
0.0
4.0
8.0
12.0
16.0
20.0
24.0
28.0
32.0
36.0
Jan-11 May-11 Sep-11 Jan-12 May-12 Sep-12 Jan-13 May-13 Sep-13 Jan-14 May-14 Sep-14
Uganda Kenya Tanzania Rwanda Burundi

Rwanda’s Perfect Development Hat Trick
611500
1071
750
476
0
200
400
600
800
1000
1200
1990 1992 2000 2005 2010 2015
Nu
mb
er
of
De
ath
s p
er
10
0,0
00
Number of Deaths
151
196
152
72
0
50
100
150
200
250
1990 2000 2005 2010 2015
Nu
mb
er
of
De
ath
s
Number of deaths
Maternal mortality Under- five mortality
• Life expectancy: from 51.2 years in 2002 to 64.5
years in 2012
• Literacy rates (aged 15 to 24): from 48% in 2000
to 84% in 2011
• Financial inclusion: from 48% in 2008 to 72% in
2012 (3rd best in SSA)
• Mobile phones owners: from 6% in 2006 to 65%
in 2014

2. The EconomyNearly Two Decades of Strong Growth

-5%
0%
5%
10%
15%
Ghana
Rw
anda
Nig
eria
Moza
mbiq
ue
Gabon
Zam
bia
Tan
zania
Uganda
Bots
wana
Nam
ibia
Kenya
Cam
eroon
Angola
South
Afric
a
Senegal
Rwanda Has Been a Leader in Africa’s Economic Renaissance
The Foundation of Rwanda’s Robust Growth
Rwanda has undergone a sustained period of growth supported
by various factors, among which:
– Implementation of structural reforms, which have pushed
Rwanda up to the ranks of world’s top performer in the World
Bank’s Ease of Doing Business Index in 2010, the first Sub-
Saharan Africa country to achieve this distinction
– Sustained investment by the Government, which is expected to
drive output growth in the coming years
– Sound macroeconomic management and robust fiscal discipline
Source: IMF World Economic Outlook (October 2013).
Source: MINECOFIN.Source: MINECOFIN.
2001 2013
Sustained Real GDP Growth
GDP % Growth Vs. African Peers
Structure of the Economy: More Services, Less Agriculture(% of Nominal GDP)
Since 1995, GDP growth has dipped below 6% in only one year.
CD
I
2011 2012
8.4%
8.5%
13.2%
2.2%
7.4%
9.4%
9.2%
7.6%
11.2%
6.2%
7.3%
7.8%
8.8%
4.7%
0.0%
2.0%
4.0%
6.0%
8.0%
10.0%
12.0%
14.0%
-5%
0%
5%
10%
15%
20%
25%
30%
35%
40%
AGRICULTURE INDUSTRY SERVICES GDP %
33%
15%
47%
5%
AGRICULTURE INDUSTRY SERVICES ADJUSTMENTS
37%
14%
44%
5%
AGRICULTURE INDUSTRY
SERVICES ADJUSTMENTS
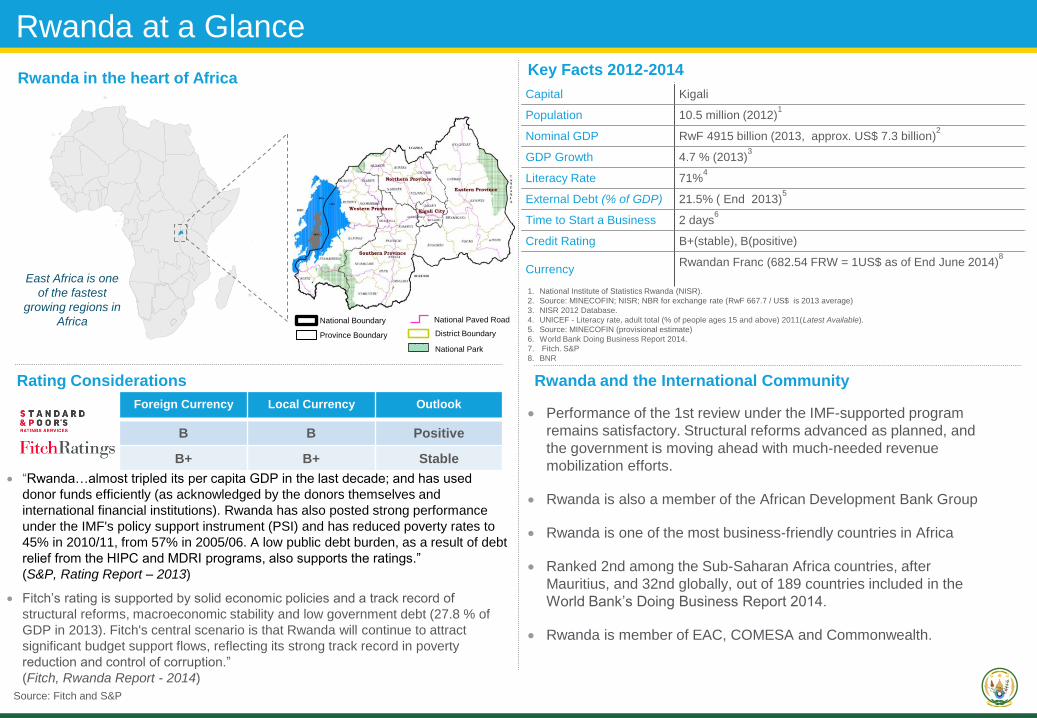
Rwanda’s Recent Economic Developments
GDP 2013 - 2014
• Real GDP growth in 2013 has moderated and stood at 4.7 %,
before bouncing back at 7.4% in Q1 2014.
• The main contributors to Q1 growth were Agriculture with strong
performance during season A, and services
Outlook
• Economic activity is expected to pick up by End 2014.
• Stepped up government spending in line with EDPRSII expected
to give a boost to aggregate demand.
• Services are expected to continue driving growth.
• Prices will remain stable at single digit level and are expected to
not exceed 3% by end 2014.
Inflation 2014
• Overall prices have subsided owing mostly to lower food prices
and reduction in imported inflation.
• Core inflation (excluding fresh food and energy) has also been
low.
• End June inflation in 2014 was 1.4 % . It decelerated further to
0.9% by August 2014
(Inflation,
e.o.p) Dec-12 Mar-13 Jun-13 Sep-13 Dec-13 Mar-14 Jun-14
Uganda 5.5 4.0 3.6 8.0 6.7 7.1 4.9
Kenya 3.2 4.1 4.9 8.3 7.2 6.3 7.4
Tanzania 12.1 9.8 7.6 6.1 5.6 6.1 6.4
Rwanda 3.9 3.2 3.7 5.1 3.6 3.5 1.4
Burundi 11.8 5.9 11.4 12.1 9.0 3.8 3.3

Strong Export Goods Growth since 2009
• From a contraction in 2009, annual average export goods growth
has been 30%.The slowdown in 2013 is mainly due to a slowdown
in informal cross border trade, and the decline in coffee and tea
prices and in volume for tea.
• Coltan (Rwanda’s most important mineral) grew by 136 % in 2013
(exporters were able to respond elastically to a 10% increase in
price by more than doubling their volume of exports).
• Minerals in 2013 represent 32 % of total goods exports by value,
up from 22 % in 2009. They contributed 15 percentage points to
growth in 2013.
• Rwanda’s exports to EAC continue to increase and main exports
are tea, raw hides and skins, coffee, bars and rods of iron,
leguminous vegetables and beer.
Exports by Destination (2013 % of total)Composition of Export Goods (2013, % of Total fob)
Source: National Bank of Rwanda and National Institute of Statistics.
Source: National Institute of Statistics of Rwanda
Source: National Bank of Rwanda
Coffee, 7.8%
Tea, 7.9%
Cassiterite , 8.7%
Coltan, 19.1%
Wolfram, 4.3%
Hides and skins, 2.3%
Pyrethrum, 1%
Other ordinary products,
11.7%
Reexports, 19.2%
Adjustments, 2.9%

Imports Support Growth but a Slowdown in 2013
Source: National Bank of Rwanda and National Institute of Statistics. Source: National Bank of Rwanda and National Institute of Statistics.
Currently the main origins of imports are Uganda, China, Kenya, and Europe.
In 2013, imports slightly increased in volume terms (4.3%) and in value (cif) terms (2.2%), consistent with a slow down in the
growth of economic activity.
Rwanda’s imports to EAC represents 23% of total imports and main imports are cement, refined and non-refined palm oil and
other cooking oils, sugar cane, animals, chemical fertilizers and clothing.
Composition of Imports (2013, % of Total cif value)Import growth (cif, y-on-y)
Increased Imports Driving Balance of Payments
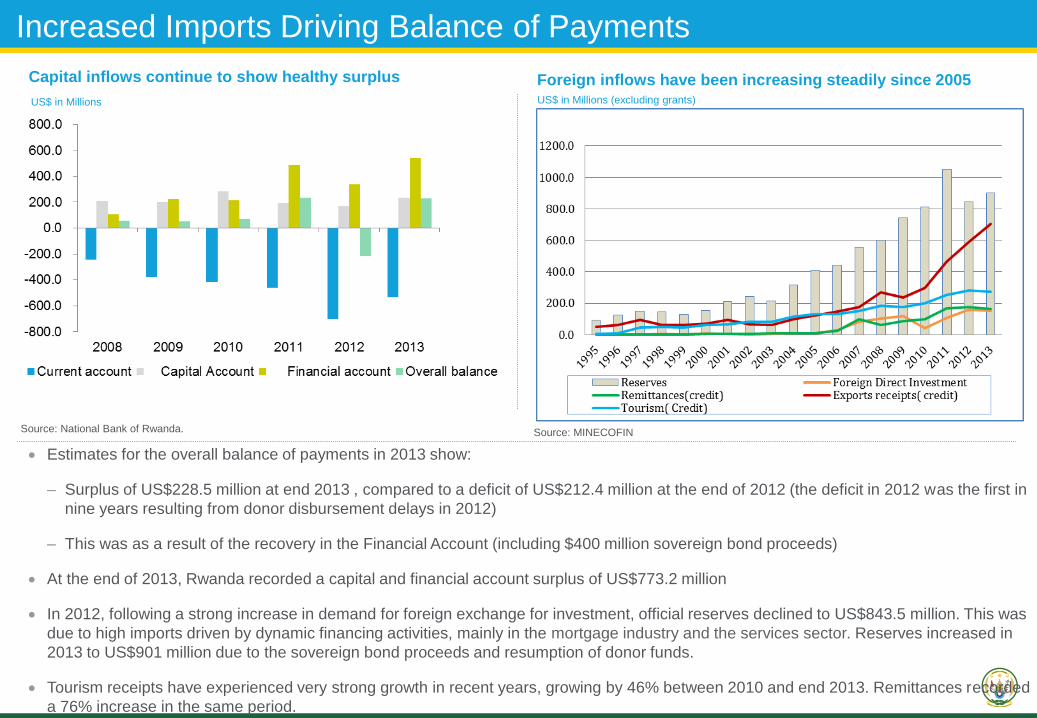
Estimates for the overall balance of payments in 2013 show:
– Surplus of US$228.5 million at end 2013 , compared to a deficit of US$212.4 million at the end of 2012 (the deficit in 2012 was the first in
nine years resulting from donor disbursement delays in 2012)
– This was as a result of the recovery in the Financial Account (including $400 million sovereign bond proceeds)
At the end of 2013, Rwanda recorded a capital and financial account surplus of US$773.2 million
In 2012, following a strong increase in demand for foreign exchange for investment, official reserves declined to US$843.5 million. This was
due to high imports driven by dynamic financing activities, mainly in the mortgage industry and the services sector. Reserves increased in
2013 to US$901 million due to the sovereign bond proceeds and resumption of donor funds.
Tourism receipts have experienced very strong growth in recent years, growing by 46% between 2010 and end 2013. Remittances recorded
a 76% increase in the same period.
US$ in Millions
Foreign inflows have been increasing steadily since 2005
Source: MINECOFINSource: National Bank of Rwanda.
US$ in Millions (excluding grants)
Capital inflows continue to show healthy surplus
Fiscal Policy Framework
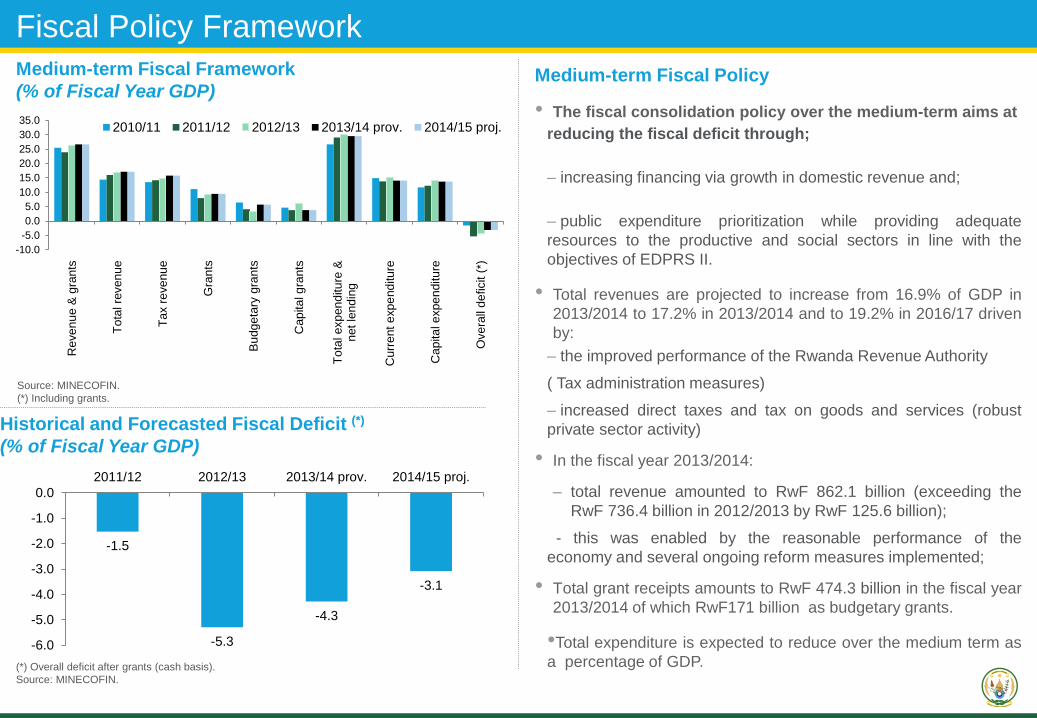
Historical and Forecasted Fiscal Deficit (*)
(% of Fiscal Year GDP)
(*) Overall deficit after grants (cash basis).
Source: MINECOFIN.
Medium-term Fiscal Framework
(% of Fiscal Year GDP)
Source: MINECOFIN.
(*) Including grants.
-10.0
-5.0
0.0
5.0
10.0
15.0
20.0
25.0
30.0
35.0
Reve
nu
e &
gra
nts
To
tal re
ven
ue
Ta
x r
eve
nu
e
Gra
nts
Bu
dg
eta
ry g
ran
ts
Cap
ita
l g
rants
To
tal exp
en
ditu
re &
net
len
din
g
Cu
rre
nt
exp
end
itu
re
Cap
ita
l e
xpe
nditu
re
Ove
rall
de
ficit (
*)
2010/11 2011/12 2012/13 2013/14 prov. 2014/15 proj.
-1.5
-5.3
-4.3
-3.1
-6.0
-5.0
-4.0
-3.0
-2.0
-1.0
0.0
2011/12 2012/13 2013/14 prov. 2014/15 proj.
Medium-term Fiscal Policy
• The fiscal consolidation policy over the medium-term aims at
reducing the fiscal deficit through;
– increasing financing via growth in domestic revenue and;
– public expenditure prioritization while providing adequate
resources to the productive and social sectors in line with the
objectives of EDPRS II.
• Total revenues are projected to increase from 16.9% of GDP in
2013/2014 to 17.2% in 2013/2014 and to 19.2% in 2016/17 driven
by:
– the improved performance of the Rwanda Revenue Authority
( Tax administration measures)
– increased direct taxes and tax on goods and services (robust
private sector activity)
• In the fiscal year 2013/2014:
– total revenue amounted to RwF 862.1 billion (exceeding the
RwF 736.4 billion in 2012/2013 by RwF 125.6 billion);
- this was enabled by the reasonable performance of the
economy and several ongoing reform measures implemented;
• Total grant receipts amounts to RwF 474.3 billion in the fiscal year
2013/2014 of which RwF171 billion as budgetary grants.
•Total expenditure is expected to reduce over the medium term as
a percentage of GDP.
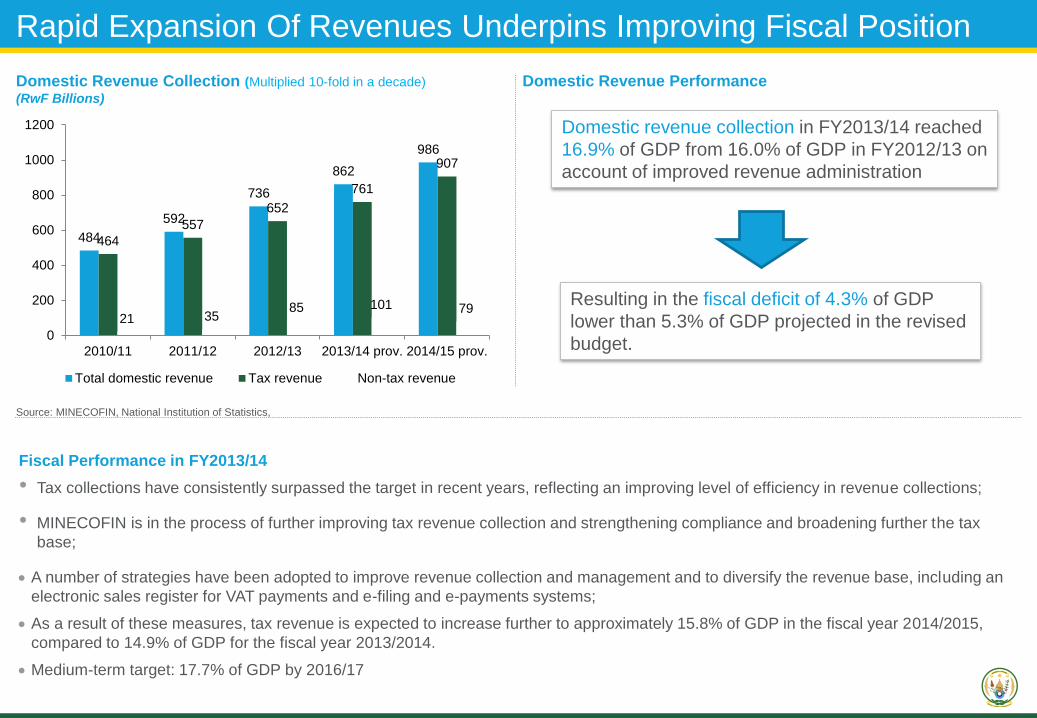
Rapid Expansion Of Revenues Underpins Improving Fiscal Position
Domestic Revenue Collection (Multiplied 10-fold in a decade)
(RwF Billions)
Domestic Revenue Performance
Source: MINECOFIN, National Institution of Statistics,
484
592
736
862
986
464
557
652
761
907
21 3585 101 79
0
200
400
600
800
1000
1200
2010/11 2011/12 2012/13 2013/14 prov. 2014/15 prov.
Total domestic revenue Tax revenue Non-tax revenue
Domestic revenue collection in FY2013/14 reached
16.9% of GDP from 16.0% of GDP in FY2012/13 on
account of improved revenue administration
Resulting in the fiscal deficit of 4.3% of GDP
lower than 5.3% of GDP projected in the revised
budget.
Fiscal Performance in FY2013/14
• Tax collections have consistently surpassed the target in recent years, reflecting an improving level of efficiency in revenue collections;
• MINECOFIN is in the process of further improving tax revenue collection and strengthening compliance and broadening further the tax
base;
A number of strategies have been adopted to improve revenue collection and management and to diversify the revenue base, including an
electronic sales register for VAT payments and e-filing and e-payments systems;
As a result of these measures, tax revenue is expected to increase further to approximately 15.8% of GDP in the fiscal year 2014/2015,
compared to 14.9% of GDP for the fiscal year 2013/2014.
Medium-term target: 17.7% of GDP by 2016/17
Stable Monetary Policy
• In June 2014, BNR adopted an accommodative monetary policy stance by cutting its policy rate to 6.5% from 7% amid a relatively stable
macroeconomic environment. Since then, the monetary policy stance has remained accommodative as most market interest rates have also
been trending downward.
Broad money supply recorded an annual increase of 27.5% by the end June 2014 against 9.2% recorded in June last year. This was mainly
attributable to :
Net Domestic Assets (NDA) of the banking system increased by 73.1% which in turn
offset the 1.4% decline in Net Foreign Assets.
Liquidity conditions have been improving in 2014. When comparing June 2013 to June 2014, the total most liquidity assets, such as
T-bills, repos, excess reserves and banks cash in vault, increased from US$ 361million to US$ 435 million. This was the result of
accommodative monetary policy and liquidity injection from fiscal operations, especially towards the end of fiscal year 2013/2014, with an
increase in Government net liquidity injection of Rwf 142.3 billion between December 2013 and June 2014.
There has been an increase of 7.3% in the outstanding credit to the private sector in 2014 compared to 5% recorded in the first half of 2013.
Over the last 8 years, the Rwandan franc has depreciated against major currencies:
– The Rwandan franc nominally depreciated by: 1.9% against the US dollar; 1.0% against the Euro; and 5.3% against the Pound Sterling
during the first half of 2014.
The NBR remains committed to keeping the exchange rate fundamentally market driven, depending on the demand and supply of
foreign exchange in the domestic market
The main objective in the medium term is to maintain low level of inflation (below 5%) whilst providing adequate credit to the private sector
to promote the required growth
With low inflationary pressures, accommodative monetary stance since 2013
Average RWF/US$ Exchange Rate
Source: MINECOFIN.Note: Annual Average Inflation.
Source: MINECOFIN.
Global food and fuel price
increase caused temporary
spike, now under control
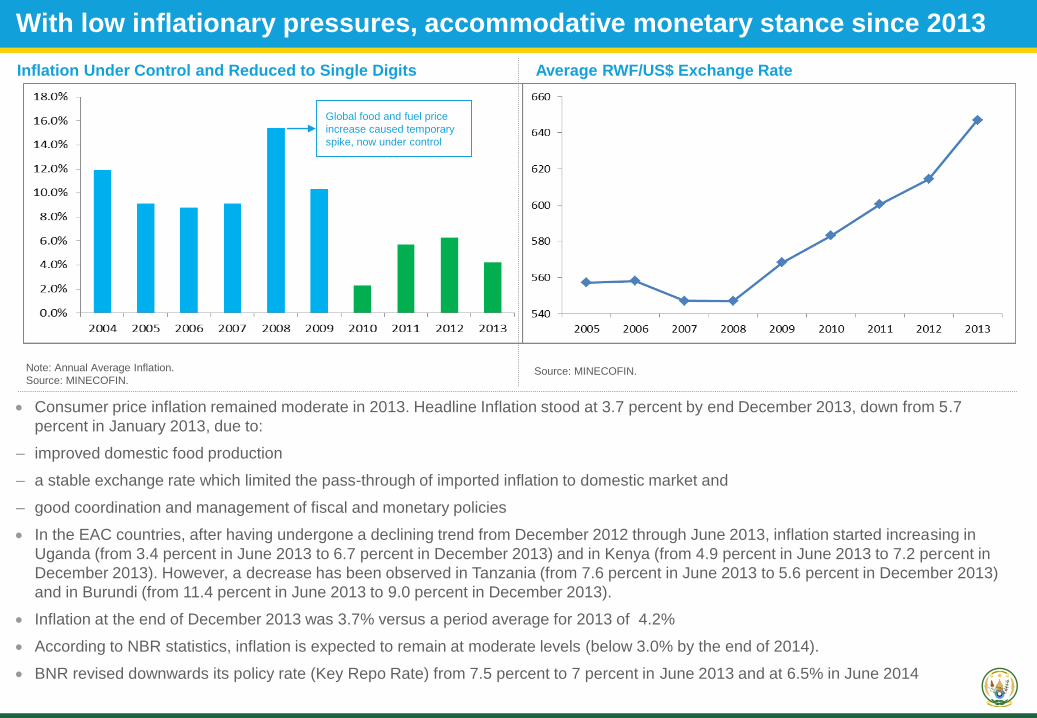
Consumer price inflation remained moderate in 2013. Headline Inflation stood at 3.7 percent by end December 2013, down from 5.7
percent in January 2013, due to:
– improved domestic food production
– a stable exchange rate which limited the pass-through of imported inflation to domestic market and
– good coordination and management of fiscal and monetary policies
In the EAC countries, after having undergone a declining trend from December 2012 through June 2013, inflation started increasing in
Uganda (from 3.4 percent in June 2013 to 6.7 percent in December 2013) and in Kenya (from 4.9 percent in June 2013 to 7.2 percent in
December 2013). However, a decrease has been observed in Tanzania (from 7.6 percent in June 2013 to 5.6 percent in December 2013)
and in Burundi (from 11.4 percent in June 2013 to 9.0 percent in December 2013).
Inflation at the end of December 2013 was 3.7% versus a period average for 2013 of 4.2%
According to NBR statistics, inflation is expected to remain at moderate levels (below 3.0% by the end of 2014).
BNR revised downwards its policy rate (Key Repo Rate) from 7.5 percent to 7 percent in June 2013 and at 6.5% in June 2014
Inflation Under Control and Reduced to Single Digits

Banking Sector Supports Economic Growth
Source: BNR
.
Banking Sector: key soundness indicators, in percent
The banking sector is continuing to grow and has been largely insulated from emerging market disorder in 2013
Key Players
The banking sector is comprised of:
– 10 commercial banks, 4 primary microfinance banks, 1
development bank, 1 cooperative bank (all supervised under the
Banking Law)
– 496 microfinance institutions
The three largest local banks are:
– Banque de Kigali
– Banque Populaire du Rwanda (65% cooperative members, 35%
Rabobank)
– I&M Bank ( with 80% shares of I&M and 20% GoR)
Ecobank and Access Bank are among the large international
banks with a presence in Rwanda
Banking Sector Overview
In terms of total assets, the sector recorded an amount of US$2.59
billion end June 2014 compared to US$2.15 billion end June 2013. This
was mainly attributed to an increase of 7.2 % in credit to the private
sector.
Significant progress has been made in improving the percentage of the
population included in the formal financial system
-The percentage of Rwandan adults who are formally served increased
from 21% in 2008 to 47% in June 2013 (Finscope report 2012)
19% sector growth rate in the past two years has been driven by
–GoR enforcement of international banking standards
–Implementation of the “Financial Sector Development Program”
(increased the minimum capital requirement to Rwf 5 billion,
approximately US$ 8 million).
Policy, strategy and incentives in place to develop capital markets
Indicator 2013 2014
June September December March June
Solvency ratio (total capital) 23.1 22.9 23.1 22.6 23.6
NPLs / Gross Loans 6.9 7.2 6.9 6.7 6.6
NPLS net/Gross loans 3.2 6.5 6 5.7 5.5
Provisions / NPLs 54.8 50.3 53.3 56.4 50
Earning Assets / Total Assets 80.8 79.1 78.6 82.1 80.7
Large Exposures / Gross Loans 8 9.9 11.6 15.1 15.9
Return on Average Assets 2.1 1.7 1.5 2.3 2.1
Return on Average Equity 9.9 8.3 7.4 11.9 12.2
Cost of deposits 3.5 3.8 3.8 4.1 3.3
Liquid assets/total deposits 46.2 48.8 49.4 46.3 51.4
FOREX exposure/core capital -3.1 -3 -2.2 -12.6 -1.7
3. Debt Management and Funding
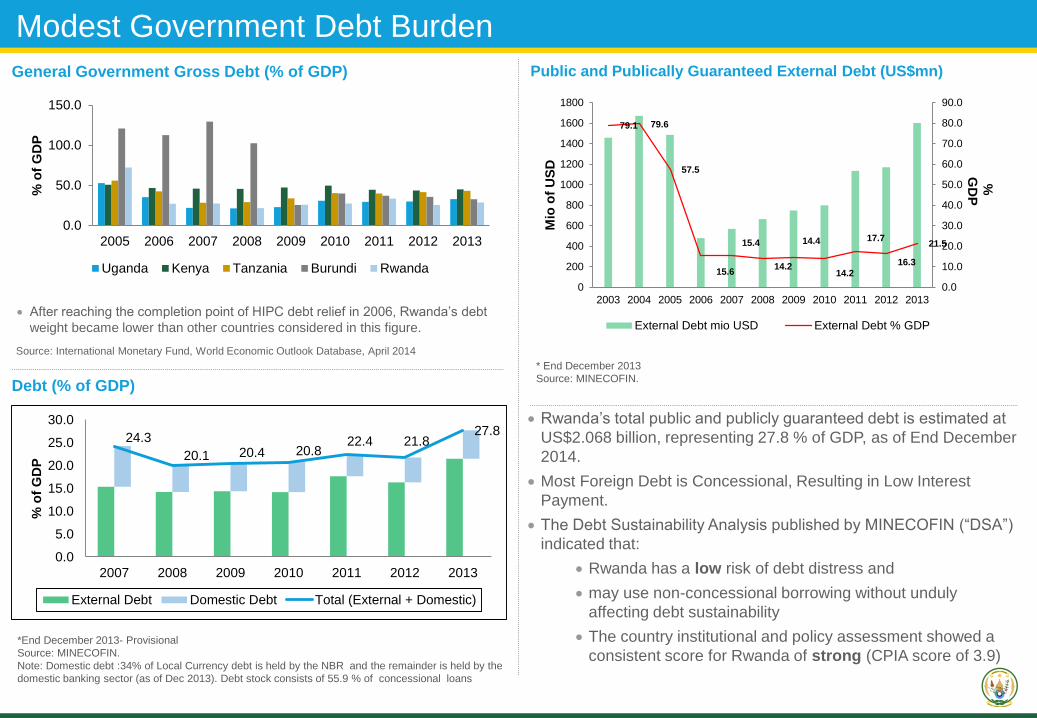
Modest Government Debt Burden
General Government Gross Debt (% of GDP)
After reaching the completion point of HIPC debt relief in 2006, Rwanda’s debt
weight became lower than other countries considered in this figure.
Source: International Monetary Fund, World Economic Outlook Database, April 2014
Debt (% of GDP)
*End December 2013- Provisional
Source: MINECOFIN.
Note: Domestic debt :34% of Local Currency debt is held by the NBR and the remainder is held by the
domestic banking sector (as of Dec 2013). Debt stock consists of 55.9 % of concessional loans
Public and Publically Guaranteed External Debt (US$mn)
Rwanda’s total public and publicly guaranteed debt is estimated at
US$2.068 billion, representing 27.8 % of GDP, as of End December
2014.
Most Foreign Debt is Concessional, Resulting in Low Interest
Payment.
The Debt Sustainability Analysis published by MINECOFIN (“DSA”)
indicated that:
Rwanda has a low risk of debt distress and
may use non-concessional borrowing without unduly
affecting debt sustainability
The country institutional and policy assessment showed a
consistent score for Rwanda of strong (CPIA score of 3.9)
* End December 2013
Source: MINECOFIN.
0.0
50.0
100.0
150.0
2005 2006 2007 2008 2009 2010 2011 2012 2013
% o
f G
DP
Uganda Kenya Tanzania Burundi Rwanda
24.3
20.1 20.4 20.822.4 21.8
27.8
0.0
5.0
10.0
15.0
20.0
25.0
30.0
2007 2008 2009 2010 2011 2012 2013
% o
f G
DP
External Debt Domestic Debt Total (External + Domestic)
79.1 79.6
57.5
15.6
15.4
14.2
14.4
14.2
17.7
16.3
21.5
0.0
10.0
20.0
30.0
40.0
50.0
60.0
70.0
80.0
90.0
0
200
400
600
800
1000
1200
1400
1600
1800
2003 2004 2005 2006 2007 2008 2009 2010 2011 2012 2013
Mio
of
US
D
%G
DP
External Debt mio USD External Debt % GDP
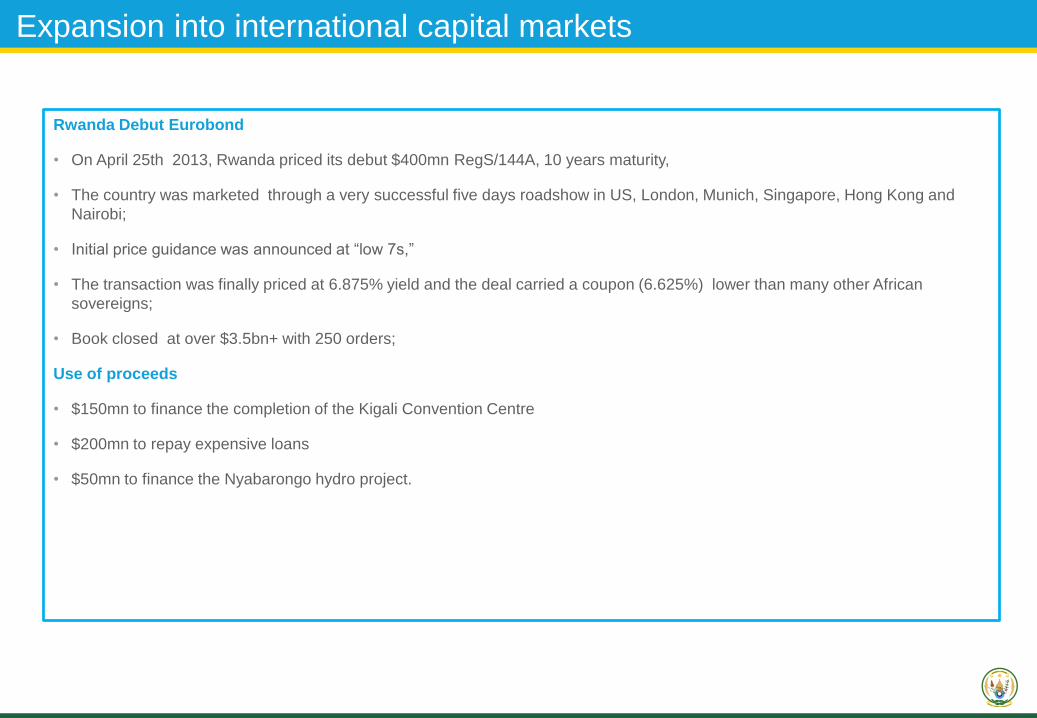
Rwanda Debut Eurobond
• On April 25th 2013, Rwanda priced its debut $400mn RegS/144A, 10 years maturity,
• The country was marketed through a very successful five days roadshow in US, London, Munich, Singapore, Hong Kong and
Nairobi;
• Initial price guidance was announced at “low 7s,”
• The transaction was finally priced at 6.875% yield and the deal carried a coupon (6.625%) lower than many other African
sovereigns;
• Book closed at over $3.5bn+ with 250 orders;
Use of proceeds
• $150mn to finance the completion of the Kigali Convention Centre
• $200mn to repay expensive loans
• $50mn to finance the Nyabarongo hydro project.
Expansion into international capital markets
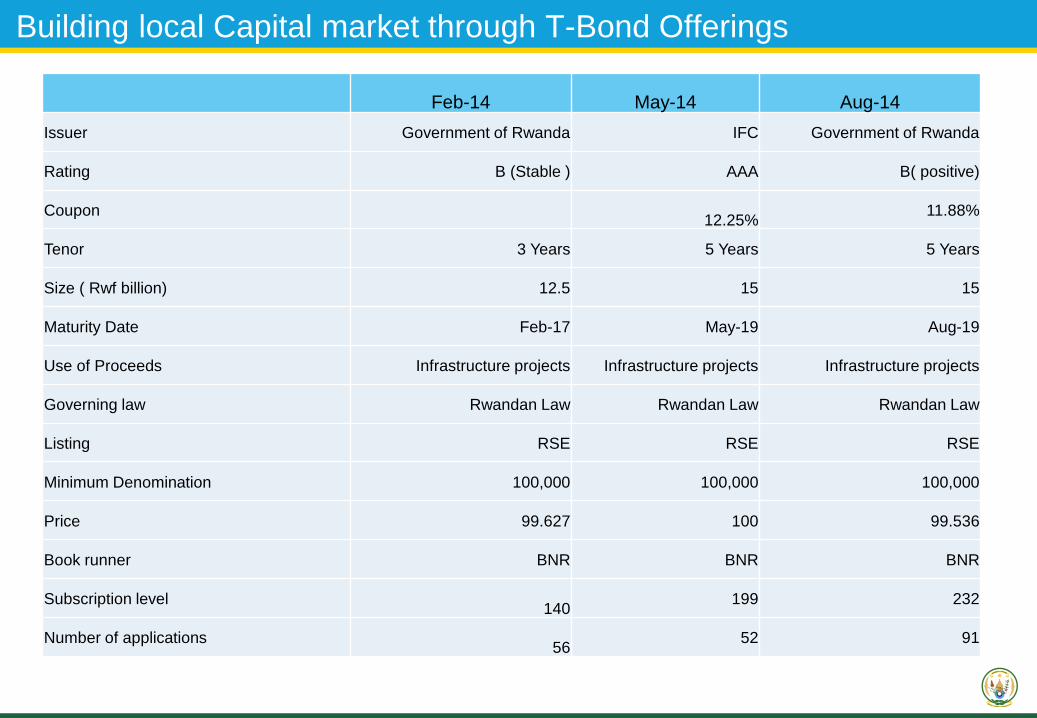
Building local Capital market through T-Bond Offerings
Feb-14 May-14 Aug-14
Issuer Government of Rwanda IFC Government of Rwanda
Rating B (Stable ) AAA B( positive)
Coupon12.25%
11.88%
Tenor 3 Years 5 Years 5 Years
Size ( Rwf billion) 12.5 15 15
Maturity Date Feb-17 May-19 Aug-19
Use of Proceeds Infrastructure projects Infrastructure projects Infrastructure projects
Governing law Rwandan Law Rwandan Law Rwandan Law
Listing RSE RSE RSE
Minimum Denomination 100,000 100,000 100,000
Price 99.627 100 99.536
Book runner BNR BNR BNR
Subscription level140
199 232
Number of applications56
52 91

4. Business Environment
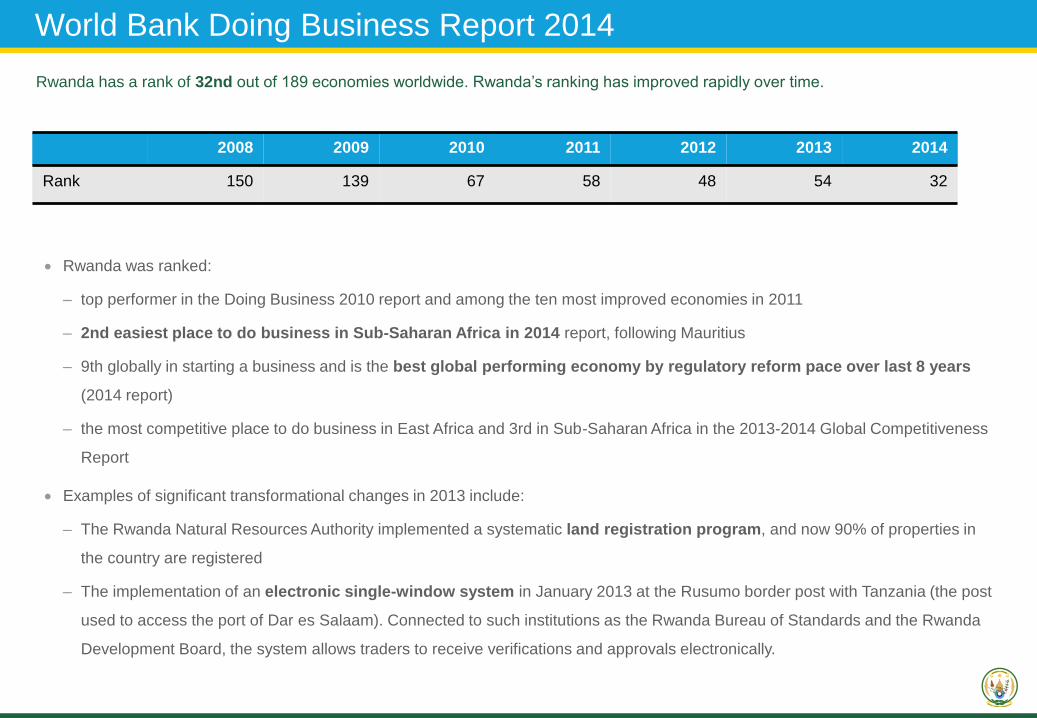
Rwanda has a rank of 32nd out of 189 economies worldwide. Rwanda’s ranking has improved rapidly over time.
2008 2009 2010 2011 2012 2013 2014
Rank 150 139 67 58 48 54 32
Rwanda was ranked:
– top performer in the Doing Business 2010 report and among the ten most improved economies in 2011
– 2nd easiest place to do business in Sub-Saharan Africa in 2014 report, following Mauritius
– 9th globally in starting a business and is the best global performing economy by regulatory reform pace over last 8 years
(2014 report)
– the most competitive place to do business in East Africa and 3rd in Sub-Saharan Africa in the 2013-2014 Global Competitiveness
Report
Examples of significant transformational changes in 2013 include:
– The Rwanda Natural Resources Authority implemented a systematic land registration program, and now 90% of properties in
the country are registered
– The implementation of an electronic single-window system in January 2013 at the Rusumo border post with Tanzania (the post
used to access the port of Dar es Salaam). Connected to such institutions as the Rwanda Bureau of Standards and the Rwanda
Development Board, the system allows traders to receive verifications and approvals electronically.
World Bank Doing Business Report 2014

Rwanda ranks amongst the top 40 economies in Doing Business
1. Singapore
2. Hong Kong SAR, China
3. New Zealand
4. United States
5. Denmark
6. Malaysia
7. Korea, Rep.
8. Georgia
9. Norway
10. United Kingdom
11. Australia
12. Finland
13. Iceland
14. Sweden
15. Ireland
16. Taiwan, China
17. Lithuania
18. Thailand
19. Canada
20. Mauritius
21. Germany
22. Estonia
23. United Arab Emirates
24. Latvia
25. Macedonia, FYR
26. Saudi Arabia
27. Japan
28. Netherlands
29. Switzerland
30. Austria
31. Portugal
32. Rwanda
In Africa, only
Mauritius ranks
better. In 2014 DB
report Rwanda has
overtaken South
Africa

5.The Road to Middle Income Status
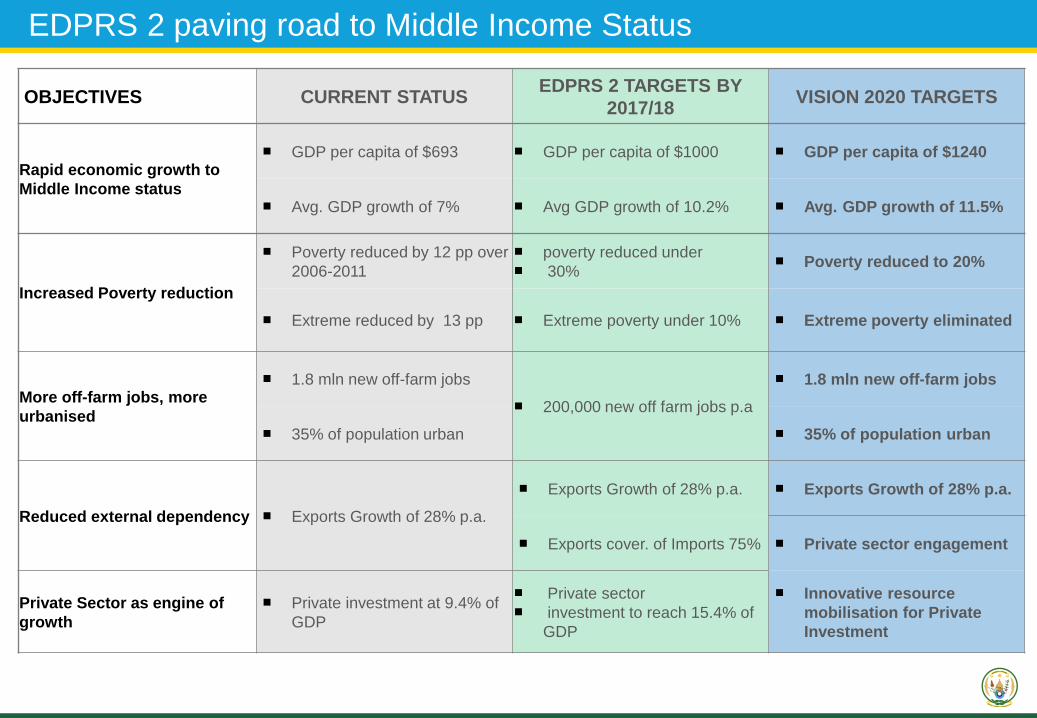
OBJECTIVES CURRENT STATUSEDPRS 2 TARGETS BY
2017/18VISION 2020 TARGETS
Rapid economic growth to
Middle Income status
GDP per capita of $693 GDP per capita of $1000 GDP per capita of $1240
Avg. GDP growth of 7% Avg GDP growth of 10.2% Avg. GDP growth of 11.5%
Increased Poverty reduction
Poverty reduced by 12 pp over
2006-2011 poverty reduced under
30% Poverty reduced to 20%
Extreme reduced by 13 pp Extreme poverty under 10% Extreme poverty eliminated
More off-farm jobs, more
urbanised
1.8 mln new off-farm jobs
200,000 new off farm jobs p.a
1.8 mln new off-farm jobs
35% of population urban 35% of population urban
Reduced external dependency Exports Growth of 28% p.a.
Exports Growth of 28% p.a. Exports Growth of 28% p.a.
Exports cover. of Imports 75% Private sector engagement
Private Sector as engine of
growth Private investment at 9.4% of
GDP
Private sector
investment to reach 15.4% of
GDP
Innovative resource
mobilisation for Private
Investment
EDPRS 2 paving road to Middle Income Status
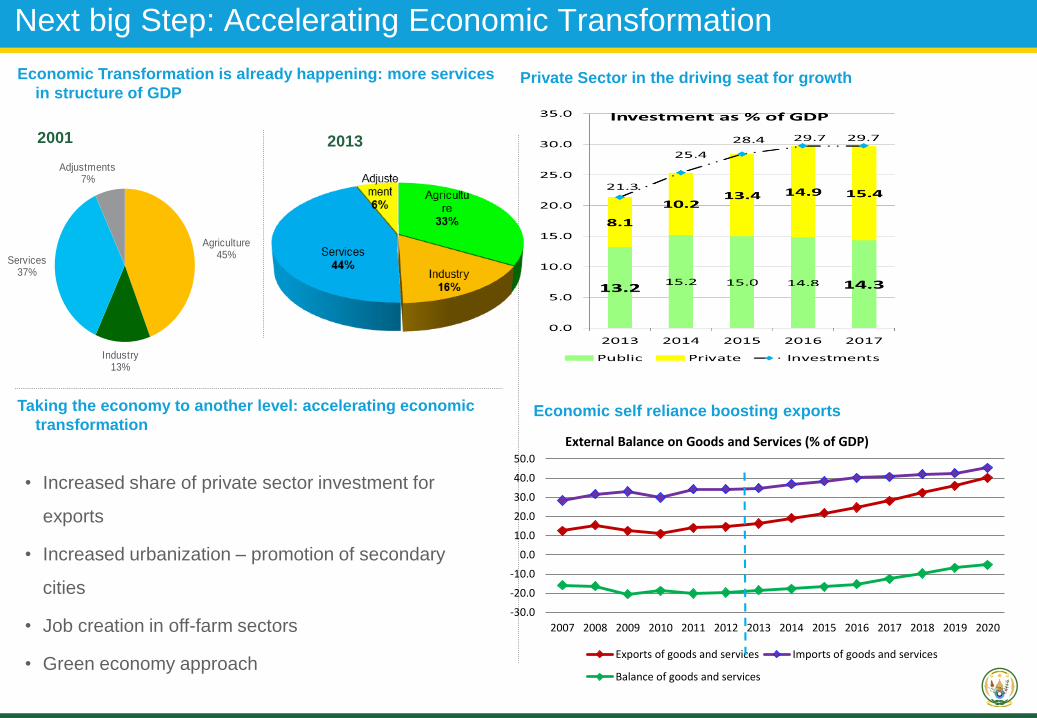
Next big Step: Accelerating Economic Transformation
• Increased share of private sector investment for
exports
• Increased urbanization – promotion of secondary
cities
• Job creation in off-farm sectors
• Green economy approach
2001 2013
Agriculture45%
Industry13%
Services37%
Adjustments7%
Economic Transformation is already happening: more services
in structure of GDPPrivate Sector in the driving seat for growth
-30.0
-20.0
-10.0
0.0
10.0
20.0
30.0
40.0
50.0
2007 2008 2009 2010 2011 2012 2013 2014 2015 2016 2017 2018 2019 2020
External Balance on Goods and Services (% of GDP)
Exports of goods and services Imports of goods and services
Balance of goods and services
Economic self reliance boosting exportsTaking the economy to another level: accelerating economic
transformation