Republic of Namibia - Konrad-Adenauer-Stiftung · Cf. Graham HOPWOOD, Guide to Namibian Politics,...
20
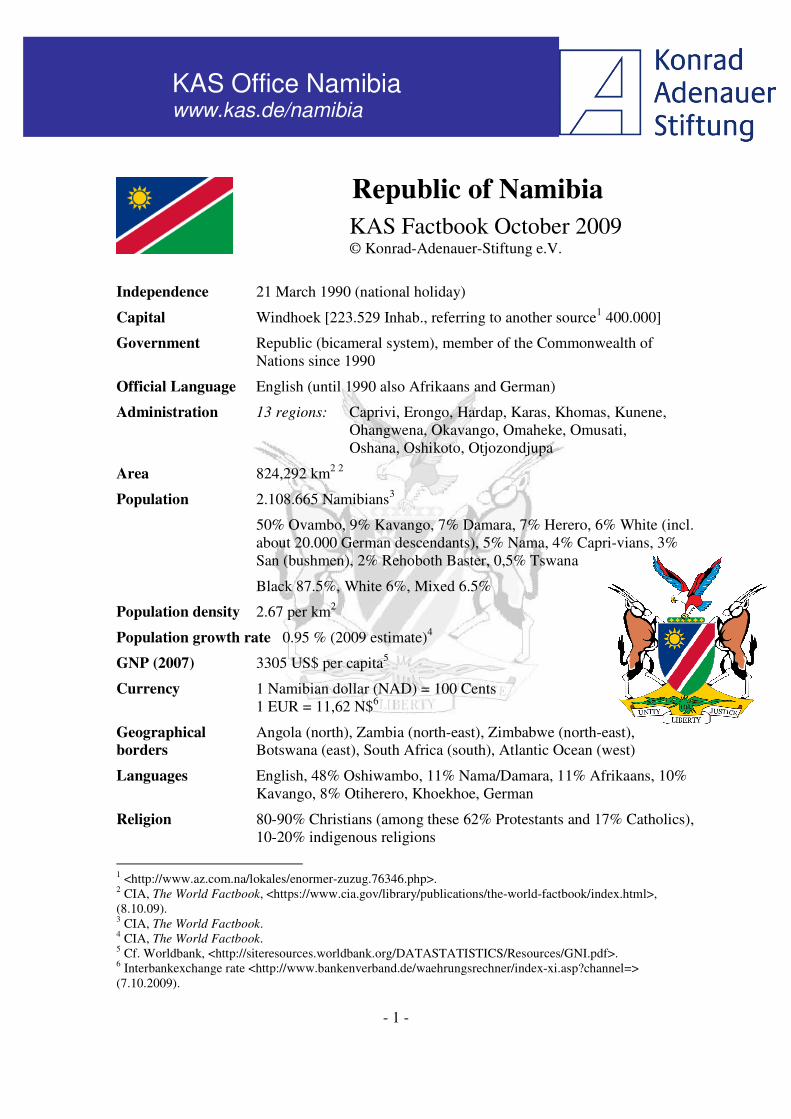
- 1 - Republic of Namibia KAS Factbook October 2009 © Konrad-Adenauer-Stiftung e.V. Independence 21 March 1990 (national holiday) Capital Windhoek [223.529 Inhab., referring to another source 1 400.000] Government Republic (bicameral system), member of the Commonwealth of Nations since 1990 Official Language English (until 1990 also Afrikaans and German) Administration 13 regions: Caprivi, Erongo, Hardap, Karas, Khomas, Kunene, Ohangwena, Okavango, Omaheke, Omusati, Oshana, Oshikoto, Otjozondjupa Area 824,292 km 2 2 Population 2.108.665 Namibians 3 50% Ovambo, 9% Kavango, 7% Damara, 7% Herero, 6% White (incl. about 20.000 German descendants), 5% Nama, 4% Capri-vians, 3% San (bushmen), 2% Rehoboth Baster, 0,5% Tswana Black 87.5%, White 6%, Mixed 6.5% Population density 2.67 per km 2 Population growth rate 0.95 % (2009 estimate) 4 GNP (2007) 3305 US$ per capita 5 Currency 1 Namibian dollar (NAD) = 100 Cents 1 EUR = 11,62 N$ 6 Geographical Angola (north), Zambia (north-east), Zimbabwe (north-east), borders Botswana (east), South Africa (south), Atlantic Ocean (west) Languages English, 48% Oshiwambo, 11% Nama/Damara, 11% Afrikaans, 10% Kavango, 8% Otiherero, Khoekhoe, German Religion 80-90% Christians (among these 62% Protestants and 17% Catholics), 10-20% indigenous religions 1 <http://www.az.com.na/lokales/enormer-zuzug.76346.php>. 2 CIA, The World Factbook, <https://www.cia.gov/library/publications/the-world-factbook/index.html>, (8.10.09). 3 CIA, The World Factbook. 4 CIA, The World Factbook. 5 Cf. Worldbank, <http://siteresources.worldbank.org/DATASTATISTICS/Resources/GNI.pdf>. 6 Interbankexchange rate <http://www.bankenverband.de/waehrungsrechner/index-xi.asp?channel=> (7.10.2009). KAS Office Namibia www.kas.de/namibia
Transcript of Republic of Namibia - Konrad-Adenauer-Stiftung · Cf. Graham HOPWOOD, Guide to Namibian Politics,...
- 1 -
Republic of Namibia
KAS Factbook October 2009 © Konrad-Adenauer-Stiftung e.V.
Independence 21 March 1990 (national holiday)
Capital Windhoek [223.529 Inhab., referring to another source1 400.000]
Government Republic (bicameral system), member of the Commonwealth of Nations since 1990
Official Language English (until 1990 also Afrikaans and German)
Administration 13 regions: Caprivi, Erongo, Hardap, Karas, Khomas, Kunene, Ohangwena, Okavango, Omaheke, Omusati, Oshana, Oshikoto, Otjozondjupa
Area 824,292 km2 2
Population 2.108.665 Namibians3
50% Ovambo, 9% Kavango, 7% Damara, 7% Herero, 6% White (incl. about 20.000 German descendants), 5% Nama, 4% Capri-vians, 3% San (bushmen), 2% Rehoboth Baster, 0,5% Tswana
Black 87.5%, White 6%, Mixed 6.5%
Population density 2.67 per km2
Population growth rate 0.95 % (2009 estimate)4
GNP (2007) 3305 US$ per capita5
Currency 1 Namibian dollar (NAD) = 100 Cents 1 EUR = 11,62 N$6
Geographical Angola (north), Zambia (north-east), Zimbabwe (north-east), borders Botswana (east), South Africa (south), Atlantic Ocean (west)
Languages English, 48% Oshiwambo, 11% Nama/Damara, 11% Afrikaans, 10% Kavango, 8% Otiherero, Khoekhoe, German
Religion 80-90% Christians (among these 62% Protestants and 17% Catholics), 10-20% indigenous religions
1 <http://www.az.com.na/lokales/enormer-zuzug.76346.php>. 2 CIA, The World Factbook, <https://www.cia.gov/library/publications/the-world-factbook/index.html>, (8.10.09). 3 CIA, The World Factbook. 4 CIA, The World Factbook. 5 Cf. Worldbank, <http://siteresources.worldbank.org/DATASTATISTICS/Resources/GNI.pdf>. 6 Interbankexchange rate <http://www.bankenverband.de/waehrungsrechner/index-xi.asp?channel=> (7.10.2009).
KAS Office Namibia www.kas.de/namibia
www.kas.de/namibia
- 2 -
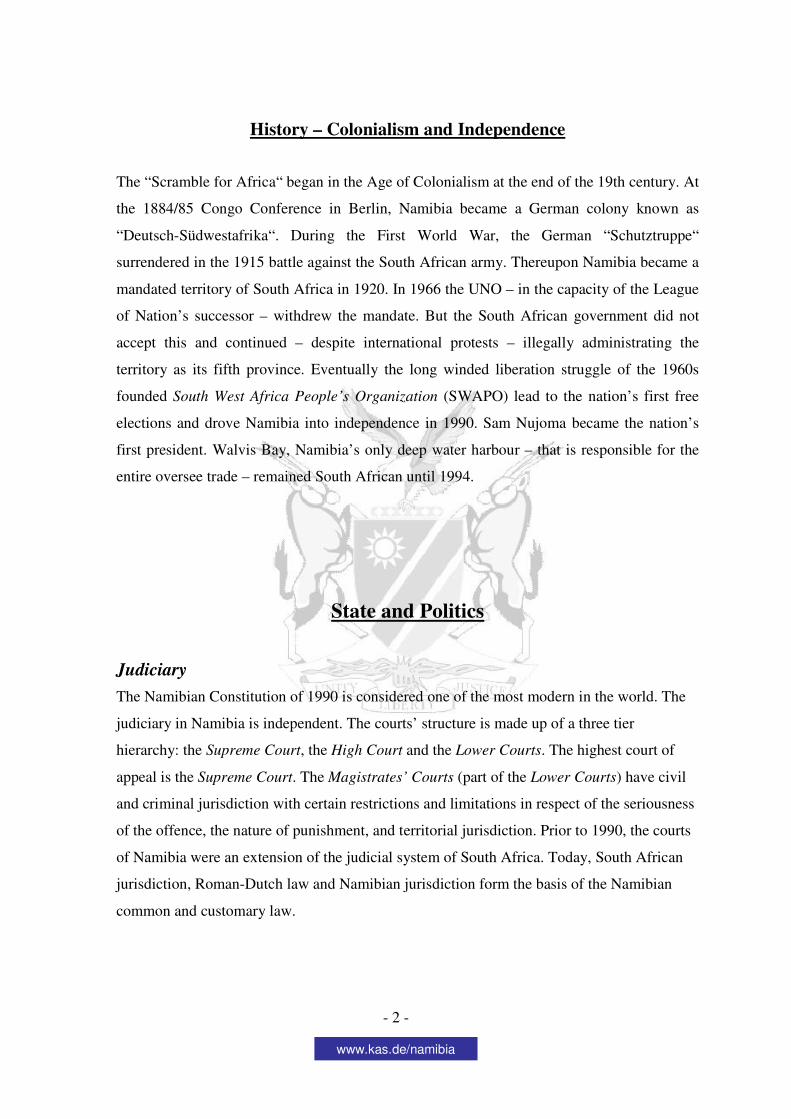
History – Colonialism and Independence
The “Scramble for Africa“ began in the Age of Colonialism at the end of the 19th century. At
the 1884/85 Congo Conference in Berlin, Namibia became a German colony known as
“Deutsch-Südwestafrika“. During the First World War, the German “Schutztruppe“
surrendered in the 1915 battle against the South African army. Thereupon Namibia became a
mandated territory of South Africa in 1920. In 1966 the UNO – in the capacity of the League
of Nation’s successor – withdrew the mandate. But the South African government did not
accept this and continued – despite international protests – illegally administrating the
territory as its fifth province. Eventually the long winded liberation struggle of the 1960s
founded South West Africa People’s Organization (SWAPO) lead to the nation’s first free
elections and drove Namibia into independence in 1990. Sam Nujoma became the nation’s
first president. Walvis Bay, Namibia’s only deep water harbour – that is responsible for the
entire oversee trade – remained South African until 1994.
State and Politics
Judiciary
The Namibian Constitution of 1990 is considered one of the most modern in the world. The
judiciary in Namibia is independent. The courts’ structure is made up of a three tier
hierarchy: the Supreme Court, the High Court and the Lower Courts. The highest court of
appeal is the Supreme Court. The Magistrates’ Courts (part of the Lower Courts) have civil
and criminal jurisdiction with certain restrictions and limitations in respect of the seriousness
of the offence, the nature of punishment, and territorial jurisdiction. Prior to 1990, the courts
of Namibia were an extension of the judicial system of South Africa. Today, South African
jurisdiction, Roman-Dutch law and Namibian jurisdiction form the basis of the Namibian
common and customary law.
www.kas.de/namibia
- 3 -
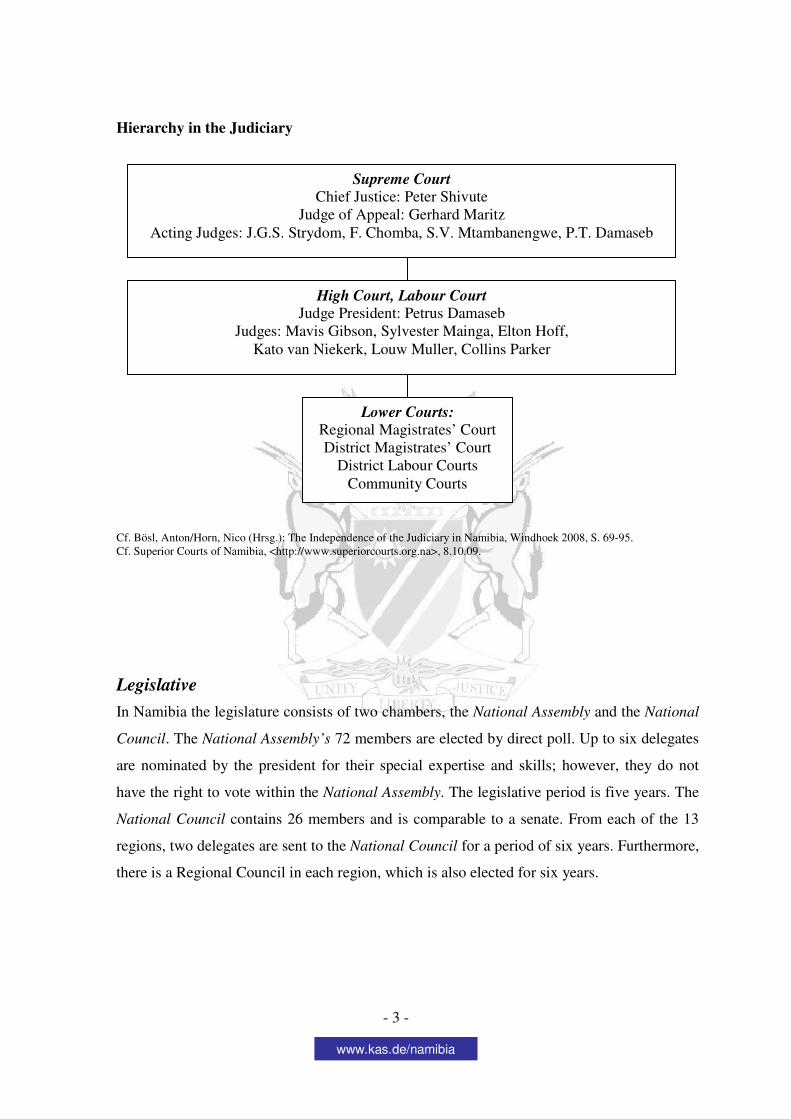
Hierarchy in the Judiciary
Cf. Bösl, Anton/Horn, Nico (Hrsg.): The Independence of the Judiciary in Namibia, Windhoek 2008, S. 69-95. Cf. Superior Courts of Namibia, <http://www.superiorcourts.org.na>, 8.10.09.
Legislative
In Namibia the legislature consists of two chambers, the National Assembly and the National
Council. The National Assembly’s 72 members are elected by direct poll. Up to six delegates
are nominated by the president for their special expertise and skills; however, they do not
have the right to vote within the National Assembly. The legislative period is five years. The
National Council contains 26 members and is comparable to a senate. From each of the 13
regions, two delegates are sent to the National Council for a period of six years. Furthermore,
there is a Regional Council in each region, which is also elected for six years.
Supreme Court
Chief Justice: Peter Shivute Judge of Appeal: Gerhard Maritz
Acting Judges: J.G.S. Strydom, F. Chomba, S.V. Mtambanengwe, P.T. Damaseb
High Court, Labour Court
Judge President: Petrus Damaseb Judges: Mavis Gibson, Sylvester Mainga, Elton Hoff,
Kato van Niekerk, Louw Muller, Collins Parker
Lower Courts:
Regional Magistrates’ Court District Magistrates’ Court
District Labour Courts Community Courts
www.kas.de/namibia
- 4 -
1990
4121
43 111
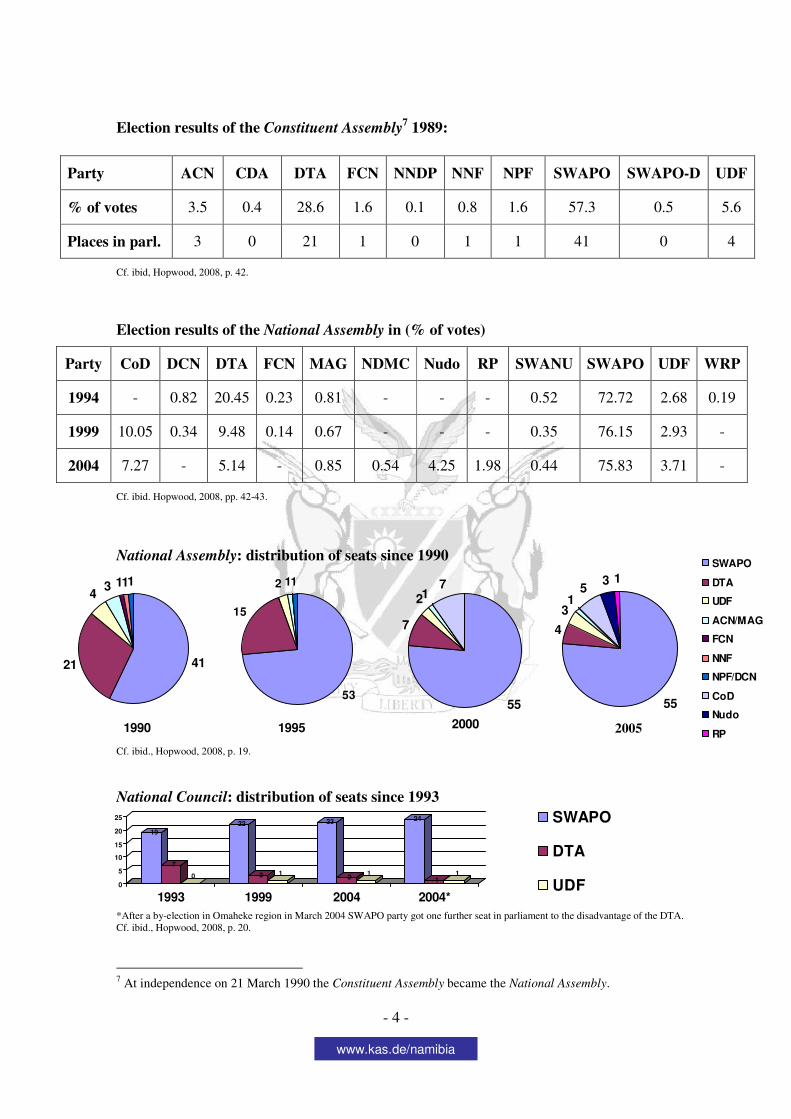
Election results of the Constituent Assembly7 1989:
Cf. ibid, Hopwood, 2008, p. 42.
Election results of the National Assembly in (% of votes)
Party CoD DCN DTA FCN MAG NDMC Nudo RP SWANU SWAPO UDF WRP
1994 - 0.82 20.45 0.23 0.81 - - - 0.52 72.72 2.68 0.19
1999 10.05 0.34 9.48 0.14 0.67 - - - 0.35 76.15 2.93 -
2004 7.27 - 5.14 - 0.85 0.54 4.25 1.98 0.44 75.83 3.71 -
Cf. ibid. Hopwood, 2008, pp. 42-43.
National Assembly: distribution of seats since 1990
Cf. ibid., Hopwood, 2008, p. 19.
National Council: distribution of seats since 1993
*After a by-election in Omaheke region in March 2004 SWAPO party got one further seat in parliament to the disadvantage of the DTA. Cf. ibid., Hopwood, 2008, p. 20.
7 At independence on 21 March 1990 the Constituent Assembly became the National Assembly.
Party ACN CDA DTA FCN NNDP NNF NPF SWAPO SWAPO-D UDF
% of votes 3.5 0.4 28.6 1.6 0.1 0.8 1.6 57.3 0.5 5.6
Places in parl. 3 0 21 1 0 1 1 41 0 4
1995
53
15
2 11
2000
55
7
217
2005
55
4
31
53 1
SWAPO
DTA
UDF
ACN/MAG
FCN
NNF
NPF/DCN
CoD
Nudo
RP
19
7
0
22
3 1
23
21
24
11
0
5
10
15
20
25
1993 1999 2004 2004*
SWAPO
DTA
UDF
www.kas.de/namibia
- 5 -
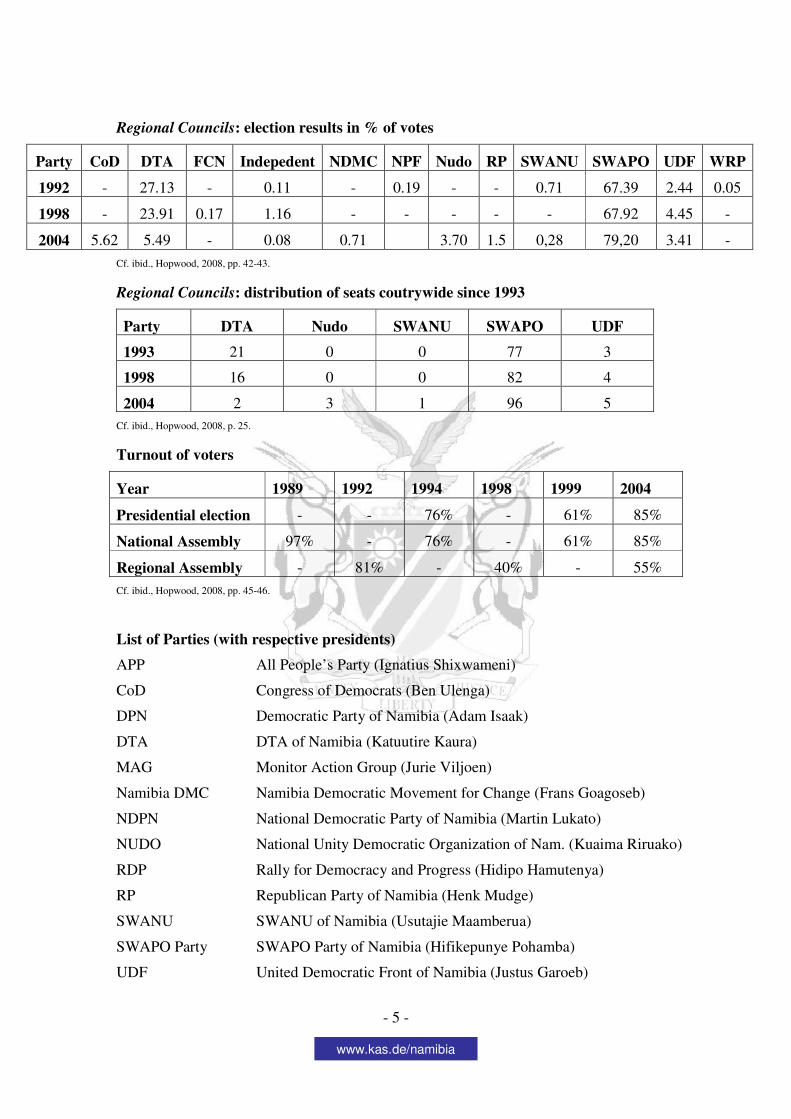
Regional Councils: election results in % of votes
Party CoD DTA FCN Indepedent NDMC NPF Nudo RP SWANU SWAPO UDF WRP
1992 - 27.13 - 0.11 - 0.19 - - 0.71 67.39 2.44 0.05
1998 - 23.91 0.17 1.16 - - - - - 67.92 4.45 -
2004 5.62 5.49 - 0.08 0.71 3.70 1.5 0,28 79,20 3.41 -
Cf. ibid., Hopwood, 2008, pp. 42-43.
Regional Councils: distribution of seats coutrywide since 1993
Party DTA Nudo SWANU SWAPO UDF
1993 21 0 0 77 3
1998 16 0 0 82 4
2004 2 3 1 96 5
Cf. ibid., Hopwood, 2008, p. 25.
Turnout of voters
Year 1989 1992 1994 1998 1999 2004
Presidential election - - 76% - 61% 85%
National Assembly 97% - 76% - 61% 85%
Regional Assembly - 81% - 40% - 55%
Cf. ibid., Hopwood, 2008, pp. 45-46.
List of Parties (with respective presidents)
APP All People’s Party (Ignatius Shixwameni)
CoD Congress of Democrats (Ben Ulenga)
DPN Democratic Party of Namibia (Adam Isaak)
DTA DTA of Namibia (Katuutire Kaura)
MAG Monitor Action Group (Jurie Viljoen)
Namibia DMC Namibia Democratic Movement for Change (Frans Goagoseb)
NDPN National Democratic Party of Namibia (Martin Lukato)
NUDO National Unity Democratic Organization of Nam. (Kuaima Riruako)
RDP Rally for Democracy and Progress (Hidipo Hamutenya)
RP Republican Party of Namibia (Henk Mudge)
SWANU SWANU of Namibia (Usutajie Maamberua)
SWAPO Party SWAPO Party of Namibia (Hifikepunye Pohamba)
UDF United Democratic Front of Namibia (Justus Garoeb)
www.kas.de/namibia
- 6 -
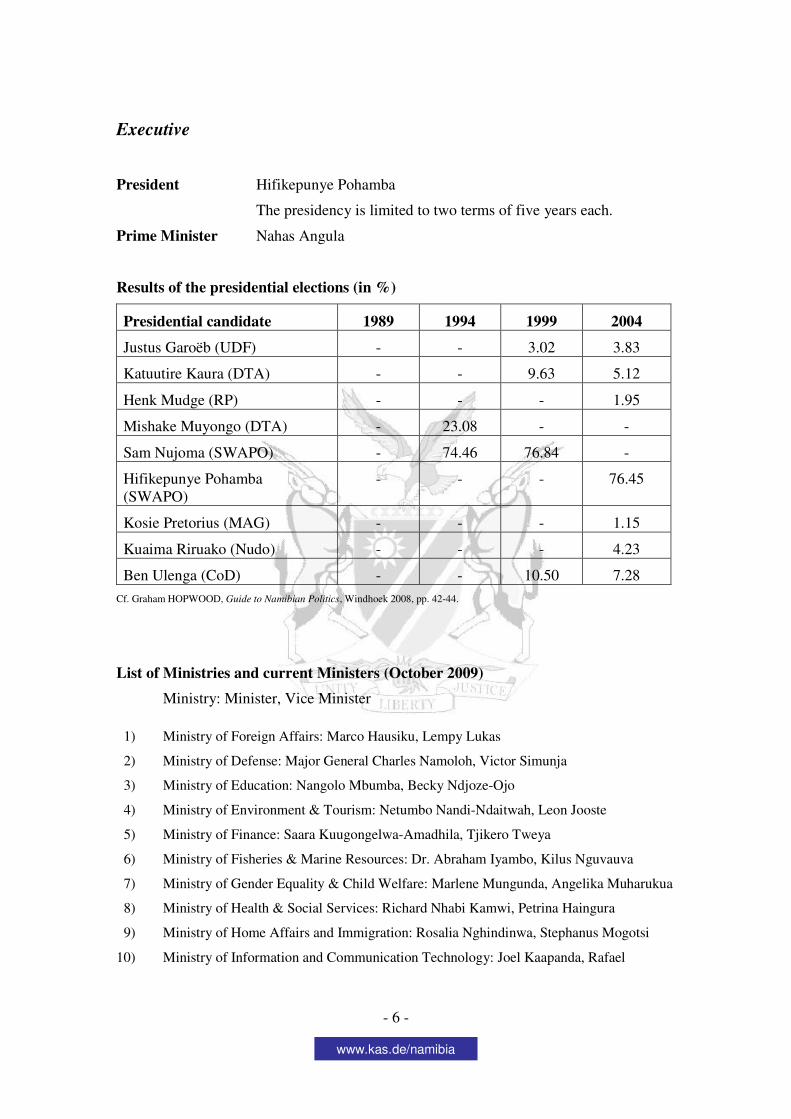
Executive
President Hifikepunye Pohamba
The presidency is limited to two terms of five years each.
Prime Minister Nahas Angula
Results of the presidential elections (in %)
Presidential candidate 1989 1994 1999 2004
Justus Garoëb (UDF) - - 3.02 3.83
Katuutire Kaura (DTA) - - 9.63 5.12
Henk Mudge (RP) - - - 1.95
Mishake Muyongo (DTA) - 23.08 - -
Sam Nujoma (SWAPO) - 74.46 76.84 -
Hifikepunye Pohamba (SWAPO)
- - - 76.45
Kosie Pretorius (MAG) - - - 1.15
Kuaima Riruako (Nudo) - - - 4.23
Ben Ulenga (CoD) - - 10.50 7.28
Cf. Graham HOPWOOD, Guide to Namibian Politics, Windhoek 2008, pp. 42-44.
List of Ministries and current Ministers (October 2009)
Ministry: Minister, Vice Minister
1) Ministry of Foreign Affairs: Marco Hausiku, Lempy Lukas
2) Ministry of Defense: Major General Charles Namoloh, Victor Simunja
3) Ministry of Education: Nangolo Mbumba, Becky Ndjoze-Ojo
4) Ministry of Environment & Tourism: Netumbo Nandi-Ndaitwah, Leon Jooste
5) Ministry of Finance: Saara Kuugongelwa-Amadhila, Tjikero Tweya
6) Ministry of Fisheries & Marine Resources: Dr. Abraham Iyambo, Kilus Nguvauva
7) Ministry of Gender Equality & Child Welfare: Marlene Mungunda, Angelika Muharukua
8) Ministry of Health & Social Services: Richard Nhabi Kamwi, Petrina Haingura
9) Ministry of Home Affairs and Immigration: Rosalia Nghindinwa, Stephanus Mogotsi
10) Ministry of Information and Communication Technology: Joel Kaapanda, Rafael
www.kas.de/namibia
- 7 -
Dinyado
11) Ministry of Justice & Attorney General: Pendukeni Iivula-Ithana, Utoni Nujoma
12) Minstry of Labour & Social Welfare: Immanuel Ngatjizeko, Petrus Iilonga
13) Ministry of Lands & Resttlement: Alpheus !Naruseb, Enock Ya Kasita
14) Ministry of Mines & Energy: Erkki Nghimtina, Bernard Esau
15) Ministry of Regional & Local Government & Housing & Rural Development: Jerry
Ekandjo, Kazenambo Kazenambo
16) Ministry of Safety & Security: Dr. Nickey Iyambo, Gabes Shihepo
17) Ministry of Trade & Industry: Dr. Hage Geingob, Teopolina Mushelenga
18) Ministry of Works and Transport: Helmut Angula, Paul Smit
19) Ministry of Youth, National Service, Sport & Culture: Willem Kondjore, Pohamba
Shifeta
20) Ministry of Presidential Affairs: Albert Kawana
21) Ministry of Veteran Affairs: Ngarikutuke Tjiriange
Equated to ministries are:
The National Planning Commission: Director General Prof. Peter Katjavivi
The Namibia Central Intelligence Service: Ben Likando
www.kas.de/namibia
- 8 -
Economy
Nineteen years after independence, Namibia still remains dependent on its most important
economic partner, the Republic of South Africa. About half of the population lives on
subsistence farming, but this sector only forms about one tenth of the GDP. Mining and
processing of minerals is another important industry, but it only employs 3 percent of the
population. Meanwhile, Namibia is the fifth largest producer of uranium in the world.
Despite the comparably high income per capita for this region, the wealth distribution is
extremely uneven in Namibia.
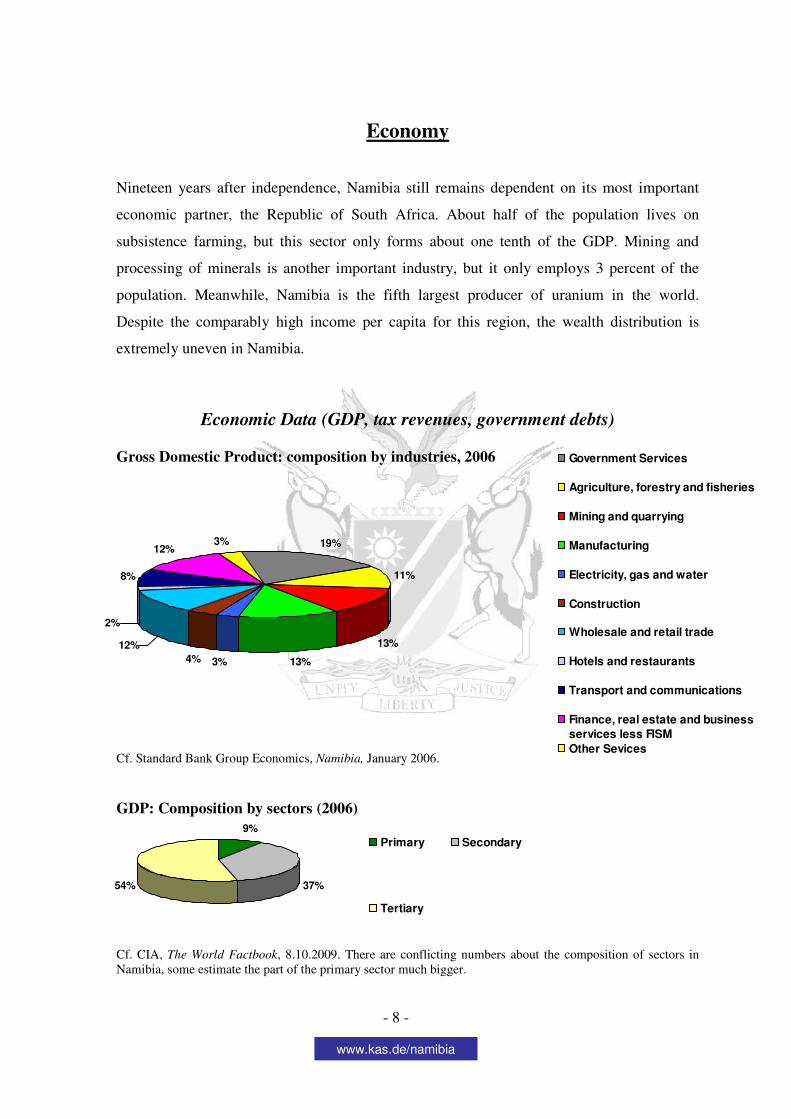
Economic Data (GDP, tax revenues, government debts)
Gross Domestic Product: composition by industries, 2006
Cf. Standard Bank Group Economics, Namibia, January 2006.
GDP: Composition by sectors (2006)
Cf. CIA, The World Factbook, 8.10.2009. There are conflicting numbers about the composition of sectors in Namibia, some estimate the part of the primary sector much bigger.
9%
37%54%
Primary Secondary
Tertiary
19%
11%
13%
13%3%4%
12%
2%
8%
12%3%
Government Services
Agriculture, forestry and fisheries
Mining and quarrying
Manufacturing
Electricity, gas and water
Construction
Wholesale and retail trade
Hotels and restaurants
Transport and communications
Finance, real estate and business
services less FISM
Other Sevices
www.kas.de/namibia
- 9 -
Growth rate of real GNP in (% - including forecast)
1995 2000 2005 2006 2007 2008 2009
4.1 % 3.5 % 4.8 % 4.1 % 3.8 % 4.0 % 3.3 % Cf. NEPRU Quarterly Economic Review No 64/ March 2008. <www.nepru.org.na> (8.10.2009)
Development of GNP (in N$ mill. - including forecast)
Period 2000/01 2002/03 2004/05 2006/07 2008/09 2009/10 2010/11
N$ mio. 21,436 33,142 37,300 48,228 59,516 64,590 70,017 Cf. Republic of Namibia, Statement for the 2008/09 Budget, presented by the Hon. Saara Kuugongelwa-Amadhila, Minister of Finance, 5 March 2008. SARPN: <http://www.sarpn.org.za/documents/d0003021/index.php> (8.10.2009)
Development of GNP (in N$ - including forecast)
1995 2000 2005 2006 2007 2008 2009
8,328 12,846 19,926 23,334 24,967 26,715 30,000 Cf. NEPRU Quarterly Economic ReviewNo64/March 2008 <www.nepru.org.na> (8.10.2009)
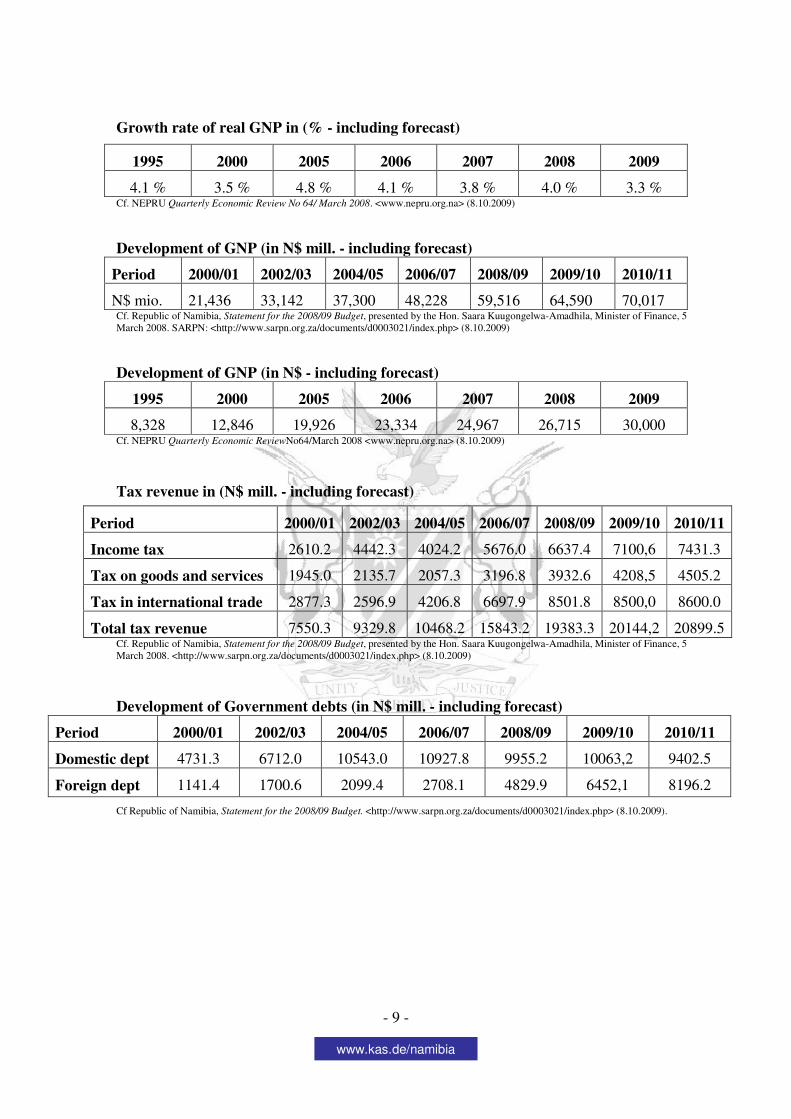
Tax revenue in (N$ mill. - including forecast)
Cf. Republic of Namibia, Statement for the 2008/09 Budget, presented by the Hon. Saara Kuugongelwa-Amadhila, Minister of Finance, 5 March 2008. <http://www.sarpn.org.za/documents/d0003021/index.php> (8.10.2009)
Development of Government debts (in N$ mill. - including forecast)
Period 2000/01 2002/03 2004/05 2006/07 2008/09 2009/10 2010/11
Domestic dept 4731.3 6712.0 10543.0 10927.8 9955.2 10063,2 9402.5
Foreign dept 1141.4 1700.6 2099.4 2708.1 4829.9 6452,1 8196.2
Cf Republic of Namibia, Statement for the 2008/09 Budget. <http://www.sarpn.org.za/documents/d0003021/index.php> (8.10.2009).
Period 2000/01 2002/03 2004/05 2006/07 2008/09 2009/10 2010/11
Income tax 2610.2 4442.3 4024.2 5676.0 6637.4 7100,6 7431.3
Tax on goods and services 1945.0 2135.7 2057.3 3196.8 3932.6 4208,5 4505.2
Tax in international trade 2877.3 2596.9 4206.8 6697.9 8501.8 8500,0 8600.0
Total tax revenue 7550.3 9329.8 10468.2 15843.2 19383.3 20144,2 20899.5
www.kas.de/namibia
- 10 -
Development of exchange rate
Year 19908 1995 2000 2004 2005 2006 2007 2008 20099
N$ for 1 EUR 3,3 4,67 7,04 8,02 7,91 8,52 9,66 11,86 11,45
N$ for 1 US$ 2,6 3,65 7,57 6,45 6,36 6,77 7,06 7,70 7,37
Cf. NEPRU Quarterly Economic Review No 64/ March 2008 <www.nepru.org.na> (8.10.2009).
Developement of Inflation rate (in % - including forecast)
1998 1999 2000 2001 2002 2003 2004 2005 2006 2007
6.2 8.6 9.3 9.3 11.3 7.3 3.9 2.3 5.1 6.7
Own calculation of annual average using data about the inflation by the Namibia Economic Policy Research Unit (NEPRU), <http://nepru.traktiv.com/index.php?id=19> (8.10.2009).
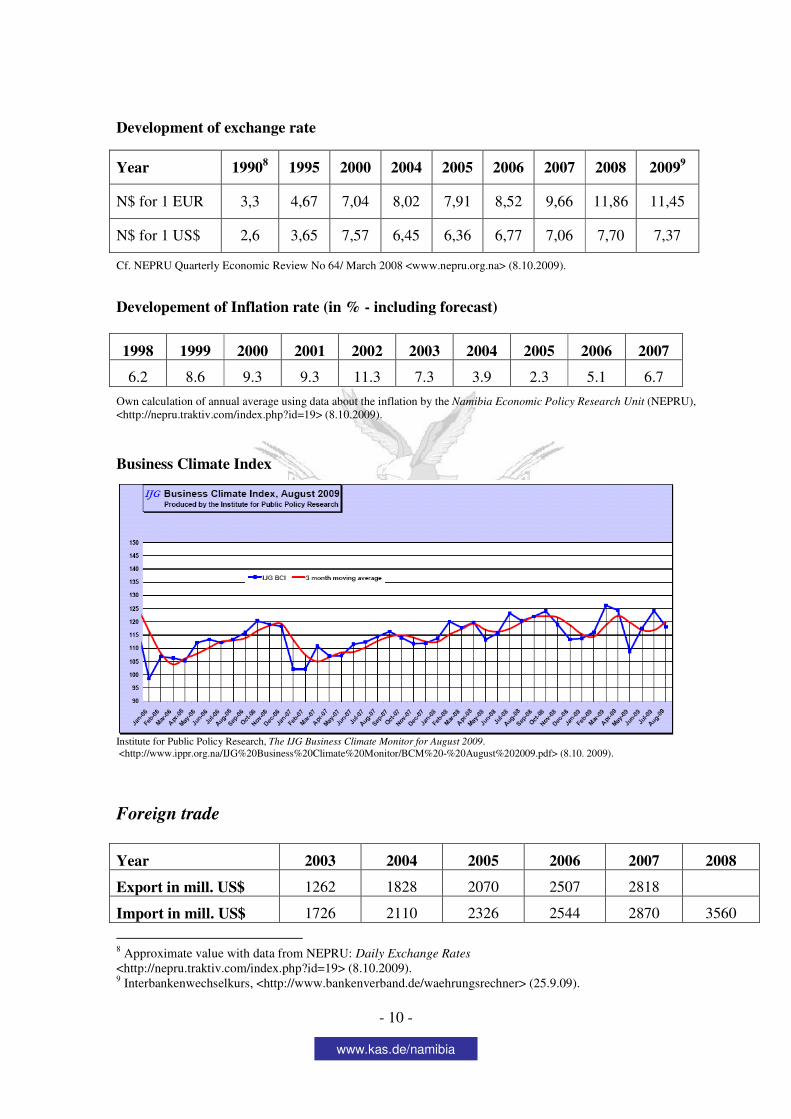
Business Climate Index
Institute for Public Policy Research, The IJG Business Climate Monitor for August 2009. <http://www.ippr.org.na/IJG%20Business%20Climate%20Monitor/BCM%20-%20August%202009.pdf> (8.10. 2009).
Foreign trade
Year 2003 2004 2005 2006 2007 2008
Export in mill. US$ 1262 1828 2070 2507 2818
Import in mill. US$ 1726 2110 2326 2544 2870 3560
8 Approximate value with data from NEPRU: Daily Exchange Rates <http://nepru.traktiv.com/index.php?id=19> (8.10.2009). 9 Interbankenwechselkurs, <http://www.bankenverband.de/waehrungsrechner> (25.9.09).
www.kas.de/namibia
- 11 -
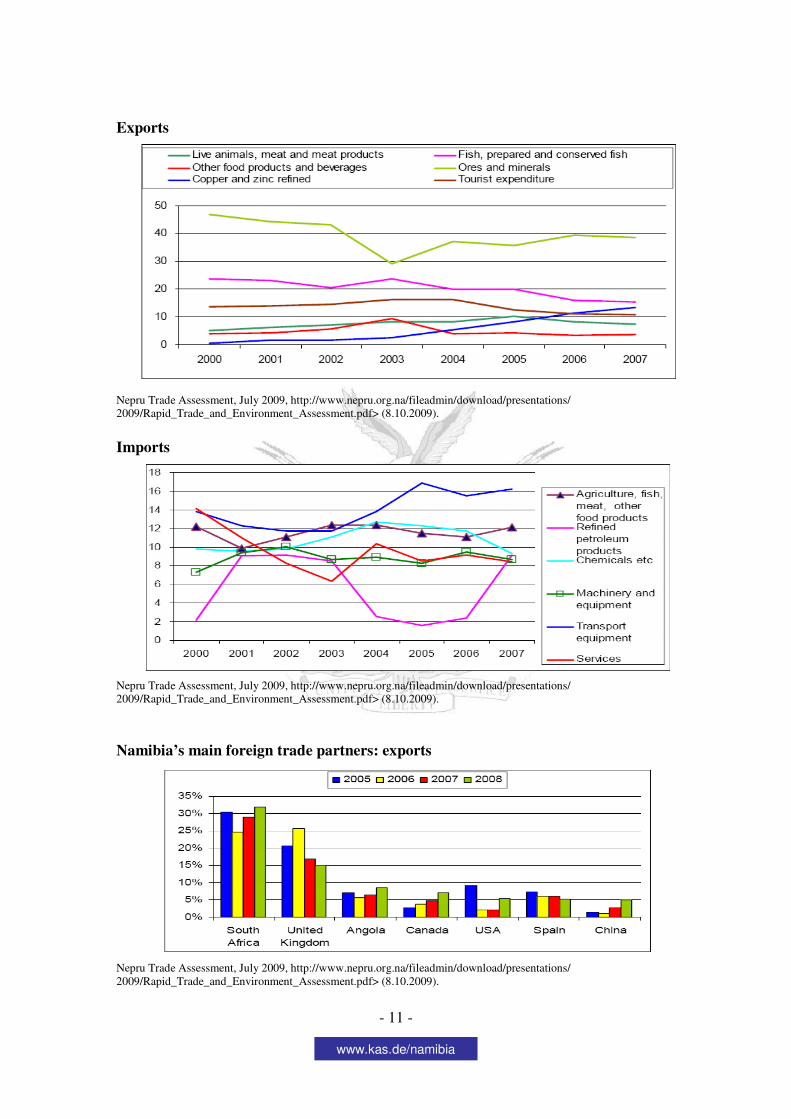
Exports
Nepru Trade Assessment, July 2009, http://www.nepru.org.na/fileadmin/download/presentations/ 2009/Rapid_Trade_and_Environment_Assessment.pdf> (8.10.2009).
Imports
Nepru Trade Assessment, July 2009, http://www.nepru.org.na/fileadmin/download/presentations/ 2009/Rapid_Trade_and_Environment_Assessment.pdf> (8.10.2009).
Namibia’s main foreign trade partners: exports
Nepru Trade Assessment, July 2009, http://www.nepru.org.na/fileadmin/download/presentations/ 2009/Rapid_Trade_and_Environment_Assessment.pdf> (8.10.2009).
www.kas.de/namibia
- 12 -
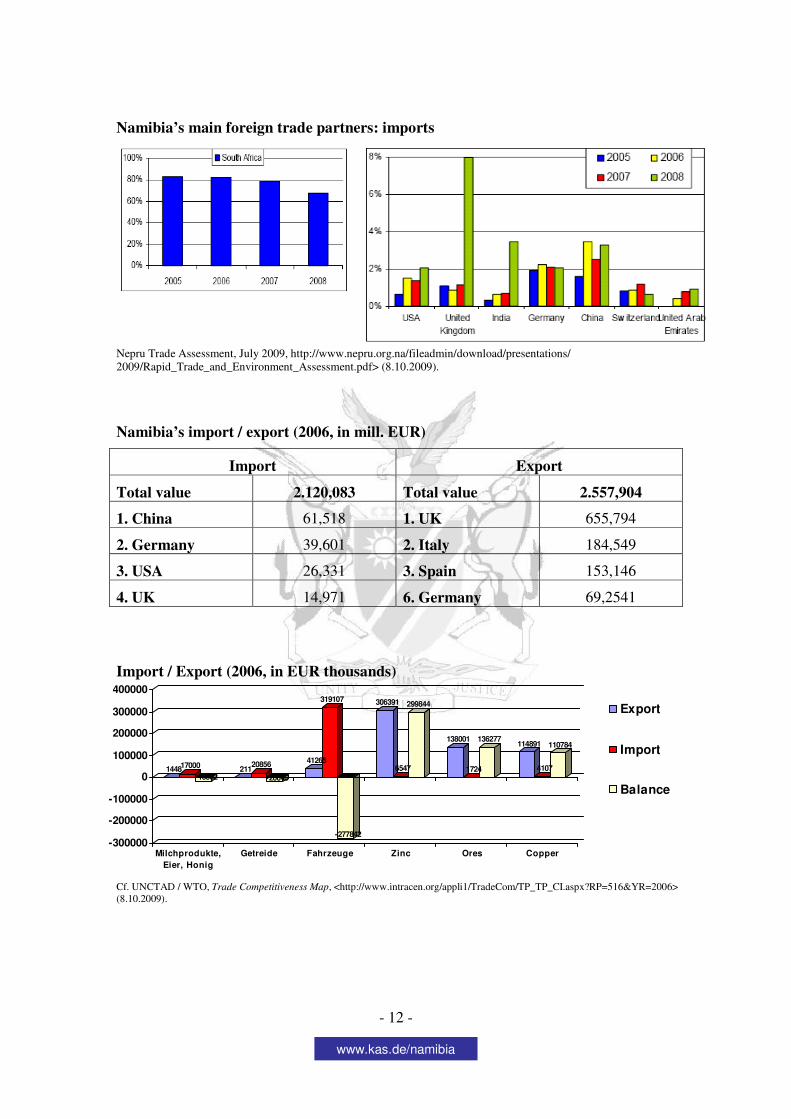
Namibia’s main foreign trade partners: imports
Nepru Trade Assessment, July 2009, http://www.nepru.org.na/fileadmin/download/presentations/ 2009/Rapid_Trade_and_Environment_Assessment.pdf> (8.10.2009).
Namibia’s import / export (2006, in mill. EUR)
Import Export
Total value 2.120,083 Total value 2.557,904
1. China 61,518 1. UK 655,794
2. Germany 39,601 2. Italy 184,549
3. USA 26,331 3. Spain 153,146
4. UK 14,971 6. Germany 69,2541
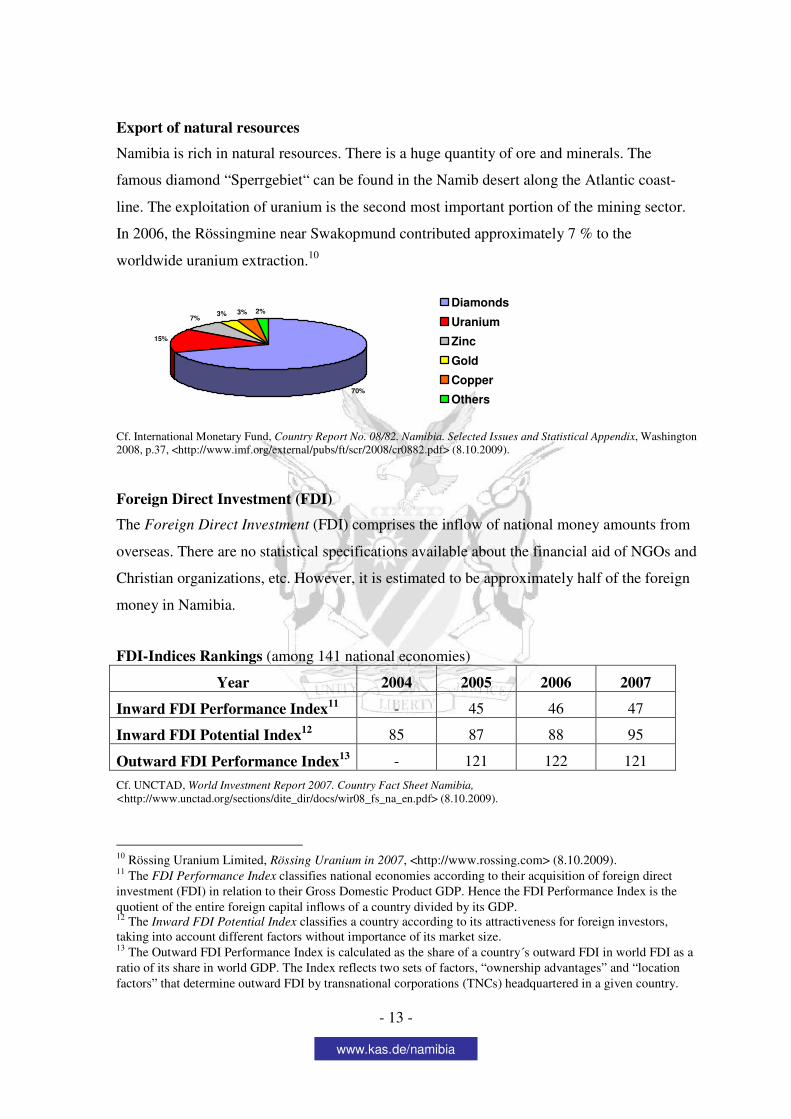
Import / Export (2006, in EUR thousands)
Cf. UNCTAD / WTO, Trade Competitiveness Map, <http://www.intracen.org/appli1/TradeCom/TP_TP_CI.aspx?RP=516&YR=2006> (8.10.2009).
144817000
-15552211
20856
-20645
41265
319107
-277842
306391
6547
299844
138001
1724
136277114891
4107
110784
-300000
-200000
-100000
0
100000
200000
300000
400000
Milchprodukte,
Eier, Honig
Getreide Fahrzeuge Zinc Ores Copper
Export
Import
Balance
www.kas.de/namibia
- 13 -
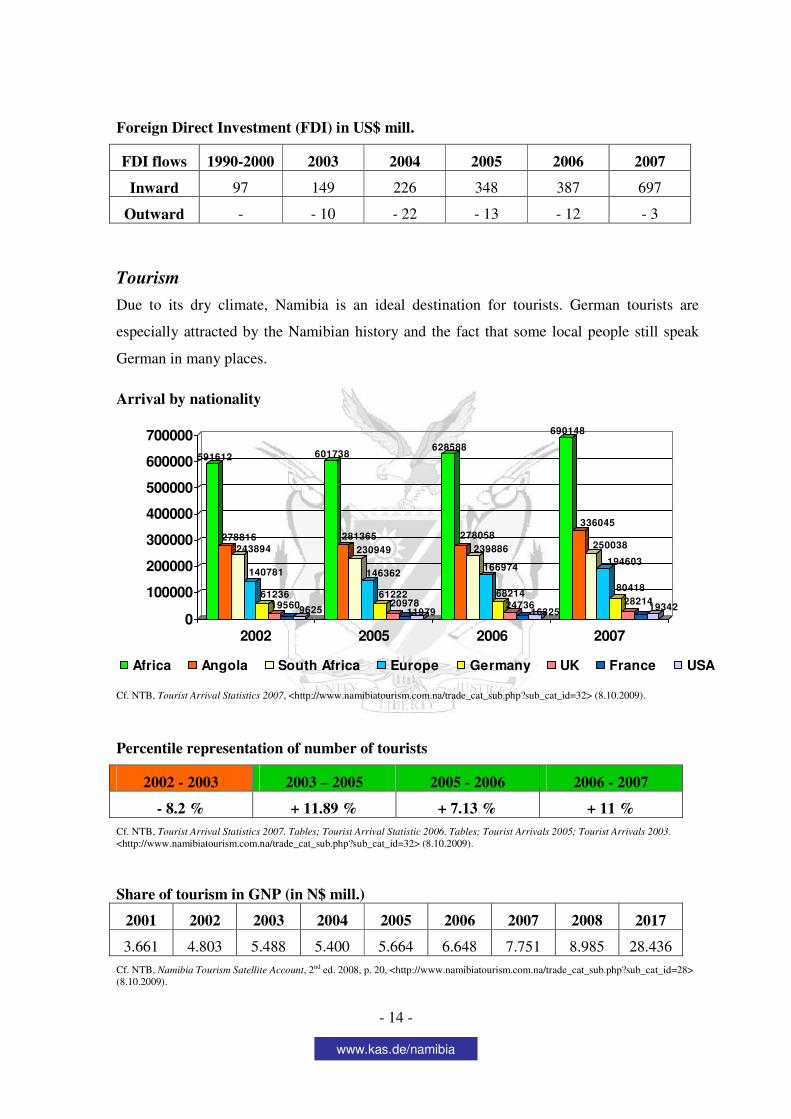
Export of natural resources
Namibia is rich in natural resources. There is a huge quantity of ore and minerals. The
famous diamond “Sperrgebiet“ can be found in the Namib desert along the Atlantic coast-
line. The exploitation of uranium is the second most important portion of the mining sector.
In 2006, the Rössingmine near Swakopmund contributed approximately 7 % to the
worldwide uranium extraction.10
15%
7%3% 3% 2%
70%
Diamonds
Uranium
Zinc
Gold
Copper
Others
Cf. International Monetary Fund, Country Report No. 08/82. Namibia. Selected Issues and Statistical Appendix, Washington 2008, p.37, <http://www.imf.org/external/pubs/ft/scr/2008/cr0882.pdf> (8.10.2009).
Foreign Direct Investment (FDI)
The Foreign Direct Investment (FDI) comprises the inflow of national money amounts from
overseas. There are no statistical specifications available about the financial aid of NGOs and
Christian organizations, etc. However, it is estimated to be approximately half of the foreign
money in Namibia.
FDI-Indices Rankings (among 141 national economies)
Year 2004 2005 2006 2007
Inward FDI Performance Index11 - 45 46 47
Inward FDI Potential Index12 85 87 88 95
Outward FDI Performance Index13 - 121 122 121
Cf. UNCTAD, World Investment Report 2007. Country Fact Sheet Namibia,
<http://www.unctad.org/sections/dite_dir/docs/wir08_fs_na_en.pdf> (8.10.2009).
10 Rössing Uranium Limited, Rössing Uranium in 2007, <http://www.rossing.com> (8.10.2009). 11 The FDI Performance Index classifies national economies according to their acquisition of foreign direct investment (FDI) in relation to their Gross Domestic Product GDP. Hence the FDI Performance Index is the quotient of the entire foreign capital inflows of a country divided by its GDP. 12 The Inward FDI Potential Index classifies a country according to its attractiveness for foreign investors, taking into account different factors without importance of its market size. 13 The Outward FDI Performance Index is calculated as the share of a country´s outward FDI in world FDI as a ratio of its share in world GDP. The Index reflects two sets of factors, “ownership advantages” and “location factors” that determine outward FDI by transnational corporations (TNCs) headquartered in a given country.
www.kas.de/namibia
- 14 -
Foreign Direct Investment (FDI) in US$ mill.
FDI flows 1990-2000 2003 2004 2005 2006 2007
Inward 97 149 226 348 387 697
Outward - - 10 - 22 - 13 - 12 - 3
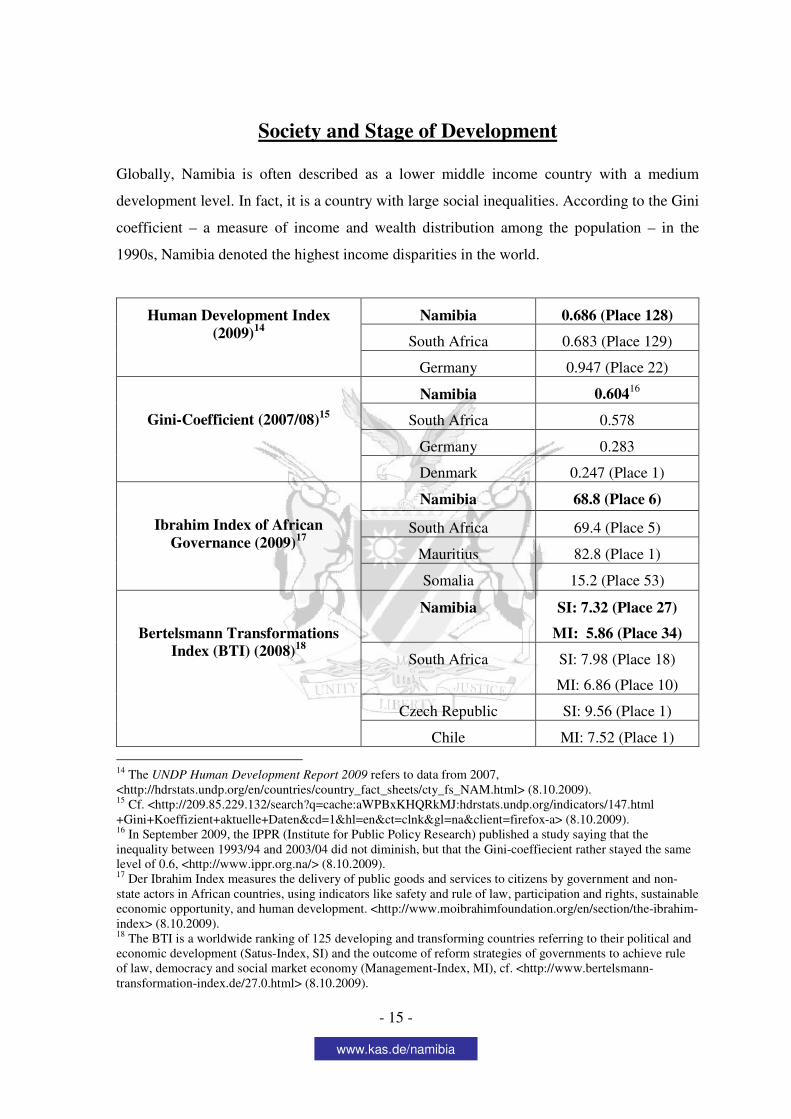
Tourism
Due to its dry climate, Namibia is an ideal destination for tourists. German tourists are
especially attracted by the Namibian history and the fact that some local people still speak
German in many places.
Arrival by nationality
Cf. NTB, Tourist Arrival Statistics 2007, <http://www.namibiatourism.com.na/trade_cat_sub.php?sub_cat_id=32> (8.10.2009).
Percentile representation of number of tourists
2002 - 2003 2003 – 2005 2005 - 2006 2006 - 2007
- 8.2 % + 11.89 % + 7.13 % + 11 %
Cf. NTB, Tourist Arrival Statistics 2007. Tables; Tourist Arrival Statistic 2006. Tables; Tourist Arrivals 2005; Tourist Arrivals 2003. <http://www.namibiatourism.com.na/trade_cat_sub.php?sub_cat_id=32> (8.10.2009).
Share of tourism in GNP (in N$ mill.)
2001 2002 2003 2004 2005 2006 2007 2008 2017
3.661 4.803 5.488 5.400 5.664 6.648 7.751 8.985 28.436
Cf. NTB, Namibia Tourism Satellite Account, 2nd ed. 2008, p. 20, <http://www.namibiatourism.com.na/trade_cat_sub.php?sub_cat_id=28> (8.10.2009).
591612
278816
243894
140781
6123619560
9625
601738
281365
230949
146362
6122220978
11979
628588
278058
239886
166974
68214
2473616325
690148
336045
250038
194603
80418
2821419342
0
100000
200000
300000
400000
500000
600000
700000
2002 2005 2006 2007
Africa Angola South Africa Europe Germany UK France USA
www.kas.de/namibia
- 15 -
Society and Stage of Development
Globally, Namibia is often described as a lower middle income country with a medium
development level. In fact, it is a country with large social inequalities. According to the Gini
coefficient – a measure of income and wealth distribution among the population – in the
1990s, Namibia denoted the highest income disparities in the world.
Namibia 0.686 (Place 128)
South Africa 0.683 (Place 129)
Human Development Index (2009)14
Germany 0.947 (Place 22)
Namibia 0.60416
South Africa 0.578
Germany 0.283
Gini-Coefficient (2007/08)15
Denmark 0.247 (Place 1)
Namibia 68.8 (Place 6)
South Africa 69.4 (Place 5)
Mauritius 82.8 (Place 1)
Ibrahim Index of African Governance (2009)17
Somalia 15.2 (Place 53)
Namibia SI: 7.32 (Place 27)
MI: 5.86 (Place 34)
South Africa SI: 7.98 (Place 18)
MI: 6.86 (Place 10)
Czech Republic SI: 9.56 (Place 1)
Bertelsmann Transformations Index (BTI) (2008)18
Chile MI: 7.52 (Place 1)
14 The UNDP Human Development Report 2009 refers to data from 2007, <http://hdrstats.undp.org/en/countries/country_fact_sheets/cty_fs_NAM.html> (8.10.2009). 15 Cf. <http://209.85.229.132/search?q=cache:aWPBxKHQRkMJ:hdrstats.undp.org/indicators/147.html +Gini+Koeffizient+aktuelle+Daten&cd=1&hl=en&ct=clnk&gl=na&client=firefox-a> (8.10.2009). 16 In September 2009, the IPPR (Institute for Public Policy Research) published a study saying that the inequality between 1993/94 and 2003/04 did not diminish, but that the Gini-coeffiecient rather stayed the same level of 0.6, <http://www.ippr.org.na/> (8.10.2009). 17 Der Ibrahim Index measures the delivery of public goods and services to citizens by government and non-state actors in African countries, using indicators like safety and rule of law, participation and rights, sustainable economic opportunity, and human development. <http://www.moibrahimfoundation.org/en/section/the-ibrahim-index> (8.10.2009). 18 The BTI is a worldwide ranking of 125 developing and transforming countries referring to their political and economic development (Satus-Index, SI) and the outcome of reform strategies of governments to achieve rule of law, democracy and social market economy (Management-Index, MI), cf. <http://www.bertelsmann-transformation-index.de/27.0.html> (8.10.2009).
www.kas.de/namibia
- 16 -
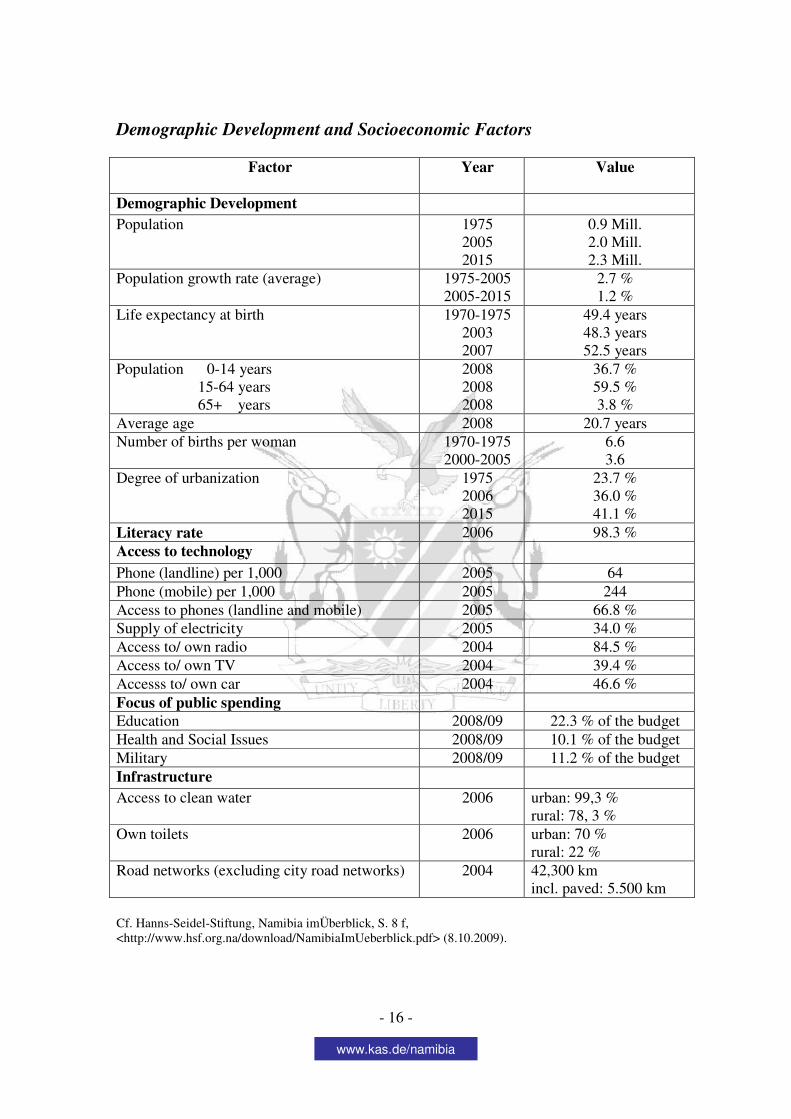
Demographic Development and Socioeconomic Factors
Factor Year Value
Demographic Development
Population 1975 2005 2015
0.9 Mill. 2.0 Mill. 2.3 Mill.
Population growth rate (average) 1975-2005 2005-2015
2.7 % 1.2 %
Life expectancy at birth 1970-1975 2003 2007
49.4 years 48.3 years 52.5 years
Population 0-14 years 15-64 years 65+ years
2008 2008 2008
36.7 % 59.5 % 3.8 %
Average age 2008 20.7 years Number of births per woman 1970-1975
2000-2005 6.6 3.6
Degree of urbanization 1975 2006 2015
23.7 % 36.0 % 41.1 %
Literacy rate 2006 98.3 % Access to technology
Phone (landline) per 1,000 2005 64 Phone (mobile) per 1,000 2005 244 Access to phones (landline and mobile) 2005 66.8 % Supply of electricity 2005 34.0 % Access to/ own radio 2004 84.5 % Access to/ own TV 2004 39.4 % Accesss to/ own car 2004 46.6 % Focus of public spending Education 2008/09 22.3 % of the budget Health and Social Issues 2008/09 10.1 % of the budget Military 2008/09 11.2 % of the budget Infrastructure
Access to clean water 2006 urban: 99,3 % rural: 78, 3 %
Own toilets 2006 urban: 70 % rural: 22 %
Road networks (excluding city road networks) 2004 42,300 km incl. paved: 5.500 km
Cf. Hanns-Seidel-Stiftung, Namibia imÜberblick, S. 8 f, <http://www.hsf.org.na/download/NamibiaImUeberblick.pdf> (8.10.2009).
www.kas.de/namibia
- 17 -
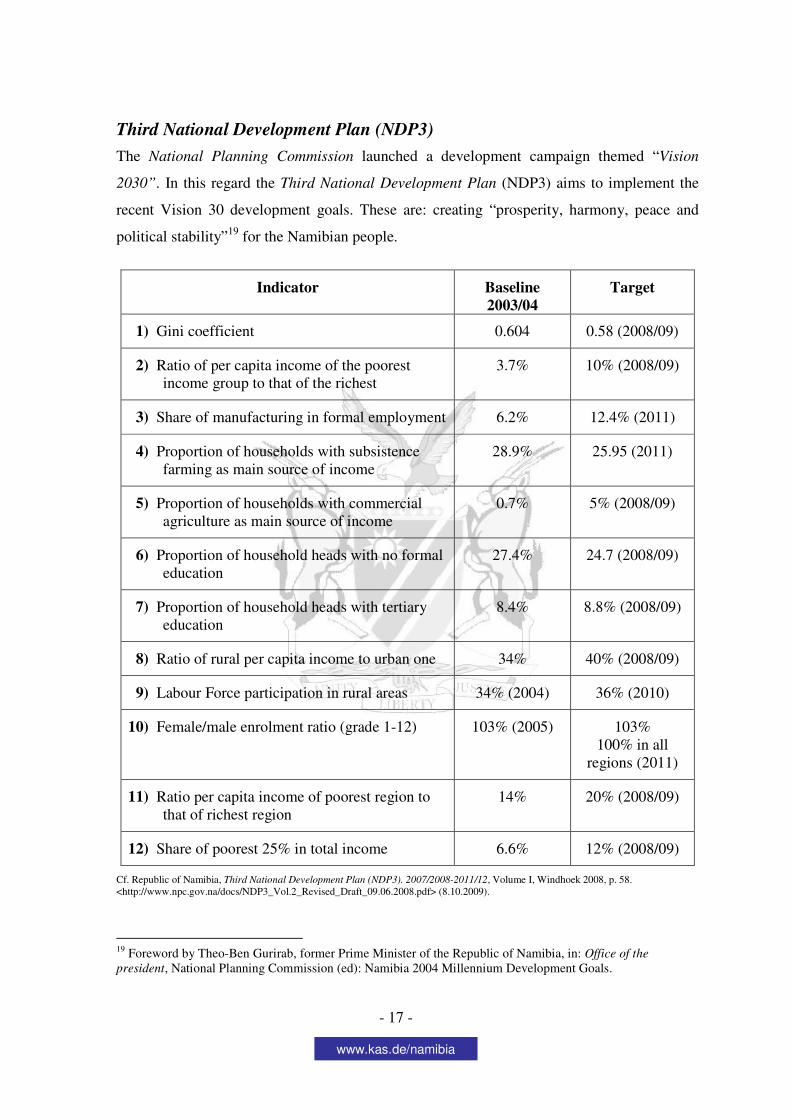
Third National Development Plan (NDP3)
The National Planning Commission launched a development campaign themed “Vision
2030”. In this regard the Third National Development Plan (NDP3) aims to implement the
recent Vision 30 development goals. These are: creating “prosperity, harmony, peace and
political stability”19 for the Namibian people.
Indicator Baseline 2003/04
Target
1) Gini coefficient 0.604 0.58 (2008/09)
2) Ratio of per capita income of the poorest income group to that of the richest
3.7% 10% (2008/09)
3) Share of manufacturing in formal employment 6.2% 12.4% (2011)
4) Proportion of households with subsistence farming as main source of income
28.9% 25.95 (2011)
5) Proportion of households with commercial agriculture as main source of income
0.7% 5% (2008/09)
6) Proportion of household heads with no formal education
27.4% 24.7 (2008/09)
7) Proportion of household heads with tertiary education
8.4% 8.8% (2008/09)
8) Ratio of rural per capita income to urban one 34% 40% (2008/09)
9) Labour Force participation in rural areas 34% (2004) 36% (2010)
10) Female/male enrolment ratio (grade 1-12) 103% (2005) 103% 100% in all
regions (2011)
11) Ratio per capita income of poorest region to that of richest region
14% 20% (2008/09)
12) Share of poorest 25% in total income 6.6% 12% (2008/09)
Cf. Republic of Namibia, Third National Development Plan (NDP3). 2007/2008-2011/12, Volume I, Windhoek 2008, p. 58. <http://www.npc.gov.na/docs/NDP3_Vol.2_Revised_Draft_09.06.2008.pdf> (8.10.2009).
19 Foreword by Theo-Ben Gurirab, former Prime Minister of the Republic of Namibia, in: Office of the
president, National Planning Commission (ed): Namibia 2004 Millennium Development Goals.
www.kas.de/namibia
- 18 -
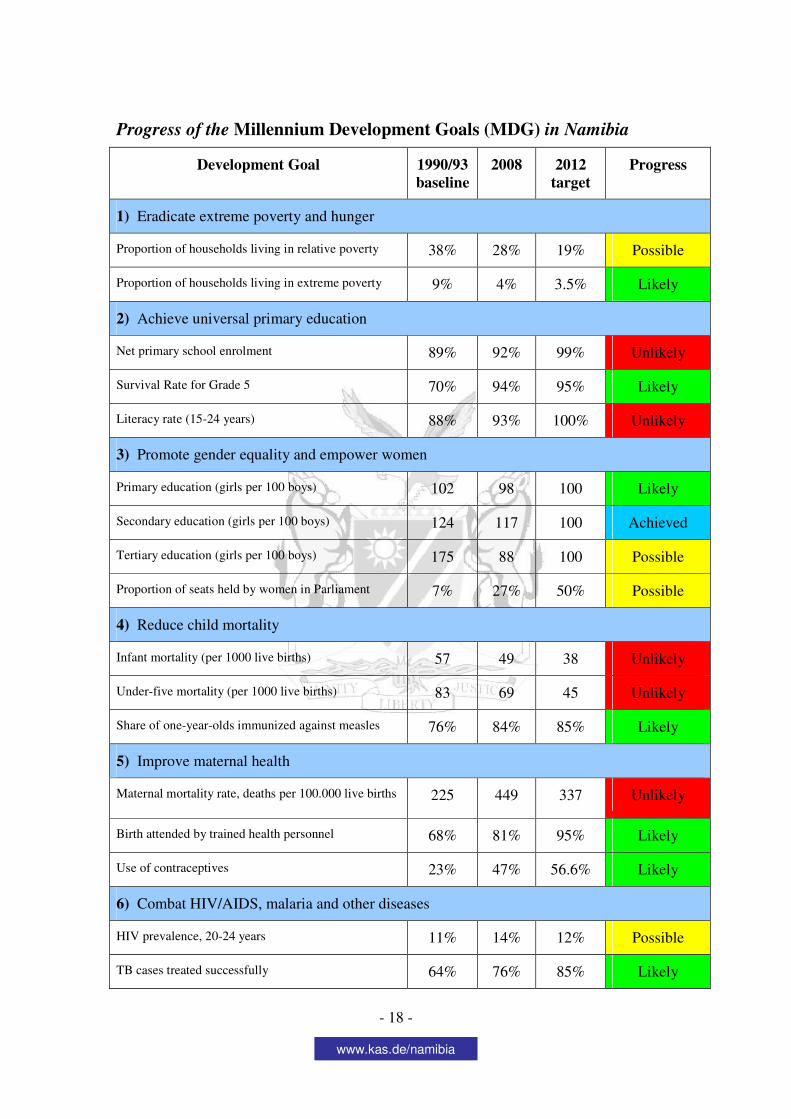
Progress of the Millennium Development Goals (MDG) in Namibia
Development Goal 1990/93 baseline
2008 2012 target
Progress
1) Eradicate extreme poverty and hunger
Proportion of households living in relative poverty 38% 28% 19% Possible
Proportion of households living in extreme poverty 9% 4% 3.5% Likely
2) Achieve universal primary education
Net primary school enrolment 89% 92% 99% Unlikely
Survival Rate for Grade 5 70% 94% 95% Likely
Literacy rate (15-24 years) 88% 93% 100% Unlikely
3) Promote gender equality and empower women
Primary education (girls per 100 boys) 102 98 100 Likely
Secondary education (girls per 100 boys) 124 117 100 Achieved
Tertiary education (girls per 100 boys) 175 88 100 Possible
Proportion of seats held by women in Parliament 7% 27% 50% Possible
4) Reduce child mortality
Infant mortality (per 1000 live births) 57 49 38 Unlikely
Under-five mortality (per 1000 live births) 83 69 45 Unlikely
Share of one-year-olds immunized against measles 76% 84% 85% Likely
5) Improve maternal health
Maternal mortality rate, deaths per 100.000 live births 225 449 337 Unlikely
Birth attended by trained health personnel 68% 81% 95% Likely
Use of contraceptives 23% 47% 56.6% Likely
6) Combat HIV/AIDS, malaria and other diseases
HIV prevalence, 20-24 years 11% 14% 12% Possible
TB cases treated successfully 64% 76% 85% Likely
www.kas.de/namibia
- 19 -
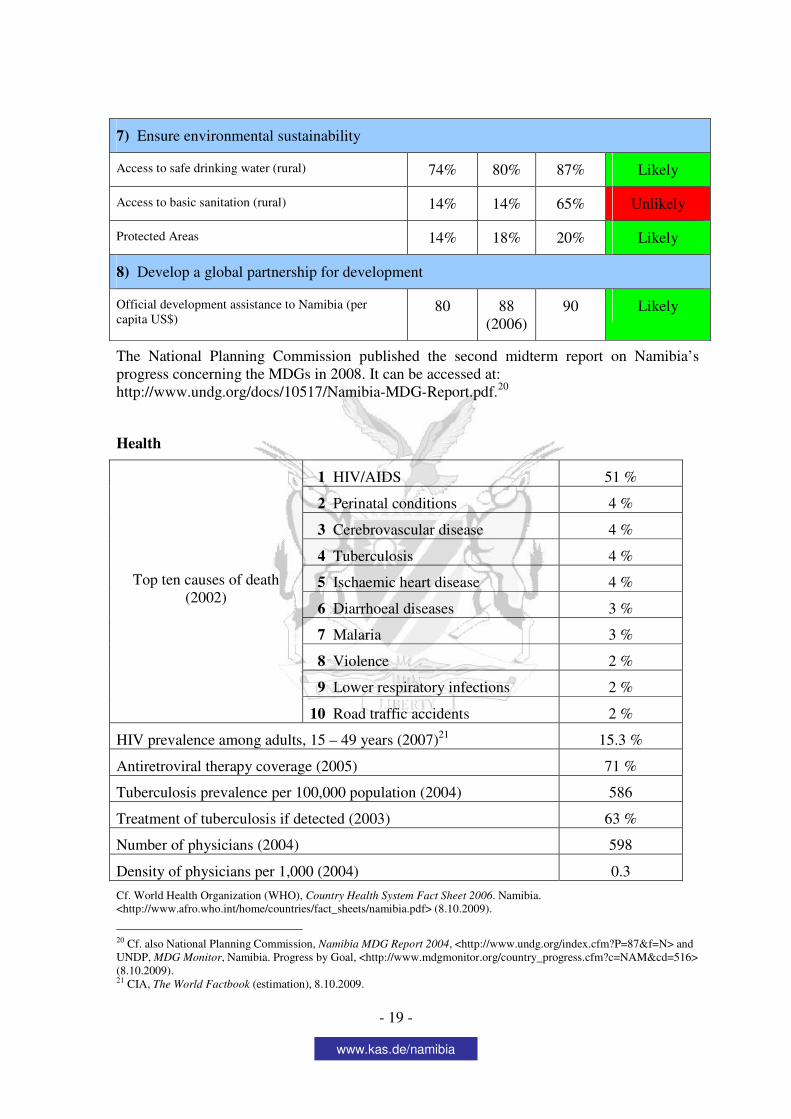
7) Ensure environmental sustainability
Access to safe drinking water (rural) 74% 80% 87% Likely
Access to basic sanitation (rural) 14% 14% 65% Unlikely
Protected Areas 14% 18% 20% Likely
8) Develop a global partnership for development
Official development assistance to Namibia (per capita US$)
80 88 (2006)
90 Likely
The National Planning Commission published the second midterm report on Namibia’s progress concerning the MDGs in 2008. It can be accessed at: http://www.undg.org/docs/10517/Namibia-MDG-Report.pdf.20
Health
1 HIV/AIDS 51 %
2 Perinatal conditions 4 %
3 Cerebrovascular disease 4 %
4 Tuberculosis 4 %
5 Ischaemic heart disease 4 %
6 Diarrhoeal diseases 3 %
7 Malaria 3 %
8 Violence 2 %
9 Lower respiratory infections 2 %
Top ten causes of death (2002)
10 Road traffic accidents 2 %
HIV prevalence among adults, 15 – 49 years (2007)21 15.3 %
Antiretroviral therapy coverage (2005) 71 %
Tuberculosis prevalence per 100,000 population (2004) 586
Treatment of tuberculosis if detected (2003) 63 %
Number of physicians (2004) 598
Density of physicians per 1,000 (2004) 0.3
Cf. World Health Organization (WHO), Country Health System Fact Sheet 2006. Namibia. <http://www.afro.who.int/home/countries/fact_sheets/namibia.pdf> (8.10.2009).
20 Cf. also National Planning Commission, Namibia MDG Report 2004, <http://www.undg.org/index.cfm?P=87&f=N> and UNDP, MDG Monitor, Namibia. Progress by Goal, <http://www.mdgmonitor.org/country_progress.cfm?c=NAM&cd=516> (8.10.2009). 21 CIA, The World Factbook (estimation), 8.10.2009.
www.kas.de/namibia
- 20 -
Land reform
Namibia covers land area of about 824.000 km2, which corresponds to 82.4 million hectares. According to the Namibia Agricultural Union (NAU), about 68.7 million hectares of this area is agriculturally usable. About 52 percent of this area (36 million hectares) are in the hands of formerly underprivileged people, 42 percent in the hands of formerly privileged people. Cf. Hanns-Seidel-Stiftung, Namibia imÜberblick, S. 11, <http://www.hsf.org.na/download/NamibiaImUeberblick.pdf> (8.10.2009).
Receipt of money from the Official Development Assistance (ODA) (in US$ mill)
Year 1991- 1992 1996-1997 2002 2003 2004
Official Development Assistance ODA (in US$ mill.)
212 217 134 146 183
ODA per GNP (in %) - - -
OECD, Table 25. ODA Receipts and Selected Indicators for Developing Countries and Territories (2007): <http://www.oecd.org/document/9/0,3343,en_2649_34485_1893129_1_1_1_1,00.html> (8.10.2009).