Republic of Mauritius Ministry of Finance and Economic Empowerment From Mono crop to Diversification...
28
Republic of Mauritius Ministry of Finance and Economic Empowerment From Mono crop to Diversification and Economic Resilience Republic of Mauritius
-
Upload
barnaby-harmon -
Category
Documents
-
view
218 -
download
0
Transcript of Republic of Mauritius Ministry of Finance and Economic Empowerment From Mono crop to Diversification...

Republic of Mauritius Ministry of Finance and Economic Empowerment
From Mono crop to Diversification and Economic Resilience
Republic of Mauritius
Macroeconomic Unit /
Outline
1. Economy at Independence
2. Development Strategies and Basis of Success
3. Economic Diversification
4. Importance of Tourism Sector
5. Mid 2000s Fundamental Reforms
6. Impact of Reforms
7. Impact of crises and Measures taken (2008
onwards)
8. Achieving Success: Mauritian Development

Background: At Independence Monocrop: Sugarcane
Sugar >91% of total fob exports
State of Mauritius in
1968
USD 200
High and rising unemployment ( >16%)
Low labour and capital productivity
Low in both Primary & Secondary
Low Standard of Living Poor access to Water, electricity & Decent dwellings
Growth rate of 3% Low Life Expectancy (61 male; 66
female) High Infant Mortality (64)
Economy
Income per Capita
Unemployment
School Enrollment
Quality of Living
Demographics
Infrastructure
Poor Infrastructure

Macroeconomic Unit /
Monocrop to Diversification and Economic Resilience
1970s: Sugar - 70% of export revenueIncome per Capita @ $ 200
1980s: Industrialization & Tourism Development Income per Capita @ $1500
1990s: Export of ServicesIncome per Capita @ $3000
2006 + : Open economy with Diversified ServicesIncome per capita @ $8600 (2011)

Development Strategies
Economic diversification: Agriculture
(Tea, Tobacco) Tourism
Labour intensive -import substituting industrialisation
1st Strategy: 1960s 2nd Strategy: 1970s
Mix strategy of import substituting and export led industrialisation
Tourism Use of preferences (EC
and US sugar quotas; Multi-Fibre Agreement quotas; African Growth and Opportunity Act)
Population Control Rural Development
Programmes Investment in road
network, education and other basic infrastructure
Primary goals: Industrialisation, Diversification, Employment Creation
3rd Strategy: 2006+
Paradigm shift to openness and global competitiveness
Transition to services economy and move from 4 to 8 pillars
Widen Circle of Opportunities
Empowerment & Solidarity
Maurice Ile Durable Corporate Social
Responsibility
Building blocks for economic independence
From low tomiddle income
From middle to high income

Basis of Success in 1970s Favourable Climatic Conditions specially in early 1970s
Very High Sugar Prices in Both Quota and Non-quota Markets
Sugar Protocol Arrangements
Non-Reciprocal preferential market access under Lomé Convention Industrialisation and Consolidation of Labour Intensive EPZ Industry
Fiscal and Monetary Incentives to EPZ Enterprises
Government Pump Priming Policies for Infrastructure Development
Successful Sectoral Specific Policies in Diversification and Consolidation of Economic Base i.e., EPZ and Tourism
Political Stability
Enabling Institutions

Basis of Success in 1980s Successful Stabilisation Programme
Stand-by Arrangements Structural Adjustment Lending Devaluation Containment of Public Recurrent
Expenditures Tightening of Domestic Credit Liberalisation of Deposit and
Lending Rates Removal of Restrictions on
Imports Major Changes in Industrial
Policies Export Led Industrialisation Recovery of World Economy By Mid
1980s Strengthening of Economic Ties with
Asia and Europe
Lome Convention Sound Macroeconomic
Management Consensus Building and
Social Safety Nets Cheap Supply of Educated
Labour Force Flexibility and Adaptability
of Workforce – Bilingual and high mobility of labour
Strong Public/Private Sector Participation with government playing a facilitating role
Commitment to Success Culture of Hard Work and
Saving Political Stability

Evolution of Key Sectors 1990-2011
Agricu
lture
& fishing
Man
ufacturin
g
Constr
uction
Wholes
ale &
retai
l trad
e
Hotel
s and re
stauran
ts
Tran
sport
&communica
tions
Finan
cial in
termed
iation
Rea
l esta
te & busin
ess
Others(m
ainly
servic
es)0.0
5.0
10.0
15.0
20.0
25.0
30.0
1990 2000 2005 2011

Macroeconomic Unit /
Tourism Sector and Market Diversification
1 2 3 4 5 6 7 8 9 10 11 120
200
400
600
800
1000
1200
051015202530354045
Tourist Earnings (Rs bn) and Tourist Arrivals (000s)
Tourist Earnings(Rs bn), RHSTourist Arrivals (000s)
2000200120022003200420052006200720082009201020110
2000
4000
6000
8000
10000
12000
85
90
95
100
105
110
115
No. of Hotels and Tourist Nights
No.of Hotels (RHS) Tourist Nights
EUROPE AFRICA ASIA OCEANIA AMERICA OTHER & N.STATED
0.0
10.0
20.0
30.0
40.0
50.0
60.0
70.0% of Tourist Arrival by Region
2009
2010
2011
With Euro Crisis Mauritius has been investing in market
diversification: India, China and Russia

Macroeconomic Unit /
Tourism Sector
2000 2001 2002 2003 2004 2005 2006 2007 2008 2009 2010 2011
-10.0
-5.0
0.0
5.0
10.0
15.0
Tourism growth rate and share of GDP (%)
% growth rate % of GDP
2000 2001 2002 2003 2004 2005 2006 2007 2008 2009 2010 20110.0
5.0
10.0
15.0
20.0
25.0
30.0
35.0
40.0
Tourism Employment (thousands)
2000200120022003200420052006200720082009201020110.0
5.0
10.0
15.0
20.0
25.0
30.0
35.0
40.0
45.0
Earnings (Rs bn)

Mid 2000s Fundamental Reforms & New Development Paradigm
Investment facilitation Greater openness/attracting foreign
capital, skills, talents, expertise, ideas
Doing Business Environment
Fiscal Policy Reforms
Low flat income tax rates of 15% Tax expenditure reforms PFM Reforms
Labour Market Reforms
From job protection to worker protection
Flexibility Workfare
Reducing energy consumption Leveraging renewable sources:
Solar, Wind, Ocean-based
Maurice Ile Durable
Arts & Culture
Promotion & Development of artists via: grants, training, and festivals (Kreole, Film)
Solidarity
Targeted social safety nets Empowerment programme Social housing Education & Healthcare CSR

Vulnerable Groups
National Empowerment Fund(NEF) targets the highly vulnerable
Training programmes in Literacy & Numeracy, and Life-skills
Special programme for re-training of unemployed women
Intergrated Social Development (Housing) Programme:
Lease-to-buy over 25yrs Civic, Literacy & Numeracy
training Job placement for at least
one adult in household Use of “green” technology:
biogas, composting, solar heaters
Empowerment Programme
Operates via NGOs/Grassroot movements
Building material for housing Transport/Shoes/Food for K-6 Microcredit schemes
Trust Fund
Eradication of Absolute Poverty
EAP & Ministry of health conducting screening of children to provide glasses, hearing aids, and provide for other disabilities
Collaborates with trust fund on educating children in K-6
Collaborates with NEF on the integrated social development approach

Widening the Circle of Opportunities
Shift in Labour Market From Manufacturing (Sugar/Textiles) to Services (Tourism/Tech)
Workfare programme emphasising training & re-skilling Training programme for unemployed women Creation of better post-college institutions offering wider curricula Support for development of new entrepreneurs & SMEs Assistance for outsourcing and encouraging the virtual office
Widening the Circle of Opportunities

Maurice Ile Durable
Incandescent bulbs replaced with CFLs (1 Million to date)
Government subsidy for solar water heaters
Bus modernisation scheme Replacement of fleets with
energy efficient and less polluting buses
Street & Traffic light replacement Large scale composting for
agriculture
Reducing Energy Consumption
Wind turbines in Mauritius & Rodrigues (almost operational)
Mini-hydropower stations Waste to Energy Gas(Landfill) to Energy
Alternative Energy Sources

Macroeconomic Unit /
Growth in Exports of goods and services
2000
2001
2002
2003
2004
2005
2006
2007
2008
2009
2010
2011
0
2
4
6
8
10
12 Real GDP Growth Rate & Unemployment Rate (%)
Unem-ployment rateGDP Growth
Rising Growth
Jun-04 Jun-05 Jun-06 Jun-07 Jun-08 Jun-09 Jun-10 Jun-11 Jun-120
10
20
30
40
50
60
70
80
Public sector debt as a share of GDPImproved debt
ratio
2000200120022003200420052006200720082009201020110
2
4
6
8
10
12
14
16
15
17
19
21
23
25
27FDI (Rs bn) & Investment Rate (% of GDP)
FDI GDFCF as a % of GDP
Rs b
n Rate (%)
Unemp falling
Improved FDI & Investment Rate
Impact of Reforms2000
2001
2002
2003
2004
2005
2006
2007
2008
2009
2010
2011
0.020.040.060.080.0
100.0120.0140.0160.0180.0200.0
Exports of goods and services (Rs bn)

Macroeconomic Unit /
Economic Success AFRICA• 1st. for Doing Business environment, • 1st open economy, • 1st. in paying taxes index, • 1st. in 2011 Mo Ibrahim Index, • 1st. in Global Competitiveness Index 2011-12, • 1st. in Travel & Tourism Competiveness Report 2011, • 1st. in Global Information Technology Report 2010-11, • 1st.Global Gender Gap Index 2011, • 1st. in Open Borders Index 2011, • 1st. in Democracy Index 2011) • 1st.2010 Environmental Performance Index, • 1st.in Quality of Life Index 2011, • 1st. in Political Instability Index 2009/2010, • 1st. in Women’s Economic Opportunity Index 2010, & • 1st. in Knowledge Economy Index.
AMONG THE TOP WORLDWIDE
• 2012 Index of Economic Freedom
• 2012 Doing Business Index• 2011 Democracy Index• 2011 Fraser Institute Index of
Economic Freedom• 2011 Forbes Survey for Best
Countries for business• 2010 Environmental
Performance Index• 2009 Social Institutions and
Gender Index

Impact of Crisis Risk of:
• Job losses in in Export Oriented Sectors & slowdown in job creation in other sectors
• Slowdown in Textile, Tourism, Construction and Real Estate sectors
• Drop in export volume of Textile/Apparel & non-Textile manufacturing and drop in growth of tourist arrival
• Stagnation in FDI flows & drop in Private sector Investment rate
• Possible deterioration in revenue buoyancy of Government, leading to a deterioration in debt ratio

Macroeconomic Unit /
Measures to unlock growth Opening economy for international investment flows, increased labour
mobility (including circular migration) and incentive for innovation and technology transfer
Maintaining a simple and investment friendly tax regime
Level playing field for local and foreign economic operators
Increased investment in capacity building
Front loading public sector investment
Reviving the micro, small & medium enterprise sector
Fiscal Consolidation
Reprioritizing spending to improve public sector investment
Restructuring public enterprises
Contingency planning
Special package to address challenges arising from worsening of global
economic conditions
Managing crisis/building resilience

Performance of the economy – Before and after the crisis
2000
2001
2002
2003
2004
2005
2006
2007
2008
2009
2010
2011
2012
0.0
2.0
4.0
6.0
8.0
10.0
12.0
Unemployment Rate (%)
2000
2001
2002
2003
2004
2005
2006
2007
2008
2009
2010
2011
2012
0.0
2.0
4.0
6.0
8.0
10.0
12.0
Inflation rate (%)
2000
2001
2002
2003
2004
2005
2006
2007
2008
2009
2010
2011
2012
0.0
1.02.03.04.05.06.07.08.09.0
10.0 Real GDP per capita growth rate
2000
2001
2002
2003
2004
2005
2006
2007
2008
2009
2010
2011
2012
0.0
2.0
4.0
6.0
8.0
10.0
12.0
Real Growth Rate (%)

Labour
2000200120022003200420052006200720082009201020110
5
10
15
20
25Net Job Creation (000s)
1 2 3 4 5 6 7 8 9 10 11 120
2
4
6
8
10
12
14
16
18 Unemployment Rate (%)
Male Female
2001 2002 2003 2004 2005 2006 2007 2008 2009 2010 20110.0
1.0
2.0
3.0
4.0
5.0
6.0Growth in Labour productivity (%)
Base Year: 2000

Social Indicators
2000/01 2001/02 2002/03 2003/04 2004/05 2005/06 2006/07 2007/08 2008/09 Jul -Dec 2009
2010 20110.0
1.0
2.0
3.0
4.0
5.0
6.0
10.0
10.5
11.0
11.5
12.0
12.5
13.0
13.5
Social Functions Expenditure & components as a % of GDP
Housing and community amenities Health Recreation, culture, and religion Education Social protection
Social Functions Expenditure (RHS)

Macroeconomic Unit /
Addressing Youth Unemployment reforms
• National Youth Employment Program: building capacity and promoting/ sponsoring employable skills among
the youth through intensive training for positions and provision of basic job readiness skills as well as some trade-specific abilities;
assist the young person to sustain the employment throughout a period of time;
build a dynamic pool of skills based on demand from industry thereby leading to a reduction in foreign /imported labour.
• Encourage higher participation of women aged 16-25 years.
• Huge possibilities for employment on cruise ships; dispensing training through the hotel training school (both public and private)
• Developing a contractual employment program with other countries necessary training and skilling is given to secure higher-end and skilled jobs in these countries where such skills are required.

Govt
Private
The People
Close Consultations between Government and the Private Sector
Development partners play a key role by providing financial and technical support
Encouragement of Civil Society Organisations
Emphasis on Corporate Social Responsibility following tax cuts
Innovative CSR tax to encourage private sector to work with Civil Society on tough social issues
Government – Private Sector – Civil Society
Development Partners

Republic of Mauritius Ministry of Finance and Economic EmpowermentMacroeconomic Unit /
Thank You!
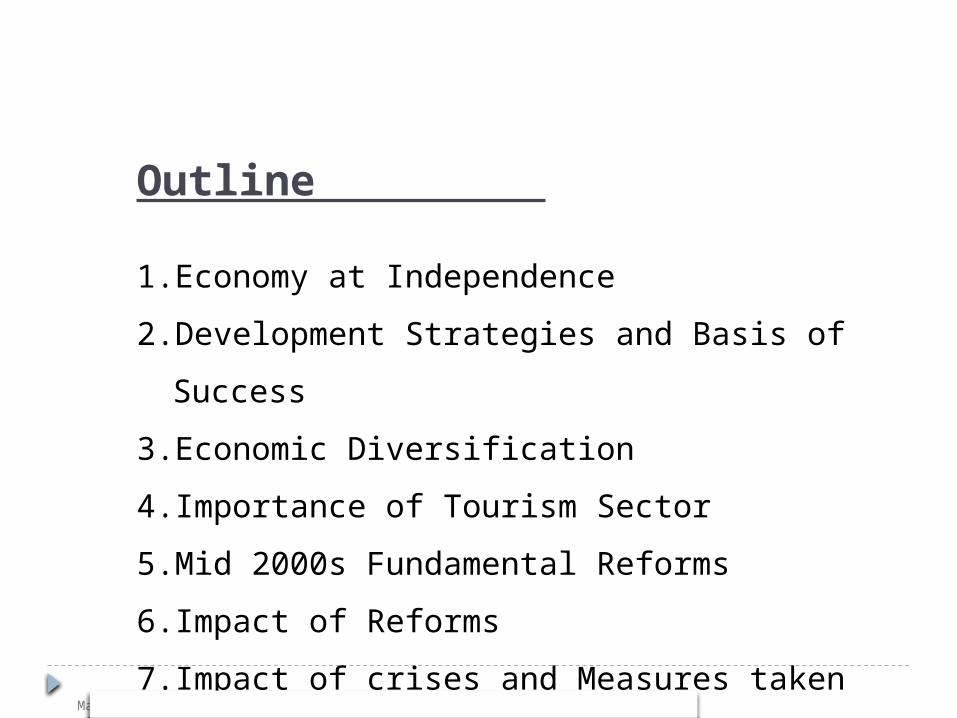
Government
The National Assembly Maximum 5 year term 3 MPs elected first-past-the-post
in 20 constituencies 2 MPs for Rodrigues 8 MPs elected to normalise
representation of minorities
The Cabinet The Prime Minister heads the
Government The President of the Republic
nominates the Prime Minister from coalition with majority in the National Assembly
The President 5 year term Elected by the National
Assembly Largely figurehead role (UK,
Commonwealth and Israeli model)
The Constitution Mix of British & French laws
The Courts The UK Privy Council The Supreme Court Intermediary Courts
Nomination of Judges to the Supreme Court
Chief Justice is nominated by the President after consultation with the Prime Minister
Puisne Judges nominated by the President with consent Judicial and Legal services commission
The Judiciary
The ExecutiveThe Legislature

Mauritian Rankings 2012 Index of Economic Freedom : 1st in Sub-
Saharan Africa 2012 Doing Business Index : 1st in Sub-
Saharan Africa Global Competitiveness Index 2011-12 : 2nd in
Sub-Saharan Africa Travel & Competitiveness Report 2011: 1st in
Sub-Saharan Africa 2011 Mo Ibrahim Index: 1st in Africa Network Readiness Index: 1st in Sub-Saharan
Africa
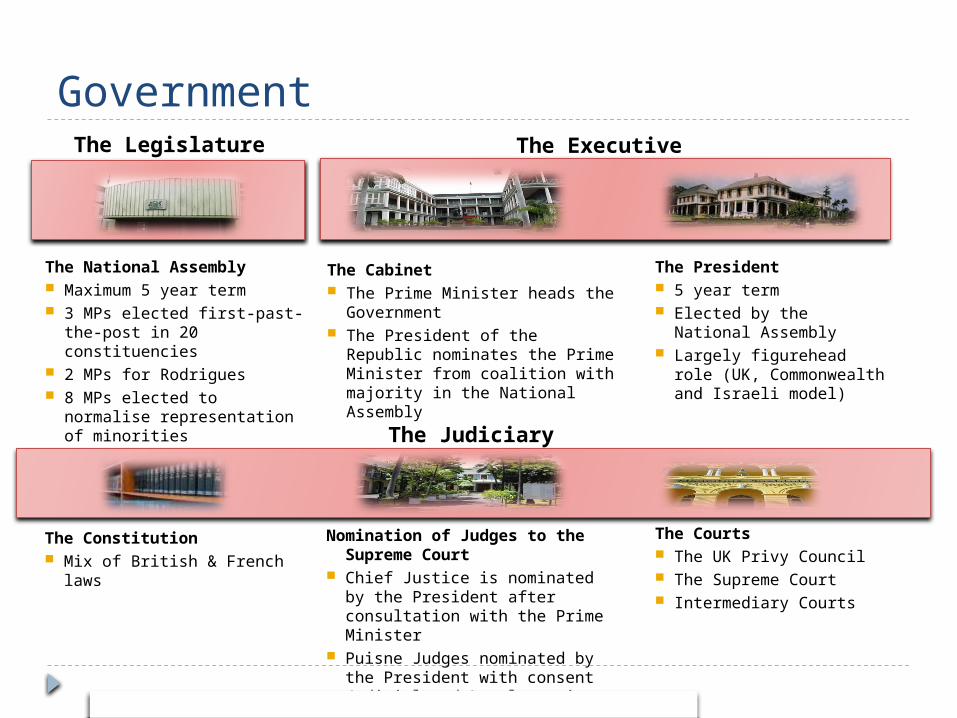
Triple Shock of 2005
1 Dismantlement of the Multi Fiber Agreement
2 End of preferential EU sugar prices
3 Soaring Energy Prices (~$30 to $60 for a Barrel)

Brief History
Île de FranceFrench Colony
1715 - 1810
MauritiusEnglish Colony
1810 - 1968
MauritiusIndependent
1968 - Present