REPUBLIC OF LIBERIA - LISGIS CROP ASSESSMENT REPORT.pdf · REPUBLIC OF LIBERIA PRODUCTION ESTIMATES...
42
REPUBLIC OF LIBERIA PRODUCTION ESTIMATES OF MAJOR CROPS AND ANIMALS – 2008 NOVEMBER 2009 MONROVIA, LIBERIA
Transcript of REPUBLIC OF LIBERIA - LISGIS CROP ASSESSMENT REPORT.pdf · REPUBLIC OF LIBERIA PRODUCTION ESTIMATES...

REPUBLIC OF LIBERIA
PRODUCTION ESTIMATES OF MAJOR
CROPS AND ANIMALS – 2008
NOVEMBER 2009
MONROVIA, LIBERIA

PRODUCTION ESTIMATES OF MAJOR
CROPS AND ANIMALS – 2008
Ministry of Agriculture (MOA)
Liberia Institute of Statistics & Geo-information Services (LISGIS)
United Nations Food and Agriculture Organization (FAO)
Catholic Relief Services (CRS)
Samaritan Purse

TABLE OF CONTENTS
Foreword i
Acknowledgement ii
Fact Sheet iii
List of Tables and Figures iv
Acronyms v
Executive Summary vi
Introduction vii
Part 1: Survey Objectives and Methodology 1
1.1. Objectives 1
1.2. Terms and Definition 1
1.3. Methodology 2
Part 2: National Estimates 4
2.1. Rice and Cassava Production 4
2.2. Livestock and Poultry Production 5
2.3. Agricultural Households 6
2.4. Heads of Agricultural Households 7
2.5. Members of Agricultural Households 7
2.6. Rice Balance Sheet 9
Part 3: County and Regional Estimates 11
3.1. Introduction 11
3.2. Rice Production 11
3.3. Cassava Production 13
3.4. Rice and Cassava Producing Households 15
3.5. Livestock and Poultry Rearing Households 16
3.6. Heads of Livestock 19
3.7. Household Raising Poultry and Number of Heads 20
3.8. Heads of Agricultural Households 22
3.9. Members of Agricultural Households 25
2008 CROP SURVEY
FOREWORD
In any developing country agriculture plays a very important role in the economic life
of her people. Liberia is no exception. The bulk of the population in the country derives
its means and sources of livelihood from agricultural activities. The nation depends on
agricultural production for the accomplishment of food security. Because of the unique
position agriculture holds in the life of the country, its promotion has been one of the
primary concerns of the Government. Now, for success in promoting agriculture,
planning is absolutely necessary. No planning is meaningful and useful unless
supported or backed by statistical information.
Planning for agricultural development usually requires a wide range of statistical data
covering the different sectors of the economy relevant to agricultural productivity.
Thus, regular collection of agricultural data is significant. Since the establishment of
the Division of Statistics in the Ministry of Agriculture, there have been series of
Annual Agricultural Surveys for major crops up to 1989. The Division had provided
reliable agricultural statistics that satisfied demands for data. Unfortunately, no such
surveys have been conducted up to 2000 because of the civil war and its
consequences.
With the relative peace in 2001, the Government decided to rehabilitate the
Agricultural Statistical System. Under the Technical Cooperation Program (TCP) of the
United Nations Food and Agriculture Organization (UNFAO), appropriate
methodologies for agricultural annual surveys were developed and a baseline survey
was conducted in 2001 aimed at rehabilitating the agricultural surveys. As a
consequence of the 2003 civil crisis, the established system was collapsed.
Considering the ardent need for agricultural statistics, efforts were made to reactivate
the system of agricultural data collection. This report presents the results of the 2008
crop survey, the 16th
of the series and the first since the democratically elected
Government of Unity Party, headed by Her Excellency Madam Ellen Johnson-Sirleaf.
Dr. Florence A. Chenoweth
MINISTER OF AGRICULTURE
i

ACKNOWLEDGEMENT
The Ministry of Agriculture (MOA) through its Division of Statistics conducted
2008/2009 Annual Production Survey with the primary objective of providing relevant
statistics for agricultural development planning. A nation-wide survey of this type
requires a great deal of efforts, cooperation, a high level of commitment and technical
as well as administrative support.
Many individuals have made some contributions from the planning stage, data
collection and towards publication of the results. Accordingly, we wish to sincerely
extend our thanks and appreciations to those who have contributed in making the
2008 Agricultural survey a very successful one. We are particularly grateful to the
Former Minister of Agriculture, Dr. J. Chris Toe and Mr. Joseph Boiwu, Assistant FAO
Representative for Program who exerted some efforts in mobilizing resources, which
enabled the survey team to accomplish the first phase of the survey. We are very
fortunate to have worked with people who recognized the usefulness of statistics.
Thus, we owe a great deal to Dr. Florence A. Chenoweth, the current Minister of
Agriculture and Hon. James B. Logan, Deputy Minister for Planning and Development
for their administrative and moral support.
Special mention is due to Dr. T. Edward Liberty, Director-General for Liberia Institute of
Statistics and Geo-Information Services (LISGIS) for his technical advice and
administrative guidance during the data collection and summarization as well as
analytical process of the survey results. Special mention is made of Dr. Winfred
Hammond, FAO Representative in Liberia for his consistent commitment and support
to the activities of the survey. Gratitude is expressed to CRS and Samaritan Purse for
their logistical support and the provision of field personnel.
We are indebted to the Local Government Authorities who assisted our field
personnel in the form of interpreting, logging, escorting and introducing them to the
farmers. Principal contributors were the selected farmers who have cooperated,
opened to dialogue about their agricultural as well as basic socio-economic activities.
They deserve credit. Gratitude is expressed to the field personnel of the Ministry of
Agriculture (MOA) whose dedication and sacrifices have made the field activities of the
2008 Agricultural Survey possible despite of several constraints. So many people have
contributed to this report, and it is difficult and impossible to thank them individually.
However, we extend thanks and appreciation to those individuals and Institutions,
time does not permit us to mention one by one.
Mr. Reginald W. Fannoh
DIRECTOR, STATISTICS DIVISION
MINISTRY OF AGRICULTURE
ii

Fact Sheet
DESCRIPTION
BOTH SEXES
MALE FEMALE
PERCENT
Number Percent Male Female
1. Agricultural Population 1,567,650 100.0 785,400 782,250 50.1 49.9
Age Category
< 10 Years 442,080 28.2 216,010 226,070 48.9 51.1
10 - 19 Years 402,880 25.7 212,790 190,090 52.8 47.2
20 - 39 Years 468,730 29.9 217,630 251,100 46.4 53.6
40 - 59 Years 184,980 11.8 100,500 84,480 54.3 45.7
60 Years + 68,980 4.4 38,470 30,510 55.8 44.2
2. Heads of Agric. Households 274,070 100.0 197,580 76,490 72.1 27.9
Age Category
< 20 Years 6,850 2.5 4,740 2,110 69.2 30.8
20 - 39 Years 117,850 43.0 87,720 30,130 74.4 25.6
40 - 59 Years 106,890 39.0 77,060 29,830 72.1 27.9
60 Years & over 42,480 15.5 28,060 14,420 66.1 33.9
3.Primary occupation, 10 yrs+ 1,125,570 100.0 569,390 556,180 50.6 49.4
Farmer 566,160 50.3 270,460 295,700 47.8 52.2
Farmhand 128,320 11.4 55,230 73,090 43.0 57.0
Fishing 2,250 0.2 1,140 1,110 50.7 49.3
Agro-processing 2,250 0.2 1,140 1,110 50.7 49.3
Trader 24,760 2.2 7,970 16,790 32.2 67.8
Artisan 7,880 0.7 5,690 2,190 72.2 27.8
Civil Servant 22,510 2.0 15,940 6,570 70.8 29.2
Unskilled Labor 5,630 0.5 2,850 2,780 50.6 49.4
Student 365,810 32.5 208,970 156,840 57.1 42.9
Number % Agric Hh
4. Agricultural Households 274,070
Rice producing households 231,370 84.4
Cassava producing households 117,730 43.0
Livestock rearing households 65,470 23.9
Poultry raising households 117,120 42.7
Number % Tot. Area
5. Area Under Food Crops 280,030 100.0
Rice Area in Hectares 222,670 79.5
Cassava Area in Hectares 57,360 20.5
Metr tons % Tot. Prod
6. Food Crop Production 775,290 100.0
Paddy rice 279,000 36.0
Fresh cassava 496,290 64.0
Number % Tot. Head
7. Livestock and Poultry 1,063,600 100.0
Heads of Livestock 234,920 22.1
Heads of Poultry 828,680 77.9
iii

LIST OF TABLES AND FIGURES
Table 2.1: Rice and Cassava Production
Table 2.2: Livestock and Poultry Production
Table 2.3: Food Crops and Animal Farming Households
Table 2.4: Heads of Agricultural Households by Age and Sex
Table 2.5: Members of Agricultural Households by Age and Sex
Table 2.6: Members of Agric. Households 10 years and over by Primary Occupation and
Sex
Table 2.7: Cereal (Rice) Balance Sheet
Table 3.1: Area under Rice Cultivation, Yields per Hectare and Production by County
Table 3.2: Area under Cassava Cultivation, Yields per Hectare and Production by
County
Table 3.3: Rice and Cassava Producing Households by County
Table 3.4: Livestock and Poultry Rearing Households by County
Table 3.5a&b: Households Rearing Livestock by Type and County
Table 3.6: Heads of Livestock by Type and County
Table 3.7: Households Raising Poultry and Number of Heads by County
Table 3.8: Rural and Agricultural Households by County
Table 3.9: Heads of Agricultural Households by Sex and by County
Table 3.10: Members of Agricultural Households by Sex and by County
Figure 2.1: Percent Distribution of Household Members 10 Yrs+ by Primary Occupation
and Sex
iv

Acronyms
AH Agricultural Household
AP Agricultural Population
HoH Heads of Household
HRF Holder’s Rice Farm
EA Enumeration Area
FAO Food and Agriculture Organization
LH Livestock Household
LISGIS Liberia Institute of Statistics and Geo-Information Services
MOA Ministry of Agriculture
PH Poultry Holder
PSU Primary Sampling Unit
RH Rice Household
SSU Secondary Sampling Unit
TCP Technical Cooperation Program
UNFAO United Nations Food and Agriculture Organization
v
Executive Summary
Introduction
Statistical information on agricultural production, prices and market conditions play a
central role in the Liberian economy in terms of contribution to income generation,
employment and food security for most families. This is precisely why the Ministry of
Agriculture (MOA) in collaboration with Liberia Institute of Statistics and Geo-
Information Services (LISGIS) exerted significant efforts to revive the activities of
agricultural survey. This summary provides an insight into all major components of the
2008 agricultural survey results. The document highlights major characteristics of
agricultural activities including production of food crops and livestock.
Objective
The overall objective of the publication is to provide statistics on food and agriculture
for effective planning and the monitoring of agricultural sector for policy and
administrative decisions.
Main Source of Data
The main source of data for the publication was the 2008 agricultural sample survey
which used the conventional method with a well-prepared questionnaire.
Methodology
The sample design for the 2008 survey was a multi-stage sampling with: (a)
Enumeration Areas (EAs) as the primary sampling units (PSUs), (b) Agricultural
Holders (Ahs) within EA as the secondary sampling units (SSUs), (c) Holders’ Rice
Farms (HRFs) as the tertiary sampling unit, and (d) Experimental plots for crop-cutting
in selected farms as the ultimate stage-sampling unit. The sampling design was adopted
with each county as domain of study.
Three (3) sets of questionnaires were developed and administered, namely: Households
listing questionnaire, Holders’ questionnaire and Field and Yields measurement
questionnaires. These questionnaires were used to probe only those households with
member participating in agricultural activities. Each completed questionnaire was
scrutinized in the field and further scrutiny was done in the central office. Range and
internal consistency checks were adopted.
vi

Key Findings
Member of Agricultural Households: The population that lived in agricultural
households was estimated at 1,567,650 with 785,400 (50.1 %) male and 782,250 (49.9
%) female. The age group 0 – 19 accounted for more than half (53.9 %) of the total
population. By contrast, the elderly age group 60 years and over accounted for 4.4
percent, while the active labor force (20 – 59) accounted for 41.7 percent. This shows
that the bulk of the populations in agricultural households were children and young
adults and the least were elderly.
Agricultural Households: The total number of agricultural households was 274,040,
which constituted 85.3 percent of the rural households. Of this number 70.6 percent
involved in rice production, 35.9 percent in cassava production, 23.9 percent in
livestock production and 42.7 percent in the production of poultry. This analysis
depicts that more households engaged in rice farming. Nearly all of the livestock and
poultry are produced by households through the free range system.
Rice and Cassava Production: The production of rice was estimated at 279,000 metric
tons. This estimate was 6.6 percent less than pre-war (1988) and 27.4 percent more than
2001. Cassava production was estimated at 496,290 metric tons. This estimate was
above pre-war (1988) and 2001 by 21.1 percent and 32.9 percent respectively.
vii

Introduction and Organization of the Report
A five-year National Strategy for the Development of Statistics (NSDS) has been
launched in Liberia with the primary objectives of strengthening capacity for the
production of quality data and improving coordination of statistical activities within the
national statistical system. As one of the key ministries, the Ministry of Agriculture
participated in the process and five major activities were identified and planned for the
period 2008 to 2012. The activities are aimed at rehabilitating agricultural surveys and
the production of reliable statistics. One of the major activities planned is Annual Crop
Production Survey. Crop production data are considered to be the most important
agricultural information for the monitoring of the Poverty Reduction Strategy (PRS)
and Millennium Development Goals (MDGs). This publication presents results of the
2008/2009 crop survey.
The report is organized into three parts. Part one discusses the objectives and
methodology of the survey. The second part provides national estimates for major
items, including rice, cassava, livestock and poultry production, agricultural
households, heads of agricultural households, members of agricultural households and
cereal (rice) balance sheet. Part three provides estimates at the county level, which
include rice and cassava production, rice and cassava producing households, livestock
and poultry rearing households, heads of livestock and poultry, agricultural households,
heads and members of agricultural households differentiated by gender.
viii

PART 1: Survey Objectives and Methodology
1.1. Objectives
The immediate objectives of the survey are as follows:
• Assess the current levels of farming households and population;
• Provide gender-disaggregated agricultural statistics on key agricultural activities;
• Provide statistics for locally produced commodities, mainly food and livestock;
• Provide basic statistics on major agricultural import and export commodities and
• Develop a “user-friendly agricultural database to include major indicators for food
security
1.2. Terms and Definitions • Enumeration Area (EA)- a geographical area delineated by the Liberia Institute
for Statistics and Geo-Information Services (LISGIS) in the 2008 National
Population and Housing Census. Each EA may contain one or more
towns/villages with 75 – 125 households.
• Building- any kind of structure or house made of bricks, stone, timber /wood,
cement, mat or mud with a roof made of thatch, zinc, concrete where People
live or may live.
• Town/Village- one or more building grouped together having a distinct name
and a chief.
• Household - a group of persons living together and eating from the same pot
regardless of whether they live in one building and are responsible to the
Same head. .
• Head of Household (H/H)-the person responsible for providing the daily needs
for members households. In the decision of food security, they share with their
spouse (if any) the long- term hopes and fears for the availability of household
supplies.
• Agricultural Household (AH)-a household in which any member is actively
growing crop(s) or raising livestock or poultry.
• Agricultural Population (AP)- all people residing permanently in the
agricultural households including those temporarily absent for less than three
months and excluding visitors in the household for less than three months.
• Livestock Holder (LH)- any holder raising five or more heads of livestock
(cattle, goats, sheep, pigs,)
• Poultry Holder (PH)- any holder raising ten or more heads of poultry (Chicken,
ducks)
• Holder-any member of a household who operates a farm in his or her own right
(means that the person is independent in making decisions concerning the
operations regardless whether he/she owns the land, rent it from others or
squats on it).

• Respondent- any reliable or knowledgeable member of the household who is
in the position to answer survey questions. He/she might be the head of the
household or any member appointed by him/her. There may be more than one
respondent answering different set of questions in consultation with each
other.
• Holding (Farm)- a piece of land used for agricultural production operated or
managed by one person/holder or in some cases jointly operated or managed
by two or more holders.
• Field- a piece of cultivated land carrying one crop or mixture of crops. It may be
a parcel or part of land. It may make up an entire holding or only part of the
holding. In some cases farm may be used.
• Crop Mixture- a combination of crops planted within the same plot. They do
not need to be planted and harvested at the same time.
• Plot- part of a field (farm) used for yield measurement or density studies.
1.3. Methodology
The sample design for the 2008 survey was a multi-stage sampling with the following
features: (a) Enumeration Areas (EAs) as the primary sampling units (PSUs), (b)
Agricultural Holders (Ahs) within EA as the secondary sampling units (SSUs), (c)
Holders’ Rice Farms (HRFs) as the tertiary sampling unit, and (d) Experimental plots
for crop-cut in selected farms as the ultimate stage-sampling unit. The sampling plan
was adopted with each county as domain of study. The survey was designed purposely
to collect rice data
Description of the Sampling Frame: For the first stage of sampling, the basic frame
consists of a list of Enumeration Areas (EAs) from Liberia Institution of Statistics and
Geo-Information Services (LISGIS). These EAs were delineated as a result of the 2008
National Population and Housing Census. According to the 2008 frame, number of
households for each EA was indicated, and from this list, EAs were selected within
county using systematic sampling. The sample was designed with a total sample size of
110 EAs for the country from the total of 4,512 rural EAs. The sample size was derived
based on the amount of resources (time and money) available.
For the second stage of sampling, the basic frame consisted of a list of holders.
Enumeration areas, which were selected at the first stage of sampling, were canvassed;
that is agricultural households counts were made within EA and recorded on a listing
form. Based on the quick canvassing operations, a list of holders was prepared and the
number of farms for each holder recorded. From the listing record of holders for each
sample EA, a systematic sample of fifteen (15) holders was taken. The holders selected
constituted the sample of farming households that were interviewed.
For the third stage sampling, the basic frame consisted of rice and cassava farms for
holders selected at the second stage. From the listing record of rice and cassava farms a

sample of eight (8) farms for rice and five (5) farms for cassava were selected for area
measurement. The selection of these farms was done using systematic sampling.
For the ultimate stage of sampling, the basic frame consisted of a list of rice and cassava
farms selected at the third stage for measurement. A sample of five (5) farms for rice
and three (3) farms for cassava was taken using simple random sampling without
replacement. The farms selected constituted the sample of farms for yield estimates.
Conventional survey method was used with a well-prepared questionnaire and forms
including field manual. Different forms and questionnaires used include Enumeration
Area Listing Form, Farm Measurement Form, Holders and Crop Cutting Questionnaires
Area and Yield Measurements: Enumerators were provided with GPSs. which were
used to take measurements of the farms by taking coordinates of the parameters of the
farms. Circular plots were laid using a twine of 5 feet long for rice and 7 feet long for
cassava as radius of the circle. The entire crops in the sample plots in each farm were
carefully harvested in single day. The total harvests were weighed and the weight
recorded using drying method for rice. Fresh weight for cassava was taken.

PART 2: National Estimates
2.1. Rice and Cassava Production
Table 2.1 below presents the production for both paddy and fresh cassava in Liberia
for 2008/2009. According to the table, total production (both rice and cassava) was
estimated at 775,290 metric tons with an increase of 30.9 percent on the total of
592,430 metric tons in 2001 and of 9.4 percent on the total of 708,470 metric tons
during the pre-war (1988).
The production of rice was estimated at 279,000 Metric tons (paddy) during the
2008/2009 crop season in Liberia. This estimate was 6.6 percent less than pre-war
(1988) when 298,630 metric tons were produced and 27.4 percent more than 2001
when 219,040 metric tons were produced. An estimated land area of rice harvested
was 222,670 hectares with an average yield of 1,253 kilograms per hectare. This
estimate was 30.6 percent more than 2001 and 5.6 percent less than pre-ward (1988)
when 170,480 and 235,760 hectares were harvested respectively.
The production of cassava was estimated at 496,290 metric tons during the 2008/2009
crops season. This estimate was 21.1 percent and 32.9 percent more than pre-war
(1988) and 2001 when 409,840 metric tons and 373,390 metric tons were produced
respectively. Area of cassava harvested was estimated at 57.360 hectares with an
average yield of 8,652 kilograms. This estimate was 19.7 percent and 10.0 percent
more than 2001 and pre-war (1988) when 47,930 and 52,160 hectares were harvested
respectively.
Table 2.1 further shows that total number of farms (both rice and cassava) was
349,380 with an increase of 43.5 percent on the total of 243,450 farms in 2001 and of
18.4 percent on the total number of 295,060 farms during the pre-war (1988).
According to the results of the survey, the total number of rice farms reported was
231,650. This estimate is about 61 percent of 2001 and 28 percent of pre-war (1988).
The average farm size for rice is about 1.2 hectares. The number of cassava farms
reported in 2008 was estimated at 117,730. This estimate is about 18.7 percent and
3.2 percent more than 2001 and pre-war (1988) respectively.

Table 2.1: Rice and Cassava Production, Liberia
CROPS/AREA UNIT YEAR PERCENT CHANGE
2008 2001 1988 2001 1988
Production
Paddy Rice Metric tons 279,000 219,040 298,630 27.4 (6.6)
Fresh Cassava Metric tons 496,290 373,390 409,840 32.9 21.1
Total Metric tons 775,290 592,430 708,470 30.9 9.4
Area Harvested
Rice Hectares 222,670 170,480 235,760 30.6 (5.6)
Cassava Hectares 57,360 47,930 52,160 19.7 10.0
Total Hectares 280,030 218,410 287,920 28.2 (2.7)
Yields per Hectare
Rice Kilograms 1,253 1,285 1,270 (2.3) (1.6)
Cassava Kilograms 8,652 7,790 7,860 5.0 4.1
Farms
Rice Farms Number 231,650 144,240 181,030 60.6 28.0
Cassava Farms Number 117,730 99,210 114,030 18.7 3.2
Total Number 349,380 243,450 295,060 43.5 18.4
2.2. Livestock and Poultry Production
Animal rearing in Liberia is not well institutionalized. Most of the livestock and poultry
enumerated were produced in the backyards of the traditional farmers. The table 2.2
below shows the results of the survey on livestock and poultry production. According
to the table, total heads of livestock were estimated at 234,920. This estimate was 8.4
percent less than pre-war (1988) when 256,500 heads of livestock were reported.
The heads of cattle reared were estimated at 8,370. Other estimates included 63,460
heads of goats, 43,270 sheep, 77,720 pigs and 42,100 rabbits. The heads of cattle
estimated were 43.6 percent less than pre-war (1988), heads of goats estimated were
50.7 less, and heads of sheep were 28.6 percent less than pre-war (1988). On the other
hand, there was a significant increase as compared to pre-war (1988) in the number of
pigs by 48.2 percent.
Poultry is raised in the backyards by most farm families on a free range basis. It is the
most common domestic birds reared in the country mainly for household consumption
and for cash. The most common poultry are chickens and ducks. Heads of poultry were
estimated at 828,680 showing an increase of 8.7 percent as compared to pre-war
(1988). Heads of chickens raised were estimated at 785,010, indicated 8.5 percent
more than pre-war when 723,390 heads were reported and heads of ducks raised
were estimated at 43,670 with an increase of 11.4 percent compared to pre-war
(1988) when 39,190 heads were reported.
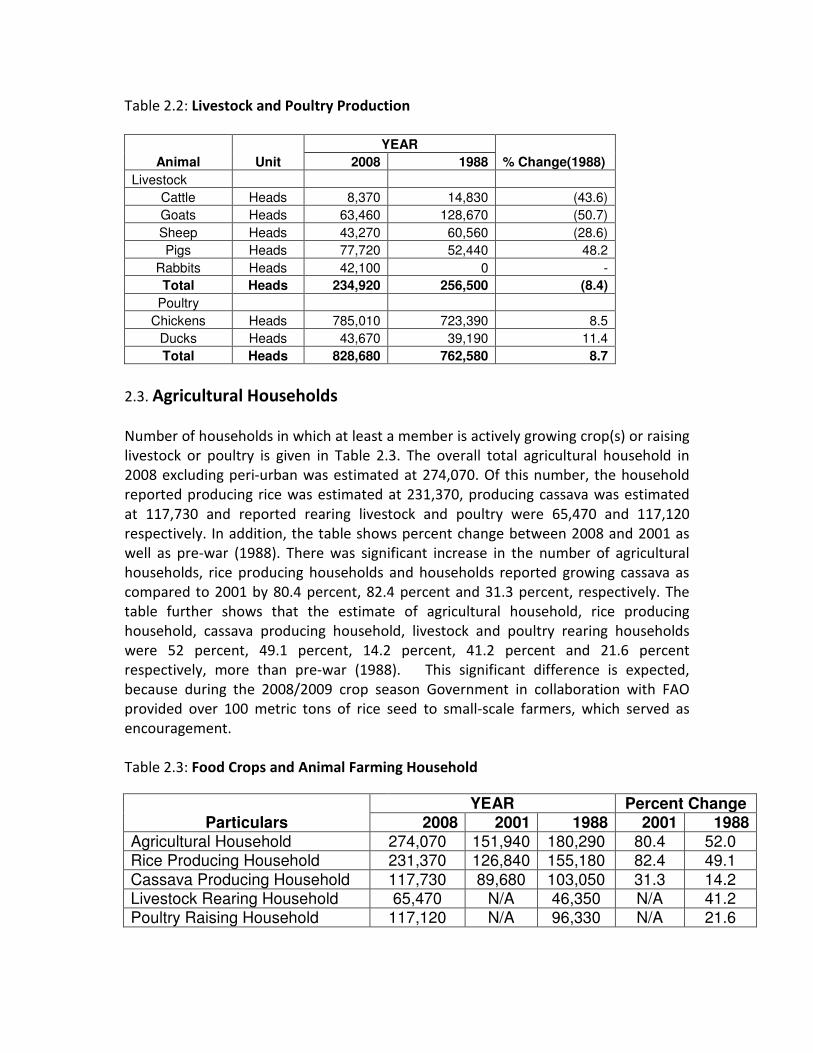
Table 2.2: Livestock and Poultry Production
Animal Unit
YEAR % Change(1988) 2008 1988
Livestock
Cattle Heads 8,370 14,830 (43.6)
Goats Heads 63,460 128,670 (50.7)
Sheep Heads 43,270 60,560 (28.6)
Pigs Heads 77,720 52,440 48.2
Rabbits Heads 42,100 0 -
Total Heads 234,920 256,500 (8.4)
Poultry
Chickens Heads 785,010 723,390 8.5
Ducks Heads 43,670 39,190 11.4
Total Heads 828,680 762,580 8.7
2.3. Agricultural Households
Number of households in which at least a member is actively growing crop(s) or raising
livestock or poultry is given in Table 2.3. The overall total agricultural household in
2008 excluding peri-urban was estimated at 274,070. Of this number, the household
reported producing rice was estimated at 231,370, producing cassava was estimated
at 117,730 and reported rearing livestock and poultry were 65,470 and 117,120
respectively. In addition, the table shows percent change between 2008 and 2001 as
well as pre-war (1988). There was significant increase in the number of agricultural
households, rice producing households and households reported growing cassava as
compared to 2001 by 80.4 percent, 82.4 percent and 31.3 percent, respectively. The
table further shows that the estimate of agricultural household, rice producing
household, cassava producing household, livestock and poultry rearing households
were 52 percent, 49.1 percent, 14.2 percent, 41.2 percent and 21.6 percent
respectively, more than pre-war (1988). This significant difference is expected,
because during the 2008/2009 crop season Government in collaboration with FAO
provided over 100 metric tons of rice seed to small-scale farmers, which served as
encouragement.
Table 2.3: Food Crops and Animal Farming Household
Particulars YEAR Percent Change
2008 2001 1988 2001 1988 Agricultural Household 274,070 151,940 180,290 80.4 52.0 Rice Producing Household 231,370 126,840 155,180 82.4 49.1
Cassava Producing Household 117,730 89,680 103,050 31.3 14.2 Livestock Rearing Household 65,470 N/A 46,350 N/A 41.2 Poultry Raising Household 117,120 N/A 96,330 N/A 21.6

2.4. Heads of Agricultural Households
The total number of heads of agricultural households was estimated at 274,070
excluding peri-urban farmers. Of the total heads, 197,580 persons were males (72.1 %)
and 76,490 persons were females (27.9 %). Ages of agricultural households’ heads
were collected and analyzed. Table 2.4 below depicts the age distribution. According
to the table the age group 30 – 39 years had the largest proportional share to the total
with 24.7 percent, followed by the age group 40 – 49 years with 23.8 percent and age
group 20 – 29 years (18.3 %). As expected, young people below age 20 years had the
smallest proportion of agricultural household heads (2.5 %)
The Table further depicts the percentage share of male and female heads of
households within age group. Of the total households’ heads age less than 20, males
were 69 percent and females 31 percent. For the ages 20 – 29 years males were 76
percent and females 24 percent, 30 – 39 years, males were 73 percent and females 27
percent, 40 – 49 years males were 74 percent and females 26 percent and 50 – 59
years males were 70 percent and females 30 percent
Table 2.4: Heads of Agricultural Households by age and sex, Liberia
Liberia/Age Category
Agricultural Households Heads
Both Sexes Male Female Male - Female
Ratio (%)
Number Percent Number Percent Number Percent Male Female
Total 274,070 100.0 197,580 100.0 76,490 100.0 72.1 27.9
< 20 Years 6,850 2.5 4,740 2.4 2,110 2.8 69.2 30.8
20 -29 Years 50,160 18.3 38,130 19.3 12,030 15.7 76.0 24.0
30 - 39 Years 67,690 24.7 49,590 25.1 18,100 23.7 73.3 26.7
40 - 49 Years 65,230 23.8 48,010 24.3 17,220 22.5 73.6 26.4
50 - 59 Years 41,660 15.2 29,050 14.7 12,610 16.5 69.7 30.3
60 Years & over 42,480 15.5 28,060 14.2 14,420 18.9 66.1 33.9
2.5. Members of Agricultural Households
The population living in agricultural households was collected and analyzed. Table 2.5
below presents the results. Overall, members of the agricultural households were
estimated 1,567,650. Of this estimate, 50.1 percent were males and 49.9 percent
females. The table depicts the broad age distribution of the households’ members.
According to the table members with age less than 10 years accounted for 28.2
percent of the total agricultural members, followed by the age groups 10 – 19 years
with 25.7 percent and 20 – 29 years with 18.3 percent. On the other hand, the age
groups with fewer members in relative terms are 50 – 59 years, 60 years+, 30 – 39
years and 40 – 49 years. These groups combined accounted for 27.8 percent.
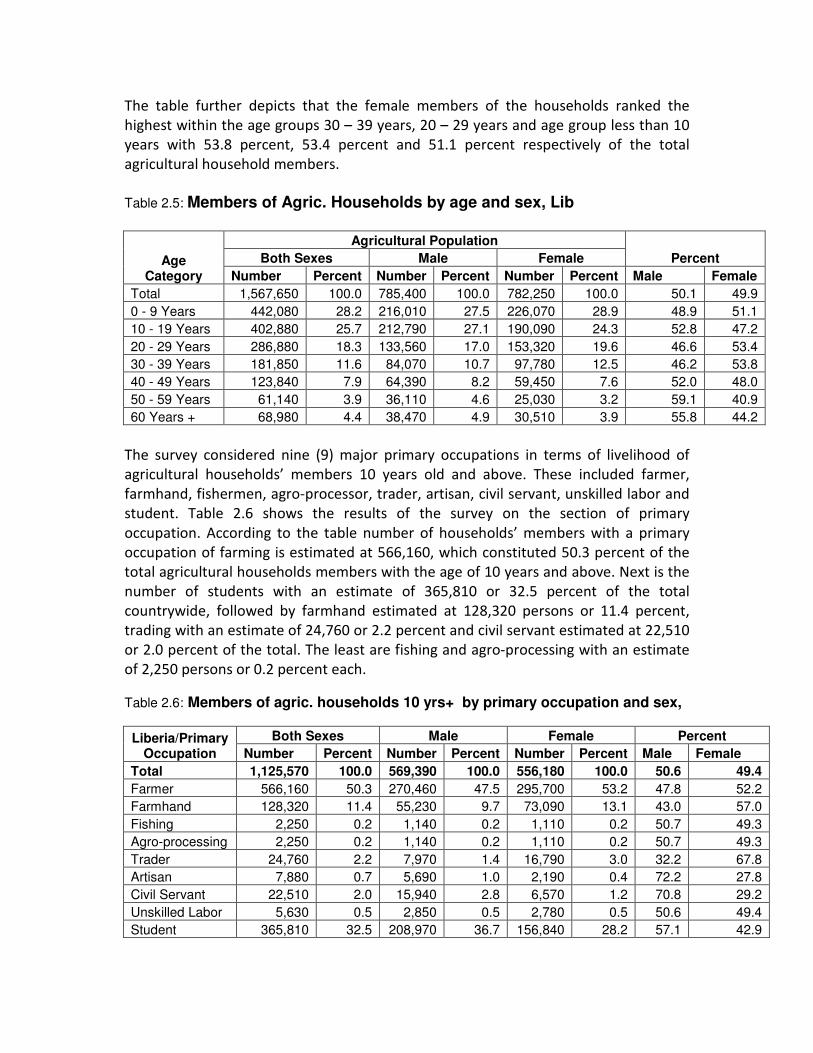
The table further depicts that the female members of the households ranked the
highest within the age groups 30 – 39 years, 20 – 29 years and age group less than 10
years with 53.8 percent, 53.4 percent and 51.1 percent respectively of the total
agricultural household members.
Table 2.5: Members of Agric. Households by age and sex, Lib
Age Category
Agricultural Population
Percent Both Sexes Male Female
Number Percent Number Percent Number Percent Male Female
Total 1,567,650 100.0 785,400 100.0 782,250 100.0 50.1 49.9
0 - 9 Years 442,080 28.2 216,010 27.5 226,070 28.9 48.9 51.1
10 - 19 Years 402,880 25.7 212,790 27.1 190,090 24.3 52.8 47.2
20 - 29 Years 286,880 18.3 133,560 17.0 153,320 19.6 46.6 53.4
30 - 39 Years 181,850 11.6 84,070 10.7 97,780 12.5 46.2 53.8
40 - 49 Years 123,840 7.9 64,390 8.2 59,450 7.6 52.0 48.0
50 - 59 Years 61,140 3.9 36,110 4.6 25,030 3.2 59.1 40.9
60 Years + 68,980 4.4 38,470 4.9 30,510 3.9 55.8 44.2
The survey considered nine (9) major primary occupations in terms of livelihood of
agricultural households’ members 10 years old and above. These included farmer,
farmhand, fishermen, agro-processor, trader, artisan, civil servant, unskilled labor and
student. Table 2.6 shows the results of the survey on the section of primary
occupation. According to the table number of households’ members with a primary
occupation of farming is estimated at 566,160, which constituted 50.3 percent of the
total agricultural households members with the age of 10 years and above. Next is the
number of students with an estimate of 365,810 or 32.5 percent of the total
countrywide, followed by farmhand estimated at 128,320 persons or 11.4 percent,
trading with an estimate of 24,760 or 2.2 percent and civil servant estimated at 22,510
or 2.0 percent of the total. The least are fishing and agro-processing with an estimate
of 2,250 persons or 0.2 percent each.
Table 2.6: Members of agric. households 10 yrs+ by primary occupation and sex,
Liberia/Primary Occupation
Both Sexes Male Female Percent
Number Percent Number Percent Number Percent Male Female
Total 1,125,570 100.0 569,390 100.0 556,180 100.0 50.6 49.4
Farmer 566,160 50.3 270,460 47.5 295,700 53.2 47.8 52.2
Farmhand 128,320 11.4 55,230 9.7 73,090 13.1 43.0 57.0
Fishing 2,250 0.2 1,140 0.2 1,110 0.2 50.7 49.3
Agro-processing 2,250 0.2 1,140 0.2 1,110 0.2 50.7 49.3
Trader 24,760 2.2 7,970 1.4 16,790 3.0 32.2 67.8
Artisan 7,880 0.7 5,690 1.0 2,190 0.4 72.2 27.8
Civil Servant 22,510 2.0 15,940 2.8 6,570 1.2 70.8 29.2
Unskilled Labor 5,630 0.5 2,850 0.5 2,780 0.5 50.6 49.4
Student 365,810 32.5 208,970 36.7 156,840 28.2 57.1 42.9

Figure 2.1 displays the percent of male and female household members having
primary occupation. Of the household members involved in farming, female accounted
for more than half (52.2 %) and males were 47.8 percent. For the farmhand, females
57 percent and males were 43 percent; fishing, males 50.7 percent and females 49.3
percent; trading, females 67.8 percent and males 32.2 percent; civil servant, males
70.8 percent, females 29.2 percent and for unskilled labor, males 50.6 percent and
females 49.6 percent. Clearly, in relative terms there were more females in farming,
farmhand and trading compared to males. On the other hand, there were more males
in fishing, agro-processing, artisan and civil servant than females.
Figure 2.1: Percent Distribution of Agric. Household Members by Primary Occupation
0.010.020.030.040.050.060.070.080.0
Pe
rce
nta
ge
Primary Occupation
Male
Female
2.6. Cereal (Rice) Balance Sheet
Table 2.7 below presents information on the account of rice utilization and supply,
imports and consumption in 2008. Of the total rice consumption in 2008, Liberian
farmers supplied 38.3 percent and the balance 61.7 percent was imported. The volume
of rice imported for the period from January to December in 2008 was recorded at
341,284.5 metric tons. Of this quantity, 6,194.15 metric tons were non-commercial,
and the balance 335,090.35 metric tons were commercial.
From the total of actual harvested production, losses and seed rice for the following
year were calculated. An average of 10 percent of the actual harvest (rough rice) never
reached to the process of milling, which represented post harvest losses. In addition,
average of 2 percent of the available paddy is retained for seed. Thus, after seed
retention and losses, paddy rice available for consumption was estimated at 245,520
metric tons. Using the milling rate of 65 percent, quantity of local rice milled was
calculated at 159,590 metric tons, which constituted 38.3 percent of total requirement

for rice. Total requirement was estimated at 417,190 metric tons; thus, the balance
257,190 metric tons were made available from imported rice. The closing stock as of
December 30th
2008 was 83,684.5 metric tons. All of this quantity was kept by business
traders.
Table 2.7: Cereal (Rice) Balance Sheet
ITEMS UNIT 2008
Population Number 3,476,608*
DISPOSITION
Total Production (Paddy) Metric tons 279,000
Losses (10%) Metric tons 27,900
Seed Rice Retention (2 %) Metric tons 5,580
Paddy available for consumption Metric tons 245,520
Local rice milled (65% of paddy) Metric tons 159,590
Per Capita Consumption Kilograms 120***
Needs – Requirement for 2008 Metric tons 417,190
Deficit (61.7 %) Metric tons 257,600
IMPORTATION**
Commercial Metric tons 335,090.35
Non-commercial Metric tons 6,194.15
Total Metric tons 341,284.5
Consumption Metric tons 257,600
Balance stock Metric tons 83,684.5
* LISGIS, ** Ministry of Commerce
*** Average annual consumption of rice producers, urban dwellers and both
Urban and rural dwellers

PART 3: County Estimates
3.1: Introduction
The agricultural sector remains the most sustainable source of income and major
contributor to employment for rural population. A specific question was asked about
rice and cassava cultivation, livestock and poultry rearing and rural households
involved in agricultural activities at the county level. The results of the analysis are
presented in this section
3.2. Rice Production
Table 3.1 shows volume of paddy produced and area cultivated for rice in 2008.
According to the table, a total of 279,000 metric tons of rough rice (paddy) was
produced in 2008, which is about 93.4 percent of its pre-war level when production
was estimated at 298,760 metric tons. Rice, Liberian principal staple food is produced
at a subsistence level primarily for consumption.
The table shows that Nimba, Bong and Lofa counties ranked the highest in the 2008
rice production with 55,880 (20.0 %) metric tons, 46,760 (16.8 %) metric tons and
41,710 (14.9 %) metric tons respectively. The combined estimates of these three
counties accounted for more than half (51.7%) of the total production, followed by
Gbarpolu with 5.5 percent and Grand Gedeh with 5.0 percent of the total production.
Next to these counties were Grand Bassa (4.7 %), Bomi (4.6 %), Sinoe (4.4 %) and
Maryland (4.1 %). The rest of the counties have a percent share of the total production
ranging from 2.4 percent to 3.8 percent.
Overall average production per rice household was estimated at 1.2 metric tons.
According to the table, rice production per rice household was relatively high in Bomi,
Bong and Gbarpolu counties with 1.5 metric tons each. Next were four counties: Lofa,
Maryland, River Gee and Sinoe with 1.4 metric tons each followed by Grand Cape
Mount and Grand Gedeh counties with 1.3 metric tons each. The least were
Montserrado and Margibi counties with 0.8 metric tons each. The rest of the counties
ranged from 0.9 to 1.1 metric tons.
The table further presents the total number of rice farms and hectares. According to
the table, number of rice farms was estimated at 231,650. Of this number three (3)
counties cultivated the highest number of farms, namely: Nimba, Bong and Lofa
reported having 56,570, 30,270 and 29,970 farms respectively. The combined
estimates of the three counties constitute 50.4 percent of the total number of farms.
Next was Grand Bassa with 14,660, Montserrado with 11,400 and Margibi with 11,150
farms, followed by Gbarpolu and Grand Gedeh with 10,700 and 10,500 farms
respectively. The least was River Cess County with 6,320 farms. The rest of the
counties reported number of farms ranged from 7,240 to 9,060.

The Area of rice harvested during the 2008 crop year was estimated at 222,670
hectares with an average farm size of 1.2 hectares. Nimba, Lofa and Bong counties had
the largest harvested areas of rice with 46,180 (20.7%) hectares, 34,190 (15.4%)
hectares and 34,130 (15.3%) hectares respectively. Next were Gbarpolu and Grand
Bassa counties with 12,440 (5.6%) hectares each, followed by Grand Gedeh with
11,230 (5.0%) hectares, Bomi 9,730 (4.4%) hectares and Sinoe with 8,950 (4.0%). The
county with the least harvested area was River Cess with 5,960 (2.7%) hectares.
Table 3.1: Area under Rice Cultivation, Yields per Hectare, and Production by County
COUNTY
RICE % of Tot.
Prod. Prod per rice
Household(mt) Hectares % of Tot. Farm Ha/Farm Yields/Ha(Kg)
Prod. (Mt)
Bomi 9,730 4.4 8,780 1.25 1,310 12,740 4.6 1.5
Bong 34,130 15.3 30,270 1.31 1,370 46,760 16.8 1.5
Gbarpolu 12,440 5.6 10,700 1.43 1,240 15,430 5.5 1.5
Grd. Bassa 12,440 5.6 14,660 1.14 1,050 13,060 4.7 0.9
Cape Mount 8,370 3.8 8,470 1.32 1,280 10,710 3.8 1.3
Grd. Gedeh 11,230 5.0 10,500 1.18 1,230 13,810 5.0 1.3
Grd. Kru 7,350 3.3 8,500 1.13 1,360 9,990 3.6 1.2
Lofa 34,190 15.4 29,970 1.37 1,220 41,710 14.9 1.4
Margibi 7,520 3.4 11,150 0.9 1,240 9,320 3.3 0.8
Maryland 8,270 3.7 8,060 1.21 1,380 11,410 4.1 1.4
Montserrado 7,920 3.6 11,400 0.88 1,180 9,350 3.4 0.8
Nimba 46,180 20.7 56,570 1 1,210 55,880 20.0 1.0
River Cess 5,960 2.7 6,320 1.15 1,120 6,670 2.4 1.1
River Gee 7,990 3.6 7,240 1.31 1,240 9,900 3.5 1.4
Sinoe 8,950 4.0 9,060 1.18 1,370 12,260 4.4 1.4
TOTAL/AV. 222,670 100.0 231,650 1.18 1,253 279,000 100.0 1.2
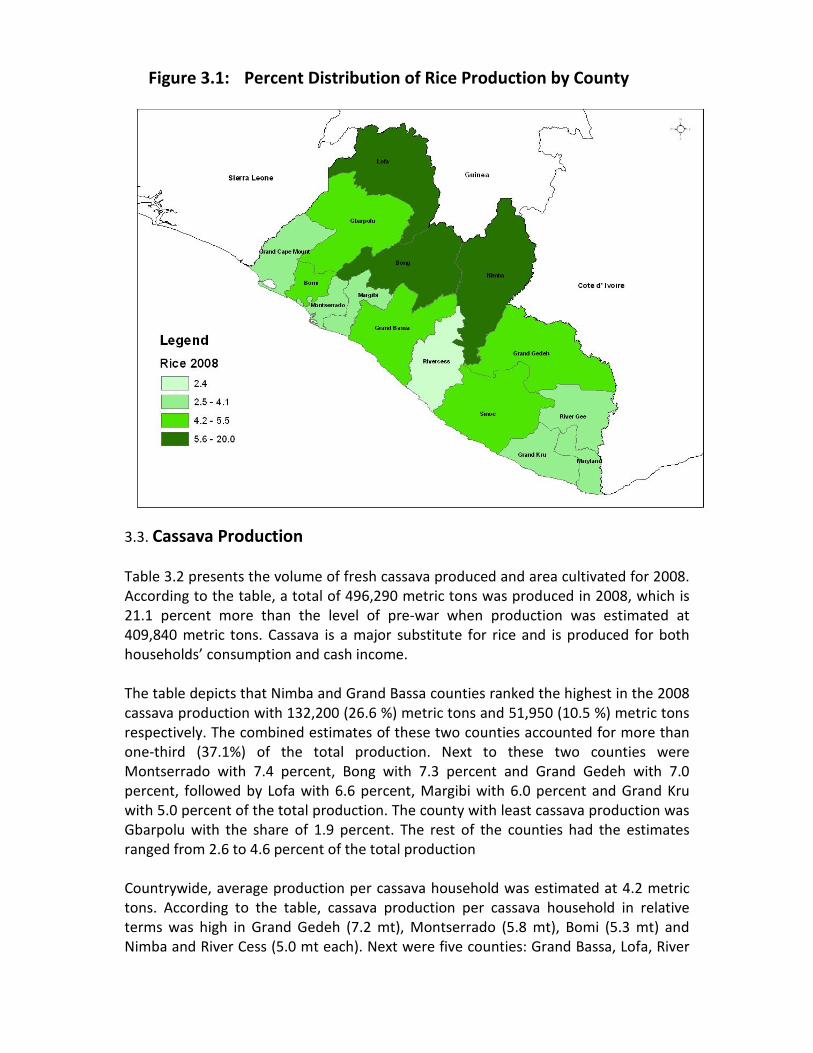
3.3. Cassava Production
Table 3.2 presents the volume of fresh cassava produced and area cultivated for 2008.
According to the table, a total of 496,290 metric tons was produced in 2008, which is
21.1 percent more than the level of pre-war when production was estimated at
409,840 metric tons. Cassava is a major substitute for rice and is produced for both
households’ consumption and cash income.
The table depicts that Nimba and Grand Bassa counties ranked the highest in the 2008
cassava production with 132,200 (26.6 %) metric tons and 51,950 (10.5 %) metric tons
respectively. The combined estimates of these two counties accounted for more than
one-third (37.1%) of the total production. Next to these two counties were
Montserrado with 7.4 percent, Bong with 7.3 percent and Grand Gedeh with 7.0
percent, followed by Lofa with 6.6 percent, Margibi with 6.0 percent and Grand Kru
with 5.0 percent of the total production. The county with least cassava production was
Gbarpolu with the share of 1.9 percent. The rest of the counties had the estimates
ranged from 2.6 to 4.6 percent of the total production
Countrywide, average production per cassava household was estimated at 4.2 metric
tons. According to the table, cassava production per cassava household in relative
terms was high in Grand Gedeh (7.2 mt), Montserrado (5.8 mt), Bomi (5.3 mt) and
Nimba and River Cess (5.0 mt each). Next were five counties: Grand Bassa, Lofa, River
Figure 3.1: Percent Distribution of Rice Production by County

Gee, Margibi and Grand Kru with 4.8 metric tons, 4.6 metric tons, 4.5 metric tons, 4.4
metric tons and 4.3 metric tons respectively; followed by Maryland and Grand Cape
Mount counties with 3.5 metric tons and 3.4 metric tons respectively. The least were
Gbarpolu with 2.0 metric tons, Bong with 2.1 metric tons and Sinoe with 2.4 metric
tons.
The table further presents the total number of cassava farms and hectares. According
to the table, number of cassava farms cultivated was estimated at 117,730. Of this
number three (3) counties cultivated the highest number of farms, namely: Nimba,
Bong and Grand Bassa reported having 26,530, 17,480 and 10,790 farms respectively.
The combined estimates of the three counties constituted more than two-fifth (46.5
%) of the total number of farms. Next were Lofa with 7.020 farms, Margibi 6,830 farms
and Montserrado with 6,290 farms, followed by Grand Kru, Maryland and Sinoe
counties with 5,760, 5,490 and 5,300 farms respectively. The County with the least
number of farms was River Gee with 3,490 farms.
The Area harvested for cassava during the 2008 crop year was estimated at 57,360
hectares with an average farm size of 0.5 hectares. Nimba and Grand Bassa counties
had the largest harvested areas of cassava with 13,530 (23.6 %) hectares and 6,040
(10.5 %) hectares. Next were Bong, Grand Gedeh and Montserrado counties with
5,070 (8.8 %) hectares, 3,990 (7.0 %) and Montserrado with 3,900 (6.8 %), followed by
Lofa with 3,300 (5.8) hectares, Margibi with 3,140 (5.5 %) and Grand Kru with 2,590
(4.5 %) hectares. The counties with the least harvested areas were River Cess and
Sinoe with 2,110 (3.7%) hectares and 2,120 (3.7 %) hectares respectively.
Table 3.2: Area under Cassava Cultivation, Yields per Hectare, and Production by County
COUNTY
CASSAVA
% of Tot. Production.
Prod/ cassava
Hhold(MT) Hectares % of Tot. Farm Ha/Farm Yields/Ha(Kg) Prod.(Mt)
Bomi 2,200 3.8 4,310 0.51 7,110 23,050 4.6 5.3
Bong 5,070 8.8 17,480 0.29 7,160 36,320 7.3 2.1
Gbarpolu 2,190 3.8 4,660 0.47 7,790 9,300 1.9 2.0
Grd. Bassa 6,040 10.5 10,790 0.56 8,600 51,950 10.5 4.8
Cape Mount 2,510 4.4 4,830 0.52 6,510 16,350 3.3 3.4
Grd. Gedeh 3,990 7.0 4,810 0.83 8,650 34,480 7.0 7.2
Grd. Kru 2,590 4.5 5,760 0.45 9,640 24,990 5.0 4.3
Lofa 3,300 5.8 7,020 0.47 9,900 32,540 6.6 4.6
Margibi 3,140 5.5 6,830 0.46 9,500 29,830 6.0 4.4
Maryland 2,470 4.3 5,490 0.45 7,860 19,410 3.9 3.5
Montserrado 3,900 6.8 6,290 0.62 6,220 36,710 7.4 5.8
Nimba 13,530 23.6 26,530 0.51 9,770 132,200 26.6 5.0
River Cess 2,110 3.7 4,140 0.51 9,730 20,560 4.1 5.0
River Gee 2,200 3.8 3,490 0.63 7,250 15,830 3.2 4.5
Sinoe 2,120 3.7 5,300 0.4 7,050 12,770 2.6 2.4
TOTAL/AV. 57,360 100.0 117,730 0.512 8,183 496,290 100.0 4.2
3.4. Rice and Cassava Producing Households
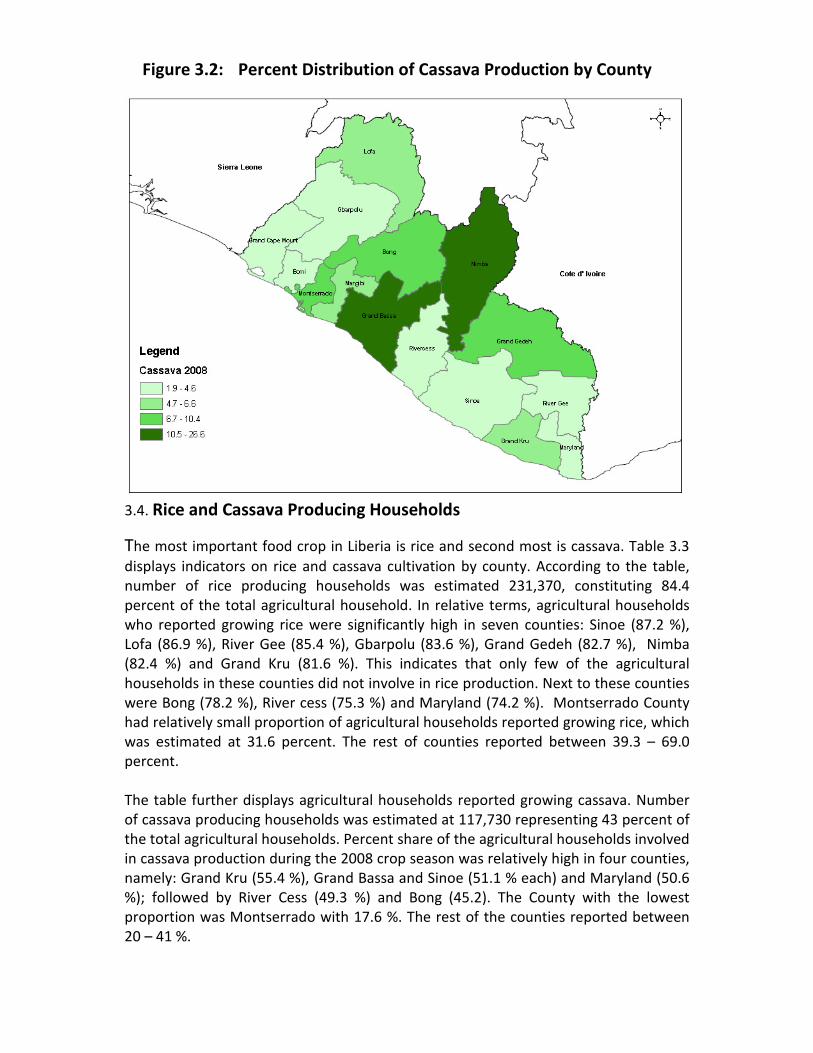
The most important food crop in Liberia is rice and second most is cassava. Table 3.3
displays indicators on rice and cassava cultivation by county. According to the table,
number of rice producing households was estimated 231,370, constituting 84.4
percent of the total agricultural household. In relative terms, agricultural households
who reported growing rice were significantly high in seven counties: Sinoe (87.2 %),
Lofa (86.9 %), River Gee (85.4 %), Gbarpolu (83.6 %), Grand Gedeh (82.7 %), Nimba
(82.4 %) and Grand Kru (81.6 %). This indicates that only few of the agricultural
households in these counties did not involve in rice production. Next to these counties
were Bong (78.2 %), River cess (75.3 %) and Maryland (74.2 %). Montserrado County
had relatively small proportion of agricultural households reported growing rice, which
was estimated at 31.6 percent. The rest of counties reported between 39.3 – 69.0
percent.
The table further displays agricultural households reported growing cassava. Number
of cassava producing households was estimated at 117,730 representing 43 percent of
the total agricultural households. Percent share of the agricultural households involved
in cassava production during the 2008 crop season was relatively high in four counties,
namely: Grand Kru (55.4 %), Grand Bassa and Sinoe (51.1 % each) and Maryland (50.6
%); followed by River Cess (49.3 %) and Bong (45.2). The County with the lowest
proportion was Montserrado with 17.6 %. The rest of the counties reported between
20 – 41 %.
Figure 3.2: Percent Distribution of Cassava Production by County

Table 3.3: Rice and Cassava Producing Households by County
COUNTY
RICE CASSAVA
Households
Farn/100 HH
Households
Farm/100 HH Number
As % Agric Number
As % Agric HH
Bomi 8,760 62.8 100 4,310 30.9 100
Bong 30,260 78.2 100 17,480 45.2 100
Gbarpolu 10,630 83.6 101 4,660 36.7 100
Grand. Bassa 14,550 69.0 101 10,790 51.1 100
Grd Cape Mount 8,460 67.9 100 4,830 38.8 100
Grand. Gedeh 10,490 82.7 100 4,810 37.9 100
Grand. Kru 8,490 81.6 100 5,760 55.4 100
Lofa 29,960 86.9 100 7,020 20.4 100
Margibi 11,140 39.3 100 6,830 24.1 100
Maryland 8,050 74.2 100 5,490 50.6 100
Montserrado 11,400 31.6 100 6,290 17.5 100
Nimba 56,570 82.4 100 26,530 38.6 100
River Cess 6,320 75.3 100 4,140 49.3 100
River Gee 7,240 85.4 100 3,490 41.2 100
Sinoe 9,050 87.2 100 5,300 51.1 100
TOTAL/AV. 231,370 84.4 100 117,730 43.0 100
3.5. Livestock and Poultry Rearing Households
Nearly all of the livestock and poultry are produced in the backyards through the
system of free range. There are few livestock importers who are primarily importing
for immediate slaughtering. These importers were not considered in the data
collection and analysis. Table 3.4 presents the number of traditional households
reported rearing livestock and raising poultry. According to the table, number of
agricultural households rearing livestock was estimated at 65,470, constituting 23.9
percent of the total agricultural households. Proportions of the agricultural households
rearing livestock were relatively high in Grand Kru, Nimba and Grand Gedeh counties.
More than half (57.6 %) of the agricultural households reported rearing livestock in
Grand Kru County and more than two-fifth (43.4 %) and (40.6 %) of the agricultural
households reported rearing livestock in Grand Gedeh and Nimba respectively,
followed by Bong (31.9 %), Sinoe (31.6 %) and River Gee (26.6 %). Counties with the
least proportions were Bomi (2.4 %), Gbarpolu (4.2 %), Grand Bassa (4.7 %) and River
Cess (5.9 %). The rest of the counties reported between 6 – 20 %.
Poultry raising is very popular in the rural communities. As a traditional poultry, it is
primarily used to supplement household diet and sometimes sold for cash. According
to the table, the number of households reported raising poultry was estimated at
117,120, representing 42.7 percent of the total agricultural households. Percent share
of agricultural households raising poultry was significantly high with 94.6 percent,
followed by Grand Kru and Sinoe with 79 percent and 68.7 percent respectively. The

County with the lowest proportion was Bomi (2.1 %). The rest of the counties reported
between 13 – 58 %.
Table 3.4: Livestock and Poultry Rearing Households by County
COUNTY
Livestock Households Poultry Households Number of Animals
Number % of Agric Hh Number % Agric Hh Livestock Poultry
Bomi 260 2.4 230 2.1 1,080 1,620
Bong 10,890 31.9 19,880 58.2 37,570 102,310
Gbarpolu 480 4.2 2,950 25.7 2,180 15,760
Grd. Bassa 850 4.7 2,340 13.0 2,860 17,220
Grd Cape Mount 1,160 11.8 3,340 34.1 3,040 24,830
Grd. Gedeh 4,610 40.6 10,740 94.6 14,040 76,760
Grd. Kru 5,240 57.6 7,190 79.0 15,040 52,950
Lofa 3,760 11.4 12,620 38.1 13,430 91,740
Margibi 980 6.1 5,460 33.8 4,990 39,570
Maryland 1,960 20.0 2,170 22.1 7,600 16,310
Montserrado 3,320 13.7 12,880 53.2 9,610 94,640
Nimba 26,290 43.4 24,590 40.6 102,540 180,360
River Cess 440 5.9 1,480 20.0 2,100 10,460
River Gee 2,160 26.6 4,590 56.5 6,520 57,240
Sinoe 3,070 31.6 6,660 68.7 12,320 46,910
TOTAL/AV. 65,470 23.9 117,120 42.7 234,920 828,680
Tables 3.5a & 3.5b display the number of household rearing livestock by type. Of the
total livestock households, proportions of households reported rearing cattle were
high in Bomi (26.9 %) and Grand Kru (21.6 %), followed by Margibi (14.3 %), Bong (13.3
%), River Cess (11.4 %) and Nimba (11.0 %). The counties with the least proportions
were Montserrado (2.4 %) and River Gee (3.2 %). The rest of the counties reported
between 4.3 – 9.4 %.
Proportions of livestock households reported rearing goats were significantly high in
Grand Bassa (85.9 %) and Grand Gedeh (84.6 %), followed by River Gee and Maryland
with 78.7 percent and 71.4 percent respectively. The county with the least proportion
of goat households was Grand Cape Mount with 4.3 percent of livestock households.
Half (50.0 %) of the livestock households reported rearing sheep in Gbarpolu County,
which was relatively the highest proportion. Next were three counties: Bomi (38.5 %),
Maryland (35.7 %) and Margibi (31.6 %). Counties with the least proportions were
Grand Bassa (3.5 %) and Grand Cape Mount (7.8 %).
The proportions of livestock households reported rearing pigs were relatively high in
Montserrado (60.5 %), Lofa (56.4 %), Bong (55.6 %), Margibi (54.5 %) and Grand Bassa
with 50.6 percent. The percent shares of livestock households reported rearing rabbits
were relatively high in River Cess, Grand Cape Mount and Gbarpolu with 45.5 percent
42.2 percent and 39.6 percent respectively. Next were Bong county with 21.9 percent

and Sinoe with 21.2 percent, followed by Grand Kru (17.4 %), Maryland (14.4 %) and
Lofa (14.1 %).
Table 3.5a: Households Raising Livestock by Type and by County
COUNTY
Cattle Households Goats Households Sheep Households
Number As % of Lstk Hh Number
As % of Lstk Hh Number
% of Lstk Hh
Bomi 70 26.9 30 11.5 100 38.5
Bong 1450 13.3 4,020 36.9 2,270 20.8
Gbarpolu 0 0.0 240 50.0 240 50.0
Grd. Bassa 0 0.0 730 85.9 30 3.5
Grd Cape Mount 50 4.3 50 4.3 90 7.8
Grd. Gedeh 320 6.9 3,900 84.6 980 21.3
Grd. Kru 1130 21.6 2,560 48.9 820 15.6
Lofa 270 7.2 2,160 57.4 730 19.4
Margibi 140 14.3 330 33.7 310 31.6
Maryland 140 7.1 1,400 71.4 700 35.7
Montserrado 80 2.4 440 13.3 680 20.5
Nimba 2890 11.0 11,840 45.0 6,350 24.2
River Cess 50 11.4 100 22.7 50 11.4
River Gee 70 3.2 1,700 78.7 570 26.4
Sinoe 290 9.4 840 27.4 390 12.7
TOTAL/%. 6950 10.6 30,340 46.3 14,310 21.9
Table 3.5b: Households Raising Livestock by Type, Co. cont.
COUNTY
Pigs Households Rabbits Households
Number As % of Lstk Hh Number % of Lstk Hh
Bomi 30 11.5 30 11.5
Bong 6,060 55.6 2,380 21.9
Gbarpolu 0 0.0 190 39.6
Grd. Bassa 430 50.6 - 0.0
Grd Cape Mount 0 0.0 490 42.2
Grd. Gedeh 280 6.1 270 5.9
Grd. Kru 770 14.7 910 17.4
Lofa 2,120 56.4 530 14.1
Margibi 534 54.5 30 3.1
Maryland 540 27.6 280 14.3
Montserrado 2,010 60.5 80 2.4
Nimba 12,760 48.5 2,180 8.3
River Cess 160 36.4 200 45.5
River Gee 80 3.7 210 9.7
Sinoe 1,470 47.9 650 21.2
TOTAL/% 27,244 41.6 8,430 12.9

3.6. Heads of Livestock
Table 3.6 shows the number of heads (traditional) of livestock. According to the table a
total of 234,920 heads of livestock was estimated. Of this estimate, 33.1 percent was
pigs, 27 percent goats, 18.4 percent sheep, 17.9 percent rabbits and 3.6 percent cattle.
Nimba County reported having more animals than the other counties with 43.6
percent of the total, followed by Bong County with 16.0 percent. The estimates of
these two counties accounted for 59.6 percent. Next higher livestock rearing counties
in relative term were Grand Kru with 6.4 percent, Grand Gedeh with 6.0 percent and
Lofa with 5.7 percent of total animals.
Nimba County ranked the highest for the county reported rearing cattle with 3,080
heads, goats with 25,440 heads, sheep with 19,090 heads and pigs with 44,080. For
the county reported rearing rabbits, Bong County ranked the highest with 11,950
heads, followed by Nimba with 10,850 heads, Grand Kru with 4,550 heads and Sinoe
with 3,230 heads.
Table 3.6: Heads of Livestock by Type and by County,
COUNTY
HEADS (Number) OF LIVESTOCK TOTAL
Cattle Goats Sheep Pigs Rabbits Number Percent
Bomi 450 70 290 110 160 1,080 0.5
Bong 1,450 8,830 6,790 8,550 11,950 37,570 16.0
Gbarpolu 0 480 730 - 970 2,180 0.9
Grd. Bassa 0 1,460 100 1,300 - 2,860 1.2
Grd Cape Mount 450 50 90 - 2,450 3,040 1.3
Grd. Gedeh 610 8,000 3,000 1,140 1,290 14,040 6.0
Grd. Kru 1,130 5,110 2,470 1,780 4,550 15,040 6.4
Lofa 330 4,330 2,760 3,350 2,660 13,430 5.7
Margibi 140 670 920 3,120 140 4,990 2.1
Maryland 140 2,870 2,030 1,160 1,400 7,600 3.2
Montserrado 80 880 2,040 6,210 400 9,610 4.1
Nimba 3,080 25,440 19,090 44,080 10,850 102,540 43.6
River Cess 150 200 100 660 990 2,100 0.9
River Gee 70 3,390 1,700 300 1,060 6,520 2.8
Sinoe 290 1,680 1,160 5,960 3,230 12,320 5.2
TOTAL 8,370 63,460 43,270 77,720 42,100 234,920 100.0
Percent of Total 3.6 27.0 18.4 33.1 17.9 100.0

3.7. Household Raising Poultry and number of Heads
The types of poultry considered in 2008 survey were chickens and ducks. Table 3.6
presents percent shares of poultry households reported raising chickens and ducks and
heads of poultry by type and county. According to the table, proportions of poultry
households reported raising chickens were significantly high in River Gee (99.3 %),
Grand Cape Mount (98.5 %), Grand Kru (97.6 %), Grand Bassa (97.4 %), Maryland
(96.8 %) and Grand Gedeh (96.4 %), followed by Lofa and Montserrado (96.0 % each),
Margibi (95.4 %), Nimba (93.5 %) and River Cess (93.2 %). The rest of the counties
ranged between 84.5 to 87 percent.
The proportions of Poultry households reported raising ducks were relatively high in
Sinoe (33.9 %) and Grand Gedeh (20.0 %). Next were Montserrado (18.6 %), Nimba
(18.5 %), Margibi (18.3 %) and Bong County with 17.9 percent. Gbarpolu had the least
agricultural households reported raising ducks having the proportional share of 1.7
percent. The rest of the county ranged from 2.4 to 13.5 percent.
Table 3.6 further provides number of heads of poultry by type and county. According
to the table total number of chickens was estimated at 785,010. Of this number,
Nimba County reported more with 21.3 of the total, followed by Bong, Montserrado
and Lofa with 12.4 percent, 11.7 percent and 10.8 percent respectively. Bomi County
reported raising the least with 0.2 percent of the total. The rest of the counties had the
proportional shares ranged 1.2 to 9.3 percent. The number of ducks was estimated at
43,670. Compared to the rest of the counties, Nimba County had the highest with 30.9
percent, followed by Lofa with 16 percent and Bong with 10.7 percent. Next were
Grand Gedeh with 8.7 percent, Margibi and Montserrado with 5.7 percent each and
Sinoe with 5.2 percent. The least were Bomi and Gbarpolu with 0.1 percent each. The
rest of the counties of the counties had the percent shares ranged from 1.8 to 4.1
percent.

Table 3.7: Households Raising Poultry and Number of Heads by County
COUNTY
Households Raising Chicken
Household Raising Duck Chicken Duck
Number % Poultry Hh Number
% of Poultry Hh Number Percent Number Percent
Bomi 200 87.0 30 13.0 1,590 0.2 30 0.1
Bong 16,790 84.5 3,550 17.9 97,620 12.4 4,690 10.7
Gbarpolu 2,510 85.1 50 1.7 15,710 2.0 50 0.1
Grd. Bassa 2,280 97.4 160 6.8 15,950 2.0 1,270 2.9
Cape Mount 3,290 98.5 450 13.5 23,050 2.9 1,780 4.1
Grd. Gedeh 10,350 96.4 2,150 20.0 72,980 9.3 3,780 8.7
Grd. Kru 7,020 97.6 910 12.7 51,870 6.6 1,080 2.5
Lofa 12,120 96.0 1,700 13.5 84,750 10.8 6,990 16.0
Margibi 5,210 95.4 1,000 18.3 37,060 4.7 2,510 5.7
Maryland 2,100 96.8 210 9.7 14,700 1.9 1,610 3.7
Montserrado 12,360 96.0 2,400 18.6 92,160 11.7 2,480 5.7
Nimba 22,980 93.5 4,550 18.5 166,860 21.3 13,500 30.9
River Cess 1,380 93.2 100 6.8 9,670 1.2 790 1.8
River Gee 4,560 99.3 110 2.4 56,390 7.2 850 1.9
Sinoe 6,370 95.6 2,260 33.9 44,650 5.7 2,260 5.2
TOTAL 109,520 93.5 19,630 16.8 785,010 100.0 43,670 100.0
3.7. Agricultural Households
Table 3.8 presents the number of agricultural households and its proportion of rural
households. According to the table, the number of agricultural households was
estimated at 274,070. This estimate is about 84 percent of rural households. In actual
terms, Nimba, Bong and Lofa had a much higher number of agricultural households
compared to the other counties with 60,640 (22.1 %), 34,170 (12.5 %) and 33,120 (12.1
%) respectively. Next were Montserrado with 8.8 percent and Grand Bassa with 6.6
percent, followed by Margibi with 5.9 percent, Gbarpolu with 4.2 percent and Grand
Gedeh with 4.1 percent. The least was River Cess County with 2.7 percent.
According to the table, about 90 to 96 percent of the rural households in Gbarpolu,
Margibi, River Gee and Lofa reported engaging in agricultural activities during the 2008
crop survey. Of these counties, Lofa ranked the highest with 96.1 percent, followed by
River Gee with 95.9 percent, Maryland with 90.3 percent and Gbarpolu with 90.2
percent. Margibi and Montserrado ranked the least with 57 and 67.1 percent
respectively. The rest of the counties ranged from 78.6 percent to 89.4 percent.
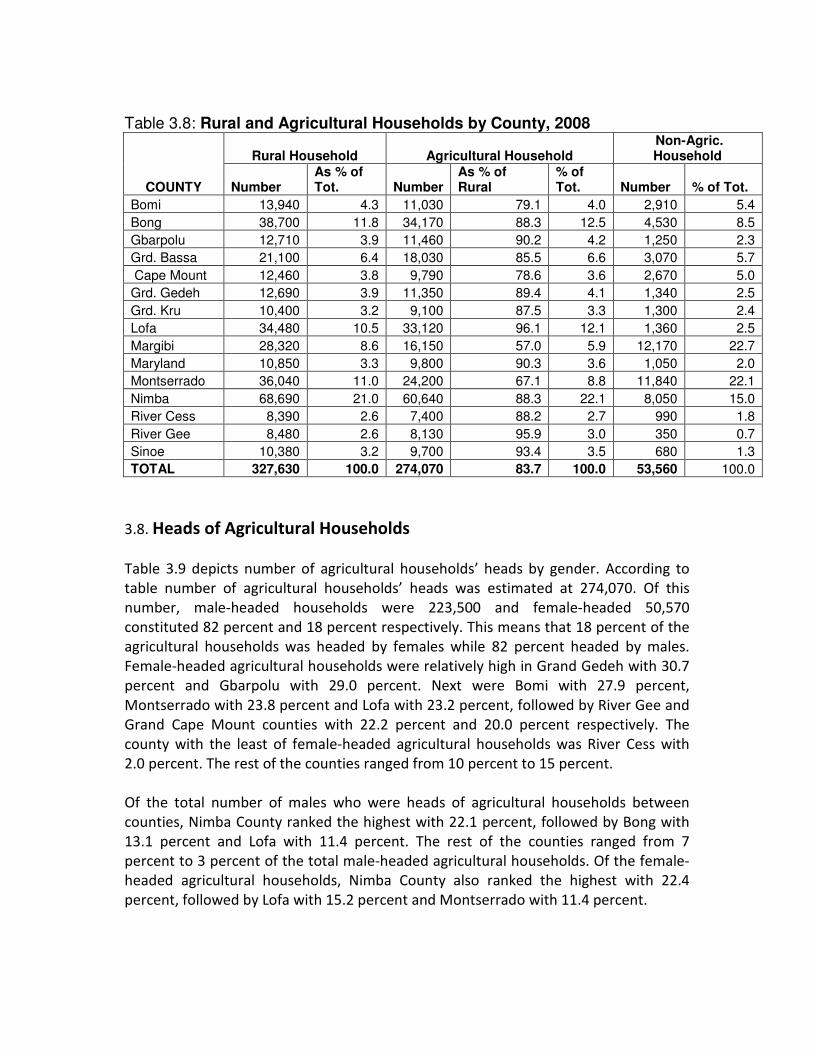
Table 3.8: Rural and Agricultural Households by County, 2008
COUNTY
Rural Household Agricultural Household Non-Agric. Household
Number As % of Tot. Number
As % of Rural
% of Tot. Number % of Tot.
Bomi 13,940 4.3 11,030 79.1 4.0 2,910 5.4
Bong 38,700 11.8 34,170 88.3 12.5 4,530 8.5
Gbarpolu 12,710 3.9 11,460 90.2 4.2 1,250 2.3
Grd. Bassa 21,100 6.4 18,030 85.5 6.6 3,070 5.7
Cape Mount 12,460 3.8 9,790 78.6 3.6 2,670 5.0
Grd. Gedeh 12,690 3.9 11,350 89.4 4.1 1,340 2.5
Grd. Kru 10,400 3.2 9,100 87.5 3.3 1,300 2.4
Lofa 34,480 10.5 33,120 96.1 12.1 1,360 2.5
Margibi 28,320 8.6 16,150 57.0 5.9 12,170 22.7
Maryland 10,850 3.3 9,800 90.3 3.6 1,050 2.0
Montserrado 36,040 11.0 24,200 67.1 8.8 11,840 22.1
Nimba 68,690 21.0 60,640 88.3 22.1 8,050 15.0
River Cess 8,390 2.6 7,400 88.2 2.7 990 1.8
River Gee 8,480 2.6 8,130 95.9 3.0 350 0.7
Sinoe 10,380 3.2 9,700 93.4 3.5 680 1.3
TOTAL 327,630 100.0 274,070 83.7 100.0 53,560 100.0
3.8. Heads of Agricultural Households
Table 3.9 depicts number of agricultural households’ heads by gender. According to
table number of agricultural households’ heads was estimated at 274,070. Of this
number, male-headed households were 223,500 and female-headed 50,570
constituted 82 percent and 18 percent respectively. This means that 18 percent of the
agricultural households was headed by females while 82 percent headed by males.
Female-headed agricultural households were relatively high in Grand Gedeh with 30.7
percent and Gbarpolu with 29.0 percent. Next were Bomi with 27.9 percent,
Montserrado with 23.8 percent and Lofa with 23.2 percent, followed by River Gee and
Grand Cape Mount counties with 22.2 percent and 20.0 percent respectively. The
county with the least of female-headed agricultural households was River Cess with
2.0 percent. The rest of the counties ranged from 10 percent to 15 percent.
Of the total number of males who were heads of agricultural households between
counties, Nimba County ranked the highest with 22.1 percent, followed by Bong with
13.1 percent and Lofa with 11.4 percent. The rest of the counties ranged from 7
percent to 3 percent of the total male-headed agricultural households. Of the female-
headed agricultural households, Nimba County also ranked the highest with 22.4
percent, followed by Lofa with 15.2 percent and Montserrado with 11.4 percent.

Table 3.9: Heads of Agricultural Households by sex and by county
County
Both Sexes Male Female Percent
Number Percent Number Percent Number Percent Male Female
Bomi 11,030 4.0 7,950 3.6 3,080 6.1 72.1 27.9
Bong 34,170 12.5 29,210 13.1 4,960 9.8 85.5 14.5
Gbarpolu 11,460 4.2 8,140 3.6 3,320 6.6 71.0 29.0
Grd. Bassa 18,030 6.6 15,380 6.9 2,650 5.2 85.3 14.7
Cape Mount 9,790 3.6 7,830 3.5 1,960 3.9 80.0 20.0
Grd. Gedeh 11,350 4.1 7,870 3.5 3,480 6.9 69.3 30.7
Grd. Kru 9,100 3.3 8,190 3.7 910 1.8 90.0 10.0
Lofa 33,120 12.1 25,440 11.4 7,680 15.2 76.8 23.2
Margibi 16,150 5.9 15,000 6.7 1,150 2.3 92.9 7.1
Maryland 9,800 3.6 8,850 4.0 950 1.9 90.3 9.7
Montserrado 24,200 8.8 18,440 8.3 5,760 11.4 76.2 23.8
Nimba 60,640 22.1 49,300 22.1 11,340 22.4 81.3 18.7
River Cess 7,400 2.7 7,250 3.2 150 0.3 98.0 2.0
River Gee 8,130 3.0 6,320 2.8 1,810 3.6 77.8 22.2
Sinoe 9,700 3.5 8,330 3.7 1,370 2.7 85.9 14.1
TOTAL 274,070 100.0 223,500 100.0 50,570 100.0 82.1 17.9
3.10. Members of Agricultural Households
Table 3.10 displays the number of people that reported leaving in the households in
which at least one person was involved in farming or agricultural activities by county.
According to the table, members of agricultural households were estimated at
1,567,650. Of this number, male population was estimated at 784,500 (50.04 %) and
the female population was estimated at 783,150 (49.96 %). Males present a slightly
higher number compared to females in agricultural households during the 2008
agricultural survey.
The table further depicts the percent share of male and female households’ members
within county. Proportions of female population are relatively high in six (6) counties
namely: Bomi and Grand Kru (53.9 % each), Grand Bassa (53.0 %), Gbarpolu (52.5 %),
Bong (51.4 %) and Grand Cape Mount (50.4 %). On the other hand proportions of male
population were relatively high in eight counties. These counties include River Gee
(54.9 %), Grand Gedeh & Maryland (53.1 % each), Sinoe (51.6 %), Margibi (51.2 %),
Lofa (50.9 %) and Nimba (50.1 %). There is equal population for male and female in
River Cess County (50.0 % each)

Table 3.10: Members of agricultural households by sex and county
COUNTY
Agricultu-ral
Household
Agricultural Population
Percent Both Sexes
Male Female Number Percent Male Female
Bomi 11,030 57,360 3.7 26,470 30,890 46.1 53.9
Bong 34,170 192,430 12.3 93,520 98,910 48.6 51.4
Gbarpolu 11,460 58,410 3.7 27,730 30,680 47.5 52.5
Grd. Bassa 18,030 87,950 5.6 41,380 46,570 47.0 53.0
Cape Mount 9,790 54,970 3.5 27,260 27,710 49.6 50.4
Grd. Gedeh 11,350 83,230 5.3 44,230 39,000 53.1 46.9
Grd. Kru 9,100 54,600 3.5 25,160 29,440 46.1 53.9
Lofa 33,120 198,540 12.7 101,050 97,490 50.9 49.1
Margibi 16,150 75,900 4.8 38,860 37,040 51.2 48.8
Maryland 9,800 56,840 3.6 30,200 26,640 53.1 46.9
Montserrado 24,200 128,260 8.2 65,240 63,020 50.9 49.1
Nimba 60,640 363,840 23.2 182,150 181,690 50.1 49.9
River Cess 7,400 38,660 2.5 19,330 19,330 50.0 50.0
River Gee 8,130 51,670 3.3 28,360 23,310 54.9 45.1
Sinoe 9,700 64,990 4.1 33,560 31,430 51.6 48.4
TOTAL 274,070 1,567,650 100.0 784,500 783,150 50.0 50.0

Appendix Table 2.1: Heads of Agricultural Households by age, sex and by county, 2008
County/Age Catego Agricultural Households Heads
Both
Sexes Male Headed Female Headed percent
Number Percent Number Percent Number Percent Male Female
Total 274,070 100.0 197,580 100.0
76,490 100.0 72.1 27.9
< 20 Years 6,850 2.5 4,740 2.4 2,110 2.8 69.2 30.8
20 -29 Years 50,160 18.3 38,130 19.3 12,030 15.7 76.0 24.0
30 - 39 Years 67,690 24.7 49,590 25.1 18,100 23.7 73.3 26.7
40 - 49 Years 65,230 23.8 48,010 24.3 17,220 22.5 73.6 26.4
50 - 59 Years 41,660 15.2 29,050 14.7 12,610 16.5 69.7 30.3
60 Years & over 42,480 15.5 28,060 14.2 14,420 18.9 66.1 33.9
Bomi 11,030 100.0 7950 100.0 3,080 100.0 72.1 27.9
< 20 Years 250 2.3 130 1.6 120 3.9 52.0 48.0
20 - 29 Years 2,050 18.6 1,800 22.6 250 8.1 87.8 12.2
30 - 39 Years 3,340 30.3 2,300 29.0 1,040 33.8 68.9 31.1
40 - 49 Years 2,690 24.4 1,540 19.4 1,150 37.3 57.2 42.8
50 - 59 Years 1,030 9.3 770 9.7 260 8.4 74.8 25.2
60 Years & Over 1,670 15.1 1,410 17.7 260 8.4 84.4 15.6
Bong 34,170 100.0 29,210 100.0 4,960 100.0 85.5 14.5
< 20 Years 440 1.3 220 0.7 220 4.4 50.0 50.0
20 - 29 Years 7,420 21.7 6,740 23.1 680 13.7 90.9 9.1
30 - 39 Years 8,100 23.7 7,430 25.4 670 13.5 91.7 8.3
40 - 49 Years 9,230 27.0 7,880 27.0 1,350 27.2 85.4 14.6
50 - 59 Years 4,950 14.5 4,050 13.9 900 18.1 81.8 18.2
60 Years & Over 4,030 11.8 2,910 10.0 1,120 22.6 72.2 27.8
100.0
Gbarpolu 11,460 100.0 8,140 100.0 3,320 100.0 71.0 31.2
< 20 Years 720 6.3 370 4.5 350 10.5 51.4 48.6
20 - 29 Years 3,220 28.1 2,220 27.3 1,000 30.1 68.9 31.1
30 - 39 Years 1,790 15.6 1,480 18.2 310 9.3 82.7 17.3
40 - 49 Years 1,790 15.6 1,480 18.2 310 9.3 82.7 17.3
50 - 59 Years 1,430 12.5 1,110 13.6 320 9.6 77.6 22.4
60 Years & Over 2,510 21.9 1,480 18.2 1,030 31.0 59.0 41.0
Grand Bassa 18,030 100.0 15,380 100.0 2,650 100.0 85.3 14.7
< 20 Years 1,150 6.4 1,050 6.8 100 3.8 91.3 8.7
20 - 29 Years 5,080 28.2 4,500 29.3 580 21.9 88.6 11.4
30 - 39 Years 4,510 25.0 4,170 27.1 340 12.8 92.5 7.5
40 - 49 Years 3,250 18.0 3,000 19.5 250 9.4 92.3 7.7
50 - 59 Years 1,500 8.3 690 4.5 810 30.6 46.0 54.0
60 Years & Over 2,540 14.1 1,970 12.8 570 21.5 77.6 22.4

Grd Cape Mount 9,790 100.0 7,830 100.0 1,960 100.0 80.0 20.0
< 20 Years 610 6.2 450 5.7 160 7.7 73.8 26.2
20 - 29 Years 2,110 21.6 1,960 25.0 150 7.7 92.9 7.1
30 - 39 Years 2,560 26.1 2,410 30.8 150 7.7 94.1 5.9
40 - 49 Years 1,960 20.0 1,060 13.5 900 46.2 54.1 45.9
50 - 59 Years 1,200 12.3 900 11.5 300 15.4 75.0 25.0
60 Years & Over 1,350 13.8 1,060 13.5 290 15.4 78.5 21.5
Grand Gedeh 11,350 100.0 7,870 100.0 3,480 100.0 69.3 30.7
< 20 Years 310 2.7 150 1.9 160 4.3 48.2 51.8
20 - 29 Years 1,360 12.0 900 11.5 460 13.0 66.2 33.8
30 - 39 Years 2,580 22.7 1,970 25.0 610 17.4 76.4 23.6
40 - 49 Years 3,480 30.7 1,970 25.0 1,510 43.5 56.6 43.4
50 - 59 Years 2,420 21.3 1,820 23.1 600 17.4 75.2 24.8
60 Years & Over 1,200 10.6 1,060 13.5 140 4.4 88.3 11.7
Grand Kru 9,100 100.0 8,190 100.0 910 100.0 90.0 10.0
< 20 Years 560 6.1 310 3.8 250 27.5 55.4 44.6
20 - 29 Years 1,100 12.1 950 11.6 150 16.5 86.4 13.6
30 - 39 Years 1,930 21.2 1,570 19.2 360 39.6 81.3 18.7
40 - 49 Years 1,930 21.2 1,890 23.1 40 4.4 97.9 2.1
50 - 59 Years 2,480 27.3 2,530 30.8 (50) -5.5 102.0 -2.0
60 Years & Over 1,100 12.1 940 11.5 160 17.6 85.5 14.5
Lofa 33,120 100.0 25,440 100.0 7,680 100.0 76.8 23.2
< 20 Years 1,424 4.3 890 3.5 530 6.9 62.5 37.2
20 - 29 Years 7,518 22.7 5,720 22.5 1,800 23.4 76.1 23.9
30 - 39 Years 9,307 28.1 8,060 31.7 1,250 16.2 86.6 13.4
40 - 49 Years 4,306 13.0 3,590 14.1 720 9.4 83.4 16.7
50 - 59 Years 4,306 13.0 2,700 10.6 1,610 21.0 62.7 37.4
60 Years & Over 6,260 18.9 4,480 17.6 1,780 23.1 71.6 28.4
Margibi 16,150 100.0 15,000 100.0 1,150 100.0 92.9 7.1
< 20 Years 420 2.6 320 2.1 100 9.1 76.2 23.8
20 - 29 Years 2,700 16.7 2,580 17.2 120 9.1 95.6 4.4
30 - 39 Years 2,580 16.0 2,380 15.9 200 18.2 92.2 7.8
40 - 49 Years 5,280 32.7 5,070 33.8 210 18.2 96.0 4.0
50 - 59 Years 3,310 20.5 3,000 20.0 310 27.2 90.6 9.4
60 Years & Over 1,860 11.5 1,650 11.0 210 18.2 88.7 11.3
Maryland 9,800 100.0 8,850 100.0 950 100.0 90.3 9.7
< 20 Years 640 6.5 380 4.3 260 26.40 59.4 40.6
20 - 29 Years 1,580 16.1 1,540 17.4 40 4.20 97.5 2.5
30 - 39 Years 1,900 19.4 1,540 17.4 360 37.90 81.1 18.9
40 - 49 Years 3,480 35.5 3,470 39.2 10 1.00 99.7 0.3
50 - 59 Years 630 6.4 380 4.3 250 26.30 60.3 39.7
60 Years & Over 1,580 16.1 1,540 17.4 40 4.20 97.5 2.5

Montserrado 24,200 100.0 18,440 100.0 5,760 100.0 76.2 23.8
< 20 Years 460 1.9 240 1.3 220 3.8 52.1 47.9
20 - 29 Years 3,920 16.2 3,410 18.5 510 8.9 87.0 13.0
30 - 39 Years 6,680 27.6 4,090 22.2 2,590 45.0 61.2 38.8
40 - 49 Years 5,080 21.0 4,780 25.9 300 5.2 94.1 5.9
50 - 59 Years 3,460 14.3 2,730 14.8 730 12.7 78.9 21.1
60 Years & Over 4,600 19.0 3,190 17.3 1,410 24.5 69.3 30.7
Nimba 60,640 100.0 49,300 100.0 11,340 100.0 81.3 18.7
< 20 Years 550 0.9 250 0.5 300 2.6 45.5 54.5
20 - 29 Years 8,000 13.2 7,000 14.2 1,000 8.8 87.5 12.5
30 - 39 Years 17,520 28.9 13,410 27.2 4,110 36.2 76.5 23.5
40 - 49 Years 14,980 24.7 12,370 25.1 2,610 23.0 82.6 17.4
50 - 59 Years 9,280 15.3 7,990 16.2 1,290 11.4 86.1 13.9
60 Years & Over 10,310 17.0 8,280 16.8 2,030 17.9 80.3 19.7
River Cess 7,400 100.0 7,250 100.0 150 100.0 98.0 2.0
< 20 Years 450 6.1 340 4.7 110 73.3 75.6 24.4
20 - 29 Years 1,510 20.4 1,510 20.9 - 0.0 100.0 0.0
30 - 39 Years 1,670 22.5 1,670 23.2 - 0.0 100.0 0.0
40 - 49 Years 1,810 24.5 1,810 25.6 - 0.0 100.0 0.0
50 - 59 Years 1,060 14.3 1,020 14.0 40 26.7 96.2 3.8
60 Years & Over 900 12.2 900 11.6 - 0.0 100.0 0.0
River Gee 8,130 100.0 6,320 100.0 1,810 100.0 77.7 22.3
< 20 Years 350 4.3 180 2.8 170 9.4 51.4 48.6
20 - 29 Years 350 4.3 180 2.8 170 9.4 51.4 48.6
30 - 39 Years 2,070 25.5 1,580 25.0 490 27.1 76.3 23.7
40 - 49 Years 2,770 34.0 2,450 38.8 320 17.7 88.4 11.6
50 - 59 Years 1,730 21.3 1,580 25.0 150 8.3 91.3 8.7
60 Years & Over 860 10.6 350 5.6 510 28.2 40.7 59.3
Sinoe 9,700 100.0 8,330
1,370 100.0 85.9 14.1
< 20 Years 320 3.3 210 2.5 110 8.0 65.6 34.4
20 - 29 Years 1,160 12.0 1,060 12.7 100 7.3 91.4 8.6
30 - 39 Years 2,000 20.6 1,900 22.8 100 7.3 95.0 5.0
40 - 49 Years 2,320 23.9 2,100 25.2 220 16.1 90.5 9.5
50 - 59 Years 1,900 19.6 1,690 20.3 210 15.3 88.9 11.1
60 Years & Over 2,000 20.6 1,370 16.5 630 46.0 68.5 31.5
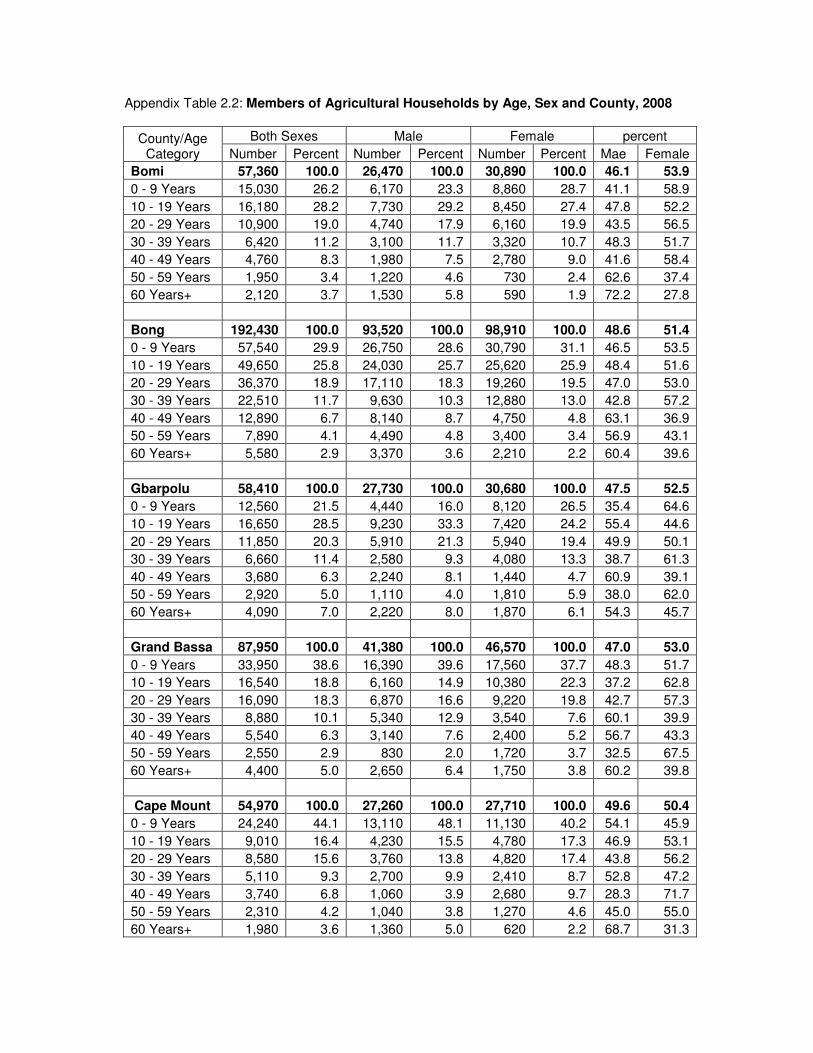
Appendix Table 2.2: Members of Agricultural Households by Age, Sex and County, 2008
County/Age Category
Both Sexes Male Female percent
Number Percent Number Percent Number Percent Mae Female
Bomi 57,360 100.0 26,470 100.0 30,890 100.0 46.1 53.9
0 - 9 Years 15,030 26.2 6,170 23.3 8,860 28.7 41.1 58.9
10 - 19 Years 16,180 28.2 7,730 29.2 8,450 27.4 47.8 52.2
20 - 29 Years 10,900 19.0 4,740 17.9 6,160 19.9 43.5 56.5
30 - 39 Years 6,420 11.2 3,100 11.7 3,320 10.7 48.3 51.7
40 - 49 Years 4,760 8.3 1,980 7.5 2,780 9.0 41.6 58.4
50 - 59 Years 1,950 3.4 1,220 4.6 730 2.4 62.6 37.4
60 Years+ 2,120 3.7 1,530 5.8 590 1.9 72.2 27.8
Bong 192,430 100.0 93,520 100.0 98,910 100.0 48.6 51.4
0 - 9 Years 57,540 29.9 26,750 28.6 30,790 31.1 46.5 53.5
10 - 19 Years 49,650 25.8 24,030 25.7 25,620 25.9 48.4 51.6
20 - 29 Years 36,370 18.9 17,110 18.3 19,260 19.5 47.0 53.0
30 - 39 Years 22,510 11.7 9,630 10.3 12,880 13.0 42.8 57.2
40 - 49 Years 12,890 6.7 8,140 8.7 4,750 4.8 63.1 36.9
50 - 59 Years 7,890 4.1 4,490 4.8 3,400 3.4 56.9 43.1
60 Years+ 5,580 2.9 3,370 3.6 2,210 2.2 60.4 39.6
Gbarpolu 58,410 100.0 27,730 100.0 30,680 100.0 47.5 52.5
0 - 9 Years 12,560 21.5 4,440 16.0 8,120 26.5 35.4 64.6
10 - 19 Years 16,650 28.5 9,230 33.3 7,420 24.2 55.4 44.6
20 - 29 Years 11,850 20.3 5,910 21.3 5,940 19.4 49.9 50.1
30 - 39 Years 6,660 11.4 2,580 9.3 4,080 13.3 38.7 61.3
40 - 49 Years 3,680 6.3 2,240 8.1 1,440 4.7 60.9 39.1
50 - 59 Years 2,920 5.0 1,110 4.0 1,810 5.9 38.0 62.0
60 Years+ 4,090 7.0 2,220 8.0 1,870 6.1 54.3 45.7
Grand Bassa 87,950 100.0 41,380 100.0 46,570 100.0 47.0 53.0
0 - 9 Years 33,950 38.6 16,390 39.6 17,560 37.7 48.3 51.7
10 - 19 Years 16,540 18.8 6,160 14.9 10,380 22.3 37.2 62.8
20 - 29 Years 16,090 18.3 6,870 16.6 9,220 19.8 42.7 57.3
30 - 39 Years 8,880 10.1 5,340 12.9 3,540 7.6 60.1 39.9
40 - 49 Years 5,540 6.3 3,140 7.6 2,400 5.2 56.7 43.3
50 - 59 Years 2,550 2.9 830 2.0 1,720 3.7 32.5 67.5
60 Years+ 4,400 5.0 2,650 6.4 1,750 3.8 60.2 39.8
Cape Mount 54,970 100.0 27,260 100.0 27,710 100.0 49.6 50.4
0 - 9 Years 24,240 44.1 13,110 48.1 11,130 40.2 54.1 45.9
10 - 19 Years 9,010 16.4 4,230 15.5 4,780 17.3 46.9 53.1
20 - 29 Years 8,580 15.6 3,760 13.8 4,820 17.4 43.8 56.2
30 - 39 Years 5,110 9.3 2,700 9.9 2,410 8.7 52.8 47.2
40 - 49 Years 3,740 6.8 1,060 3.9 2,680 9.7 28.3 71.7
50 - 59 Years 2,310 4.2 1,040 3.8 1,270 4.6 45.0 55.0
60 Years+ 1,980 3.6 1,360 5.0 620 2.2 68.7 31.3
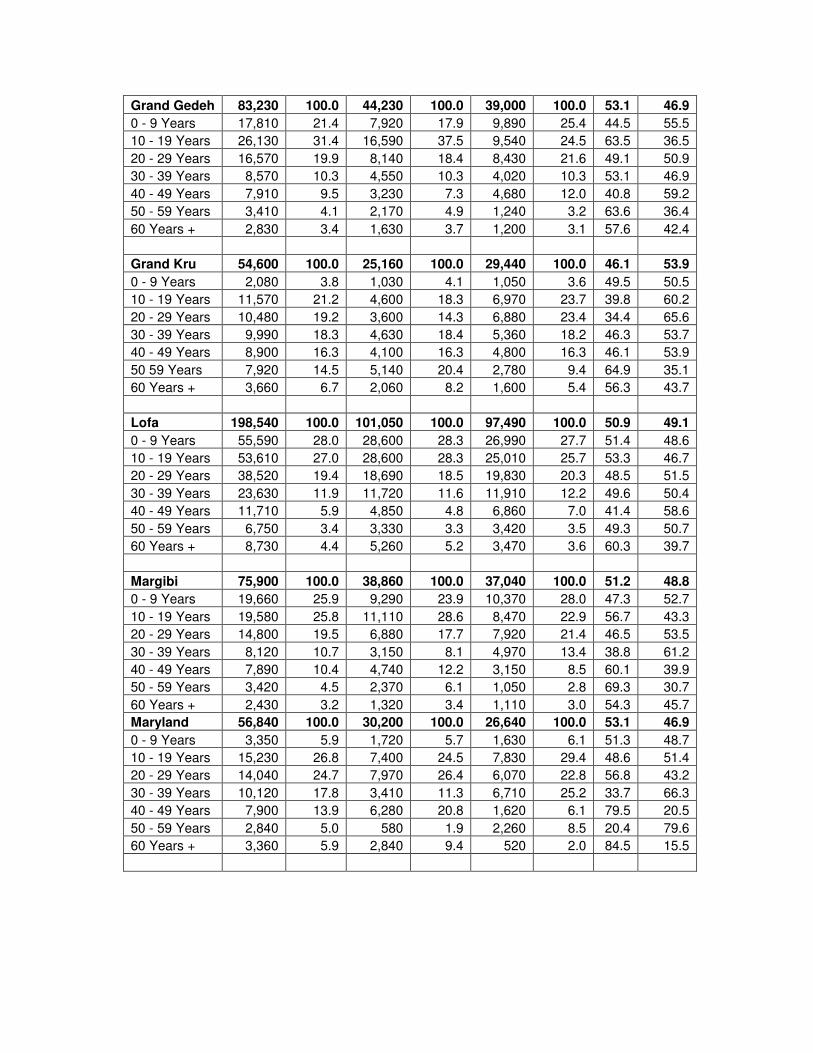
Grand Gedeh 83,230 100.0 44,230 100.0 39,000 100.0 53.1 46.9
0 - 9 Years 17,810 21.4 7,920 17.9 9,890 25.4 44.5 55.5
10 - 19 Years 26,130 31.4 16,590 37.5 9,540 24.5 63.5 36.5
20 - 29 Years 16,570 19.9 8,140 18.4 8,430 21.6 49.1 50.9
30 - 39 Years 8,570 10.3 4,550 10.3 4,020 10.3 53.1 46.9
40 - 49 Years 7,910 9.5 3,230 7.3 4,680 12.0 40.8 59.2
50 - 59 Years 3,410 4.1 2,170 4.9 1,240 3.2 63.6 36.4
60 Years + 2,830 3.4 1,630 3.7 1,200 3.1 57.6 42.4
Grand Kru 54,600 100.0 25,160 100.0 29,440 100.0 46.1 53.9
0 - 9 Years 2,080 3.8 1,030 4.1 1,050 3.6 49.5 50.5
10 - 19 Years 11,570 21.2 4,600 18.3 6,970 23.7 39.8 60.2
20 - 29 Years 10,480 19.2 3,600 14.3 6,880 23.4 34.4 65.6
30 - 39 Years 9,990 18.3 4,630 18.4 5,360 18.2 46.3 53.7
40 - 49 Years 8,900 16.3 4,100 16.3 4,800 16.3 46.1 53.9
50 59 Years 7,920 14.5 5,140 20.4 2,780 9.4 64.9 35.1
60 Years + 3,660 6.7 2,060 8.2 1,600 5.4 56.3 43.7
Lofa 198,540 100.0 101,050 100.0 97,490 100.0 50.9 49.1
0 - 9 Years 55,590 28.0 28,600 28.3 26,990 27.7 51.4 48.6
10 - 19 Years 53,610 27.0 28,600 28.3 25,010 25.7 53.3 46.7
20 - 29 Years 38,520 19.4 18,690 18.5 19,830 20.3 48.5 51.5
30 - 39 Years 23,630 11.9 11,720 11.6 11,910 12.2 49.6 50.4
40 - 49 Years 11,710 5.9 4,850 4.8 6,860 7.0 41.4 58.6
50 - 59 Years 6,750 3.4 3,330 3.3 3,420 3.5 49.3 50.7
60 Years + 8,730 4.4 5,260 5.2 3,470 3.6 60.3 39.7
Margibi 75,900 100.0 38,860 100.0 37,040 100.0 51.2 48.8
0 - 9 Years 19,660 25.9 9,290 23.9 10,370 28.0 47.3 52.7
10 - 19 Years 19,580 25.8 11,110 28.6 8,470 22.9 56.7 43.3
20 - 29 Years 14,800 19.5 6,880 17.7 7,920 21.4 46.5 53.5
30 - 39 Years 8,120 10.7 3,150 8.1 4,970 13.4 38.8 61.2
40 - 49 Years 7,890 10.4 4,740 12.2 3,150 8.5 60.1 39.9
50 - 59 Years 3,420 4.5 2,370 6.1 1,050 2.8 69.3 30.7
60 Years + 2,430 3.2 1,320 3.4 1,110 3.0 54.3 45.7
Maryland 56,840 100.0 30,200 100.0 26,640 100.0 53.1 46.9
0 - 9 Years 3,350 5.9 1,720 5.7 1,630 6.1 51.3 48.7
10 - 19 Years 15,230 26.8 7,400 24.5 7,830 29.4 48.6 51.4
20 - 29 Years 14,040 24.7 7,970 26.4 6,070 22.8 56.8 43.2
30 - 39 Years 10,120 17.8 3,410 11.3 6,710 25.2 33.7 66.3
40 - 49 Years 7,900 13.9 6,280 20.8 1,620 6.1 79.5 20.5
50 - 59 Years 2,840 5.0 580 1.9 2,260 8.5 20.4 79.6
60 Years + 3,360 5.9 2,840 9.4 520 2.0 84.5 15.5

Montserrado 128,260 100.0 65,240 100.0 63,020 100.0 50.9 49.1
0 - 9 Years 38,990 30.4 21,990 33.7 17,000 27.0 56.4 43.6
10 - 19 Years 29,890 23.3 14,220 21.8 15,670 24.9 47.6 52.4
20 - 29 Years 22,960 17.9 10,960 16.8 12,000 19.0 47.7 52.3
30 - 39 Years 14,620 11.4 4,760 7.3 9,860 15.6 32.6 67.4
40 - 49 Years 11,030 8.6 6,650 10.2 4,380 7.0 60.3 39.7
50 - 59 Years 4,490 3.5 3,200 4.9 1,290 2.0 71.3 28.7
60 Years + 6,280 4.9 3,460 5.3 2,820 4.5 55.1 44.9
Nimba 363,840 100.0 182,150 100.0 181,690 100.0 50.1 49.9
0 - 9 Years 86,590 23.8 40,620 22.3 45,970 25.3 46.9 53.1
10 - 19 Years 106,610 29.3 60,290 33.1 46,320 25.5 56.6 43.4
20 - 29 Years 64,400 17.7 28,960 15.9 35,440 19.5 45.0 55.0
30 - 39 Years 45,840 12.6 19,850 10.9 25,990 14.3 43.3 56.7
40 - 49 Years 27,650 7.6 14,210 7.8 13,440 7.4 51.4 48.6
50 - 59 Years 13,460 3.7 8,740 4.8 4,720 2.6 64.9 35.1
60 Years + 19,290 5.3 9,480 5.2 9,810 5.4 49.1 50.9
River Cess 38,660 100.0 19,330 100.0 19,330 100.0 50.0 50.0
0 - 9 Years 16,860 43.6 8,310 43.0 8,550 44.2 49.3 50.7
10 - 19 Years 7,810 20.2 4,080 21.1 3,730 19.3 52.2 47.8
20 - 29 Years 4,370 11.3 1,660 8.6 2,710 14.0 38.0 62.0
30 - 39 Years 4,950 12.8 1,650 8.5 3,300 17.1 33.3 66.7
40 - 49 Years 2,430 6.3 1,660 8.6 770 4.0 68.3 31.7
50 - 59 Years 1,200 3.1 1,060 5.5 140 0.7 88.3 11.7
60 Years + 1,040 2.7 910 4.7 130 0.7 87.5 12.5
River Gee 51,670 100.0 28,360 100.0 23,310 100.0 54.9 45.1
0 - 9 Years 15,550 30.1 10,660 37.6 4,890 21.0 68.6 31.4
10 - 19 Years 13,180 25.5 6,860 24.2 6,320 27.1 52.0 48.0
20 - 29 Years 7,240 14.0 3,600 12.7 3,640 15.6 49.7 50.3
30 - 39 Years 5,580 10.8 2,720 9.6 2,860 12.3 48.7 51.3
40 - 49 Years 5,060 9.8 2,530 8.9 2,530 10.9 50.0 50.0
50 - 59 Years 2,530 4.9 1,620 5.7 910 3.9 64.0 36.0
60 Years + 2,530 4.9 370 1.3 2,160 9.3 14.6 85.4
Sinoe 64,990 100.0 33,560 100.0 31,430 100.0 51.6 48.4
0 - 9 Years 19,110 29.4 9,030 26.9 10,080 32.1 47.3 52.7
10 - 19 Years 14,560 22.4 7,720 23.0 6,840 21.8 53.0 47.0
20 - 29 Years 11,890 18.3 6,610 19.7 5,280 16.8 55.6 44.4
30 - 39 Years 7,210 11.1 3,690 11.0 3,520 11.2 51.2 48.8
40 - 49 Years 5,460 8.4 2,950 8.8 2,510 8.0 54.0 46.0
50 - 59 Years 2,990 4.6 1,780 5.3 1,210 3.8 59.5 40.5
60 Years + 3,770 5.8 1,780 5.3 1,990 6.3 47.2 52.8


![Joseph Jenkins Roberts [President of Liberia]--The Republic of Liberia--An Address (1869)](https://static.fdocuments.in/doc/165x107/577d22a11a28ab4e1e97dd93/joseph-jenkins-roberts-president-of-liberia-the-republic-of-liberia-an.jpg)