Reproductions supplied by EDRS are the best that can … · DOCUMENT RESUME. ED 437 927 IR 019 890....
62
DOCUMENT RESUME ED 437 927 IR 019 890 AUTHOR Becker, Henry J.; Ravitz, Jason L.; Wong, YanTien TITLE Teacher and Teacher-Directed Student Use of Computers and Software. Teaching, Learning, and Computing: 1998 National Survey. Report #3. INSTITUTION Center for Research on Information Technology and Organizations, Irvine, CA.; Minnesota Univ., Minneapolis. SPONS AGENCY National Science Foundation, Arlington, VA.; Office of Educational Research and Improvement (ED), Washington, DC. PUB DATE 1999-11-00 NOTE 64p.; For Report #1, see ED 429 564; for Report #2, see ED 430 548. CONTRACT REC-9600614 AVAILABLE FROM Teaching Learning & Computing, Department of Education, University of California-Irvine, 2001 Berkeley P1., Irvine, CA 92697-4650 ($8). Tel: 949-824-8965. For full text: http://www.crito.uci.edu/TLC/findings/computeruse. PUB TYPE Numerical/Quantitative Data (110) Reports Research (143) EDRS PRICE MF01/PC03 Plus Postage. DESCRIPTORS *Computer Software; *Computer Uses in Education; Educational Objectives; Educational Technology; Elementary Secondary Education; National Surveys; School Surveys; Tables (Data); Teacher Surveys; Use Studies; Users (Information) IDENTIFIERS Access to Computers ABSTRACT This report, the third in a series from the spring 1998 national survey, "Teaching, Learning, and Computing," focuses on how teachers have incorporated computers into their instructional practices. The study is comprised of completed questionnaire responses from teachers, principals, and school technology coordinators from 1,616 schools. Part 1 discusses teacher-directed student use of computers, including basic descriptive statistics, access to classroom computers, and computer platforms used by students. The extent and variety of software used and teachers' objectives for use are addressed in part 2, including types of software used, software that teachers judge as most valuable for students, patterns of software use, objectives for computer use, and student computer use for school work on their own time. Part 3 considers teacher computer expertise and professional use, including teacher professional use of software, and teacher self-reported expertise with computers. It was found that teachers who are the most technically knowledgeable about computers are the ones most likely to have students use computers in varied and complicated ways. At any level, the cluster of teachers strong in most aspects of computer use is small (5% of elementary school teachers, 4% of middle school teachers, and 13% of high school teachers). Although small in numbers, these teachers constitute the standard for instructional computer use, and their numbers are likely to increase in the near future. Data are presented in 24 tables throughout the report. Supplementary tables and a summary of study methodology are appended. (MES) Reproductions supplied by EDRS are the best that can be made from the original document.
Transcript of Reproductions supplied by EDRS are the best that can … · DOCUMENT RESUME. ED 437 927 IR 019 890....

DOCUMENT RESUME
ED 437 927 IR 019 890
AUTHOR Becker, Henry J.; Ravitz, Jason L.; Wong, YanTienTITLE Teacher and Teacher-Directed Student Use of Computers and
Software. Teaching, Learning, and Computing: 1998 NationalSurvey. Report #3.
INSTITUTION Center for Research on Information Technology andOrganizations, Irvine, CA.; Minnesota Univ., Minneapolis.
SPONS AGENCY National Science Foundation, Arlington, VA.; Office ofEducational Research and Improvement (ED), Washington, DC.
PUB DATE 1999-11-00NOTE 64p.; For Report #1, see ED 429 564; for Report #2, see ED
430 548.CONTRACT REC-9600614AVAILABLE FROM Teaching Learning & Computing, Department of Education,
University of California-Irvine, 2001 Berkeley P1., Irvine,CA 92697-4650 ($8). Tel: 949-824-8965. For full text:http://www.crito.uci.edu/TLC/findings/computeruse.
PUB TYPE Numerical/Quantitative Data (110) Reports Research(143)
EDRS PRICE MF01/PC03 Plus Postage.DESCRIPTORS *Computer Software; *Computer Uses in Education; Educational
Objectives; Educational Technology; Elementary SecondaryEducation; National Surveys; School Surveys; Tables (Data);Teacher Surveys; Use Studies; Users (Information)
IDENTIFIERS Access to Computers
ABSTRACTThis report, the third in a series from the spring 1998
national survey, "Teaching, Learning, and Computing," focuses on how teachershave incorporated computers into their instructional practices. The study iscomprised of completed questionnaire responses from teachers, principals, andschool technology coordinators from 1,616 schools. Part 1 discussesteacher-directed student use of computers, including basic descriptivestatistics, access to classroom computers, and computer platforms used bystudents. The extent and variety of software used and teachers' objectivesfor use are addressed in part 2, including types of software used, softwarethat teachers judge as most valuable for students, patterns of software use,objectives for computer use, and student computer use for school work ontheir own time. Part 3 considers teacher computer expertise and professionaluse, including teacher professional use of software, and teacherself-reported expertise with computers. It was found that teachers who arethe most technically knowledgeable about computers are the ones most likelyto have students use computers in varied and complicated ways. At any level,the cluster of teachers strong in most aspects of computer use is small (5%of elementary school teachers, 4% of middle school teachers, and 13% of highschool teachers). Although small in numbers, these teachers constitute thestandard for instructional computer use, and their numbers are likely toincrease in the near future. Data are presented in 24 tables throughout thereport. Supplementary tables and a summary of study methodology are appended.(MES)
Reproductions supplied by EDRS are the best that can be madefrom the original document.

Teacher and Teacher-Directed Student Use of Computers and Software
Henry J. BeckerJason L. RavitzYanTien Wong
Teaching, Learning, and Computing: 1998 National Survey
Report #3
Center for Research on Information Technology and OrganizationsUniversity of California, Irvine
And
University of Minnesota
November, 1999
BEST COPY AVAILABLE
U.S. DEPARTMENT OF EDUCATIONOffice of Educational Research
and Improvement
EDUCATIONAL RESOURCES INFORMATION
CENTER (ERIC)-0 This document has been reproduced as
received from the person or organization
originating it.Minor changes have been made to
improve reproduction quality.
Points of view or opinions stated in thisdocument do not necessarily representofficial OERI position or policy.

Teacher and Teacher-Directed Student Use of Computers and Software
Henry J. BeckerJason L. RavitzYanTien Wong
Teaching, Learning, and Computing: 1998 National Survey
Report #3
Center for Research on Information Technology and OrganizationsUniversity of California, Irvine
And
University of Minnesota
November, 1999
Source: http://www.crito.uci.edu/tIc/findings/ComputerUse/html/startpage.htm
Research funded by the program of Research on Education Policy and Practice at the National ScienceFoundation and the Office of Educational Research and Improvement, U.S. Department of Education.NSF Grant # REC-9600614

TABLE OF CONTENTS
EXECUTIVE SUMMARY 2
GUIDE TO DATA TABLES 5
PART I. TEACHER-DIRECTED STUDENT USE OF COMPUTERS 6
BASIC DESCRIPTIVE STATISTICS 6Location of Computer Use 7Frequent Use by Students 7
ACCESS TO CLASSROOM COMPUTERS 8
Computer-Student Ratios in Classrooms 9Number of Classroom Computers Needed For Frequent Use 9Computer Access in Labs and Media Centers versus Classrooms 10Which Promotes More Frequent Use: High Computer Density in Labs or Convenience of ClassroomLocation? 11
COMPUTER PLATFORMS USED BY STUDENTS 12
PART II. EXTENT AND VARIETY OF SOFTWARE USED AND TEACHERS' OBJECTIVES FOR USE13
TYPES OF SOFTWARE USED 13
SOFTWARE THAT TEACHERS JUDGE AS MOST VALUABLE FOR STUDENTS 16PA 1TERNS OF SOFTWARE USE 18
A Typology of Teachers' Software Use 19Selected Elementary Level Clusters 21Middle Grades Diverse-Use Clusters 21
High School High-Use Clusters 22Middle and High School "Specialized-Use" Clusters 23
OBJECTIVES FOR COMPUTER USE 23Student Software Use by Teacher's Objectives for Computer Use 25
STUDENT COMPUTER USE FOR SCHOOL WORK ON THEIR OWN TIME 28
PART III. TEACHER COMPUTER EXPERTISE AND PROFESSIONAL USE 31
TEACHER PROFESSIONAL USE OF SOFTWARE 31TEACHER SELF-REPORTED EXPERTISE WITH COMPUTERS 33
Teacher Computer Expertise and Having a Computer at Home 35Teacher Computer Skill and Expertise and their Use of Computers 36Teacher Computer Skills and Expertise and their Objectives for Student Computer Use 38Major Software Use Clusters Associated with Expert Computer-Using Teachers and Teachers HoldingObjectives Correlated with High Levels of Out-of-Class Student Computer Use 40
Upper-Elementary Grades Clusters 41Middle Grades Clusters 41High School Clusters 43
DISCUSSION AND CONCLUSIONS 47
APPENDIX A. SUPPLEMENTARY TABLES 50
APPENDIX B. SUMMARY OF STUDY METHODOLOGY 56
PARTICIPATING SCHOOLS 57SELECTION OF TEACHERS 57ATTAINED SAMPLE 58
4

EXECUTIVE SUMMARY
Teachers' access to personal computers at school and at home has increased to the point where, by 1998,93% of teachers in grades 4-12 were using computers as a part of their professional lives. A majority ofteachers now have a computer in their classroom and nearly 80% have one at home. Most teachers findcomputers useful for preparing handouts for lessons, recording student grades, and doing other work ofknowledge professionals. However, what is most significant about teachers' involvement with computersis not their own professional use, but the role teachers play in directing students' use of this still-maturingand rapidly changing technology. This report, the 3rd in a series from the Spring, 1998 national survey,Teaching, Learning, and Computing: 1998, focuses on how teachers have incorporated computers intotheir instructional practices.
While the majority of American teachers (71%) assign computer work to students at least occasionally,only about one third do so on a regular basis. Apart from computer teachers, business education andvocational teachers are more likely than teachers of other subjects to use computers regularly withstudents i.e. it is quite typical for their students to use computers twenty times or more during the schoolyear. Aside from these more likely candidates for frequent computer use, English and elementaryteachers are also more apt to use computers on a regular basis with their students. In fact 30% of Englishteachers and 43% of elementary teachers (those who teach the traditional self-contained class) assigncomputer work frequently while only about one in six science teachers, one in eight math teachers, andone in ten social studies and fine arts teachers do. Thus, much of students' computer educationexperiences occur outside of academic courses, particularly at the high school level, when students aremore likely than at other grade levels to be taking computer, business, or vocational courses. At lowergrade levels, however, when students have less opportunity to take these elective courses, their computerexperience more likely occurs in academic classes. For example, at the middle school level, 30% ofstudents' experience using computers takes place in English classes.
Regular use of computers with students is highly dependent on access to computers. TLC data show thatteachers who assign computer work to students use rooms with many computers in them. However,besides computer teachers and business education teachers, most other teachers have relatively fewcomputers compared to the number of students in their classroom. In fact, only 14% of English and 13%of math teachers have a decent ratio of one computer for every four students. Those who don't have thislevel of access in the classroom must therefore make use of shared spaces, like computers labs. However,access to several computers in a classroom proves to be a more suitable setting for a great deal of school-based computer use than does an even greater number in a computer lab, particularly for academicsecondary teachers. Our data shows that computer-assigning academic secondary teachers who have atleast one computer in their classroom for every four students are more than 3 times as likely to havestudents use computers on a regular basis than those who don't have classroom access and use computersin labs (62% are frequent users compared to 18% of those who have no computers in their classroom anduse labs for their students' computer work).
Except for elementary teachers, who still make frequent use of game and drill software, skills-practicethrough computers has become much less common than other uses of computers. In particular, wordprocessing is used by students of 50% of all teachers in the study (grade 4-12 teachers) and CD-ROMreference software is used by 36% of all teachers. As discussed more extensively in Report 1 in thisseries,' roughly 30% of all teachers have students use the World Wide Web. Relatively few teachersmake use of more analytic and project-oriented software, particularly on a frequent basis. For example,
Henry Jay Becker, Internet Use by Teachers: Conditions of Professional Use and Teacher-Directed Student Use.Report #1, Teaching, Learning, and Computing: 1998 National Survey. University of California, Irvine. February,1999. http://www.crito.uci.edu/TLC/FINDINGS/internet-use/startpage.htm
2
5
only 4% of English teachers have students use presentation software on at least 10 occasions, and only5% of science teachers had students use simulation or modeling software that often. As for spreadsheetand database programs, only 7% of vocational education teachers had students use that type of software10 times. Math teachers, along with foreign language teachers, are among the least likely to be makingcomputers a regular part of their instructional practice. They are the only secondary subject categorywhere skills-practice-games is the most common type of software used, and even then, only one-quarterof math teachers do that.
The software teachers most often name as their most valuable programs for student use are general officeapplications such as ClarisWorks and Microsoft Works and web browsers such as Netscape. In addition,certain individual software titles attract noticeable numbers of teachers in specific fields: AcceleratedReader and Hyperstudio among elementary and some middle grades teachers, Geometer's Sketchpad inmath, and AutoCAD in Vocational Education, to name the most-often mentioned ones.
We found it was useful to classify teachers according to the pattern of different types of software they hadstudents use. Several distinct patterns of use were uncovered at each school level--some emphasizingfrequent use of a single type of software, others involving diverse types of software. However, the mostextensive and diverse software use practices taken together involve only a small percentage of teachers,on the order of 10 to 15% in total, and several of those clusters are dominated by computer and businesseducation teachers. However, several other "clusters" do contain disproportionate numbers of Englishteachers as well as secondary teachers of mixed academic subjects (a special category of teachers).
Just as skill and drill games are no longer the most commonly used software applications, objectives forcomputer use have extended beyond just "learning computer skills" or using computer games for thelimited purpose of mastering content. In fact, "finding out about ideas and information" was the mostcommonly reported objective followed by students "expressing themselves in writing."
Teachers' objectives for students' computer use do vary by the subjects they teach. Social studies andteachers of mixed academic subjects are more interested in students finding out about ideas than areothers while English and elementary teachers are more likely to be interested in students expressingthemselves in writing. In contrast, math, computer, and business teachers reported more traditionalobjectives. They are more likely to select mastering skills and improving computer skills. Of courseteachers interested in skill-related objectives are more likely to use game software, but, they tend to usethat type of software almost exclusively while teachers holding other objectives tend to use a greatervariety of software. For example, those interested in having students find out about ideas and informationnot only have students use CD-ROM reference software, and the World Wide Web, two applicationsnaturally associated with information retrieval, but they were also likely to have their students use wordprocessing software.
Aside from in-class computer work, TLC asked teachers how often their students worked on computerassignments for that class outside of class time. This survey question proved quite revealing indistinguishing between teachers who see computers as tools that enable students to do productive workversus teachers who see computers in "skills" terms (either as a means for mastering basic literacy skillsor as a new set of technology skills). We found that teachers more likely to have students do computerwork on their own time (e.g. before or after class) were more likely to select four main objectives forstudent computer use: "presenting information to an audience," "improving their writing,""communicating with other people," and "finding out about ideas and information." Those objectives areall about building competencies for skill- integrating productive work. The teachers who were less likelyto report that their students used computers to do classwork outside of class time were more likely selectas their top objectives reinforcing skills just taught, remediation of skills, and learning to work
3

independently. The fact that their students don't use computers outside of class is a consequence of howthose teachers have defined the purpose of computers: isolated, decontextualized "learning."
A teacher's skill in using computers certainly has an impact on how they use computers, and in how theysee their role to begin with. TLC asked teachers to rate themselves on how well they knew how toperform certain tasks ranging from basic ones such as displaying the directory of a disk to more complexactivities such as developing a multimedia document. Teachers were also asked to self-evaluate theirexperience and expertise on different computer platforms. Although the majority of teachers felt theywere "very experienced" on at least one platform, only 3% felt that they were "expert" on multipleplatforms (e.g., Macintosh AND Windows). We found that the greater their platform expertise and thegreater number of computer-related tasks teachers reported they could do, the more substantially theyused computers for their own professional purposes. Teacher computer skill level was also associatedwith more frequent assignment of computer work to students, but this relationship was not as strong asthe one for teachers' own professional use of computers. We also found that the more computer-skilledteachers were, the more likely their primary objective for having students use computers had to do withstudents presenting material, communicating electronically, and analyzing information. Teachers simplyinterested in having students use computers for purposes of remediating skills were those with lowerlevels of computer expertise.
Finally, we combined information about teacher expertise, teacher professional use, and objectives forstudent computer use most closely associated with higher levels of student use outside of class time toidentify those clusters of teachers who are strongest on all those dimensions. At the elementary level, weidentified two clusters of teachers who are strong in these respects (although together involving only 5%of all upper-elementary teachers). Both emphasized student production of multimedia and a majority ofboth groups named one program, Hyperstudio, as their most valuable software. At the middle grades, twoclusters also appeared notable (4% of middle grades teachers), and these classes emphasized wordprocessing and use of the World Wide Web, along with some use of electronic mail (in one cluster) andpresentation and multimedia software as well. At the high school level, five clusters of teachers hadrelatively high levels of computer expertise (13% of high school teachers), but only one of those clusters(2% of high school teachers) seemed outstanding in terms of having objectives for student computer usethat translated into high levels of out-of-class involvement in computer work for the class. Those classes,primarily English, social studies, and computer classes, used an array of software going beyond wordprocessing, Web browsing, and CD-ROM use, to include presentation software (Powerpoint was second-only to Netscape as those teachers' most valued software) and other graphically-oriented programs.Though teachers in these clusters constitute only a minority of teachers, due to their exemplary use ofcomputers with students, they deserve even closer examination.
4 7

GUIDE TO DATA TABLES
A "Summary of Study Methodology" is attached as Appendix B to this report, and provides a morecomplete background to the design of the TLC survey. The followingare some additional notes,particularly oriented towards interpreting the data tables:
Although the data tables are based on weighted cases (weights inverse to the probability of selection), rawN's (number of teachers responding) accompany most tables. Those numbers provide a rough sense ofthe sampling reliability of a cell's mean or a set of row or column percentages without the additionalcomplexity of displaying standard deviations and significance levels and/or effect sizes for all of themany comparisons that might be made with a table's statistics. The comparisons are shown largely tosuggest and explore propositions rather than to test specific hypotheses. Moreover, analyses are bi-variateor involve at most three variables; future research that simultaneously incorporates multiple predictorvariables to test propositions about explanation of variance will include tests of statistical significance asappropriate.
Generally speaking, the sample population for any given table is one of several types: (a) all teachers inthe probability sample (see Appendix B); (b) all teachers in both the probability and purposive samples;(c) teachers (in either (a) or (b)) who assigned computer work to any of their classes; or (d) teachers whoassigned computer work to a specific class which they selected as the one in which they felt they mostsuccessfully accomplished their teaching objectives. The latter two groups are both referred to as"computer-assigning teachers." The sample population for each table is described next to the term"universe," under each table.
A number of tables divide teachers by the subject-matter of the classes that they teach. Middle and highschool teachers are designated by the subject they teach to more than one-half of their teaching load.Teachers who teach two subjects equally or a range of subjects are classified as either "mixed academicsecondary" or "other applied secondary," depending on the nature of their courses. Tables that are basedon a single classthe teacher's specifically selected classhave similar categories except that instead of"mixed academic," the phrase "misc. academic" is used. Elementary grade teachers (grades 4 through 6in K-6 or K-5 schools as well as grades 4 and 5 in schools that go above grade 6) are broken out into onlytwo categories: those who teach a single self-contained class (same students, all subjects), and those whoteach a single subject or some combination of multiple classes and multiple subjects.

PART I. TEACHER-DIRECTED STUDENT USE OF COMPUTERS
BASIC DESCRIPTIVE STATISTICS
By the 1997-98 school year, almost three-quarters of American teachers (71% among teachers of grades4-12) had students use computers during class time at some point during the school year. In some cases,teachers used computers with certain classes but not others. However, 60% of all teachers had studentsuse computers in the single class that we sampled for further study: the class where they felt mostsatisfied with their teaching"where you accomplish your teaching goals most often."
Teachers of some subjects2 and school levels are less likely to have students use computers than others.In particular, teachers of secondary academic subjects (math, social studies and foreign language, inparticular) are less likely to have their students use computers than are elementary teachers of self-contained classes or teachers of business and vocational subjects. Overall, about one-half of mathteachers (49%), slightly more social studies teachers (56%), two-thirds (66%) of science teachers, andthree-fourths (75%) of English teachers reported some use of computers by students during at least one ofthe classes they taught that year (compared to 79% of vocational education teachers, 87% of elementaryteachers of self-contained classes, and 93% of business education teachers. (See first two data columns inTable 1.)3
TABLE 1: TEACHERS' COMPUTER USE PRACTICE BY SUBJECT & LEVEL
Subject and Level Taught
(Where level not indicated:secondary, i.e., middle orhigh school grades)
% that havestudents usecomputers inthe selected
class*
% that havestudents usecomputers inother classes,
but not thatclass
% that usecomputers
only forprofessional
activities
% that donot use
computersbut have in
the past
% thatnever usedcomputersin teaching
or otheractivities Total (N)
Elementary Self-Contained 73 15 9 2 2 100 (386)
Elementary Other 64 14 14 4 5 100 (160)
English 65 10 20 4 1 100 (326)
Science 60 6 30 3 1 100 (312)
Social Studies 50 6 32 8 4 100 (212)
Foreign Language 38 17 38 0 8 100 (49)
Math 37 12 38 7 6 100 (262)
Mixed Academic Secondary 72 15 11 1 1 100 (135)
Computer 94 4 1 0 0 100 (102)
Business 82 11 0 4 3 100 (79)
Vocational 73 6 20 1 0 100 (76)
Fine Arts 36 17 39 4 4 100 (72)
Other Applied Secondary 40 11 43 2 5 100 (57)
All Teachers 60 11 23 4 3 100 (2,228)
Universe: All teachers in probability sample (grades 4-12, not including physical education).Class named by teacher as the one in which teaching goals are most often accomplished.
2 Defined as the subject-matter of the majority of the classes they taught. If a teacher taught different subjects todifferent classes, they were coded as "mixed academic" or "other applied," depending on the nature of the subjectstaught. If they taught all subjects to a single class, they were coded as teaching a "self-contained" class.3 In all tables, (N) refers to the actual number of teachers responding in that category. Percentages and meanshowever, reflect weights based on the inverse of the probability that each teacher has selected for the sample. Twodifferent weights were used, depending on whether the table refers to data from only the national probability sampleof schools (as in Table 1) or from teachers in both the national probability sample and the two categories ofpurposive samples of schools ("educational reform" and "high-end technology") that comprised 45% of the total setof schools studied. For further information about the sample and data collection methodology, see Appendix B atthe end of this document.
6

Nearly all teachers, including most of those who do not assign computer work, are computer usersthemselves. For eleven of the thirteen subject-level categories studied (all except secondary math andsocial studies), more than 90% of teachers either had their students use computers or used them for theirown professional needs.
Location of Computer Use
A majority of teachers whose students use computers makeuse of computers in their own classroom(nearly 80% at the elementary level and about 60% in middle and high schools). However, at each schoollevel only a minority of computer-assigning teachers uses their classroom as the sole primary location ofcomputer use during class time. Nearly 40% of elementary computer-assigning teachers (and 20% ofsecondary teachers) have their students do much of their computer work both in the classroom and inanother location. In most cases, that other location is a "computer lab," but sometimes the library ormedia center serves that function too. Moreover, one-fifth of computer-assigning elementary teachersand two-fifths of those at secondary levels make the computer lab (or other non-classroom location) theprimary place where their students do computer work during class time.
There are major differences between teachers of different subjects in where their students use computersduring class time. Those differences are discussed below under the topic of "access to classroomcomputers."
Frequent Use by Students
In Table 1, teachers were counted as "computer-assigning teachers" even if they had students usecomputers only rarely or occasionally. However, unless teachers assign computer tasks frequently,important consequences are not likely to occur. Table 2 draws attention to those classes4 where teachersreported that the typical student used computers on more than 20 class days during the school year.
Using that criterion for applying the term "frequent student computer use," we see that, as of Spring,1998, only one-fourth of all 4th-12th grade teachers (27%) gave students a frequent opportunity to usecomputers during class time. Variations across teachers of different subject-level categories are evengreater than for our measure of "any student computer use." The left-hand side of Table2 shows that thevast majority of secondary teachers of computer classes (80%) and two-thirds of secondarybusinesseducation teachers (70%) had the students in their selected class use computers on more than 20occasions. Also, a substantial fraction of vocational teachers (42%), elementary teachers of self-contained classes (43%), and secondary English teachers (24%) had their students use computersfrequently. At the other extreme, only 11 to 17 percent of secondary math, social studies and scienceteachers frequently assigned computer work, as did fewer than one in ten fine arts teachers.
4In Table 2, we focus on computer use in one class taught by each sampled teacher, which we call the 'selected'
class. This is the class where the teacher felt most accomplished in teaching. In this table, the teachers themselvesare defined not in terms of the subject that they taught most often, but by which subject they taught that particularclass.
7
10
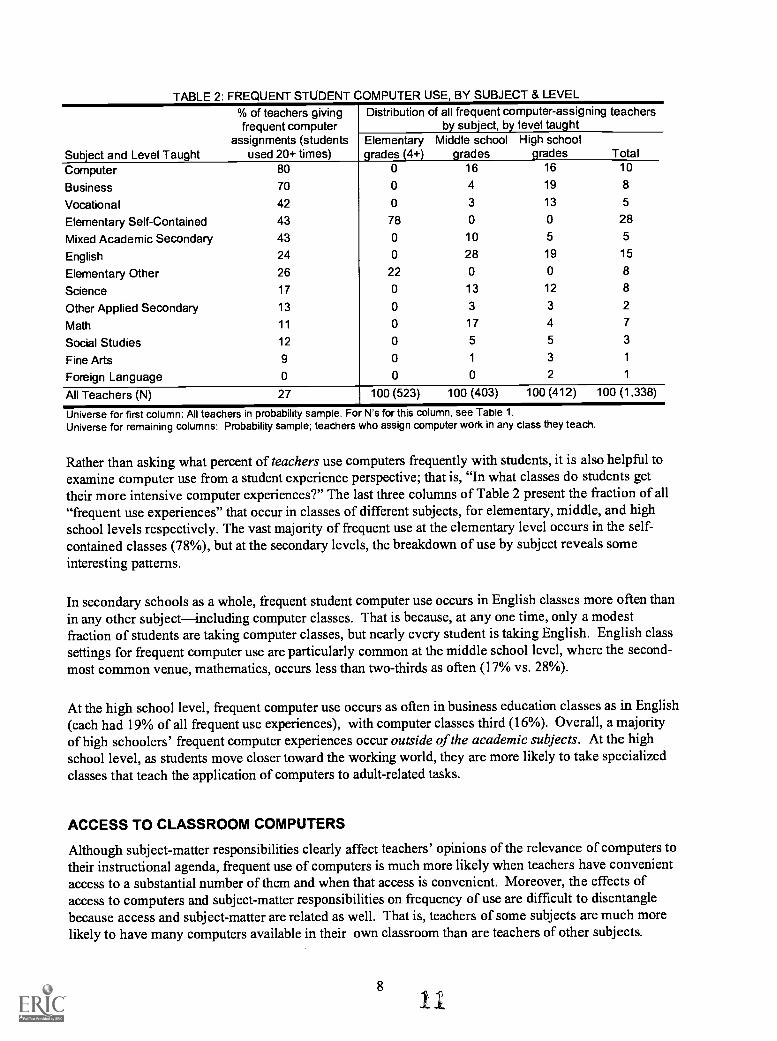
TABLE 2: FREQUENT STUDENT COMPUTER USE, BY SUBJECT & LEVEL
Subject and Level Taught
% of teachers givingfrequent computer
assignments (studentsused 20+ times)
Distribution of all frequent computer-assigning teachersby subject, by level taught
Elementarygrades (4+)
Middle schoolgrades
High schoolgrades Total
Computer 80 0 16 16 10
Business 70 0 4 19 8
Vocational 42 0 3 13 5
Elementary Self-Contained 43 78 0 0 28
Mixed Academic Secondary 43 0 10 5 5
English 24 0 28 19 15
Elementary Other 26 22 0 0 8
Science 17 0 13 12 8
Other Applied Secondary 13 0 3 3 2
Math 11 0 17 4 7
Social Studies 12 0 5 5 3
Fine Arts 9 0 1 3 1
Foreign Language 0 0 0 2 1
All Teachers (N) 27 100 (523) 100 (403) 100 (412) 100 (1,338)
Universe for first column: All teachers in probability sample. For N's for this column, see Table 1.Universe for remaining columns: Probability sample; teachers who assign computer work in any class they teach.
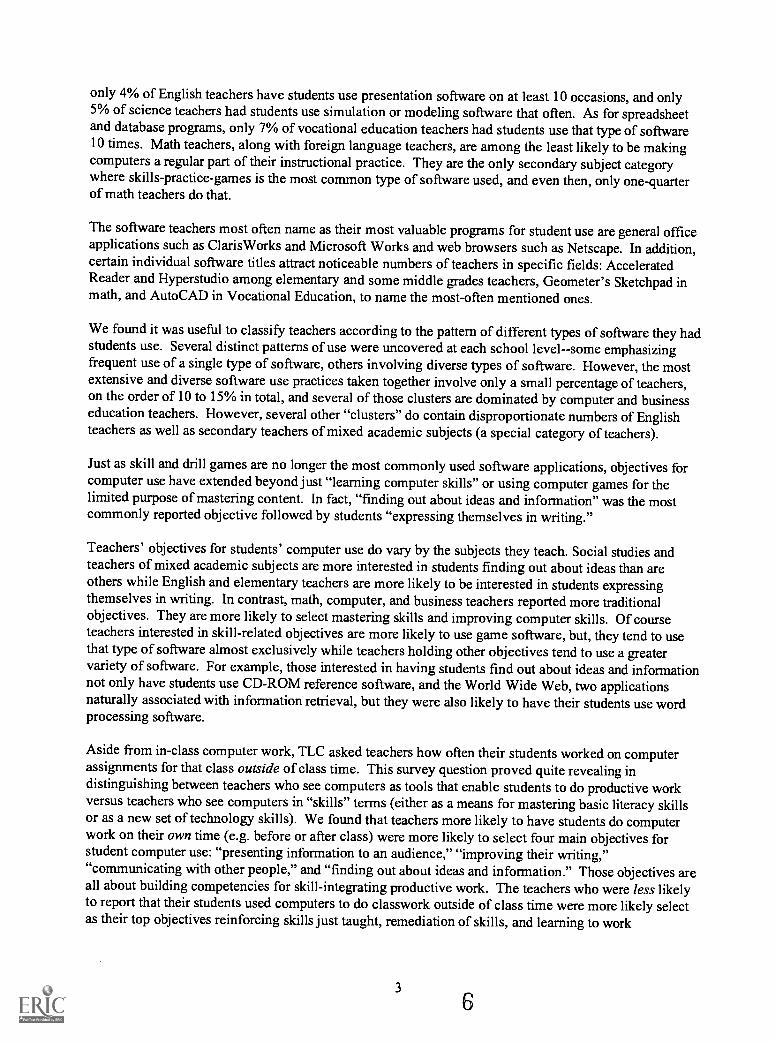
Rather than asking what percent of teachers use computers frequently with students, it is also helpful toexamine computer use from a student experience perspective; that is, "In what classes do students gettheir more intensive computer experiences?" The last three columns of Table 2 present the fraction of all"frequent use experiences" that occur in classes of different subjects, for elementary, middle, and highschool levels respectively. The vast majority of frequent use at the elementary level occurs in the self-contained classes (78%), but at the secondary levels, the breakdown of use by subject reveals someinteresting patterns.
In secondary schools as a whole, frequent student computer use occurs in English classes more often thanin any other subjectincluding computer classes. That is because, at any one time, only a modestfraction of students are taking computer classes, but nearly every student is taking English. English classsettings for frequent computer use are particularly common at the middle school level, where the second-most common venue, mathematics, occurs less than two-thirds as often (17% vs. 28%).
At the high school level, frequent computer use occurs as often in business education classes as in English(each had 19% of all frequent use experiences), with computer classes third (16%). Overall, a majorityof high schoolers' frequent computer experiences occur outside of the academic subjects. At the highschool level, as students move closer toward the working world, they are more likely to take specializedclasses that teach the application of computers to adult-related tasks.
ACCESS TO CLASSROOM COMPUTERS
Although subject-matter responsibilities clearly affect teachers' opinions of the relevance of computers totheir instructional agenda, frequent use of computers is much more likely when teachers have convenientaccess to a substantial number of them and when that access is convenient. Moreover, the effects ofaccess to computers and subject-matter responsibilities on frequency of use are difficult to disentanglebecause access and subject-matter are related as well. That is, teachers of some subjects are much morelikely to have many computers available in their own classroom than are teachers of other subjects.
8
1 1

Computer-Student Ratios in Classrooms
In particular, more than 80% of secondary teachers of computer education classes, two-thirds (67%) ofbusiness education teachers and 23% of vocational education teachers had a ratio of computers-to-students in their classroom of at least 1-to-4; that is, if they had 24 students, they had at least 6 computers.In comparison, that density of classroom computer access prevailed for only one in ten academicsecondary teachers and only 5% of elementary teachers. Only 7% of science teachers had a 1:4 ratio ofcomputers to students in their classroom, only 2% of the social studies teachers did, and none of the 30foreign language teachers studied for the analysis in Table 3 had that many computers in their classroom.In fact, among the secondary academic subjects, for only English and science did a majority of teachershave any computers in their classroom. At the elementary level, a small number of computers, typicallyone or two, were present in the classrooms of most teachers, whether teachers of self-contained classes orsubject specialists.
TABLE 3: CLASSROOM COMPUTER-STUDENT RATIO BY SUBJECT & LEVEL
Subject and Level Taught
Classroom Computer-to-Student Ratio
% with at least 1per 4 students
% with under1 to 4
% with nocomputers Total (N)
Computer 82 3 15 100 (50)Business 67 7 27 100 (31)Vocational 23 54 23 100 (43)Mixed Academic Secondary 22 24 53 100 (40)English 14 41 46 100 (167)Math 13 16 72 100 (149)Other Applied Secondary 12 19 69 100 (32)Elementary Other 11 59 30 100 (79)Science 7 47 46 100 (157)Fine Arts 6 22 72 100 (38)Elementary Self-Contained 3 68 30 100 (192)Social Studies 2 31 67 100 (93)Foreign Language 0 16 84 100 (30)All Teachers 13 39 49 100 (1,101)
Universe: Probability sample; questionnaire versions 1 and 2.
Number of Classroom Computers Needed For Frequent Use
Not surprisingly, for every subject-level combination examined, the more computers present in theclassroom, the more likely that a teacher will have students use them frequently. This holds true evenamong just the computer-assigning teachers, and it also holds true even when including classes that usecomputer labs or media centers as wellthe more computers in the classroom, the greater the level ofstudent use. For elementary teachers and for secondary English teachers, even small numbers ofcomputers in their own classroom lead half of them to use computers regularly with students. For mostother subjects, there has to be a substantial number of computers present (in our analysis, a 1:4 ratio ofcomputers to students) for a majority of computer-assigning teachers to make computer activities aregular and frequent component of their classroom practice. But when that happens, a majority ofsecondary social studies, science, and math computer-assigning teachers become frequent computer-assigning teachers.
9 12

Table 4 presents these findings. 5 For example, among science and social studies teachers who do assigncomputer work at least sometimes, only 9% assign work frequently (i.e., more than 20 times during theyear) if they have no computers at all in their classroom; 18% assign frequent computer work if they havesome computers in their classroom but fewer than one for every four students. However, among thosesecondary science and social studies teachers with at least 1 computer per 4 students, a majority of themassigned computer work frequently (53% of the 50 teachers studied, as shown in the second row of Table4). Differences as dramatic are shown in Table 4 for mathematics teachers and similar differences,though less dramatic, apply to English teachers and to teachers in applied secondary subjects.
In contrast, among elementary teachers, although having some computers in the classroom makesfrequent computer use more likely, having a 1:4 ratio of computers-to-students in the classroom does notappear to be as necessary a condition of frequent use.6 Perhaps this is because in most elementary classes,teachers see their students for much longer periods of time. As a result, they can use that extended time toorchestrate computer use among many students, even when they have only a handful of computerspresent. Another reason may be that given the ways that most elementary level teachers currently usecomputers (see Part II of this report) the most significant computer use may occur in computer labs awayfrom the classroom, so the number present in the classroom may not make so much of a difference infrequency of use.
TABLE 4: PERCENT OF COMPUTER-ASSIGNING TEACHERS WHOSE STUDENTS USE COMPUTERSFREQUENTLY, BY CLASSROOM COMPUTER-STUDENT RATIO, BY SUBJECT & LEVEL
CLASSROOM COMPUTER-TO-STUDENT RATIO
Subject and LevelTaught
At least 1 per 4students Under 1 to 4 No computers Total
% freq.user (N)
% freq.user (N)
% freq.user (N)
% freq.user (N)
English 82 (31) 51 (135) 16 (57) 48 (223)
Social Studies-Science 53 (50) 18 (211) 9 (75) 21 (336)
Math 89 (29) 14 (73) 7 (57) 23 (159)
Comp-Bus-Voc 87 (115) 40 (34) 66 (29) 74 (178)
All Other Secondary 71 (33) 31 (72) 17 (56) 32 (161)
Elementary 67 (61) 55 (332) 34 (81) 53 (474)
All computer-assigningteachers 77 (319) 37 (857) 21 (355) 41 (1,531)Universe: Probability and purposive samples; questionnaire versions 1 & 2; teachers who assign computer work inany class they teach.
Computer Access in Labs and Media Centers versus ClassroomsTeachers without a sufficient number of computers in their classroom generally have access to sharedschool or department facilitiesspecialized computer laboratories or more general resource areas such asa library or media center. Typically, computer labs and libraries accommodate many more students at onetime than computer-present classrooms do. (The typical lab has 21 computers; the typical classroom withany computers at all has only 2 of them.) Thus, teachers with only one or two classroom computers mayhave their students use computers in a lab instead of using the limited number in the classroom. Indeed,most teachers who give computer-based assignments do make some use of a computer lab or mediacenter, and 46% of teachers who have at least one computer in their classroom report using shared
5 In Table 4, subject categories were collapsed and teachers from the purposive samples were included in order thateach cell in the table was based on at least 30 (actually 29) cases.6 The difference in the percentage of frequent users among computer-assigning teachers is only 12 percentage pointsbetween elementary teachers with at least one computer in their classroom, but fewer than one-per-four students(55%); and elementary teachers with a better computer-student ratio (67%).
10
13

facilities as much as their classroom computers anyway. Even among teachers who have their studentsuse computers only sometimes (i.e., not frequently), three-fourths of them do so in a room where there isat least one computer for every four students (most often a computer lab or media center). This seems tobe the case across most subjects.
In sum, most teachers who use computers with their students, particularly at the secondary levels, usethem in some room where there are a substantial number of computers present. If they don't have a largenumber in their classroom, they will use a computer lab (but they will use computers less often than ifthey had them in their classroom). If they don't have enough computers in any location, they just won'thave students use them at all.
Which Promotes More Frequent Use: High Computer Density in Labs or Convenience ofClassroom Location?
How many computers in a classroom provide sufficient convenience and independence for teachers thatthose advantages outweigh the value of the larger number of computers in a shared computer lab? Underwhich condition is frequent computer use more likely to take placewhere there are many computersavailable in a lab or where there are a reasonable number in a classroom? Table 5 provides someinteresting contrasts. It shows that for secondary computer-assigning teachers in particular, both forteachers of academic subjects and other subjects that don't require computer use, a higher proportion ofteachers with five or more computers in their room give frequent computer assignments than those whosestudents use computer labs with 15 or more computers in themthree times as many computers.
TABLE 5: PERCENT OF COMPUTER-ASSIGNING TEACHERS WHO ASSIGN COMPUTER WORKFREQUENTLY, BY SUBJECT & LEVEL, BY NUMBER OF COMPUTERS IN CLASSROOM AND LAB
Number of computers in classroom and lab (or other outside location)None in 5 or more in All other (0-4 in
classroom; 1-4 in classroom; classroom class; under 15Subject and Level Taught 15+ in lab 15+ in lab (usually 5-8)** outside if available)Elementary 61% (200) 75% (99) 47% (123)Academic Secondary 18% (82) 32% (342) 62% (164) 22% (132)Computer and Business * * 88% (99)Other including Fine Arts andVocational 32% (36) 64% (44) 30% (58)Universe: Probability and purposive samples; questionnaire versions 1 & 2; teachers who used computers with their selected class.* Fewer than 20 cases** Includes both teachers who use labs and those who don't
Thus, secondary teachers with just five or six computers in their classroom are much more likely to usecomputers on a regular basis than are teachers of the same subjects who make use of computer labs withsubstantially more computers in them but who have few, if any, computers in their own room. This mayseem counter-intuitive since being in a lab with three times as many computers as these classrooms wouldseem to give individual students more opportunities to use computers. However, it seems that thecomputer's value in most secondary classes is not for concentrated whole-class use on a scheduled basis,but as a resource available for particular groups of students when needed to find, analyze, or communicateinformation.
This analysis does not take into account the economies that centralized placement of computers involve.In other words, if all of a school's two dozen academic subject-matter teachers had five computers in theirclassrooms instead of sharing 30 computers in a computer lab, four times as many computers in totalwould be required. Instead, what we are examining is the relative likelihood that students will receive asubstantial computer experience during instructional time. If centralized placement of computers does notresult in students getting a substantial experience with using computers to pursue academic goals, such
11
14

aggregation may not be efficient. We found that particularly in secondary schools with their short-duration class periods, students are much more likely to have a frequent computer experience when itoccurs primarily in the teacher's own classroom in which a 1:4 ratio of computers to students prevails.
COMPUTER PLATFORMS USED BY STUDENTS
During most the 1990's, American schools followed the pattern of American businesses and families ofmoving more of students' computer work onto computers running the Windows operating system. Thispattern was not uniform, however, and certain types of teachers have their students use computers withthe Apple Macintosh operating system. Although the two operating systems have strong similarities, theydo differ in the number of discrete instructional products available, in the learning time required tobecome expert in their use, and in other ways.
Table 6 shows the primary computer platform employed by the computer-assigning teachers in the study.Windows' dominance is clearest among secondary computer education teachers, business educationteachers, and vocational education teachersthe groups that are most likely to assign computer work tostudents frequently and who have access to higher ratios of computers to students. Macintosh computersare used by almost three-quarters of fine arts teachers, and that platform also dominates the arrangementswhere students of "miscellaneous-subjects" academic teachers use computers in secondary schools.Among elementary school teachers, those who teach specialized programs, rather than a self-containedclass, are more likely than are other elementary computer-assigning teachers to have their students useMacintosh computers.
TABLE 6: PERCENT OF COMPUTER-ASSIGNING TEACHERS WHOSE STUDENTS USE EACH COMPUTEROPERATING SYSTEM PLATFORM IN THE SCHOOL ROOM WHERE THEY USE COMPUTERS
Percent Whose Students Use...Macintosh Windows Apple II Mixed* Total (N)
Elementary self-contained 35 23 8 34 100 (311)Elementary other 59 32 2 8 100 (98)English 46 41 1 12 100 (180)Science 34 54 0 12 100 (199)Math 30 48 4 19 100 (113)Social Studies 21 64 5 10 100 (88)Foreign Language 56 44 0 0 100 (13)Miscellaneous Academic Sec. 45 36 3 16 100 (51)Computers 12 76 3 9 100 (80)Business 8 75 8 8 100 (34)Vocational 17 79 0 4 100 (40)Fine Arts 70 20 0 10 100 (27)Other Applied Secondary 7 93 0 0 100 (27)Elementary 42 25 6 26 100 (408)Middle School 42 49 2 8 100 (447)High School 23 60 2 15 100 (406)All computer-assigning teachers 35 45 3 16 100 (1,261)
Universe: Probability sample; questionnaire versions 1 and 2; teachers who used computers with students in their selected class.'The category "mixed" refers to situations where teachers selected more than one platform as primary in one location or selectedtwo locations with different primary platforms as equally common places where their students used computers for their selectedclass.
12
15

PART II. EXTENT AND VARIETY OF SOFTWARE USED AND TEACHERS' OBJECTIVESFOR USE
TYPES OF SOFTWARE USED
Studies of instructional uses of school computers conducted in the 1980's and early in the 1990's foundthat the primary uses of computer technology in schools involved students practicing basic math andlanguage arts skills and becoming "computer literate" (e.g., learning how to use different types ofsoftware). Today, although a large fraction of students' use of computers still occurs in special computerclasses and pull-out programs, we are seeing larger numbers of teachers going beyond simple skillspractice or basic computer literacy and having their students use computers to do productive workforexample, searching for information and producing written and visual products that reflect their cognitiveand creative effort.
Of all of the various types of software available on school computers, word processing software is by farthe most commonly used. Not only are English teachers, business education teachers and computerteachers more likely to have their students do word processing than any other computer activity, but soare science, social studies, vocational education, and elementary teachers. (See Table 7, wherepercentages of teachers who use "word proc." are shown in the first data column.) Altogether, 50% of all4th through 12th grade teachers have students use word processing software at least occasionally duringclass time.
Among elementary classes, games for practicing basic math and language arts skills are still common(second only to word processing). However in secondary schools, games are used much less frequently.In middle schools, drills and games are used by fewer teachers' students than are CD-ROM referencesoftware or Web browsers. In high schools, drill and game software is used by fewer teachers' studentsthan graphics software, spreadsheets, simulation and exploratory software, computer-aided presentationssoftware (e.g., PowerPoint), CD-ROMs or web browsers.
Mathematics teachers, however, appear to be an exception to this trend of using "tool-oriented" computerapplications in secondary schools (except perhaps for their use of graphing calculators, which was notpart of this survey of computer use). More math teachers use skills-practice games than any other type ofcomputer software.' Table 7 shows the percentage of teachers, by subject, who reported having theirstudents use each of ten different types of software on at least three occasions during the year.
' Note that "graphing software" was not a category used in the survey. However, graphing programs werementioned by relatively few math teachers in an open-ended question about the specific software they found to bemost valuable with their students.
13
16

TABLE 7: PERCENT OF TEACHERS REPORTING STUDENT USE* OF SOFTWARE DURING CLASS,BY TYPE OF SOFTWARE AND SUBJECT & LEVEL TAUGHT
Word Skill Simulations/Subject and Word Wide practice ExploratoryLevel Taught** Proc. CD-ROM Web games Environments Graphics
ElementarySelf-containedElementaryOtherEnglishScienceMathSocial StudiesForeignLanguageMixedAcademic Sec.ComputersBusinessVocationalFine Arts
Other AppliedSecondaryElementaryMiddle SchoolHigh SchoolAll teachers
2939 34
39 .35 3514 16277.1 l2 20 10
12
9
23
32 17
2310
22
17
12
27
16 13
23
t 3-7
9 21
22 212626
29 34 I
I 36 1 29
Ai
16
3 13 29
12 20 15
32, 2721 18 18
12 21 2028 23 21
Spread-sheets/
DatabasePresent-
ationMulti-media E-mail
8 7 11 8
13 10 199 12 5 7
19 8 8 9
13 5 3 1
12 16 11 8
9 2 8 3
16 10 9 1021 16
34 5 13
24 22 10 13
8 12 7 8
13 14 7 210 8 13 7
16 11 8 6
20 15 8 8
16 12 9 7
Universe: All teachers in probability sample. For N's, see Table 1."Use" defined as students in any of the teacher's classes having used that type of software on 3 or more occasions."'Subject" defined as the subject occupying a majority of the teacher's workload.
40%+30-39%20-29%
As Table 7 shows, besides word processing software for composing and editing text, two other types ofsoftware are in widespread useCD-ROM reference software and World Wide Web browsing software.Both of these enable students to gather information for research or simply to explore. In elementaryschool teachers' practices, the more controlled information bases on CD-ROMs are used much more oftenthan the more wide-open information repositories on the Internet. However, in high schools the WorldWide Web is used at least as often as CD-ROMs, and the Web is the information resource of choiceparticularly in computer-assigning foreign language classes, fine arts classes, computer classes, andbusiness education classes.
Use of analytic softwaresuch as spreadsheets, simulations and exploratory environmentsand product-oriented softwaresuch as presentation software, graphics programs, and multimedia authoringenvironmentsare used by fewer academic subject-matter teachers than use word processing orinformation retrieval software. However, computer and business education teachers are more likely to usemost types of analytic and product-oriented software than they are to use information retrievaltechnologies like CD-ROMs and the World Wide Web. For example, two-thirds of computer teachers andbusiness education teachers have students use spreadsheets while only about one-fourth to one-third havestudents use CD-ROMs. In contrast, only 19% of science teachers' students use spreadsheets, but nearlytwice that number have students use CD-ROMs. More than one-third of computer and business educationteachers have their students use presentation software, but that is done by only about 10% of teachers inthe academic subjects.
14 17 MINT COPY AVA111030

Overall, the broadest use of different types of software occurs among computer and business educationteachers, and the next broadest use is among secondary vocational education teachers, elementaryteachers, and a group we call "secondary teachers of mixed or other academic subjects." Those teachersare much more likely to have students use a variety of softwareor any one type of softwarethan aremore traditional "single subject" secondary teachers. That pattern is even clearer in Table 8, which showsthe percentage of each group of teachers whose students used each type of software on at least 10occasions during the school year (actually, over the 8 months, on average, between the start of the schoolyear and the completion of the survey).
TABLE 8: PERCENT OF TEACHERS REPORTING FREQUENT STUDENT USE (USE IN AT LEAST 10LESSONS), BY TYPE OF SOFTWARE AND SUBJECT & LEVEL TAUGHT
WordProc.
ElementarySelf-containedElementaryOther 39English li 38Science 24Math 4
Social Studies : 20ForeignLanguage 4MixedAcademicSecondaComputers 76
Business 78
Vocational 15
Fine Arts 10
Other AppliedSecondary 18Elementary 46
Middle School 26High School po.All teachers ''...32
World SkillWide practice
CQ-1301)/1 Web games
Simulations/Exploratory
Environments Graphics
Spread-sheets/
DatabasePresent-
ationMulti-media E-mail
11 12 11 2 2 4 3
25
_.,..,...XL___,
12 22 8 7 1 3 7 310 12 4 2 6 2 4 2 215 22 3 5 6 8 5 2 42 4 13 8 1 4 2 1 1
16 14 2 3 5 4 5 6 6
4 4 11 0 0 9 0 0 0
.t.,-4.
.-:, 21 10 7 17 9 6 8 515 v .38 202,... 22 23 29 13 93 14 16 19 20 22 2 512 15 1 21 :'' 16 7 6 3 34 7 0 1 15 0 1 2 1
4 5 7 2 7 4 4 3 1
28 12 -- 32 :
f11 10 2 3 5 3
.
13 7 6 8 5 4 212 9
10 16 5 6 9 9 7 3 416 13 14 7 8 7 5 4 3
Universe: All teachers in probability sample. For N's, see Table 1."Frequent Use" defined as students in any of the teacher's classes having used that type of software on 10 or more occasions."Subject" defined as in Table 7.
40%+30-39%20-29%
Table 8 shows that there are relatively few examples where a given type of software is being usedfrequently by at least of one-third teachers of any one subject. Only 11 times (out of 130 possible cells inthe first panel of Table 8) do we see frequent use by at least one-third of all teachers with their classes.Word processing accounted for nearly half of those (6), led, not surprisingly, by computer teachers andbusiness education teachers, three-fourths of which had students use word processing on at least tenoccasions. Computer and business education teachers accounted for 3 more examples, involving Web useand spreadsheets. The final two examples were elementary self-contained class teachers' use of skillpractice games and mixed academic secondary teachers' use of CD-ROMs. The rest of the combinationsof computer use by subject (119 of them) involved only a small percentage of teachers. For example,among English teachers only 4% had students use presentation software on at least 10 occasions. Amongscience teachers, only 5% had students use simulation or modeling software that often. Among
BEST Copy VAOLABLE 15
18

vocational teachers, only 7% had students make frequent use of spreadsheets or database software. Andonly 4% of math teachers had students use word processing 10 times. Outside of business and computerteachers, outside of word processing, CD-ROM use, and World Wide Web use, and outside of skillpractice games in elementary school, there were almost no examples of a type of software being usedfrequently by more than 20% of any one category of teacher.
In summary, it appears that most types of software have their widest diffusion in applied and electiveareas of the secondary school curriculum where teachers are freer to adopt technology-based approachesto instruction. Except for word processing, CD-ROM software, and the World Wide Web, relatively fewcollege preparatory academic teachers (who are perhaps constrained by their notion of college admissionstandards) even experiment with simulation software, graphics software, presentation software,spreadsheets, or databases.
Teachers in those subjects not only have fewer classroom computers, but they may be more constrainedby expectations for subject-matter coverage against implementing teaching approaches in which computeractivities are tools for student projects. As a result, one would not expect to find major outcomes ofstudent computer use in schools by examining high school students' achievement on academic tests ofmathematics skill or science or social studies knowledge. It would be more appropriate to attend to thecompetencies likely to be affected by the ways computers are usedprimarily, given the broad use ofword processing, in terms of writing competence, and in a range of applied secondary courses whereteachers prepare students to be productive users of occupationally relevant technology tools andresources.
SOFTWARE THAT TEACHERS JUDGE AS MOST VALUABLE FOR STUDENTS
Separately from asking teachers about how often they had students use different types of software, wealso asked teachers to name several of the "best" or "most valuable" software programs that students intheir selected class had used (including Internet access software).8 Programs named as "best" or "mostvaluable" by 5% or more of all computer-assigning teachers of a given subject are shown in Table 9.
ClarisWorks (now AppleWorks), the integrated office application, is clearly the program most widelyviewed by teachers as most valuable for students. Twenty percent of both elementary and middle schoolteachers who gave students computer work found it to be one of the two or three best programs forstudents, as did 12% of high school teachers who assigned computer work. In every subject categoryexcept business education, at least 10% of computer-assigning teachers judged it that way. At thesecondary level, in those subjects where teachers are least likely to frequently assign computer work (i.e.,academic subject teachers and teachers of fine arts) it is named by at least 15% of computer-assigningteachers. Interestingly, in secondary subjects where teachers are most likely to assign computer work tostudents on a frequent basis (i.e., computer and business classes), teachers are less likely to nameClarisWorks as one of their most valuable programs. ClarisWorks, thus, appears to serve as an easy-entrygeneral-purpose software tool that meets the needs of occasional computer-assigning teachers. Whenthey become more expert and more specialized in their needs, they move on to other programs forfulfilling these basic office functions.
8 The question about "best programs used by students" was asked of 50% of the survey sample. The question aboutthe "most valuable" software was asked of the other 50%. The latter question, though, was asked differentlyitincorporated both teacher use and student use and inquired separately about each of the past five years. The analysisin this section incorporates answers from both questions, except that for the second group, only reports about thepast two years are included and only when the software appeared to be used by students rather than the teacherherself.
16 19
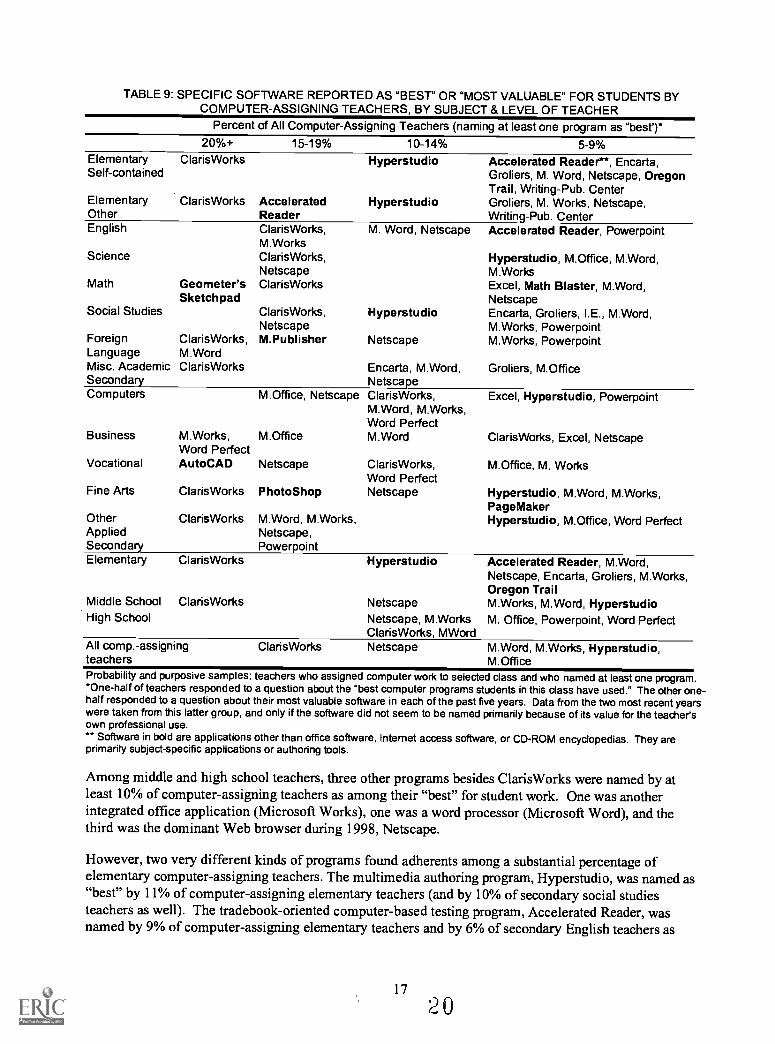
TABLE 9: SPECIFIC SOFTWARE REPORTED AS "BEST" OR "MOST VALUABLE" FOR STUDENTS BYCOMPUTER-ASSIGNING TEACHERS, BY SUBJECT & LEVEL OF TEACHER
Percent of All Computer-Assigning Teachers (naming at least one program as "best')*20%+ 15-19% 10-14% 5-9%
ElementarySelf-contained
ElementaryOtherEnglish
Science
Math
Social Studies
ForeignLanguageMisc. AcademicSecondaryComputers
Business
Vocational
Fine Arts
OtherAppliedSecondaryElementary
Claris Works
Claris Works AcceleratedReaderClaris Works,M.WorksClarisWorks,Netscape
Geometer's ClarisWorksSketchpad
Claris Works,M.WordClaris Works
Claris Works,NetscapeM.Publisher
Hyperstudio Accelerated Reader**, Encarta,Groliers, M. Word, Netscape, OregonTrail, Writing-Pub. Center
Hyperstudio Groliers, M. Works, Netscape,Writing-Pub. Center
M. Word, Netscape Accelerated Reader, Powerpoint
Hyperstudio
Netscape
Encarta, M.Word,Netscape
M.Office, Netscape ClarisWorks,M.Word, M.Works,Word PerfectM.WordM.Works, M.Office
Word PerfectAutoCAD Netscape
Claris Works PhotoShop
Claris Works M.Word, M.Works,Netscape,Powerpoint
Claris Works,Word PerfectNetscape
Hyperstudio, M.Office, M.Word,M.WorksExcel, Math Blaster, M.Word,NetscapeEncarta, Groliers, I.E., M.Word,M.Works, PowerpointM.Works, Powerpoint
Groliers, M.Office
Excel, Hyperstudio, Powerpoint
ClarisWorks, Excel, Netscape
M.Office, M. Works
Hyperstudio, M.Word, M.Works,PageMakerHyperstudio, M.Office, Word Perfect
Middle SchoolHigh School
Claris Works
Claris Works
All comp.-assigning Claris Works
Hyperstudio
NetscapeNetscape, M.WorksClaris Works, MWordNetscape
Accelerated Reader, M.Word,Netscape, Encarta, Groliers, M.Works,Oregon TrailM.Works, M.Word, HyperstudioM. Office, Powerpoint, Word Perfect
M.Word, M.Works, Hyperstudio,teachers M.OfficeProbability and purposive samples; teachers who assigned computer work to selected class and who named at least one program.*One-half of teachers responded to a question about the "best computer programs students in this class have used." The other one-half responded to a question about their most valuable software in each of the past five years. Data from the two most recent yearswere taken from this latter group, and only if the software did not seem to be named primarily because of its value for the teachersown professional use.** Software in bold are applications other than office software, Internet access software, or CD-ROM encyclopedias. They areprimarily subject-specific applications or authoring tools.
Among middle and high school teachers, three other programs besides ClarisWorks were named by atleast 10% of computer-assigning teachers as among their "best" for student work. One was anotherintegrated office application (Microsoft Works), one was a word processor (Microsoft Word), and thethird was the dominant Web browser during 1998, Netscape.
However, two very different kinds of programs found adherents among a substantial percentage ofelementary computer-assigning teachers. The multimedia authoring program, Hyperstudio, was named as"best" by 11% of computer-assigning elementary teachers (and by 10% of secondary social studiesteachers as well). The tradebook-oriented computer-based testing program, Accelerated Reader, wasnamed by 9% of computer-assigning elementary teachers and by 6% of secondary English teachers as
17
20

well. Neither of these programs fit into the office application-web-browser-generic tool category of theother popular programs. Hyperstudio is used for enabling students to produce media-integrated products,while Accelerated Reader has become a highly popular system for increasing student effort in reading.(In Table 9, all "specialized" softwarethat is, other than the most common office applications or Webbrowser softwareis shown in bold type.)
In a few secondary school subjects, one or two specialized software titles have become popular with asubstantial fraction of computer-assigning teachers. In mathematics, the inductively-oriented program,Geometer's Sketchpad, was mentioned by more than one-fifth (21%) of all math teachers who reported a"most valuable" software title for use with their students. Similarly, the adult-level automated draftingprogram, AutoCAD, was reported to be their most valuable software by nearly one-fourth (24%) of allvocational education teachers who used computers with their classes.
In vocational education classes, AutoCAD plays a similar role that adult-level office software (e.g.,Microsoft Office, Word Perfect, etc.) does in business education classesas an occupational tool forwhich skill mastery is an explicit goal. However, the high percentage of mathematics teachers whoreported Geometer's Sketchpad to be among their best software was unexpected. Most academic subjectareas have many specialized software titles, causing utilization to be split among many differentprograms. Moreover, most computer-assigning mathematics teachers use very traditional skill-practicesoftware, and Geometer's Sketchpad is oriented very differently, towards inductive reasoning andexploration of hypotheses. (In comparison, the spreadsheet program Excel was selected by only 8% ofcomputer-assigning math teachers.) Finally, the Sketchpad program has its principal applicability in onlyone area of mathematics rather than being used across the full mathematics curriculum.
Besides Sketchpad and AutoCAD, the only non-office, non-web-browser programs to be selected bymore than 10% of computer-assigning teachers in any given subject were PhotoShop, the adult-levelimage-editing program, chosen by 18% of computer-assigning fine arts teachers, and Microsoft Publisher,a graphics-oriented word processing program, named by 14% of the small number of computer-assigningforeign language teachers.
The only other software (besides other word processing and office oriented titles) to appear in Table 9'slist of software selected by at least 5% of computer-assigning teachers of particular subjects were twoCD-ROM-based encyclopedias (Encarta and Groliers), the game-like social studies simulation OregonTrail, and "math blaster" type math drills. Recall, though, that Table 9 does not show all of the softwarethat teachers use with students, but only those titles named by teachers as "best" or "most valuable" foruse with students.
PATTERNS OF SOFTWARE USE
Some teachers have their students use only one or two types of software, while other teachers integrate avariety of types of software into their students' learning. For example, many teachers have their studentsonly use word processing or only skill-practice games and drills and don't have them use other computerapplications except occasionally. At the other extreme, teachers whose students frequently use multimediaauthoring or presentation software or e-mail typically have their students use many other types ofsoftware as well. Specifically, one-half (51%) of teachers whose students frequently use multimediaauthoring software also at least occasionally have students play computer games for practicing skills, butonly 17% of teachers whose students frequently use computer-based skill games also use multimediasoftware on occasion. The same pattern exists for teachers who used e-mail and presentationsoftwarethat is, a much higher proportion of them also reported using games but the reverse was nottrue.
1821
We can see three reasons for the difference in the breadth of computer-based teaching between teacherswhose students use word-processing or skill-games and those who have students use presentation, e-mail,and multimedia software. First, these two groups of teachers may have different teaching responsibilities.Teachers of computer classes would be likely to have students use a greater variety of software thanwould history teachers, for example. Second, there is an order of difficulty involved in the use ofdifferent types of software. In order for their students to use presentation software or multimediaauthoring software, teachers must have greater facility with having students do computer-based projects,and they may need more general expertise in the use of computers as well. Third, teachers whosestudents do e-mail and multimedia projects may have different objectives for computer use and differentteaching philosophies than those who assign computer-based drills or word processing. For example,they may see students using computers to learn through making products or through communicating ideasto others while skill-game-using teachers and even many word-processing-assigning teachers may seecomputers as valuable for students to simply "do school work." In this section of this report, we examinethe patterns of software use among different groups of teachers, and how their pattern of use relates totheir teaching responsibilities, computer expertise, and their objectives for computer use.
A Typology of Teachers' Software Use
"Cluster Analysis" is an iterative process of sorting people's responses to survey questions intoa set ofcategories so that people with similar patterns of responses are grouped into the same category. In thiscase, the survey responses are each teacher's report of the frequency that they had their students use eachof 10 types of software. Because the age of their students so clearly affects the types of software thatteachers use, the sorting was done separately for elementary, middle, and high school teachers. Onlyteachers who reported some use of software by their students during class were included in the analysis.For each level of teaching, we specified that the clustering procedure9 produce 10 different groups definedaccording to the similarity and distinctions in their reports of how frequently they had students usedifferent types of software.
For all three levels, the largest number of computer-assigning teachers were part of a clusterwe wouldcall "limited users." These are teachers who do have students use computers, but no type of software isused more than occasionally (among the 10 software types listed in the questionnaire). These limitedusers constitute nearly 30% of all teachers. (See Table 10.) When added to the 30% of teachers who do
9 K-Means clustering (or "Quick Cluster" in SPSS).
19 22

TABLE 10: CLUSTER ANALYSIS OF PATTERN OF SOFTWARE USE (MEAN SCALE SCORES*)ELEMENTARY CLUSTER PROFILESCluster:Unweighted (N)Weighted (N)% within Elementa level**Word ProcessingCD-ROM ReferenceWWW BrowserGamesGraphics Oriented PrintingSimulationsSpreadsheet/DatabasePresentation softwareMultimediaE-Mail
1-1 1-2 1-3 1-4 1-5 1-6 1-7 1-8 1-9(306) (163) (97) (65) (52) (108) (10) (82) (36)(241) (124) (85) (50) (26) (55) (7) (60) (25)30% 15% 10% 6% 3% 7% 1% 7% 3%
1.51.4 1.60.6 1.1 0 8
.1 2.90.5 0.7 1 51.0 1.0 1.00.2 0.9 0.40.2 0.4 0.60.2 0.5 0.50.2 0.3 0.4
5.5.1 6.5, .6.0: 6.01 6 3.8 5.9'0 7 2 1 8.0 1 2
I ,47 2922 20
2.2 1.8 1.5 4.30.3 1.4 0.6 1 4 0 6 2 4 r 3 60.9
8.0'
1-10(35)(14)2%
7.94- 8.0.6.8- 6.8' 7.5 7.81
0 4
0.50.2
, 7.90.5
1.3 00 05 111.2 8,0 0 5 1 42.4 2.0 1.0 0.4 4.5
40.3 62.824% 64%
Total 8.7 18.0 22.5 24.8 31.7 33.6 35.5% students used twice/week 17% 20% 22% 28% 46% 49% 14%
38.039%
MIDDLE SCHOOL CLUSTER PROFILESCluster: 2-1 2-2 2-3Unweighted (N)Weighted (N)% within Middle School level**Word ProcessingCD-ROM ReferenceWWW BrowserGamesGraphics Oriented PrintingSimulationsSpreadsheet/DatabasePresentation softwareMultimediaE-Mail
(463)(459)31%
1.61.01.00.80.60.80.60.40.20.2
(173)(165)11%
2.30.81.01.91.01.60.80.50.4
(59)(74)5%2.51.01.2
2-4(50)
(44)3%
7.940.53.12.50.60.30.1
2.25.5-1.31.1
1.31.61.02.5.32 .L10.4
2-5(71)(52)4%391.7
0.81.71.40.81.50.51.9
2-6(98)(80)5%
2-7(43)(30)2%
2-8(51)(36)2%
2-9(42)(28)2%
2-10(53)(34)2%
7.2:. 7,7' 8.0 8.0i.8.0- 615r 3.7 -4:1 6.216.8- 1 5 7.7 4.1 7:8k1.6 1 1 4.72.0 391.2 143:5 3.71.2 1.2 5.3 ,J'4.81.7 1.50.6 0.91.0 0.3
6.5
5.8
3.913 02
Total 7.2 18.3 19.7 20.1 22.1 31.3 36.4 38.7 48.3 56.6% students used twice/week 7% 22% 20% 25% 31% 30% 27% 41% 59% 43%
HIGH SCHOOL CLUSTER PROFILESCluster: 3-1Unweighted (N) (347)Weighted (N) (420)% within High School Level** 24%Word Processing 1.3 0.7 3.9. 2.0CD-ROM Reference 0.9 1.2 1.0 L. 31'WWW Browser 1.1 1.0 1.3Games 0.4 3.r .; 0.2Graphics Oriented Printing 0.4 0.3Simulations 0.6 1.3Spreadsheet/Database 0.6 0.6 1.2
Presentation software 0.4 0.6 0.8Multimedia 0.2 0.4 1.4
E-Mail 0.2 0.1 0.3
3-2(70)(84)5%
3-3(55)(57)3%
3-4(69)(68)4%
3-5(220)(239)14%
3-6(107)(104)6%
3-7 3-8(57) (59)(46) (40)
2%3%
3-9(45)(36)2%
3-10(37)(27)2%
8.0
7.0'0.70.81.51.41.20.70.8
3.0- 0.92.1
1.1 0.90.9 2.41.3 2.90.70.90.50.6
7.21.30.40.6
0.52.61.31.21.71.1 2.0 2.7
2.7 1.8 2.5
7.7' 7:0;6.6 6.6z
7.81
Total% students used twice/week
6.1 12.8 19.4 19.7 20.4 24.8 31.1 43.9 46.0 51.17% 13% 53% 15% 20% 57% 29% 45% 68% 71%
Universe: Probability and purposive samples; teachers who assign computer work in any class they teach.* Scale score entries have maximum values of 8.0. Scores based on the coding of the number of lessons in which teachers usedsoftware with students.** Row does not add to 100%. The remaining teachers are those who do not use computers with students.
5.0 +3.0 - 4.9
11.8 - 2.9
MIFST COIFY AVARILABILE 20
23

not use computers with students at all (Table 1), this leaves only 40% of teachers whose pattern ofcomputer use we will discuss in this section.1°
Each of the clusters 2 through 10 (numbered 1-2 to 1-10 for elementary, 2-2 to 2-10 for middle, and 3-2through 3-10 for high school) are teachers whose pattern of student software use is relativelyhomogeneous and distinct. We will describe several of these at each school level; the remainder can becharacterized by an examination of Table 10.
Selected Elementary Level Clusters
At the elementary level, 15% of teachers belong to Cluster 1-2. These teachers have students use wordprocessing frequently (the score of 8.0 in Table 10 for Cluster 1-2's use of word processing is themaximum possible in our coding system), but they rarely have students use any other type of software,except for skill-related computer games. In contrast, in elementary Cluster 1-8, which encompasses 7%of all elementary teachers (grades 4-6), students make relatively frequent use of three types of softwarebesides word processing: CD-ROM reference titles, skill-related games, and simulation software. Inaddition, students in Cluster 1-8 classes occasionally use the World Wide Web. For further contrast, inelementary Cluster 1-5, involving 3% of all upper-grade elementary teachers, the software that studentsuse the mosteven more than word processinginvolves assembling and producing their own multimediapresentations. In Cluster 1-5, students don't use computers more than in Cluster 1-8; they just use itdifferently. They are less likely to use skill-based computer games or CD-ROMs, and make hardly anyuse of simulations, but they do occasionally use software to present their work to their classmates. Thus,in Cluster 1-5 students' use is oriented more towards producing and explaining things rather thanacquiring facts or using games or exercises to learn basic skills. In the final section of this report, we willshow a number of ways that teachers in these three clusters (and others) differ from one another. Forexample, teachers in Cluster 1-5 are more than twice as likely as teachers in the other two clusters, 1-2and 1-8, to be highly proficient in computer skills themselves (i.e., scoring in the upper-third ofteacherson a measure of expertise in computer operations).
Middle Grades Diverse-Use Clusters
At the middle school level, there are five different clusters whose teachers provide students with asubstantial variety and frequency of computer use (Clusters 2-6 through 2-10). However, each of the fivediverse-use clusters has a relatively distinct pattern in the types of software students use. Students in allfive clusters make substantial use of word processing, but Cluster 2-6 is otherwise focused only on CD-ROMs and the World Wide Web, while Cluster 2-7 teachers have students use CD-ROMs, games, andsimulations, but not the Web, and Cluster 2-8 teachers' students use the Web a great deal, along withmore occasional use of a variety of software including spreadsheets, presentation software, andmultimedia authoring. Cluster 2-9 teachers' students are particularly heavy users of presentationsoftware, multimedia authoring, and graphics related programs for printed output, but they are not as"information"-oriented as Clusters 2-6 through 2-8. Cluster 2-10 shows the broadest pattern of softwareuse even extending to student electronic mail. Altogether, these five clusters involve only 14% of all
ioIn order to make use of all teachers' data, the percentages and rates in this section come from the full set of TLC
schoolsthat is, both the probability sample and the various purposively selected reform-involved and high-technology schools. However, in many respects, differences among these two samples of teachers are hardlynoticeable. For example, the percentage of teachers who are in clusters 2 through 10 combined (whom we mightcall "regular computer-assigning teachers") is nearly the same in the probability sample as it is among the teachersin the reform-plus-high-tech TLC schools (the purposive sample). For example, 54% of probability-sampleelementary teachers regularly assign computer work compared to 56% of teachers in the elementary schools in thepurposive sample. (Comparable percentages for middle school teachers are 37% for each sample; and for highschool teachers, 42% in the probability sample and 39% in the purposive sample.)
21
24

middle school teachers. About an equal number of computer-assigning middle school teachers fall intojust two other clusters: the 11% whose main student computer activity is word-processing plus the 5%whose primary activity is skill-related computer games.
At the secondary school levels, both middle- and high school, subject-matter responsibilities stronglyaffect the placement of teachers into different clusters. Three groups of middle-grades teachers areparticularly likely to be in the five "diverse-use clusters"teachers who primarily teach classes incomputers, vocational education teachers, and teachers of mixed academic subjects. Those teachers areabout twice as likely to be in one of the diverse-use clusters than into one of the others, "limited-use" or"specialized-use" clusters. For comparison, most of the single-subject academic teachers are split aboutevenly between limited- or specialized-use clusters and diverse-use clusters. The most sharply distinctivepattern is held by computer-assigning middle grades mathematics teachers. Those teachers are five timesas likely to be in the limited- or specialized-use clusters as in the diverse-use clusters. Looked at anotherway, only 4% of the diverse-use cluster teachers are from math, whereas math teachers comprise 20% ofthe limited- or specialized-use cluster teachers. (See supplementary Table A-1 in Appendix A.)
High School High-Use Clusters
In high schools, the most active computer-assigning teachers also fall into five clusters. As with the morediverse-use clusters at the middle school level, relatively few teachers belong to these upper-end clusters.Altogether, for example, only 6% of high school teachers comprise Clusters 3-8 through 3-10, and only9% additionally comprise Clusters 3-6 and 3-7. Although three-fourths (78%) of all teachers of computereducation courses belong to these five clusters, only 12% of science teachers, 9% of English and socialstudies teachers, and 5% of math teachers do. (See supplementary Table A-2.)
One of these high-use clusters (Cluster 3-6) is focused on the traditional computer literacy applications ofinstruction in word processing, spreadsheet, and database softwareand almost nothing else. More thanhalf (53%) of the teachers in this cluster are computer education or business education teachers. (Seesupplementary Table A-3.) Another cluster (3-7) is heavily Internet-dominated, involving not onlysubstantial use of the Web, but substantial student use of electronic mail as well. The teachers in thiscluster come primarily from academic subjects, most commonly English (25% of Cluster 3-7 teachers). Inthis group, comparatively few teachers report that typical students in the classroom have used computersmore than 40 days (twice/weekly) during the year. (See the bottom row in Table 10.) This may have todo with having a limited number of convenient Internet connections and e-mail accounts, since at the timeof this study few academic classrooms had high-speed Internet connections and few schools provided (oryet provide) e-mail accounts to students on locally-controlled servers.
The other three high-use high school clusters are characterized by substantial use of both word processingand presentation softwarein other words, both writing and speaking. Cluster 3-8 involves courses thatare information-oriented; both CD-ROM reference software and World Wide Web browsers accompanythe word processing and Powerpoint (presentation) activities. Like the previous cluster, 3-7, it is alsoprimarily drawn from teachers of academic subjects, and, again, English teachers are most prevalent.
In contrast, Clusters 3-9 and 3-10 are primarily populated by teachers of computer classes and businesseducation classes. Both involve the frequent use of several types of software in addition to wordprocessing and presentation software, with most other types of software used occasionally as well. ForCluster 3-9, the most-used software includes spreadsheets and Web browsers. For Cluster 3-10, itincludes spreadsheets, simulations, and graphics-oriented print programs. At this point, it is hard to seewhat distinguishes these final two clusters. However, as we will show later, one cluster is heavily drawnfrom teachers whose computer access is in their own classroom, while the other cluster overwhelmingly
22
25

uses computer labs. One cluster's teachers teach students who are high in overall academic achievementand teach in high socio-economic status communities; the other's students are slightly below average inacademic achievement and come from lower than average socio-economic backgrounds. We will explorethose differences further at the end of this paper.
Middle and High School "Specialized-Use" Clusters
At each school level, some clusters are characterized by the use of one particular type of software withstudents, if not exclusively then at least far more than any other type. We already pointed to Cluster 1-2at the elementary level, whose students experience computers primarily through word processing (andsecondarily through games). Cluster 2-2 is similar at the middle school level, except that CD-ROMs andgraphics-oriented printing substitute for games as a secondary computer activity. Cluster 3-5 iscomparable for high school teachers except that these teachers also have their students use the WorldWide Web and/or CD-ROMs. English teachers and science teachers constitute the largest fraction ofteachers who fit the "primarily word-processing" Clusters 2-2 and 3-5.
Math teachers constitute nearly one-half (47%) of the teachers in middle school Cluster 2-3, in whichskill-based games are the dominant mode of computer activity, supported by simulations and limitedspreadsheet or database work. Industrial arts and fine arts teachers together are the majority of teachers inhigh school Cluster 3-3, whose teachers report very frequent use of graphics software (CAD in industrialarts, varied drawing and design software in fine arts) along with word processing software as well. Highschool science teachers are one-third (33%) of the teachers in Cluster 3-4, where use focuses on WorldWide Web browser programs like Netscape, along with some CD-ROM reference software. Interestinglyenough, very little word processing is done in those classes. A somewhat similar cluster, 2-5, is formed atthe middle school level by teachers from a wide range of subjects whose students use Web browsersoftware supported by word processing.
Although the teachers in these "specialized-use" clusters have students use a less varied array of software,many of them make computers a part of their classes' instructional activities. Overall, about 25% of theteachers in these clusters have had their "typical student" use computers on more than 40 occasionsduring the year (twice/weekly). Thus, another way of classifying teachers would be to create categoriesbased on both extent of student computer use and variety of software used. Supplementary Table A-4describes how teachers of specific subjects are allocated among several categories of diversity andfrequency of student software use. (That table employs a somewhat weaker "weekly or more" frequencyof use criterion.)
After we discuss several other aspects of teachers' computer usethe objectives they have for students'use, their students' use of computers outside of class, the extent to which they use computers themselvesprofessionally, and their self-perceived expertise in using computerswe will provide a richer portrait ofmany of these software-use clusters.
OBJECTIVES FOR COMPUTER USE
Not only is there a wide variety of different kinds of software that teachers can use with students, butmost types of software can be used for different instructional purposes by different teachers. Forexample, one teacher may have students do word processing in order to improve how well theycommunicate their ideas, while another teacher may have students use the same software so they canbecome more proficient in basic grammar, and another may have students do word processing in pairs ortriplets in order for them to learn to work more collaboratively. We asked each teacher whose selected
23
26
class used computers to indicate which of ten different objectives they had for their students' computeruse, and then to pick the three objectives that were most important for them.
Across grades 4 to 12, the two most commonly selected objectives of teachers who assign computer workto their students were "finding out about ideas and information" (51%) and "expressing themselves inwriting" (44%)two objectives closely linked to the two most common types of software in use wordprocessing and CD-ROM reference software. (See Table 11.) Third and fourth in teachers' estimationwere "mastering skills" (37%) and "improving computer skills" (32%). Although previous nationalsurveys did not ask the same questions about teachers' objectives, other data from those earlier surveysconducted in 1989 and 1992 suggests that the rank-ordering between these pairs of objectives (basic skillsand computer skills versus writing and information-seeking) has flip-flopped over the past decade. Inother words, the use of computers to have students learn content knowledge and to improve their writinghas taken over from the "computer literacy" and "skills practice" objectives that dominated students'teacher-directed computer use during the 1970s and 1980s. This suggests that teachers are now seeingcomputers as advantageous for somewhat more complex competencies than the role they assigned tocomputers heretofore.II
Even among elementary teachers, the writing and information-acquisition objectives were more commonthan the skills objectives. In fact, a higher percentage of elementary (grade 4-6) computer-assigningteachers than secondary teachers named "writing" as a principal objective. Still, elementary teacherswere also more likely than teachers at other levels were to report that "remediation of skills not learnedwell" and "computer skills" were among their top three objectives for computer use. In contrast,computer-assigning teachers of older children were more likely to point to objectives such as havingstudents analyze information and present it to others as a main reason for using computers.
Quite understandably, teachers of different subjects also have different objectives for their students'computer use. (See Table 11 for overall differences and see supplementary Table A-5 for numericalpercentages.) Some of the differences are self-evidentfor example, that English teachers are morelikely than other teachers to use computers to help students improve their writing, or that computerteachers are more apt than others to have "improving computer skills" as a principal objective. However,other patterns of objectives chosen in response to this survey question suggest that different pedagogicalperspectives may characterize teachers of different subjects. For example, the teachers most likely tobelieve that a main objective for using computers is "remediation of skills not previously learned" arebusiness education teachers (82% of which selected this objective). (Also, math teachers were morelikely than others were to make this choice, clearly by using computer-based drills and games for thatpurpose.) Foreign language and vocational education teachers were more likely than other teachers wereto value computers for helping students to work at learning their subject independently from others.
n An important reservation to this claim should be noted: A large fraction of students' more intensive computerexperiences occur in computer education and business education classes, and teachers of those classes are less likelythan average to prioritize improvement of student writing as a primary objective. (See text below)
24
27

TABLE 11. SUBJECT-MATTER TEACHERS MORE LIKELY AND LESS LIKELY THAN AVERAGE TO NAME EACHOBJECTIVE AMONG THEIR MOST IMPORTANT OBJECTIVES FOR STUDENT COMPUTER USE
Much MoreLikely More Likely Less Likely
Much LessLikely
Finding out about ideas & info. (51%of all computer-assigning teachers)
Misc. AcademicSocial Studies
Foreign Lang. Business Ed.Computer Ed.
Math
Expressing self in writing (44%) English Elem. Self-Cont. Business Ed. Computer Ed.Math
Reinforcement Business Ed. English("Mastering skills just taught") (37%) Math Social Studies
Misc. Academic
Computer skills (32%) Computer Ed. Business Ed. . EnglishElem. Self-Cont. Foreign Lang.
D)
a)
Fine Arts
Analyzing information (27%) Science Foreign Lang.Computer Ed.
Remediation of skills (24%) Math Elem. Other Social StudiesMisc. AcademicComputer Ed.Vocational Ed.
Collaboration (24%) Misc. Academic Elem. Other Foreign Lang.Social Studies
Independent work (23%) Foreign Lang. Business Ed. ScienceVocational Ed. Fine Arts
Presenting info. to an audience (18%) Fine Arts ElementaryEnglish
Communicating electronically (9%) Misc. Academic MathComputer Ed.
What is also interesting is to identify the subjects whose teachers are least likely to select a givenobjective as among their most important ones for having students use computers. Foreign languageteachers, for example, were much less likely than others to select "learning to work collaboratively,"while math teachers were the least likely to see computers as useful for having students communicateelectronically with other people. A future report in this series discusses subject-matter in terms of theteaching philosophies that these various objectives reflect.
Student Software Use by Teacher's Objectives for Computer Use
As the previous section showed, teachers have widely varying objectives for students' use of computersaccording to the subject-matter that they teach. For example, 82% of business education teachers reportthat reinforcing skill acquisition (mastering skills) is one of their top three objectives, compared to only20% of social studies teachers. Do teachers with such different objectives also have students usedifferent types of software or do they merely use the same types of software in different ways? In orderto answer this question, we compared software use patterns for two groups of teachersthose whoselected a given objective as being central to their use of computers versus those who did not select thatobjective. We repeated this for each of the 10 objectives. The greater the difference in use of a giventype of software between those who selected an objective and those who did not, the more we regardeduse of that software as conditional on having or not having that objective in mind.12
12 We recognize that teachers might have different objectives for different types of software that they use.Unfortunately our data about teachers' objectives was not specific to one or another type of software but just to how
114 EFT COPY MAMA.25
28

One key finding is that academic skills-related objectives such as reinforcement or remediation areassociated with greater use of the software category "games for practicing skills" and less use ofeverything else. This is consistent with the earlier finding that many teachers who use skill gamessoftware such as teachers in Cluster 2-3, are less likely to use other types of software. For example, ofteachers with "mastering skills" as an objective, only 37% use CD-ROM resources compared to 59% ofother teachers. Similarly, only 28% of the skills-mastery teachers have students use the World Wide Webcompared to 50% of all other computer-assigning teachers. Comparable differences were found betweenteachers who prioritize "remediation" as an objective and those who do not.
Table 12 shows the situations where there are substantial differences in their students' use of particulartypes of software between teachers holding a given objective and those not reporting it as one of their topthree.I3 Negative values indicate that a given type of software is less likely to be used by teachers ratingan objective as central than by teachers who did not rate it so highly. For example, Table 12 shows thatthe standardized difference (effect size) for CD-ROM use between those who prioritize mastering skills asan objective and those who do not is a negative .45.
TABLE 12. RELATIONSHIP BETWEEN OBJECTIVES FOR COMPUTER USE ANDTYPES OF SOFTWARE USED (EFFECT SIZES)
Teachers Who Difference in Likelihood that Software Was Used by Teacher's StudentsPlaced This (standardized difference in "% used" between teachers with/without that objective)Objective
Among TheirThree Most Word CD- Simula- Graph- Spread/ Presen- Multi-Important Proc. ROM WWW Games tions ics Data tation media E-Mail
Finding out aboutideas and info .25 .70 .59Expressing inwritingMastering skillsImprovingcomputer skillsAnalyzing infoRemediation ofskillsLearning to workcollaborativelyLearning to workindependentlyPresenting info toan audience .29Communicatingelectronically
.52 .39
;--45 .24
.20
[40
.36
.45 .34 .46 ;-..33.
3
.20.22 .44
.21
.44
.23
.65 .56
.29
6
.72
Universe: Probability sample; teachers who used computers with students in their selected class.Highlighted statistics draw attention to negative differences indicating the types of software less likely to be used by teachers withcertain objectives.
a particular teacher used computers with her students. The consequence of this data limitation is that if we finddifferences in objectives by software type, it is likely that the true differences are even larger than shown, since theteacher's objectives at best are "averaged" across different software that she uses.13 "Use" was defined as students using that type of software in at least three lessons during the year. Rather thanemploying the absolute difference in percent using between objective-holders and non-holders, that difference wasdivided by the combined sample standard deviation of "use/non-use," in effect creating an "effect size"measurement. This was to take into account the fact that differences between two very small (or very large)percentages need not be as large as differences between two modestly sized percentages for an equivalent "effect" tobe registered. Effect sizes greater than .20 are show in the table.
26
29It Egli' COPY AVAIRLAIBI2

Information retrieval objectives (i.e., "finding out about ideas and information") are quite naturallyassociated with the use of CD-ROMs (68% vs. 33%, effect size = .70) and the World Wide Web (56% vs.27%, E.S. = .59). But it is also the case that teachers who prioritize student written expression usingcomputers also make use of CD-ROMs more than other teachers do (62% vs. 42%, E.S. = .39).
One other point: Teachers who prioritize having students use computers to present information to anaudience not only are more likely than others to use presentation software, but they are also the primaryleaders in student use of multimedia authoring software such as Hyperstudio. Thirty percent of suchteachers use multimedia authoring software with their students compared to 10% of all other computer-assigning teachers. Looking at this from the opposite perspective, 39% of multimedia-authoring softwareusers selected "presenting information to an audience" as a primary objective of student computer usecompared to 15% of all other computer-assigning teachers.
Of course, this raises the question, if some users of multimedia authoring software do not see its primaryvalue in terms of improving students' ability to present information to an audience, what are theirobjectives for that software's use? Table 13 highlights all those "high priority objectives" whichwereselected by at least one-third of the teachers who use each type of software frequently (that is, in 10 ormore lessons during the year). (The entries indicate the percentage of those frequent-using teachers,including both the probability and purposive samples, who reported that particular objective.)
TABLE 13: PRIMARY OBJECTIVES SELECTED BY TEACHERS WHO FREQUENTLY USED SPECIFIC TYPES OFSOFTWARE WITH STUDENTS (PERCENT SELECTING OBJECTIVE)
PERCENT SELECTING THESE OBJECTIVES AS ONE IN THE TOP 3Teachers whosestudents used thistype of software inat least 10 lessons (N)
% findout
aboutideas
%expres-sion inwriting
%
mas-teringskills
% corn-puterskills
%analyze
info
%reme-diation
% work % workcollabo- indepen-ratively dently
%presentinfo. to
audience
% corn-municateelectro-nically
Word Processing (1,332) 53 $7 28 32 24 15 23 24 26 11
CD-ROMReference (633) 71 01 23 26 29 18 26 18 22 10WWW Browser (657) 71 40 17 27 30 10 25 21 27 14Skill Games (477) 49 44 46 *7 19 39 24 20 12 5Graphics oriented (359) 42 36 34 ,-, 24 13 33 23 32 10Simulation/Exploratory (329) 59 34' 43 31 :,3,4 19 24 26 10 9Spread/Database (287) 37 27 44 10 25 31 19 11
Presentation s.w. (297) 43 36 27 34 25 10 32 25 46 11
Multimedia Auth. (235) 4g 45 18 24 29 14 36 16 45 10E-Mail (201) 58 b." 16 25 P 8 30 20 26 3.1
Universe: Probability and purposive samples; teachers who used a given type of software in 10 or more lessons during the schoolyear. Highlighted statistics draw attention to those objectives selected by at least one third of teachers as one of their 3 most importantobjectives for student computer use.
Regardless of which types of software teachers use frequentlyand that includes the multimedia-authoring users referred to in the previous paragraphthey are apt to see written expression andinformation acquisition ("finding out about ideas and information") as one of the primary objectives oftheir instructional use of computers. Overall, despite the fact that teachers' objectives were measuredgenerally, without reference to particular types of software, Table 13 shows distinct patterns among thefrequent users of different types of software. For example, nearly one-half of multimedia-authoringsoftware users valued the goal of students presenting information to an audience, but frequentusers ofmany other types of software were less than half as likely to prioritize that objective. Apart from obvious
27 30

connections, such as between electronic communications objectives and student use of e-mail software,associations were evident between collaboration objectives and both graphics software and multimediaauthoring, between a skills-mastery orientation and spreadsheet/database activities, and betweeninformation analysis goals and use of three types of softwarespreadsheets/databases, electronic mail,and simulation and microworld exploration programs." Thus, not surprisingly, teachers' choice ofsoftware reflects their instructional goals and perspectives. This relationship will be explored in muchmore detail in a future report.
STUDENT COMPUTER USE FOR SCHOOL WORK ON THEIR OWN TIME
Although teachers may have their most direct effects on students' learning during class time, teachersalso affect how much effort students take to do school work at other timesbefore and after school and atother times away from the school building. We asked teachers whose students use computers during classwhat proportion of the students (in their selected class) "do work for this class at other times," that is,while at school and outside of school. Across all teachers in the probability sample who assign computerwork to their selected class, 25% say that all or most of their students have done computer work on atleast several occasions outside of class time while at school and about the same number (28%) say that allor most students have done class work at home or other places away from school. These two types ofout-of-class activities are correlated; a majority of teachers who reported one type of activity also reportedthe other.
Teachers who reported that students did out-of-class-time computer work differ from other teachers interms of which subjects they taught, the overall level of student achievement in their class, the socio-economic level of the school's population, and according to which objectives they had for studentcomputer use. Thus, student characteristics, teaching responsibilities, and approach to computer use allaffect the likelihood that students will supplement their in-class computer work with time before or afterschool or at home, at least as measured by teacher surveys.
In terms of subject-matter, two-fifths (39%) of all science teachers who assign computer work duringclass reported that most or all students did computer work at school outside of class time. On the otherhand, only 10% of computer-assigning math teachers did. Other secondary teachers with higher-than-average rates of reporting before- and after-school computer use included teachers of computer classesand social studies teachers. Table 14 shows not only the percent of teachers reporting most or all studentsdoing out-of-class school-located computer work, but the percent reporting that no students did this at all.Besides math teachers, three other groups of teachers reported limited out-of-class-time computer workby studentsvocational education teachers, business education teachers, and elementary teachers of self-contained classes.
14 The pattern in Table 13 is somewhat different than the pattern in Table 12, and several reasons are likelycontributors. First, Table 13 uses a criterion of "frequent" use of a given type of software while Table 12 is basedon the percentages who use that software even occasionally. Second, Table 13 uses the purposive (reform plus hightech) samples as well as the probability sample, while Table 12 only uses the latter. Third, different statistics areused in each, for different purposes. In Table 12, the focus is on contrasting teachers who prioritize certainobjectives with those who prioritize others, and leads to an effect size calculation. In Table 13, the focus is oncomparing frequent users of different types of software (ignoring those who are not frequent users of any type ofsoftware) and attends to differences in the kinds of objectives these contrasting groups of frequent software-usingteachers have.
28 31

TABLE 14: PERCENT OF COMPUTER-ASSIGNING TEACHERS REPORTING DIFFERENT LEVELS OFOUT-OF-CLASS AT-SCHOOL COMPUTER WORK (FOR THE CLASS), BY SUBJECT AND LEVEL TAUGHT
% reporting none orfew students did this
% reporting 1/4 to 1/2students did this
% reporting most orall students did this Total (N)
Elem. Self-Contained 44 36 20 100 (160)Elem. Other 29 46 25 100 (54)
English 29 49 22 100 (108)
Science 32 29 39 100 (98)Math 54 37 10 100 (53)
Social Studies 14 54 33 100 (52)
Foreign Language 13 38 50 100 (5)
Miscellaneous Academic Sec. 26 51 23 100 (47)
Computers 25 39 36 100 (43)
Business 37 47 17 100 (40)
Vocational 33 47 20 100 (32)
Fine Arts 18 55 27 100 (19)Other Applied Sec. 13 53 33 100 (14)
All computer assigning teachers 34 42 25 100 (725)
Universe: Probability sample; teachers who used computers with students in selected class.
With respect to students using computers to do work for the class at home, more computer-assigningEnglish teachers reported students doing this than any other group of teachers (48%). That is probablydue to the wide accessibility of word processing software on home computers. Science and foreignlanguage teachers were also above-average in this regard, also suggesting that word processing is thedominant school-related use of computers at students' homes. The computer-assigning teachers leastlikely to report most students engaged in away-from-school computer use for class-related work were finearts teachers (none of them did), math teachers (5%), and vocational education teachers (10%). For twoof those groups, fine arts and vocational education, that is probably due to the specialized and costlynature of the software used in those courses. For math teachers, this appears to be the continuation of therelatively low involvement of math teachers in computer work that has been evident throughout thisreport. It should be noted that while a majority fine arts and vocational education teachers reported somestudent computer use outside of school, 71% of computer-assigning secondary math teachers reported nooutside-of-school use by students for math class at all. (See Table 15.)
29 32

TABLE 15: PERCENT OF COMPUTER-ASSIGNING TEACHERS REPORTING VARIOUS LEVELS OFOUT-OF-SCHOOL COMPUTER WORK FOR CLASS, BY SUBJECT AND LEVEL TAUGHT
% reporting none orfew students did this
% reporting 1/4 to 1/2students did this
% reporting most orall students did this Total (N)
Elem. Self-Contained 34 48 19 100 (158)
Elem. Other 20 52 28 100 (53)
English 21 31 48 100 (109)
Science 18 40 42 100 (100)
Math 71 24 5 100 (50)
Social Studies 7 63 30 100 (53)
Foreign Language 13 50 38 100 (5)
Miscellaneous Academic Sec. 20 54 26 100 (47)
Computers 27 55 18 100 (40)
Business 40 43 17 100 (40)
Vocational 43 47 10 100 (33)
Fine Arts 33 67 0 100 (17)
Other Applied Secondary 13 60 27 100 (13)
All computer assigning teachers 29 44 28 100 (718)
Universe: Probability sample; teachers who used computers with students in selected class.
In the same way that teachers' objectives for student computer work affect the types of software theyhave students use, so, too, do those objectives appear to affect the likelihood that students will docomputer work outside of class time, at school or at home. For this analysis, we combine the "out-of-class" and the "at home, out-of-school" measure and report the overall difference (in standard deviationunits) in the extent of participation by students in doing computer work for the class at non-class timesbetween teachers who include each teaching objective among their three most important objectives andteachers who do not include that objective.
Teachers with four objectives for their students' computer use are distinctly more likely to report higherlevels of student participation in out-of-class computer work done for the class. By far the highest levelof participation is by students of teachers who value computers for helping students to presentinformation to an audience (E. S. = .68). Also, though, teachers whose primary objectives include studentsimproving their writing, communicating with other people, and finding out about ideas and informationall score well above average in out-of-class student use of computers for class work. (Effect sizes allabout +.40; see Table 16.) In contrast, three groups of teachers are much less likely than other teachers toreport students using computers out-of-class: those whose objectives are reinforcement of skills,remediation, and students "learning to work independently." (Effect sizes all about .50.) It is interestingthat teachers who value computers to help students to work independently are much less likely than othersto report students actually using computers outside of their own presence! It seems plausible that formany teachers, having students "work independently" means that they prefer students to be workingquietly, not that they really want them to do independent work!
30
33

TABLE 16: RELATIONSHIP BETWEEN OBJECTIVES FOR COMPUTER USE AND PERCENT OF STUDENTSSAID TO USE COMPUTERS FOR CLASS WORK DURING OTHER TIMES (AT SCHOOL PLUS AT HOME),
MEAN SCORES AND EFFECT SIZE (STANDARDIZED DIFFERENCE MEASURE)Use of computers outside of class for class work (scale1-5)*
ObjectiveTeachers with that objective
(among top three) (N)Other computer-
assigning teachers (N)EffectSize
Presenting info to an audience 3.16 (143) 2.38 (577) 0.68Communicating electronically 2.94 (54) 2.46 (666) 0.41Finding out about ideas and info 2.73 (363) 2.28 (357) 0.39Expressing self in writing 2.77 (295) 2.32 (425) 0.38Analyzing information 2.58 (216) 2.48 (504) 0.08Learning to work collaboratively 2.47 (189) 2.52 (531) -0.04Improving computer skills 2.47 (234) 2.53 (486) -0.05Learning to work independently 2.09 (163) 2.62 (557) -0.46Remediation of skills 2.06 (158) 2.68 (562) -0.53Mastering skills 2.12 (248) 2.75 (472) -0.54Universe: Probability sample; questionnaire 1 and 2; teachers who used computers with students in selected class;questionnaire versions 1 & 2
Score is average of the two measures: out-of-class at-school computer use and out-of-school computer use, where 1 = 'none or fewstudents' 2 = '1/4 of students' 3 = '1/2 of students', 4 = '3/4 of students' and 5 = 'all students.' (Overall mean, 2.51, overall standarddeviation 1.16.)
Teachers' objectives, as we have seen, tend to be accomplishedby having students use specific types ofsoftware. Thus, it is not surprising that teachers who report their classes frequently using certain types ofsoftware are the same teachers who report the highest levels of participation in computer work being doneoutside of class time. In particular, across all school levels, the teachers reporting the most out-of-classand out-of-school participation in computer activities for their classes are those who have studentsfrequently use four types of programs: presentation software (E.S.=.51 compared to all other computer-assigning teachers), electronic mail (E.S. = .46), multimedia authoring programs (E.S. = .44), and wordprocessing (E.S. = .48). The high effect size for word processing is doubtlessly due to the ease withwhich that type of software carries over to non-supervised computer time. The equally strong relationshipwith out-of-class computer work for the other types of software seems more likely due to the greaterengagement produced by the kinds of classroom assignments into which those types of software areincorporated. (See Supplementary Table A-7 for the accompanying data.)
PART III. TEACHER COMPUTER EXPERTISE AND PROFESSIONAL USE
TEACHER PROFESSIONAL USE OF SOFTWARE
As we showed in Table 1 of this report, about 30% ofteachers do not have their students use computers.However, three-fourths of those non-computer-assigning teachers do use computers for their ownprofessional needsto prepare materials for teaching, to keep track of student grades, or to communicatewith other teachers or parents. (So do 98% of the teachers who assign computer work to their students.)
Overall, teachers' most frequent professional uses are related to their day-to-day needsmakinghandouts, keeping a record of student grades, and writing lesson plans or notes. A majority of teachers usecomputers to make handouts for class on at least a weekly basis. Almost half of all teachers also usecomputers that frequently to record and calculate student grades and to make lesson plans or notes.
Teachers use computer technology less often in other ways, such as getting information from the Internet(28% do that at least weekly). Most teachers use computers at least occasionally to correspond withparents, and between 30% and 40% also from time to time exchange computer files with other teachers.
31 34

Similarly, almost one-third use camcorders, digital cameras or scanners. By Spring, 1998, nearly oneteacher in five had posted student work, suggestions, or shared their opinions on the World Wide Web.
These percentages as a whole suggest that computers have become a routine tool for helping teachersaccomplish their professional work. Computers are no longer just something for students to spend timeon. They have become a major tool of the trade.
Teachers of some subjects are more likely to use computers professionally than are others. (See Table17.) Math teachers, for example, are less likely to use computers in most ways than are other teachers.They are less likely to use computers for making handouts, getting information from the Internet, ortranslating material to electronic format. However, they are more likely than other teachers are to usecomputers to keep track of student grades. In contrast, teachers of computer, business, and vocationaleducation courses use computers more for professional purposes than other teachers do. They exceedother teachers particularly in writing lesson plans, exchanging computer files with other teachers, andusing camcorders, digital cameras or scanners, and also in recording grades by computer.
TABLE 17: PROFESSIONAL USES OF COMPUTERS, BY SUBJECT-LEVEL
EnglishSocial Studiesand Science Math
Comp- All OtherBus-Voc Sec.
Elem-entary
Allteachers
% of teachers who use of computers for the following weekly or more oftenMaking handouts 79 71 51 74 63 61 66
Student grades 51 59 66 63 40 32 49
Writing lesson plans/notes 49 51 33 60 39 30 42
Get information from Internet 26 33 14 22 36 29 28
% of teachers who use of computers for the following occasionally or more oftenCorresponding with parents 66 60 64 70 65 78 68
Exchanging files w/other teachers 38 42 29 55 38 36 39
Use camcorders, digital cameras, orscanners 41 33 14 47 29 29 29Posting on Web 22 19 11 24 24 14 18
(N) (322) (514) (257) (251) (305) (536) (2,185)
Mean number of professional use criteria passed
All teachers of that subject 3.7 3.7 2.8 4.1 3.4 3.1 3.4
Teachers whose students usecomputers frequently 4.1 4.5 2.6 4.5 4.4 3.8 4.1(N) (73) (84) (28) (173) (71) (248) (677)Teachers whose students usecomputers occasionally 3.8 4.0 3.4 4.0 3.4 2.9 3.5(N) (181) (262) (110) (62) (149) (224) (988)Teachers whose students do notuse computers 4.2 3.7 3.2 * 3.2 3.3 3.4(N) (54) (138) (97) (73) (46) (420)
Universe: All teachers in probability sample.*N too low.
In general, teachers who use computers more frequently with students also use computers more forprofessional purposes. This is not, however, true for mathematics teachers. Math teachers whosestudents use computers frequently (41+ times) themselves use professional applications at about 75% ofthe rate that math teachers whose students use computers less often do. This is the opposite of the patternfor most other subjects, as shown in Table 17.
Frequent computer-assigning teachers are most different from non-computer assigning teachers in theirgreater use of searching the Web for resources for use in teaching, in using scanners, digital cameras, and
3235
camcorders as teaching resources, and in posting information on the Web. (See supplementary Table A-7.) One professional application, interestingly enough, is used somewhat more by non-computer-assigning teachers than by those who give students frequent computer assignmentskeeping track ofstudent grades. This appears to be a simple-to-understand application that requires little computerexpertise. Yet, once teachers find other ways to help them in their professional work, they may put asidethis particular application.
TEACHER SELF-REPORTED EXPERTISE WITH COMPUTERS
A computer is a fairly complex piece of electronic equipment. In part, it is complex because its functionsare so varied. Although for decades teachers have had to operate equipment such as movie projectors,slide projectors, and VCRs to fulfill their teaching role, the skills required to successfully operatecomputers are far removed from most other competencies required of teachersfor example, classroommanagement, student assessment, organizing materials and planning lessons. Still, if teachers are tosuccessfully use computers for their own professional needs and to oversee how students themselves usecomputers to fulfill classroom assignments, teachers will need to have certain levels of expertise in basiccomputer operations.
Our survey asked teachers to rate their skill level for eight different computer tasks, from displaying thedirectory of a computer disk to developing a multimedia document. The percentage of teachers whoreported that they knew how to do a particular computer task varied from 75% who said they coulddisplay a disk's directory to only 18% who said they could develop a multimedia document. In addition,nearly three-quarters (71%) said they could copy files from one disk to another, three-fifths could use aWeb browser (63%), about one-half (48%) said they could imbed graphics into a word processordocument, two-fifths (40%) could create a new database and establish fields and screen layouts, and one-fourth (26%) could prepare a slide show using presentation software. Of course these skills were notactually tested, but they are the teachers' self-reported presentation of their sense of competency in theseareas.
In a second survey question, we asked teachers to rate their expertise on each of three different computerplatforms: Windows/DOS, Macintosh, and Apple II. Overall, a majority of teachers (59%) felt that theywere at least "very experienced" on at least one of the computer platforms, and 11% consideredthemselves "expert" on at least one platform. Many teachers have had sufficient experience to considerthemselves "very experienced" (or better) on more than one platform (22%), but few felt they were experton more than one (3%).
Generally, secondary teachers, particularly high school teachers, reported having higher levels ofcomputer skill and platform expertise than did elementary school teachers. (See Table 18.) Overall, forexample, high school teachers, even including those who did not have their students use computers,reported having about 4 computer skills out of the seven asked about compared to 2.6 skills for theaverage elementary teacher. Also, they were twice as likely to claim expertise on a computer platform(14% vs. 6%). Within the secondary teaching ranks, not surprisingly computer teachers were most likelyto claim platform expertise (32%). The least likely were math teachers (8%) and teachers of "otherapplied" subjects (5%). In terms of self-reported computer skills, elementary teachers reported fewer ofthem, on average, than any group of secondary subject-matter teachers.
33 36

TABLE 18: TEACHER COMPUTER EXPERTISE BY SUBJECT-LEVEL% very experienced(or expert) on any
platform% expert onany platform
Mean computer skills(# criteria of 7 met)
% veryexperienced orexpert in Mac
% veryexperienced orexpert in Win
Elementary self-cont. 56 7 2.7 31 27
Elementary other 45 4 2.5 37 17
English 61 14 3.2 35 35
Science 66 12 4.0 31 39
Math 56 8 3.3 23 36
Social studies 57 12 3.6 28 32
Foreign language 51 17 2.8 38 22
Mixed Academic Sec. 62 13 3.6 37 41
Computers 90 32 5.2 31 74
Business 85 15 5.1 20 80
Vocational 51 12 3.7 21 37
Fine arts 65 15 4.3 48 27
Other Applied Sec. 48 5 3.1 30 16
Elementary 53 6 2.6 32 24
Middle school 57 12 3.4 29 33
High school 66 14 3.9 32 42
All teachers 59 11 3.4 31 35
Universe: All teachers in probability sample. For N's, see Table 1.
In terms of the platform on which teachers are most experienced, about the same percentage of teachersfeel themselves either "very experienced" or "expert" in using the Macintosh (31%) as feel that way aboutusing Windows or DOS systems (35%). (Nine percent say they are very experienced or expert on both.)Among teachers who assign computer work to students, there is a similar pattern: 34% are veryexperienced or expert on Macs compared to 36% having that level of experience with Windows. Onlyone- fifth of all teachers (and 24% of all computer-assigning teachers) report being very experienced onApple II series computers.
Expertise on Windows/DOS systems varies by school level, with nearly twice the percentage of highschool teachers rating themselves "very experienced" or better as did elementary teachers (42% vs. 24%).In contrast, the presence of Macintosh expertise is quite even across the three school levelsroughly 30%of teachers at all levels claim that level of experience. By subject, there are sharp differences favoringWindows expertise among computer teachers and business education teachersteachers who generallyhave the most technology available and whose students use computers the most frequently. In businesseducation, four times as many teachers report being very experienced or expert on Windows/DOS as onMacintosh systems. Among computer teachers, the ratio is about 2.5 to 1.
However, teachers who call themselves "very experienced" or "expert" on the Macintosh system actuallyreport having somewhat more computer skill in general, and they are more likely to have some specificadvanced competencies than teachers who call themselves "very experienced" or "expert" on Windowscomputers. This becomes apparent only when one holds subject-matter "constant" because Windows-expert teachers, concentrated in the computer and business education fields, do tend to report morecomputer skills overall.
Elementary teachers and secondary computer or business teachers who are very experienced or expertMacintosh users report having about one-half an additional skill, making them one-fifth to one-fourth astandard deviation higher than very experienced or expert Windows users. (See Table 19.) In contrast,
34
37

among very experienced secondary academic teachers or secondary teachers in other applied fields therewere no skill differences by platform.
When we examine specific computer competencies, for most of the more advanced individual computerskills, a slightly higher percentage of very experienced Macintosh-using teachers than Windows usersreport having that competency. Of the 20 individual comparisons in the bottom part of Table 19,seventeen favor Macintosh users and only two favor Windows users. Still, only one difference was reallysizablethe higher proportion of very experienced Mac-using computer and/or business educationteachers who report being able to develop multimedia documents (73% vs. 42%). But of the five specificskills in Table 19, only using a World Wide Web search engine failed to show a difference favoring theexperienced Mac users.
TABLE 19: COMPUTER SKILLS REPORTED BY TEACHERS VERY EXPERIENCED OR EXPERT ON EACHPLATFORM, BY SUBJECT/LEVEL GROUP
Platform on which Secondaryteacher was very Computer and Secondary Otherexperienced or Elementary Secondary Business (includingexpert Teachers Academic Subjects Education vocational)Mean Number Of Computer SkillsMacintosh 4.32 4.96 6.28 5.26(N) (423) (893) (108) (113)Windows 3.87 4.83 5.69 5.25(N) (280) (814) (196) (116)Difference(st.dev 2.24) +.45 +.13 +.59 +.01
Percent Reporting Specific Skill% that can create a new database, establishing fields and screen layoutsMacintosh 50 64 93 75Windows 42 62 85 67Difference +9 +2 +8 +8% that can embed graphics into a word-processor documentMacintosh 69 74 97 84Windows 62 73 92 79Difference +7 +1 +5 +4% that can prepare a slide show using presentation softwareMacintosh 32 49 82 56Windows 25 47 69 56Difference +6 +2 +12 1% that can use a World Wide Web Search EngineMacintosh 73 85 90 79Windows 71 85 85 88Difference +2 0 +5 9% that can develop a multimedia document using Hyperstudio or similar authoring softwareMacintosh 36 37 73 44Windows 31 30 42 43Difference +5 +7 +32 +1(N) Macintosh (422) (892) (108) (113)(N) Windows (279) (813) (196) (116)Universe: Both probability and purposive samples. Teachers giving self-ratings of "very experienced" or "expert" on platforminvolved.
Teacher Computer Expertise and Having a Computer at HomeMany more teachers have a computer at home than haveone in their classroom. (80% have a computer athome, compared to only 51% having one in their own classroom.) The same is true for modems used forInternet access: 59% of teachers had one at home in 1998 compared to 39% having one in theirclassroom. Because most teachers do much of their class preparation work at home, one would expect
35
38

that teachers with home computers would also report more professional use of computers and greatercomputer expertise overall than those without a home computer. The truth is that while having acomputer at home does not "make" you an expert user, not having one makes it extremely unlikely thatyou will consider yourself to be an expert. Only 25% of all teachers who have had a home computer formore than 10 years believe themselves to be expert on at least one computer platform. But only 3% ofteachers who do not have a home computer at all give themselves that designation.
The longer the teacher has had a home computer, the more likely they are to report being an expert user ofone type of computer and also the greater number of distinct computer skills they report having. Forexample, teachers who have been home computer owners for more than a decade report an average of 4.8of the seven computer skills, those with 7 to 10 years of home computer experience report 3.8 skills, the4-6 year home users average 3.5 skills, the relatively new home computer users average 3.0 skills, andthose without a home computer report only 2.1 computer skills. There is a similar, very regularrelationship between years of home computer ownership and the number of professional use criteria metby the survey responding teacher, going from 4.6 types of professional use for the longest-durationowners to 2.1 for the non-owners. Overall, the number of years of home computer presence is correlated+.37 with both measures of computer expertise and +.32 with variety of professional uses.
Teacher Computer Skill and Expertise and their Use of Computers
The most expert teachers, not surprisingly, typically make the most use of computers in their professionalwork. Even among teachers of the same groups of subjects, the differences between the most computer-skilled and the least-skilled teachers are substantial. For example, among secondary academic subjectteachers, those who report having 4 or 5 of the computer skills we asked about also used computersprofessionally in half-again as many ways as teachers who had 3 or fewer computer skills (4.1 vs. 2.6).15The academic secondary teachers who reported having 6 or all 7 computer skills (about one-fourth of allacademic secondary teachers in the combined probability-purposive sample) used computersprofessionally in even more ways (5.2). The same was true for elementary teachers (4.7 uses for the mostbroadly skilled compared to 2.5 for the least skilled).
Having more computer skills was also associated with having students use computers more frequentlyand in more ways. For most subject-matter groups, among the teachers who assigned computer work toat least one class, the greater the number of computer skills self-reported, the more often they usedcomputers with their students (in their sampled class). This was most clearly true for vocationaleducation teachers, secondary teachers of mixed subjects, and English teachers. In those subjects,teachers who assigned more computer work also knew more about computers themselves; those whoassigned less work, knew less. That was not true, however, for math teachers or for foreign languageteachers (nor for computer teachers or business education teachers, most of which reported high computeruse and high personal computer skill). In those subjects, teachers who assigned more computer workprofessed no greater knowledge about how to use computers than did those who assigned less. (The firstcolumn of Table 20 shows correlations between teacher computer skills and frequency of assigningcomputer work.)
15iThis is based on a scale which counted weekly or greater use of computers for keeping grades, making handouts,
writing lesson plans, and getting information from the Web, and occasional (or greater) use for parentcorrespondence, use of camcorder/scanner/cameras, exchanges of files with other teachers, and World Wide Webposting.
3639

TABLE 20: CORRELATION BETWEEN NUMBER OF COMPUTER SKILLS REPORTED ANDEXTENT OF USE OF EACH TYPE OF SOFTWARE, BY SUBJECT/LEVEL
(N)
Freq. ofstudentuse in
sampledclass
Elem. Self-Cont. (484) .24
Elementary Other (167) .05
English (407) LE33Science (377) *28
Math (325) 705Social Studies (212) .21
Foreign Lang. (59) -.14
Mixed AcademicSecondary (191)Computers (136) .00
Business (90) -.01
Vocational (67) LlFine Arts (70) .26
Other AppliedSecondary (55) .22
WordProc.kahl
.23
CD-ROMRefer-ence.22
.02
Simu- Spread-World Skill lation/ sheet/Wide practice Graph- Explo- Data-Web games ics ratory base
.08 .25 .16 .19
.16 .02 .19 .16 .16
Pres-entation Multi-
s.w. media E-mail.28 '.31 .21
.19 .29 .15.24
.14
F3710.25
.10
:.34
.19
.10
.20
.26-.08
.03
.15
-.11
.17
.21
.24
.02
.12
.04
.17
31 .26
.12
-.03
-.09
-.03
-.03
.27 .05
.12 -.11
-.09
.25 .05
.05 .20
.23 .08
.05 .25
-.06
.15 I 38 .26 .24
.15 .14
.26 .21 .13
7701 .2103 .15 14 :21-
.11 .19 .29
.16 .11 17
8 .08
.15 .15
.12 .04
18 .28 .07 .20
.10 .14
-.28
-.15
.12Universe: Probability and purposive samples; computer-assigning teachers.
Teacher personal skill in using computers was especially associated with having students use certainkinds of software-most commonly, presentation software and multimedia authoring software. However,the patterns of correlation coefficients differed by subject, as Table 20 shows. The most technicallyskilled social studies teachers, for example, had their students use Web browsers more than lesscomputer-skilled social studies teachers did, but among science teachers, Web use did not vary by teachercomputer skill. In general, it appears that for any given group of subject-matter teachers, the highercorrelations between teacher computer skill and student use of that type of software were for thoseapplications that might be seen as being on the leading edge of computer use in that subject. Thus, thehighest correlations for math teachers were for word processing software, Web browsers, spreadsheetsand presentation software. For science teachers, teacher computer skill was most related to use ofspreadsheets and presentation software. The only high correlation for foreign language teachers was forelectronic mail use. And so forth.
If we try to compare whether computer skills are more closely associated with increased professional useor increased instructional use, in correlational terms, the relationship is clearly strongest for professionaluse, particularly when expertise is measured by the number of different computer skills they reportedhaving. The correlation between number of computer skills and variety of professional use is almosttwice as large as that between skills and variety and frequency of student softwareuse (r=.52 vs. .1-.29).16Thus, computer skill translates much more directly into professional use than into instructional use.
We can see that fact more clearly when we look at particular skills and corresponding student softwareuse. Even if teachers themselves are skilled in a particular type of software, that is not a guarantee thatthey will have their students use that software. For example, although one-fourth of teachers reportknowing how to "prepare a slide show using presentation software," only 34% of that group (and 6% ofother teachers) say that they have had students use presentation software on three or more lessons.Similarly, only 32% of teachers who feel skilled in developing a multimedia document using Hyperstudio
16 There is a three-fold difference in r-squared, .09 vs. .27.
37 4 0iiEST COPT AV

or other authoring software have their students do so. Even in the case of Web use and word processinguse, teacher skill does not guarantee use in teaching. Only 41% of the teachers who report they can use aWeb search engine actually assign students to use the Web, and only 60% of teachers who report beingable to imbed graphics into a word processor document also report assigning their students to use wordprocessing.
Some computer skills suggest a greater readiness to have students use computers in a variety of ways. Inparticular, teachers who feel capable of developing a multimedia document using Hyperstudio or similarauthoring software on average have their students use computers more frequently and with a greatervariety of software. This is independently true for teachers of almost every subject, and for most subjects,multimedia-authoring-capable teachers have students use computers more and with a greater variety ofsoftware than do other teachers teaching the same subject. (See supplementary Table A-8.) A secondcomputer skill associated with a teacher's having students use computers more and with greater variety is"preparing a slide show." In particular, elementary teachers, English teachers, and secondary teachers ofmixed academic subjects who feel able to produce slide shows using presentation software are among themost active computer-assigning teachers in their subject. In sum, there seems to be a clear order ofdifficulty among computer skills that relates to the variety of ways that teachers are able and willing tooversee student computer use. In other words, whether or not the teacher knows how to use a Webbrowser doesn't have much of an effect on whether they use a type of software with students. But someskills such as producing a slide show or a multimedia document clearly are indicators of a teacher'sability and interest in having students use computers in a variety of different ways and on a relativelyfrequent basis.
Teacher Computer Skills and Expertise and their Objectives for Student Computer UseThe computer skills that teachers hold, both specific skills and their overall expertise, are also related tothe objectives that they prioritize for their students' computer use. In other words, teachers who choosecertain objectives as most important are more computer-skilled on average than those who choose otherobjectives. Table 21 shows the average number of computer skills reported by teachers who selecteddifferent objectives as primary, separately for elementary-level teachers, secondary academic subject-matter teachers, and so on. On average, the most computer-skilled teachers are those who valuecomputers for their role in helping students learn to make presentations to an audience, to communicatebetter, and to analyze information. By an even larger margin, teachers who see remediation as one of theirmost important objectives for using computers with students are less skilled computer users than teacherswho have other objectives. For example, the average elementary level teacher who selected "presentinformation to an audience" as one of their three main objectives reported having about 4.4 skillscompared to just 2.6 among teachers choosing remediation as a primary objective. That difference, asshown in Table 21 is roughly three-quarters of a standard deviation.
38 41

TABLE 21: MEAN NUMBER OF TEACHERS COMPUTER SKILLSBY TEACHERS PRIMARY OBJECTIVE FOR STUDENT COMPUTER USE
Elementary (N)SecondaryAcademic (N)
SecondaryComputer and
Business (N)
SecondaryOther (inc.Vocational) (N)
Communicate electronically 3.4 (72) 4.6 (129) * *
Present information to an audience 4.4 (148) 4.3 (389) 6.5 (34) 4.8 (61)Analyze ideas & information 3.2 (119) 4.5 (537) 5.5 (68) 4.0 (50)Learn to work collaboratively 3.1 (183) 4.4 (352) 5.8 (71) 4.2 (53)Find out about ideas andinformation 3.3 (435) 4.2 (834) 5.5 (65) 4.5 (106)Improve computer skills 2.8 (289) 4.2 (311) 5.5 (136) 4.8 (66)Learn to work independently 2.2 (125) 3.8 (279) 5.6 (89) 4.7 (67)Express oneself in writing 3.2 (466) 4.0 (654) 5.0 (42) 4.1 (51)Master skills (reinforcement) 2.6 (256) 4.0 (332) 5.4 (131) 4.0 (69)Remediation of skills 2.7 (267) 3.2 (207) *
Standard Deviation (2.2) (2.2) (1.7) (2.3)Universe: Probability and purposive samples; teachers who use computers with their selected class.
N less than 30.
The seven computer skills can be ranked according to which ones are differentially held (reported) byteachers with different objectives versus which ones are reported about equally frequently among teacherswith different objectives. (See supplementary Table A-9.) In particular, the ability to use a World WideWeb search engine, although common among teachers regardless of their objectives for student computeruse, is reported by more teachers who selected either information-related objectives ("find out" or"analyze") or communications-related objective ("communicate electronically" or "present to anaudience") than by those who valued skills-related objectives (skills-mastery or remediation). Similarly,multimedia document creation skills are reported by more than a third of teachers prioritizing objectivessuch as collaboration and presentation to an audience, but only by 12% of teachers favoring remediationuses of computers. The same pattern is found when we consider which teachers are "very experienced"on both Macintosh and Windows platforms or "expert" on one of them: the teachers most likely to be sohave "electronic communications" as one of their main objectives for student computer use, followed bythose who want students to analyze data or present information to an audience. The least likely to be veryexperienced across platforms or expert in one are teachers valuing remediation objectives and thosevaluing computers for helping students to work better independently.
Finally, we examined whether computer-assigning teachers who are very experienced or expert onMacintosh platforms differ from teachers with similar expertise on Windows platforms in the kinds ofobjectives they have for student computer use. Because teachers' objectives are related to the subject andlevel they teach and computer platform is as well (to a lesser extent), we did some analysis of teacherobjectives within specific subject areas. Some subjects show larger differences than others in theobjectives for computer use held by Macintosh and Windows platform-knowledgeable teachers. Thelargest differences are among English teachers and the combination of computer teachers and businesseducation teachers. The smallest differences were for social studies teachers and other applied secondaryteachers.
Across all subjects, and generally within them as well, Macintosh-knowledgeable teachers were morelikely to value having students use computers to present information to an audience, to find out aboutideas and information, and to express themselves in writing. Windows-knowledgeable teachers weremore likely to value computers for their help in having students master skills, computer skills in particularas well as subject-matter skills, and to work independently. In addition, among English teachers andcomputer/business education teachers, those most experienced or expert in the use of the Macintosh were
3942

more likely than the Windows-experts to have "students learning to work collaboratively" as an objective.Windows-expert (or very experienced) English teachers were more likely than Mac-experts to usecomputers to assist in the remediation of skills not learned well. Lastly, among computer and businesseducation teachers, the Mac specialists were more likely than the Windows specialists to state the value ofcomputers for students learning to communicate electronically with other people. All of these differenceswere close to or greater than 10 percentage points, as shown in supplementary Table A-10.
Major Software Use Clusters Associated with Expert Computer-Using Teachers and TeachersHolding Objectives Correlated with High Levels of Out-of-Class Student Computer Use
Earlier in this report, we introduced a set of 30 clusters of computer-assigning teachers, 10 at each ofthree school levels. Each cluster represents a group of teachers whose pattern of software use by studentsduring class time was relatively similar to one another and distinguishable from that of other teachers atthe same school level. In the earlier section we showed how a plurality of computer-assigning teachers ateach school level (30% of all teachers or more than 40% of all computer-assigning teachers) could bedescribed as "limited users," but that there were as many as nine distinct patterns of software use thatother teachers followed at each school level. We indicated how teachers in some clusters focused on asingle type of software, while other clusters reflected more diverse software use patterns that were,nevertheless, distinct from one another. We also suggested that overall frequency of student computer usewas distinguishable from diversity of software used, and we classified some teachers' pattern of assigningcomputer work as "focused but frequent" while others could be seen as "diverse but not frequent."Finally, we showed how teachers of some subjects were clearly over-represented in certain clusters andunder-represented in others.
Since that point in the paper, we have introduced other aspects of teachers' practicesthe objectives theyhave for student computer use, the ways in which they use computers for professional functions, and thecomputer skills and platform-specific expertise they possess. Each of those is also a dimension on whichclusters of teachers might distinguish themselves. Those aspects, along with other basic conditions ofteachers' practice, such as the socio-economic background of their student enrollments, provide a way tohelp us further characterize different modal patterns of teaching with computers.
As a summary clarification, the clusters were defined on the basis of the pattern of frequency of studentsoftware use across 10 types of software as reported by the teacher. Each of the other dimensions bywhich we characterize a given cluster comes from the correlation between that pattern of software useand these other dimensions of practice or teaching conditions. The principal purpose of this analysis isexploratory. In subsequent reports in this series, as we examine other aspects of teachers' workenvironments, personal background, personal pedagogy, and orientation towards the teaching role, wewill learn which of these various aspects also distinguish teachers in terms of their "cluster"i.e., thepattern of software use which they bring to their instructional activities.
All of the contrasts that we have uncovered so far are included in Tables 22, 23, and 24, one for each ofthe three school levels. As in the earlier discussion, rather than characterizing each one of the 30 clustersof computer-assigning teachers, we will limit commentary to certain contrasts. In particular, we willfocus on characterizing those clusters that contain the teachers who are most "accomplished" in theircomputer usethat is, teachers with generally high levels of computer skill and professional software useand whose objectives for computer use appear to result in more out-of-class class-related studentcomputer use (having primary objectives for students of presenting before an audience, communicatingwith other people, finding out ideas and information, and improving written work). We will alsocomment on the specific software that these "most accomplished teacher-clusters) clusters identified asmost valuable in their teaching practice.
40
43

Upper-Elementary Grades Clusters
At the elementary school level, the 35 teachers in Cluster 1-10 (see Table 22) clearly stand out on all ofthe criteria we selected for attention. Cluster 1-10 teachers are very high on general computer skills; theyreport high levels of platform-specific experience; they are extremely high on professional use, and theyhave distinctively strong objectives in exactly the four areas identified earlier as related to high levels ofout-of-class student computer use. (Not surprisingly, they have the highest level of out-of-class computeruse by students of any cluster except for one high-school cluster.) These teachers' students use computersvery frequently, using nearly every single type of software our survey inquired about. As a group, by alarge margin, the single software title they most often mention as "most valuable" for their students is themultimedia authoring program, Hyperstudio (two thirds named it as most valuable). They are relativelyrich in classroom computer resources, with 38% of them (still not a majority) having at least a 1:4 ratio ofcomputers to students in their room. However, they also use computers outside their classroom, with50% reporting both classroom and lab settings as equally central to their students' work. They do teach ineconomically advantaged schools, but their students are not particularly high in attributed "ability" orprior achievement.
Subsequent examination of this group and the others will reveal the way these teachers might or might notdiffer from others in terms of their personal teaching philosophy, the characteristic way that they organizeclassroom learning, their orientation towards their own classroom versus their teaching peers both at theirown school and beyond, the kinds of changes in their approach to teaching that they report having madeover the past three years, the degree of support that exists for teachers' computer use at their school, theextent of formal training opportunities provided to them, the types of pressures which these teachers feel,or don't feel, how much technology their school has as a whole, the extent ofa school-wide emphasis oninstructional reform and the level of administrative support for computers and for reform, and their ownpersonal educational background and teaching experience.
A second elementary level cluster of interest is Cluster 1-5, which we call "focused multimedia." The 52teachers in this cluster are higher on measures of personal computer expertise and professional use thanany other elementary cluster except for the just-discussed Cluster 1-10, even though the extent of theirstudents' computer use is not quite as great as some others. These teachers' main emphasis is on studentdevelopment of multimedia products, along with word processing, and exploratory use of most othertypes of software. They disproportionately include two of our targeted objectives for computerusewriting and presentation to an audience. Again, and not surprisingly given their objectives, it isHyperstudio that is far and away their most frequently named "best" software program for students withthirds of the teachers in this cluster naming it to be so. This group's practice appears to suffer from nothaving enough computers in their own classroom (33% of them have none at all), but they use whatevercomputer resources are available to them. Their students disproportionatelyhave access to Macintoshcomputers, but compared to other teachers they are more likely to report having students work one-on-oneat computers rather than in pairs (which may be explained by theirhigher-than-average choice of"analyzing information" as a prime objective for computer use. As we explore other parts of our data, itwill be interesting to learn the advantages and disadvantages these teachers bring to their computer-usepractice. We suspect that among their advantages are excellent pedagogy, but that poor school supportconstrains them from carrying out a more extensive computer-based practice.
Middle Grades Clusters
Although three of the middle grades clusters contain teachers who are clearly expert and well-experiencedin computer use (and two more clusters that approach that level), on the criterion of "objectives associatedwith out-of-class student use," none of the clusters seem as remarkable as Cluster 1-10 did at theelementary level. (See Table 23.) Cluster 2-8 comes the closest. In this group, teachers
41 44

TA
BLE
22:
UP
PE
R-E
LEM
EN
TA
RY
GR
AD
ES
CLU
ST
ER
S: C
HA
RA
CT
ER
IST
ICS
OF
CO
MP
UT
ER
US
E, S
TU
DE
NT
S A
ND
TE
AC
HE
RS
Clu
ster
Nam
e
3 M
easu
res
ofF
requ
ency
of
Com
pute
r U
se**
Sof
twar
e U
seO
bjec
tives
for
Bes
t Sof
twar
e N
amed
com
pute
r us
eW
here
Com
pute
r to
Out
of
Sch
l.T
each
er T
each
erS
tude
ntS
tude
ntC
lass
SE
SC
omp
Exp
er-
Pro
f'lpr
imar
ily u
se s
tude
nt r
atio
Sol
o vs
. pai
rsP
latfo
rm A
bilit
y***
Use
***
***
Ski
lls**
*tis
e***
Use
***
1-1
1-3
non-
user
sno
ne
limite
d us
e1,
low
2, lo
w2
focu
sed,
infr
eque
nt u
sew
ord
22,2
proc
essi
ng
reso
urce
2,2,
2
1ty
pica
lhi
gh2,
hig
h2,'
low
4 -
prim
arily
wee
kly
use
1-5
focu
sed
3, 3
, 3m
ultim
edia
1 -6
info
.. irk
3; h
igh3
, 3.
1-7*
mul
timed
iain
fo. n
=10
1-9
3, h
ighl
, hig
h1 -
broa
d bu
t not
freq
uent
core
freq
uent
hig
h3, 3
, 3
core
grap
hics
high
3, 2
, 4br
oad,
prim
arily
wee
kly
none
occa
sion
ally
gam
es
wor
d pr
oces
sing
1: C
D-R
OM
, wor
dpr
oces
sing
;2:
gam
esga
mes
, gra
phiC
S, w
ord
proc
essi
ng a
ll eq
ually
.no
thin
g el
se
1: m
ultim
edia
;2:
wor
d pr
oces
sing
;w
ide
rang
e of
expl
orat
ion
1: w
eb;
2: w
ord
proc
eSS
ing,
'C
D-R
OM
;so
me
gam
es,
occa
sion
ally
e-m
ail
1: m
ultim
edia
;2:
CD
-RO
M, g
raph
ics,
sim
ulat
ion;
little
wor
d pr
oces
sing
1: w
ord
proc
essi
ng,
gam
es, s
imul
atio
ns,
CD
-RO
M;
som
e w
eb.
1: w
ord
proc
essi
ng,
grap
hics
, CD
-RO
M,
gam
es;
som
e si
mul
atio
ns
1:10
high
end
4,.4
, 4 v
ery
1: w
ord
proc
essi
ng,
high
CD
-RO
M, w
eb,
pres
enta
tion,
mul
timed
ia;
subs
tant
ial g
ames
,si
mul
atio
ns, g
raph
ics
Acc
el. R
eade
r (1
2%)
not w
ritin
g
Cla
risW
Ork
s (2
4%)
Cla
risW
orks
(14
%)
MS
Wor
d (1
7%)
Cla
risW
orks
(13
%)
Ore
gon.
Tra
il (1
2%)
Hyp
erst
udio
(66
%)
Cla
risW
orks
(24
%)
Writ
ing
Pub
lish.
(18
%)
Acc
el. R
eade
r (1
6%)
Net
scap
e (1
8%)
Cla
risW
orks
(1'
3%)
Hyp
erst
udio
(47
%)
Net
scap
e (2
8%)
Gro
liers
Enc
y. (
20%
)
Cla
risW
orks
(21
%)
Ore
gon
Tra
il (1
1%)
Cla
risW
orks
(23
%)
Acc
el. R
eade
r (1
3%)
MS
Wor
ks (
13%
)R
eade
r R
abbi
t (12
%)
Hyp
erst
udio
(66
%)
Cla
risW
rirks
(28
%)
Writ
ing
Pub
lish.
(12
%)
Kid
Pix
(11
%)
writ
ing
find
out
mor
ein
cla
ss
mor
eou
tsid
e
mor
ein
cla
ss
rd. l
ow o
n fin
d ou
t) m
ore
writ
ing,
pre
sent
atio
n(r
el. h
igh
onan
alyz
ing)
not c
ompu
ter
skill
s,in
depe
nden
t wor
k
writ
ing,
find
ing
out.:
:no
t ski
lls
in: f
ew w
ith n
one
(7%
); a
nd fe
w w
ith6:
1 or
bet
ter
(12%
)-in
: man
y w
ith n
one
outs
ide
(29%
)an
y: 8
1% w
ith 2
:1or
bet
ter
(eve
nth
ough
onl
y 3%
had
4:1
in c
lass
)
none
mor
em
ac(6
1%),
mix
ed(4
6%)
over
whe
lm-
in: m
any
with
non
e m
ore
solo
high
mac
ingl
y(3
3%)
(66%
vs.
46%
) (6
7%)
in b
oth
(n=
21)
plac
es (
81%
)
skill
sov
erw
helm
-in
: 75%
had
gre
atm
ore
pairs
win
(rel
hig
h on
ana
lyze
) in
gly
outs
ide
ratio
(4:
1 or
bet
ter)
(64
% v
s. 4
5%)
(67%
)on
ly (
71%
)an
y: 1
00%
had
2:1
0% m
acor
bet
ter
in=
5)..
find
out
not r
erne
diat
ion
++
(rel
hig
h on
ana
lyze
) he
avily
inm
ore
varia
tion
high
mac
++
not c
ompu
ter
skill
sbo
th p
lace
sw
ithin
cla
sses
(71%
)+
or in
depe
nden
t wor
k (5
2%)
("so
lo +
(n=
17)
pairs
"), l
ess
pure
sol
ow
ritin
g, fi
ndin
g ou
the
avily
inut
rel
. hig
h %
with
mor
e va
riatio
n(n
=19
)pr
esen
tatio
n,bo
th p
lace
s41
or
bette
r (3
8%)
with
in c
lass
esco
llabo
ratio
n(5
0%)
( "s
olo
,+no
t ski
lls,
: pai
rs")
, les
s"'
rem
edia
tion,
or
'pu
re s
olo
inde
pend
ent w
ork
++
(n=
5)
++ ++
*Thi
s cl
uste
r te
nds
not t
o be
sel
f-co
ntai
ned,
but
oth
er e
lem
enta
ry.
**M
easu
res
scor
e fr
om 1
to 4
.**
*Eac
h (+
) re
pres
ents
1/4
to 1
/2 a
sta
ndar
d de
viat
ion
abov
e th
e m
ean.
Eac
h ()
rep
rese
nts
1/4
to 1
/2 a
sta
ndar
d de
viat
ion
belo
w th
e m
ean.
wr
DY
4F)
EST
con
46

disproportionately chose "finding out about ideas and information" and "presenting information to anaudience" as principal objectives for student computer use, and clearly did not select skill mastery orremediation. Although not quite as computer-knowledgeable or active as some other middle gradesclusters (particularly 2-9 and 2-10), teachers in this cluster are more likely to be academic subject-matterspecialists (particularly in English and science) rather than computer or fine arts teachers, as in Cluster 2-9, or "mixed academic teachers," as in Cluster 2-10. Their choice of software emphasizes wordprocessing (Claris Works is clearly the most popular) and the World Wide Web (Netscape), while othersoftware is used in more exploratory ways. (Only 11% mention Hyperstudio, for example.) As withCluster 1-5, their students disproportionately have access to Macintosh computers, and teachers seem touse both classroom and shared space facilities for their students' computer work.
The other two middle grades clusters with high levels of teacher computer expertise (2-9 and 2-10) aremainly advantaged in terms of access to computers. A majority of teachers in Cluster 2-9 had at least a1:4 ratio of computers to students in their classroom, while 83% of Cluster 2-10 teachers had a 1:2 ratiosomewhere in the school, better than most other groups. Both of these clusters of teachers used a richermix of software, more frequently, than did teachers in Cluster 2-8. However, despite of their breadth ofsoftware use, Cluster 2-9's teachers appear to emphasize the "skills" involved in learning and usingsoftware and definitely, for example, do not prioritize "improving written expression" as a goal of theircomputer use. The three software titles most often named as "most valuable" for this group wereMicrosoft Office (which is primarily a high-school-and-older package), Netscape, and Hyperstudioquite a diverse set. The 2-9 teachers also exhibit some confusion between intention and practice, as theyselected "learning to work collaboratively" more than other teachers did, but they also most often reportedassigning students to computers on a one-on-one basis rather than having them work in pairs. Whereasteachers in Clusters 2-8 and 2-10 both report relatively high levels of out-of-class computer use bystudents, the teachers in Cluster 2-9 report only average levels of such use. Cluster 2-10 teachers, likeCluster 2-8's, name ClarisWorks and Netscape as their most valued software for their students.
High School Clusters
Five clusters of high school teachers show high levels of computer expertise and use computersprofessionally more than other high school teachers do. (See Table 24.) A typical Cluster 3-4 teacher is ascience teacher in a middle class community whose students mainly use computers in pairs, but relativelyinfrequently, to find information on Web sites. Not surprisingly, Netscape is the program most oftenmentioned as "best" in this cluster. However, teachers in Cluster 3-4 are less likely than average to reportstudent use of computers for schoolwork outside of class. In contrast, Cluster 3-7 teachers have studentswho are more likely than average to use computers outside of class. A Cluster 3-7 teacher is typically anEnglish teacher whose above-average ability students use computers in a variety of ways but distinctivelyby doing electronic mail. Yet, their three "favorite" programs were all word processing programsClarisWorks, Microsoft Word, and Word Perfect.
Cluster 3-8 is composed of English, social studies, and computer teachers whose students use a widevariety of software including word processing, Web and CD-ROM information sources, graphics output,and presentation software and who emphasize presentation objectives more than other teachers do, usingprimarily Macintosh computers. The software most often mentioned as best for students by these teachersare Netscape and Powerpoint. Thus, information acquisition and communication of that information areboth prime uses of computers in these academically-oriented classes. Students of Cluster 3-8 teachers areamong the most active in using computers for class tasks outside of the class period and outside of school.
Students of teachers in Clusters 3-9 and 3-10 have the most intensive computer experiences, primarilyonWindows computers, and a majority of them are computer education or business education teachers,
43
47

TA
BLE
23:
MID
DLE
SC
HO
OL
CLU
ST
ER
S: C
HA
RA
CT
ER
IST
ICS
OF
CO
MP
UT
ER
US
E, S
TU
DE
NT
S A
ND
TE
AC
HE
RS
Tea
cher
Clu
ster
Nam
eS
ubje
ct12
.-0
'non
-use
rsM
ath
2-1
limite
d us
e
3 M
easu
res
ofF
req.
of
Com
pute
r U
se*
Non
e
1, 1
, 1
Sof
twar
e U
seno
ne
very
littl
e
'2-2
wor
dE
nglis
h (b
us2,
2, 3
wor
d pr
oces
sing
proc
essi
nged
ove
r-re
p)L
:..
::
2-3
gam
esM
ath
(for
eign
2-,2
, 2ga
mes
; som
ela
ng o
ver-
sim
ulat
ion
rep)
expl
orat
ory
soci
al2,
2, l
ow2
stud
ies
pnm
ary;
scie
nce
seco
ndar
y2-
5w
eb(c
ompu
ters
2, lo
w3,
2an
dvo
catio
nal
over
-rep
)j 2
-6in
fo c
ore
mix
ed/o
ther
acad
emic
prim
ary:
scie
nce
S.P
.P.4
11da
rY2-
7lik
eco
mpu
ters
elem
enta
ry a
nd mix
ed/o
ther
acad
emic
2 -8
wp-
web
-E
nglis
h an
dhi
gh3,
3, 3
broa
dsc
ienc
e(c
ompu
ter
edov
er-r
ep)
CD
-RO
M (
not h
ighe
st);
som
e m
ultim
edia
,pr
esen
tatio
n, w
ord
proc
essi
ng
web
, som
e w
ord
proc
essi
ng
3, h
igh2
, hig
h2C
D-R
OM
, web
, wor
dpr
oces
sing
3, 2
, hig
h2br
oade
r th
anfr
eque
nt
2-9
high
grap
hics
pres
en-
tatio
n
com
pute
rs4,
4, 3
(fin
e ar
tsov
er-r
ep)
1'2-
10hi
ghm
ixed
/oth
erIn
tern
et-
acad
emic
broa
d
4, 3
, low
3br
oad
but n
otfr
eque
nt
wor
d pr
oces
sing
alo
ngw
ith C
D-R
OM
, gam
es,
sim
ulat
ions
; som
egr
aphi
cs1:
wor
d pr
oces
sing
and
web
; som
e m
ix o
fot
hers
incl
.P
rese
ntat
ion
and
mul
timed
ia,
spre
adsh
eet/d
atab
ase
and
CD
-RO
M, g
raph
ics
1: g
raph
ics
and
pres
enta
tion
2: w
ord
proc
essi
ng,
mul
timed
ia,
spre
adsh
eet/d
atab
ase;
som
e of
eve
ryth
ing
else
exc
ept e
-mai
l1:
wor
d pr
oces
sing
,w
eb, a
nd e
-mai
l;2:
CD
-RO
Mpr
esen
tatio
n;"s
ome
of e
very
thin
gel
se
Bes
t Sof
twar
eO
bjec
tives
for
Nam
edco
mpu
ter
use
Cla
risW
orks
(13
%)
Cla
risW
orks
(23
%)
MS
Wor
ks (
13%
)M
S W
ord
(8%
)C
laris
Wor
ks (
22%
)
Hyp
erst
udio
(25
%)
Cla
risW
orks
(13
%)
Net
scap
e (3
0%)
MS
Wor
d (1
2%)
MS
Wor
ks (
11%
)
Enc
arta
(12
%)
Net
scap
e (1
0%)
Cla
risW
orks
(12
%)
Cla
risW
orks
(44
%)
Net
scap
e (2
9%)
Hyp
erst
udio
(11
%)
MS
Offi
ce (
16%
)N
etsc
ape
(14%
)H
yper
stud
io (
12%
)
writ
ing
Whe
repr
imar
ilyus
e
mor
e in
clas
s.
skill
s,re
med
iatio
n,in
depe
nden
t wor
kno
t writ
ing
orpr
esen
tatio
nfin
ding
out
mor
eou
tsid
e
Com
pute
r to
stu
dent
Sol
o vs
.ra
tiopa
irsS
tude
ntS
tude
ntP
latfo
rmA
bilit
y**
none
high
mac
(67%
)
in: h
igh
% w
ith 4
:1m
ore
solo
high
win
or b
ette
r (4
5%)
but
(74%
vs.
(65%
)m
any
with
non
e to
o56
%)
(30%
),
mor
e gr
oups
hig
h m
ac +
and
othe
r,(6
5%)
few
er p
air
(n=
19)
findi
ng o
ut
findi
ng o
uthe
avily
inin
: man
y ha
d no
neno
t ski
llsbo
th p
lace
s (3
2%)
(48%
)
findi
ng o
ut a
ndan
alyz
ing
not p
rese
ntat
ion
mor
e in
clas
s
findi
ng o
ut,
heav
ily in
pres
enta
tion
both
pla
ces
not s
kills
or
(42%
) or
inre
med
iatio
n:cl
ass
skill
s(r
el. h
igh
onco
llabo
ratio
n) n
otw
ritin
g
Net
scap
e (3
5%)
"(re
l. hi
gh o
nC
laris
Wor
ks (
23%
)el
ect-
Wor
d P
erfe
ct (
16%
) co
mm
unic
atio
n)no
t ski
lls
som
ewha
tfe
wer
sol
o
mor
e w
in(5
8%)
slig
htly
mor
e w
in
n=19
)
mor
e gr
oups
hig
h m
ac 4
.4.
(13%
vs.
4%
) .(
70%
),r
n=23
)
in: m
ost h
ad g
reat
mor
e so
lora
tio (
4:1
or b
ette
r)(7
4% v
s.(5
8%)
56%
)
in: m
ost h
ad a
t lea
st6:
1 (6
4%)
but n
otth
at m
any
at 4
:1an
y: m
ore
had
2:1
or b
ette
r th
an o
ther
grou
ps (
83%
)
Out
of S
chl.
Cla
ss S
ES
Use
** *
*
Tea
cher
Com
p.S
kills
**
Tea
cher
Exp
er-
Pro
f'ltis
e*U
se**
++
mor
e w
in+
++
++
+(5
8%)
++
(n=
16)
mix
ed+
++
++
+ ++
(30%
)(n
=22
)
*Mea
sure
s sc
ore
from
1 to
4. H
igh
Sch
ool C
lust
ers
**E
ach
(+)
repr
esen
ts 1
/4 to
1/2
a s
tand
ard
devi
atio
n ab
ove
the
mea
n. E
ach
() r
epre
sent
s 1/
4 to
1/2
a s
tand
ard
devi
atio
n be
low
the
mea
n.
48B
EST
CO
PYA
VA
ILA
BL
E
49

(computer teachers forming an absolute majority in Cluster 3-10). Teachers of both clusters emphasizecomputer skill objectives rather than academic competencies like writing or gaining knowledge orauthentic accomplishment such as presenting and communicating one's understandings to reach a real-world goal. In both clusters, the most commonly named "best" software is Microsoft Office.
There are several interesting contrasts between Clusters 3-9 and 3-10. In terms of the cluster-definingstatistical algorithm which distinguished contrasting patterns of software use, teachers in Cluster 3-9involve their students in greater use of the World Wide Web and more game-playing and somewhat morespreadsheet/database work, while Cluster 3-10 teachers' students make greater use of graphics software,presentation software, and simulation software. Those distinctions are not easily interpretable.
However, we also found three other factors that quite sharply differed between the two sets of teachers.Students of Cluster 3-9 teachers are typically from somewhat lower socio-economic-status communities,they most often work individually at computers, do their work in their own classroom and do not docomputer-based schoolwork outside of class time. In contrast, Cluster 3-10 students are typically highachieving students from relatively wealthy neighborhoods, they are very active in using computers forclasswork outside of class time, and during class they most often work in pairs or groups in specializedcomputer labs.
Yet, interestingly enough, it is the Cluster 3-10 teachers who most clearly define their objectives forstudent computer use in terms of skills and attitudes (computer skills and learning to work independently)rather than goals of academic understandings or communicating those understandings. In fact, Cluster 3-10 teachers explicitly eschew goals such as improved student writing or information acquisition. Lookingahead to data that will be presented in more detail in a future report in this series, we also found thatCluster 3-10 teachers were far more traditional in their actual pedagogy than they were in their personalteaching philosophy and that they were particularly likely to select as disadvantages of using computersthat students are not careful with the equipment and that computers let students cheat more easily.
The best picture we can get so far is that the former group of teachers, in Cluster 3-9, are providing theirsomewhat economically disadvantaged students with a good but conventional education in usingmainstream computers, thus helping them gain technical skills valuable for economic and social mobility.On the other hand, Cluster 3-10 teachers, for all of their personal expertise about computers (by far themost knowledgeable, experienced, and professional users of computers) and despite having students withbackgrounds and perceived abilities that suggest adolescents at the start of successful careers and adultlives, seem to lack a vision for how the computer skills that they provide to students can be linked closelyto academic core objectives and to developing young people's talents for engaging in collaborative actionto affect real-world situations.
Our analysis of teacher clusters defined by patterns of software use will be continued in future reports thatexamine other aspects of teachers' philosophies, teaching practices, and working conditions. This "clusterapproach" serves as a sometimes-confusing, sometimes-clarifying alternative to the more conventionalanalysis of the interrelationships among individual variables. But it is required by the complex nature ofthe dimension of practice defined by the teacher's pattern of in-class student-use of computer software,and we suspect that in the long run, it will prove highly enlightening.
0
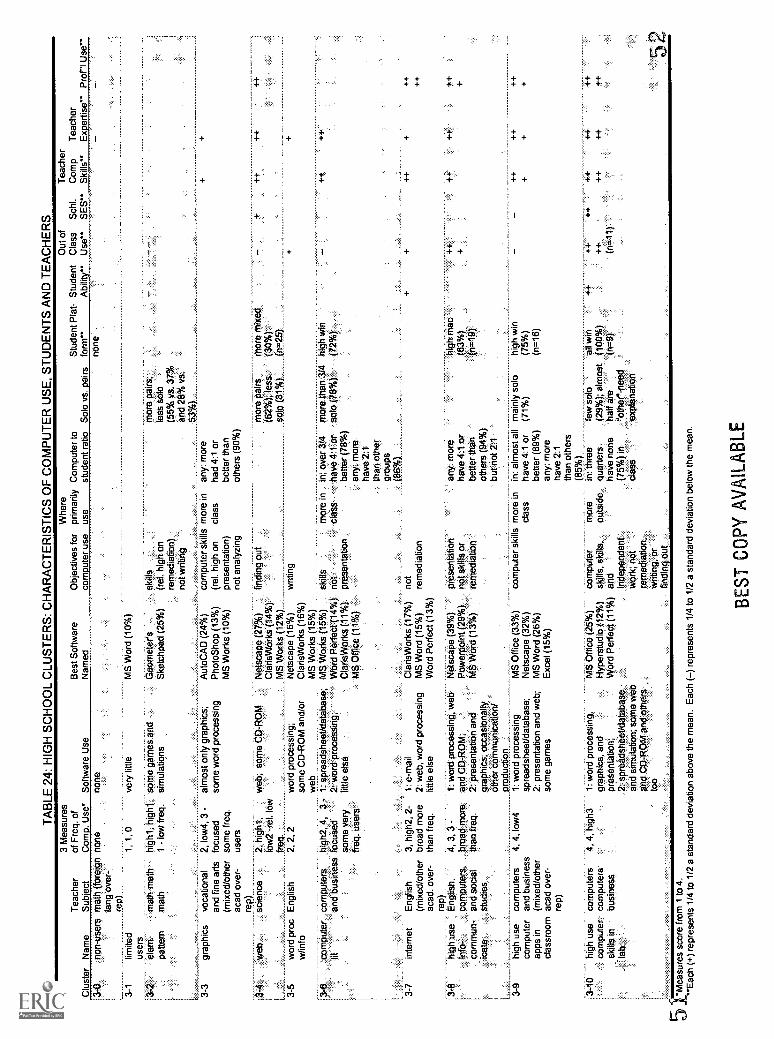
TA
BLE
24:
HIG
H S
CH
OO
L C
LUS
TE
RS
: CH
AR
AC
TE
RIS
TIC
S O
F C
OM
PU
TE
R U
SE
, ST
UD
EN
TS
AN
D T
EA
CH
ER
S
Clu
ster
3 M
easu
res
Tea
cher
of F
req.
of
Nam
eS
ubje
ctC
omp.
Use
*S
oftw
are
Use
non-
user
s m
ath
(for
eign
non
eno
neta
ng o
ver-
rep)
Bes
t Sof
twar
eN
amed
3-1
limite
d1,
1, 0
very
littl
eus
ers
13-2
elem
.-
mat
h m
ath
high
l, hi
ghl,
som
e ga
mes
and
patte
rnm
ath
1lo
w fr
eq.
sim
ulat
ions
3-3
grap
hics
voca
tiona
lan
d fin
e ar
ts(m
ixed
/oth
erac
ad o
ver-
rep)
web
scie
nce
3-5
wor
d pr
oc E
nglis
hw
/info
2, lo
w4,
3 -
alm
ost o
nly
grap
hics
;fo
cuse
dso
me
wor
d pr
oces
sing
som
e fr
eq.
user
s
2, h
ighl
,w
eb, s
ome
CD
-RO
Mho
w2
-rel
. low
freq
.2,
2, 2
com
pute
r co
mpu
ters
high
2, 4
, 3 -
litan
d bu
sine
ss fo
cuse
dso
me
very
freq
. use
rs
3-7
Inte
rnet
Eng
lish
(mix
ed/o
ther
acad
. ove
r-re
p)3
-8hi
gh u
seE
nglis
h.in
fo-
com
pute
rs,
com
mun
- an
d so
cial
icat
e.st
udie
s
wor
d pr
oces
sing
;so
me
CD
-RO
M a
nd/o
rw
eb1:
spr
eads
heet
/dat
abas
e;2:
wor
d pr
oces
sing
;lit
tle e
lse
3, h
igh2
, 2-
1: e
-mai
lbr
oad
mor
e2:
web
, wor
d pr
oces
sing
than
freq
.lit
tle e
lse
4. 3
. 3 -
broa
d m
ore
than
freq
.
3-9
high
use
com
pute
rs4,
4, l
ow4
com
pute
r an
d bu
sine
ssap
ps in
(mix
ed/o
ther
clas
sroo
m a
cad
over
-re
p)
:3-1
0hi
gh u
seco
mpu
ters
com
pute
r- c
ompu
ters
skill
s in
busi
ness
lab.
5le
Mea
sure
ssc
ore
from
1 to
4.
"Eac
h (+
) re
pres
ents
1/4
to 1
/2 a
sta
ndar
d de
viat
ion
abov
e th
e m
ean.
Eac
h (-
) re
pres
ents
1/4
to 1
/2 a
sta
ndar
d de
viat
ion
belo
w th
e m
ean.
1: w
ord
proc
essi
ng, w
eban
d C
D-R
OM
;2:
pre
sent
atio
n an
dgr
aphi
cs; o
ccas
iona
llyet
her
com
mun
icat
ion!
prod
uctio
n1
wor
d pr
oces
sing
spre
adsh
eet/d
atab
ase;
2: p
rese
ntat
ion
and
web
;so
me
gam
es
MS
Wor
d (1
0%)
Geo
met
er's
Ske
tchp
ad (
25%
)
Aut
oCA
D (
24%
)P
hoto
Sho
p (1
3%)
MS
Wor
ks (
10%
)
Net
scap
e (2
7%)
Cla
risW
orks
(14
%)
MS
Wor
ks (
12%
)N
etsc
ape
(16%
)C
laris
Wor
ks (
16%
)M
S W
orks
(15
%)
MS
Wor
ks (
15%
)W
ord
Per
fect
(14
%)
Cla
risW
orks
(11
%)
MS
Offi
ce (
11%
)
Cla
nsW
orks
(17
%)
MS
Wor
d (1
5%)
Wor
d P
erfe
ct (
13%
)
Net
scap
e (3
9%)
Pow
erpo
int (
29%
)M
S W
ord
(13%
)
MS
Offi
ce (
33%
)N
etsc
ape
(32%
)M
S W
ord
(26%
)E
xcel
(15
%)
Obj
ectiv
es fo
rco
mpu
ter
use
skill
s(r
el. h
igh
onre
med
iatio
n)no
t writ
ing
Whe
repr
imar
ilyus
eC
ompu
ter
tost
uden
t rat
io
com
pute
r sk
ills
mor
e in
(rel
. hig
h on
clas
spr
esen
tatio
n)no
t ana
lyzi
ng
findi
ng o
ut
writ
ing
any:
mor
eha
d 4:
1 or
bette
r th
anot
hers
(90
%)
skill
sm
ore
inin
. ove
r 31
4no
tcl
ass
- ha
ve 4
:1 o
rpr
esen
tatio
nbe
tter
(78%
)an
y: m
ore
have
2:1
than
oth
ergr
oups
(86%
)no
tre
med
iatio
n
pres
enta
tion
not s
kills
or
rem
edia
tion
com
pute
r sk
ills
mor
e in
clas
s
4, 4
, hig
h31:
wor
d pr
oces
sing
,M
S O
ffice
(25
%)
com
pute
r.
grap
hics
, and
Itype
rstu
dio
(12%
)sk
ills,
ski
lls.
pres
enta
tion;
Wor
d P
erfe
ct (
11%
) an
d.2
: spr
eads
heet
/dat
abas
e::.
..,in
depe
nden
t ,an
d si
mul
atio
n; s
ome
web
wor
k; n
otan
d C
D-R
OM
and
oth
ers
-re
med
iatio
n,to
oW
ritin
wer
findi
ng o
ut
MO
Bou
tsid
e,
any:
mor
eha
ve 4
:1 o
rbe
tter
than
othe
rs (
94%
)bu
t not
2:1
in: a
lmos
t all
have
4:1
or
bette
r (8
9%)
any:
mor
eha
ve 2
:1th
an o
ther
s
(§,5
1(P
)
quar
ters
have
non
e(7
5%)
incl
asi
Stu
dent
Pla
t- S
tude
ntS
olo
vs. p
airs
form
**A
bilit
yno
ne
mor
e pa
irs;
less
sol
o(5
5% v
s. 3
7%an
d 28
% v
s.53
%)
mor
e pa
irsm
ore
mix
ed(6
2%);
less
(30%
)so
lo (
31%
)(n
=25
)
mor
e th
an 3
f4hi
gh w
inso
lo (
78%
)(7
2%)
high
mac
(63%
)(n
=19
)
mai
nly
solo
high
win
(71%
)(7
5%)
(n=
16)
few
sol
o(2
9%);
alm
ost
half
are
"oth
er-p
eed
expl
anat
ion
Out
of
Tea
cher
Cla
ssS
chl.
Com
pT
each
erU
seS
ES
Ski
llsE
xper
tise
Pro
f.! U
se
++
++
++ ++
++
++
t+
++
++
++
all w
in+
++
+(1
00%
)+
+(n
=9)
(n=
11)
++
BE
ST C
OPY
AV
AIL
AB
LE

DISCUSSION AND CONCLUSIONS
Computers have been present in most schools for nearly 20 years. Until recently, their use has beenlimited by the relatively small number of computers compared to the number of students present.However, as shown in Report 2 in this series,17 by 1998 the typical school had one computer for every6 students enrolled, or about four computers per classroom if they were actually divided equallyamong all instructional rooms.
School computers have also had a limited impact on students because until recently, a plethora oflimitationstechnical ones, limitations in the variety of software and content, in notions about whatshould be done with computers, and in knowledge of how to integrate computer activities intoteachingall conspired to trivialize the kinds of tasks that students were asked to do with computers.In particular, students in elementary schools, and into middle school grades, primarily used computersto do skill-related drills and to play "edutainment" games. Teachers used computers to provide awelcome break from the routine of more difficult and "more important" learning. In students'secondary school experience, computers became a subject in itself, either a pull-out program of"computer literacy" provided by a specialist teacher or a whole semester or year-long course incomputers, keyboard skills, computer programming, or word-processing. Computers became anotherset of skills that parents, students, and teachers believed to be important for students' future lives, butcomputer skills were seen as a ticket to the future much more than as a tool for improving currentunderstandings and academic competence.
Our analysis of the Teaching, Learning, and Computing 1998 survey data suggests that the computerexperiences that teachers provide to students are beginning to change, in some ways fairlydramatically, from the experiences that earlier cohorts of students had. It is still true that, at the highschool level, a majority of intensive experiences with computers that students have are in coursesoutside of the academic coremost often in computer classes and business education classes. It isalso still true that a majority of teachers across grades 4 to 12 either do not use computers at all withtheir students or do so only occasionally; the "typical" teacher provides students with fewer than tenopportunities to use computers during a school year. Nevertheless, we have found that those academicsubject-matter teachers who do have their students use computers frequently, do so in ways that aredifferent from the "traditional" focus on computer-based drills and learning games and computer"literacy."
Across the academic subjects at both elementary and secondary levels, the most common objectivesthat teachers have for their students' use of computers no longer are "practicing skills just taught" or"learning computer skills." Instead, the objectives most often named have to do with students gainingaccess to information and improving their writing. Moreover, the kinds of software that teachersreport using most often with their studentsword processing programs, CD-ROM reference materials,and World Wide Web browser softwareconfirm that what students do most often on schoolcomputers involves searching for information and ideas through electronic media and expressingthemselves in writing; not practicing math and grammar drills, playing games, or learning computerskills as isolated skills.
Nevertheless, the activity of students gathering information and writing about it is not the whole storyof how teachers direct student use of computers in schools today. Apart from Web browsers and word
17Ronald E. Anderson and Amy Ronnkvist, "The Presence of Computers in American Schools," Report #2,
Teaching, Learning, and Computing: 1998 National Survey. University of California, Irvine. June, 1998.http://www.crito.uci.edu/t1c/findings/computers_in_american_schools/html/startpage.htm
47 53

processing programs, most of the other specific software titles that teachers report to be most valuablefor their studentsHyperstudio, among elementary teachers and secondary social studies and scienceteachers; Geometer's Sketchpad in mathematics, Auto CAD in vocational arts subjects, and Photo Shopand Page Maker in fine arts classesare evidence that at least some teachers are having students usecomputers as productivity tools in complex projects that may involve higher-order thinking, designinga product, and explaining their ideas and constructions to an external audience.
In fact, we found that the teachers who are most technically knowledgeable about computers are theones who are most likely to have their students use presentation software and multimedia authoringsoftware and to have as principal objectives goals like having students use computers to help thempresent their ideas before an audience and to communicate with other people. Although even amongthe most computer-skilled teachers, objectives such as acquiring information or writing are morecommon than the objective of helping students to communicate information to an audience, the mostcomputer-skilled teachers are much more likely than other computer-assigning teachers to includeaudience presentation among their objectives.
Many of those who support increased incorporation of computer-related activities into academiccoursework argue that student engagement in doing schoolwork is improved and even carries over totimes of the day when direct teacher supervision is absent. Our research has found that teachers whoseobjectives for student computer use include having them learn to develop presentations for audiences,communicate with other people, acquire information, and express themselves in writing are muchmore likely than other teachers to say that their students do work for the class using computers outsideof class time (for example, at home, or before or after school). Similarly, the teachers who report themost out-of-class involvement by students in doing work for their class are those who frequently havestudents use during class one of four types of programs: presentation software, electronic mail,multimedia authoring software, and word processing programs.
Finally, it is certainly true that what makes a good computer-using teacher is more than any one thing:technical knowledge about computers helps, so does experience in using computers professionally, andit also seems reasonable to expect that an exemplary teacher has the kinds of objectives for studentcomputer use and employs the types of software that most likely result in student engagement andthoughtful effort, outside of class time as well as during class.
At the elementary level, we identified two clusters of teachers who were strong in all of those respects.Together, those clusters of teachers represent only 5% of all teachers of the upper-elementary grades,but by having students integrate a range of academic and technical competencies into the production ofmultimedia products, they are helping to demonstrate what nine- and ten-year old children canaccomplish using technology. At the middle grades, we also identified two strong clusters in terms ofexpertise, professional use, and the nature of their objectives (4% of all middle school teachers). Inthis case, the teachers emphasized both word processing and use of the World Wide Web, along withsome use of electronic mail (in one cluster) and presentation and multimedia software. The teachers inthese clusters demonstrate the integration of information acquisition with communication of thatinformation, making learning consequential for their students and their students' audiences. At thehigh school level, we identified five clusters (13% of all high school teachers) where relatively highlevels of computer expertise were present, but in only one of those clusters did the teachers seemoutstanding in terms of having objectives for student computer use that translated into high levels ofout-of-class involvement in computer work for the class. Those classesa mixture of primarilyEnglish, social studies, and computer classesused an array of software going beyond wordprocessing, Web browsing, and CD-ROM use, to include presentation software (PowerPoint wassecond-only to Netscape as those teachers' most valued software) and other graphically-oriented
4854

programs. Here again, these teachers demonstrated the integration of information acquisition,thoughtful writing and presentation, and concern with communicating fmdings to an audience.
The teachers in these highlighted clusters, although clearly a minority of teachers and even a minorityof computer-assigning teachers, constitute a pioneering group of technology-knowledgeableinstructional innovators. They constitute the standard for exemplary instructional computer use, andtheir numbers are likely to increase in the near future.
49
55

APPENDIX A. SUPPLEMENTARY TABLES
TABLE A-1: WHICH MIDDLE SCHOOL TEACHERS BELONG TO "DIVERSE-USE" CLUSTERS,"LIMITED AND SPECIALIZED USE CLUSTERS," AND "NON-USERS"?
Subject Taught (N)
% that do notuse computerswith students
% limited/specialized clusters
2-1 to 2-5
% diverse-useclusters 2-6 to
2-10
% distribution ofall middle school
teachersEnglish (290) 15 22 18 19Science (314) 18 17 21 18Math (268) 29 20 4 21Social Studies (177) 16 11 13 13Foreign Language (22) 3 3 1 3Mixed Academic Sec. (190) 7 14 24 13Computers (86) 0 5 11 4Business (21) 0 2 1 1
Vocational (39) 2 2 4 2Fine Arts (62) 7 4 1 4Other Applied Sec. (42) 3 2 2 2All M.S. teachers (1,511) 100 100 100 100Universe: All middle school teachers in probability and purposive samples.
TABLE A-2: HIGH SCHOOL SOFTWARE USE CLUSTER GROUPINGS BY SUBJECT TAUGHT
Subject Taught (N)
% do not usecomputers with
students% limited/specialized
clusters 3-1 to 3-5% diverse-use
clusters 3-6 to 3-10 TotalEnglish (270) 28 63 9 100Science (291) 38 50 12 100Math (246) 49 46 5 100Social Studies (172) 41 51 9 100Foreign Language (57) 63 37 0 100Mixed Academic Sec. (53) 6 60 33 100Computers (89) 0 22 78 100Business (83) 8 41 51 100Vocational (70) 14 77 9 100Fine Arts (58) 34 58 8 100Other Applied Sec. (46) 51 37 12 100All H.S. teachers (1,435) 35 50 15 100
Universe: All high school teachers in probability and purposive samples.
50
5.BEST COPY AVAILABLE.

TABLE A-3: DISTRIBUTION OF SUBJECT AREASFOR SELECTED HIGH SCHOOL SOFTWARE USE CLUSTERS
Cluster 3-2 3-3 3-4 3-5 3-6 3-7 3-8 3-9 3-10 All H.S.
Wordproc. Corn-
High useinfo-
High usecomputer
High usecomputer
Main applications used Elem. with puter corn- apps in skills inin that cluster Pattern Graphics Web info lit Internet muniate classroom labSubject Taught Cluster Make-up: % of Teachers from Each Subject Area
English 2 14 15 42 2 26 27 3 0 17
Science 11 7 32 20 20 15 20 16 11 22
Math 59 0 15 2 12 6 2 5 0 19
Social Studies 1 0 16 12 2 15 17 3 7 12
Foreign Language 5 0 3 4 0 0 0 0 0 5
Mixed Academic Sec. 1 11 2 5 5 13 7 5 4 3
Computers 4 4 2 3 26 9 17 30 56 5
Business 2 11 3 7 27 9 0 27 19 5
Vocational 9 28 7 2 3 2 2 0 4 4
Fine Arts 4 23 6 0 0 6 5 0 0 4
Other Applied Sec. 2 4 0 3 4 0 2 11 0 4
All H.S. teachers 100 100 100 100 100 100 100 100 100 100
(N) (70) (55) (69) (220) (107) (57) (59) (45) (37) (1,435)
Universe: All high school teachers in probability and purposive samples.
TABLE A-4: DISTRIBUTION OF TEACHERS ACCORDING TO TYPE OF STUDENTS' SOFTWARE USE ANDFREQUENCY OF EACH STUDENT'S EXPERIENCE DURING CLASS, BY SUBJECT TAUGHT
Subject and Level Taught (N)% non-users
% limitedsoftware
use
% specializedand notfrequent
% diverseuse but notfrequent
% specialized&
frequent use
% diverseand frequent
use TotalElementary Self-Contained (784) 13 30 8 17 8 25 100Elementary Other (291) 22 30 10 14 4 20 100
English (560) 27 30 18 3 14 8 100
Science (605) 36 30 10 10 8 6 100
Math (514) 47 38 7 2 3 3 100
Social Studies (349) 40 29 12 10 4 5 100
Foreign Language (79) 55 30 13 2 0 0 100
Mixed Academic Sec. (243) 15 23 13 12 19 19 100
Computers (175) 1 16 2 9 19 53 100
Business (104) 7 12 8 11 28 35 100
Vocational (109) 20 37 8 7 22 7 100
Fine Arts (120) 43 34 9 5 7 2 100
Other Applied Sec. (88) 47 27 6 11 5 5 100
All teachers (4,021) 30 30 10 9 9 12 100
Universe: All teachers in probability and purposive samples.
51
57

TABLE A-5. PERCENT OF COMPUTER-ASSIGNING TEACHERS WHO REPORT THAT THE FOLLOWINGARE AMONG THEIR MOST IMPORTANT OBJECTIVES FOR STUDENT COMPUTER USE
Subject and LevelTaught
Find outinfo Writing
Reinforce- Computer Analyze Reme- Collabo- Indepen- Presen- Commu-ment skills info diation ration dent work tation nication
Elem. Self-Contained 54% 57% 37% 44% 15% 31% 27% 17% 9% 5%Elem. Other 56 45 46 35 20 40 14 21 13 7English 54 81 17 17 23 20 23 19 29 8Science 60 36 34 25 46 18 20 14 23 9Math 22 13 62 22 34 51 26 32 13 2Social Studies 69 35 20 31 31 13 35 21 25 10Foreign Language 39 38 37 16 34 35 2 43 17 2Misc. Academic Sec. 73 54 20 30 23 11 20 20 18 23Computers 26 7 44 59 39 13 29 33 14 18
Business 7 26 82 52 23 21 20 45 9 11
Vocational 52 14 38 31 32 11 30 46 12 7Fine Arts 50 18 37 21 17 7 21 34 36 13Other Applied Sec. 55% 30% 44% 14% 40% 19% 39% 20% 34% 0%
Universe: Probability sample; teachers who use computers with students in their selected class. For N's, see Table 6.
Note. About 1/4 of vocational and 1/2 of fine arts teachers also included an "other objective among their top 3. Fewer than 10%of teachers of other subjects indicated that as well.
TABLE A-6: STUDENT PARTICIPATION IN USING COMPUTERS FOR CLASS OUTSIDE OF CLASS TIME(HOME + SCHOOL) BY WHETHER TEACHER REPORTED SPECIFIC TYPES OF SOFTWARE
USED IN TEN OR MORE LESSONSUse of computers outside of class for class work (scale1-5)*
Type of SoftwareTeachers reporting software
used in 10+ lessons (N)Other computer-
assigning teachers (N)EffectSize
Presentation s.w. 3.21 (138) 2.61 (1,207) 0.51Word Proc. 2.96 (673) 2.39 (683) 0.48E-mail 3.18 (103) 2.64 (1,253) 0.46Multimedia 3.16 (109) 2.64 (1,247) 0.44CD-ROM Reference 3.05 (301) 2.57 (1,056) 0.41Graphics oriented 2.95 (179) 2.62 (1,176) 0.28WWW Browser 3.01 (318) 2.58 (1,045) 0.16Spreadsheet/Database 2.82 (138) 2.65 (1,220) 0.14Simulation/Exploratory 2.68 (159) 2.65 (1,171) 0.03Skill Games 2.34 (251) 2.71 (1,106) -0.31
Universe: Probability sample; teachers who used computers with students in selected class, questionnaire versions 1 & 2Score is average of the two measures: out-of-class at-school computer use and out-of-school computer use, where 1 = 'none orfew students' 2 = '1/4 of students' 3 ='1/2 of students', 4 ='3/4 of students' and 5 = 'all students.' (Overall mean, 2.51, overallstandard deviation 1.16.)
52BEST COPY AVAILABLE

TABLE A-7: PERCENT OF WEEKLY COMPUTER-ASSIGNING TEACHERS AND NON-ASSIGNINGTEACHERS WHO USE COMPUTERS WEEKLY FOR EACH PROFESSIONAL ACTIVITY SHOWN
Computer Use
Type of Professional Use
(N)
Record Writeor lesson
Make calculate plans orhandouts grades notes
Info orpictures from
Internet forlessons
Corres-pondwith
parents
Camcorder/digital
cameras,scanners
Exchangefiles with
otherteachers
All teachers (2,178) 66 50 42 28 23 7 7
Professionally onlyWeekly with students
(411)
(677)
69
77
60
51
4351
27
37
24
29
4
11
7
9
Standardizeddifference (effect size) .16 -.18 .16 23 .11 F27 .07
Universe: Probability sample only. Teachers intermediate in assigning computer work to students are not shown."All teachers" includes teachers who use computers occasionally with students, who are not shown separately.Largest differences are highlighted.
Poststudentwork onthe web
5
4
9
TABLE A-8: MEAN BREADTH AND FREQUENCY OF STUDENT SOFTWARE USE (SCALE SCORE) FORTEACHERS HAVING SPECIFIC COMPUTER SKILLS THEMSELVES, BY SUBJECT-LEVEL
Subject and LevelTau s ht
Display thedirectory of
a disk
Copy filesfrom one
disk toanother
Create anew
databaseand
establishfields and
screenla outs
Imbedgraphics
into aword-
processordocument
Prepare aslide show
usingpresent-
ationsoftware
Use aWWWsearchen ine
Developmultimediadocument
usingHyperstudio
or similarauthoringsoftware
Allteachers
in thatsub'ect
Elem. Self-Cont. 2.09 2.20 2.55 2.46 2.85 2.25 3.03 1.88
Elementary Other 1.95 2.08 2.20 2.18 2.64 1.93 2.48 1.72
English 1.44 1.52 1.85 1.73 2.18 1.51 2.22 1.27
Science 1.24 1.24 1 41 1.50 1.77 1.32 1.86 1.16
Math 0.74 0.75 0.91 0.92 1.07 0.84 1.28 0.67
Social Studies 1.40 1.46 1 42 1.74 1.75 1.31 2.31 1.16
Foreign Language 0.60 0.71 0.85 0.51 1.08 0.63 1.00 0.63
Mixed Academic Sec. 2.15 2.22 2.44 2.54 2.77 2.24 3.05 1.93
Computer 3.16 3.18 3.34 3.22 3.43 3.17 3.68 3.14
Business 2.23 2.26 2.54 2.34 2.89 2.47 2.97 2.21
Vocational 1.30 1.44 1.48 1.48 1 53 1.32 1.52 1.36
Fine Arts 0.90 0.88 1.01 1.04 1.35 1 09 1.55 0.87
Other Applied Sec. 1.12 1.42 1.26 1.40 1.41 1.09 2.50 1.01
All teachers 1.48 1.54 1.75 1.77 2.02 1.55 2.30 1.36
Universe: All teachers in probability and purposive samples. For N's see Table A-4.Comparing across rows, shaded cells highlight those computer skills on which teachers of that subject score higher.
53 59
?ESA' COPY MAMMA
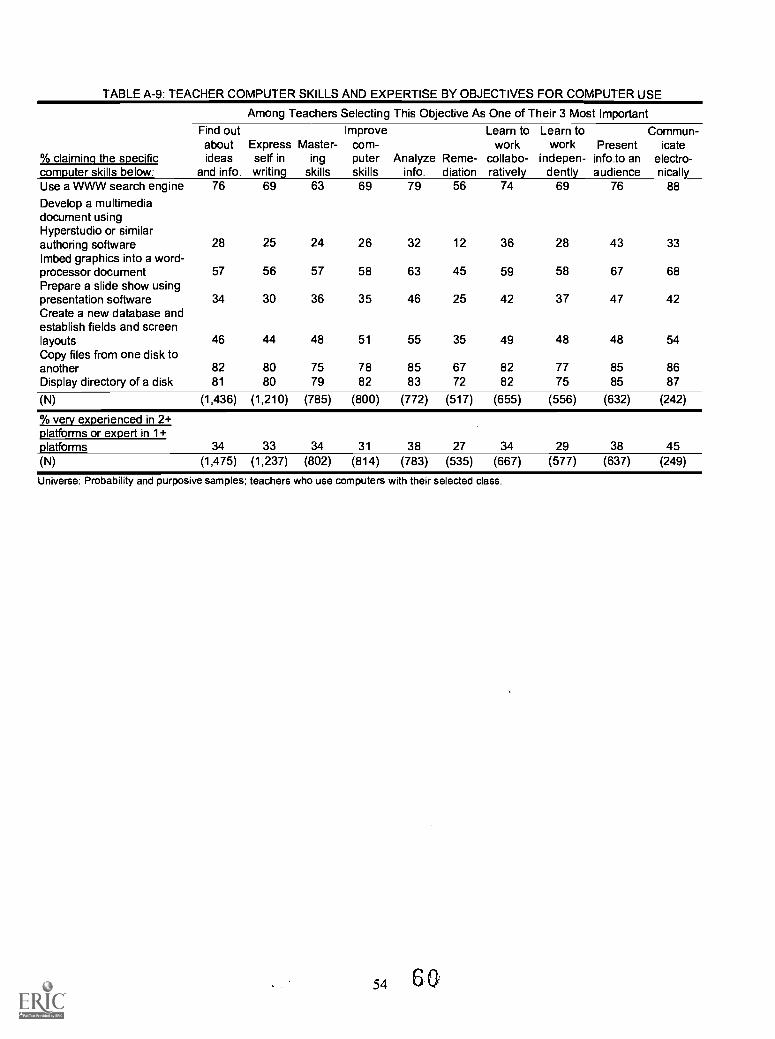
TABLE A-9: TEACHER COMPUTER SKILLS AND EXPERTISE BY OBJECTIVES FOR COMPUTER USE
Among Teachers Selecting This Objective As One of Their 3 Most Important
% claiming the specific
Find outaboutideas
and info.
Express Master-self in ingwritin skills
Improvecorn-puterskills
Analyze Reme-info. diation
Learn towork
collabo-rativel
Learn towork Present
indepen- info.to andentl audience
Commun-icate
electro-nicallcom uter skills below:
Use a WWW search engine 76 69 63 69 79 56 74 69 76 88
Develop a multimediadocument usingHyperstudio or similarauthoring software 28 25 24 26 32 12 36 28 43 33Imbed graphics into a word-processor document 57 56 57 58 63 45 59 58 67 68Prepare a slide show usingpresentation software 34 30 36 35 46 25 42 37 47 42Create a new database andestablish fields and screenlayouts 46 44 48 51 55 35 49 48 48 54Copy files from one disk toanother 82 80 75 78 85 67 82 77 85 86Display directory of a disk 81 80 79 82 83 72 82 75 85 87
(N) (1,436) (1,210) (785) (800) (772) (517) (655) (556) (632) (242)
% very experienced in 2+
34 33 34 31 38 27 34 29 38 45platforms or expert in 1+platforms(N) (1,475) (1,237) (802) (814) (783) (535) (667) (577) (637) (249)
Universe: Probability and purposive samples; teachers who use computers with their selected class.
54 60

TABLE A-10: PERCENT OF TEACHERS REPORTING VARIOUS OBJECTIVES FOR STUDENT COMPUTERUSE AMONG TEACHERS VERY EXPERIENCED OR EXPERT ON AT LEAST ONE PLATFORM,
BY TEACHER'S PLATFORM OF EXPERTISE (MACINTOSH OR WINDOWS)*Percent Of Teachers (those very experienced or expert on at least
one platform) Naming Each ObjectiveAll subjects English only Comp-Bus Only
Mastering skills (reinforcement)
28
39
-11
6
24
-19
42
63
-21
Macintosh
Windows
Difference
Remediation
Macintosh 16 8 8
Windows 18 21 11
Difference -2 -13 -3Express oneself in writingMacintosh 48 83 18
Windows 41 83 19
Difference 6 1 -1
Communicate electronicallyMacintosh 11 15 17
Windows 10 15 9
Difference 1 0 8
Find out about ideas and informationMacintosh 56 61 32Windows 48 47 25Difference 8 14 7
Analyze informationMacintosh 32 17 22Windows 32 22 29Difference 0 -5 -7
Present information to an audience
Macintosh 28 38 26Windows 20 24 12
Difference 9 14 14
Improve computer SkillsMacintosh 26 20 44Windows 33 18 49Difference -7 2 -5
Learn to work collaboratively
Macintosh 27 29 33Windows 25 13 24Difference 2 16 9
Learn to work independently
Macintosh 17 19 33Windows 25 29 43Difference -7 -10 -10
(N) Macintosh (1,188) (191) (119)(N) Windows (1,032) (124) (217)
Universe: Both probability and purposive samples.*Teachers giving self-ratings of "very experienced" or "expert" on platform involved.
55
6 1

APPENDIX B. SUMMARY OF STUDY METHODOLOGY
The Teaching, Learning, and Computing (TLC) study is comprised of completed questionnaireresponses from teachers, principals, and school technology coordinators from three separate samplesof schools. Somewhat more than one-half of the 1,616 schools sampled for the study (56%) were astratified national probability sample of elementary (299 schools), middle (253), and high schools(346), including 83 private and parochial schools. Those schools were sampled with probabilitiesrelated to both size (estimated number of full-time teachers, grades 4 to 12) and the presence ofcomputer technology (based on an index developed for Quality Education Data, Inc.). The samplinguniverse was the approximately 108,000 schools in the Quality Education Data (QED) database.
The remaining samples of schools are referred to as "purposive samples" and were based oncompiling, refining, and sampling from lists of two basic types of schools: "High-end Technologyschools" are schools with substantial amounts of computer technology per capita, including schoolsselected from the QED technology presence index and schools identified through books, articles inmagazines and school web-sites. "Reform Program schools" were compiled by identifying schools orindividual teachers who had been long-term (3 year+) participants in one of 54 different national orregional externally-defined "programs" of major school or instructional reform.
In all three school samples, teachers were sampled from grades 4-12 and from all subjects exceptphysical education and special education. At each sampled school, three to five teachers (3,elementary; 5, middle and high school) were selected with probabilities related to the teacher's reputedinstructional practices and use of technology. A small number of teachers (a maximum of 2 per school)were selected with certainty (probability equal to 1) based on the principal's attribution of that teacherhaving an exemplary instructional practice or based on their known participation in the selectedprogram of instructional reform. Because unequal probabilities were used, at both school and teacherlevel, all analysis employs weighted data with weights inverse to the probability of selection, asmodified by stratum-specific non-response rates and within-school partial completions of teacherrosters.
The research began in the Spring of 1997 with a validation study of self-report measures of teacherbeliefs and practices and exploratory studies of survey measures of changes in teaching practices andtechnology use and school-level investments in technology hardware, software, and training andteacher support. The validation study provided self-report data from 72 teachers in 24 schools anddetailed classroom observation and interview data with those same teachers. At the school level, pilotversions of surveys were used in order to test measurement approaches for studying technologyexpenditure information, hardware and software acquisition, and investments of time and money inteacher training and support activities.
The data collection itself was the second stage of the project, taking place from January through Juneof 1998, and conducted by the Battelle Centers for Evaluation and Health Research. Data collectionencompassed an initial district contact information letter, followed by a school mailing, in whichteachers were rostered and sampled; a subsequent mailing of questionnaires for teachers, the school-level technology coordinator, and the principal; and several waves of mail and telephone follow-up,editing, coding, data entry, and data cleaning. The teacher respondents were asked to complete asurvey booklet about their teaching practice and teaching beliefs that was 21 pages in length andrequired approximately 60-75 minutes. Four different versions of the teacher survey booklet wereused, with overlapping sets of questions. These are called questionnaire versions 1, 2, 3, and 4. Theschool technology coordinator's booklet was approximately the same length as the teacher survey andprincipally concerned the investments their school has made in computer hardware, software, andteacher training and support, measured both financially and in units of time, materials, and equipment.
56
62

The principal's survey booklet was half as long, and inquired about technology-related school policiesand efforts in school restructuring and reform.
The third stage of the project involves data analysis, preparation of reports, and the release of nationaldata files for secondary analysis.
PARTICIPATING SCHOOLS
Across the three samples, 1,215 of the 1,616 schools selected for participation agreed to participate inthe study (75%). They did so by returning a roster of a specifically requested number of teachers (10in elementary schools; 15 in middle and high schools), providing rough estimates of each teacher's useof computers, projects, and emphasis on critical thinking and complex problem-solving. The attainedprobability sample (rostered schools) consists of 598 public and 57 private and parochial schools.
The High-end Technology sample includes 182 rostered schools including 86 entering the samplebased on having among the highest technology presence index scores in the QED database. Theremainder were believed to have substantial computer and Internet technology, as identified throughpublicly available information from school Web sites, books, and magazine articles.
The Reform Program sample includes 378 rostered schools that were identified through varioussources as being involved in one of 53 different reform efforts. The "reform program" and "high-endtechnology" samples involve some definitional overlap in that 13 of the reform programs (with 90rostered schools) appear to have substantial amounts of technology, while 72 rostered high-endtechnology schools appear to have explicit instructional reform emphases even though they did notparticipate in any of the major reform programs selected. A majority of Reform Program schools areinvolved in a school-wide reform program (e.g., Coalition of Essential Schools, League of ProfessionalSchools, Bay Area School Reform Collaborative, Co-NECT Schools) These total 30 separateprograms (200 schools) including four with a technology emphasis and five that are not 'programs' perse but schools linked by a common origin (e.g., 'Charter Schools with a constructivist flavor'). Inaddition, there are four programs that are limited to math and/or science (26 schools), 17 programs thatenrolled individual teacher participants (nine of these are technology-centered), and two programs thatrecognized individual exemplary teachers.
Lists of participating schools or teachers were obtained directly from the programs in 44 of the cases;in the other 9 they were obtained from public sources--lists of participants on World Wide Web sitesor in books. (In some cases, these were not actually programs--just schools identified as exemplary inthe public source.) Forty programs provided more schools than were needed so that probabilitysampling was employed to select the particular schools that would be incorporated into the study. (Insome cases, additional selection criteria were used prior to the sampling.)
SELECTION OF TEACHERS
At each of the 1,616 studied schools, samples of 3 (elementary) or 5 (middle and high school) teacherswere drawn through probability sampling methods. A Teacher Roster form was sent to the schoolprincipal as the first major mailing to the school (following an introductory letter). That form askedthe principal to roster either 10 (elementary) or 15 (secondary) teachers of grade 4 or higher (in somecases limited to the same subject taught by a reform program-participating teacher), starting withteachers with last names beginning with a randomly selected letter of the alphabet and proceedingalphabetically. The roster form asked for 4 additional pieces of information about the rostered teachers
57
63

that were used to assign sampling weights to each rostered teacher (e.g., subject taught, use ofcomputers, use of projects in teaching).
In addition, two other sources of teachers are incorporated as purposive samples. Approximately 250teachers were individually selected from the purposive school samples based on reports (public orprogram-supplied) of their participation in educational reform activities. And finally, approximately800 teachers were chosen through nominations by principals (as part of the Roster form) as exemplarypractitioners of constructivist approaches to teaching.
ATTAINED SAMPLE
Response rates of individually selected teachers, principals, and technology coordinators averagedabout 70%. Altogether, responses were obtained from 4,083 teachers of grade 4 and higher in 1,150schools, as well as 845 technology coordinators and 867 school principals.
6458

U.S. Department of EducationOffice of Educational Research and Improvement (OERI)
National Library of Education (NLE)Educational Resources Information Center (ERIC)
NOTICE
REPRODUCTION BASIS
ERIC
This document is covered by a signed "Reproduction Release(Blanket) form (on file within the ERIC system), encompassing allor classes of documents from its source organization and, therefore,does not require a "Specific Document" Release form.
This document is Federally-funded, or carries its own permission toreproduce, or is otherwise in the public domain and, therefore, maybe reproduced by ERIC without a signed Reproduction Release form(either "Specific Document" or "Blanket").
EFF-089 (9/97)