Reproductions supplied by EDRS are the best that can be ... · PDF filemeasures of discrepant...
26
DOCUMENT RESUME ED 468 757 TM 034 434 AUTHOR Stricker, Lawrence J. TITLE Discrepant LSAT Subscores. LSAC Research Report Series. INSTITUTION Law School Admission Council, Newtown, PA. REPORT NO LSAC-R-93-01 PUB DATE 1993-06-00 NOTE 25p. PUB TYPE Numerical/Quantitative Data (110) Reports Research (143) EDRS PRICE EDRS Price MF01/PCO2 Plus Postage. DESCRIPTORS Admission (School); *College Entrance Examinations; Law Schools; Law Students; *Minority Groups; *Scores IDENTIFIERS *Discrepancy Measure; *Law School Admission Test ABSTRACT This study investigated the overall prevalence of discrepant Law School Admission Test (LSAT) subscores, their differential incidence for subgroups of examinees, and the psychometric properties of alternative measures of discrepant performance. The sample consisted of 39,350 examinees who took the LSAT in December 1991. Subscore differences, often very substantial, were frequent. Statistically significant differences affected about a third of examinees, and significant and rare differences involved a tenth of test takers. The incidence of these discrepancies did not vary with the examinees' sex, ethnicity, familiarity with the LSAT, or the number or selectivity of the law schools to which examinees were applying. The prevalence was greater for examinees who had high total scores on the LSAT or were older, primarily reflecting these test takers' deviantly poor performance on the Analytical Reasoning subtest. Reliability was appreciable for two of the three measures or observed differences, but minimal for the more important measures of significant or significant and rare differences. Subscore discrepancies appear to have no viable role to play in interpreting examinee's LSAT performance. (Contains 3 figures, 10 tables, and 29 references.) (SLD) Reproductions supplied by EDRS are the best that can be made from the original document.
Transcript of Reproductions supplied by EDRS are the best that can be ... · PDF filemeasures of discrepant...
DOCUMENT RESUME
ED 468 757 TM 034 434
AUTHOR Stricker, Lawrence J.
TITLE Discrepant LSAT Subscores. LSAC Research Report Series.
INSTITUTION Law School Admission Council, Newtown, PA.REPORT NO LSAC-R-93-01PUB DATE 1993-06-00
NOTE 25p.
PUB TYPE Numerical/Quantitative Data (110) Reports Research (143)EDRS PRICE EDRS Price MF01/PCO2 Plus Postage.
DESCRIPTORS Admission (School); *College Entrance Examinations; LawSchools; Law Students; *Minority Groups; *Scores
IDENTIFIERS *Discrepancy Measure; *Law School Admission Test
ABSTRACT
This study investigated the overall prevalence of discrepantLaw School Admission Test (LSAT) subscores, their differential incidence forsubgroups of examinees, and the psychometric properties of alternativemeasures of discrepant performance. The sample consisted of 39,350 examineeswho took the LSAT in December 1991. Subscore differences, often verysubstantial, were frequent. Statistically significant differences affectedabout a third of examinees, and significant and rare differences involved atenth of test takers. The incidence of these discrepancies did not vary withthe examinees' sex, ethnicity, familiarity with the LSAT, or the number orselectivity of the law schools to which examinees were applying. Theprevalence was greater for examinees who had high total scores on the LSAT orwere older, primarily reflecting these test takers' deviantly poorperformance on the Analytical Reasoning subtest. Reliability was appreciablefor two of the three measures or observed differences, but minimal for themore important measures of significant or significant and rare differences.Subscore discrepancies appear to have no viable role to play in interpretingexaminee's LSAT performance. (Contains 3 figures, 10 tables, and 29references.) (SLD)
Reproductions supplied by EDRS are the best that can be madefrom the original document.
NN00
w.
etce)
O2I
LSAC RESEARCH REPORT SERIES
PERMISSION TO REPRODUCE ANDDISSEMINATE THIS MATERIAL HAS
BEEN GRANTED BY
J. VAS ELECK
TO THE EDUCATIONAL RESOURCESINFORMATION CENTER (ERIC)
1
U.S. DEPARTMENT OF EDUCATIONOffice of Educational Research and Improvement
EDUCATIONAL RESOURCES INFORMATIONCENTER (ERIC)
C/rhis document has been reproduced asreceived from the person or organizationoriginating it.Minor changes have been made toimprove reproduction quality.
Points of view or opinions stated in thisdocument do not necessarily representofficial OERI position or policy.
Discrepant LSAT Subscores
Lawrence J. Stricker
Law School Admission CouncilResearch Report 93-01June 1993
L A W
A Publication of Law School Admission Council/Law School Admission Services
2 > STCOPYAVAILABLE
The Law School Admission Council is a nonprofit association ofUnited States and Canadian law schools. Law School Admission Servicesadministers the Council's programs and provides services to the legaleducation community.
LSAT® and the Law Services logo are registered by Law School AdmissionServices, Inc. Law School Forum is a service mark of Law School AdmissionServices, Inc. The Official LSAT Prep Test, The Official LSAT Prep Kit, andThe Official LSAT TriplePrep are trademarks of Law School AdmissionServices, Inc.
Copyright © 1993 by Law School Admission Services, Inc.
All rights reserved. This book may not be reproduced or transmitted, inwhole or in part, by any means, electronic or mechanical, includingphotocopying, recording, or by any information storage and retrievalsystem, without permission of the publisher. For information, write:Publications, Law School Admission Services, Box 40, 661 Penn Street,Newtown, PA 18940.
This study is published and distributed by the Law School AdmissionCouncil (LSAC) and Law School Admission Services (LSAS). The opinionsand conclusions contained in this report are those of the author and do notnecessarily reflect the position or policy of LSAC/LSAS.
3

Discrepant LSAT Subscores
Abstract
This study investigated the overall prevalence of discrepant LSAT subscores, their differential incidence forsubgroups of examinees, and the psychometric properties of alternative measures of discrepant perfor-mance. Subscore differences, often very substantial ones, were frequent; statistically significant differencesaffected about a third of examinees; and significant and rare differences involved a tenth of test takers. Theincidence of these discrepancies did not vary with the examinees' sex, ethnicity, familiarity with the LSAT, orthe number or selectivity of the law schools to which the examinees were applying. But the prevalence wasgreater for examinees who had high total scores on the LSAT or were older, primarily reflecting these test-takers' deviantly poor performance on the Analytical Reasoning subtest. Reliability was appreciable for twoof the three measures of observed differences but minimal for the more important measures of significant orsignificant and rare differences. Subscore discrepancies appear to have no viable role to play in interpretingexaminees' LSAT performance.
Unlike other tests employed in graduate admissions, the Law School Admission Test (LSAT) reports only atotal score. In contrast, the Graduate Record Examination General Test (Conrad, Trisman, & Miller, 1977) pro-vides Verbal, Quantitative, and Analytical scores (and no total score), and the Graduate ManagementAdmission Test (Hecht & Schrader, 1986) gives Verbal and Quantitative scores as well as a total score.
A recent LSAS survey suggested that there was growing interest in the law school community about the po-tential usefulness of the LSAT subscores (Analytical Reasoning, Reading Comprehension, and LogicalReasoning) in admissions, especially for minority applicants, supplementing what is yielded by the test'stotal score. One approach to this issue is to identify examinees with markedly different performance on thetest's subscores. Previous research has studied examinees' discrepancies between their LSAT performanceand their college record, as reflected in large differences between LSAT scores and undergraduate GPAs, inan effort to determine the implications of these differences for the validity of the test and college record inpredicting law school grades (Bo ldt, 1966, 1968). Similarly, examinees may exhibit discrepant performanceon the various sections of the LSAT, with large differences in their subscores. These discrepancies may shedlight on the examinees' overall test performance, useful in interpreting the LSAT total score and in makingadmissions decisions about these applicants. For instance, discrepant performance could reflect language dif-ficulties or atypical education.
"Profile" or "scatter" analysis of discrepancies in the subtest scores on, individually-administered intelli-gence tests, notably the Weschler Adult Intelligence ScaleRevised (WAIS-R; Wechsler, 1981), WechslerIntelligence Scale for ChildrenRevised (WISC-R; Wechsler, 1974), and Stanford-Binet Intelligence Scale:Fourth Edition (Thorndike, Hagen, & Sattler, 1986), have long been employed in interpreting performanceon these tests (e.g., Frank, 1983; Kaufman, 1979, 1990; Matarazzo, 1972; Sattler, 1988). For instance, differ-ences between the Verbal and Performance IQs on the WALS-R or WISC-R are examined. Subtest scores onthese tests are also compared, such as the difference between the highest and lowest scores for the entire setof subtests, as well as the difference between scores for each pair of subtests.
Accordingly, the purpose of this study was to provide basic information on discrepant test performance onthe LSAT: the overall prevalence of discrepant performance as well as its differential incidence for relevantsubgroups of examinees, and the psychometric properties of alternative measures of this characteristic.
4

Method
Sample and Test Form
The sample consisted of the 39,530 examinees who took the LSAT (Form 2LSS13) at the December 1991 ad-ministration, had no test irregularities, had no handicap flag, and had not applied to all 15 Canadian lawschools. This test administration was chosen because it used the current version of the test, it was large, andit had a substantial proportion of minority examinees. For the sample, 55.1% were male, 72.4% were Cauca-sian, the mean age was 26.4 years (SD = 6.51), and the mean LSAT score was 149.9 (SD = 9.2).
Variables
Discrepant subscores. A combined score was obtained for the two separately-timed Logical Reasoning sec-tions. The raw scores for this combined subtest and for each of the two other subtests were converted tostandard scores. Corresponding standard scores for the halves of each subtest were also obtained. Thehalves were matched in content and psychometric characteristics. The content characteristics were the majorcategories used in test development. Analytical Reasoning categories are Ordering, Grouping and Set Mem-bership, and Mixed/Other. Reading Comprehension categories are Science and Technology Humanities,Social Science, and Law. And Logical Reasoning categories are Conclusions; Techniques, Structures, Pat-terns, or Principles; Argument Flaws and Reasoning Errors; and Additional Evidence. The psychometriccharacteristics were the delta indexes of item difficulty and biserial correlations of item discrimination, fromthe routine test analysis for a subsample of the examinees.
Three kinds of discrepancy scores, adapted from those employed with intelligence tests (e.g., Kaufman,1990; Sattler, 1988), were obtained for each pair of subscores:
1. An observed difference: The actual difference between a pair of subscores, retaining the direction of thedifference.
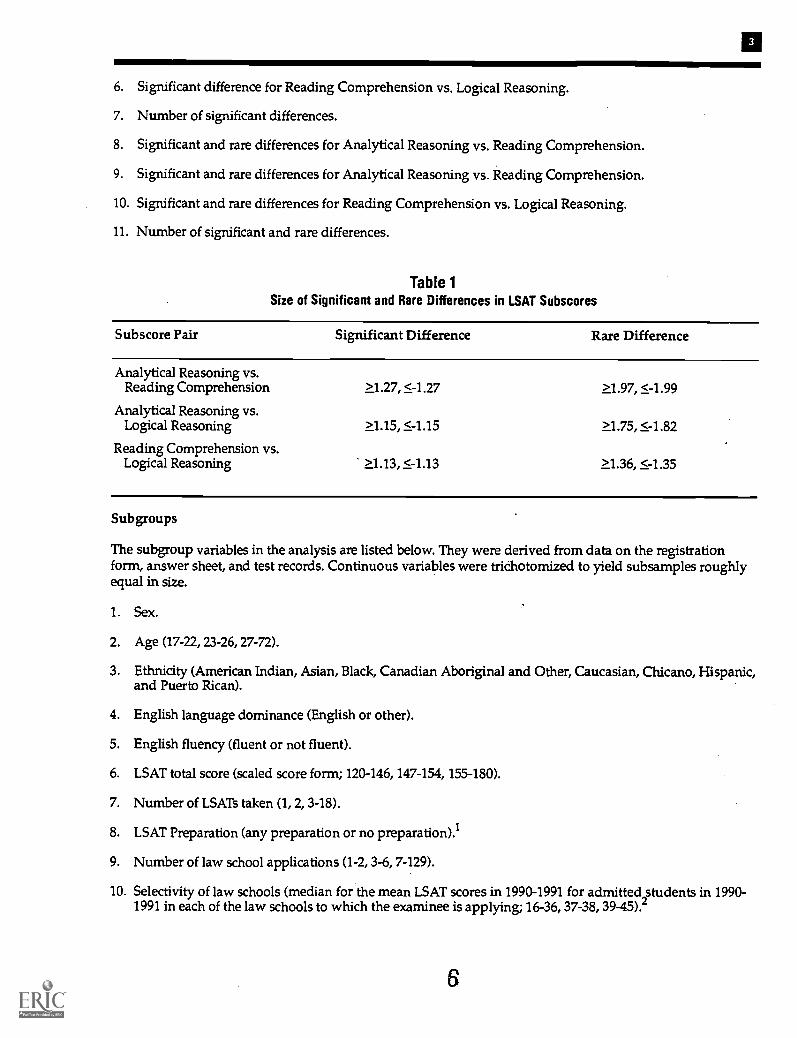
2. A significant difference: An observed difference that was statistically significant. Each pair of subscore dif-ferences was tested for significance, using the .05 significance level (two-tailed). The direction of thedifference was retained. (The size of each pair of subscore differences required for a significant differ-ence appears in Table 1.)
3. A significant and rare difference: An observed difference that was both significant and infrequent. Eachpair of subscore differences was appraised for its frequency in the sample. Subscore differences wereidentified that had a probability of occurrence of .05 or less (using the top and bottom 2.5% of the fre-quency distribution) and were also significant. The direction of the difference was retained. (The size ofeach pair of subscore differences required for a significant and rare difference appears in Table 1.)
Two composite measures were also obtained from the discrepancy scores for the three pairs of subscores:
1. The number of significant differences, disregarding the direction of the differences.
2. The number of significant and rare differences, disregarding the direction of the differences.
The following variables were derived for the full subscores and the half subscores:
1. Observed difference for Analytical Reasoning vs. Reading Comprehension.
2. Observed difference for Analytical Reasoning vs. Logical Reasoning.
3. Observed difference for Reading Comprehension vs. Logical Reasoning.
4. Significant difference for Analytical Reasoning vs. Reading Comprehension.
5. Significant difference for Analytical Reasoning vs. Logical Reasoning.
6. Significant difference for Reading Comprehension vs. Logical Reasoning.
7. Number of significant differences.
8. Significant and rare differences for Analytical Reasoning vs. Reading Comprehension.
9. Significant and rare differences for Analytical Reasoning vs. Reading Comprehension.
10. Significant and rare differences for Reading Comprehension vs. Logical Reasoning.
11. Number of significant and rare differences.
Table 1Size of Significant and Rare Differences in LSAT Subscores
Subscore Pair Significant Difference Rare Difference
Analytical Reasoning vs.Reading Comprehension >1.27, <-1.27 >1.97, <-1.99
Analytical Reasoning vs.Logical Reasoning >1.15,1-1.15 >1.75, <-1.82
Reading Comprehension vs.Logical Reasoning >1.13, <-1.13 1.36, 1-1.35
Subgroups
The subgroup variables in the analysis are listed below. They were derived from data on the registrationform, answer sheet, and test records. Continuous variables were trichotomized to yield subsamples roughlyequal in size.
1. Sex.
2. Age (17-22, 23-26, 27-72).
3. Ethnicity (American Indian, Asian, Black, Canadian Aboriginal and Other, Caucasian, Chicano, Hispanic,and Puerto Rican).
4. English language dominance (English or other).
5. English fluency (fluent or not fluent).
6. LSAT total score (scaled score form; 120-146, 147-154, 155-180).
7. Number of LSATs taken (1, 2, 3-18).
8. LSAT Preparation (any preparation or no preparation).1
9. Number of law school applications (1-2, 3-6, 7-129).
10. Selectivity of law schools (median for the mean LSAT scores in 1990-1991 for admitted students in 1990-1991 in each of the law schools to which the examinee is applying; 16-36, 37-38, 39-45).`
6
U
Analysis
Prevalence analysis. Differences within the various subgroups (e.g., male vs. female) in the frequencies foreach of the six categorical discrepancy variables for the full subscores (e.g., significant difference for Analyti-cal Reasoning vs. Reading Comprehension, significant and rare difference for Analytical Reasoning vs.Reading Comprehension) were assessed by x2 tests. And differences within the various subgroups in themeans for each of the continuous discrepancy variables for the full subscores (e.g., observed difference forAnalytical Reasoning vs. Reading Comprehension, number of significant differences, number of significantand rare differences) were assessed by one-way analysis of variance.
Because of the large sample size, both statistical and practical significance were considered in evaluating theresults. The .01 level was used throughout in view of the sample size. A minimum effect size was used thataccounted for 1% of the variance: a w of .10 for x2 analyses and an T1 of .10 for analyses of variance (Cohen,1988). This size is commonly considered to be a "small" effect from the standpoint of practical significance(Cohen, 1988).
Reliability analysis. The agreement between the categorical discrepancy variable for the correspondingpairs of half subscores (e.g., significant difference for Analytical ReasoningHalf 1 vs. Reading Comprehen-sionHalf 1 with significant difference for Analytical ReasoningHalf 2 vs. Reading ComprehensionHalf2) for the total sample was assessed by the product-moment correlation between the two trichotomous vari-ables. (These variables were dummy coded: The codes for the significant difference variables were +1 =significantpositive, 0 = not significant, and 1 = significantnegative; the codes for the significant and raredifference variables were: +1 = significant and rarepositive, 0 = not significant and rare, and -1 = signifi-cant and rarenegative.)
The agreement between the continuous discrepancy variables for the corresponding pairs of half subscores(e.g., observed difference for Analytical ReasoningHalf 1 vs. Reading ComprehensionHalf 1 with ob-served differences for Analytical ReasoningHalf 2 vs. Reading ComprehensionHalf 2; number ofsignificant differencesHalf 1 with number of significant differencesHalf 2) for the total sample was as-sessed by the product-moment correlation between the two continuous variables.
It should be noted that these analyses yield underestimates of reliability for the categorical discrepancy vari-ables and the composite measures for them because these variables are derived from half subscores, not fullsubscores. Standard corrections for double length are not applicable, for these adjustments are for continu-ous scores that are additive, but the present variables use categorizations that are not additive.
Intercorrelation analysis. The product-moment intercorrelations of the categorical discrepancy variables forthe full subscores were computed for the total sample. (The variables were dummy coded, with the samecodes used in the reliability analysis.) Note that these correlations are inflated because the same subscoresare used in different discrepancy variables (e.g., observed difference for Analytical Reasoning vs. ReadingComprehension with observed difference for Analytical Reasoning vs. Logical Reasoning).
Results
Prevalence
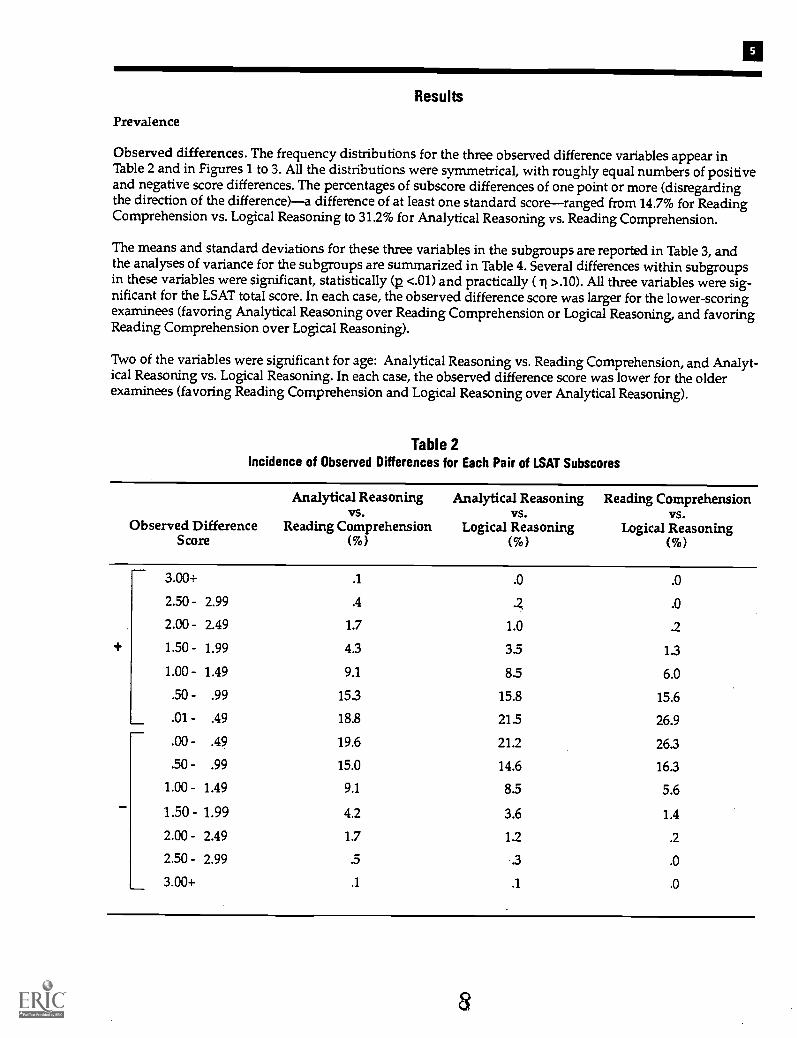
Observed differences. The frequency distributions for the three observed difference variables appear inTable 2 and in Figures 1 to 3. All the distributions were symmetrical, with roughly equal numbers ofpositiveand negative score differences. The percentages of subscore differences of one point or more (disregardingthe direction of the difference)-a difference of at least one standard score-ranged from 14.7% for ReadingComprehension vs. Logical Reasoning to 31.2% for Analytical Reasoning vs. Reading Comprehension.
The means and standard deviations for these three variables in the subgroups are reported in Table 3, andthe analyses of variance for the subgroups are summarized in Table 4. Several differences within subgroupsin these variables were significant, statistically (R <.01) and practically ( i >.10). All three variables were sig-nificant for the LSAT total score. In each case, the observed difference score was larger for the lower-scoringexaminees (favoring Analytical Reasoning over Reading Comprehension or Logical Reasoning, and favoringReading Comprehension over Logical Reasoning).
Two of the variables were significant for age: Analytical Reasoning vs. Reading Comprehension, and Analyt-ical Reasoning vs. Logical Reasoning. In each case, the observed difference score was lower for the olderexaminees (favoring Reading Comprehension and Logical Reasoning over Analytical Reasoning).
Table 2Incidence of Observed Differences for Each Pair of LSAT Subscores
Observed DifferenceScore
Analytical Reasoningvs.
Reading Comprehension(%)
Analytical Reasoningvs.
Logical Reasoning(%)
Reading Comprehensionvs.
Logical Reasoning(%)
3.00+ .1 .0 .0
2.50 - 2.99 .4 2, .0
2.00 - 2.49 1.7 1.0 .2
1.50 1.99 4.3 3.5 1.3
1.00 1.49 9.1 8.5 6.0
.50 - .99 15.3 15.8 15.6
.01 - .49 18.8 21.5 26.9
.00 - .49 19.6 212 26.3
.50 - .99 15.0 14.6 16.3
1.00 - 1.49 9.1 8.5 5.6
1.50 1.99 4.2 3.6 1.4
2.00 - 2.49 1.7 12 .2
2.50 - 2.99 .5 .3 .0
3.00+ .1 .1 .0
8

Table 3Means and Standard Deviation of Observed Differences for Each Pair of LSAT Subscores
Analytical Reasoning vs. Analytical Reasoning vs. Reading ComprehensionReading Comprehension Logical Reasoning vs. Logical Reasoning
Subgroup N Mean 532 Mean SD Mean p_
Male
Female
17 - 22
23 - 26
27 - 72
AmericanIndian
Asian
Black
CanadianAboriginaland Other
Caucasian
Chicano
Hispanic
Puerto Rican
English
Other
Fluent
Not Fluent
Sex
21,762 -.04 1.00 -.09 .91 -.05 .70
17,622 .05 .98 .11 .88 .06 .68
Age
14,202 .13 .99 .13 .88 .00 .70
11,910 .12 .98 .07 .89 -.04 .69
13,397 -.25 .96 -.21 .89 .04 .68
Ethnicity
276 -.07 .99 -.01 .93 .06 .72
2,377 .21 1.03 .28 .90 .07 .70
4,454 .01 .88 .09 .80 .08 .66
1,139 -.01 .98 .02 .89 .04 .69
28,503 -.02 1.01 -.05 .92 -.03 .69
626 -.05 1.00 .04 £6 .09 .71
1,229 -.01 .94 .10 £6 .11 .66
753 .07 .87 .18 .78 .10 .63
English Language Dominance
35,661 -.01 .99 .00 .90 .00 .69
2,036 .17 .97 .20 .85 .03 .68
English Fluency
36,671 .00 .99 .00 .90 .00 .69
348 .29 .93 .35 .78 .05 .66

Table 3 (continued)
Subgroup N
Analytical Reasoning vs.Reading Comprehension
Mean SD
Analytical Reasoning vs. Reading ComprehensionLogical Reasoning vs. Logical Reasoning
Mean SD Mean SD
LSAT Total Score
120 - 146 13,813 .11 .88 .21 .80 .10 .66
147 -154 13,174 .02 1.06 -.01 .95 -.03 .73
155 - 180 12,543 -.15 1.02 -.23 .90 -.07 .66
Number of LSATs Taken
1 29,035 -.05 .99 -.05 .90 .00 .69
2 8,675 .13 .99 .12 .91 -.01 .70
3 - 18 1,820 .15 .98 .20 .87 .04 .69
LSAT Preparation
Preparation 34,668 .01 .99 .01 .90 .00 .69
NoPreparation 1,648 -.18 .98 -.15 .90 .04 .67
Number of Law School Applications
1 - 2 9,617 -.10 .97 -.08 .90 .02 .68
3 - 6 10,063 .00 1.00 .02 .90 .01 .69
7 -129 8,319 .13 1.00 .08 .90 -.05 .69
Selectivity of Schools
16 - 36 7,511 .06 .99 .07 .90 .01 .70
37 - 38 8,044 .03 1.01 .02 .91 .00 .70
39 - 45 11,225 -.05 .99 -.06 .89 -.01 .68

Table 4Analyses of Variance of Subgroup Differences in Observed Differences for Each Pair of LSAT Subscores
Source
Analytical Reasoning vs. Analytical Reasoning vs.Reading Comprehension Logical Reasoning
Mean Meandf Square F rl Square F 11
Reading Comprehensionvs. Logical Reasoning
MeanSquare F
Between
Within
1 71.28
39,382 .99
72.26**
Sex
.04 361.65 449.06"
.81
.11 111.81
.47
236.66** .08
Between
Within
2 619.55
39,506 .96
647.01**
Age
.18 444.33 560.83**
.79
.17 23.28
.47
49.11** .05
Between
Within
7 17.22
34,349 .99
17.47**
Ethnicity
.06 46.53 57.68**
.81
.10 14.09
.47
29.81** .07
Between
Within
1 58.86
37,695 .99
59.65**
English Language Dominance
.04 78.96 9733**
.81
.05 1.47
.47
3.11 .01
Between
Within
1 29.21
37,017 .99
29.55**
English Fluency
.03 40.68 49.98**
.81
.04 .95
.48
1.99 .01
Between
Within
2 239.69
39,527 .98
245.36"
LSAT Total Score
.11 632.42 807.72**
.78
.20 104.47
.47
222.28" .11
Between
Within
2 140.62
39,527 .98
143.21**
Number of LSATs Taken
.08 134.69 166.61"
.81
.09 2.42
.48
5.09" .02
Between
Within
1 58.70
36,314 .99
59.46**
LSAT Preparation
.04 39.10 47.92**
S2
.04 1.98
.47
4.19 .01
Between
Within
2 122.64
27,996 .98
Number of Law School Applications
125.19** .09 64.45 7949** .08
.81
11.29
.48
23.69" .04
Between
Within
2 31.93
26,777 .99
32.26**
Selectivity of Law Schools
.05 42.49 52.28**
.81
.06 .77
.48
1.61 .01
Note. An r of .10 is a "small" effect (Cohen, 1988).<.01.
1.1

Figure 1Distribution for Analytical Reasoning vs. Reading Comprehension observed difference score.
30
25
20
5
0-3.5 -3.0-3.0 -2.5 -2.0 -1.5 -1.0 -0.5 0.0 0.5 1.0 1.5 2.0 2.5 3.0 3.5
Figure 2Distribution for Analytical Reasoning vs. Logical Reasoning observed difference score.
30
25
20
5
0-3.5 -3.0 -2.5 -2.0 -1.5 -1.0 -0.5 0.0 0.5 1.0 1.5 2.0 2.5 3.0 3.5
12
10
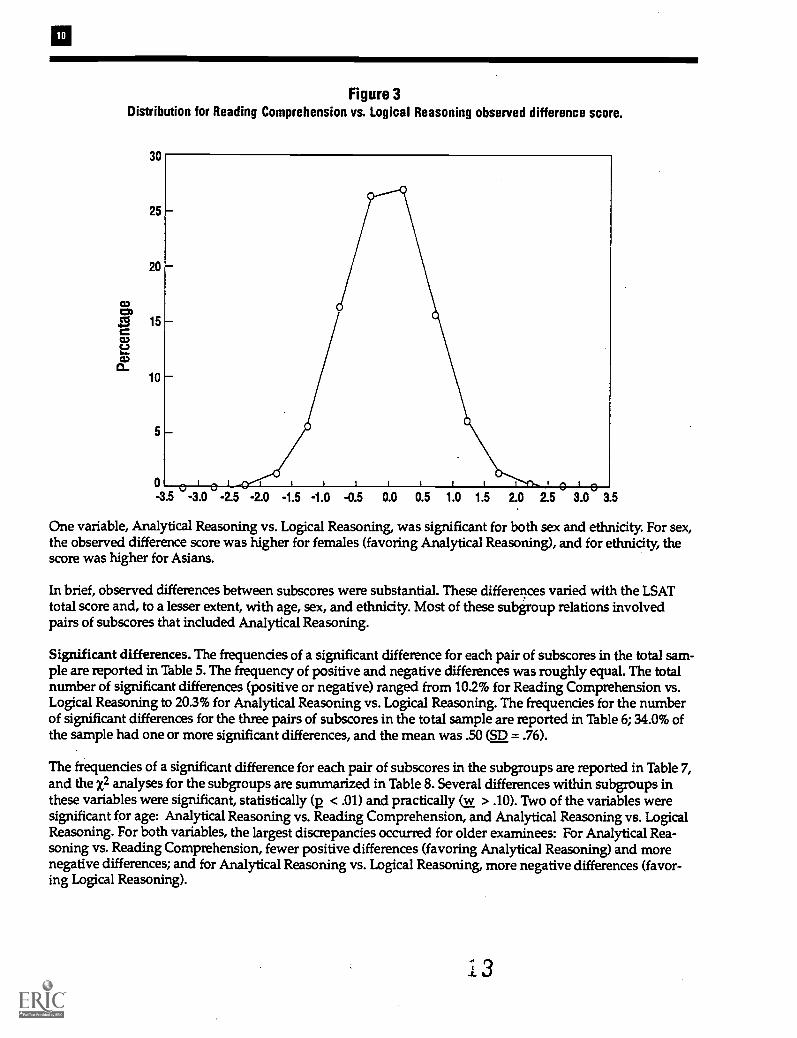
Figure 3Distribution for Reading Comprehension vs. Logical Reasoning observed difference score.
30
25
20
5
0-3.5 -3.0 -2.5 -2.0 -1.5 -1.0 -0.5 0.0 0.5 1.0 1.5 2.0 2.5 3.0 3.5
One variable, Analytical Reasoning vs. Logical Reasoning, was significant for both sex and ethnicity. For sex,the observed difference score was higher for females (favoring Analytical Reasoning), and for ethnicity, thescore was higher for Asians.
In brief, observed differences between subscores were substantial. These differences varied with the LSATtotal score and, to a lesser extent, with age, sex, and ethnicity. Most of these subgroup relations involvedpairs of subscores that included Analytical Reasoning.
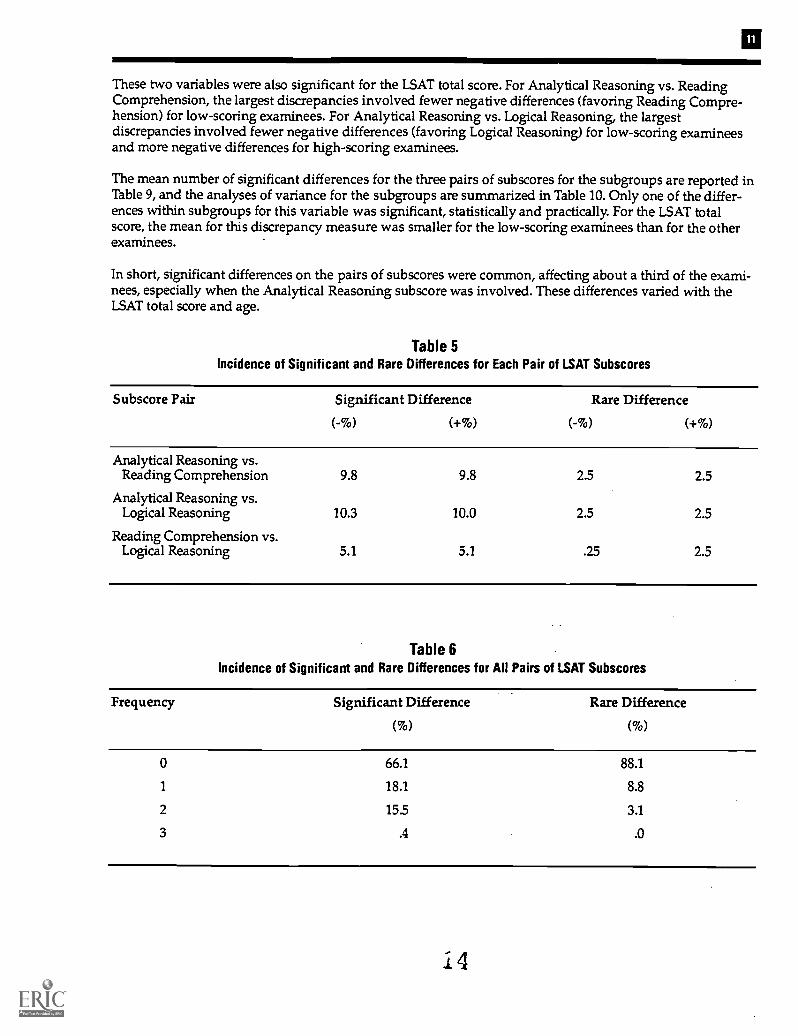
Significant differences. The frequencies of a significant difference for each pair of subscores in the total sam-ple are reported in Table 5. The frequency of positive and negative differences was roughly equal. The totalnumber of significant differences (positive or negative) ranged from 10.2% for Reading Comprehension vs.Logical Reasoning to 20.3% for Analytical Reasoning vs. Logical Reasoning. The frequencies for the numberof significant differences for the three pairs of subscores in the total sample are reported in Table 6; 34.0% ofthe sample had one or more significant differences, and the mean was .50 ( 2 = .76).
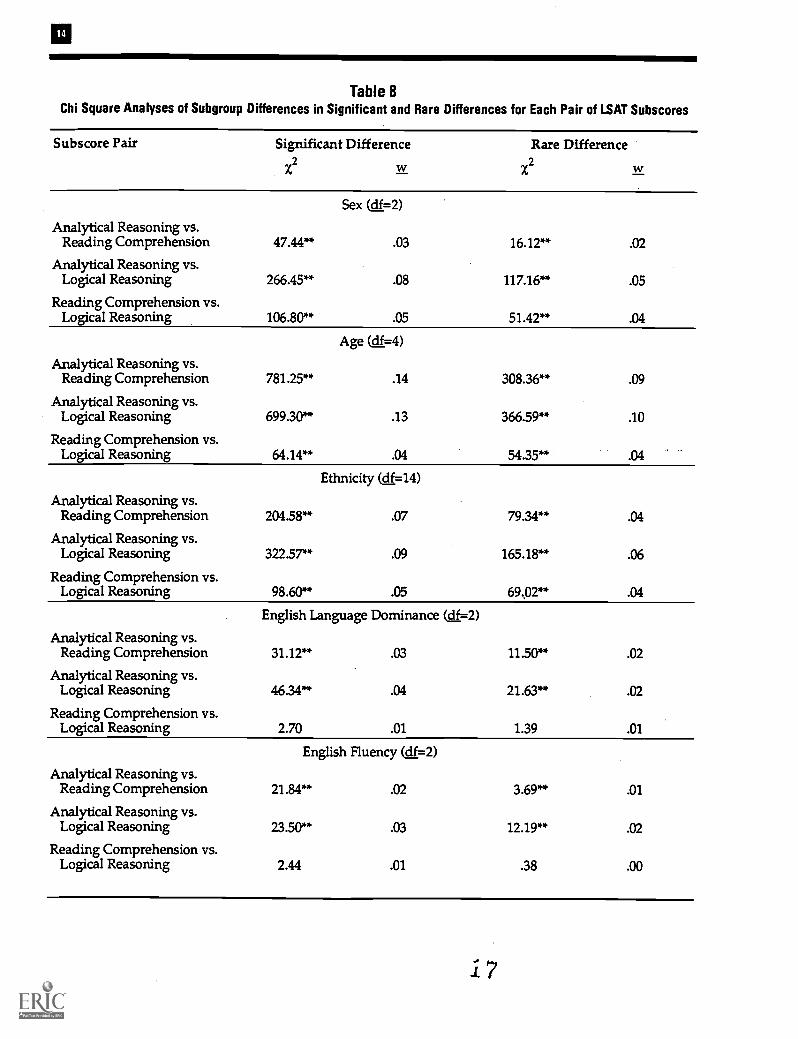
The frequencies of a significant difference for each pair of subscores in the subgroups are reported in Table 7,and the x2 analyses for the subgroups are summarized in Table 8. Several differences within subgroups inthese variables were significant, statistically (R < .01) and practically (iv > .10). Two of the variables weresignificant for age: Analytical Reasoning vs. Reading Comprehension, and Analytical Reasoning vs. LogicalReasoning. For both variables, the largest discrepancies occurred for older examinees: For Analytical Rea-soning vs. Reading Comprehension, fewer positive differences (favoring Analytical Reasoning) and morenegative differences; and for Analytical Reasoning vs. Logical Reasoning, more negative differences (favor-ing Logical Reasoning).
Es
These two variables were also significant for the LSAT total score. For Analytical Reasoning vs. ReadingComprehension, the largest discrepancies involved fewer negative differences (favoring Reading Compre-hension) for low-scoring examinees. For Analytical Reasoning vs. Logical Reasoning, the largestdiscrepancies involved fewer negative differences (favoring Logical Reasoning) for low-scoring examineesand more negative differences for high-scoring examinees.
The mean number of significant differences for the three pairs of subscores for the subgroups are reported inTable 9, and the analyses of variance for the subgroups are summarized in Table 10. Only one of the differ-ences within subgroups for this variable was significant, statistically and practically. For the LSAT totalscore, the mean for this discrepancy measure was smaller for the low-scoring examinees than for the otherexaminees.
In short, significant differences on the pairs of subscores were common, affecting about a third of the exami-nees, especially when the Analytical Reasoning subscore was involved. These differences varied with theLSAT total score and age.
Table 5Incidence of Significant and Rare Differences for Each Pair of LSAT Subscores
Subscore Pair Significant Difference
(-%) (+%)
Rare Difference
(-%) (+%)
Analytical Reasoning vs.Reading Comprehension 9.8 9.8 2.5 2.5
Analytical Reasoning vs.Logical Reasoning 10.3 10.0 2.5 2.5
Reading Comprehension vs.Logical Reasoning 5.1 5.1 .25 2.5
Table 6Incidence of Significant and Rare Differences for AU Pairs of LSAT Subscores
Frequency Significant Difference
(%)
Rare Difference
(%)
0 66.1 88.1
1 18.1 8.8
2 155 3.1
3 .4 .0
14

Table 7Incidence of Significant and Rare Differences for Each Pair of LSAT Subscores for Subgroups
Subgroup N
Significant Difference
AR vs. RCa AR vs. LRb RC vs. LR`
(-%) (+%) (-%) (+%) (-%) (+%)
Rare Difference
AR vs. RCa AR vs. LRb RC vs. LIZ`
(-%) (+%) (-%) (+%) (-%) (+%)
SexMale 21,762 10.7 9.5 12.3 8.7 5.9 4.4 2.8 2.4 3.2 2.2 2.9 2.2Female 17,622 8.7 10.2 7.8 11.6 4.2 6.0 2.2 2.6 1.6 2.9 2.0 2.9
Age17 - 22 14,202 7.6 12.2 7.3 12.3 5.4 5.3 1.8 3.4 1.5 3.5 2.7 2.823 - 26 11,910 7.6 11.9 9.0 11.4 5.9 4.4 1.8 2.9 1.9 2.9 3.1 2.227 - 72 13,397 14.0 5.3 14.7 6.2 4.1 5.5 3.9 1.2 4.1 1.2 1.8 2.5
EthnicityAmerican Indian 276 12.7 9.4 10.1 10.9 6.2 5.8 2.5 1.4 2.5 1.4 3.6 2.9Asian 2,377 7.6 14.7 6.2 15.9 4.1 6.3 2.3 3.9 1.1 5.0 2.1 3.0Black 4,454 7.0 7.4 6.0 8.9 3.2 5.9 1.6 1.4 1.1 1.6 1.3 2.8Canadian
Aboriginal andOther 1,139 9.4 9.4 9.0 10.4 4.6 5.2 2.3 2.5 2.9 2.3 1.8 2.5
Caucasian 28,503 10.5 9.9 11.6 9.6 5.7 4.8 2.8 2.6 2.9 2.5 2.8 2.3Chicano 626 11.3 8.6 8.5 9.9 3.2 7.4 2.6 2.9 2.1 2.4 1.8 3.7Hispanic 1,229 8.7 7.2 8.1 11.0 3.4 6.3 2.0 2.2 2.1 3.3 1.5 3.4Puerto Rican 753 5.0 8.1 4.8 10.1 3.0 4.8 1.2 1.6 1.1 2.0 1.5 2.4
English LanguageDominanceEnglish 35,661 9.9 9.7 10.4 10.0 5.1 5.2 2.5 2.5 2.5 2.5 2.5 2.5Other 2,036 6.7 12.1 6.1 12.3 4.4 4.8 1.6 3.3 1.1 3.3 2.3 2.8
English FluencyFluent 36,671 9.8 9.9 10.2 10.1 5.1 5.2 2.5 25 2.5 2.6 2.5 2.5Not Fluent 348 3.2 14.1 2.6 12.9 3.7 4.0 1.2 3.4 .3 4.6 2.0 2.6
LSAT Total Score120 -146 13,813 4.9 9.2 4.3 12.2 3.2 6.1 .9 2.3 .5 2.9 1.5 2.8147 - 154 13,174 11.5 12.6 11.2 11.3 6.5 5.9 2.8 3.3 2.6 3.7 3.2 3.1155 -180 12,543 13.3 7.5 16.0 6.2 5.8 3.2 4.0 1.8 4.6 1.0 2.9 1.4
Number of LSATsTaken1 29,035 10.6 8.8 11.1 9.0 5.0 5.0 2.8 2.2 2.8 2.2 2.5 2.42 8,675 7.5 12.4 8.4 12.6 5.6 5.3 1.8 3.2 1.9 3.5 2.7 2.63 -18 1,820 7.3 12.6 6.4 13.7 4.4 6.0 15 3.7 .9 3.5 2.1 3.2

Table 7 (continued
Significant Difference
AR vs. RCa AR vs. LRb RC vs. LIZ`
Rare Difference
AR vs. RCa AR vs. LRb RC vs. Lle
Subgroup N (-%) (+%) (-%) (+%) (-%) (+%) (-%) (+%) (-%) (+%) (-%) (+%)
LSAT PreparationYes 1,648 13.4 7.2 14.1 7.3 3.8 5.3 3.9 1.2 2.8 1.8 1.6 2.7No 34,668 9.5 9.9 10.1 10.2 5.2 5.1 2.5 2.6 2.4 2.6 2.6 2.5
Number ofLaw SchoolApplications1 - 2 9,617 11.2 7.1 12.0 8.2 4.7 5.5 3.0 1.5 3.2 1.8 2.3 2.63 6 10,063 9.9 10.3 9.8 10.3 5.0 5.4 2.6 2.7 2.4 2.6 2.5 2.67 - 129 8,319 7.8 12.5 9.1 11.8 6.0 4.5 1.6 3.3 1.7 3.2 2.8 2.2
Selectivity ofLaw Schools16 - 36 7,511 8.4 10.8 8.9 11.3 5.2 5.7 2.1 2.7 2.3 2.9 2.8 2.637 - 38 8,044 9.7 10.9 10.0 11.1 5.0 5.3 2.4 2.8 2.2 2.9 2.3 2.739 -45 11,225 10.8 8.8 11.7 8.4 5.4 4.7 2.8 2.1 2.7 2.0 2.5 2.2
a Analytical Reasoning vs. Reading Comprehensionb Analytical Reasoning vs. Logical Reasoning
Reading Comprehension vs. Logical Reasoning
Significant and rare differences. The frequencies of a significant and rare difference for each pair of subscoresin the total sample are reported in Table 5; the frequency of positive and negative differences was identical. Thetotal number of significant differences was 5.0% for each pair of subscores. The frequencies for the number of sig-nificant and rare differences for the three pairs of subscores in the total sample are reported in Table 6; 11.9% ofthe sample had one or more significant and rare differences, and the mein was .15 (S12 = .44).
The frequencies of a significant and rare difference for each pair of subscores in the subgroups are reportedin Table 7, and the x2 analyses are summarized in Table 8. Two differences within the subgroups in thesevariables were significant, statistically and practically. The same variable, Analytical Reasoning vs. LogicalReasoning, was significant for age and the LSAT total score. For age, the largest discrepancy involved morenegative differences (favoring Logical Reasoning) for older examinees. For the LSAT total score, the largestdiscrepancy involved fewer negative differences for low-scoring examinees.
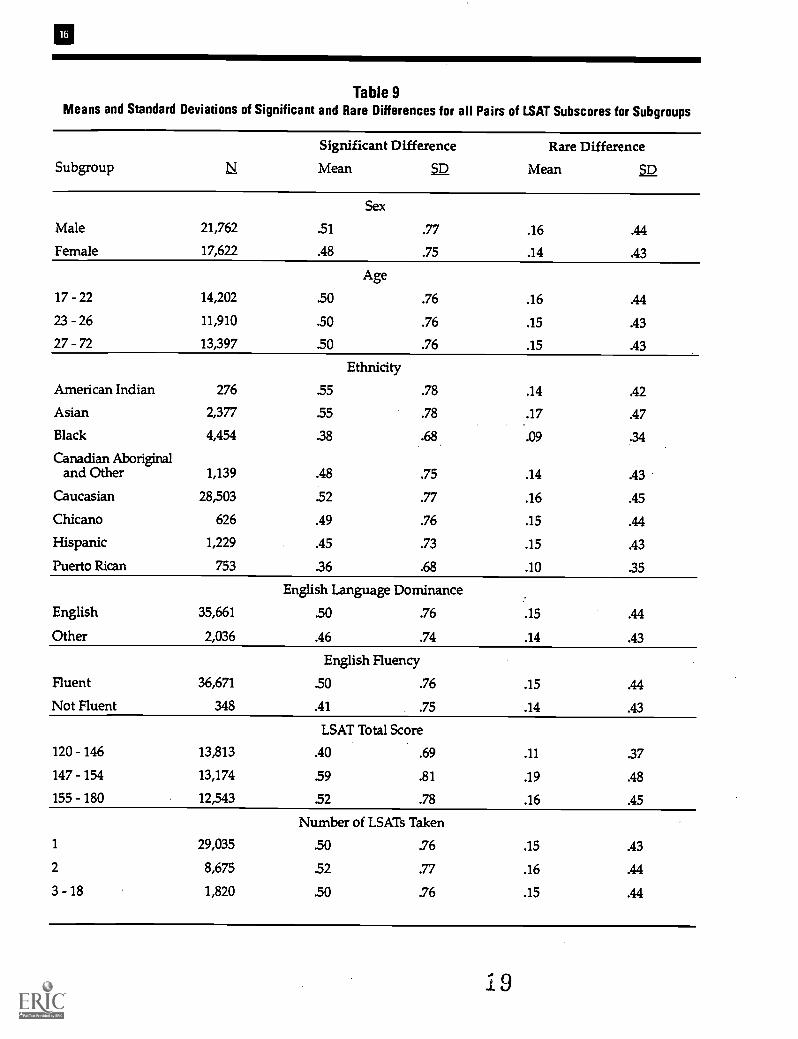
The mean number of significant and rare differences for the three pairs of subscores for the subgroups are re-ported in Table 9, and the analyses of variance for the subgroups are summarized in Table 10. None of thedifferences within subgroups was significant, statistically and practically.
In brief, significant and rare differences in the pairs of subscores were uncommon, but about a tenth of theexaminees were affected. These differences varied with the LSAT total score and age.
Intercorrelations
Observed differences. In the total sample, the observed difference variable for Analytical Reasoning vs.Reading Comprehension correlated .74, with the corresponding Analytical Reasoning vs. Logical Reasoningvariable and -.47 with the Reading Comprehension vs. Logical Reasoning variable, and the Analytical Rea-soning vs. Logical Reasoning variable correlated .24 with the Reading Comprehension vs. Logical Reasoning
w
Table 8Chi Square Analyses of Subgroup Differences in Significant and Rare Differences for Each Pair of LSAT Subscores
Subscore Pair Significant Difference
X2
Rare Difference
X2
Analytical Reasoning vs.Reading Comprehension
Analytical Reasoning vs.Logical Reasoning
Reading Comprehension vs.Logical Reasoning
47.44**
266.45**
106.80**
Sex (c11=2)
.03
.08
.05
16.12**
117.16**
51.42**
.02
.05
.04
Age (df=4)
Analytical Reasoning vs.Reading Comprehension 781.25** .14 308.36** .09
Analytical Reasoning vs.Logical Reasoning 699.30** .13 366.59** .10
Reading Comprehension vs.Logical Reasoning 64.14** .04 54.35** :04
Ethnicity (c_lf=14)
Analytical Reasoning vs.Reading Comprehension 204.58** .07 79.34** .04
Analytical Reasoning vs.Logical Reasoning 322.57** .09 165.18** .06
Reading Comprehension vs.Logical Reasoning 98.60** .05 69;02** .04
English Language Dominance (cl1=2)
Analytical Reasoning vs.Reading Comprehension 31.12** .03 11.50** .02
Analytical Reasoning vs.Logical Reasoning 46.34** .04 21.63** .02
Reading Comprehension vs.Logical Reasoning 2.70 .01 1.39 .01
English Fluency (d1=2)
Analytical Reasoning vs.Reading Comprehension 21.84** .02 3.69** .01
Analytical Reasoning vs.Logical Reasoning 23.50** .03 12.19** .02
Reading Comprehension vs.Logical Reasoning 2.44 .01 38 .00
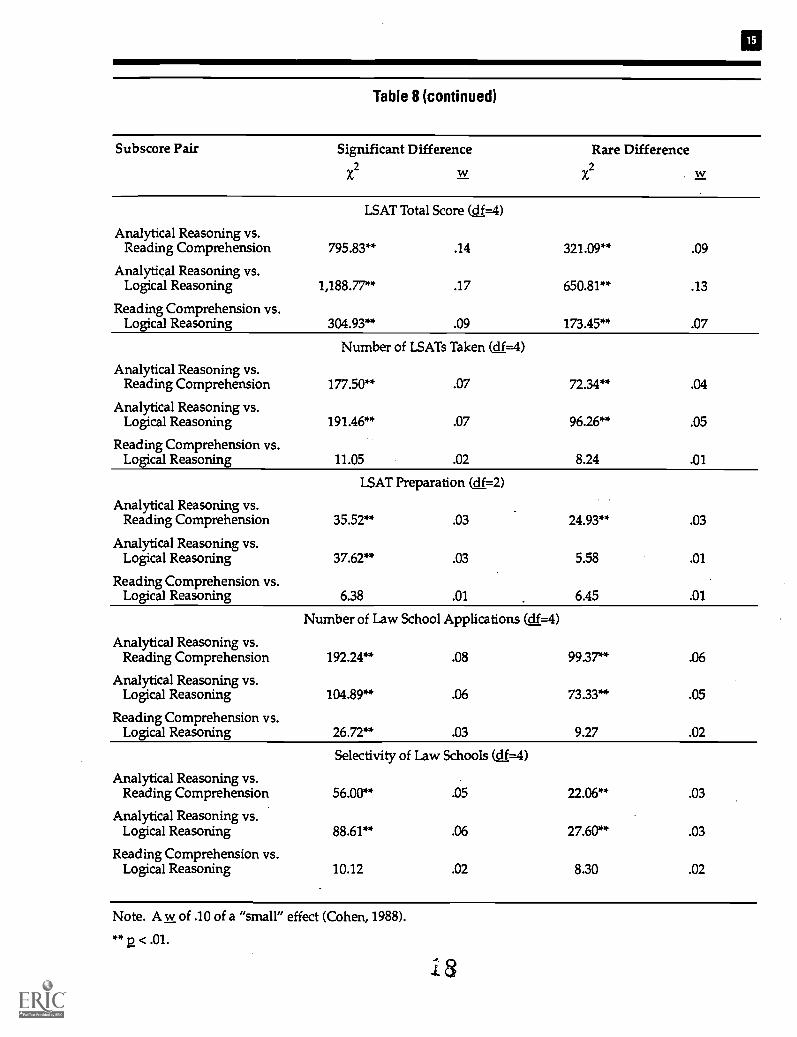
Table 8 (continued)
Subscore Pair Significant Difference Rare Difference
X2 X2
LSAT Total Score (df=4)
Analytical Reasoning vs.Reading Comprehension 795.83** .14 321.09**
Analytical Reasoning vs.Logical Reasoning 1,188.77** .17 650.81**
Reading Comprehension vs.Logical Reasoning 304.93** .09 173.45**
Number of LSATs Taken (c=4)
Analytical Reasoning vs.Reading Comprehension 177.50**
Analytical Reasoning vs.Logical Reasoning 191.46**
Reading Comprehension vs.Logical Reasoning 11.05
.07
.07
.02
72.34**
96.26**
8.24
.09
.13
.07
.04
.05
.01
LSAT Preparation (cif=2)
Analytical Reasoning vs.Reading Comprehension 35.52** .03 24.93** .03
Analytical Reasoning vs.Logical Reasoning 37.62** .03 5.58 .01
Reading Comprehension vs.Logical Reasoning 6.38 .01 6.45 .01
Number of Law School Applications (cL f=4)
Analytical Reasoning vs.Reading Comprehension 192.24**
Analytical Reasoning vs.Logical Reasoning 104.89**
Reading Comprehension vs.Logical Reasoning 26.72**
.08
.06
.03
99.37**
73.33**
9.27
.06
.05
.02
Selectivity of Law Schools (c11=4)
Analytical Reasoning vs.Reading Comprehension 56.00**
Analytical Reasoning vs.Logical Reasoning 88.61**
Reading Comprehension vs.Logical Reasoning 10.12
.05
.06
.02
22.06**
8.30
.03
.03
.02
Note. A w of .10 of a "small" effect (Cohen, 1988).
** < .01.
16
Table 9Means and Standard Deviations of Significant and Rare Differences for all Pairs of LSAT Subscores for Subgroups
Subgroup N
Significant Difference
Mean SD
Rare Difference
Mean SD
Sex
Male 21,762 .51 .77 .16 .44
Female 17,622 .48 .75 .14 .43
Age
17 - 22 14,202 .50 .76 .16 .44
23 - 26 11,910 .50 .76 .15 .43
27 - 72 13,397 .50 .76 .15 .43
Ethnicity
American Indian 276 .55 .78 .14 .42
Asian 2,377 .55 .78 .17 .47
Black 4,454 .38 .68 .09 .34
Canadian Aboriginaland Other 1,139 .48 .75 .14 .43
Caucasian 28,503 .52 .77 .16 .45
Chicano 626 .49 .76 .15 .44
Hispanic 1,229 .45 .73 .15 .43
Puerto Rican 753 .36 .68 .10 .35
English Language Dominance
English 35,661 .50 .76 .15 .44
Other 2,036 .46 .74 .14 .43
English Fluency
Fluent 36,671 .50 .76 .15 .44
Not Fluent 348 .41 .75 .14 .43
LSAT Total Score
120 - 146 13,813 .40 .69 .11 .37
147 - 154 13,174 .59 .81 .19 .48
155 -180 12,543 .52 .78 .16 .45
Number of LSATs Taken
1 29,035 .50 .76 .15 .43
2 8,675 .52 .77 .16 .44
3 -18 1,820 .50 .76 .15 .44
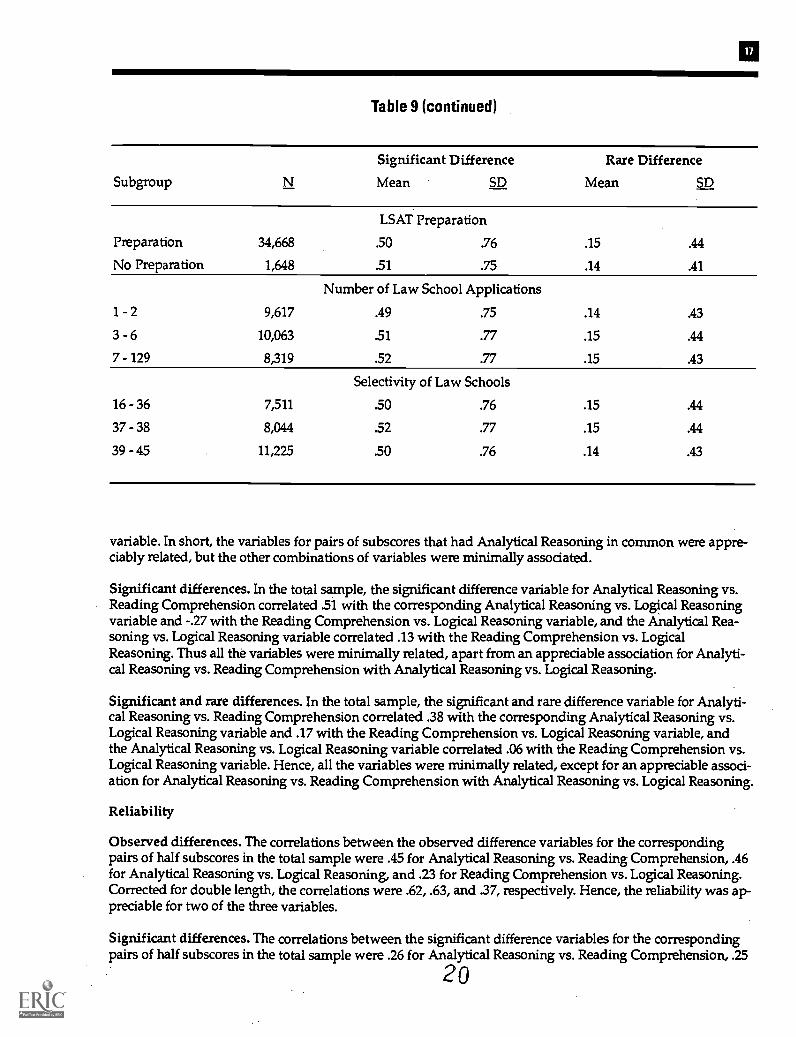
Table 9 (continued)
Subgroup N
Significant Difference
Mean SD
Rare Difference
Mean SD
LSAT Preparation
Preparation 34,668 .50 .76 .15 .44
No Preparation 1,648 .51 .75 .14 .41
Number of Law School Applications
1- 2 9,617 .49 .75 .14 .43
3 - 6 10,063 .51 .77 .15 .44
7 -129 8,319 .52 .77 .15 .43
Selectivity of Law Schools
16 - 36 7,511 .50 .76 .15 .44
37 - 38 8,044 .52 .77 .15 .44
39 - 45 11,225 .50 .76 .14 .43
variable. In short, the variables for pairs of subscores that had Analytical Reasoning in common were appre-ciably related, but the other combinations of variables were minimally associated.
Significant differences. In the total sample, the significant difference variable for Analytical Reasoning vs.Reading Comprehension correlated .51 with the corresponding Analytical Reasoning vs. Logical Reasoningvariable and -.27 with the Reading Comprehension vs. Logical Reasoning variable, and the Analytical Rea-soning vs. Logical Reasoning variable correlated .13 with the Reading Comprehension vs. LogicalReasoning. Thus all the variables were minimally related, apart from an appreciable association for Analyti-cal Reasoning vs. Reading Comprehension with Analytical Reasoning vs. Logical Reasoning.
Significant and rare differences. In the total sample, the significant and rare difference variable for Analyti-cal Reasoning vs. Reading Comprehension correlated .38 with the corresponding Analytical Reasoning vs.Logical Reasoning variable and .17 with the Reading Comprehension vs. Logical Reasoning variable, andthe Analytical Reasoning vs. Logical Reasoning variable correlated .06 with the Reading Comprehension vs.Logical Reasoning variable. Hence, all the variables were minimally related, except for an appreciable associ-ation for Analytical Reasoning vs. Reading Comprehension with Analytical Reasoning vs. Logical Reasoning.
Reliability
Observed differences. The correlations between the observed difference variables for the correspondingpairs of half subscores in the total sample were .45 for Analytical Reasoning vs. Reading Comprehension, .46for Analytical Reasoning vs. Logical Reasoning, and .23 for Reading Comprehension vs. Logical Reasoning.Corrected for double length, the correlations were .62, .63, and .37, respectively. Hence, the reliability was ap-preciable for two of the three variables.
Significant differences. The correlations between the significant difference variables for the correspondingpairs of half subscores in the total sample were .26 for Analytical Reasoning vs. Reading Comprehension, .25
20

Table 10Analyses of Variance of Subgroup Differences in Significant and Rare Differences for All Pairs of LSAT Subscores
Source df
Significant Difference
MeanSquaxe F zl
Significant Difference
MeanSquare F 1
Between
Within
1
39,382
Sex
8.45 14.54**
.58
.02 1.99
.19
10.46** .02
Between
Within
2
39,506
Age
.07 .12
.58
.00 .36
.19
1.89 .01
Between
Within
7
39,349
Ethnicity
14.17 24.47**
.58
.07 2.62
.19
13.79** .05
Between
Within
1
37,695
English Language Dominance
2.95 5.08
.58
.01 .08
.19
.41 .00
Between
Within
1
37,017
English Fluency
3.29 5.65
.58
.01 .03
.19
.17 .00
Between
Within
2
39,527
LSAT Total Score
126.41 219.75**
.58
.10 .20.88
.19
108.96** .07
Between
Within
2
39,527
Number of LSATs Taken
1.72 2.96
.58
.01 .33
.19
1.74 .01
Between
Within
1
36,314
LSAT Preparation
.18 .31 .00
.58
.22
.19
1.16 .01
Between
Within
2
27,996
Number of Law School Applications
1.95 3.35 .02
.58
.24
.19
1.24 .01
Between
Within
2
26,777
Selectivity of Schools
1.13 1.94
.58
.01 .30
.19
1.58 .01
Note. An of .10 is a "small" effect (Cohen, 1988).**_2 <.01.
for Analytical Reasoning vs. Logical Reasoning, and .09 for Reading Comprehension vs. Logical Reasoning.The correlation between the number of significant differences for the corresponding pairs of half subscoreswas .17 for the total sample. Thus, the reliability was minimal for all the variables.
Significant and rare differences. The correlations between the significant and rare difference variables for thecorresponding pairs of half subscores in the total sample were .16 for Analytical Reasoning vs. Reading Compre-hension, .17 for Analytical Reasoning vs. Logical Reasoning, and .07 for Reading Comprehension vs. LogicalReasoning. The correlation between the number of significant and rare differences for the corresponding pairs ofhalf subscores was .13 in the total sample. In short, the reliability was minimal for all the variables.
Discussion
A central finding is that subscore differences on the LSAT, often very substantial ones, were frequent. Statisti-cally significant subscore differences were also very common, affecting about a third of the examinees.Substantively, this finding suggests that real differences exist in these examinees' performance on the LSATsubtests, reflecting variation in their development of the abilities tapped by the subtests. A similar phenome-non has been repeatedly observed in intelligence tests (Chatman, Reynolds, & Willson, 1984; Kaufman,1976a, 1976b; Matarazzo, Daniel, Prifitera, & Herman, 1988; Matarazzo & Herman, 1985; McLean, Kaufman,& Reynolds, 1989; Rosenthal & Kemphaus, 1988). For example, 37.8% of the standardization sample for theWAIS-R (1,880 late adolescents and adults) had a significant difference (.05 level, two-tail) of 10 IQ points be-tween their Verbal and Performance IQs (Matarazzo & Herman, 1985). The ubiquity of such discrepancieshas led to the suggestion that differences in how people manifest intelligence are the norm rather than theexception (Kaufman, 1990).
Statistically significant but rare differences were necessarily less common, but affected over a tenth of the ex-aminees. These differences have the greatest potential importance because of their infrequency, for theyrepresent real and highly unusual differences in examinees' patterns of abilities.
A related finding of some interest is that these trends in prevalence generally did not vary with theexaminees' sex, ethnicity, familiarity with the LSAT, or the number or selectivity of the law schools to whichthe examinees were applying. This absence of associations between subscore discrepancies and sex andethnicity is paralleled by generally similar findings for intelligence tests (Chatman et al., 1984; Kaufman,1976a, 1976b; Matarazzo, Bornstein, McDermott, & Noonan, 1986; Matarazzo et al., 1988; McLean et al.,1989).
The connections that emerged between subscore discrepancies and the LSAT total score and age primarily re-flected the deviantly poor performance on the Analytical Reasoning subtest by examinees who had highertotal scores on the test or were older.
The greater discrepancies for high scorers accords with the intelligence test research, which consistentlyfinds the highest incidence of subscore discrepancies for such examinees (Kaufman, 1976a, 1976b; Matarazzo& Herman, 1985; Matarazzo et al., 1988; Matarazzo & Prifitera, 1989; McLean et al., 1989). For instance, in theWAIS-R standardization sample, 47.5% of examinees with a full-scale IQ of 120 and above had a significantdifference of 10 points in their Verbal and Performance IQs, in contrast to 37.8% of the total sample(Matarazzo & Herman, 1985). This association has been interpreted as a manifestation of greater differenta-tion of abilities for the most intelligent individuals (Matarazzo et al., 1988).
The greater discrepancies for older examinees disagrees with the research on intelligence tests, which gener-ally finds no association between age and subscore differences (Chatman et al., 1984; Kaufman, 1976b;Matarazzo & Herman, 1985; Matarazzo et al., 1988; McLean et al., 1989). This inconsistency may be attribut-able to the self-selected character of the LSAT examinee population that produces systematic differences inthe backgrounds and experiences of older and younger test takers not found in the representative cross-sec-tions of the general population used in the intelligence test work. Follow-up research into the link between
22

20
age and performance on the Analytical Reasoning subtest might be informative, along the lines of previousstudies of gender and ethnic group differences in the validity of the test's items and scores (Wightman &Muller, 1990a, 1990b).
Subscore differences are an inevitable consequence when the subtest scores are not perfectly correlated(Cahan & Cohen, 1988; Matarazzo, 1972; Matarazzo & Herman; 1985). In fact, significant (and significantand rare) differences were most prevalent in this study for pairs of subscores that included Analytical Rea-soning, and this subtest had substantially lower correlations with the other subtests (E = .51 with ReadingComprehension and r = .59 with Logical Reasoning vs. r = .76 between Reading Comprehension and LogicalReasoning in the total sample). This same differentiation between the Analytical Reasoning subtest and theother subtests was also observed in a factor analytic study of the previous version of the LSAT (Camilli,Wang, & Fesq, 1992). Two factors were identified, one defined by Analytical Reasoning items, and the otherby Reading Comprehension and Logical Reasoning items.
Any operational use of these discrepancy variables hinges on their reliability. Two of the three observed dif-ference measures had appreciable reliability (Reading Comprehension vs. Logical Reasoning was anexception), about .6, similar to the reliability of observed difference measures for intelligence tests (Feingold,1984; McNemar, 1957). For example, on the WAIS-R, the average reliabilities were .81 for the difference be-tween Verbal and Performance IQs and .65 for the difference between subtest scores (Feingold, 1984).
But the reliability was minimal for all of the more important discrepancy measures for significant or signifi-cant and rare differences, even taking into account the lower-bound nature of these reliability estimates. Theunreliability of these measures clearly precludes their use in interpreting the test performance of individualexaminees. Parallel data are unavailable on the reliability of these measures for intelligence tests, but itseems highly likely that their reliability is equally low. Indeed, a study of a somewhat similar measure forthe WAIS-R (number of subtest scores significantly different from the examinee's mean subtest score) foundits reliability was only .28 (Matarazzo et al., 1988).
The minimal reliability of these two kinds of discrepancy measures may, of course, contribute to their sparseassociations with the subgroup variables. However, the much more reliable observed difference measureswere also generally unrelated to the subgroup variables, suggesting that this absence of differences in preva-lence within subgroups is an inherent feature of all these measures.
Although subscore discrepancies appear to have no viable role to play in interpreting examinees' LSAT per-formance, the distinct possibility remains that other approaches which capitalize on the test'smultidimensionality, such as using the subscores in prediction systems ( Camilli et al, 1992), may yet proveto be useful. The potential value of the LSATs multidimensionality merits serious attention.

r
References
Bo ldt, R. F. (1966). Predicting law school achievement with discrepant predictor scores (LSAC Research Report66-1). Princeton, NJ: Law School Admission Council.
Boldt, R. F. (1968). Extension of the discrepant predictor study-Final report (LSAC Research Report 68-1).Princeton, NJ: Law School Admission Council.
Cahan, S., & Cohen, N. (1988). Significance testing of subtest score differences: The case of nonsignificantresults. Journal of Psychoeducational Assessment, 6,107 -117.
Camilli, G., Wang, M-m., & Fesq, J. (1992). The effects of dimensionality on true score tables for the Law SchoolAdmission Test (LSAC Statistical Report 92-01). Newtown, PA: Law School Admission Services.
Chatman, S. P., Reynolds, C. R., & Willson, V. L. (1984). Multiple indexes of test scatter on the KaufmanAssessment Battery for Children. Journal of Learning Disabilities 12, 523-531.
Cohen, J. (1988). Statistical power analysis for the behavioral sciences (2nd ed.). Hillsdale, NJ: Erlbaum.
Conrad, D., Trisman, D., & Miller, R. (1977). Graduate Record Examinations technical manual. Princeton, NJ:Educational Testing Service.
Feingold, A. (1984). The reliability of score differences on the WAIS,
WISC-R, and WAIS-R. Journal of Clinical Psychology, 4.0 1060-1063.
Frank, G. (1983). The Wechsler enterprise. Oxford, England: Pergamon.
Hecht, L. W., & Schrader, W. B. (1986). Graduate Management Admission Test, technical report on testdevelopment and score interpretation for GMAT users. Princeton,. NJ: Graduate Management AdmissionCouncil.
Kaufman, A. S. (1976a). Anew approach to the interpretation of test scatter on the WISC-R. Journal of LearningDisabilities .9 33-41.
Kaufman, A. S. (1976b). Verbal-Performance IQ discrepancies on the WISC-R. Journal of Consulting and ClinicalPsychology, 44, 739-744.
Kaufman, A. S. (1979). Intelligent testing with the WISC-R. New York: Wiley.
Kaufman, A. S. (1990). Assessing_adolescent and adult intelligence. Boston: Allyn and Bacon.
Matarazzo, J. D. (1972). Wechsler's measurement and appraisal of adult intelligence (5th ed.). Baltimore, MD:Williams &
Matarazzo, J. D., Bornstein, R. A., McDermott, P. A., & Noonan, J. V. (1986). Verbal IQ vs. Performance IQdifference scores in males and females from the WAIS-R standardization sample. journal of ClinicalPsychology, 42, 965-974.
Matarazzo, J. D., Daniel, M. H., Prifitera, A., & Herman, D. 0. (1988). Inter-subtest scatter in the WAIS-Rstandardization sample. Journal of Clinical Psychology, 4A, 940-950.
Matarazzo, J. D., & Herman, D. 0. (1985). Clinical uses of the WAIS-R: Base rates of differences between VIQand PIQ in the WAIS-R standardization sample. In B. B. Wolman (Ed.), Handbook of intelligence (pp.899-932). New York: Wiley.
Matarazzo, J. D., & Prifitera, A. (1989). Subtest scatter and premorbid intelligence: Lessons for the WAIS-Rstandardization sample. Psychological Assessment A Journal of Consulting and Clinical Psychology, 1186-191.
24

McLean, J. E., Kaufman, A. S., & Reynolds, C. R. (1989). Base rates of WAIS-R subtest scatter as a guide forclinical and neuropsychological assessment. Journal of Clinical Psychology, 45, 919-926.
McNemar, Q. (1957). On WAIS difference scores. Journal of Consulting Psychology, 21, 239-240.
Rosenthal, B. L., & Kemphaus, R. W. (1988). Interpretive tables for test scatter on the Stanford-Binet IntelligenceScale: Fourth Edition. Journal of Psychoeducational Assessment, 6., 359-370.
Sattler, J. M. (1988). Assessment of children's intelligence and special abilities (3rd ed.). San Diego, CA: Author.
Thorndike, R. L., Hagen, E. P., & Sattler, J. M. (1986). The Stanford-Binet Intelligence Scale: Fourth Edition,technical manual. Chicago: Riverside.
Wechsler, D. (1974). Manual for the Wechsler Intelligence Scale for ChildrenRevised. New York: Psycholog-ical Corporation.
Wechsler, D. (1981). WAIS-R manual. Wechsler Adult Intelligence ScaleRevised. Cleveland, OH: Psycholog-ical Corporation.
Wightman, L. F., & Muller, D. G. (1990a). An analysis of differential validity and differential prediction for Black,Mexican American, Hispanic. and White law school students (LSAC Research Report 90-03). Newtown, PA:Law School Admission Services.
Wightman, L. F., & Muller, D. G. (1990b). Comparison of LSAT performance among selected subgroups (LSACResearch Report 90-01). Newtown, PA: Law School Admission Services.
Author Notes
Thanks are due to Edwin Whitehall for furnishing test development specifications, Manfred Steffen for pro-viding test analysis data, Kathleen B. McGeady and Linda F. Wightman for supplying LSAS test andbackground data for examinees, Lucient C. Chan for computer programming, and Isaac Bejar and Philip K.Oltman for reviewing a draft of this report.
Endnotes
1 "Any preparation" consisted of any of the following responses: Studying the same questions in the LawServices Information Book; taking the sample test in the Law Services Information Book; workingthrough The Official LSAT PrepTest(s), The Official LSAT PrepBook, or The Official LSAT PrepKit; using abook on how to prepare for the LSAT not published by Law Services; attending a commercial test prepara-tion or coaching course; attending a test preparation or coaching course offered through anundergraduate institution; self-study; and other preparation.
2 Data for this variable were only available for examinees applying to 20 or fewer law schools.
U.S. Department of EducationOffice of Educational Research and Improvement (OERI)
National Library of Education (NLE)
Educational Resources Information Center (ERIC)
NOTICE
Reproduction Basis
TM034434
ERIC
This document is covered by a signed "Reproduction Release(Blanket)" form (on file within the ERIC system), encompassing allor classes of documents from its source organization and, therefore,does not require a "Specific Document" Release form.
This document is Federally-funded, or carries its own permission toreproduce, or is otherwise in the public domain and, therefore, maybe reproduced by ERIC without a signed Reproduction Release form(either "Specific Document" or "Blanket").
EFF-089 (3/2000)