Reproductions supplied by EDRS are the best that can be ... Environment and Student Outcomes...
44
DOCUMENT RESUME ED 465 525 SE 066 132 AUTHOR Lightburn, Millard E.; Fraser, Barry J. TITLE Classroom Environment and Student Outcomes Associated with Using Anthropometry Activities in High School Science. PUB DATE 2002-04-00 NOTE 42p.; Paper presented at the Annual Meeting of the American Educational Research Association (New Orleans, LA, April 1-5, 2002). PUB TYPE Reports Research (143) -- Speeches/Meeting Papers (150) EDRS PRICE MF01/PCO2 Plus Postage. DESCRIPTORS *Academic Achievement; Biology; *Data Collection; *Data Interpretation; High Schools; Inquiry; Science Instruction; *Student Attitudes IDENTIFIERS *Anthropometric Tests; Learning Environments ABSTRACT The study involved implementing and evaluating activities that actively engage students in the process of gathering, processing and analyzing data derived from human body measurements, with students using their prior knowledge acquired in science, mathematics, and computer classes to interpret this information. In the classroom activities involving human body measurements, students used science process skills such as collecting data, organizing and interpreting data, measuring, observing, predicting, reasoning, and thinking. Students integrated concepts in science, mathematics, and statistics, using technological tools (graphing calculators, computers) to process information. The purpose of this research was to evaluate these student-centered activities in terms of performance assessment, student attitudes, and perceptions of science classroom environment. The study has the potential to help other science teachers to apply these ideas in their classrooms, and it contributes an interesting application of classroom environment assessments in the evaluation of educational innovations. (Contains 49 references.) (Author/MM) Reproductions supplied by EDRS are the best that can be made from the original document.
Transcript of Reproductions supplied by EDRS are the best that can be ... Environment and Student Outcomes...
DOCUMENT RESUME
ED 465 525 SE 066 132
AUTHOR Lightburn, Millard E.; Fraser, Barry J.TITLE Classroom Environment and Student Outcomes Associated with
Using Anthropometry Activities in High School Science.PUB DATE 2002-04-00NOTE 42p.; Paper presented at the Annual Meeting of the American
Educational Research Association (New Orleans, LA, April1-5, 2002).
PUB TYPE Reports Research (143) -- Speeches/Meeting Papers (150)EDRS PRICE MF01/PCO2 Plus Postage.DESCRIPTORS *Academic Achievement; Biology; *Data Collection; *Data
Interpretation; High Schools; Inquiry; Science Instruction;*Student Attitudes
IDENTIFIERS *Anthropometric Tests; Learning Environments
ABSTRACTThe study involved implementing and evaluating activities
that actively engage students in the process of gathering, processing andanalyzing data derived from human body measurements, with students usingtheir prior knowledge acquired in science, mathematics, and computer classesto interpret this information. In the classroom activities involving humanbody measurements, students used science process skills such as collectingdata, organizing and interpreting data, measuring, observing, predicting,reasoning, and thinking. Students integrated concepts in science,mathematics, and statistics, using technological tools (graphing calculators,computers) to process information. The purpose of this research was toevaluate these student-centered activities in terms of performanceassessment, student attitudes, and perceptions of science classroomenvironment. The study has the potential to help other science teachers toapply these ideas in their classrooms, and it contributes an interestingapplication of classroom environment assessments in the evaluation ofeducational innovations. (Contains 49 references.) (Author/MM)
Reproductions supplied by EDRS are the best that can be madefrom the original document.
CLASSROOM ENVIRONMENT AND STUDENT OUTCOMESASSOCIATED WITH USING ANTHROPOMETRY ACTIVITIES
IN HIGH SCHOOL SCIENCE
PERMISSION TO REPRODUCE ANDDISSEMINATE THIS MATERIAL HAS
BEEN GRANTED BY
1
TO THE EDUCATIONAL RESOURCESINFORMATION CENTER (ERIC)
Millard E. Lightburn and Barry J. FraserCurtin University of Technology, Australia
GPO Box 1987Perth, Western Australia
U.S. DEPARTMENT OF EDUCATIONOffice of Educational Research and Improvement
EDUCATIONAL RESOURCES INFORMATIONCENTER (ERIC)
rg, e n t has been reproduced asom the person or organization
originating it.
0 Minor changes have been made toimprove reproduction quality.
Points of view or opinions stated in thisdocument do not necessarily representofficial OERI position or policy.
BEST COPY AVAILABIE
Paper presented at the Annual Meeting of American EducationalResearch Association, New Orleans, April 2002
2
Classroom Environment and Student Outcomes Associated with Using AnthropometryActivities in High School Science
Millard E. Lightburn and Barry J. FraserCurtin University of Technology, Australia
1. Rationale and Introduction
The study involved implementing and evaluating activities that actively engage students in
the process of gathering, processing and analyzing data derived from human body
measurements, with students using their prior knowledge acquired in science, mathematics
and computer classes to interpret this information. In the classroom activities involving
human body measurements, students used science process skills such as collecting data,
organizing and interpreting data, measuring, observing, predicting, reasoning and thinking.
Students integrated concepts in science, mathematics and statistics, using technological tools
(graphing calculators, computers) to process the information. The purpose of this research
was to evaluate these student-centered activities in terms of performance assessment, student
attitudes and perceptions of science classroom environment. The study has the potential to
help other science teachers to apply these ideas in their classrooms, and it contributes an
interesting application of classroom environment assessments in the evaluation of educational
innovations.
Paper Presented at the Annual Meeting of the AERA,New Orleans, April 2002
3
2. Objectives
To validate generally applicable measures of classroom learning environments and
student attitudes to science.
To evaluate student-centered anthropometric activities in terms of:
(a) student performance as demonstrated by the ability to make accurate
measurements, to organize data in tables, charts and graphs, and to compute and
interpret basic descriptive statistics.
(b) student attitudes to science.
(c) student perceptions of their classroom learning environment.
To investigate associations between the classroom learning environment and the
student outcomes of performance and attitudes.
3. Background
Anthropometry
Anthropometry (from the Greek anthropos 'human' and metron 'measure') is the biological
science of measuring the size, weight and proportions of the human body (Farkas, 1994).
Anthropometry lends itself as an appropriate activity in the science classroom, because
concepts in science and mathematics can be integrated and technological tools can be used to
process data, and also to enhance and facilitate learning. It is important that students see
connections among other subjects, such as science, mathematics and technology. In Project
Paper Presented at the Annual Meeting of the AERA, 2
New Orleans, April 2002
2061, it is stated that science provides mathematics with interesting problems to investigate
and mathematics provides science with powerful tools to use in analyzing data (American
Association for the Advancement of Science, 1990). In the present study, students were
trained to make anthropometric measurements during student-centered activities in which
they had the opportunity to apply prior and new knowledge to gather, process and analyze
data generated from the research.
Mosenthal and Kirsch (1994) stated that, before 1860, the belief was that each person's body
was unique. They described that the outbreak of the Civil War produced a sudden demand for
uniforms in great quantities. Using inches as a standard metric, the army discovered that
certain body measurements tended to recur in combination with predictable regularity. This
simple discovery made it possible to manufacture well-fitting clothes for a large population.
Such discoveries and practices gave rise to 'Anthropometry' or the measurement of the
individual with a view of discovering those patterns of physical and mental characteristics,
which recur among people differing in such dimensions as age, gender, and economic status.
Other researchers have successfully used anthropometric activities in the elementary, middle
school and high school settings (Greeley & Reardon, 1997; Knill 1991, 1995; Neufeld, 1989;
Pagni, 1979; Shaw, 1984).
Neufeld (1989) caffied out measurements and calculations of human body measurements
with students from grades 4 to 9 as well as with prospective teachers and teachers attending
inservice courses. Calculations of body surface as well as volume and density were made.
Neufeld states that students' measurements of their own bodies can enhance the teaching of
Paper Presented at the Annual Meeting of the AERA, 3
New Orleans, April 20025
measurement, and he considers that this activity should be based on concrete, pictorial, and
abstract modes of instruction.
Greeley and Reardon (1997) provide an excellent activity relating geometry to physical
therapy. It refers to measuring angles of different joints in the student body in order to
determine the range of motion. The data were entered and processed on a graphing calculator
(TI-82). They give a step-by-step procedure stating how to input the data in the graphing
calculator. This activity was field tested with fifth graders and middle school mathematics
classes.
Shaw (1984) describes various activities that provide practice in measuring skills, estimating
and computing area and volume of the human body. One of the activities, 'Primary Metric
Me', is geared to Grades 1-3 and the other activity, 'Upper Grades Metric Me', is focused on
Grades 4-8.
knill (1995) also provides an excellent activity involving mathematics in forensic science.
This activity uses algebraic equations and graphing exercises as a means of interpreting
forensic anthropometric data. It is very appropriate for the high school level. Knill (1981)
states that, when a skeleton is found, a forensic scientist uses the length of certain bones to
calculate the height of the living person. The bones that are used are femur (F), tibia (T),
humerus (H), and radius (R).
Pagni (1979) describes activities using human variability. In one of the activities, he used
discrete variables to describe, classify, and count genetic traits. In the other activity, he used
measurable human characteristics that can be represented as continuous variables.
Paper Presented at the Annual Meeting of the AERA, 4
New Orleans, April 2002 6
These anthropomevic activities described in this literature review as well as those activities
described in the present study, are the type of practical applications that are likely to get
students interested in science and mathematics.
In the present study, students made anthropometric measurements during activities requiring
the application of prior and new knowledge to gather, process and analyze data. A sample of
information gathered by the students is given in Appendix A. This information was used to
compile central tendency statistics (mean, mode, median), standard deviation and regression
equation (see Appendix A).
Learning Environments and Attitudes to Science
Although the instructional activities provided good-quality performance measures of student
achievement, the affective domain (attitudes and classroom environment perceptions) should
not be left out when evaluating educational innovations.
A strong history of research on classroom learning environments (Fraser, 1991, 1998) has
established several trends relevant to our study. First, several widely applicable and carefully
validated questionnaires for assessing student perceptions of classroom environments formed
the starting point for the development of a learning environment questionnaire for use in the
present study. Second, this study followed previous research (Maor & Fraser, 1996; Teh &
Fraser, 1994) in which educational innovations have been evaluated in part in terms of their
impact in transforming the classroom learning environment. Third, the proposed study also
Paper Presented at the Annual Meeting of the AERA, 5
New Orleans, April 20027
followed past research, which has explored associations between the nature of the classroom
learning environment and students' achievement and attitudes (Mc Robbie 84 Fraser, 1993).
For the purposes of our study, we adapted attitude scales from the Test of Science-Related
Attitudes (TOSRA) (Fraser, 1981) and from the scales developed by Doepken, Lawsky
Padwa (1993).
Fraser (1998) conducted an extensive 30 year meta-analysis (1960s to 1990s) of the literature
related to the determinants and effects of the social and psychological aspects of the learning
environments of classrooms and schools. He made a comparative analysis of 9 classroom
environment instruments, one of which is the Science Laboratory Inventory (SLEI). A
modified version of SLEI was used in the present study, to determine student perception of
the classroom learning environment.
Lewin (1936) and Murray (1938) were probable the first to point out that human behavior is a
function of the interaction between the individual and its environment. This concept may
have served as foundation for the development of the first learning environment scales.
Walberg's Learning Environment Inventory (LEI) (Walberg and Anderson, 1968) and Moos'
Classroom Environment Scale (CES) (Moos 1974, 1979; Moos & Trickett, 1987) were some
of the earliest learning environment scales. Since the pioneering works of Walberg and Moos,
research on classroom learning environment has grown extensively (Fraser, 1998). However,
it wasn't until the early 1990s that researchers felt that there was a need to develop special
learning environment scale to assess the unique psychosocial aspects of the science
laboratory. Fraser, McRobbie and Giddings (1993), developed one of the first survey
Paper Presented at the Annual Meeting of the AERA, 6 8New Orleans, April 2002
instruments to assess the learning environment of science laboratory classes at the high
school level (Science Laboratory Inventory (SLEI)). SLEI was later refined in 1995 (Fraser,
Giddings & Mc Robbie, 1995; Fraser & Mc Robbie, 1995). The SLEI was field tested and
validated simultaneously with a sample of over 5400 students in 269 classes in six different
countries (USA, Canada, England, Israel, Australia and Nigeria) and cross-validated with
1594 Australian students in 92 classes (Fraser & Mc Robbie, 1995), 489 senior high school
biology students in Australia (Fisher, Henderson & Fraser, 1997) and 1592 high school
chemistry students in Singapore (Wong & Fraser, 1995).
4. Research Methods
Sample Selection
One hundred fifty-eight students participated in the anthropometric study. Twenty-four of
these students (11 girls and 13 boys) were selected for the qualitative component of the
research involving interviews. The target students selected to participate in the interview are
all honors student in the researcher's biology classes. These students were selected because
they are more involved in classroom interactions and they are high achievers. Other sources
of information used to assess student achievement were based on a Biology pretest and
Paper Presented at the Annual Meeting of the AERA, 7
New Orleans. April 2002 9
posttest administered to 558 students, and the final report card in Biology for the school year
2000-2001 collected from 662 students.
For the quantitative portion of the study involving the validation of questionnaires and
investigating associations between environment and student attitudes, a larger sample
covering 761 students in 25 classes was used.
The use of different sized samples (grain sizes) for different research questions in learning
environment research (Fraser 1999) has been used in mixed-method research (Lee, 2001;
Aldridge & Fraser, 2000; Tobin & Fraser, 1998), and was used in the collection of
quantitative and qualitative data in this study.
The study was conducted at a suburban public high school in the southeastern part of the
United States. This school serves a diverse community, both culturally and socio-
economically. It has a population of approximately 3,200 students, with the following
demographic characteristics: 55% White, 23.4% Hispanics, 16.5 % African-American and
5% Asian/others. The study involved Grade 9 and 10 biology students.
Data Sources
We used both quantitative and qualitative methods to generate answers for the same research
problem as recommended by Tobin and Fraser (1998). Within the quantitative approach
(questionnaire surveys), the study was conceptualized in terms of variables and relationships
Paper Presented at the Annual Meeting of the AERA. 8
New Orleans, April 2002 1 0
between them, while the qualitative approach (interviews) provided a way of finding out the
subjects' views (Erickson, 1998).
Several authors and researchers in the field of science education are increasingly
recommending combining quantitative and qualitative methods in the same study (Anderson
& Arsenault, 1998; Erickson, 1998; Houtz 1995; Fraser & Tobin 1991; Lee 2001; Punch,
1998; Tobin & Fraser, 1998). Fraser and Tobin (1991) point out the merits of combining
qualitative and quantitative methods in learning environments research by drawing on three
cases of successful attempts at using questionnaire surveys and ethnographic methods
together within the same investigation.
Our data collection included achievement, attitudes toward science, and perceptions of
classroom learning environment. For the anthropometric portion of the study, an instructional
laboratory activity guide was developed, given to all students in the researcher's classroom,
and used to determine student ability to make linear and circumference measurements of the
human body, to organize data in tables, charts and graphs, and to analyze and interpret the
data by use of descriptive statistics and develop predictive linear regression equations.
The survey instrument that measured student attitudes towards science was based on selected
items from the Modified Fennema-Sherman Science Attitude Scales (Doepken, Lawsky, &
Padwa, 1993) and Test of Science-Related Attitudes (TOSRA) (Fraser, 1981). This
instrument consisted of four scales (Personal Confidence about Science, Usefulness of the
Subject Matter, Perception of Teacher's Attitudes, and Attitude to Scientific Inquiry). Each
scale consists of six items for a total of 24 questions. Each item is based on a five-point
Paper Presented at the Annual Meeting of the AERA.New Orleans, April 2002
Likert scale with the alternatives of strongly agree, agree, not sure or can't answer, disagree
and strongly disagree.
Student perceptions of classroom learning environment were measured with a modified
instrument based on the Science Laboratory Environment Inventory (SLEI) (Fraser,
Giddings, & Mc Robbie, 1995; Fraser, Mc Robbie, & Giddings, 1993). This survey
instrument also consisted of four scales (Student Cohesiveness, Integration, Rule Clarity and
Material Environment), with six items for each scale for a total of 24 questions. Each item
was also based on a five-point response scale with the alternatives of almost never, seldom,
sometimes, often and very often.
Pretests and posttests were administered before and after the instructional activities took-
place to determine if improvement in knowledge and understanding had occurred. During the
implementation of the anthropometric activity, students' performance was assessed in order
to determine if they mastered the concepts.
Data Analysis and Interpretation
Data from the modified measures of classroom environment and attitudes were subjected to
factor and item analyses. Refined scales were validated in terms of factor structure, internal
consistency reliability and ability to differentiate between classrooms. For SLEI, we were
unable to obtain factor structure analysis for our sample.
Paper Presented at the Annual Meeting of the AERA, 10
New Orleans, April 2002 12
Students' achievement assessment for the anthropometric activity was based on how well
they processed data using graphing calculators, graphing software and electronic
spreadsheets. Students also applied concepts learned in their mathematics classes such as
graphing skills, identifying dependent and independent variables, median, mode, mean and
standard deviation.
Another way of evaluating student academic performance on the anthropometric activities
was to measure changes in achievement on a pretest and posttest. The pretest was done at the
beginning of May 2001 and the posttest at the end of May 2001.
Simple correlation and multiple regession analyses were used to explore associations
between achievement (Anthropometric posttest, Biology Posttest and Biology Final Report
Card Grade) and the dimensions of SLEI, using two units of analyses: the individual
(perception scores of individual students) and the class mean (average of scores of all
students within a class).
Associations between students' perceptions of their classroom environment and student
attitudes were investigated by use of simple correlation and multiple regression analysis using
two units of analyses. The simple correlation (r) describes the bivariate association between
an attitudinal outcome and a SLEI scale. The standardized regression weight (A characterizes
the association between an attitudinal outcome and a particular learning environment scale
when all other SLEI scales are mutually controlled.
In order to identify the individual classroom environment scale, which contributes most to the
variance in student attitudes, standardized regression coefficients (6) were computed.
Paper Presented at the Annual Meeting of the AERA, I I 3New Orleans, April 2002
The qualitative data were collected primarily through written interviews and when warranted,
oral interviews were conducted. The purposes of the interviews were twofold. First, the
researchers wanted to expand and gain clarification on some of the responses given on the
attitude and environment surveys (quantitative portion of the study). Second, we wanted to
assess how students viewed the anthropometric activities.
5. Findings
5.1 Validity and Reliability of Environment and Attitude Questionnaires
As mentioned previously, one of the goals of the research was to validate the adapted
versions of the Science Learning Environment Inventory (SLEI) survey and the Modified
Fennema-Sherman Attitude Scales survey that were used in this research. Item analyses and
factor analyses were used to validate and refine the survey instruments. Some original items
were removed because their factor loading were lower than 0.40.
5.1.1 Validity and Reliability of SLEI (Science Laboratory Environment Inventory)
In the present research, a modified version of SLEI was used. The version used in this study
consisted of four scales (Integration, Rule Clarity, Student Cohesiveness, and Material
Environment), containing six items in each scale. Although the original version of SLEI has
been extensively cross validated, it was deemed necessary to conduct validation studies for
the modified version with the present sample of 761 students.
Paper Presented at the Annual Meeting of the AERA. 12
New Orleans. April 2002
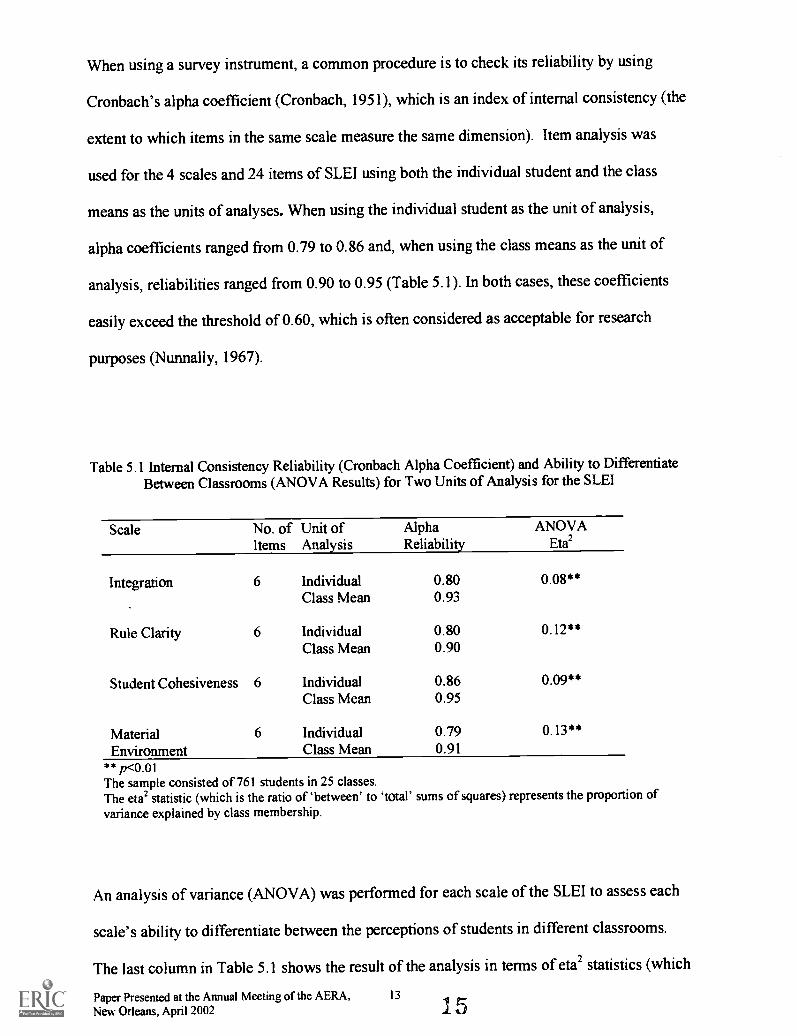
When using a survey instrument, a common procedure is to check its reliability by using
Cronbach's alpha coefficient (Cronbach, 1951), which is an index of internal consistency (the
extent to which items in the same scale measure the same dimension). Item analysis was
used for the 4 scales and 24 items of SLEI using both the individual student and the class
means as the units of analyses. When using the individual student as the unit of analysis,
alpha coefficients ranged from 0.79 to 0.86 and, when using the class means as the unit of
analysis, reliabilities ranged from 0.90 to 0.95 (Table 5.1). In both cases, these coefficients
easily exceed the threshold of 0.60, which is often considered as acceptable for research
purposes (Nunnally, 1967).
Table 5.1 Internal Consistency Reliability (Cronbach Alpha Coefficient) and Ability to DifferentiateBetween Classrooms (ANOVA Results) for Two Units of Analysis for the SLEI
Scale No. of Unit ofItems Analysis
AlphaReliability
ANOVAEta2
Integration 6 Individual 0.80 0.08**Class Mean 0.93
Rule Clarity 6 Individual 0.80 0.12**Class Mean 0.90
Student Cohesiveness 6 Individual 0.86 0.09**Class Mean 0.95
Material 6 Individual 0.79 0.13**
Environment Class Mean 0.91
** p<0.01The sample consisted of 761 students in 25 classes.The eta' statistic (which is the ratio of 'between' to 'total' sums of squares) represents the proportion ofvariance explained by class membership.
An analysis of variance (ANOVA) was performed for each scale of the SLEI to assess each
scale's ability to differentiate between the perceptions of students in different classrooms.
The last column in Table 5.1 shows the result of the analysis in terms of eta2 statistics (which
Paper Presented at the Annual Meeting of the AERA, 13
New Orleans, April 2002 1
is the ratio of 'between' to 'total' sums of squares and represents the proportion of variance
explained by class membership). The value of the eta2 was statistically significant (p<0.0l )
for each scale and ranged from 0.08 to 0.13 for different scales, suggesting that each scale of
the SLEI was able to differentiate between the perceptions of students in different classes.
Although other authors have reported strong support for factor analysis of SLEI ((Lee, 2001;
Fraser, McRobbie & Giddings, 1993), we were unable to replicate this structure with the
present sample.
5.1.2 Validity and Reliability of the Modified Fennema-Sherman Attitude Scale
When the attitude instrument was subjected to item and factor analyses, three items from the
scale Perception of Teachers Attitudes were found to have a factor loading lower than 0.40
with its own scale (namely, Items 3, 7, and 11). It was decided to omit items 3 and 11 in all
subsequent analyses, but to retain Item 7.
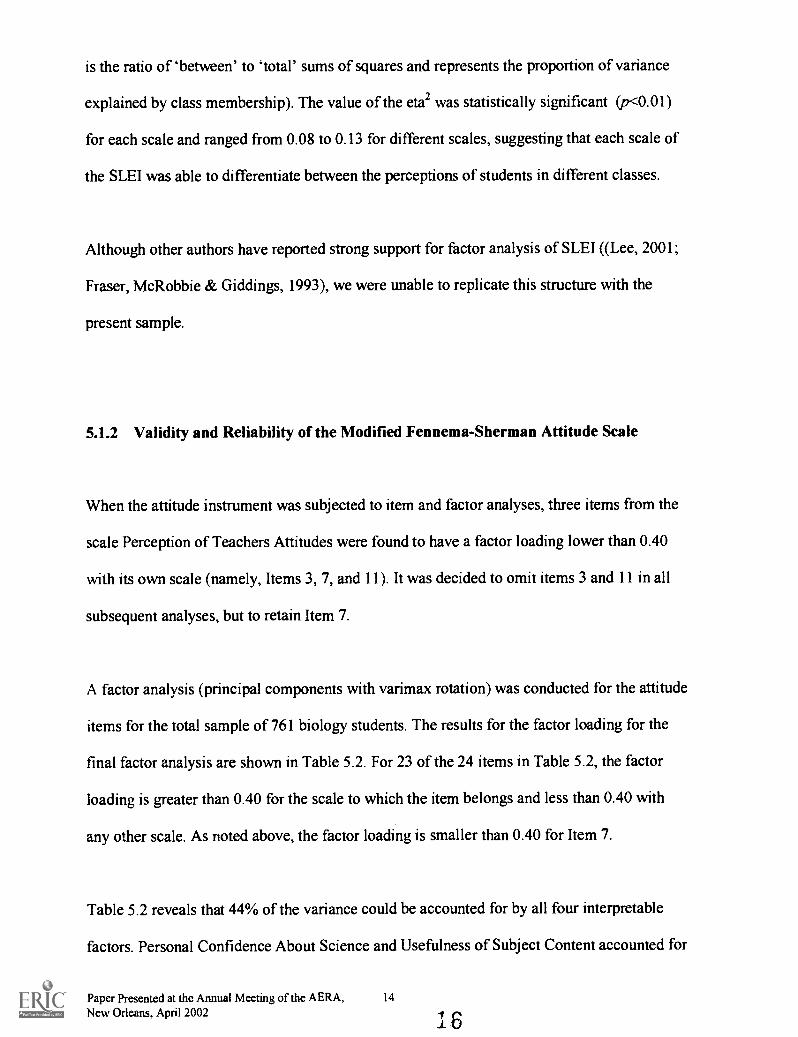
A factor analysis (principal components with varimax rotation) was conducted for the attitude
items for the total sample of 761 biology students. The results for the factor loading for the
final factor analysis are shown in Table 5.2. For 23 of the 24 items in Table 5.2, the factor
loading is greater than 0.40 for the scale to which the item belongs and less than 0.40 with
any other scale. As noted above, the factor loading is smaller than 0.40 for Item 7.
Table 5.2 reveals that 44% of the variance could be accounted for by all four interpretable
factors. Personal Confidence About Science and Usefulness of Subject Content accounted for
Paper Presented at the Annual Meeting of the AERA, 14
New Orleans, April 20026
11.44% and 13.13% of the variance, respectively, while Perception of Teachers' Attitudes
and Attitudes to Scientific Inquiry accounted for 9.40% and 9.91% of the variance
respectively. Overall, the analyses reported in Table 5.2 provide strong support for the
factorial validity of the attitude questionnaire.
Table 5.2: Factor Loadings for the Science Attitude Scales (Fennema-Sherman Scale)
Factor Loading
Item PersonalNo Confidence
aboutScience
Usefulness ofSubjectContent
Perception ofTeachers'Attitudes
Attitudes to ScientificInquiry
1
5
913
17
21
0.600.650.670.520.640.45
2 0.646 0.6310 0.5814 0.5018 0.75
0.677
15 0.6419 0.70
0.524 0.718 0.6012 0.6016 0.41
20 0.5524 0.59
% Variance 11.44 13.13 9.40 9.91Factor loadings smaller than 0.40 have been omitted from this analysis.The sample consisted of 761 students.
Paper Presented at the Annual Meeting of the AERA,New Orleans. April 2002
15 .0
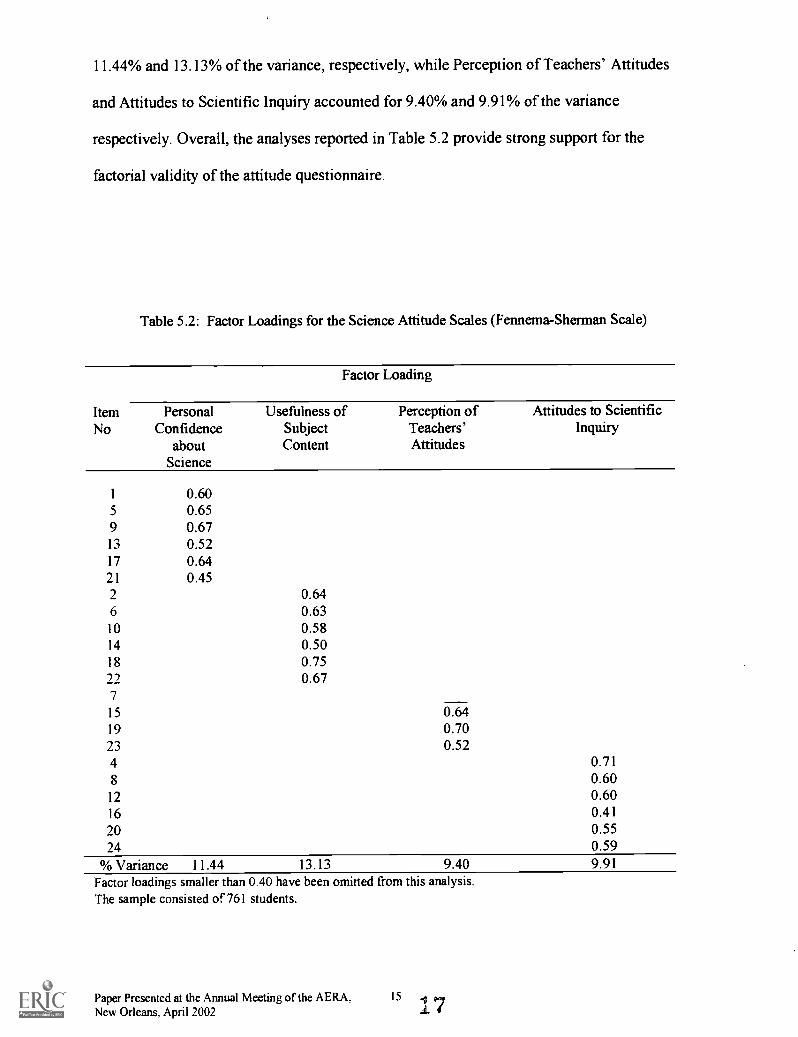
Item analysis was used for the 4 scales and 22 items of Attitude Scale using both the
individual student and the class as the units of analyses. When using the individual student as
the unit of analysis, alpha reliability coefficients ranged from 0.67 to 0.83 and, when using
the class means as the unit of analysis, the coefficient ranged from 0.74 to 0.93 (Table 5.3).
These coefficients exceed the value of 0.60, which is considered as acceptable for research
purposes (Nunnally, 1967). However, these values are somewhat lower than those obtained
for SLEI.
The discriminant validity (mean correlation of a scale with other scales) ranged from 0.26 to
0.42 when using individual student as the unit of analysis and from 0.55 to 0.77 when using
class mean as the unit of analysis (Table 5.3). This suggests that raw scores on each scale
assess a unique, although somewhat overlapping, dimension. However, the factor analysis
results attest to the independence of factor scores.
Table 5.3 Internal Consistency Reliability (Cronbach Alpha Coefficient) and DiscriminantValidity (Mean Correlation With Other Scales) for Two Units of Analysis for theScience Attitude Scales
Scale No. of Unit of Alpha Mean Correlation withItems Analysis Reliability other Scales
Personal Confidence 6 Individual 0.81 0.42about Science Class Mean 0.87 0.77
Usefulness of Subject 6 Individual 0.83 0.42Content Class Mean 0.93 0.62
Perception of Teachers 4 Individual 0.67 0.38Attitudes Class Mean 0.93 0.73
Attitudes to Scientific 6 Individual 0.76 0.26Inquiry Class Mean 0.74 0.55
** p<0.01 The sample consisted of 761 students in 25 classes
Paper Presented at the Annual Meeting of the AERA, 16
New Orleans, April 2002 1 8
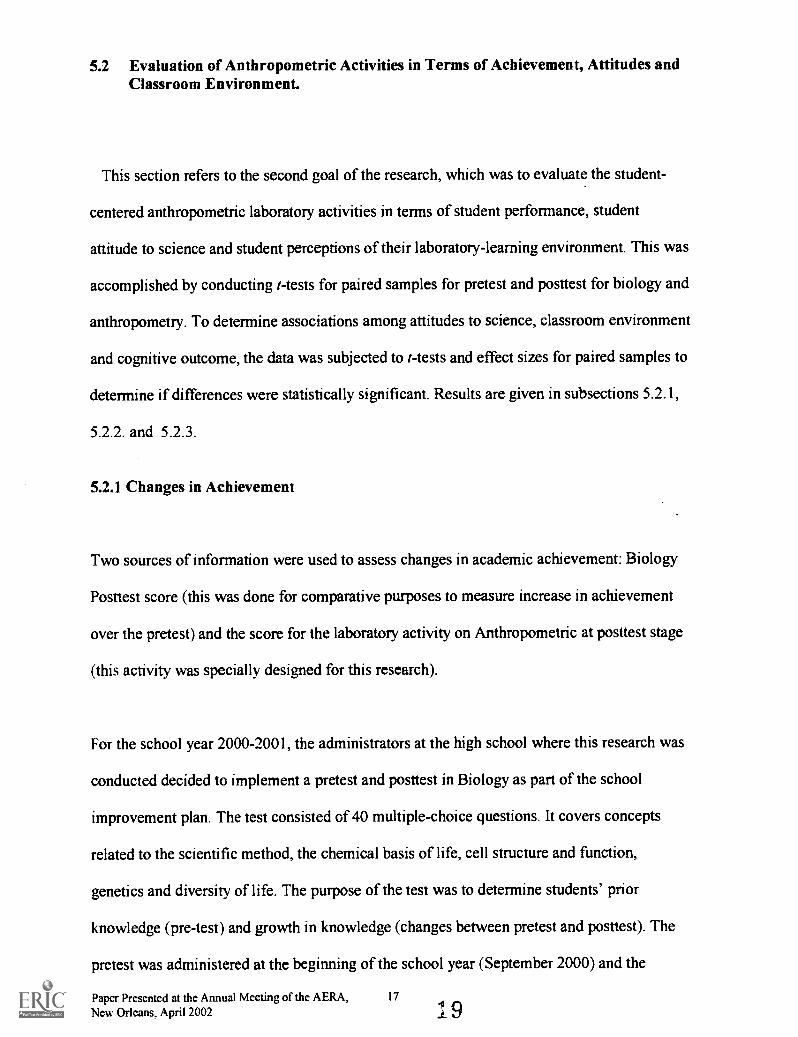
5.2 Evaluation of Anthropometric Activities in Terms of Achievement, Attitudes andClassroom Environment.
This section refers to the second goal of the research, which was to evaluate the student-
centered anthropometric laboratory activities in terms of student performance, student
attitude to science and student perceptions of their laboratory-learning environment. This was
accomplished by conducting t-tests for paired samples for pretest and posttest for biology and
anthropometry. To determine associations among attitudes to science, classroom environment
and cognitive outcome, the data was subjected to t-tests and effect sizes for paired samples to
determine if differences were statistically significant. Results are given in subsections 5.2.1,
5.2.2. and 5.2.3.
5.2.1 Changes in Achievement
Two sources of information were used to assess changes in academic achievement: Biology
Posttest score (this was done for comparative purposes to measure increase in achievement
over the pretest) and the score for the laboratory activity on Anthropometric at posttest stage
(this activity was specially designed for this research).
For the school year 2000-2001, the administrators at the high school where this research was
conducted decided to implement a pretest and posttest in Biology as part of the school
improvement plan. The test consisted of 40 multiple-choice questions. It covers concepts
related to the scientific method, the chemical basis of life, cell structure and function,
genetics and diversity of life. The purpose of the test was to determine students' prior
knowledge (pre-test) and growth in knowledge (changes between pretest and posttest). The
pretest was administered at the beginning of the school year (September 2000) and the
Paper Presented at the Annual Meeting of the AERA, 17
New Orleans, April 2002
posttest was administered at the end of the school year (May 2001). Five hundred and ninety
eight (598) students took this test both as a pretest and posttest
The anthropometric laboratory is based on an activity in which student had to measure the
length of different bones of their body, then collect information from the rest of the class,
organize the data in charts and graphs and then use graphing calculators to determine
statistical correlation between different variables and compute predictive regression
equations. A sample of the type of information gathered by the students is given in Appendix
A. This information was used to compile central tendency statistics (mean, mode, median),
standard deviation and regression equation (see Appendix A). The pretest was done at the
beginning of May 2001 and the posttest at the end of May 2001. The laboratory activity was
carried out during the month of May. One hundred and fifty-eight (158) students participated
in the anthropometric activity and tests.
Another method of evaluating student academic performance on the anthropometric activities
and Biology test was to measure changes in achievement on a pretest and posttest. Table 5.4
reports average item mean, average item standard deviation and t tests for paired samples for
differences between pretest and posttest scores in anthropometric and Biology achievement
using the individual as unit of analysis.
Paper Presented at the Annual Meeting of the AERA,New Orleans, April 2002
18
2 0
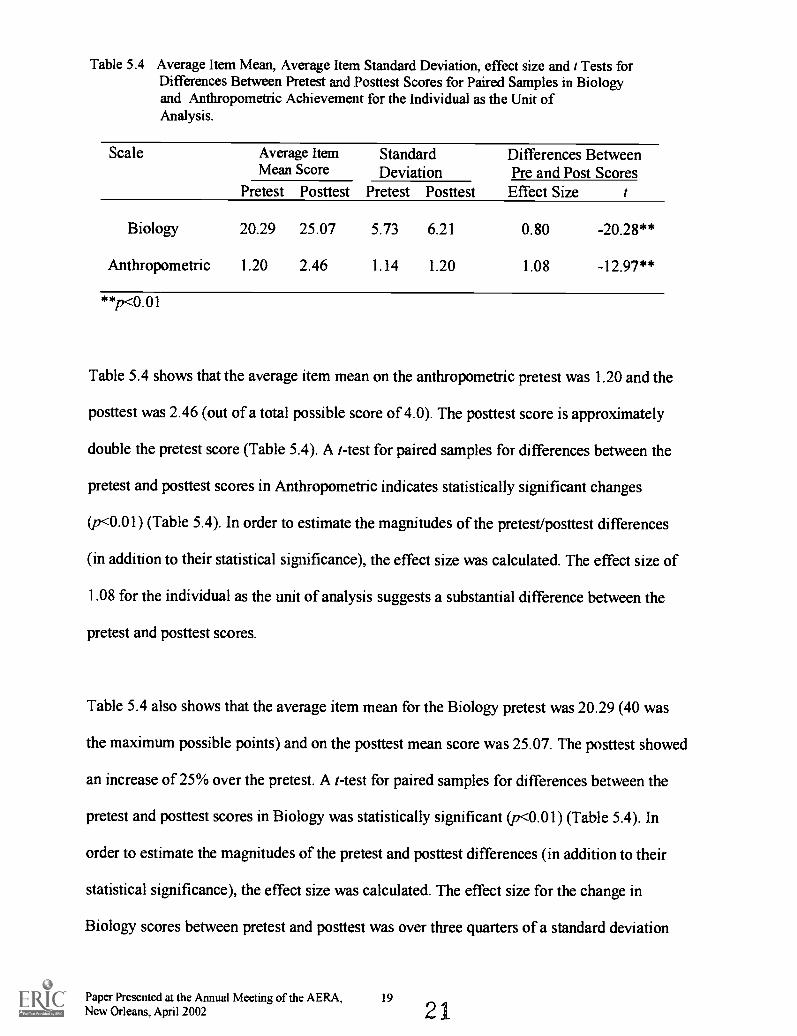
Table 5.4 Average Item Mean, Average Item Standard Deviation, effect size and t Tests forDifferences Between Pretest and Posttest Scores for Paired Samples in Biologyand Anthropometric Achievement for the Individual as the Unit ofAnalysis.
Scale Average Item Standard Differences BetweenMean Score Deviation Pre and Post Scores
Pretest Posttest Pretest Posttest Effect Size t
Biology 20.29 25.07 5.73 6.21 0.80 -20.28**
Anthropometric 1.20 2.46 1.14 1.20 1.08 -12.97**
**p<0.01
Table 5.4 shows that the average item mean on the anthropometric pretest was 1.20 and the
posttest was 2.46 (out of a total possible score of 4.0). The posttest score is approximately
double the pretest score (Table 5.4). A t-test for paired samples for differences between the
pretest and posttest scores in Anthropometric indicates statistically significant changes
(p<0.01) (Table 5.4). In order to estimate the magnitudes of the pretest/posttest differences
(in addition to their statistical significance), the effect size was calculated. The effect size of
1.08 for the individual as the unit of analysis suggests a substantial difference between the
pretest and posttest scores.
Table 5.4 also shows that the average item mean for the Biology pretest was 20.29 (40 was
the maximum possible points) and on the posttest mean score was 25.07. The posttest showed
an increase of 25% over the pretest. A t-test for paired samples for differences between the
pretest and posttest scores in Biology was statistically significant (p<0.01) (Table 5.4). In
order to estimate the magnitudes of the pretest and posttest differences (in addition to their
statistical significance), the effect size was calculated. The effect size for the change in
Biology scores between pretest and posttest was over three quarters of a standard deviation
Paper Presented at the Annual Meeting of the AERA,New Orleans, April 2002
19
21
(0.80) for the individual as the unit of analysis, which suggests a substantial difference
between the pretest and posttest scores.
5.2.2 Achievement Measures and Attitude
Gender related differences between achievement measures and attitude were analyzed.
Three sources of information were used to determine gender differences in academic
achievement. The sources of achievement were: Final Report Card grade in Biology (this
refers to student final coursework grade in Biology), Biology Posttest score (this was done
for comparative purposes to measure increase in achievement over the pretest), and the score
for the laboratory activity `Anthropometric' at the posttest stage (this was specially designed
for this research).
At the end of the 2000-2001 school year we collected data on student final grade in Biology,
which was used as another measure of achievement. It refers to student performance grades
on the mandate curricular content taught by all science teachers during the school year. Data
was collected from 662 students. The letter grade scale is A = 4 points (90-100 %), B = 3
points (80-89 %), C = 2 points (70-79 %), D = 1 point (60-69 %) and F = 0 points (0-59 %).
Gender-related differences were explored for the attitude scale, and achievement measures by
the use of multivariate analysis of variance (MANOVA) for repeated measures, with gender
as the independent variable and the other variables as dependent variables. Because the
multivariate test yielded a statistically significant result using Wilks' lamba criterion, a t test
Paper Presented at the Annual Meeting of the AERA, 20New Orleans, April 2002
22
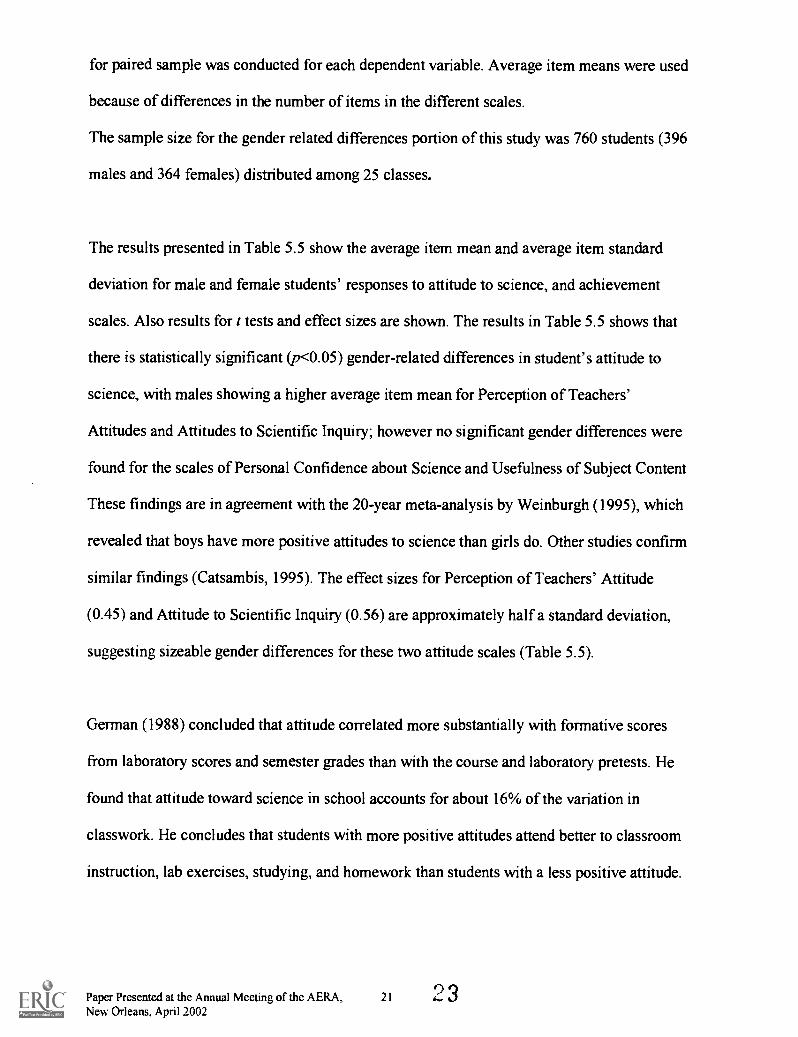
for paired sample was conducted for each dependent variable. Average item means were used
because of differences in the number of items in the different scales.
The sample size for the gender related differences portion of this study was 760 students (396
males and 364 females) distributed among 25 classes.
The results presented in Table 5.5 show the average item mean and average item standard
deviation for male and female students' responses to attitude to science, and achievement
scales. Also results for t tests and effect sizes are shown. The results in Table 5.5 shows that
there is statistically significant (p<0.05) gender-related differences in student's attitude to
science, with males showing a higher average item mean for Perception of Teachers'
Attitudes and Attitudes to Scientific Inquiry; however no significant gender differences were
found for the scales of Personal Confidence about Science and Usefulness of Subject Content
These findings are in agreement with the 20-year meta-analysis by Weinburgh (1995), which
revealed that boys have more positive attitudes to science than girls do. Other studies confirm
similar findings (Catsambis, 1995). The effect sizes for Perception of Teachers' Attitude
(0.45) and Attitude to Scientific Inquiry (0.56) are approximately half a standard deviation,
suggesting sizeable gender differences for these two attitude scales (Table 5.5).
German (1988) concluded that attitude correlated more substantially with formative scores
from laboratory scores and semester grades than with the course and laboratory pretests. He
found that attitude toward science in school accounts for about 16% of the variation in
classwork. He concludes that students with more positive attitudes attend better to classroom
instruction, lab exercises, studying, and homework than students with a less positive attitude.
Paper Presented at the Annual Meeting of the AERA,New Orleans, April 2002
21 23
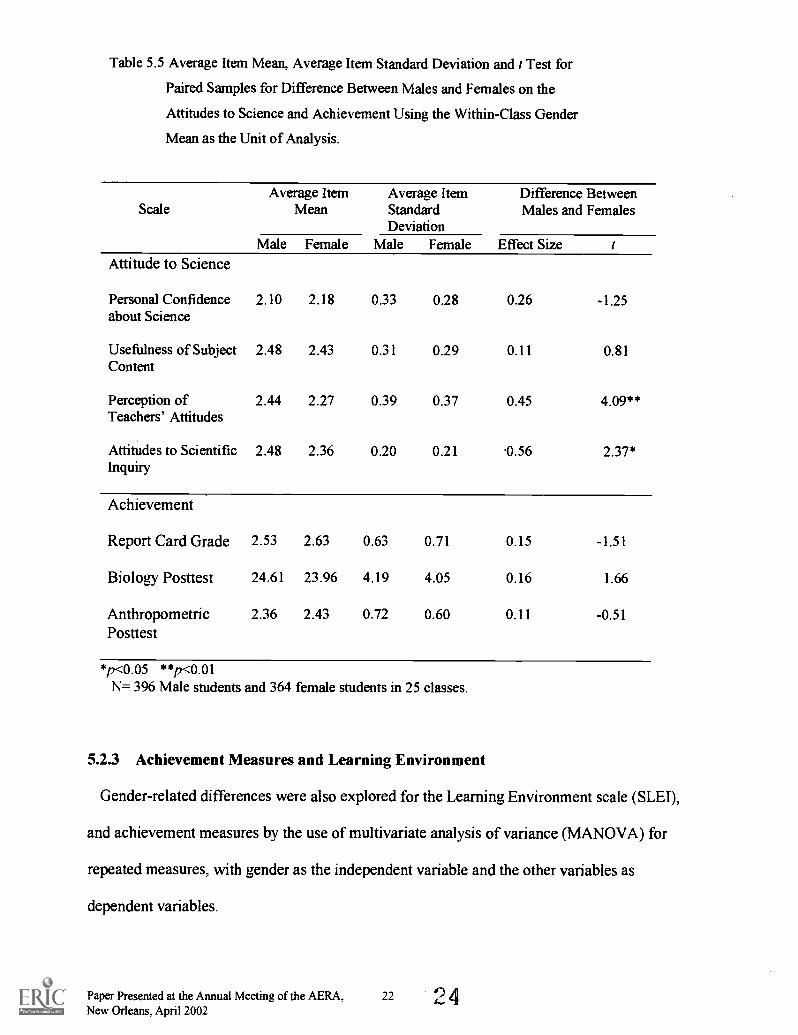
Table 5.5 Average Item Mean, Average Item Standard Deviation and t Test for
Paired Samples for Difference Between Males and Females on the
Attitudes to Science and Achievement Using the Within-Class Gender
Mean as the Unit of Analysis.
ScaleAverage Item
MeanAverage ItemStandardDeviation
Difference BetweenMales and Females
Male Female Male Female Effect SizeAttitude to Science
Personal Confidenceabout Science
2.10 2.18 0.33 0.28 0.26 -1.25
Usefulness of Subject 2.48 2.43 0.31 0.29 0.11 0.81Content
Perception of 2.44 2.27 0.39 0.37 0.45 409**Teachers' Attitudes
Attitudes to Scientific 2.48 2.36 0.20 0.21 .0.56 2.37*Inquiry
Achievement
Report Card Grade 2.53 2.63 0.63 0.71 0.15 -1.51
Biology Posttest 24.61 23.96 4.19 4.05 0.16 1.66
Anthropometric 2.36 2.43 0.72 0.60 0.11 -0.51Posttest
*p<0.05 **p<0.01N= 396 Male students and 364 female students in 25 classes.
5.2.3 Achievement Measures and Learning Environment
Gender-related differences were also explored for the Learning Environment scale (SLEI),
and achievement measures by the use of multivariate analysis of variance (MANOVA) for
repeated measures, with gender as the independent variable and the other variables as
dependent variables.
Paper Presented at the Annual Meeting of the AERA, 22New Orleans, April 2002
24
Table 5.6 reveals statistically significant (p <0.05) gender-related differences in students'
perceptions of their learning environment, with females showing a higher average item mean
for Rule Clarity and Student Cohesiveness. No statistically significant gender differences
were found for the scales Integration and Material Environment. These findings in part
support the results of others studies which reveal that females generally hold more favorable
perceptions of their classroom environment than do males in the same classes (Henderson,
Fisher, & Fraser, 1998; Fraser, Giddings, & McRobbie, 1995). The effect sizes for Rule
Clarity (0.30) and Student Cohesiveness (0.40) are approximately one third of a standard
deviation for within-class gender means, which confirms the gender differences for these two
classrooms environmental scales are of a reasonable magnitude.
No statistically significant differences were found between male and females students in their
achievement scores on any of the three measures. These results are different from those
obtained by Zerega, Haertel, Tsai and Walberg (1986). When they analyzed data from the
1976 National Assessment of Educational Progress (NAEP) using a sample size of 3049 17-
year old high school students, males scored higher on science achievement and motivation,
and perceived their classroom environments more positively than did females. They
concluded that science was still viewed as a male domain, that it is very important to be
accepted by peers in high school, and that, because girls are not supposed to be good in
science according to the stereotype, they confirm what peers expect. The results of our study
could possibly suggest that, in the 2000s at my school, female students do not consider
Biology to be so much of a male domain anymore. Perhaps this could be reinforced by the
fact that females also showed no statistically significant difference from their male
counterparts in scores on two main attitudes to science scales, namely, Personal Confidence
about Science and Usefulness of Subject Content.
Paper Presented at the Annual Meeting of the AERA, 23 3New Orleans, April 2002
Arambula (1995) investigated gender participation patterns in State-level science
competitions over approximately 35 years of competition in Hawaii. The examination of
topic preferences over the years indicates that both boys and girls have traditionally favored
life science; however, boys have been and continue to be more likely to prefer physical, earth
and mathematics/computer science projects than girls. This clearly suggests that different
type of high school sciences could lead to differences in gender preferences and possibly
differences in cognitive outcomes.
5.3 Associations Between Students' Outcome and their Classroom Environment
Perceptions
Another goal of this research was to investigate the associations between students' outcome
and their perception of the learning environment. The association between attitude and
student perception of the learning environment will be discussed in section 5.3.1 and the
association between achievement and learning environment will be discussed in section 5.3.2.
5.3.1 Association Between Perception of Classroom Environment and Attitude
Associations between students' perceptions of their classroom environment and student
attitude were investigated by use of simple correlation and multiple regression analyses using
two units of analysis (Table 5.7). The simple correlation (r) describes the bivariate
association between an attitudinal outcome and a SLEI scale. The standardized regression
weight (fl) characterizes the association between an attitudinal outcome and a particular
Paper Presented at the Annual Meeting of the AERA, 24New Orleans. April 2002
4.(*).. 6
learning environment scale when all other SLEI scales are mutually controlled. The sample
size used for this analysis was 761 students in 25 classes.
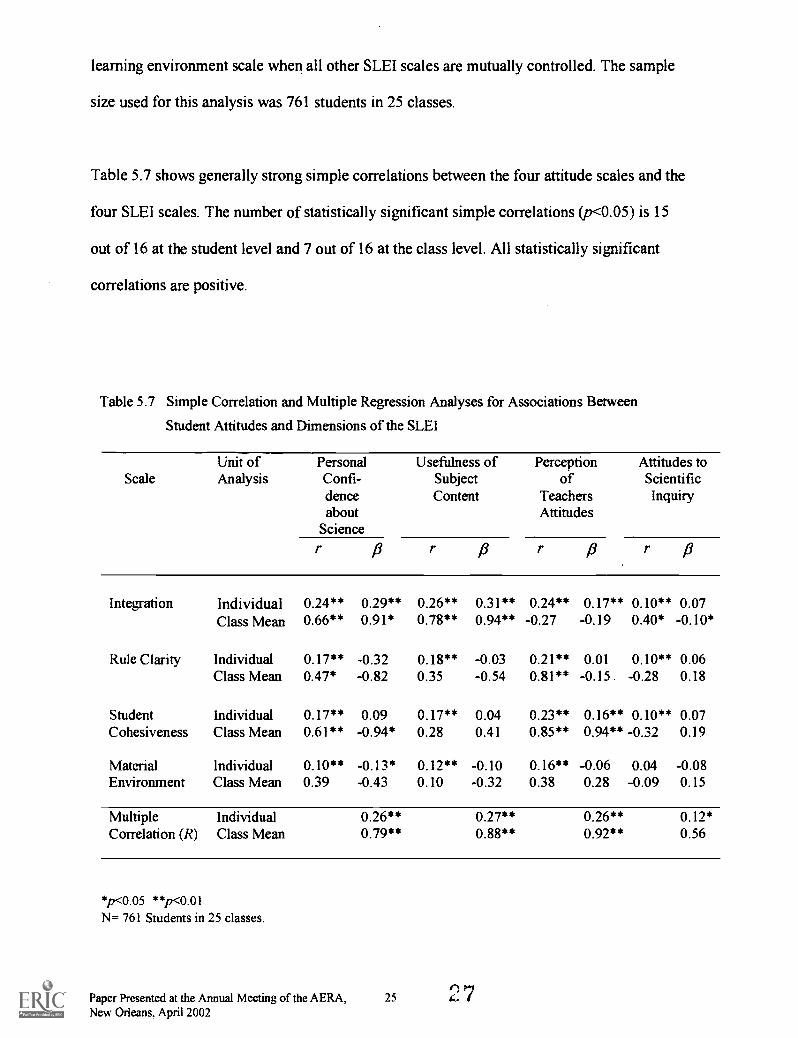
Table 5.7 shows generally strong simple correlations between the four attitude scales and the
four SLEI scales. The number of statistically significant simple correlations (p<0.05) is 15
out of 16 at the student level and 7 out of 16 at the class level. All statistically significant
correlations are positive.
Table 5.7 Simple Correlation and Multiple Regression Analyses for Associations Between
Student Attitudes and Dimensions of the SLEI
ScaleUnit of Personal Usefulness of Perception Attitudes toAnalysis Confi- Subject of Scientific
dence Content Teachers Inquiryabout Attitudes
Sciencer fi r P r 13 r /3
Integration Individual 0.24** 0.29** 0.26** 0.31** 0.24** 0.17** 0.10** 0.07Class Mean 0.66** 0.91* 0.78** 0.94** -0.27 -0.19 0.40* -0.10*
Rule Clarity Individual 0.17** -0.32 0.18** -0.03 0.21** 0.01 0.10** 0.06Class Mean 0.47* -0.82 0.35 -0.54 0.81** -0.15 -0.28 0.18
Student Individual 0.17** 0.09 0.17** 0.04 0.23** 0.16** 0.10** 0.07Cohesiveness Class Mean 0.61** -0.94* 0.28 0.41 0.85** 0.94** -0.32 0.19
Material Individual 0.10** -0.13* 0.12** -0.10 0.16** -0.06 0.04 -0.08Environment Class Mean 0.39 -0.43 0.10 -0.32 0.38 0.28 -0.09 0.15
Multiple Individual 0.26** 0.27** 0.26** 0.12*Correlation (R) Class Mean 0.79** 0.88** 0.92** 0.56
*p<0.05 **p<0.01N= 761 Students in 25 classes.
Paper Presented at the Annual Meeting of the AERA, 25New Orleans, April 2002
The bottom of Table 5.7 shows the multiple correlation (R) between each attitude scale and
the SLEI of four Learning Environment scales. Multiple correlations for different attitudes
scales range from 0.12 to 0.27 and all were statistically significant with the student as the unit
of analysis. With the class as the unit of analysis, the multiple correlation ranges from 0.56 to
0.92 and is statistically significant for all attitude scales except Attitudes to Inquiry.
In order to identify the individual classroom environment scale, which contributes most to the
variance in student attitudes, standardized regression coefficients /3 were examined (Table
5.7).
When using the individual as the unit of analysis, the/3 values in Table 5.7 indicate that
Integration is a significant independent predictor of all attitudinal scales except for Attitudes
to Scientific Inquiry. Student Cohesiveness is a significant independent predictor of only one
attitude scale, namely, Perception of Teachers Attitudes. Material environment is a significant
independent predictor of Personal Confidence about Science; however the beta value is
negative, which indicate an inverse relationship. Rule Clarity is not a significant independent
predictor of any attitudinal scale.
When using the class as the unit of analysis, Integration is a significant independent predictor
of all attitudinal scales, except for Perception of Teachers Attitudes. Student Cohesiveness is
a significant independent predictor of Personal Confidence and Perception of Teachers
Attitudes. Rule Clarity and Material Environment are not significant independent predictors
of any of the attitudinal scales.
Paper Presented at the Annual Meeting of the AERA, 26New Orleans, April 2002
These results indicate that students' attitudes to science are most likely to be positive in
laboratory classes where student perceive a strong integration between the concepts and
principles covered in theory classes and in laboratory classes. These findings are consistent
with results in other countries (Lee, 2001; Mc Robbie & Fraser, 1993).
5.3.2 Associations Between Achievement and Learning Environment (SLED
As shown in table 5.8, simple correlation and multiple regression analyses were used to
explore associations between achievement (Final Biology Report Card Grade, Biology
Posttest and anthropometric posttest) and the dimensions of SLEI, using two units of
analysis: the individual (perception scores of individual students) and the class mean (average
of scores of all students within a class).
Biology report card scores were recorded for 662 students in 25 classes. A total of 598
students in 25 classes took the biology posttest and 158 students in 6 classes participated in
the anthropometric activity. For anthropometric, the sample size (N=6) was too small to
generate dependable statistics for class means.
When using the individual student as the unit of analysis for the Final Report Grade in
Biology, simple correlations were statistically significant (p<0.05) for the two SLEI scales of
Integration and Student Cohesiveness (Table 5.8). Talton and Simpson (1987) reported
similar results. They found that 56% to 61% of the variance in attitude toward science could
be accounted for by students' attitude toward the classroom environment; 8% to 18% of the
variance in achievement was accounted for by both attitude toward classroom environment
Paper Presented at the Annual Meeting of the AERA, 27New Orleans, April 2002 9
and attitude toward science; and 5% to 14% of the variance in student achievement was
predicted by the students' attitude toward the classroom environment alone.
The simple correlation (r) values for the Biology posttest score showed a strong statistically
significant (p<0.05) correlation with each of the four SLEI scales (Table 5.8); however, there
is a stronger statistical correlation (p<0.01) at the individual level.
The simple correlation (r) values in Table 5.8 show that the final report card grade in Biology
is statistically significantly correlated (p<0.05) with two classroom environment scales,
Integration and Student Cohesiveness at the student level and none at the class level of
analysis.
The only statistically significant simple correlation (r) (p<0.05) for the anthropometric
activity was with Material Environment. This is understandable; because this activity was
purely a laboratory activity designed and implemented for this study and not part of the
regular curriculum activities. Only 158 students distributed among 6 classes took the
anthropometric posttest. This number was probable too small to generate dependable
statistics (Table 5.8).
30Paper Presented at the Annual Meeting of the AERA, 28New Orleans, April 2002
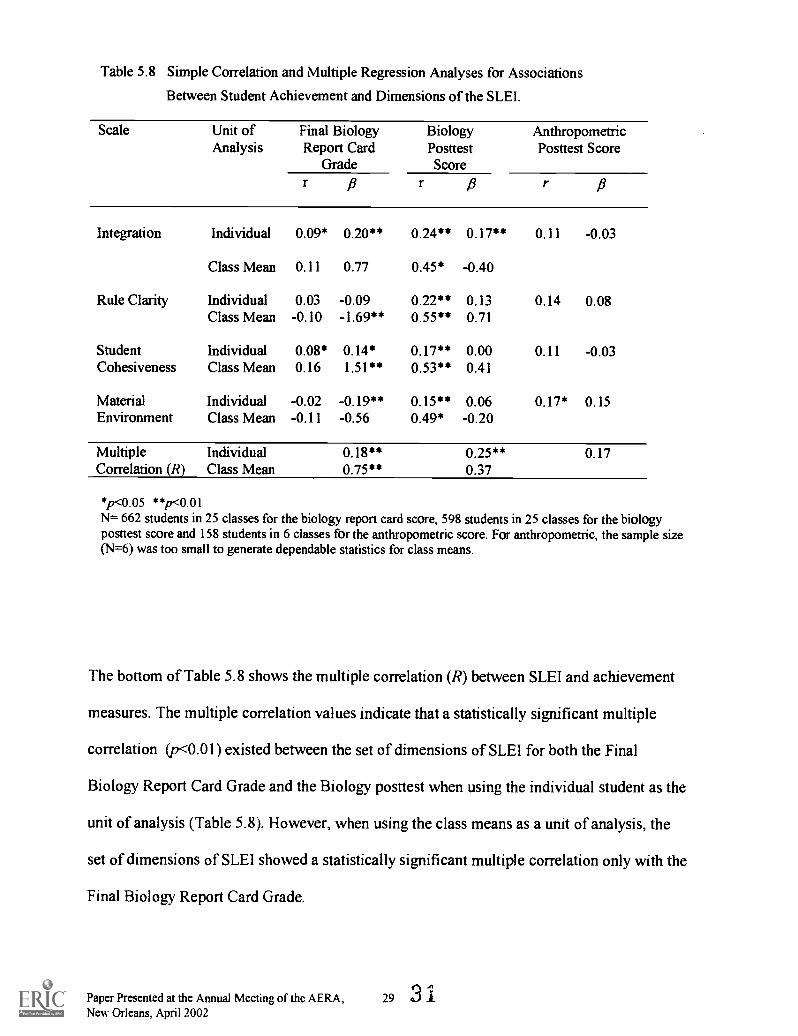
Table 5.8 Simple Correlation and Multiple Regression Analyses for Associations
Between Student Achievement and Dimensions of the SLEI.
Scale Unit ofAnalysis
Final BiologyReport Card
Grade
BiologyPosttestScore
AnthropometricPosttest Score
r /3 r /3 r 13
Integration Individual 0.09* 0.20** 0.24** 0.17** 0.11 -0.03
Class Mean 0.11 0.77 0.45* -0.40
Rule Clarity Individual 0.03 -0.09 0.22** 0.13 0.14 0.08Class Mean -0.10 -1.69** 0.55** 0.71
Student Individual 0.08* 0.14* 0.17** 0.00 0.11 -0.03Cohesiveness Class Mean 0.16 1.51** 0.53** 0.41
Material Individual -0.02 -0.19** 0.15** 0.06 0.17* 0.15Environment Class Mean -0.11 -0.56 0.49* -0.20
Multiple Individual 0.18** 0.25** 0.17Correlation (R) Class Mean 0.75** 0.37
*p<0.05 **p<001N= 662 students in 25 classes for the biology report card score, 598 students in 25 classes for the biologyposttest score and 158 students in 6 classes for the anthropometric score. For anthropometric, the sample size(N=6) was too small to generate dependable statistics for class means.
The bottom of Table 5.8 shows the multiple correlation (R) between SLEI and achievement
measures. The multiple correlation values indicate that a statistically significant multiple
correlation (p<0.01) existed between the set of dimensions of SLE1 for both the Final
Biology Report Card Grade and the Biology posttest when using the individual student as the
unit of analysis (Table 5.8). However, when using the class means as a unit of analysis, the
set of dimensions of SLEI showed a statistically significant multiple correlation only with the
Final Biology Report Card Grade.
Paper Presented at the Annual Meeting of the AERA,New Orleans, April 2002
29 li
No significant multiple correlation was found between the set of SLEI scales and the scores
on the anthropometric posttest. This could be partly due to the small number of students who
participated in the activity (158 students) and responded to the posttest (Table 5.8).
In order to identify the individual classroom environment scales, which contribute to the
variance in student achievement, standardized regression coefficient fi were examined (Table
5.8). The standardized regression coefficient fin Table 5.8 indicate that Integration, Rule
Clarity, Student Cohesiveness and Material Environment were significant independent
predictors of the Final Biology Report Card grade for both units of analyses.
Integration is the only significantly independent predictor of the Biology posttest score (Table
5.8) when using the individual as the unit of analysis. No significant independent predictors
were found for the anthropometric post test score.
These results suggest that integration of theoretical concepts with laboratory activities
(Integration), using cooperative learning groups (Student Cohesiveness), and using
appropriate laboratory materials and equipment, (Material Environment) are likely to lead to
positive achievement outcomes at the end of the school year.
We found stronger outcome-environment associations for attitudes than for achievement.
This finding is consistent with results from past research (Fraser, Giddings & McRobbie,
1995). Talton and Simpson (1986) reported similar findings. They found that classroom
environment possessed the strongest relationship with attitude toward science. They suggest
that, by increasing teacher awareness to the important role that classroom environment might
Paper Presented at the Annual Meeting of the AERA,New Orleans, April 2002 3° 3 2
play in the formation of student attitudes toward science, it could be possible to substantially
increase student interest and achievement in science.
5.4 Student Perception on the Anthropometric Activity
One of the objectives of the second aim of this research was to obtain student perceptions of
the anthropometric laboratory activity. Student feedback forms the basis for the qualitative
part of the study. The qualitative data were collected mostly through written interviews and
orally, only when clarification was warranted.
The purposes of the interviews were twofold. First, we wanted to expand and gain
clarification on some of the responses given on the attitude questionnaire and environment
survey (quantitative portion of the study). Second, we wanted to assess how students viewed
the anthropometric activities.
A group of 24 students (11 girls and 13 boys) was selected to participate in the interviews.
These target students are all honors student in the researcher's biology classes. These students
were selected because they are more involved in classroom interactions, they are high
achievers and they seem to have no problem in providing honest responses.
The findings of the qualitative portion of the study reveal that both boys and girls believe that
the anthropometric activity was a good learning activity. However it was considered too time-
consuming. They also agreed that the activity integrated science and mathematics skills and
that they learned how to use the graphing calculator to develop regression equations. They
Paper Presented at the Annual Meeting of the AERA, 31
New Orleans, April 2002 3 3
also indicated that cooperative learning activities are important, but sometimes members of
the group don't get along. Both boys and girls agreed that Chemistry, Physics, Advanced
Placement Biology and Advanced Placement Chemistry are the courses, which they would
like to take in the next two to three years in high school.
Students were asked what were the positive perceptions and negative perceptions of
cooperative learning groups. Some of the responses were as follows.
You get to share information and get input from one another and discuss your thoughts and answers;
however, if your partner doesn't work, then you're stuck doing it yourself"
"Fun and you get to compare answers. However, sometimes you don't get your work done because
you are constantly talking with the people in your group."
"Fun; you could work together if you are unsure about your answer, however you could get distracted
easily."
The interviews shed important light in term of improving the understanding of the
quantitative part of the research. Students felt that closed-ended laboratory activities do not
promote scientific inquiry. On the other hand, the students felt that laboratory activities were
excellent ways of integrating concepts learned in science classes and also of promoting
cooperative group work
Paper Presented at the Annual Meeting of the AERA,New Orleans, April 2002
32 3 4
6. Conclusion
A major educational goal is that all students should achieve scientific literacy. The central
function of the National Science Education Standards (National Academy of Science, 1996)
was to spell out a vision of science education that would make scientific literacy for all a
reality in the 21st century. Two of the six major areas of science teaching standards are the
planning of inquiry-based science programs and the development of environments that enable
students to learn science. The learning goals of this anthropometric activity reflect the vision
promoted in the National Standards in Science Education, and the activities are appropriate
for the intended student population. Hopefully this study will provide insights that other
science teachers can apply in their classrooms.
Factor and item analyses supported the factorial validity and internal consistency reliability of
the classroom environment questionnaire and the attitude questionnaire. Past research (Fraser,
1994) was replicated in that statistically significant associations were found between student
attitudes and classroom environment.
Sizeable effect sizes and statistical significance were found for the pretest-posttest scores on
the achievement measures.
Students demonstrated ability to make accurate anthropometric measurements and were able
to process the statistical data using graphing calculators and electronic spreadsheet.
Students considered the anthropometric activity a good learning activity but it should be
probable broken down into various activities.
Paper Presented at the Annual Meeting of the AERA, 33 35New Orleans, April 2002
Overall the findings based on quantitative information were consistent with patterns
emerging from our qualitative information, and they supported the effectiveness of the
anthropometric activities.
The results of this study indicate that students' attitudes to science are most likely to be
positive in laboratory classes where student perceive a strong integration between the
concepts and principles covered in theory classes and in laboratory classes. Positive attitude
would more likely be displayed when students work in cooperative learning groups
(Cohesiveness) and they perceived that their behavior in the laboratory is guided by formal
rules (Rule Clarity).
A unique feature of this research is that it has an evaluation component involving student
performance, student attitudes, and the nature of the classroom learning environment.
Therefore, the study contributes to the field of learning environments research by adding
another study to the limited research that has employed the classroom environment as a
criterion of effectiveness in evaluating educational innovations (e.g., Teh & Fraser, 1994).
Paper Presented at the Annual Meeting of the AERA, 34New Orleans, April 2002 3 1-;
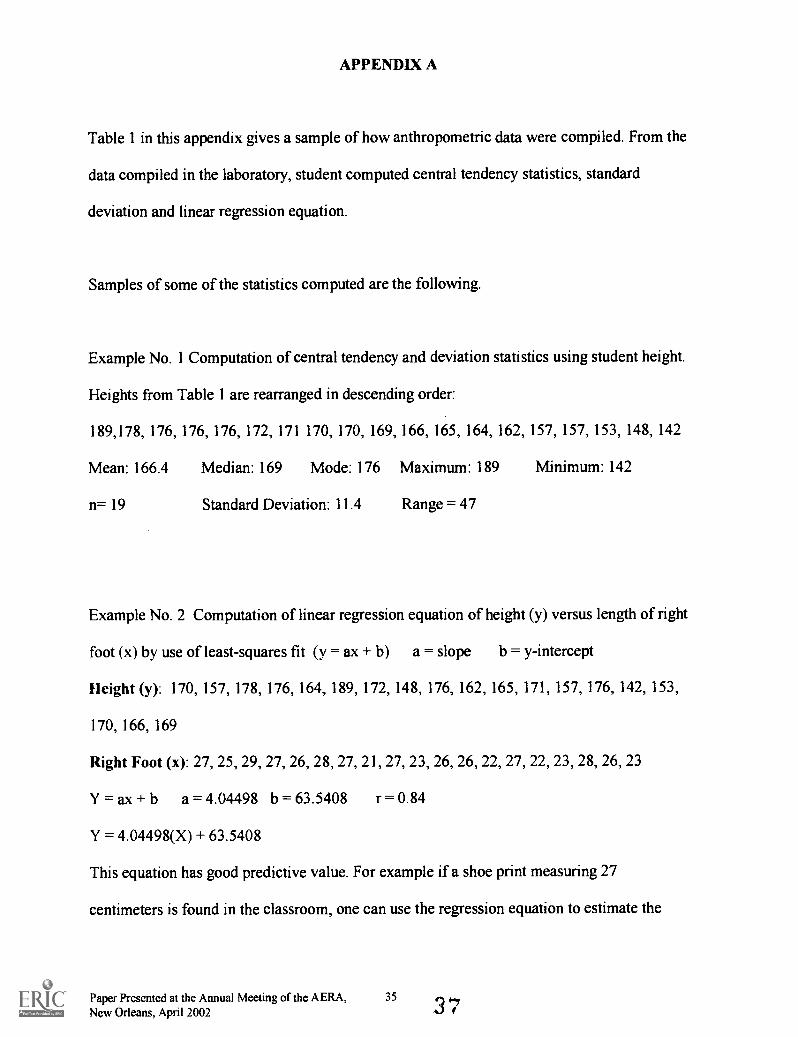
APPENDIX A
Table 1 in this appendix gives a sample of how anthropometric data were compiled. From the
data compiled in the laboratory, student computed central tendency statistics, standard
deviation and linear regression equation.
Samples of some of the statistics computed are the following.
Example No. 1 Computation of central tendency and deviation statistics using student height.
Heights from Table 1 are rearranged in descending order:
189,178, 176, 176, 176, 172, 171 170, 170, 169, 166, 165, 164, 162, 157, 157, 153, 148, 142
Mean: 166.4 Median: 169 Mode: 176 Maximum: 189 Minimum: 142
n= 19 Standard Deviation: 11.4 Range = 47
Example No. 2 Computation of linear regression equation of height (y) versus length of right
foot (x) by use of least-squares fit (y = ax + b) a = slope b = y-intercept
Height (y): 170, 157, 178, 176, 164, 189, 172, 148, 176, 162, 165, 171, 157, 176, 142, 153,
170, 166, 169
Right Foot (x): 27, 25, 29, 27, 26, 28, 27, 21, 27, 23, 26, 26, 22, 27, 22, 23, 28, 26, 23
Y = ax + b a = 4.04498 b = 63.5408 r = 0.84
Y = 4.04498(X) + 63.5408
This equation has good predictive value. For example if a shoe print measuring 27
centimeters is found in the classroom, one can use the regression equation to estimate the
Paper Presented at the Annual Meeting of the AERA, 35
New Orleans, April 2002
student height. (Y= 4.04498 (27) + 63.5408 = 172.76 cm (5'6") would be an estimate of the
person's height).
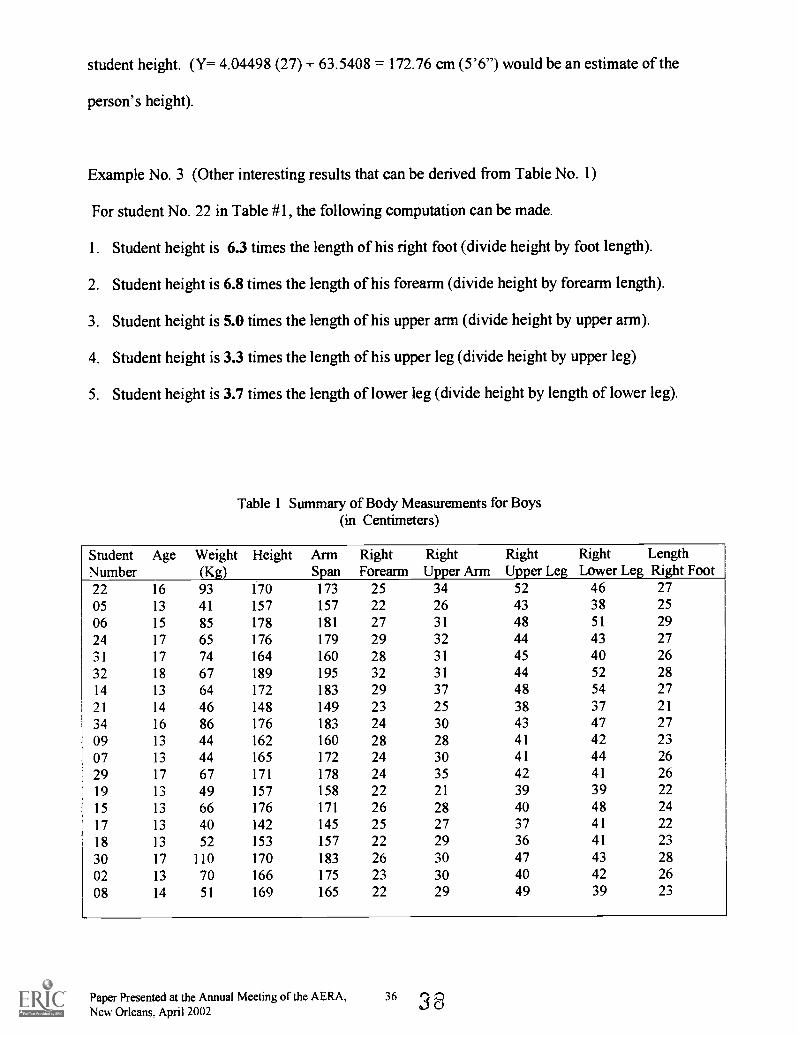
Example No. 3 (Other interesting results that can be derived from Table No. 1)
For student No. 22 in Table #1, the following computation can be made.
1. Student height is 6.3 times the length of his right foot (divide height by foot length).
2. Student height is 6.8 times the length of his forearm (divide height by forearm length).
3. Student height is 5.0 times the length of his upper arm (divide height by upper arm).
4. Student height is 3.3 times the length of his upper leg (divide height by upper leg)
5. Student height is 3.7 times the length of lower leg (divide height by length of lower leg).
Table 1 Summary of Body Measurements for Boys(in Centimeters)
StudentNumber
Age Weight(Kg)
Height ArmSpan
RightForearm
RightUpper Arm
Right Right LengthUpper Leg Lower Leg Right Foot
22 16 93 170 173 25 34 52 46 2705 13 41 157 157 22 26 43 38 25
06 15 85 178 181 27 31 48 51 2924 17 65 176 179 29 32 44 43 2731 17 74 164 160 28 31 45 40 2632 18 67 189 195 32 31 44 52 2814 13 64 172 183 29 37 48 54 2721 14 46 148 149 23 25 38 37 21
34 16 86 176 183 24 30 43 47 2709 13 44 162 160 28 28 41 42 2307 13 44 165 172 24 30 41 44 2629 17 67 171 178 24 35 42 41 2619 13 49 157 158 22 21 39 39 22
15 13 66 176 171 26 28 40 48 2417 13 40 142 145 25 27 37 41 2218 13 52 153 157 22 29 36 41 23
30 17 110 170 183 26 30 47 43 2802 13 70 166 175 23 30 40 42 2608 14 51 169 165 22 29 49 39 23
Paper Presented at the Annual Meeting of the AERA, 36 3aNew Orleans. April 2002
References
Aldridge, J. M., & Fraser, B. J. (2000). A cross-cultural study of classroom learningenvironments in Australia and Taiwan. Learning Environments Research, 3, 101-134.
American Association for the Advancement of Science (AAAS). (1990). Sciencefor allAmericans: Project 2061. New York: Oxford University Press.
Anderson, G., & Arsenault, N. (1998). Fundamentals of educational research (2nd ed.).
London: The Falmer Press.
Arambula, T. (1995). An exploration of gender participation patterns in science competitions.Journal of Research in Science Teaching, 32(7), 735-748.
Catsambis, S, (1995). Gender, race, ethnicity and science education in the middle grades.Journal of Research in Science Teaching, 32(3), 243-257.
Cronbach, L. J. (1951, September). Coefficient alpha and the internal structure of tests.Psychometrika, 16(3), 297-334.
Doepken, D., Lawsky, E., & Padwa, L. (1993, June). Modified Fennema-Sherman attitudescales. Paper presented at Woodrow Wilson Gender Equity in Mathematics andScience Congress (WW-GEMS), Princeton, NJ.
Erickson, F. (1998). Qualitative research methods for science education. In B. J. Fraser, & K.
G. Tobin (Eds.), The international handbook of science education (pp. 1155-1173).Dordrecht, The Netherlands: Kluwer Academic Publishers.
Farkas, L. (Ed.). (1994). Anthropometry of the head and face. New York: Raven Press.
Fisher, D., Henderson, D. & Fraser, B. (1997). Laboratory Environments & StudentOutcomes in Senior High School Biology. American Biology Teacher, 59, 214-219.
Fraser, B. J. (1981). Test of Science-Related Attitudes. Melbourne, Australia: AustralianCouncil for Educational Research.
Fraser, B. J. (1991). Two decades of classroom environment research. In B. J. Fraser & H. J.Walberg (Eds.), Educational environments: Evaluation, antecedents and consequences(pp. 3-27). Oxford, England: Pergamon Press.
Fraser, B. J. (1994). Research on classroom and school climate. In D. Gabel (Ed.), Handbookof research on science teaching and learning (pp. 493-541). New York: Macmillan.
Fraser, B. J. (1998). Science learning environments: Assessment, effects and determinants. InB. J. Fraser & K. G. Tobin (Eds.), International handbook of science education (pp.527-564). Dordrecht, The Netherlands: Kluwer Academic Publishers.
Paper Presented at the Annual Meeting of the AERA, 37 3 9New Orleans, April 2002
Fraser, B. J. (1999). "Grain sizes" in learning environment research: Combining qualitativeand quantitative methods. In H.C. Waxman and H.J. Walberg (Eds.), New directionsfor teaching practice and research. Berkeley, CA: McCutchan.
Fraser, B. J., Giddings, G. J., & McRobbie, C. J. (1995). Evolution and validation of personalform of an instrument for assessing science laboratory classroom environments.Journal of Research in Science Teaching, 32, 399-422.
Fraser, B.J. & McRobbie, C.J. (1995). Science Laboratory Classroom Environments atSchools and Universities: A Cross-National Study. Educational Research andEvaluation,1 , 289-317.
Fraser, B. J., McRobbie, C. J., & Giddings, G. J. (1993). Development and cross-nationalvalidation of a laboratory classroom environment instrument for senior high schoolscience. Science Education, 77, 1-24.
Fraser, B. J., & Tobin, K. (1991). Combining qualitative and quantitative methods inclassroom environment research. In B. J. Fraser & H. J. Walberg (Eds.), Educationalenvironments: Evaluation, antecedents and consequences (pp. 271-292). Oxford,England: Pergamon Press.
Germann, P.J. (1988). Development of the attitude toward science in school assessment andits use to investigate the relationship between science achievement and attitude towardscience in school. Journal of Research in Science Teaching, 25, 689-703.
Greeley, N., & Reardon-Offerman T. (1997, March-April). Measuring angles in physicalTherapy. Mathematics Teaching in Middle School. Reston, VA: National Council ofTeachers of Mathematics, 2(5), 338-344).
Henderson, D. G., Fisher, D. L., & Fraser, B. J. (1998, April). Learning environment, studentattitudes and effects of students' sex and other science study in environmental scienceclasses. Paper presented at the annual meeting of American Educational ResearchAssociation, San Diego, CA.
Houtz, L. (1995). Instructional strategy change and the attitude and achievement of seventhand eight grade science students. Journal of Research in Science Teaching, 32(6),629-648.
Knill, G. (1981, February). Applications: Mathematics in forensic science. MathematicsTeacher. Reston, VA: National Council of Teachers of Mathematics.
Knill, G. (1995). Introductory activity Bones. Pacesetter Mathematics. PrecalculusThrough modeling. Princeton, NJ: The College Board and Educational Testing. 1,1-4.
Lee, S. U. (2001). Assessment, description and effects of science classroom environmentsin Korea. Unpublished doctoral dissertation, Curtin University of Technology,Australia.
Lewin, K. (1936). Principles of Topological Psychology, McGraw: New York.
Paper Presented at the Annual Meeting of the AERA, 38
New Orleans, April 20024 0
Maor, D., & Fraser, B. J. (1996). Use of classroom environment perceptions in evaluatinginquiry-based computer assisted learning. International Journal of Science Education,18, 401-421.
McRobbie, C. J., & Fraser, B. J. (1993). Associations between student outcomes andpsychosocial science environments. Journal of Educational Research, 87, 78-85.
Moos, R.H. (1979). The social climate scales: An overview. Palo Alto, CA: ConsultingPsychologists Press.
Moos, R.H. (1979). Evaluating educational environments: Procedures, measures, findingsand policy implications. San Francisco: Jossey-Bass.
Moos, R.H., & Trickett, E.J. (1987). Classroom Environment Scale manual (2nd ed.). PaloAlto, CA: Consulting Psychologists Press.
Mosenthal, P., & Kirch, I. (1994). Defining the proficiency standards of adult literacy inthe U.S.: A profile approach. Paper presented at the National Reading Conference,San Diego, CA.
Murray, H.A. (1938). Explorations in Personality. Oxford University Press: New York.
National Academy of Sciences. (National Research Council). (1996). National scienceeducation standards. Washington, DC: National Academy Press.
Neufeld, A. (1989, May). Body measurement. Arithmetic Teacher, 36(9), 12-15.
Nunnally, J. (1967). Psychometric theory. New York: McGraw Hill.
Pagni, D. L. (1979). Application in school mathematics: Human variability. In S. Sharon, &R. E. Reys (Eds.), Measuring in school mathematics (pp. 43-58). Reston, VA:National Council of Teachers of Mathematics.
Punch, K. (1998). Introduction to social research: Quantitative and qualitative approaches.London: Sage Publications.
Shaw, J. M. (1984). Ideas. Arithmetic Teacher, 32(4), 20-24.
Talton, L.E. & Simpson, R. D. (1986). Relationships of attitude toward self, family andschool with attitude toward science among adolescents. Science Education, 70(4), 365-374.
Talton, L. E. & Simpson, R. D. (1987). Relationships of attittude toward classroomenvironment with attitude toward and achievement in science among tenth gradeBiology students. Journal of Research in Science Teaching, 24(6), 507-525.
Taylor, P. C., Fraser, B. J., & Fisher, D. L. (1997). Monitoring constructivist classroomlearning environments. International Journal of Educational Research, 27, 293-302.
Paper Presented at the Annual Meeting of the AERA, 39 41New Orleans, April 2002
Teh, G., & Fraser, B. J. (1994). An evaluation of computer-assisted learning in terms ofachievement, attitudes and classroom environment. Evaluation and Research inEducation, 8, 147-161.
Tobin, K., & Fraser, B. J. (Eds.). (1998). Qualitative and quantitative landscapes of classroomlearning environments. In B. J. Fraser & K. G. Tobin (Eds.), The internationalhandbook of science education (pp. 623-640). Dordrecht, The Netherlands: KluwerAcademic Publishers.
Walberg, H.J. & Anderson, G.J. (1938). Classroom climate and individual learning. Journalof Educational Psychology, 59, 414-419.
Weinburgh, M. (1995). Gender Differences in student attitudes toward science: A meta-Analysis of the literature from 1970-1991. Journal of Research in Science Teaching,32(4), 387-398.
Wong, A. F. F. & Fraser, B.J. (1995). Cross-Validation in Singapore of the ScienceLaboratory Environment Inventory. Psychological Reports,76, 907-911.
Zerega, M. E., Haertel, G. D., Tsai, S., & Walberg, H. J. (1986). Late adolescent sexDifferences in Science learning. Science Education, 70(4), 447-460.
Paper Presented at the Annual Meeting of the AERA, 40 4 2New Orleans, April 2002
U.S. Department of EducationOffice of Educational Research and Improvement (OERI)
National Library of Education (NLE)Educational Resources Information Center (ERIC)
REPRODUCTION RELEASE(Specific Document)
I/AR(.492Q,
I. DOCUMENT IDENTIFICATION:
Title: C I 4 `S.--5 goom a ,4A .--r--keo m /iv(Zicd.k hoc e i-e,uce
Auth-or(s): f7L4,Zd E., 2,0 1.4. gCorporate Source: C u Art A, oif vc4A) a 10,7 Publication Date:
aeft,e-r, \mi-E s-r-clz..> s-ne A 614
II. REPRODUCTION RELEASE:
In order to disseminate as widely as possible timely and significant materials of interest to the educational community, documents announced in themonthly abstract journal of the ERIC system, Resources in Education (RIE), are usually made available to users in microfiche, reproduced paper copy,and electronic media, and sold through the ERIC Document Reproduction Service (EDRS). Credit is given to the source of each document, and, ifreproduction release is granted, one of the following notices is affixed to the document.
If permission is granted to reproduce and disseminate the identified document, please CHECK ONE of the following three options and sign at the bottomof the page.
The sample sticker shown below will beaffixed to all Level 1 documents
1
PERMISSION TO REPRODUCE ANDDISSEMINATE THIS MATERIAL HAS
BEEN GRANTED BY
TO THE EDUCATIONAL RESOURCESINFORMATION CENTER (ERIC)
Level 1
The sample sticker shown below will beaffixed to all Level 2A documents
PERMISSION TO REPRODUCE ANDDISSEMINATE THIS MATERIAL IN
MICROFICHE, AND IN ELECTRONIC MEDIAFOR ERIC COLLECTION SUBSCRIBERS ONLY,
HAS BEEN GRANTED BY
2A
TO THE EDUCATIONAL RESOURCESINFORMATION CENTER (ERIC)
Level 2A
Check here for Level 1 release, permitting Check here for Level 2A release, permittingreproduction and dissemination in microfiche or other reproduction and dissemination in microfiche and in
ERIC archival media (e.g., electronic) and paper electronic media for ERIC archival collectioncopy. subscribers only
Signhere,-,please
The sample sticker shown below will beaffixed to all Level 2B documents
PERMISSION TO REPRODUCE ANDDISSEMINATE THIS MATERIAL IN
MICROFICHE ONLY HAS BEEN GRANTED BY
2B
TO THE EDUCATIONAL RESOURCESINFORMATION CENTER (ERIC)
Level 2B
Check here for Level 28 release, permittingreproduction and dissemination in microfiche only
Documents will be processed as indicated provided reproduction quality permits.If permission to reproduce is granted, but no box is checked, documents will be processed at Level 1.
I hereby grant to the Educational Resources Information Center (ERIC) nonexclusive permission to reproduce and disseminate this documentas indicated above. Reproduction from the ERIC microfiche or electronic media by persons other than ERIC employees and its systemcontractors requires permission from the copyright holder. Exception is made for non-profit reproduction by libraries and other service agenciesto satisfy information needs of educators in response to discrete inquiries.
Printed Name/Position/Title:
Organization/Address: e N.1 teitl'i S F WCT,v° 117 Telnnr 30/9e.9 ft_47-4 Ettail Address: cy 2-Date:
A a sT- \.-1 4-41 yittbu
FAX:
eteMe
III. DOCUMENT AVAILABILITY INFORMATION (FROM NON-ERIC SOURCE):
If permission to reproduce is not granted to ERIC, or, if you wish ERIC to cite the availability of the document from another source, pleaseprovide the following information regarding the availability of the document. (ERIC will not announce a document unless it is publiclyavailable, and a dependable source can be specified. Contributors should also be aware that ERIC selection criteria are significantly morestringent for documents that cannot be made available through EDRS.)
Publisher/Distributor:
Address:
Price:
IV. REFERRAL OF ERIC TO COPYRIGHT/REPRODUCTION RIGHTS HOLDER:
If the right to grant this reproduction release is held by someone other than the addressee, please provide the appropriate name andaddress:
Name:
Address:
V. WHERE TO SEND THIS FORM:
Send this form to the following ERIC Clearinghouse:
University of MarylandERIC Clearinghouse on Assessment and Evaluation
1129 Shriver LaboratoryCollege Park, MD 20742
Attn: Acquisitions
However, if solicited by the ERIC Facility, or if making an unsolicited contribution to ERIC, return this form (and the document beingcontributed) to:
ERIC Processing and Reference Facility4483-A Forbes BoulevardLanham, Maryland 20706
Telephone: 301-552-4200Toll Free: 800-799-3742
FAX: 301-552-4700e-mail: [email protected]
WWW: http://ericfac.piccard.csc.comEFF-088 (Rev. 2/2000)