ReproducibilityofMetabolicMeasurements ...jnm.snmjournals.org/content/40/11/1771.full.pdf ·...
8
CLINICAL INVESTIGATIONS Reproducibility of Metabolic Measurements in Malignant Tumors Using FDG PET Wolfgang A. Weber, Sibylle I. Ziegler, Ralf Thödtmann, Axel-R. Hanauske and Markus Schwaiger Nuklearmedizinische Klinik and I. Medizinische Klinik, Klinikum Rechts der Isar, Technische UniversitätMünchen,München,Germany PET using 18F-fluorodeoxyglucose (FDG) is increasingly applied to monitor the response of malignant tumors to radiotherapy and chemotherapy. The aim of this study was to assess the reproduc- ibility of serial FDG PET measurements to define objective criteria for the evaluation of treatment-induced changes. Meth ods: Sixteen patients participatingin phase I studies of novel antineoplastic compounds were examined twice by FDG PET within 10 d while they were receiving no therapy. Standardized uptake values (SUVs), FDG net influx constants (K¡), glucose normalized SUVs (SUVgiuc)and influx constants (Kigiuc)were determined for 50 separate lesions. The precision of repeated measurements was determined on a lesion-by-lesion and a patient-by-patient basis. Results: None of the parameters showed a significant increase or decrease at the two examinations. The differences of repeated measurements were approximately nor mally distributed for all parameters with an SD of the mean percentage difference of about 10%. The 95% normal ranges for spontaneous fluctuations of SUV, SUVgiuc,K¡and Kigiucwere determined to be ±0.91,±1.14,±0.52mL/100g/minand ±0.64 mL/100 g/min, respectively. Analysis on a lesion-by-lesion basis yielded similar results. Conclusion: FDG PET provides several highly reproducible quantitative parameters of tumor glucose metabolism. Changes of a parameter that are outside the 95% normal range determined in this study may be used to define a metabolic response to therapy. Key Words: PET;fluorodeoxyglucose;therapymonitoring J NucÃ- Med 1999; 40:1771-1777 potential of PET using the glucose analog I8F- fluorodeoxyglucose (FDG) for imaging of malignant tumors has been widely documented in the literature (7). Currently, FDG PET is used mainly for tumor detection and staging. For these applications, a qualitative image interpretation has been found to be sufficient in most cases (2-4}. However, PET also allows quantitative measurements of activity concentrations within the body. Because of the simple metabolic pathway of FDG, these activity concentrations can be used to estimate the glucose utilization of malignant tumors. In several small studies, FDG PET measurements Received Sep. 10,1998; revision accepted Apr. 9,1999. For correspondence or reprints contact: Wolfgang A. Weber, MD, Nuklear medizinische Klinik, Klinikum Rechts der Isar, Ismaningerstr. 22, 81675 München,Germany. have been applied to monitor the response of malignant tumors to therapy (5-12). These studies showed that a reduced number of viable cells or reduced metabolism of damaged cells is associated with a decrease in FDG uptake. Therefore, changes in FDG uptake after chemotherapy and radiotherapy may provide a new marker for tumor response (5-12). However, knowledge of the degree of reproducibility of FDG PET measurements is mandatory for reliable detection of changes over time. Before FDG PET can be applied for therapy monitoring in clinical practice and research, the accuracy of the measuring technique and the spontaneous variability of the biologic signal have to be determined. Thus, the aim of this study was to assess the reproducibil ity of serial FDG PET measurements in malignant tumors. A group of patients with advanced tumor stages who partici pated in phase I studies were examined twice by FDG PET within 10 d while they were receiving no therapy. A three-dimensional delineation of the tumors was performed, and the reproducibility of commonly applied parameters of glucose metabolism was determined. The data were then used to calculate normal ranges for random statistical fluctuations of the parameters. These normal ranges provide objective criteria to determine whether an observed decrease of a parameter after therapy represents a true change in glucose metabolism or can be explained by statistical fluctuation. Thus, the normal ranges allow definition of a metabolic response in individual patients. Furthermore, the normal ranges may be applied to determine the number of patients that must be included in a therapy monitoring study to detect therapy-induced changes in glucose metabolism with a certain statistical power. MATERIALS AND METHODS Patient Population The study population consisted of 16 patients (11 men, 5 women; age 57 ±9 y) who participated in phase I studies at this institution. Before the first course of chemotherapy, patients were examined by FDG PET twice within 10 d (mean 3 ±3 d). No chemotherapy, radiotherapy or surgical treatment had been per formed at least 4 wk before the first PET scan. Fifty separate tumor lesions were evaluated (8 primary tumors, 22 lung métastases,12 lymph node métastasesand 8 liver métastases)in the 16 patients. REPRODUCIBILITY OFFDG PET STUDIES• Weber et al. 1771 by on July 27, 2020. For personal use only. jnm.snmjournals.org Downloaded from
Transcript of ReproducibilityofMetabolicMeasurements ...jnm.snmjournals.org/content/40/11/1771.full.pdf ·...
CLINICAL INVESTIGATIONS
Reproducibility of Metabolic Measurementsin Malignant Tumors Using FDG PETWolfgang A. Weber, Sibylle I. Ziegler, Ralf Thödtmann,Axel-R. Hanauske and Markus Schwaiger
Nuklearmedizinische Klinik and I. Medizinische Klinik, Klinikum Rechts der Isar, Technische UniversitätMünchen,München,Germany
PET using 18F-fluorodeoxyglucose (FDG) is increasingly applied
to monitor the response of malignant tumors to radiotherapy andchemotherapy. The aim of this study was to assess the reproduc-
ibility of serial FDG PET measurements to define objectivecriteria for the evaluation of treatment-induced changes. Methods: Sixteen patients participatingin phase I studies of novelantineoplastic compounds were examined twice by FDG PETwithin 10 d while they were receiving no therapy. Standardizeduptake values (SUVs), FDG net influx constants (K¡),glucosenormalized SUVs (SUVgiuc)and influx constants (Kigiuc)weredetermined for 50 separate lesions. The precision of repeatedmeasurements was determined on a lesion-by-lesion and apatient-by-patient basis. Results: None of the parameters showeda significant increase or decrease at the two examinations. Thedifferences of repeated measurements were approximately normally distributed for all parameters with an SD of the meanpercentage difference of about 10%. The 95% normal ranges forspontaneous fluctuations of SUV, SUVgiuc,K¡and Kigiucweredetermined to be ±0.91,±1.14,±0.52mL/100g/minand ±0.64mL/100 g/min, respectively. Analysis on a lesion-by-lesion basis
yielded similar results. Conclusion: FDG PET provides severalhighly reproducible quantitative parameters of tumor glucosemetabolism. Changes of a parameter that are outside the 95%normal range determined in this study may be used to define ametabolic response to therapy.
Key Words: PET; fluorodeoxyglucose;therapy monitoringJ NucÃMed 1999; 40:1771-1777
potential of PET using the glucose analog I8F-
fluorodeoxyglucose (FDG) for imaging of malignant tumorshas been widely documented in the literature (7). Currently,FDG PET is used mainly for tumor detection and staging.For these applications, a qualitative image interpretation hasbeen found to be sufficient in most cases (2-4}. However,PET also allows quantitative measurements of activityconcentrations within the body. Because of the simplemetabolic pathway of FDG, these activity concentrationscan be used to estimate the glucose utilization of malignanttumors. In several small studies, FDG PET measurements
Received Sep. 10,1998; revision accepted Apr. 9,1999.For correspondence or reprints contact: Wolfgang A. Weber, MD, Nuklear
medizinische Klinik, Klinikum Rechts der Isar, Ismaningerstr. 22, 81675München,Germany.
have been applied to monitor the response of malignanttumors to therapy (5-12). These studies showed that areduced number of viable cells or reduced metabolism ofdamaged cells is associated with a decrease in FDG uptake.Therefore, changes in FDG uptake after chemotherapy andradiotherapy may provide a new marker for tumor response(5-12).
However, knowledge of the degree of reproducibility ofFDG PET measurements is mandatory for reliable detectionof changes over time. Before FDG PET can be applied fortherapy monitoring in clinical practice and research, theaccuracy of the measuring technique and the spontaneousvariability of the biologic signal have to be determined.
Thus, the aim of this study was to assess the reproducibility of serial FDG PET measurements in malignant tumors. Agroup of patients with advanced tumor stages who participated in phase I studies were examined twice by FDG PETwithin 10 d while they were receiving no therapy. Athree-dimensional delineation of the tumors was performed,and the reproducibility of commonly applied parameters ofglucose metabolism was determined. The data were thenused to calculate normal ranges for random statisticalfluctuations of the parameters. These normal ranges provideobjective criteria to determine whether an observed decreaseof a parameter after therapy represents a true change inglucose metabolism or can be explained by statisticalfluctuation. Thus, the normal ranges allow definition of ametabolic response in individual patients. Furthermore, thenormal ranges may be applied to determine the number ofpatients that must be included in a therapy monitoring studyto detect therapy-induced changes in glucose metabolismwith a certain statistical power.
MATERIALS AND METHODS
Patient PopulationThe study population consisted of 16 patients (11 men, 5
women; age 57 ±9 y) who participated in phase I studies at thisinstitution. Before the first course of chemotherapy, patients wereexamined by FDG PET twice within 10 d (mean 3 ±3 d). Nochemotherapy, radiotherapy or surgical treatment had been performed at least 4 wk before the first PET scan. Fifty separate tumorlesions were evaluated (8 primary tumors, 22 lung métastases,12lymph node métastasesand 8 liver métastases)in the 16 patients.
REPRODUCIBILITYOF FDG PET STUDIES•Weber et al. 1771
by on July 27, 2020. For personal use only. jnm.snmjournals.org Downloaded from

Patient characteristics, histologie diagnosis and localization of thelesions are summarized in Table 1.
Details of the study were explained to the patients, and writteninformed consent was obtained. The study protocol was reviewedand approved by the Ethics Committee of the Technische UniversitätMünchen.
Imaging ProcedureImaging was performed using a whole-body PET scanner
(ECAT EXACT; CTI/Siemens, Inc., Knoxville, TN). This imagingdevice consists of 24 rings of bismuth germaneate detectors thatyield 47 transverse slices, 3.4 mm apart.
I8F was produced with a self-shielded 11-MeV cyclotron (RDS112; CTI/Siemens, Inc.) by the acceleration of protons onto an I8O
water target. FDG was produced with a standard techniquemodified from the synthesis reported by Harnacher et al. (U).
Patients fasted at least 4 h before PET imaging to minimizeglucose utilization of normal tissue and to ensure standardizedglucose metabolism in all patients. The serum glucose level wasmeasured before the PET examination using blood glucose reagentstrips and photometric measurement (Glucometer II and Glucostix;Bayer Diagnostics, Munich, Germany). After positioning the patient inthe scanner, a transmission measurement with 68Gerod sources was
performed for 15 min to yield approximately 4 million counts per slice.After transmission measurement, a bolus of approximately 370
MBq FDG was injected through an intravenous catheter, and a
TABLE 1Characteristics of Patients in Study
Patient Ageno.(y)1234567891011121314151656655864557359585368495037604556No.
of LocalizationSex lesions oflesionsMMMFMFMFFMMMFMMM6111614131248254LungPleuraPleuraLungLungMediastinumCervix
and mediastinumLungPelvisPleuraMediastinumLiverMediastinum
andlungMediastinumLungLiverDiagnosisNSCLCMesotheliomaMesotheliomaNSCLCMetastatic
esopha-geal
cancerLymphnode métas
tases ofNSCLCLymphnode métas
tases ofNSCLCMetastaticvulvarcarcinomaRecurrent
rectalcancer(lymphnode
métastases)MesotheliomaNSCLCMetastatic
rectalcancerHigh-grade
non-Hodgkin'slym-phomaMetastatic
renalcancerMetastatic
adenoidcysticcancerMetastatic
rectalcancer
NSCLC = non-small cell lung cancer.
dynamic acquisition sequence was begun. The mode of dataacquisition was identical for both scans and consisted of six 10-sframes, eight 30-s frames, five 1-min frames, six 5-min frames andthree 10-min frames (total acquisition time 70 min).
Emission data corrected for random coincidences, dead time andattenuation were reconstructed by filtered backprojection (Manningfilter with cutoff frequency 0.4 cycle per bin). The matrix size was128 X 128 pixels with a size of 4.0 X 4.0 mm. The image pixelcounts were calibrated to activity concentrations (becquerels permilliliter) and decay corrected using the time of tracer injection as areference. The resulting in-plane image resolution of transaxialimages was approximately 8-mm full width at half maximum(FWHM), with an axial resolution of approximately 5-mm FWHM.
Data AnalysisFor definition of regions of interest (ROIs) and data analysis,
computer programs were developed in the Interactive Data Language (IDL; Research Systems, Inc., Boulder, CO) using theClinical Application Programming Package (CAPP; CTI/Siemens,Inc.). Standardized uptake values (SUVs), FDG net influx constants (K¡),glucose normalized SUVs (SUVg|uc) and net influxconstants (K, g|uc)were calculated.
Region-of-lnterest Definition
For definition of tumor volumes, the last frame of the dynamicstudy (60-70 min after injection) was used. Loosely fitting ROIs
covering the whole tumor volume were manually placed around thelesions in consecutive slices. Tumor volumes were then definedusing a cutoff value of 50% of the maximum FDG concentrationwithin this volume. The second to fourth frames of the dynamicstudy were used to define the blood ROIs needed for calculation ofthe input function. Blood time-activity curves were generated from
ROIs placed in the left ventricle (11 patients) or the aorta (5patients). For the left ventricular cavity, circular ROIs with adiameter of 1.2 cm were placed in two consecutive slices in the leftventricle. For the aorta, square 2X2 pixel ROIs were placed in theaorta in eight consecutive slices (14). Average counts derived fromthe blood ROIs were used to calculate the input function.
Calculation of ParametersSUVs were calculated in the last frame of the dynamic study
(60-70 min after injection) using the formula: SUV = measured
activity concentration (Bq/g) X body weight (g)/injected activity(Bq).
SUVgluc were calculated by multiplying the SUV with themeasured blood glucose concentration and dividing by 100 mg/100mL. To evaluate the influence of the time point of measurement onthe SUV, additional SUVs were also calculated at 40 and 50 minafter injection
The Patlak-Gjedde graphic method was used to determine K¡
(/5). The starting point of the analysis was 10 min after injection.Metabolic rates for FDG (K¡gluc)were calculated by multiplying K¡with the blood glucose concentration and dividing by 100 mg/100 mL.
Statistical AnalysisFor each tumor lesion, the difference between the measurements
of a parameter at the two time points, d, was calculated. Thedistribution of d was analyzed using probability plots. In this plot, anormally distributed sample is represented by a straight line.Deviations from normality result in curved plots. Furthermore,deviation from normality was tested using the Kolmogorov-
1772 THE JOURNALOF NUCLEARMEDICINE•Vol. 40 •No. 11 •November 1999
by on July 27, 2020. For personal use only. jnm.snmjournals.org Downloaded from
Smirnov test, and the mean skewness of the distribution of d wascalculated. The skewness of a dataset corresponds to the meanminus the median divided by the SD. This parameter indicateswhether positive or negative deviations of d from the mean aremore pronounced (16). The Kolmogorov-Smirnov test determines
the probability that differences between the observed distributionand the normal distribution are associated with random samplingfluctuation. Thus, a low probability of the Kolmogorov-Smirnov
test provides evidence that the observed data are not normallydistributed (16).
After confirmation of an approximately normal distribution, themean and SD of d were calculated. Two times the SD of d was thenused to define the normal range of spontaneous changes in aparameter. To estimate the precision of the calculated normalranges, 95% confidence intervals of the SD of d were calculatedusing the chi-square distribution (16).
For comparison of the reproducibility of the different parameters, mean relative differences, D (mean of d divided by the globalmean of a parameter) and intraclass correlation coefficients (ICs)were determined. The 1C describes the correlation between twomeasurements of a parameter. If the two measurements give identicalresults, the 1C is one. Random or systematic differences between thetwo measurements decrease the value of the 1C. Differences in thevariance of D for the various parameters were tested using the F testand Bartlet's test (16). The F test compares the SD of two normallydistributed dataseis. Bartlet's test is a generalization of the F test
that allows comparison of more than two data sets.Analysis of the reproducibility of the various parameters was
performed on a patient-by-patient and a lesion-by-lesion basis. Forthe patient-by-patient analysis, the lesion with the highest FDGuptake 60-70 min after injection in the first study was used.
Bartlet's test was also used to determine whether there were
significant differences in the variance of the parameters in patientswith different numbers of lesions. To accomplish this, patients weregrouped into four groups: group 1, 1-2 lesions; group 2, 3-4lesions; group 3, 4-6 lesions; and group 4, 7 or more lesions.
The reproducibility of blood curves was assessed by comparingthe differences in areas under the time-activity curve corrected for
injected doses in studies 1 and 2.
A paired two-sided / test was applied to test for differences of the
means of the various parameters at the two scans. To assess theinfluence of tumor size on the reproducibility of a parameter, theabsolute value of the differences at the two measurements, |d|, wasplotted against the tumor volume, and linear regression analysiswas applied. The same method was used to determine whetherthere is a correlation between |d¡and the value of the measured
parameter. All statistical tests were performed at the 5% level ofsignificance.
RESULTS
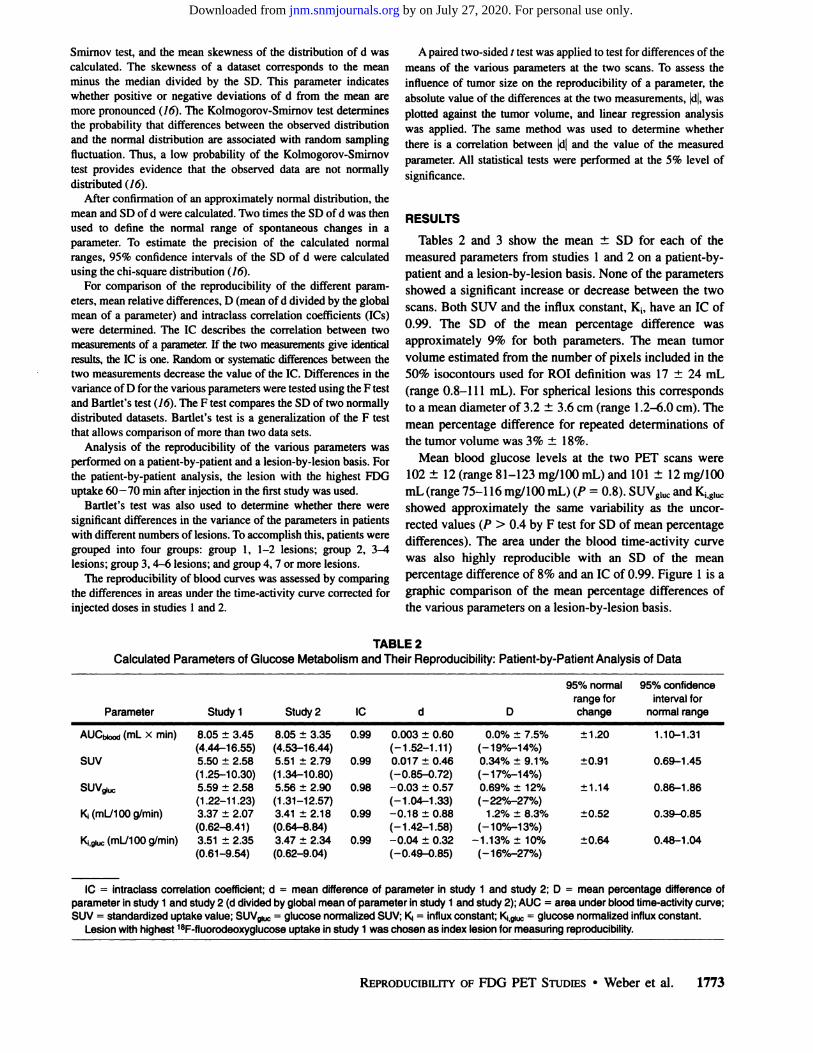
Tables 2 and 3 show the mean ±SD for each of themeasured parameters from studies 1 and 2 on a patient-by-patient and a lesion-by-lesion basis. None of the parameters
showed a significant increase or decrease between the twoscans. Both SUV and the influx constant, K¡,have an 1C of0.99. The SD of the mean percentage difference wasapproximately 9% for both parameters. The mean tumorvolume estimated from the number of pixels included in the50% isocontours used for ROI definition was 17 ±24 mL(range 0.8-111 mL). For spherical lesions this correspondsto a mean diameter of 3.2 ±3.6 cm (range 1.2-6.0 cm). The
mean percentage difference for repeated determinations ofthe tumor volume was 3% ±18%.
Mean blood glucose levels at the two PET scans were102 ±12 (range 81-123 mg/100 mL) and 101 ±12 mg/100mL (range 75-116 mg/100 mL) (P = 0.8). SUVglucand K¡,g,ucshowed approximately the same variability as the uncor-
rected values (P > 0.4 by F test for SD of mean percentagedifferences). The area under the blood time-activity curve
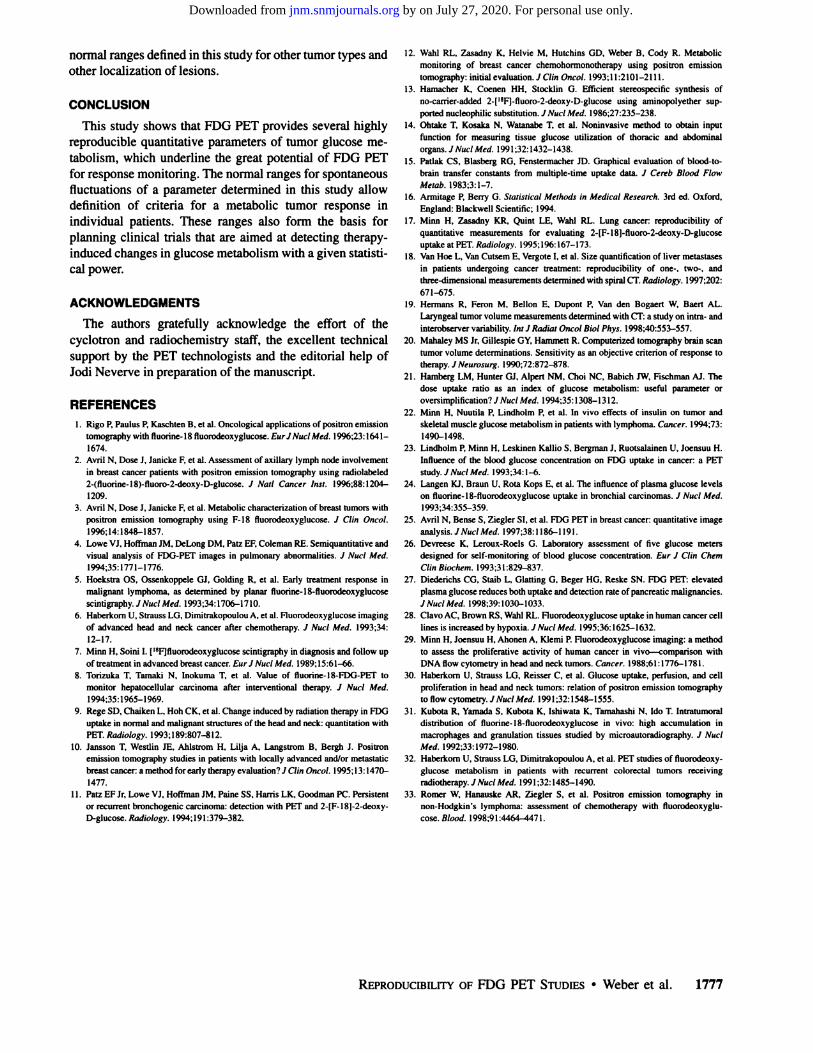
was also highly reproducible with an SD of the meanpercentage difference of 8% and an 1C of 0.99. Figure 1 is agraphic comparison of the mean percentage differences ofthe various parameters on a lesion-by-lesion basis.
TABLE 2Calculated Parameters of Glucose Metabolism and Their Reproducibility: Patient-by-Patient Analysis of Data
ParameterAUCbiood
(mL xmin)SUVSUVglucKi(mL/100g/min)K¡,giuc(mL/100g/min)Study
18.05
±3.45(4.44-16.55)5.50
±2.58(1.25-10.30)5.59
±2.58(1.22-11.23)3.37
±2.07(0.62-8.41)3.51
±2.35(0.61-9.54)Study
28.05
±3.35(4.53-16.44)5.51
±2.79(1.34-10.80)5.56
±2.90(1.31-12.57)3.41
±2.18(0.64-8.84)3.47
±2.34(0.62-9.04)1C0.990.990.980.990.99d0.003
±0.60(-1.52-1.11)0.01
7±0.46(-0.85-0.72)-0.03
±0.57(-1.04-1.33)-0.18
±0.88(-1.42-1.58)-0.04
±0.32(-0.49-0.85)D0.0%
±7.5%(-19%-14%)0.34%
±9.1%(-17%-14%)0.69%
±12%(-22%-27%)1
.2% ±8.3%(-10%-13%)-1.13%±
10%(-16%-27%)95%
normalrange forchange±1.20±0.91±1.14±0.52±0.6495%
confidenceinterval for
normalrange1.10-1.310.69-1.450.86-1.860.39-0.850.48-1.04
1C = intraclass correlation coefficient; d = mean difference of parameter in study 1 and study 2; D = mean percentage difference ofparameter in study 1 and study 2 (d divided by global mean of parameter in study 1 and study 2); AUC = area under blood time-activity curve;SUV = standardized uptake value; SUV8luc = glucose normalized SUV; Kj = influx constant; K¡giuc= glucose normalized influx constant.
Lesion with highest 18F-fluorodeoxyglucose uptake in study 1 was chosen as index lesion for measuring reproducibility.
REPRODUCIBILITYOF FDG PET STUDIES•Weber et al. 1773
by on July 27, 2020. For personal use only. jnm.snmjournals.org Downloaded from

TABLE 3Calculated Parameters of Glucose Metabolism and Their Reproducibility: Lesion-by-Lesion Analysis of Data
ParameterSUVsuvglucKi(mL/100g/min)
Ki.giuc(mL7100g/min)Study
15.02
±2.30(1.25-10.30)
4.90 ±2.16(1.20-11.20)
3.17 ±1.74(0.62-8.40)
3.21 ±2.01(0.61-9.53)Study
25.05
±2.36(1.34-10.80)
4.83 ±2.16(1.31-12.56)
3.18 ±1.81(0.64-8.84)
3.12 ±1.94(0.63-9.54)1C0.99
0.98
0.99
0.98d0.06
±0.45(-0.85-1.05)-0.10 ±0.43(-1.05-1.34)
0.01 ±0.27(-0.74-0.54)-0.03 ±0.35(-1.05-0.85)D0.5%
±8.6%(-17%-14%)
-1.0% ±8.6%(-22%-24%)
0.4% ±9.0%(-23%-17%)
-1.0% ±10.0%(-33%-27%)95%
normalrange forchange±0.90
±0.86
±0.54
±0.7095%
confidenceinterval for
normalrange0.76-1.13
0.73-1.09
0.46-0.68
0.59-0.88
1C = intraclass correlation coefficient; d = mean difference of parameter in study 1 and study 2; D = mean percentage difference ofparameter in study 1 and study 2 (d divided by global mean of parameter in study 1 and study 2); SUV = standardized uptake value; SUVgiuc =glucose normalized SUV; K¡= influx constant; K, giuc= glucose normalized influx constant.
Lesion with highest 18F-fluorodeoxyglucose uptake in study 1 was chosen as index lesion for measuring reproducibility.
The estimated mean and SDs of D and d obtained from thelesion-by-lesion analysis and the patient-by-patient analysiswere almost identical. Bartlet's test showed no significant
differences in the SD of d for any of the parameters betweenthe groups of patients with different numbers of lesions (P >0.7). Both results indicate that the main source of variabilityis the variability in the measurement of individual lesions.Therefore, the following description considers only theresults of the lesion-by-lesion analysis, which allows more
precise estimates of the statistical parameters.Kolmogorov-Smirnov testing revealed no significant de
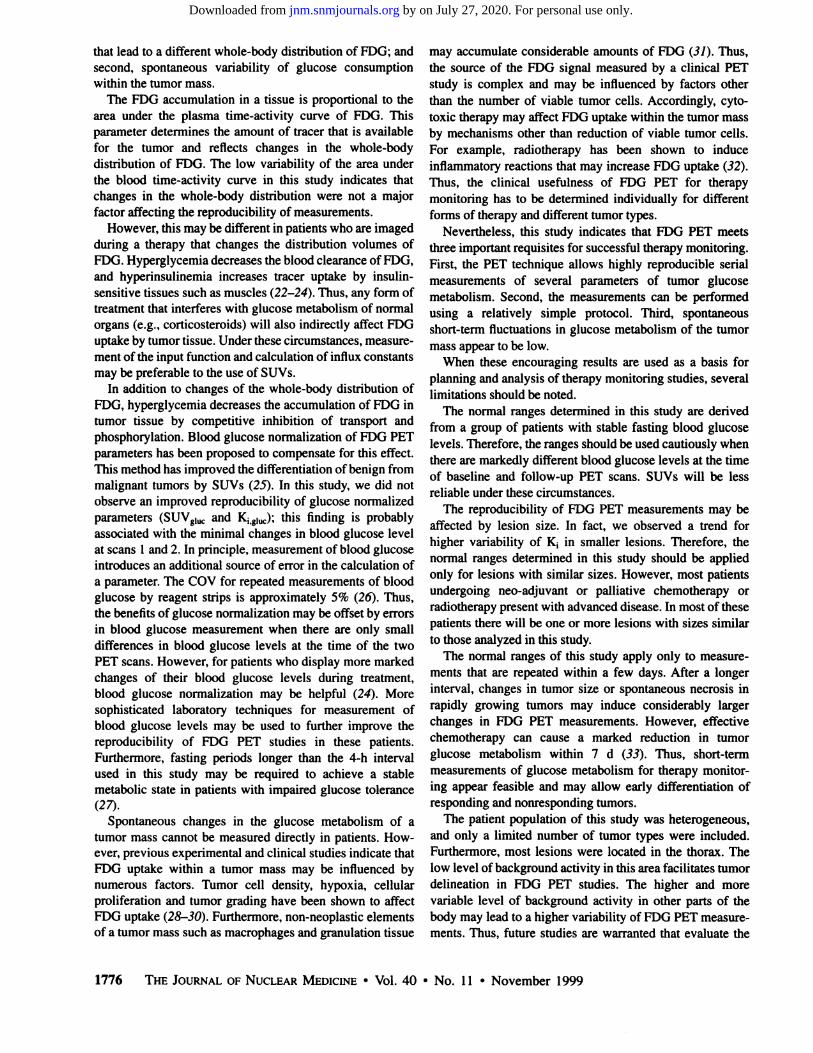
viation of d from normality for any of the parameters. Figure2 shows the probability plot of d for K¡as an example. TheSD of d was not influenced by the absolute value of theparameter (r = 0.98, P < 0.01 by linear regression analysis).
The volume of the lesion had no influence on SUV andSUVglUL.(P > 0.3 by linear regression analysis). For K¡and
40%
_ 30%
g 20% •
10% •
-10%
-40% J
SUV SUVl K13l
FIGURE 1. Graphic comparison of mean percentage difference, D, for various parameters analyzed on lesion-by-lesionbasis. Boxes represent values between 25th and 75th percen-tiles; horizontal bars (inside boxes) indicate median; vertical bars(above and below boxes) represent values at 10th and 90thpercentiles. SUV = standardized uptake value; K, = influxconstant; SUVgiuc= glucose normalized SUV; Kiigiuc= glucosenormalized influx constant.
Kj.giuo there was a trend for increased variability withdecreasing volume of the lesion; however, this was notstatistically significant (P = 0.06). The skewness of thedistribution of d was low for all parameters (range —0.21to
0.11).These results indicate that two times the SD of d is a valid
estimate for the normal range of absolute changes in aparameter. The last two columns of Table 2 give thesenormal ranges for the various parameters with their 95%confidence intervals.
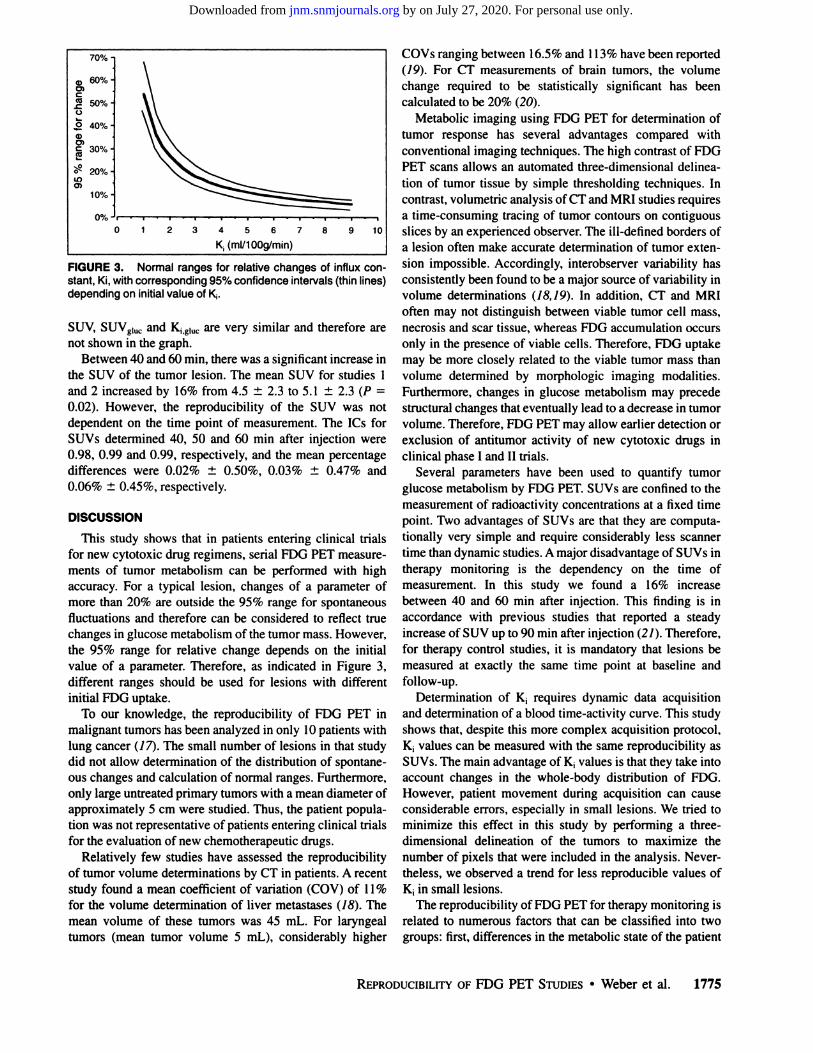
For therapy monitoring, relative changes in glucosemetabolism are more important than the absolute values.Because the normal range for absolute changes in a parameter remains constant, the normal range for relative changeswidens with decreasing initial value. Therefore, normalranges of relative changes in a parameter were calculateddepending on the mean value of the parameter in bothstudies. Figure 3 shows these normal ranges for K¡with thecorresponding 95% confidence intervals. The values for
1
0.75 -
0.5 -
? 0.25
0 O
1 -0.25 •
~° -0.5 -
-0.75 •
-3 -2 -1 0normal score
FIGURE 2. Probability plot of difference between measurements of a parameter at two time points, d, for influx constant,K¡(= dKi). Distribution of d shows no systematic deviation fromnormality.
1774 THE JOURNALOF NUCLEARMEDICINE•Vol. 40 •No. 11 •November 1999
by on July 27, 2020. For personal use only. jnm.snmjournals.org Downloaded from
a, 60%-o>
üS 40%-
O)e 30% H
5s 20%-ir>
0% Ji
0 34567
K,(ml/100g/min)
10
FIGURE 3. Normal ranges for relative changes of influxconstant, Ki, with corresponding 95% confidence intervals (thin lines)depending on initial value of K¡.
SUV, SUVg|UCand Kig|UCare very similar and therefore arenot shown in the graph.
Between 40 and 60 min, there was a significant increase inthe SUV of the tumor lesion. The mean SUV for studies Iand 2 increased by 16% from 4.5 ±2.3 to 5.1 ±2.3 (P =
0.02). However, the reproducibility of the SUV was notdependent on the time point of measurement. The ICs forSUVs determined 40, 50 and 60 min after injection were0.98, 0.99 and 0.99, respectively, and the mean percentagedifferences were 0.02% ±0.50%, 0.03% ±0.47% and0.06% ±0.45%, respectively.
DISCUSSION
This study shows that in patients entering clinical trialsfor new cytotoxic drug regimens, serial FDG PET measurements of tumor metabolism can be performed with highaccuracy. For a typical lesion, changes of a parameter ofmore than 20% are outside the 95% range for spontaneousfluctuations and therefore can be considered to reflect truechanges in glucose metabolism of the tumor mass. However,the 95% range for relative change depends on the initialvalue of a parameter. Therefore, as indicated in Figure 3,different ranges should be used for lesions with differentinitial FDG uptake.
To our knowledge, the reproducibility of FDG PET inmalignant tumors has been analyzed in only 10 patients withlung cancer (17}. The small number of lesions in that studydid not allow determination of the distribution of spontaneous changes and calculation of normal ranges. Furthermore,only large untreated primary tumors with a mean diameter ofapproximately 5 cm were studied. Thus, the patient population was not representative of patients entering clinical trialsfor the evaluation of new chemotherapeutic drugs.
Relatively few studies have assessed the reproducibilityof tumor volume determinations by CT in patients. A recentstudy found a mean coefficient of variation (COV) of 11%for the volume determination of liver métastases(¡8).Themean volume of these tumors was 45 mL. For laryngealtumors (mean tumor volume 5 mL), considerably higher
COVs ranging between 16.5% and 113% have been reported(79). For CT measurements of brain tumors, the volumechange required to be statistically significant has beencalculated to be 20% (20).
Metabolic imaging using FDG PET for determination oftumor response has several advantages compared withconventional imaging techniques. The high contrast of FDGPET scans allows an automated three-dimensional delinea
tion of tumor tissue by simple thresholding techniques. Incontrast, volumetric analysis of CT and MRI studies requiresa time-consuming tracing of tumor contours on contiguousslices by an experienced observer. The ill-defined borders of
a lesion often make accurate determination of tumor extension impossible. Accordingly, interobserver variability hasconsistently been found to be a major source of variability involume determinations (18,19). In addition, CT and MRIoften may not distinguish between viable tumor cell mass,necrosis and scar tissue, whereas FDG accumulation occursonly in the presence of viable cells. Therefore, FDG uptakemay be more closely related to the viable tumor mass thanvolume determined by morphologic imaging modalities.Furthermore, changes in glucose metabolism may precedestructural changes that eventually lead to a decrease in tumorvolume. Therefore, FDG PET may allow earlier detection orexclusion of antitumor activity of new cytotoxic drugs inclinical phase I and II trials.
Several parameters have been used to quantify tumorglucose metabolism by FDG PET. SUVs are confined to themeasurement of radioactivity concentrations at a fixed timepoint. Two advantages of SUVs are that they are computationally very simple and require considerably less scannertime than dynamic studies. A major disadvantage of SUVs intherapy monitoring is the dependency on the time ofmeasurement. In this study we found a 16% increasebetween 40 and 60 min after injection. This finding is inaccordance with previous studies that reported a steadyincrease of SUV up to 90 min after injection (21). Therefore,for therapy control studies, it is mandatory that lesions bemeasured at exactly the same time point at baseline andfollow-up.
Determination of K¡requires dynamic data acquisitionand determination of a blood time-activity curve. This study
shows that, despite this more complex acquisition protocol,K¡values can be measured with the same reproducibility asSUVs. The main advantage of K¡values is that they take intoaccount changes in the whole-body distribution of FDG.
However, patient movement during acquisition can causeconsiderable errors, especially in small lesions. We tried tominimize this effect in this study by performing a three-
dimensional delineation of the tumors to maximize thenumber of pixels that were included in the analysis. Nevertheless, we observed a trend for less reproducible values ofK¡in small lesions.
The reproducibility of FDG PET for therapy monitoring isrelated to numerous factors that can be classified into twogroups: first, differences in the metabolic state of the patient
REPRODUCIBILITYOF FDG PET STUDIES•Weber et al. 1775
by on July 27, 2020. For personal use only. jnm.snmjournals.org Downloaded from
that lead to a different whole-body distribution of FDG; and
second, spontaneous variability of glucose consumptionwithin the tumor mass.
The FDG accumulation in a tissue is proportional to thearea under the plasma time-activity curve of FDG. This
parameter determines the amount of tracer that is availablefor the tumor and reflects changes in the whole-body
distribution of FDG. The low variability of the area underthe blood time-activity curve in this study indicates thatchanges in the whole-body distribution were not a major
factor affecting the reproducibility of measurements.However, this may be different in patients who are imaged
during a therapy that changes the distribution volumes ofFDG. Hyperglycemia decreases the blood clearance of FDG,and hyperinsulinemia increases tracer uptake by insulin-sensitive tissues such as muscles (22-24). Thus, any form of
treatment that interferes with glucose metabolism of normalorgans (e.g., corticosteroids) will also indirectly affect FDGuptake by tumor tissue. Under these circumstances, measurement of the input function and calculation of influx constantsmay be preferable to the use of SUVs.
In addition to changes of the whole-body distribution of
FDG, hyperglycemia decreases the accumulation of FDG intumor tissue by competitive inhibition of transport andphosphorylation. Blood glucose normalization of FDG PETparameters has been proposed to compensate for this effect.This method has improved the differentiation of benign frommalignant tumors by SUVs (25). In this study, we did notobserve an improved reproducibility of glucose normalizedparameters (SUVg!uc and Klg,uc); this finding is probablyassociated with the minimal changes in blood glucose levelat scans 1 and 2. In principle, measurement of blood glucoseintroduces an additional source of error in the calculation ofa parameter. The COV for repeated measurements of bloodglucose by reagent strips is approximately 5% (26). Thus,the benefits of glucose normalization may be offset by errorsin blood glucose measurement when there are only smalldifferences in blood glucose levels at the time of the twoPET scans. However, for patients who display more markedchanges of their blood glucose levels during treatment,blood glucose normalization may be helpful (24). Moresophisticated laboratory techniques for measurement ofblood glucose levels may be used to further improve thereproducibility of FDG PET studies in these patients.Furthermore, fasting periods longer than the 4-h interval
used in this study may be required to achieve a stablemetabolic state in patients with impaired glucose tolerance(27).
Spontaneous changes in the glucose metabolism of atumor mass cannot be measured directly in patients. However, previous experimental and clinical studies indicate thatFDG uptake within a tumor mass may be influenced bynumerous factors. Tumor cell density, hypoxia, cellularproliferation and tumor grading have been shown to affectFDG uptake (28-30). Furthermore, non-neoplastic elements
of a tumor mass such as macrophages and granulation tissue
may accumulate considerable amounts of FDG (31). Thus,the source of the FDG signal measured by a clinical PETstudy is complex and may be influenced by factors otherthan the number of viable tumor cells. Accordingly, cyto-
toxic therapy may affect FDG uptake within the tumor massby mechanisms other than reduction of viable tumor cells.For example, radiotherapy has been shown to induceinflammatory reactions that may increase FDG uptake (32).Thus, the clinical usefulness of FDG PET for therapymonitoring has to be determined individually for differentforms of therapy and different tumor types.
Nevertheless, this study indicates that FDG PET meetsthree important requisites for successful therapy monitoring.First, the PET technique allows highly reproducible serialmeasurements of several parameters of tumor glucosemetabolism. Second, the measurements can be performedusing a relatively simple protocol. Third, spontaneousshort-term fluctuations in glucose metabolism of the tumor
mass appear to be low.When these encouraging results are used as a basis for
planning and analysis of therapy monitoring studies, severallimitations should be noted.
The normal ranges determined in this study are derivedfrom a group of patients with stable fasting blood glucoselevels. Therefore, the ranges should be used cautiously whenthere are markedly different blood glucose levels at the timeof baseline and follow-up PET scans. SUVs will be less
reliable under these circumstances.The reproducibility of FDG PET measurements may be
affected by lesion size. In fact, we observed a trend forhigher variability of K¡in smaller lesions. Therefore, thenormal ranges determined in this study should be appliedonly for lesions with similar sizes. However, most patientsundergoing neo-adjuvant or palliative chemotherapy or
radiotherapy present with advanced disease. In most of thesepatients there will be one or more lesions with sizes similarto those analyzed in this study.
The normal ranges of this study apply only to measurements that are repeated within a few days. After a longerinterval, changes in tumor size or spontaneous necrosis inrapidly growing tumors may induce considerably largerchanges in FDG PET measurements. However, effectivechemotherapy can cause a marked reduction in tumorglucose metabolism within 1 d (33). Thus, short-term
measurements of glucose metabolism for therapy monitoring appear feasible and may allow early differentiation ofresponding and nonresponding tumors.
The patient population of this study was heterogeneous,and only a limited number of tumor types were included.Furthermore, most lesions were located in the thorax. Thelow level of background activity in this area facilitates tumordelineation in FDG PET studies. The higher and morevariable level of background activity in other parts of thebody may lead to a higher variability of FDG PET measurements. Thus, future studies are warranted that evaluate the
1776 THEJOURNALOFNUCLEARMEDICINE•Vol. 40 •No. 11 •November 1999
by on July 27, 2020. For personal use only. jnm.snmjournals.org Downloaded from
normal ranges defined in this study for other tumor types andother localization of lesions.
CONCLUSION
This study shows that FDG PET provides several highlyreproducible quantitative parameters of tumor glucose metabolism, which underline the great potential of FDG PETfor response monitoring. The normal ranges for spontaneousfluctuations of a parameter determined in this study allowdefinition of criteria for a metabolic tumor response inindividual patients. These ranges also form the basis forplanning clinical trials that are aimed at detecting therapy-
induced changes in glucose metabolism with a given statistical power.
ACKNOWLEDGMENTS
The authors gratefully acknowledge the effort of thecyclotron and radiochemistry staff, the excellent technicalsupport by the PET technologists and the editorial help ofJodi Neverve in preparation of the manuscript.
REFERENCES
1. Rigo P, Paulus P, Kaschten B. et al. Oncological applications of positron emissiontomography with fluorine-18 fluorodeoxyglucose. £j/r7Mic/A/f</. 1996:23:1641-
1674.2. Avril N, Dose J. Janicke F. et al. Assessment of axillary lymph node involvement
in breast cancer patients with positron emission tomography using radiolabeled2-(fluorine-18)-fluoro-2-deoxy-D-glucose. J Nail Cancer Insl. 1996:88:1204-
1209.3. Avril N. Dose J. Janicke F. et al. Metabolic characterization of breast tumors with
positron emission tomography using F-18 fluorodeoxygluco.se. 7 Clin Oncol.1996:14:1848-1857.
4. Lowe VJ. Hoffman JM. DeLong DM. Patz EF. Coleman RE. Semiquantitative andvisual analysis of FDG-PET images in pulmonary abnormalities. J NucÃMed.1994:35:1771-1776.
5. Hoekstra OS, Ossenkoppele GJ. Golding R. et al. Early treatment response inmalignant lymphoma, as determined by planar fluorine-18-fluorodeoxyglucosescintigraphy. 3 NucÃMed. 1993:34:1706-1710.
6. Haberkorn U. Strauss LG. Dimitrakopoulou A, et al. Fluorodeoxygluco.se imagingof advanced head and neck cancer after chemotherapy. 7 NucÃMed. 1993:34:12-17.
7. Minn H, Soini 1. ['8F]fluorodeoxyglucose scintigraphy in diagnosis and follow up
of treatment in advanced breast cancer. Ear 7 NucÃMed. 1989:15:61-66.8. Torizuka T. Tamaki N. Inokuma T. et al. Value of fluorine-18-FDG-PET to
monitor hepatocellular carcinoma after interventional therapy. 7 NucÃMed.1994:35:1965-1969.
9. Rege SD, Chaiken L, HöhCK, et al. Change induced by radiation therapy in FDGuptake in normal and malignant structures of the head and neck: quantitation withPET. Radiology. 1993;189:807-812.
10. Janssen T. Westlin JE, Ahlstrom H, Lilja A. Langstrom B. Bergh J. Positronemission tomography studies in patients with locally advanced and/or metastaticbreast cancer: a method for early therapy evaluation? 7 Clin Oncol. 1995; 13:1470-
1477.11. Patz EF Jr. Lowe VJ, Hoffman JM, Paine SS. Harris LK, Goodman PC. Persistent
or recurrent bronchogenic carcinoma: detection with PET and 2-[F-18]-2-deoxy-D-glucose. Radiology. 1994:191:379-382.
12. Wahl RL. Zasadny K, Helvie M, Hutchins GD, Weber B, Cody R. Metabolic
monitoring of breast cancer chemohormonotherapy using positron emissiontomography: initial evaluation. 7 Clin Oncol. 1993:11:2101-2111.
13. Harnacher K, Coenen HH. Stocklin G. Efficient slereospecific synthesis ofno-carrier-added 2-[IiiF]-fluoro-2-deoxy-D-glucose using aminopolyether sup
ported nucleophilic substitution. 7 NucÃMed. 1986:27:235-238.
14. Ohtake T. Kosaka N. Watanabe T. et al. Noninvasive method to obtain input
function for measuring tissue glucose utilization of thoracic and abdominalorgans. 7NuclMed. 1991:32:1432-1438.
15. Patlak CS. Blasberg RG, Fenstermacher JD. Graphical evaluation of blood-to-brain transfer constants from multiple-time uptake data. 7 Cereb Blood FlowMetab. 1983:3:1-7.
16. Armitage P. Berry G. Statistical Methods in Medical Research. 3rd ed. Oxford,England: Blackwell Scientific: 1994.
17. Minn H. Zasadny KR. Quint LE, Wahl RL. Lung cancer: reproducibility ofquantitative measurements for evaluating 2-[F-18J-fluoro-2-deoxy-D-glucoseuptake at PET. Radiology. 1995:196:167-173.
18. Van Hoe L, Van Cutsem E, Vergole I, et al. Size quantification of liver métastasesin patients undergoing cancer treatment: reproducibility of one-, two-, andthree-dimensional measurements determined with spiral CT. Radiology. 1997:202:671-675.
19. Hermans R, Feron M. Bellon E, Dupont P, Van den Bogaert W, Baert AL.Laryngeal tumor volume measurements determined with CT: a study on intra- andinterobserver variability. Ini J Radial Oncol Biol Phys. 1998:40:553-557.
20. Mahaley MS Jr. Gillespie GY. Hammelt R. Computerized tomography brain scantumor volume determinations. Sensitivity as an objective criterion of response totherapy. 7 Neurosurg. 1990:72:872-878.
21. Hamberg LM, Hunter GJ. Alpert NM. Choi NC. Babich JW, Fischman AJ. Thedose uptake ratio as an index of glucose metabolism: useful parameter oroversimplification? 7 NucÃMed. 1994:35:1308-1312.
22. Minn H, Nuutila P, Lindholm P, et al. In vivo effects of insulin on tumor andskeletal muscle glucose metabolism in patients with lymphoma. Cancer. 1994;73:1490-1498.
23. Lindholm P. Minn H. Leskinen Kallio S. Bergman J. Ruotsalainen U. Joensuu H.Influence of the blood glucose concentration on FDG uptake in cancer: a PETstudy. J NucÃMed. 1993:34:1-6.
24. Langen KJ, Braun U, Rota Kops E, et al. The influence of plasma glucose levelson fluorine-18-fluorodeoxyglucose uptake in bronchial carcinomas. 7 NucÃMed.1993:34:355-359.
25. Avril N, Sense S. Ziegler SI, et al. FDG PET in breast cancer: quantitative imageanalysis. 7 NucÃMed. 1997:38:1186-1191.
26. Devreese K, Leroux-Roels G. Laboratory assessment of five glucose metersdesigned for self-monitoring of blood glucose concentration. Eur 7 Clin ChemClinBiochfm. 1993:31:829-837.
27. Diederichs CG, Staib L, Glatting G, Beger HG. Reske SN. FDG PET: elevatedplasma glucose reduces both uptake and detection rate of pancreatic malignancies.JNuclMed. 1998:39:1030-1033.
28. Clavo AC, Brown RS. Wahl RL. Fluorodeoxyglucose uptake in human cancer celllines is increased by hypoxia. 7 NucÃMed. 1995:36:1625-1632.
29. Minn H. Joensuu H, Ahonen A, Klemi P. Fluorodeoxyglucose imaging: a methodto assess the proliferative activity of human cancer in vivo—comparison withDNAflow cytometry in head and neck tumors. Cancer. 1988:61:1776-1781.
30. Haberkorn U, Strauss LO. Reisser C, et al. Glucose uptake, perfusion, and cellproliferation in head and neck tumors: relation of positron emission tomographyto flow cytometry. 7NuclMed. 1991:32:1548-1555.
31. Kubota R. Yamada S. Kubola K, Ishiwata K. Tamahashi N, Ido T. Intratumoraldistribution of fluorine-18-fluorodeoxyglucose in vivo: high accumulation in
macrophages and granulation tissues studied by microautoradiography. 7 NucÃMed. 1992:33:1972-1980.
32. Haberkorn U. Strauss LG. Dimitrakopoulou A, et al. PET studies of fluorodeoxy-
glucose metabolism in patients with recurrent colorectal tumors receivingradiotherapy. 7NuclMed. 1991:32:1485-1490.
33. Romer W. Hanauske AR, Ziegler S, et al. Positron emission tomography innon-Hodgkin's lymphoma: assessment of chemotherapy with fluorodeoxyglu-
cose. Blood. 1998:91:4464-4471.
REPRODUCIBILITYOF FDG PET STUDIES•Weber et al. 1777
by on July 27, 2020. For personal use only. jnm.snmjournals.org Downloaded from

1999;40:1771-1777.J Nucl Med. Wolfgang A. Weber, Sibylle I. Ziegler, Ralf Thödtmann, Axel-R. Hanauske and Markus Schwaiger Reproducibility of Metabolic Measurements in Malignant Tumors Using FDG PET
http://jnm.snmjournals.org/content/40/11/1771This article and updated information are available at:
http://jnm.snmjournals.org/site/subscriptions/online.xhtml
Information about subscriptions to JNM can be found at:
http://jnm.snmjournals.org/site/misc/permission.xhtmlInformation about reproducing figures, tables, or other portions of this article can be found online at:
(Print ISSN: 0161-5505, Online ISSN: 2159-662X)1850 Samuel Morse Drive, Reston, VA 20190.SNMMI | Society of Nuclear Medicine and Molecular Imaging
is published monthly.The Journal of Nuclear Medicine
© Copyright 1999 SNMMI; all rights reserved.
by on July 27, 2020. For personal use only. jnm.snmjournals.org Downloaded from