Reprisals Remembered: German-Greek Conflict and...
46
Working Paper No. 587 Vasiliki Fouka | Hans-Joachim Voth August 2016 Reprisals Remembered: German-Greek Conflict and Car Sales During the Euro Crisis
Transcript of Reprisals Remembered: German-Greek Conflict and...
Working Paper No. 587
Vasiliki Fouka | Hans-Joachim Voth
August 2016
Reprisals Remembered: German-Greek Conflict and Car
Sales During the Euro Crisis
Reprisals Remembered: German–Greek Conflict andCar Sales During the Euro Crisis∗
Vasiliki Fouka† Hans-Joachim Voth‡
August 2016
Abstract
Limited attention and selective memory are key behavioral factors identified in theliterature on cognitive biases and economic outcomes. We investigate how events triggerselective recall and thus change economic behavior. Following public disagreementbetween German and Greek politicians, Greek consumers drastically reduced theirpurchases of German automobiles – especially in areas affected by German reprisalsduring World War II. In response to contemporary political disagreements, Greeksliving in areas where German troops committed massacres curtailed their purchases ofGerman cars to a greater extent than those elsewhere. Current events can reactivatepast memories, having a first-order effect on purchasing behavior.
JEL Codes: D12, D74, F14, N14, N44
Keywords: consumer boycott, memory, political conflict, car sales, Euro crisis, German–Greek relations
∗For helpful suggestions we thank Alexander Apostolides, Leo Bursztyn, Ray Fisman, Nicola Gen-naioli, Yannis Ioannides, Tim Leunig, Guy Michaels, Stelios Michalopoulos, Nathan Nunn, Sonal Pandya,Elias Papaioannou, Luigi Pascali, Giacomo Ponzetto, and Nico Voigtlaender. Seminar participants atCREI, UPF, Harvard, the EREH-London conference, and the 12th Conference on Research on EconomicTheory and Econometrics (Naxos) provided useful advice. The Hellenic Statistical Authority kindly pro-vided car registration data. Voth received funding via ERC-AdG.†[email protected]‡[email protected]
1

The past is never dead. It’s noteven past.
—William Faulkner
1 Introduction
Theoretical research in behavioral economics posits that limited attention, fallible mem-ory, and salience all affect individual decision making.1 Models of limited attention typ-ically predict underreaction to news, and there is substantial empirical support for thisprediction. Investors, for example, often react slowly to earnings news released on Fridaysor on days when many other companies are reporting (DellaVigna and Pollet, 2009; Hirsh-leifer et al., 2009); similarly, consumers change their behavior only gradually in responseto the rankings of hospitals and colleges (Pope, 2009). Attention effects might play arole in the delayed adoption of new production techniques in developing countries (Dufloet al., 2011; Hanna et al., 2014).2 Also, savings can be increased by reminding peopleabout the importance of retirement savings (Karlan et al., 2016). Complementary re-search in macroeconomics has explored the implications of inattention for business cycles(Mankiw and Reis, 2002; Sims, 2003).
A closely related theoretical literature on memory limitations leads to the oppositeprediction – namely, that news can lead to sharp changes in behavior if it “brings back”memories of past events (Mullainathan, 2002).3 Such remembrance is more likely to occurif the current situation is similar to the past one, a scenario that encourages recall or (inthe language of cognitive psychology) “associativeness”. Some results in experimentalpsychology bear out the predictions of limited-memory models (Serman and Kim, 2002),yet there is no compelling evidence for any appreciable changes in economic behavior thatare due to a suddenly remembered past. There is also only limited evidence that eitherlimited attention or limited memory can have a significant effect on aggregate economicoutcomes.4
1Simon (1955); Kahneman and Tversky (1982); Akerlof (1991); Gabaix et al. (2006); Köszegi andSzeidl (2013); Schwartzstein (2014).
2Another prominent finding is that excise taxes, which are included in the final price, reduce demandmore than sales taxes, which are normally charged only at checkout (Chetty et al., 2009).
3Salience-based models such as those offered by Gennaioli and Shleifer (2010) and Bordalo et al.(2015) combine limited attention with limited memory; these models can accommodate both under- andoverreactions.
4One important exception are Malmendier and Nagel (2011) and Malmendier and Nagel (2016), whoshow that long-lingering memories of major economic upheavals such as the Great Depression or highinflation in the 1970s can influence expectations both at the individual and the aggregate level, and affect
2
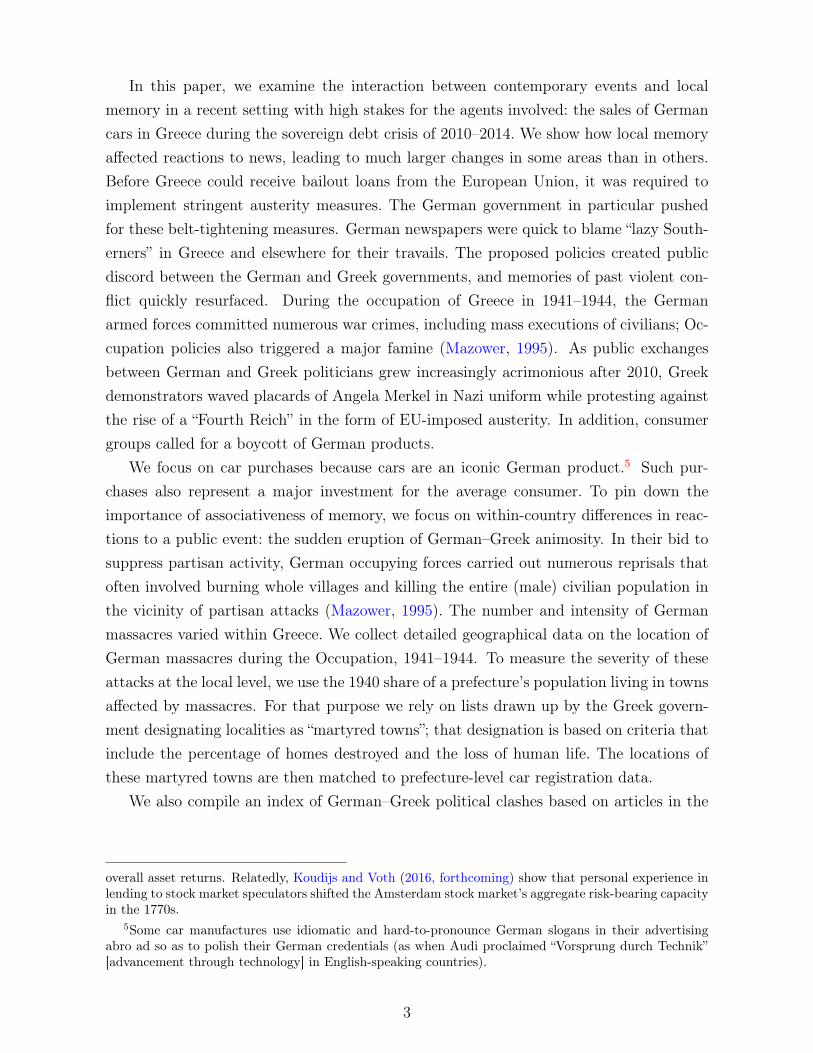
In this paper, we examine the interaction between contemporary events and localmemory in a recent setting with high stakes for the agents involved: the sales of Germancars in Greece during the sovereign debt crisis of 2010–2014. We show how local memoryaffected reactions to news, leading to much larger changes in some areas than in others.Before Greece could receive bailout loans from the European Union, it was required toimplement stringent austerity measures. The German government in particular pushedfor these belt-tightening measures. German newspapers were quick to blame “lazy South-erners” in Greece and elsewhere for their travails. The proposed policies created publicdiscord between the German and Greek governments, and memories of past violent con-flict quickly resurfaced. During the occupation of Greece in 1941–1944, the Germanarmed forces committed numerous war crimes, including mass executions of civilians; Oc-cupation policies also triggered a major famine (Mazower, 1995). As public exchangesbetween German and Greek politicians grew increasingly acrimonious after 2010, Greekdemonstrators waved placards of Angela Merkel in Nazi uniform while protesting againstthe rise of a “Fourth Reich” in the form of EU-imposed austerity. In addition, consumergroups called for a boycott of German products.
We focus on car purchases because cars are an iconic German product.5 Such pur-chases also represent a major investment for the average consumer. To pin down theimportance of associativeness of memory, we focus on within-country differences in reac-tions to a public event: the sudden eruption of German–Greek animosity. In their bid tosuppress partisan activity, German occupying forces carried out numerous reprisals thatoften involved burning whole villages and killing the entire (male) civilian population inthe vicinity of partisan attacks (Mazower, 1995). The number and intensity of Germanmassacres varied within Greece. We collect detailed geographical data on the location ofGerman massacres during the Occupation, 1941–1944. To measure the severity of theseattacks at the local level, we use the 1940 share of a prefecture’s population living in townsaffected by massacres. For that purpose we rely on lists drawn up by the Greek govern-ment designating localities as “martyred towns”; that designation is based on criteria thatinclude the percentage of homes destroyed and the loss of human life. The locations ofthese martyred towns are then matched to prefecture-level car registration data.
We also compile an index of German–Greek political clashes based on articles in the
overall asset returns. Relatedly, Koudijs and Voth (2016, forthcoming) show that personal experience inlending to stock market speculators shifted the Amsterdam stock market’s aggregate risk-bearing capacityin the 1770s.
5Some car manufactures use idiomatic and hard-to-pronounce German slogans in their advertisingabro ad so as to polish their German credentials (as when Audi proclaimed “Vorsprung durch Technik”[advancement through technology] in English-speaking countries).
3

leading Greek newspaper, Kathimerini. This index identifies an upsurge of conflict after2010, with several periods of extremely high public animosity. Public clashes between theGerman and Greek governments sharply reduced overall sales of German automobiles.Yet this effect was not uniform across Greece: in some areas, there was hardly any changein sales; elsewhere, a large decline was observed in the German market share. We findthat the greater the number and intensity of massacres in a Greek prefecture, the greaterthe decline in the German market share.
Figure 1 illustrates the timing and magnitude of effects. This figure plots the shareof articles devoted to contemporary German–Greek conflict alongside the difference –between reprisal and non-reprisal prefectures – in the market share of German autos.Until the outbreak of EU-related conflict, the average difference in German market sharebetween reprisal and non-reprisal towns fluctuated around 0. Thereafter, this gap becamelarge and negative, growing at an especially rapid pace during the period of maximumanimosity just after the Greek default in 2012. As the German Finance Minister and theGreek President publicly traded insults, the difference (between reprisal and non-reprisalprefectures) in the market share of German cars grew to more than 1 percentage point(approximately two standard deviations); it then took a year for that difference to vanish.
The effect is both large and significant. Once we take correlates into account, theeffect of a “conflict month” on the German car market share in areas with massacresbecomes even larger – rising to 3.4 percentage points. Since the pre-crisis market share forGerman manufacturers was 23 percent, it follows that the decline represents a persuasionrate of 15 percent.6 This value represents the additional decline of German market sharein massacre provinces, and the effect is large. Only five of the 24 studies surveyed byDellaVigna and Gentzkow (2009) have similar or higher persuasion rates. These resultssuggest that consumer behavior, even in the case of big-ticket items like cars, can respondstrongly to a combination of general public sentiment and local memories. Where earlierGerman atrocities became more salient as a result of current events, German car salesplummeted much faster than in other areas.
Areas with a history of political radicalization in the past - like higher Communist voteshares - show bigger declines in German car sales during the crisis. Where the right-wingradical party “Golden Dawn” won many votes, the backlash against German producers was
6The persuasion rate calculates the share of those “at risk” of changing their minds that actually do so;for details, see DellaVigna and Gentzkow (2009). In the case of German car sales in Greece, 77 percentof Greek car buyers were already intending to buy other brands. Hence these consumers could not maketheir displeasure known by refusing to buy German cars; only the 23 percent of buyers who had previouslyopted for German cars could stop doing so. So given this 23 percent pre-crisis market share, a decline of3.4 percentage points results in a 15 percent persuasion rate (since 3.4/23 = 14.8%).
4

also greater. In areas with numerous Facebook groups dedicated to boycotting Germanproducts, the German market share fell more during the crisis, and interaction effectswith our measure of past massacres are markedly larger. We also show that our findingsare robust to removing luxury cars from the sample – a key concern since many Germanmanufacturers specialize in high-end cars. We also examine the effect of using alternativemeasures of recent political conflict, and of reprisal status. The decline in German carsales does not reflect postponed purchases – car sales lost for German producers go toother manufacturers. Finally, we examine the effect of unobservables using the Altonjiet al. (2005) and Oster (2013) measures of coefficient change, and we use randomizationinference for determining significance levels.
Besides relating to the economics literature that addresses limited attention and mem-ory as possible causes of behavioral biases, our paper also has connections with twoother literatures. First, we contribute to research on cultural factors as a determinantof economic behavior. Attitudes can persist over long periods: Italian cities that wereself-governing in the Middle Ages are richer and more civic-minded today (Guiso et al.,2008), areas of Africa affected by 19th-century slave hunts exhibit lower present-day trust(Nunn and Wantchekon, 2011), and German cities that persecuted Jews during the BlackDeath were markedly more anti-Semitic, in the 1920s and 1930s, than other Germancities (Voigtländer and Voth, 2012). That being said, culture can also change quickly.For example: attitudes toward pre-marital sex have been transformed in the last century(Fernández-Villaverde et al., 2014); Islam changed from an open and tolerant religion to arelatively intolerant one (Chaney, 2016); and Franco–German conflict, recurring over twocenturies while seemingly rooted in cultural differences (Mann, 1916), has all but vanishedin the last 50 years. One of the key challenges in cultural economics is to develop a betterunderstanding of why cultural attitudes persist under some conditions but change underothers. In tracing the economic effects of culture, the literature has focused mainly onpersistent and long-term aspects. Thus, for instance, countries that fought numerous warsin the past trade less with each other in the present and also engage in less foreign directinvestment (Guiso et al., 2009). Likewise, the fertility behavior of immigrants’ children isaffected by their parents’ country of origin (Fernández and Fogli, 2006), language char-acteristics are associated with savings behavior (Chen, 2013), and inherited trust fromearlier generations can affect national growth rates (Algan and Cahuc, 2010). Underex-plored, however, is the extent to which cultural attitudes interact with political events tocreate short-term changes in economic behavior.
Second, we connect with the literature on political conflict, boycotts, and consumerbehavior. In an experimental study, Maheswaran and Chen (2006) show that, whenprimed with negative associations about a country, subjects are less likely to buy its
5
products.7 Boycotts are frequently used to articulate political views, and more thanhalf of the top US brands were targeted by a boycott in the period 1980–2000. Yettheir effectiveness is doubtful,8 because of mixed evidence that consumer behavior isdirectly influenced by calls for political action. For example, boycotts of French wineafter the country’s failure to support the US invasion of Iraq were probably ineffective(Ashenfelter et al., 2007).9 Teoh et al. (1999) report that the boycott of firms with SouthAfrican holdings had no clear effect on those firms’ stock prices. In general, the valuationsof firms targeted by boycotts are little changed (Koku et al., 1997). Counterexamplesinclude a decline in tourist visits by Americans to France after 2003 (Michaels and Zhi,2010), lower French car sales in China during the 2008 Olympics (Hong et al., 2011),and evidence that the sales of French-sounding products slumped following the Iraq War(Pandya and Venkatesan, 2016). The paper closest in spirit to ours is Fisman et al. (2014);these authors examine changes in the stock market values of Chinese and Japanese firmsafter a cooling of Sino–Japanese relations in 2005. Those relations deteriorated followingthe introduction of Japanese textbooks that downplayed war crimes committed duringJapan’s invasion of China in the 1930s. The stock prices of firms with more mainlandChinese sales exposure suffered more, and effects were strongest in industries with majorpublic-sector involvement. There was no effect on the stock prices of consumer goodsproducers.
We make three contributions to the existing literature. First, we document dramaticchanges as a result of time variation in the recall of memories as a function of a re-gion’s exposure (or not) to German war crimes that occurred seven decades prior. Wherepresent-day conflict with Germany could evoke negative memories, that conflict had agreater effect on consumer behavior. Second, we are among the first to present clearevidence that politically motivated conflict directly influences consumer behavior andthat location-specific interpretations of the past can modify these responses. Third, weshow that behavioral changes due to memory limitations can affect aggregate economicoutcomes, such as the market share of a major car-manufacturing nation.
The paper proceeds as follows. Section 2 describes the history and background ofGerman–Greek conflict since 1941; it also introduces our data sources. In Section 3 wesummarize the main results before presenting robustness checks and extensions. Section 4
7The heuristic of affect, or “gut feeling”, is often used by humans to guide their own behavior (Kah-neman, 2011) and could well have evolutionary origins (Boyd and Richerson, 1985).
8Sen et al. (2001) and John and Klein (2003) argue that free-rider problems make it difficult forboycotts to succeed.
9Although Chavis and Leslie (2009) conclude that French wine sales in the United States did sufferonce the war in Iraq started.
6

discusses mechanisms that might account for our findings. We conclude in Section 5.
2 Historical background and data description
In this section, we briefly summarize the history of German–Greek conflict during WorldWar II as well as the sovereign debt crisis starting in 2010. We also introduce the data oncar registrations and describe our measures of news-based conflict and German reprisals.
2.1 Germany’s wartime Occupation of Greece
In May 1941, Axis forces occupied Greece. The country was divided into three occupationzones, of which the largest was administered by Italy. Germany occupied less territorybut controlled crucial locations including Athens, Thessaloniki, and Crete. Bulgaria ad-ministered a relatively small part of the country close to its own borders. From thebeginning, the civilian population suffered from expropriations and plunder. The Germanarmed forces requisitioned foodstuffs on a vast scale, leading to a major famine during thewinter of 1941–1942. It is estimated that altogether 300,000 died, and the period survivesin Greek collective memory (Hionidou, 2006).
Throughout Eastern Europe, the German armed forces penalized civilian populationsin retaliation for partisan attacks. The shooting of potentially uninvolved civilians inareas of armed resistance was first authorized in April 1941 in Yugoslavia (Mazower,1995), and it became standard practice in anti-partisan operations. The High Commandof the German Armed Forces (OKW-Oberkommando der Wehrmacht) laid down precisequotas for reprisal killings: 100 civilians were to be shot for each German soldier killed ina partisan attack, 50 for each soldier wounded, and so forth.
In Greece, the first reprisals followed the capture of Crete (Nessou, 2009). GeneralStudent, the first German commander of Crete, instructed his forces to “leave aside allformalities and deliberately dispense with special courts”. In Kondomari, Crete, Germantroops shot 19 on 2 June 1941, after a German officer was killed (Meyer, 2002). Partisanattacks were often followed by indiscriminate shootings of civilians and the destruction ofevery village within a certain distance of the attack. By 1944, an estimated 2,000–3,000Greek civilians had been executed by German armed forces on Crete alone, and 1,600 (of6,500 in total) towns and villages had been destroyed (Nessou, 2009, p. 204).
After the Italian surrender in 1943, German forces took over the Italian-occupiedzone. Following this expansion of German-occupied territory, conflict between guerrillagroups (andartes ; mostly the Communist-led ELAS) and the Wehrmacht intensified. Forexample, the northwestern Greek town of Mousiotitsa saw 153 of its inhabitants killed,including women and children, on July 25, 1943, and another 15 localities in the area
7

were destroyed by the Germans (Nessou, 2009). Similarly gruesome massacres occurredin Kalavryta (in the Peloponnese) and in Distomo (near Delphi). After the war, theGreek Ministry of Reconstruction estimated that some 30,000 Greeks may have perishedin reprisal attacks by German forces (Doxiadis, 1947).10
Memories of Nazi massacres during the Occupation are never far from the surfacein Greece today. Family members of the victims of Distomo have sued for reparationpayments, taking their case to the German courts and to the International Court of HumanRights. Although Germany’s Constitutional Court dismissed the case in 2003, it wasrecently revived when an Italian court awarded victims’ descendants an Italian propertyowned by a German non-governmental organization. The case reached the InternationalCourt in 2012, at the height of the Greek debt crisis, and was featured prominently inthe Greek press.11
In Greece, four presidential decrees issued between 1993 and 2005 designated a numberof municipalities and communes as “martyred towns”. Localities in this category weredetermined – by a committee created in 1997 by the Ministry of Internal Affairs andPublic Administration – to have suffered large material and human losses during theperiod 1941–1944. The list of locations includes 78 towns, of which 72 were destroyed bythe Germans. Figure 2 shows the regional distribution of affected localities. All places onthe list of martyred towns suffered reprisals; they were not destroyed by bombing duringthe war or during the Allied invasion. Of the 72 destroyed towns, 54 witnessed massexecutions of civilians; the other 18 were burnt to the ground in retaliation for insurgencyattacks against German armed forces in their vicinity (Nessou, 2009). We construct aprefecture-level index of exposure to German reprisals as the share of the prefecture’stotal population in 1940 that lived in martyred localities. We adopt this approach becausedata on car registrations, our main dependent variable, are not available at a lower levelof aggregation than the prefecture.
2.2 German–Greek relations during the Greek crisis
The Greek sovereign debt crisis began in late 2009, when revised budget deficit figuresrevealed the country’s dire financial situation. This discovery led to successive downgradesof its credit rating. Eventually, with debt markets all but closed to the Greek government,an EU bailout became inevitable. From the beginning, the German government was skep-
10This figure does not include Jewish Greeks, shipped to death camps or murdered in Greece, norvictims of starvation.
11“The government in the Hague for Distomo”, Kathimerini, 13 January 2011.
8

tical of a financial rescue for Greece, emphasizing the scale of tax evasion and corruptionas key obstacles to any permanent improvement.12 It finally agreed to the bailout inexchange for harsh austerity measures. Greek public opinion accordingly saw Germanyas the instigator of foreign-imposed austerity. The reaction was immediate and intense:in February 2010, the Greek Consumers Association called for a boycott of German prod-ucts – explicitly highlighting the importance of cars.13 It also explained to consumershow barcodes could be read to identify German goods on supermarket shelves.
Incendiary press coverage amplified the animosity. German newspapers portrayedGreeks as lazy cheaters living it up at the expense of German taxpayers.14 The coverpage of a German weekly featured Aphrodite making a rude gesture; a tabloid urgedGreece to sell some of its islands to repay its debts.15 As the Greek economy contractedand unemployment surged amid severe cutbacks of government services and support pay-ments, anti-German sentiment in Greece deepened. In early 2012, Greek president KarolosPapoulias publicly complained that the entire country was being insulted by the Germanfinance minister Wolfgang Schäuble.16 During the 2012 visit of German chancellor An-gela Merkel to Athens, thousands of demonstrators filled the streets of Athens.17 Table 1summarizes the key events of this crisis.
After 2010, war crimes and unpaid German reparations were mentioned much morefrequently in the Greek press. Former foreign minister Stavros Dimas, addressing theGreek parliament in March 2011, reminded everyone that Greece never waived its rightto claim reparations and that a forced loan taken out by Germany during the Occupationhad not been repaid.18
An article in the English Daily Telegraph illustrates how past conflict grew in impor-tance after the start of the debt crisis. This piece profiled the life of Eleftherios Basdekis,who spent his “entire life beneath a German cloud”. A survivor of the Distomo massacre,he eventually built a successful trucking business that went bankrupt during the sovereigndebt crisis. The article also cited a mother from Distomo saying that she “hated Germany”,
12“German ‘no’ to facilitating the repayment of the 110 billion euros”, Kathimerini, 13 October 2010.Research based on Greek bank lending data illustrates the scale of unreported income, concluding thatas much as 30% of the country’s deficit may have been driven by tax evasion (Artavanis et al., 2016,forthcoming).
13Greek Consumers Association, 13 February 2012.14“Die Griechenland-Pleite”, Focus Magazine, Nr. 8, 2010.15“Verkauft doch eure Inseln, ihr Pleite-Griechen”, Bild, 27 October 2010.16“Greek president attacks German minister’s ‘insults’ ”, Reuters, 15 February 2012.17“Athens protests amid Angela Merkel’s visit”, BBC, 9 October 2012.18“The issue of German reparations is open but . . . ”, Kathimerini, 28 March 2012.
9
that Angela Merkel was “a monster”, and that the Germans “killed Distomo; they stoleour gold; they belittle Greece.” A bar owner is quoted as saying “five years ago, no onehad any problem with Germany. But now people are getting upset. The Germans say weare lazy, which is not fair.”19
As the Daily Telegraph piece illustrates, hatred of Germans resurfaced after the out-break of the debt crisis. In addition, Greeks from towns destroyed after 1941 often inter-preted recent acrimony in the light of that earlier conflict. We hypothesize that collectivememories of the German Occupation are more persistent in areas of Greece where Germantroops committed atrocities. The revival of these memories affects consumer decisions,magnifying a general decline in the post-crisis sales of German products.
We compile an index of conflict by counting newspaper articles that refer to politicaltensions between the two countries. An example from Lexis-Nexis illustrates our approach:Figure 3 shows the frequency of the joint occurrence of the words “anti-German” and“Greece” in articles appearing in international news media. This word pair is virtuallynonexistent prior to 2009, but thereafter the frequency count increases sharply beforepeaking in 2012 and 2013.
To obtain a measure of perceived German–Greek conflict within Greece, we computethe frequency of conflict-related articles in a leading Greek newspaper, Kathimerini. It isthe largest daily newspaper (by circulation) during the period under study, and its entirearchive of articles is digitized and available electronically. Our database comprises 101,889articles published under the sections “Greece”, “Politics”, and “Economy”. We compute themonthly share of articles related to German–Greek conflict using an approach similar tothe one described in Baker et al. (2013). Starting with a human-audited sample of articles,this procedure selects the terms that jointly best identify articles referring to German–Greek conflict. The resulting set of terms used to identify the relevant articles is the onethat performs closest to the “gold standard” of human readings.
Using this procedure, we classify an article as conflict-related if it contains the stem“german-” and at least one of the words in the set {haircut, summit, merkel, troika,eurozone}. Thus we derive a monthly count of conflict-related articles, which we normalizeby the total number of articles published in Kathimerini during the same month.20
Figure 4 shows the share of conflict-related articles for the period 2008–2014. Weplot two series: the raw article share; and the cyclical component after Hodrick–Prescott(HP) filtering. The latter allows us to distinguish between short-term fluctuations andslow-moving shifts in media attention. In the main empirical section, we will use the
19Interview in the Daily Telegraph, 11 February 2012.20See the Data Appendix for details on the algorithm used to select terms.
10

HP-filtered cyclical component. In the robustness section, we show that results are notmaterially affected either by using instead the raw share or by alternative methods ofdistinguishing trends from cyclical components.
2.3 Car registrations
Aggregate car sales in Greece slumped after the start of the financial crisis. Annualunit sales had totalled close to 180,000 before 2007. By 2011, with the Greek economycontracting rapidly, car sales fell to barely 60,000 per annum, a decline by almost two-thirds. Analysing sales trends of cars in Greece is complicated by the fact that Germancar manufacturers performed strongly over the last decade. World-wide, the share ofGerman brands has been rising. This partly reflects the recovery of Volkswagen sales andthe significant decline in Toyota’s market share.21 Figure 5 compares the share of Germancars in the Greek car market with that in the European market as a whole. The overalltrend is broadly similar.
The Greek Ministry of Transport and Communications collects data on registrationsof new passenger vehicles. These are disseminated by the Hellenic Statistical Authority(ELSTAT). We use monthly data on the number of new passenger vehicles registered ineach prefecture for the period from January 2008 to December 2014, by manufacturingplant. The raw data from ELSTAT does not contain information on the brand of regis-tered vehicles. However, ELSTAT provides a correspondence list that allows us to matchproduction plants to car manufacturers. This correspondence does not always distinguishbetween brands produced by the same manufacturer. This is true for the Daimler group,producer of both Smart and Mercedes vehicles, and for the Fiat group, which also pro-duces Alfa Romeo and Lancia. Despite this issue, we are able to distinguish German fromnon-German brands in our sample; the former include Volkswagen, Opel, Audi, BMW,Porsche and the brands of the Daimler group.22 For our purposes, a car’s “nationality" isnot determined by ultimate ownership of the company, but the place of manufacture of(most) cars – we count Seat as a Spanish car maker despite the fact that it is owned byVolkswagen.23
Table 2 summarizes our data. Toyota has the highest sales, followed by Opel andVolkswagen. To compare like with like, we exclude small manufacturers with less than 10
21“VW conquers the world”, The Economist, 7 July 2012.22Data on vehicle registrations are available from January 2004 on, but we are unable to distinguish
German brands in the earlier sample, due to the fact that Daimler was also the owner of Chryslers.23To the extent that Seat is actually perceived as German, we will understate the shift away from
German cars, biasing our results downwards.
11

vehicles sold in the total period 2008–2014. Many German cars are luxury products. Thesemay suffer greater declines in sales as a result of the crisis. To avoid biasing our resultsupwards, we repeat key parts of the empirical analysis for the “Volkswagen category” only.This is composed of a group of manufacturers focusing on compact vehicles, and mid-sizedfamily cars. We include the following brands: Volkswagen, Opel, Citroen, Ford, Honda,Hyundai, Nissan, Peugeot, Renault, Seat, Skoda, Toyota.
Unfortunately, there is no good data for the immediate post-war period on car regis-trations. This makes it harder to show that German car sales were initially weak after1945 – and all the more so in areas with massacres. The only data we have that is dis-aggregated by car manufacturer was compiled by ELSTAT for 1961, and is available for11 transport areas (instead of 51 prefectures). There, areas with above-median shares ofpopulation affected by massacres showed a four percentage point gap in German marketshares (23.6 vs 26.5%). This is in line with our hypothesis, but the data are inherentlynoisy due to aggregation issues.
2.4 Data descriptives, control variables and balancedness
Our dataset contains information on 51 prefectures over the period January 2008 toDecember 2014. The main features of the data are summarized in Table 3. Massacresduring the German Occupation occurred in 21 out of 51 prefectures, equivalent to 41%of the sample. The share of the (pre-war) population living in towns and villages laterdestroyed serves as our main explanatory variable. On average, a little more than onepercent of Greeks in 1940 were so affected; Fokida, on the Northern shore of the Gulf ofCorinth, is the worst-affected prefecture with a share of 12%. The average prefecture inour sample saw monthly sales of 211 cars during the period; sales were as low as zeroin some prefectures, and could reach as many as 16,365 cars per month in Athens. Theshare of German cars sold was on average 28%; especially in the smaller prefectures, theshare fluctuates strongly from month to month, and in some cases, it can reach either 0 or100%. Finally, the share of articles in Kathimerini that refer to tension in Greek-Germanrelations during the 2008–2014 period is 6.2%.
Our main control variables come from the 2001 Greek Census and Eurostat. Theyinclude population size, employment in agriculture and industry, the share of civil ser-vants, education, the unemployment rate and GDP per capita. Table 4 compares thesevariables for prefectures with and without reprisals. Overall, there are few meaningfuldifferences between the two groups – the share of employment in agriculture is similar, asis the proportion of the labor force in industry. The share of civil servants, a group thatwas hit hard by the crisis, is almost identical. Education levels are also comparable – thelargest difference is for the share of citizens with secondary education (19% in reprisal
12

prefectures, 17% in the others). Unemployment rates differed by one percentage point,with a baseline of 12%.
Importantly for our setup, and given the high levels of autocorrelation in the shareof German cars, the pre-crisis levels of this variable are orthogonal to reprisal status(Bruhn and McKenzie, 2009). The first differences in the German car share are alsoidentical across prefectures with and without massacres. This indicates that there are nodifferential pre-crisis trends in car sales, which is crucial for the validity of our differencein differences specification.
There are no significant differences between reprisal and non-reprisal prefectures exceptfor per capita income and the share of population with secondary education. Education ishigher in reprisal prefectures, and the income difference is small. It is more plausible thatthe location of partisan attacks and subsequent retaliation by German troops was affectedby geography. Ruggedness is positively correlated with reprisals. More rugged terrainprovided cover for the partisans, whose operational bases often lay in the mountains ofCentral and Northern Greece. Distance from a main road is also (negatively) correlatedwith reprisals. This reflects the German tactic of punishing villages in the vicinity ofa partisan attack, many of which occurred near roads and bridges. Though roads seemto a be predictor of reprisals, railways are not. Finally, the share of seats that eachprefecture allocated to the Communist Party in the 1936 parliamentary elections is verysimilar between reprisal and non-reprisal prefectures. Communist-dominated ELAS wasthe main guerilla group during the Occupation, and its activities might have been morewelcome in prefectures that showed more Communist support. Ideological preferences arenot correlated with the location of military action. We will control for the above variablesin all our empirical specifications.
3 Empirical analysis
In this section, we present our main empirical result – the dramatic decline in German carsales during the German-Greek crisis in prefectures affected by World War II massacres,compared with sales in other areas. The robustness section shows that our conclusions arenot affected if we remove luxury cars from our analysis, or if we use alternative measuresof German-Greek conflict, or of the scale of German atrocities.
3.1 Baseline results
How much greater was the decline in German car sales in areas of Greece that sufferedWWII massacres? We estimate difference–in–differences regressions of the form:
13
yjt = α + λt + β1Ct + β2Dj + γCt ∗Dj +Xjδ + εjt (1)
yjt is the seasonally adjusted share of vehicles of German manufacturers registered inprefecture j at time t, computed as the difference from its 12–month lag. λt are year fixedeffects, Ct is the HP–filtered share of conflict–related Kathimerini articles, Dj is the shareof the prefecture’s 1940 population that lived in towns affected by German reprisals, andXj is a vector of prefecture controls. The coefficient γ measures the differential effect ofa percentage point increase in conflict-related news articles for prefectures with a largershare of 1940 population affected by German atrocities.
Table 5, reports baseline estimates for all car brands. The effect of conflict is sys-tematically and significantly larger in areas that suffered German reprisals. This result isunaffected when we add our set of standard controls in column (2). The magnitude of theinteraction coefficient is quantitatively important: the estimated interaction coefficientimplies that, at the peak of the Greek-German conflict, a one standard deviation increasein the share of affected population in reprisal prefectures leads to an additional drop of2.8 percentage points in the share of German cars.
In column (3) we control for prefecture fixed effects, to deal with time–invariant un-observable characteristics that might affect car sales and correlate with reprisal status.This increases the magnitude of the interaction coefficient. Column (4) adds interactionsof the baseline controls with the share of conflict–related articles to the regression setup.Since we are not able to control for prefecture observables that vary at a monthly fre-quency, this allows us to proxy for the effects of conflict that differ across prefecturesand depend on observable characteristics other than the share of population affected byreprisals. Adding these interactions does not affect the results: during peak conflict, astandard deviation increase in the share of the population affected by reprisals leads to anadditional drop of 3.4 percentage points in the German car share. Column (5) estimatesan alternative specification, controlling for prefecture fixed effects and prefecture-year in-teractions. Including these further increases the size of the coefficient of the interactionterm.
The magnitude of the interaction effects is best judged graphically. Figure 6 plots themarginal effect of an increase in the share of conflict–related articles, by tercile of 1940population affected by reprisals. In areas with few reprisals (left panel), the market shareof German cars declines only a little as the share of conflict-related articles increases.In prefectures that saw many massacres (right panel), higher shares of conflict articlesquickly spell lower market share for German producers. At the maximum observed articleshare, the implied decline in high-reprisal areas is almost 5% year-on-year; in the areaswith few reprisals, it is barely one fifth, and indistinguishable from zero. The difference
14
in slopes between the two groups is also statistically significant.
3.2 Robustness
In this section, we examine the robustness of our results to alternative samples and alter-native measures of conflict and reprisals. We also explore the sensitivity of our estimatesto the inclusion of controls.
3.2.1 Removing luxury cars
Table 6 repeats the baseline analysis for cars in the Volkswagen category. German man-ufacturers produce a large share of luxury cars. One potential concern is that a drop inthe German share is really a fall in the share of luxury cars in total sales, reflecting theseverity of the economic downturn. This is not what our results suggest. After removingluxury cars from the sample, both the total and the differential drop between reprisal andnon-reprisal prefectures in the German car share in response to conflict become larger. Inthe VW category, the differential effect of a standard deviation increase in the share ofthe affected population on the German car share during the peak of the conflict rangesbetween 4.6 and 5.7 percentage points. This is an economically large shift, particularlyfor a durable good and over a short period of time.
3.2.2 Measures of political conflict
Next, we examine the robustness of our findings to different measures of political tension.Our preferred measure is the HP–filtered share of conflict-related articles in Kathimerini,which captures short-term fluctuations in political conflict. In column (1) of Table 7,we use instead the raw share of conflict-related Kathimerini articles. This specificationis comparable to column (4) of Table 5. The interaction coefficient is almost identical,irrespective of the transformation used. In column (2) we measure conflict by the deviationof the article share from a 3-month moving average. This is an alternative way of capturingshort-term deviations from a smoothed series and it produces a slightly smaller coefficient,which remains significant at the 10% level.
Next, we construct an alternative index of political conflict based on web search terms.We use data from Google Trends during the period 2008–2014. The alternative index isbased on the following terms: “Germans”, “German reparations” and “Distomo” (onlysearches that were conducted in the Greek language, in Greece). The index value fromGoogle Trends is a normalization of the share of total searches represented by a term in
15

a given time and region.24 The term “Germans” peaks in October 2011, the month whenthe haircut of the Greek debt was announced, and it fluctuates in high levels thereafter.
For each of the terms above we compile a monthly search index from Google for theperiod 2008–2014 and aggregate them into a single measure, ranging from 0 to 100. Thevalue of the index is practically zero until early 2010. Figure 7 plots the cyclical componentof this index, using the HP filter, alongside the HP-filtered Kathimerini conflict-relatedarticle share. The Google index fails to capture the initial spike in conflict-related articlesin early 2010. Thereafter, both series are highly correlated. The overall correlationcoefficient is 0.426 (p-value 0.0001). We repeat our main analysis using the Google indexas a continuous measure of conflict in column (3) of Table 7. The interaction term isnegative and significant at the 1% level. A standard deviation increase in the Googleindex increases the difference between the average reprisal and non-reprisal prefecture by0.5 percentage points. Column (4) uses the HP-filtered version of the index, and producesa similar coefficient – slightly smaller in magnitude, but more noisily estimated. Overall,the results suggest that irrespective of the type of indicator used to proxy for the time-varying intensity of political conflict, there is strong evidence of a differential effect on carpurchasing according to reprisal status.
3.2.3 Measures of reprisal status
In Table 8 we explore sensitivity of our estimates to a number of alternative definitions ofreprisal status. In all regressions, we control for prefecture fixed effects and interactions ofprefecture fixed effects with the share of conflict related articles. In columns (1) and (2)we use a binary measure of reprisal status. While having at least one town that sufferedreprisals during the German Occupation leads to a drop in German car registrations withhigher conflict, the effect is not significantly different from zero. When we focus on theupper quartile by population affected by reprisals (column 2), the interaction effect ofarticle share and reprisal status becomes large and significant.
In column (3), we use an alternative measure of wartime destruction. This is the shareof each prefecture’s 1940 building stock that was destroyed in the years 1941–1944. It iscorrelated with the extent of German reprisals, but it is a noisier proxy that also reflectsother types of wartime destruction. According to the Subministry of Reconstruction(1946), which provides the data for the construction of this variable, German reprisalmeasures were responsible for one fourth of the total number of buildings destroyed. The
24Only terms with hits above a certain threshold are considered for the construction of the index. Asa result, the index often takes on the value 0 when the search volume for a term is low.
16
rest was destroyed by wartime bombing, razed to make space for fortifications, or affectedby Bulgarian reprisals in their zone of occupation. The interaction coefficient is negative,but not significant. While not every reprisal variable is significant on its own, they all yieldnegative interaction coefficients. We can aggregate these different measures of wartimesuffering by using principal component analysis. In column (4) we use the first principalcomponent of i. the share of 1940 population affected by reprisals, ii. the share of 1940towns that experienced massacres, and iii. the share of housing destroyed between 1941–1944. A one standard deviation increase in the principal component measure leads to a2.5 percentage points differential drop in the German market share during the month ofhighest conflict.
3.2.4 The potential effect of unobservables
One of the potential weaknesses of our analysis is the paucity of high-frequency, prefecture-level control variables. To gauge the potential effect of unobserved variables, we implementthe method of Altonji et al. (2005), refined by Oster (2013), of examining how much thecoefficient of our main variable of interest changes when we add control variables – andthen ask how big the effect of unobservables on the key variable’s coefficient would haveto be for results to become insignificant. In the unrestricted regression, we use no controlsother than year fixed effects; in the first exercise, we use prefecture level fixed effects andinteractions of the share of conflict-related articles with our set of baseline controls (Table5, column (4)). Subsequently, we also add interactions of prefecture and year fixed effects(Table 5, column (5)).
Table 9, Panel A, presents the results for the Altonji approach, for both the full andthe Volkswagen sample. For the baseline specification and the full sample, the effect ofunobservables would have to be almost 6 times larger than the effect of the existing con-trol variables (and act to the opposite direction) before the interaction effect between theconflict month and the reprisal prefecture dummy becomes zero. This ratio is practicallythe same for the VW category. These large ratios capture the fact that our estimatedcoefficient is largely unaffected when we add controls. In the most parsimonious speci-fication with prefecture-year interactions, the Altonji ratio in the VW category is 3.4 –again, this implies that only variables that are much stronger than existing controls couldreduce the key effect to insignificance.
Oster (2013) develops the Altonji approach further by taking into account the explana-tory power of additional controls – adding controls that do not change the coefficient ofinterest, while also not raising the share of variance explained, should not count as asign of stability. Oster (2013) defines a degree of proportionality between observable andunobservable variables, which she denotes by δ, and suggests that researchers assess the
17
bias introduced by unobservables by computing the value of δ which would be necessaryto produce a treatment effect of zero. Higher values of δ imply more robust estimates.Panel B reports the results based on this approach. The values of δ needed to producea zero estimate of the interaction coefficient range between 0.63 and 0.82. In all cases,δ < 1, which implies that observables are more important in explaining the variance of theinteraction of conflict and reprisal status; the magnitude of δ is large and reasonably closeto 1, the value of δ computed by Oster (2013) for studies that are more likely to be vali-dated by randomized trials. Overall, there is little evidence to suggest that unobservablesmay be responsible for our results.
3.2.5 Randomization inference
To avoid possible problems with using asymptotic assumptions for inferring significance,we use randomization inference (Kempthorne, 1955; Young, 2015). Table B.2 in theappendix shows the results of performing 500 random permutations of the dependentvariable, and re-running the regressions in Table 5 with the existing (not-permuted) ex-planatory variables. The significance level reported in parentheses is the percentage ofestimated coefficients that is higher than the OLS coefficient. We also report the 95%confidence interval for the statistical significance in brackets. Results are very similar tothe ones reported under OLS assumptions overall.
4 Mechanisms
In this section, we discuss potential mechanisms behind our findings, by estimating ourmain specification in different subsamples of the data. We then examine for how long theeffects of German-Greek conflict are visible in the data and attempt to assess whetherGreek consumers substitute German cars with different brands or simply put off theirpurchase for the future.
4.1 Subsamples
Table 10 examines what characteristics of Greek prefectures are associated with a particu-larly pronounced backlash during the crisis in German-Greek relations. We subdivide thesample according to the structure of employment, education levels, unemployment levels,and several measures of political preferences. Coefficients for both the article share andthe interaction effect with population in massacred towns are negative in all subsamples.We find stronger and more tightly estimated interaction effects in areas that are moreindustrial, have lower levels of education, more unemployment in 2011 and experience alower increase in unemployment between 2008 and 2011. Areas with more votes for the
18
Golden Dawn, a neo-Fascist party campaigning on a strongly nationalistic and xenopho-bic platform, show both a larger drop in the German share and a bigger difference inthe drop by reprisal status. A history of political radicalism is similarly associated withbigger interaction effects. In Table 10, column (8), we show that areas that supported theCommunist Party before 1940 have stronger reactions to German-Greek conflict today.25
Finally, we also find stronger, more tightly estimated effects for areas with slowerpopulation growth after 1940. Since most of the differences in population growth reflectmigration, this suggests that the grip of the past in crisis times is strongest in areas withlow in-migration (or net outflows); areas that gained population (as a result of migrationfrom the rest of the country) show no clear interaction effect.26
4.2 De-friending Germany
Was anti-German sentiment really growing more rapidly in prefectures with (many) WorldWar II massacres, as the evidence from car sales suggests? To explore this issue further,we use data from Facebook. During the conflict period, some 40 groups dedicated toboycotting German products sprang up on the social networking site. We identifiedthem in 2014 through the use of the phrases “boycott German products”, “boycott foreignproducts” or “boycott Germany”. For each member of an open group, we obtain theirgeo-coded location (based on the entry for “current city”). This gives us data on 1,900boycott group members. We sum these by prefecture and normalize by the prefecture’spopulation. Figure 8 summarizes the spatial distribution of membership. Prefectures thatwitnessed major massacres, such as Achaia and Viotia, belong to the highest quartile ofthe distribution of Facebook boycott groups.
In Table 11, we partition the sample into areas with above and below median par-ticipation in anti-German facebook groups.27 More articles about German-Greek conflictis always negative for market share, but the coefficient is not tightly estimated in allspecifications. The interaction coefficient is large and significant for all prefectures withabove median membership (col. 4-6) of anti-German boycott groups. In those with below-median participation (1-3), we find no significant results, and two coefficients are actually
25One plausible but incorrect interpretation of this pattern would be the following: Communist areassupport the main partisan group more enthusiastically; hence they suffer more at the hands of the Germanforces, and they react more negatively today. This is not borne out by the data – if anything, areas withmore Communist votes in 1936 suffered fewer massacres during 1941-44 than the rest.
26This finding is similar to the result in Voigtländer and Voth (2012), who show that anti-Semitism inGermany persisted strongly in areas with low population growth.
27We cannot repeat our main analysis using Facebook membership as the dependent variable since thetime of joining a boycott group is not available.
19

positive. This suggests that the boycott of German cars was part of a broader backlashagainst the country.
4.3 Explaining the shift in market share
One possibility is that consumers simply postpone purchases of German cars. In thatcase, a lost sale in one month will be made up by additional sales in later months. Whilethe basic finding would still hold, the interpretation would be different – and the overalleconomic relevance would be less.
To deal with the possibility that purchases are postponed, we use a triple-differencespecification, with log car sales as the dependent variable. Table 12 reports the results ofthis exercise, starting from a baseline specification of the form
log(yijt) = α + λt + β1Ct + β2Dj + β3Gi + γ1Ct ∗Dj + γ2Ct ∗Gi
+ γ3Dj ∗Gi + δ(Ct ∗Dj ∗Gi) +Xjπ + εijt
and successively adding a number of fixed effects and their interactions. Here, Gi is adummy that takes on the value 1 if brand i is German. The first thing that one can observeis that there is no significantly large drop in car sales in response to heightened conflict,neither for German nor for non-German brands. This can be read as an encouragingindication that our measure of conflict is specific to German-Greek relations and does notmainly capture bad news about the Greek economy. However, the triple-difference coeffi-cient, which captures the effect of conflict on the gap between German and non-Germancars in reprisal vs non-reprisal prefectures is always negative and highly significant.
If consumers in reprisal prefectures substituted German cars for non-German ones, wewould expect non-German cars to rise in these prefectures in response to an increase inthe share of conflict-related news articles. Indeed, the interaction coefficient of a conflictmonth with the share of the population affected by reprisals captures just that. It ispositive in all specifications, though it loses in significance as more fixed effects are added.Furthermore, its magnitude makes up for the entire extra drop that German car salesexperience in reprisal prefectures. These results support the hypothesis that substitutionis taking place. People are not simply waiting to buy their VW, they are buying a Peugeotinstead.
For how long does public conflict affect consumer behavior? It could well be thateven in regions with a history of reprisal attacks, the effects of German-Greek conflictare short-term in nature, and disappear quickly. In that case, one interpretation of ourresults would be that even in places with a strong disposition towards animosity, not evensevere public conflict can affect behavior for long – in line with the general conclusion in
20

the boycott literature that effects are small at best.As Figure 1 showed, the difference in market shares between massacre and non-
massacre provinces grew to more than one percentage point at the height of the German-Greek crisis. Thereafter, the gap narrowed once more, fluctuating around zero. The gaponly vanished some 12 months after the onset of major conflict. There is certainly noevidence that the effect dissipates quickly after the peak of the crisis.
5 Conclusion
We examine consumer behavior in Greece during the Euro debt crisis that started in2010. In exchange for loans from from EU partners, the country was required to implementsevere budget cuts. Germany in particular insisted on stringent austerity measures. Publicspats between German and Greek politicians deepened the impression of deeply rootedantagonisms. The Greek public, when protesting, used Nazi-era symbols to express itsoutrage about German demands for more spending cuts and the perceived unfairness ofconditions imposed on Greece. As numerous articles in the German press blamed thecrisis on “lazy foreigners”, the Greek press published a growing number of articles aboutGerman massacres during World War II and the case for reparation payments.
These events affected consumer spending in Greece: German car sales suffered inmonths of conflict. Of greater importance is that the decline in German market sharevaried by region. Areas subjected to harsh Occupation-era reprisals (such as the torchingof villages and killing of civilian populations) saw the sharpest declines in German marketshare. Prefectures without major German war crimes during the Occupation experiencedeither much smaller declines or none at all. Thus public conflict today mattered more foreconomic behavior when it interacted with an earlier history of conflict. In this way, pastconflict can beget more acrimony in the present.
The case of German–Greek conflicts illustrates the extent to which memory can be-come important for actual purchasing behavior. The most notable feature of our empiricalsetting is the increasing divergence between areas with initially similar purchasing pat-terns. German war crimes during the Occupation are common knowledge in Greece.What distinguishes areas of high versus low reprisal activity are either individual mem-ories of past conflict or the personal, intergenerational transmission of such memories.In line with theoretical work by Mullainathan (2002) and related research in psychol-ogy (Schacter, 1996), we find evidence for “associativeness” being important. So in areaswhere contemporary events brought back negative memories, behavioral changes weremuch greater. As stated by the German philosopher Karl Jaspers: “The past illuminatesthe present.”
Our evidence also illustrates the reconstructive nature of memory; in other words,
21

people remember those aspects of the past that reduce their cognitive dissonance. Aspectsthat do not fit the preferred explanatory model are more likely to be forgotten (Bartlett,1932; Akerlof and Dickens, 1982). The revival of massacre memories in Greece is a casein point. Memories of the past conflict had become practically irrelevant in the post-warperiod, and German–Greek diplomatic relations were amiable when Greece joined theEuropean Union. Yet the debt crisis acted as a catalyst that revived memories of pastwar crimes, in large part because this dynamic helped to tell consistent stories about thepresent.
ReferencesAkerlof, G. A. (1991). Procrastination and Obedience. The American Economic Re-view, 81 (2), 1–19.
— and Dickens, W. T. (1982). The Economic Consequences of Cognitive Dissonance.The American Economic Review, 72 (3), 307–319.
Algan, Y. and Cahuc, P. (2010). Inherited Trust and Growth. American EconomicReview, 100 (5), 2060–92.
Altonji, J. G., Elder, T. E. and Taber, C. R. (2005). Selection on Observed and Un-observed Variables: Assessing the Effectiveness of Catholic Schools. Journal of PoliticalEconomy, 113 (1), 151–184.
Artavanis, N., Morse, A. and Tsoutsoura, M. (2016, forthcoming). MeasuringIncome Tax Evasion Using Bank Credit: Evidence from Greece. The Quarterly Journalof Economics.
Ashenfelter, O., Ciccarella, S. and Shatz, H. J. (2007). French Wine and theU.S. Boycott of 2003: Does Politics Really Affect Commerce? NBER Working Paper13258.
Baker, S., Bloom, N. and Davis, S. J. (2013). Measuring Economic Policy Uncer-tainty. Chicago Booth Research Paper 13-02.
Bartlett, F. (1932). Remembering. Cambridge: Cambridge University Press.
Bordalo, P.,Gennaioli, N. and Shleifer, A. (2015). Memory, Attention and Choice.Mimeo, Harvard University.
Boyd, R. and Richerson, P. J. (1985). Culture and the Evolutionary Process. Chicago:University of Chicago Press.
Bruhn, M. andMcKenzie, D. (2009). In Pursuit of Balance: Randomization in Practicein Development Field Experiments. American Economic Journal: Applied Economics,1 (4), 200–232.
Chaney, E. (2016). Religion and the Rise and Fall of Islamic Science. Mimeo, HarvardUniversity.
22

Chavis, L. and Leslie, P. (2009). Consumer Boycotts: The Impact of the Iraq War onFrench Wine Sales in the U.S. Quantitative Marketing & Economics, 7 (1), 37–67.
Chen, M. K. (2013). The Effect of Language on Economic Behavior: Evidence fromSavings Rates, Health Behaviors, and Retirement Assets. American Economic Review,103 (2), 690–731.
Chetty, R., Looney, A. and Kroft, K. (2009). Salience and Taxation: Theory andEvidence. American Economic Review, 99 (4), 1145–1177.
Danielson, J. and Gesch, D. (2010). Global Multi-Resolution Terrain Elevation Data2010, (GMTED2010), Open File Report, U.S. Geological Survey.
DellaVigna, S. and Gentzkow, M. (2009). Persuasion: Empirical Evidence. AnnualReview of Economics.
— and Pollet, J. M. (2009). Investor Inattention and Friday Earnings Announcements.The Journal of Finance, 64 (2), 709–749.
Doxiadis, C. (1947). Thysies tis Ellados: Aitimata kai Epanorthoseis ston B’ PagosmioPolemo. Report 19, Hellenic Ministry of Reconstruction, Athens.
Duflo, E., Kremer, M. and Robinson, J. (2011). Nudging Farmers to Use Fertilizer:Theory and Experimental Evidence from Kenya. American Economic Review, 101,2350–2390.
Fernández, R. and Fogli, A. (2006). Fertility: The Role of Culture and Family Ex-perience. Journal of the European Economic Association, 4 (2-3), 552–561.
Fernández-Villaverde, J., Greenwood, J. and Guner, N. (2014). From Shameto Game in One Hundred Years: The Rise in Premarital Sex and its Destigmatization.Journal of the European Economic Association, 12 (1), 25–61.
Fisman, R., Hamao, Y. andYongxiang, W. (2014). The Impact of Interstate Tensionson Economic Exchange: Evidence from Shocks to Sino-Japanese Relations. Review ofFinancial Studies, 27 (9), 2626–2660.
Gabaix, X., Laibson, D. et al. (2006). Shrouded Attributes, Consumer Myopia, andInformation Suppression in Competitive Markets. The Quarterly Journal of Economics,121 (2), 505–540.
Gennaioli, N. and Shleifer, A. (2010). What Comes to Mind. The Quarterly Journalof Economics, 125 (4), 1399–1433.
Guiso, L., Sapienza, P. and Zingales, L. (2008). Social Capital as Culture. Journalof the European Economic Association, 6 (2-3), 295–320.
—, — and — (2009). Cultural Biases in Economic Exchange? The Quarterly Journal ofEconomics, 124 (3), 1095–1131.
23

Hanna, R., Mullainathan, S. and Schwartzstein, J. (2014). Learning throughNoticing: Theory and Evidence from a Field Experiment. The Quarterly Journal ofEconomics, 129 (3), 1311–1353.
Hionidou, V. (2006). Famine and Death in Occupied Greece, 1941-1944. Cambridge:Cambridge University Press.
Hirshleifer, D., Lim, S. S. and Teoh, S. H. (2009). Driven to Distraction: ExtraneousEvents and Underreaction to Earnings News. The Journal of Finance, 64 (5), 2289–2325.
Hong, C., Hu, W.-M., Prieger, J. E. and Zhu, D. (2011). French Automobiles andthe Chinese Boycotts of 2008: Politics Really Does Affect Commerce. The B.E. Journalof Economic Analysis & Policy, 11 (1), 26.
John, A. andKlein, J. (2003). The Boycott Puzzle: Consumer Motivations for PurchaseSacrifice. Management Science, 49 (9), 1196–1209.
Kahneman, D. (2011). Thinking, Fast and Slow. New York: Farrar, Straus and Giroux.
— and Tversky, A. (1982). Judgment Under Uncertainty: Heuristics and Biases. NewYork: Cambridge University Press.
Karlan, D., McConnell, M., Mullainathan, S. and Zinman, J. (2016). Gettingto the Top of Mind: How Reminders Increase Saving. Management Science.
Kempthorne, O. (1955). The Randomization Theory of Experimental Inference. Jour-nal of the American Statistical Association, 50 (271), 946–967.
Koku, P. S., Akhigbe, A. and Springer, T. M. (1997). The Financial Impact ofBoycotts and Threats of Boycott. Journal of Business Research, 40 (1), 15–20.
Köszegi, B. and Szeidl, A. (2013). A Model of Focusing in Economic choice. TheQuarterly Journal of Economics, 128 (1), 53–104.
Koudijs, P. and Voth, H.-J. (2016, forthcoming). Leverage and Beliefs: Personal Ex-perience and Risk Taking in Margin Lending. American Economic Review.
Maheswaran, D. and Chen, C. Y. (2006). Nation Equity: Incidental Emotions inCountry-of-Origin Effect. Journal of Consumer Research, 33 (3), 370–376.
Malmendier, U. and Nagel, S. (2011). Depression Babies: Do Macroeconomic Expe-riences Affect Risk Taking?*. Quarterly Journal of Economics, 126 (1).
— and — (2016). Learning from Inflation Experiences. The Quarterly Journal of Eco-nomics, 131 (1), 53–87.
Mankiw, N. G. and Reis, R. (2002). Sticky Information versus Sticky Prices: A Pro-posal to Replace the New Keynesian Phillips Curve. Quarterly Journal of Economics,pp. 1295–1328.
24
Mann, T. (1916). Betrachtungen eines Unpolitischen. Frankfurt am Main: S. FischerVerlag.
Mazower, M. (1995). Inside Hitler’s Greece: The Experience of Occupation, 1941-1944.New Haven and London: Yale University Press.
Meyer, H. F. (2002). Von Wien nach Kalavryta. Die blutige Spur der 117. Jäger-Division durch Serbien und Griechenland. Mannheim: Peleus.
Michaels, G. and Zhi, X. (2010). Freedom Fries. American Economic Journal: AppliedEconomics, 2 (3), 256–81.
Mullainathan, S. (2002). A Memory-Based Model Of Bounded Rationality. The Quar-terly Journal of Economics, 117 (3), 735–774.
Nessou, A. (2009).Deutsche Besatzungspolitik und Verbrechen gegen die Zivilbevölkerung- eine Beurteilung nach dem Volkerrecht. Göttingen: Vandenhoeck & Ruprecht.
Nunn, N. and Wantchekon, L. (2011). The Slave Trade and the Origins of Mistrustin Africa. American Economic Review, 101 (7), 3221–52.
Oster, E. (2013). Unobservable Selection and Coefficient Stability: Theory and Valida-tion. Working Paper 19054, NBER.
Pandya, S. and Venkatesan, R. (2016). French Roast: International Conflicts andConsumer Boycotts – Evidence from Supermarket Scanner Data. Review of Economicsand Statistics, 98 (1), 42–56.
Pope, D. G. (2009). Reacting to Rankings: Evidence from "America’s Best Hospitals".Journal of Health Economics, 28 (6), 1154–1165.
Riley, S. J., DeGloria, S. D. and Elliot, R. (1999). A Terrain Ruggedness Indexthat Quantifies Topographic Heterogeneity. International Journal of Sciences, 5 (1-4),23–27.
Schacter, D. (1996). Searching for Memory: The Brain, the Mind and the Past. NewYork: Basic Books.
Schwartzstein, J. (2014). Selective Attention and Learning. Journal of the EuropeanEconomic Association, 12 (6), 1423–1452.
Sen, S., Gurhan-Canli, Z. and Morwitz, V. (2001). Withholding Consumption: ASocial Dilemma Perspective on Consumer Boycotts. Journal of Consumer Research,28 (3), 399–417.
Serman, D. and Kim, H. (2002). Affective Perseverance: The Resistance of Affect toCognitive Invalidation. Personality and Social Psychology Bulletin, 28 (2), 224Ð237.
Simon, H. A. (1955). A Behavioral Model of Rational Choice. The Quarterly Journal ofEconomics, pp. 99–118.
25

Sims, C. A. (2003). Implications of Rational Inattention. Journal of Monetary Economics,50 (3), 665–690.
Subministry of Reconstruction (1946). Pinakes Katastrofwn Oikodomwn ths Ella-dos. Edition series no. 104 2, Hellenic Subministry of Reconstruction, Athens.
Teoh, S. H., Welch, I. and Wazzan, C. P. (1999). The Effect of Socially Activist In-vestment Policies on the Financial Markets: Evidence from the South African Boycott.The Journal of Business, 72 (1), 35–89.
Voigtländer, N. and Voth, H.-J. (2012). Persecution Perpetuated: The MedievalOrigins of Anti-Semitic Violence in Nazi Germany. The Quarterly Journal of Economics,127 (3), 1339–1392.
Young, A. (2015). Channeling Fisher: Randomization Tests and the Statistical Insignif-icance of Seemingly Significant Experimental Results. Mimeo, LSE.
A Figures and Tables
Figure 1: German–Greek conflict and evolution of German market share in prefectureswith and without reprisals
−2
02
46
Jan 2009 Jan 2010 Jan 2011 Jan 2012 Jan 2013 Jan 2014
Date
German share, reprisal−non reprisal Article share
Notes: The solid line is the difference in the seasonally adjusted (expressed as difference of month t frommonth t−12) share of German car registrations in reprisal vs non-reprisal prefectures. The dotted line isthe monthly share of Kathimerini articles related to German–Greek conflict. Both series are normalizedby their standard deviation.
26

Figure 2: Map of towns affected by German reprisals, 1941–1944
Notes: “Martyred towns”, as defined in Presidential decrees no. 399 (1998), 99 (2000), 40 (2004) and140 (2005). Population data from the 1940 Greek Census.
Figure 3: Number of international news articles referring to German–Greek conflict
010
20
30
Num
ber
of art
icle
s
Jul 2007 Jan 2009 Jul 2010 Jan 2012 Jul 2013 Jan 2015
Date
Notes: Number of international newspaper articles in English that mention the words “anti-German”and “Greece”. Data from LexisNexis.
27
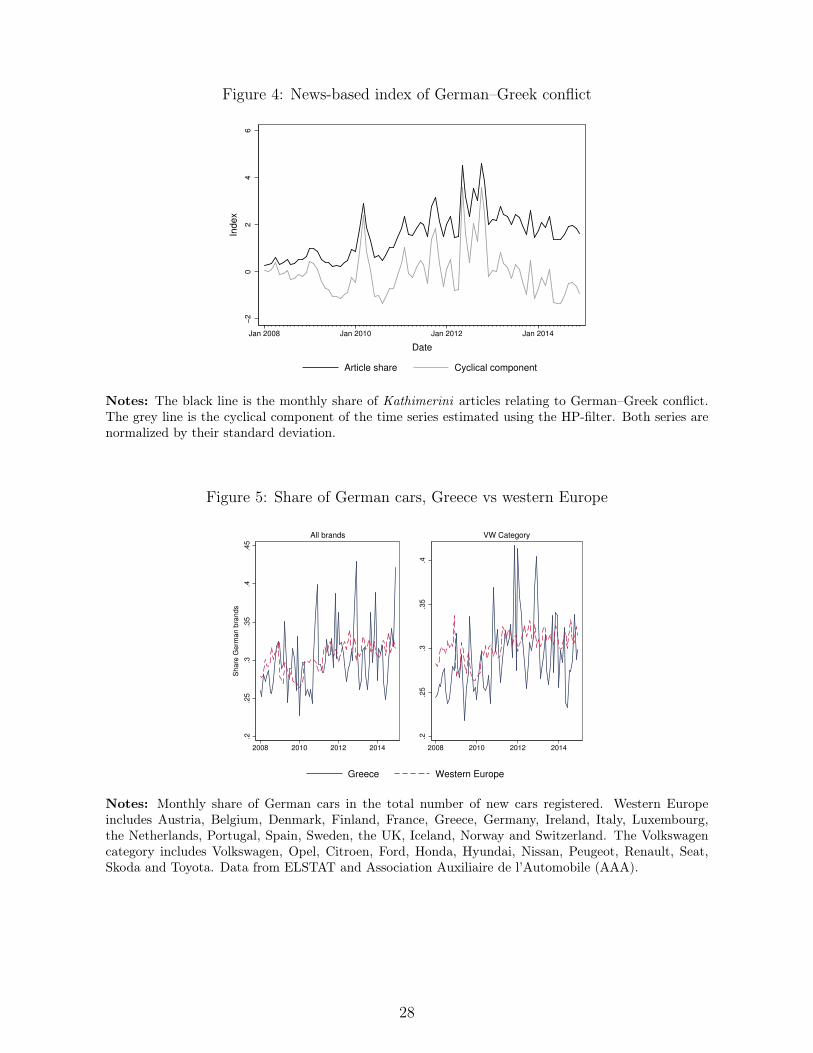
Figure 4: News-based index of German–Greek conflict
−2
02
46
Index
Jan 2008 Jan 2010 Jan 2012 Jan 2014
Date
Article share Cyclical component
Notes: The black line is the monthly share of Kathimerini articles relating to German–Greek conflict.The grey line is the cyclical component of the time series estimated using the HP-filter. Both series arenormalized by their standard deviation.
Figure 5: Share of German cars, Greece vs western Europe
.2.2
5.3
.35
.4.4
5
Share
Germ
an b
rands
2008 2010 2012 2014
All brands
.2.2
5.3
.35
.4
2008 2010 2012 2014
VW Category
Greece Western Europe
Notes: Monthly share of German cars in the total number of new cars registered. Western Europeincludes Austria, Belgium, Denmark, Finland, France, Greece, Germany, Ireland, Italy, Luxembourg,the Netherlands, Portugal, Spain, Sweden, the UK, Iceland, Norway and Switzerland. The Volkswagencategory includes Volkswagen, Opel, Citroen, Ford, Honda, Hyundai, Nissan, Peugeot, Renault, Seat,Skoda and Toyota. Data from ELSTAT and Association Auxiliaire de l’Automobile (AAA).
28
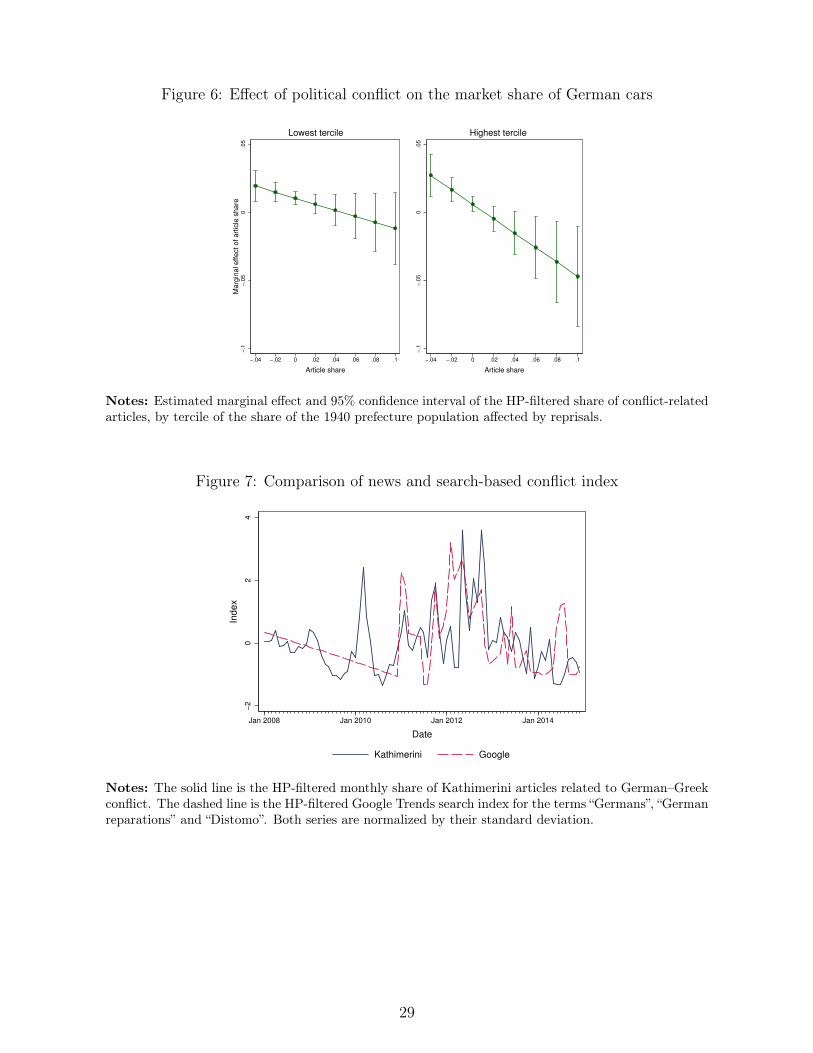
Figure 6: Effect of political conflict on the market share of German cars
−.1
−.0
50
.05
Marg
inal effect of art
icle
share
−.04 −.02 0 .02 .04 .06 .08 .1
Article share
Lowest tercile
−.1
−.0
50
.05
−.04 −.02 0 .02 .04 .06 .08 .1
Article share
Highest tercile
Notes: Estimated marginal effect and 95% confidence interval of the HP-filtered share of conflict-relatedarticles, by tercile of the share of the 1940 prefecture population affected by reprisals.
Figure 7: Comparison of news and search-based conflict index
−2
02
4
Index
Jan 2008 Jan 2010 Jan 2012 Jan 2014
Date
Kathimerini Google
Notes: The solid line is the HP-filtered monthly share of Kathimerini articles related to German–Greekconflict. The dashed line is the HP-filtered Google Trends search index for the terms “Germans”, “Germanreparations” and “Distomo”. Both series are normalized by their standard deviation.
29
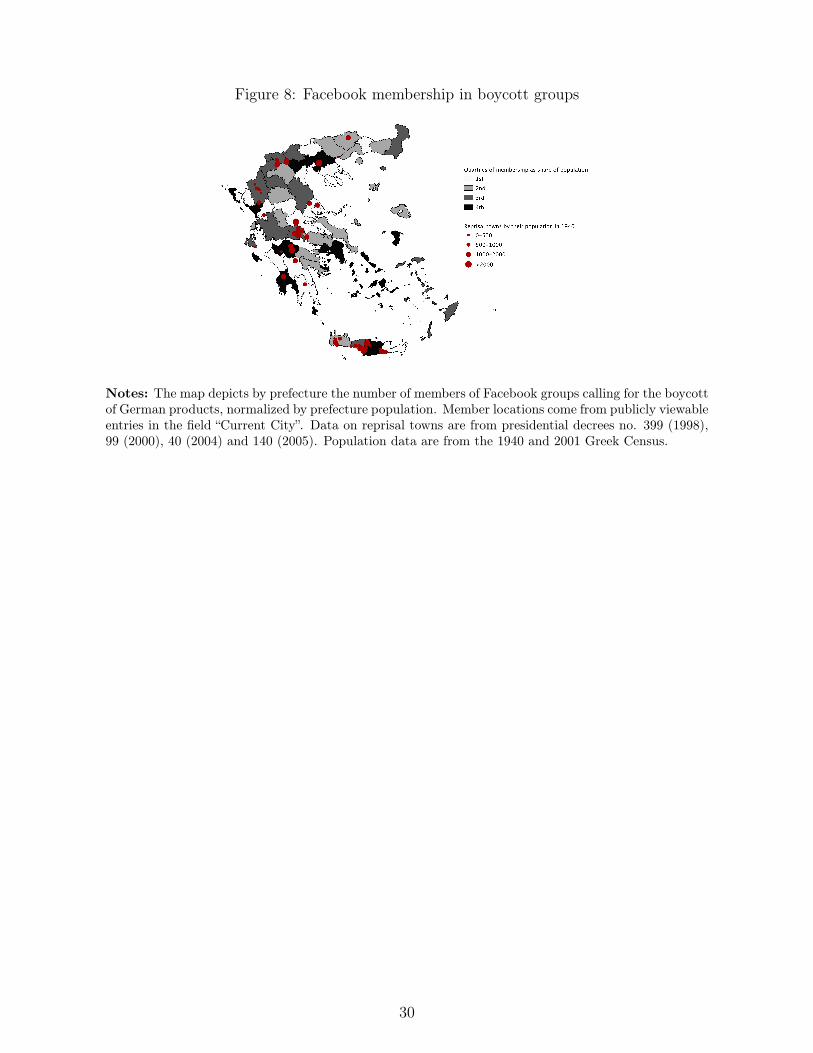
Figure 8: Facebook membership in boycott groups
Notes: The map depicts by prefecture the number of members of Facebook groups calling for the boycottof German products, normalized by prefecture population. Member locations come from publicly viewableentries in the field “Current City”. Data on reprisal towns are from presidential decrees no. 399 (1998),99 (2000), 40 (2004) and 140 (2005). Population data are from the 1940 and 2001 Greek Census.
30

Table 1: Chronology of Greek crisis and German-Greekconflict
Date Political and FinancialEvents
German-Greek Relations
Oct 2009 Centre-left party PASOKwins parliamentary elections
Oct-Dec 2009 Greek budget deficit reaches12.5% of GDPConsecutive downgrades ofGreece’s credit rating
Feb 2010 First austerity package Greek Consumer Associationcalls for boycott of Germanproducts
Mar 2010 Second austerity packageApr 2010 First bailout; Greece’s
sovereign debt downgraded tojunk bond status
May 2010 Third austerity packagepassed amidst country-wideriots and strikes
Oct 2010 Brussels EU summit acceptsGerman-inspired new bailoutmechanism
Germany refuses extension ofrepayment terms for Greekloan
Jan 2011 Greek case against Germanyfor WWII reparations heardin Den Haag
Sep 2011 German finance ministerWolfgang Schäuble suggestsGreece may want to leave theEuro
Oct 2011 Haircut on Greek debtannounced
Nov 2011 Prime minister Papandreouresigns
Feb 2012 Second bailout package Den Haag court rules inGermany’s favor inreparations case
May-Jun 2012 Parliamentary electionsNov 2012 7th austerity package passed;
massive protests and unrestoutside the parliament
Jan 2013-Nov 2014 Relative political andeconomic stability after theEU/IMF bailout and haircut
Dec 2014 Failure to elect new Greekpresident results in newelections
Continued on next page
31
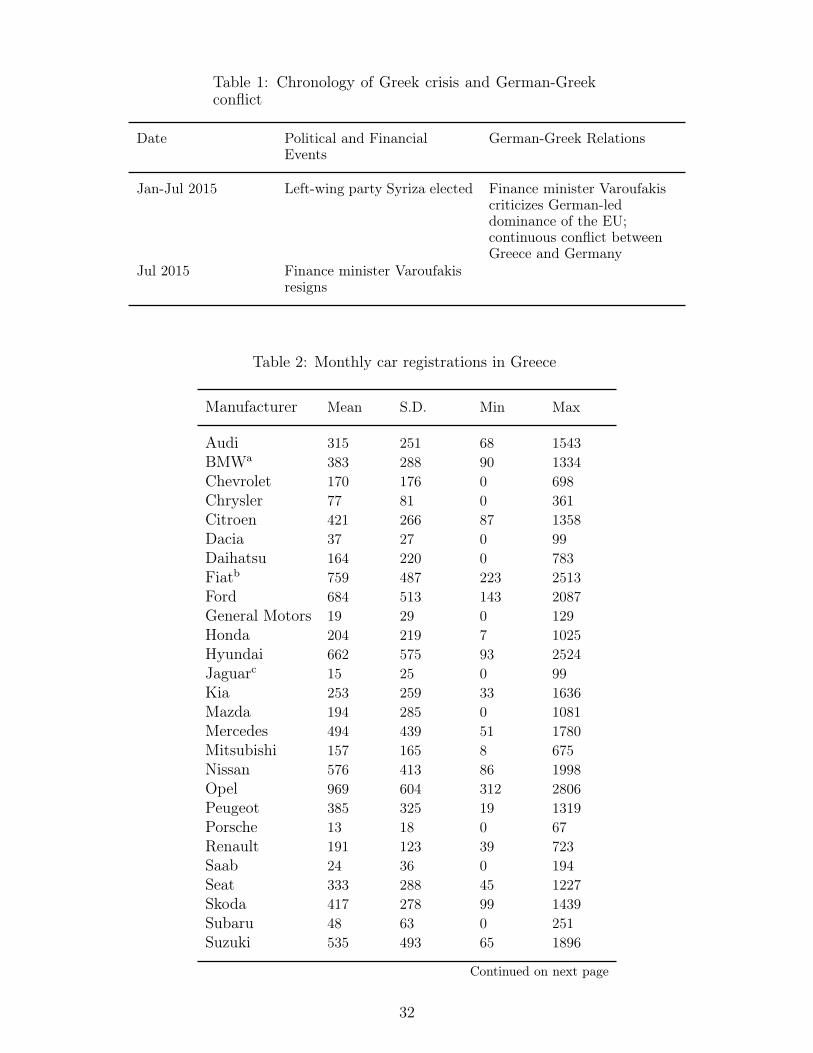
Table 1: Chronology of Greek crisis and German-Greekconflict
Date Political and FinancialEvents
German-Greek Relations
Jan-Jul 2015 Left-wing party Syriza elected Finance minister Varoufakiscriticizes German-leddominance of the EU;continuous conflict betweenGreece and Germany
Jul 2015 Finance minister Varoufakisresigns
Table 2: Monthly car registrations in Greece
Manufacturer Mean S.D. Min Max
Audi 315 251 68 1543BMWa 383 288 90 1334Chevrolet 170 176 0 698Chrysler 77 81 0 361Citroen 421 266 87 1358Dacia 37 27 0 99Daihatsu 164 220 0 783Fiatb 759 487 223 2513Ford 684 513 143 2087General Motors 19 29 0 129Honda 204 219 7 1025Hyundai 662 575 93 2524Jaguarc 15 25 0 99Kia 253 259 33 1636Mazda 194 285 0 1081Mercedes 494 439 51 1780Mitsubishi 157 165 8 675Nissan 576 413 86 1998Opel 969 604 312 2806Peugeot 385 325 19 1319Porsche 13 18 0 67Renault 191 123 39 723Saab 24 36 0 194Seat 333 288 45 1227Skoda 417 278 99 1439Subaru 48 63 0 251Suzuki 535 493 65 1896
Continued on next page
32

Table 2: Monthly car registrations in Greece
Manufacturer Mean S.D. Min Max
Toyota 1162 837 235 3909Volkswagen 967 596 220 2436Volvo 135 63 30 319
a Includes Mini.b Includes Alfa Romeo and Lancia.c Includes Land Rover.
Source: ELSTAT. All car producers with an average of at least 10car registrations per month. Data for the period January 2008 toDecember 2014.
Table 3: Summary statistics of main variables
Variable Mean S.D. Min Max N
Cross-section
Reprisals in prefecture (0/1) 0.412 0.497 0 1 51
Share of population in reprisal towns 0.011 0.024 0 0.120 51
Monthly series
Share of conflict related articles 0.062 0.039 0.008 0.182 84
Panel
Total car sales 211 973 0 16365 4284
Share German cars (all brands) 0.259 0.135 0 1 4243
Share German cars (VW category) 0.282 0.154 0 1 4220
33

Table 4: BalancednessVariable All Non-
reprisalReprisal Difference
Population 428,711 481,133 353,823 127,309(1,093,791) (1,385,816) (442,978) (270,851)
Share employed in agriculture 0.264 0.277 0.245 0.0326(0.107) (0.110) (0.102) (0.0300)
Share employed in industry 0.219 0.211 0.230 -0.0189(0.058) (0.045) (0.073) (0.0179)
Share civil servants 0.014 0.014 0.013 0.001(0.004) (0.004) (0.003) (0.001)
Share secondary education 0.179 0.170 0.192 -0.0212**(0.031) (0.030) (0.030) (0.009)
Share higher education 0.110 0.107 0.114 -0.0075(0.024) (0.024) (0.023) (0.007)
Unemployment rate 0.122 0.119 0.126 -0.007(0.029) (0.025) (0.035) (0.009)
Income per capita (2008-2009) 18378.43 18106.67 18766.67 -693.81**(4515.67) (4462.24) (4567.36) (346.33)
Income per capita growth rate -0.004 -0.005 -0.004 -0.001(2008-2009) (0.019) (0.021) (0.015) (0.001)
Share German brands pre-2010 0.024 0.021 0.028 -0.007(seasonally adjusted) (0.088) (0.094) (0.08) (0.007)
First difference in share German brands 0.003 0.002 0.004 -0.002pre-2010 (0.099) (0.098) (0.100) (0.008)
Population in 1940 146,868 147,034 146,637 397(177,369) (223,671) (83,881) (45,389)
Share seats to communists 0.028 0.026 0.031 -.0047in 1936 (0.057) (0.056) (0.060) (0.0167)
Ruggedness 248.92 232.01 273.08 -41.07*(77.25) (79.66) (68.40) (20.84)
Average distance from 1940 road 15.31 22.37 5.23 17.13**(35.42) (45.09) (2.52) (8.25)
Average distance from 1940 railway line 78.17 73.54 84.77 -11.23(92.13) (83.06) (105.53) (27.57)
N 51 30 21
Reprisal prefectures have at least one martyred town. Source: 2001 and 1940 Greek Census, HellenicSubministry of Reconstruction and Hellenic Parliament, Registry of Parliament Members.
34

Table 5: BaselineDependent variable Share of German cars
(1) (2) (3) (4) (5)
Article share -0.214∗ -0.215∗ -0.218∗ -13.49∗ -7.015(0.114) (0.114) (0.115) (6.760) (9.636)
Share pop. affected -0.132∗∗∗ -0.190∗∗∗
(0.0393) (0.0467)Article share×share pop. affected -8.717∗∗ -8.725∗∗ -8.672∗∗ -10.71∗∗∗ -12.47∗∗∗
(4.001) (4.005) (4.031) (2.339) (4.656)
Observations 3618 3618 3618 3618 3618R-squared 0.0246 0.0279 0.0307 0.0362 0.136
Controls No Yes No No NoPrefecture FE No No Yes Yes YesControls×Article share No No No Yes YesPrefecture×Year No No No No Yes
Significance levels: *** p< 0.01, ** p< 0.05, * p< 0.1. Years 2008–2014. The dependent variable is the12-month difference in the monthly German share of new cars registered in a prefecture. Article shareis the cyclical component of the share of conflict related articles in Kathimerini, estimated using the HPfilter. All regressions include year fixed effects. Prefecture controls include log population in 2001, shareemployed in agriculture in 2001, share employed in industry in 2001, share with higher education in 2001,share with secondary education in 2001, unemployment rate in 2001, share civil servants in 2001, logGDP per capita in 2008-2009, GDP per capita growth in 2008-2009, ruggedness, average distance fromthe nearest road in 1940, average distance from the nearest railway line in 1940 and share of parliamentaryseats to communists in 1936. Standard errors are clustered at the prefecture level.
Table 6: Volkswagen categoryDependent variable Share of German cars in VW category
(1) (2) (3) (4) (5)
Article share -0.313∗∗ -0.315∗∗ -0.315∗∗ -19.51∗∗ -13.12(0.131) (0.130) (0.131) (8.745) (10.11)
Share pop. affected -0.117∗ -0.212∗∗∗
(0.0618) (0.0614)Article share×share pop. affected -14.50∗∗ -14.47∗∗ -14.44∗∗ -17.99∗∗∗ -17.26∗∗∗
(6.927) (6.927) (6.960) (4.129) (5.202)
Observations 3582 3582 3582 3582 3582R-squared 0.0346 0.0383 0.0420 0.0491 0.151
Controls No Yes No No NoPrefecture FE No No Yes Yes YesControls×Article share No No No Yes YesPrefecture×Year No No No No Yes
Significance levels: *** p< 0.01, ** p< 0.05, * p< 0.1. Years 2008–2014. The dependent variable is the12-month difference in the monthly German share of new cars registered in a prefecture. Article shareis the cyclical component of the share of conflict related articles in Kathimerini, estimated using the HPfilter. The sample is restricted to the Volkswagen category, which includes Volkswagen, Opel, Citroen,Ford, Honda, Hyundai, Nissan, Peugeot, Renault, Seat, Skoda and Toyota. All regressions include yearfixed effects. Standard errors are clustered at the prefecture level.
35

Table 7: Alternative measures of German-Greek conflictDependent variable Share of German cars
(1) (2) (3) (4)
Raw article share -9.402∗
(5.117)Raw article share×share pop. affected -10.28∗∗∗
(1.886)Deviation from 3-month MA -8.116
(8.219)Deviation×share pop. affected -7.646∗
(4.405)Google Index -0.0303∗∗
(0.0123)Google Index×share pop. affected -0.0150∗∗∗
(0.00482)Google Index cyclical -0.0393∗∗
(0.0158)Google Index cyclical×share pop. affected -0.00979
(0.00809)
Observations 3618 3618 3618 3618R-squared 0.0357 0.0322 0.0315 0.0318
Significance levels: *** p< 0.01, ** p< 0.05, * p< 0.1. Years 2008–2014. The dependent variable isthe 12-month difference in the monthly German share of new cars registered in a prefecture. Deviationis the deviation of a 3-month moving average of the monthly share of Kathimerini articles related toGerman-Greek conflict. Google Index is the average of the Google Trends search index for the terms“Germans”, “German reparations” and “Distomo”. Google Index cyclical is the cyclical component of theGoogle Index, estimated using the HP filter. All regressions include prefecture and year fixed effectsand interactions of the conflict measures with baseline prefecture characteristics. Standard errors areclustered at the prefecture level.
Table 9: Assessing selection on unobservablesControls restricted Controls full Sample
All brands VW category
Panel A: Altonji ratiosYear FE Prefecture FE and interactions of controls
with Article Share-5.72 -5.31
Year FE Prefecture FE, prefecture-year interactionsand interactions of controls with the conflictmonth
-3.43 -6.49
Panel B: δ (Oster, 2013)Year FE Prefecture FE and interactions of controls
with Article Share0.74 0.71
Year FE Prefecture FE, prefecture-year interactionsand interactions of controls with the conflictmonth
0.63 0.82
The table reports the relative strength of unobservables needed to completely explain away the effect ofGerman-Greek conflict – measured as the HP-filtered share of conflict-related articles in Kathimerini – onthe difference of the seasonally adjusted German car share between reprisal and non-reprisal prefectures.Panel A uses the technique described in Altonji et al. (2005); Panel B, the technique in Oster (2013).
36

Table 8: Alternative definitions of reprisalsDependent variable Share of German cars
(1) (2) (3) (4)
Article share -14.51∗∗ -15.37∗∗ -16.00∗∗ -16.71∗∗
(7.108) (6.266) (6.976) (6.774)Article share×Reprisal -0.250
(0.212)Article share×Reprisal top quartile -0.888∗∗∗
(0.245)Article share×Share destroyed towns -0.194
(0.491)Article share×Principal component -0.183∗∗∗
(0.0438)
Observations 3618 3618 3546 3546R-squared 0.0351 0.0364 0.0361 0.0373
Significance levels: *** p< 0.01, ** p< 0.05, * p< 0.1. Years 2008–2014. The dependent variable isthe 12-month difference in the monthly German share of new cars registered in a prefecture. Articleshare is the cyclical component of the share of conflict related articles in Kathimerini, estimated usingthe HP filter. Reprisal is an indicator equal to one if the prefecture includes at least one martyred town.Reprisal top quartile is an indicator equal to one if the prefecture is in the 75th percentile of the shareof 1940 population living in martyred towns. Share destroyed towns is the share of a prefecture’s townsthat were destroyed in the years 1941-1944. Data for the construction of this variable are from Doxiadis(1947). Principal component is the first principal component of the following variables: share of 1940population in reprisal towns, share of 1940 towns that suffered reprisals and share of towns that weredestroyed in 1941-1944. All regressions include prefecture and year fixed effects and interactions of theconflict measures with baseline prefecture characteristics. Standard errors are clustered at the prefecturelevel.
37
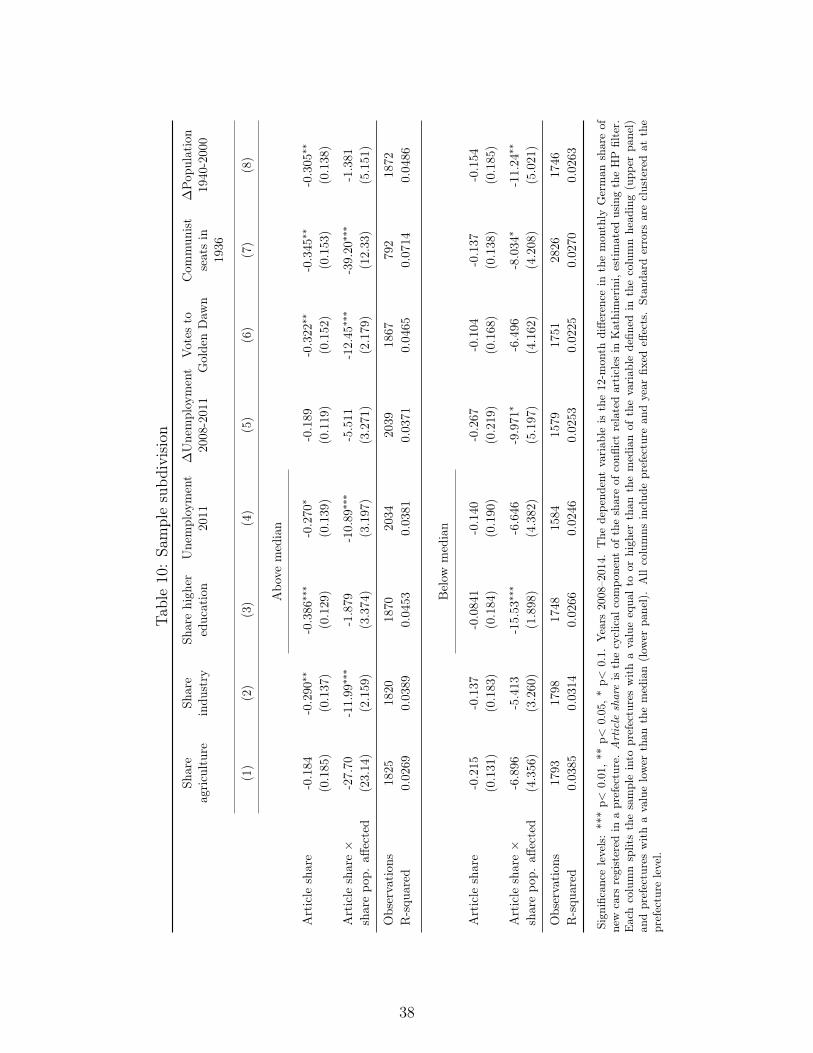
Table10
:Sa
mplesubd
ivision
Share
agricu
lture
Share
indu
stry
Sharehigh
ered
ucation
Une
mployment
2011
∆Une
mployment
2008
-201
1Votes
toGolde
nDaw
nCom
mun
ist
seatsin
1936
∆Pop
ulation
1940
-200
0
(1)
(2)
(3)
(4)
(5)
(6)
(7)
(8)
Abo
vemed
ian
Article
share
-0.184
-0.290
∗∗-0.386
∗∗∗
-0.270
∗-0.189
-0.322
∗∗-0.345
∗∗-0.305
∗∗
(0.185
)(0.137
)(0.129
)(0.139
)(0.119
)(0.152
)(0.153
)(0.138
)
Article
share×
-27.70
-11.99
∗∗∗
-1.879
-10.89
∗∗∗
-5.511
-12.45
∗∗∗
-39.20
∗∗∗
-1.381
sharepo
p.aff
ected
(23.14
)(2.159
)(3.374
)(3.197
)(3.271
)(2.179
)(12.33
)(5.151
)
Observation
s1825
1820
1870
2034
2039
1867
792
1872
R-squ
ared
0.02
690.03
890.04
530.03
810.03
710.04
650.07
140.0486
Below
med
ian
Article
share
-0.215
-0.137
-0.084
1-0.140
-0.267
-0.104
-0.137
-0.154
(0.131
)(0.183
)(0.184
)(0.190
)(0.219
)(0.168
)(0.138
)(0.185
)
Article
share×
-6.896
-5.413
-15.53
∗∗∗
-6.646
-9.971
∗-6.496
-8.034
∗-11.24
∗∗
sharepo
p.aff
ected
(4.356
)(3.260
)(1.898
)(4.382
)(5.197
)(4.162
)(4.208
)(5.021
)
Observation
s1793
1798
1748
1584
1579
1751
2826
1746
R-squ
ared
0.03
850.03
140.02
660.02
460.02
530.02
250.02
700.0263
Sign
ificancelevels:***p<
0.0
1,**
p<0.
05,*p<
0.1.Years
2008–2014.
The
depe
ndentvariab
leis
the12-m
onth
diffe
rencein
themon
thly
German
shareof
new
cars
registered
inaprefecture.
Art
icle
shar
eis
thecyclical
compo
nent
oftheshareof
confl
ictrelatedarticles
inKathimerini,estimated
usingtheHP
filter.
Eachcolumnsplitsthesampleinto
prefectureswithavalueequa
lto
orhigh
erthan
themedianof
thevariab
ledefin
edin
thecolumnhead
ing(upp
erpa
nel)
andprefectureswithavaluelower
than
themedian(low
erpa
nel).Allcolumns
includ
eprefecture
andyear
fixed
effects.Stan
dard
errors
areclusteredat
the
prefecture
level.
38
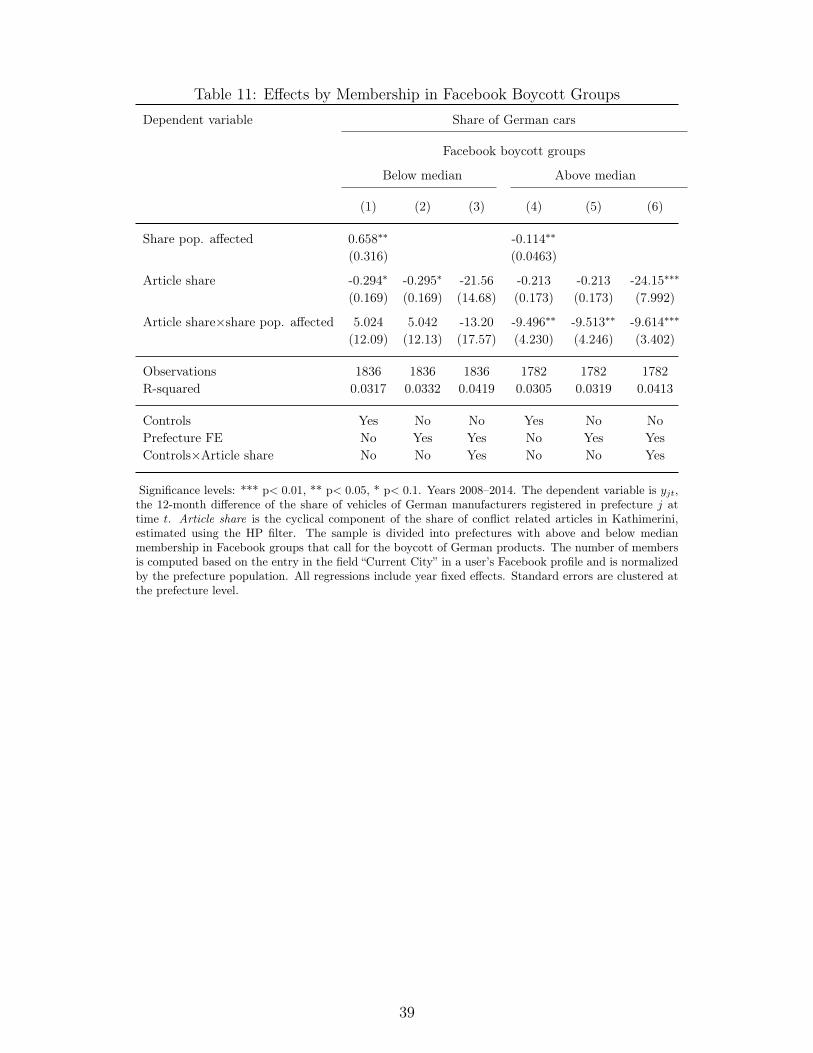
Table 11: Effects by Membership in Facebook Boycott GroupsDependent variable Share of German cars
Facebook boycott groups
Below median Above median
(1) (2) (3) (4) (5) (6)
Share pop. affected 0.658∗∗ -0.114∗∗
(0.316) (0.0463)
Article share -0.294∗ -0.295∗ -21.56 -0.213 -0.213 -24.15∗∗∗
(0.169) (0.169) (14.68) (0.173) (0.173) (7.992)
Article share×share pop. affected 5.024 5.042 -13.20 -9.496∗∗ -9.513∗∗ -9.614∗∗∗
(12.09) (12.13) (17.57) (4.230) (4.246) (3.402)
Observations 1836 1836 1836 1782 1782 1782R-squared 0.0317 0.0332 0.0419 0.0305 0.0319 0.0413
Controls Yes No No Yes No NoPrefecture FE No Yes Yes No Yes YesControls×Article share No No Yes No No Yes
Significance levels: *** p< 0.01, ** p< 0.05, * p< 0.1. Years 2008–2014. The dependent variable is yjt,the 12-month difference of the share of vehicles of German manufacturers registered in prefecture j attime t. Article share is the cyclical component of the share of conflict related articles in Kathimerini,estimated using the HP filter. The sample is divided into prefectures with above and below medianmembership in Facebook groups that call for the boycott of German products. The number of membersis computed based on the entry in the field “Current City” in a user’s Facebook profile and is normalizedby the prefecture population. All regressions include year fixed effects. Standard errors are clustered atthe prefecture level.
39

Table12
:Tr
iple
Differences
Dep
ende
ntvariab
lelog(cars)
(1)
(2)
(3)
(4)
(5)
(6)
(7)
Article
share
-0.050
9-0.050
9-0.050
9-0.050
9-0.0681
-0.008
71-3.959
(0.052
0)(0.052
0)(0.052
0)(0.052
0)(0.057
2)(0.046
0)(2.616)
Sharepo
p.aff
ected
-0.794
-1.008
∗-1.181
∗∗
(1.712
)(0.533
)(0.549
)
German
bran
d0.11
0∗∗∗
0.13
3∗∗∗
(0.025
7)(0.034
9)
Article
share×
sharepo
p.aff
ected
5.65
7∗5.65
7∗5.65
7∗5.65
7∗5.75
70.28
50.622
(3.027
)(3.027)
(3.028
)(3.028
)(4.025
)(1.029
)(1.233
)
Article
share×
German
bran
d0.10
10.10
10.10
10.10
10.18
4∗0.19
0∗∗
0.19
7∗∗
(0.099
2)(0.099
2)(0.099
2)(0.099
2)(0.093
2)(0.092
8)(0.092
4)
German
bran
d×sharepo
p.aff
ected
-0.110
-0.078
40.11
60.16
30.16
30.16
30.16
3(0.569
)(0.676)
(0.587
)(0.573
)(0.574
)(0.574
)(0.574
)
Article
share×
German
bran
d×sharepo
p.aff
ected
-9.000
∗∗∗
-9.000
∗∗∗
-9.000
∗∗∗
-9.000
∗∗∗
-9.231
∗∗∗
-9.708
∗∗∗
-9.790
∗∗∗
(2.463
)(2.463)
(2.463
)(2.463
)(2.114
)(2.281
)(2.304
)
Observation
s19
9920
1999
2019
9920
1999
2019
9920
1999
201999
20R-squ
ared
0.07
460.19
60.53
20.53
70.63
40.64
50.64
5
Con
trols
No
Yes
Yes
No
No
No
No
Brand
FE
No
No
Yes
Yes
Yes
Yes
Yes
PrefectureFE
No
No
No
Yes
Yes
Yes
Yes
Brand×YearFE
No
No
No
No
Yes
Yes
Yes
Prefecture×
YearFE
No
No
No
No
No
Yes
Yes
Con
trols×
Article
share
No
No
No
No
No
No
Yes
Sign
ificancelevels:**
*p<
0.0
1,**
p<0.0
5,*p<
0.1.Years
2008
–201
4.The
depe
ndentvariab
leis
theloga
rithm
ofnew
cars
registered
ina
prefecture.
Art
icle
shar
eis
thecyclical
compo
nent
oftheshareof
confl
ictrelatedarticles
inKathimerini,estimated
usingtheHP
filter.
All
regression
sinclud
ecalend
armon
than
dyear
fixed
effects.Stan
dard
errors
areclusteredat
theprefecture
level.
40
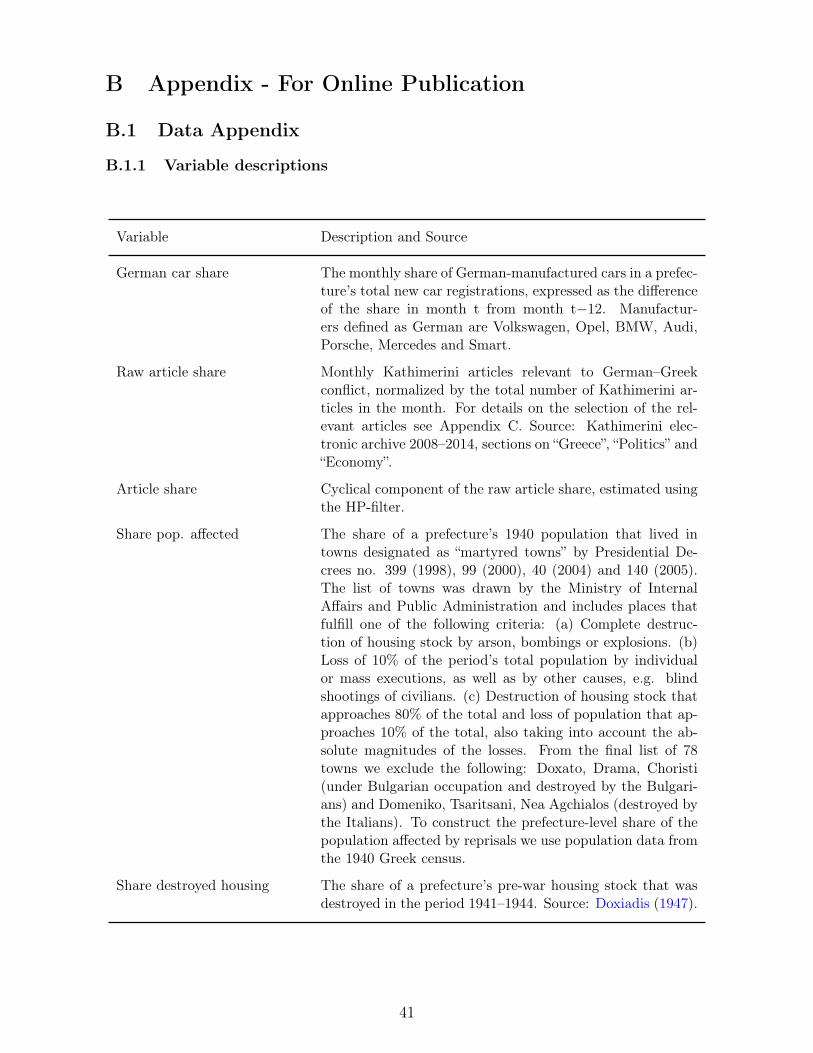
B Appendix - For Online Publication
B.1 Data Appendix
B.1.1 Variable descriptions
Variable Description and Source
German car share The monthly share of German-manufactured cars in a prefec-ture’s total new car registrations, expressed as the differenceof the share in month t from month t−12. Manufactur-ers defined as German are Volkswagen, Opel, BMW, Audi,Porsche, Mercedes and Smart.
Raw article share Monthly Kathimerini articles relevant to German–Greekconflict, normalized by the total number of Kathimerini ar-ticles in the month. For details on the selection of the rel-evant articles see Appendix C. Source: Kathimerini elec-tronic archive 2008–2014, sections on “Greece”, “Politics” and“Economy”.
Article share Cyclical component of the raw article share, estimated usingthe HP-filter.
Share pop. affected The share of a prefecture’s 1940 population that lived intowns designated as “martyred towns” by Presidential De-crees no. 399 (1998), 99 (2000), 40 (2004) and 140 (2005).The list of towns was drawn by the Ministry of InternalAffairs and Public Administration and includes places thatfulfill one of the following criteria: (a) Complete destruc-tion of housing stock by arson, bombings or explosions. (b)Loss of 10% of the period’s total population by individualor mass executions, as well as by other causes, e.g. blindshootings of civilians. (c) Destruction of housing stock thatapproaches 80% of the total and loss of population that ap-proaches 10% of the total, also taking into account the ab-solute magnitudes of the losses. From the final list of 78towns we exclude the following: Doxato, Drama, Choristi(under Bulgarian occupation and destroyed by the Bulgari-ans) and Domeniko, Tsaritsani, Nea Agchialos (destroyed bythe Italians). To construct the prefecture-level share of thepopulation affected by reprisals we use population data fromthe 1940 Greek census.
Share destroyed housing The share of a prefecture’s pre-war housing stock that wasdestroyed in the period 1941–1944. Source: Doxiadis (1947).
41
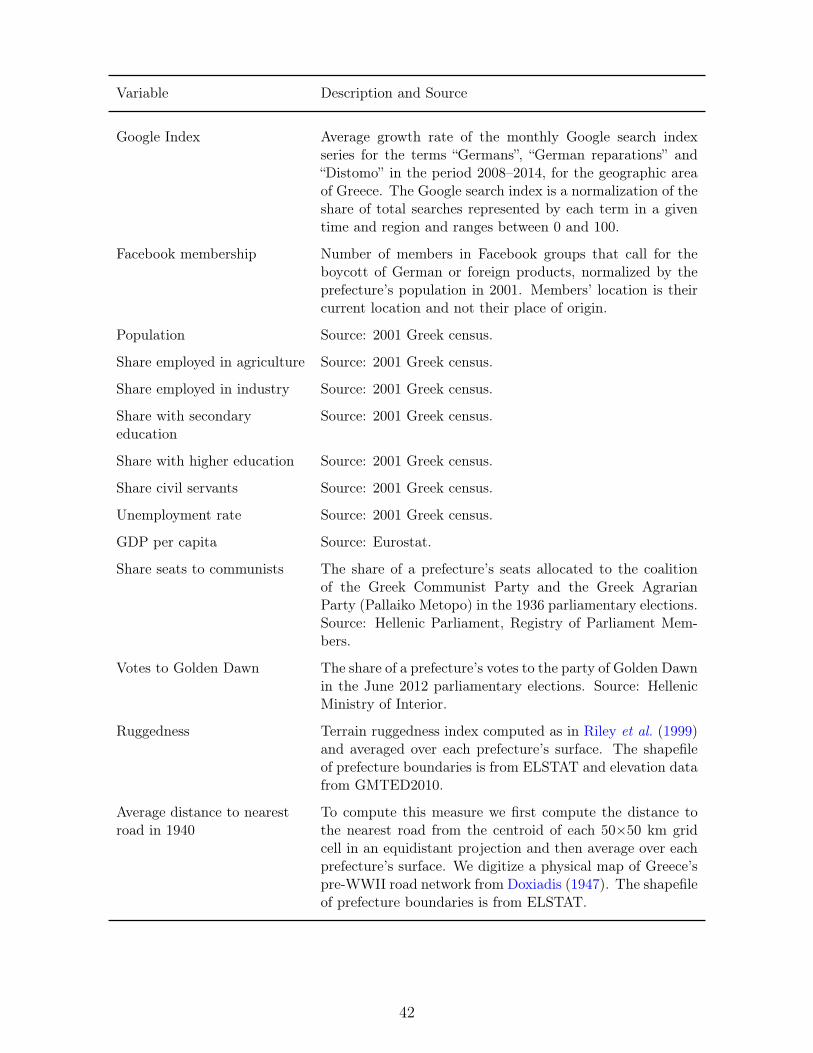
Variable Description and Source
Google Index Average growth rate of the monthly Google search indexseries for the terms “Germans”, “German reparations” and“Distomo” in the period 2008–2014, for the geographic areaof Greece. The Google search index is a normalization of theshare of total searches represented by each term in a giventime and region and ranges between 0 and 100.
Facebook membership Number of members in Facebook groups that call for theboycott of German or foreign products, normalized by theprefecture’s population in 2001. Members’ location is theircurrent location and not their place of origin.
Population Source: 2001 Greek census.
Share employed in agriculture Source: 2001 Greek census.
Share employed in industry Source: 2001 Greek census.
Share with secondaryeducation
Source: 2001 Greek census.
Share with higher education Source: 2001 Greek census.
Share civil servants Source: 2001 Greek census.
Unemployment rate Source: 2001 Greek census.
GDP per capita Source: Eurostat.
Share seats to communists The share of a prefecture’s seats allocated to the coalitionof the Greek Communist Party and the Greek AgrarianParty (Pallaiko Metopo) in the 1936 parliamentary elections.Source: Hellenic Parliament, Registry of Parliament Mem-bers.
Votes to Golden Dawn The share of a prefecture’s votes to the party of Golden Dawnin the June 2012 parliamentary elections. Source: HellenicMinistry of Interior.
Ruggedness Terrain ruggedness index computed as in Riley et al. (1999)and averaged over each prefecture’s surface. The shapefileof prefecture boundaries is from ELSTAT and elevation datafrom GMTED2010.
Average distance to nearestroad in 1940
To compute this measure we first compute the distance tothe nearest road from the centroid of each 50×50 km gridcell in an equidistant projection and then average over eachprefecture’s surface. We digitize a physical map of Greece’spre-WWII road network from Doxiadis (1947). The shapefileof prefecture boundaries is from ELSTAT.
42
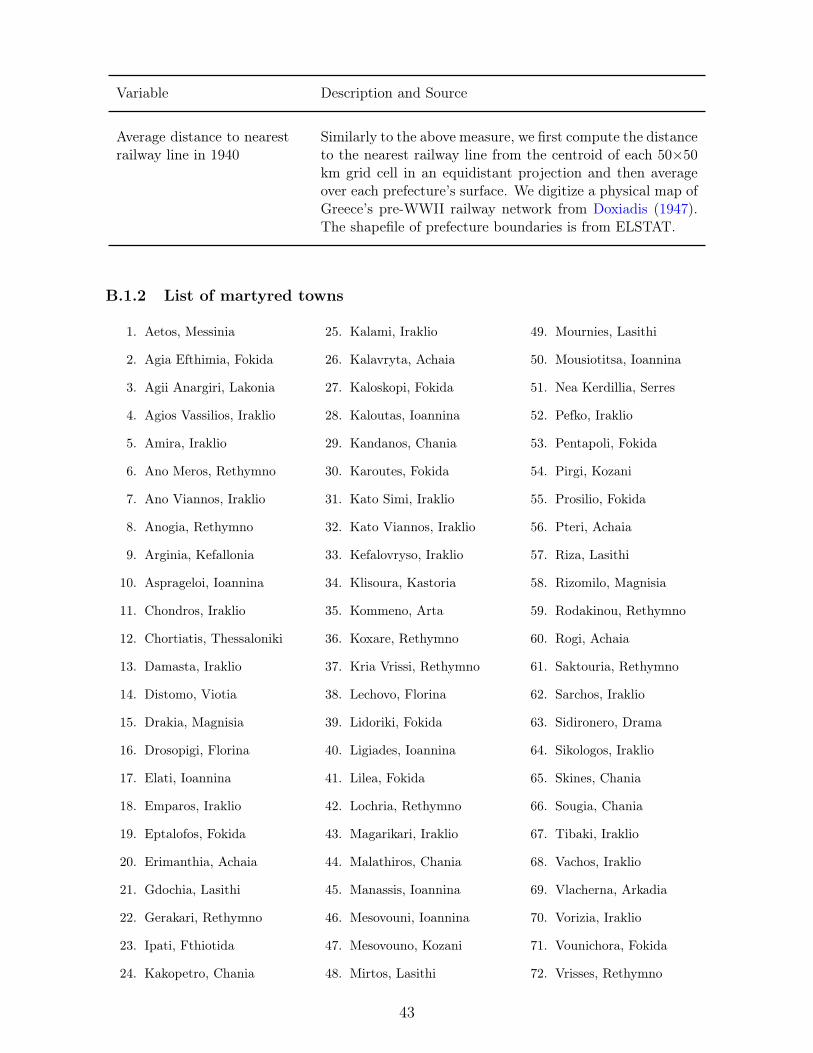
Variable Description and Source
Average distance to nearestrailway line in 1940
Similarly to the above measure, we first compute the distanceto the nearest railway line from the centroid of each 50×50km grid cell in an equidistant projection and then averageover each prefecture’s surface. We digitize a physical map ofGreece’s pre-WWII railway network from Doxiadis (1947).The shapefile of prefecture boundaries is from ELSTAT.
B.1.2 List of martyred towns
1. Aetos, Messinia
2. Agia Efthimia, Fokida
3. Agii Anargiri, Lakonia
4. Agios Vassilios, Iraklio
5. Amira, Iraklio
6. Ano Meros, Rethymno
7. Ano Viannos, Iraklio
8. Anogia, Rethymno
9. Arginia, Kefallonia
10. Asprageloi, Ioannina
11. Chondros, Iraklio
12. Chortiatis, Thessaloniki
13. Damasta, Iraklio
14. Distomo, Viotia
15. Drakia, Magnisia
16. Drosopigi, Florina
17. Elati, Ioannina
18. Emparos, Iraklio
19. Eptalofos, Fokida
20. Erimanthia, Achaia
21. Gdochia, Lasithi
22. Gerakari, Rethymno
23. Ipati, Fthiotida
24. Kakopetro, Chania
25. Kalami, Iraklio
26. Kalavryta, Achaia
27. Kaloskopi, Fokida
28. Kaloutas, Ioannina
29. Kandanos, Chania
30. Karoutes, Fokida
31. Kato Simi, Iraklio
32. Kato Viannos, Iraklio
33. Kefalovryso, Iraklio
34. Klisoura, Kastoria
35. Kommeno, Arta
36. Koxare, Rethymno
37. Kria Vrissi, Rethymno
38. Lechovo, Florina
39. Lidoriki, Fokida
40. Ligiades, Ioannina
41. Lilea, Fokida
42. Lochria, Rethymno
43. Magarikari, Iraklio
44. Malathiros, Chania
45. Manassis, Ioannina
46. Mesovouni, Ioannina
47. Mesovouno, Kozani
48. Mirtos, Lasithi
49. Mournies, Lasithi
50. Mousiotitsa, Ioannina
51. Nea Kerdillia, Serres
52. Pefko, Iraklio
53. Pentapoli, Fokida
54. Pirgi, Kozani
55. Prosilio, Fokida
56. Pteri, Achaia
57. Riza, Lasithi
58. Rizomilo, Magnisia
59. Rodakinou, Rethymno
60. Rogi, Achaia
61. Saktouria, Rethymno
62. Sarchos, Iraklio
63. Sidironero, Drama
64. Sikologos, Iraklio
65. Skines, Chania
66. Sougia, Chania
67. Tibaki, Iraklio
68. Vachos, Iraklio
69. Vlacherna, Arkadia
70. Vorizia, Iraklio
71. Vounichora, Fokida
72. Vrisses, Rethymno
43

B.1.3 News Index Construction
For the construction of the index, we use the 2008–2014 Kathimerini archive of the sections“Greece”, “Politics” and “Economy”, containing a total of 101,889 articles. As a first step,we sample 10% of articles containing the stem “german-” and manually classify theminto relevant and non-relevant to political tension between Germany and Greece. Anarticle classified as relevant must contain a reference, however short, to German–Greekconflicting political interests or political interactions in the context of foreign relations,the eurozone or the issue of German war reparations. Articles that refer to German-Greekrelations in another context – e.g. tourism flows, economic transactions between Germanand Greek firms etc. – are classified as non-relevant.
We split the audited sample into a training and test set and use the test set to evaluatethe classification performance of our algorithm. We start by assigning a frequency scoreto each term appearing more than twenty times in the articles of the training set. Thisscore captures how frequently the term appears in conflict-related articles relative to non-conflict-related articles. The frequency score for term i is an empirical index constructedas:
Frequency scorei =Pr(i|c)
Pr(i|c) + Pr(i|nc)∗ 100
where c is a conflict-related article and nc an unrelated article. The score takes on thevalue 100 when a term appears only in conflict-related articles and the value 0 when itappears only in unrelated articles. Terms like bankruptcy, memorandum, austerity, butalso subtler terms like discipline, painful, tolerance, score above 95 in this index.
We use the 40 highest-scoring terms and form all combinations of 5 to 6 terms fromthis list. For each combination, we classify an article in our test set as conflict-related if itcontains at least one of the terms in the combination. We then compare this classificationto the human audit and evaluate each combination of terms based on a compound measureof precision and recall known as the F1-score. Since we are interested in minimizing bothfalse positive and false negative classifications of articles, we put equal weight on the twotypes of errors and pick the combination that maximizes:
F1 = 2 ∗ 2 ∗ true positive2 ∗ true positive+ false negative+ false positive
Based on the above procedure, we end up classifying an article as related to German-Greek conflict if it contains the stem “german-” and at least one of the words in the set{haircut, summit, Merkel, troika, Eurozone}. This gives us a monthly count of conflict-related articles, which we normalize by the total number of articles Kathimerini published
44

in the month.
B.2 Additional Tables
B.2.1 Randomization Inference
Table B.2: Permutation tests
Dependent variable Share of German cars
(1) (2) (3) (4) (5)
Article Share -0.214∗ -0.215∗ -0.218∗ -13.49∗ -7.015
(0.064) (0.076) (0.058) (0.072) (0.438)
[0.04, 0.09] [0.05, 0.10] [0.04, 0.08] [0.05, 0.10] [0.39, 0.48]
Share pop. affected -0.132 -0.190
(0.246) (0.166)
[0.21, 0.29] [0.13, 0.10]
Article share× -8.717∗∗ -8.725∗∗ -8.672∗∗ -10.71∗∗ -12.47∗∗
share pop. affected (0.036) (0.022) (0.014) (0.022) (0.038)
[0.02, 0.06] [0.01, 0.04] [0.01, 0.03] [0.01, 0.04] [0.02, 0.06]
Observations 4284 4284 4284 4284 4284
Permutations 500 500 500 500 500
Controls No Yes No No No
Prefecture FE No No Yes Yes Yes
Controls×Article share No No No Yes Yes
Prefecture×Year No No No No Yes
Significance levels: *** p< 0.01, ** p< 0.05, * p< 0.1. Years 2008–2014. The dependent variable is the12-month difference in the monthly German share of new cars registered in a prefecture. Article shareis the cyclical component of the share of conflict related articles in Kathimerini, estimated using theHP filter. All regressions include year fixed effects. Prefecture controls include log population in 2001,share employed in agriculture in 2001, share employed in industry in 2001, share with higher educationin 2001, share with secondary education in 2001, unemployment rate in 2001, share civil servants in 2001,log GDP per capita in 2008-2009, GDP per capita growth in 2008-2009, ruggedness, average distancefrom the nearest road in 1940, average distance from the nearest railway line in 1940 and share ofparliamentary seats to communists in 1936. Standard errors are clustered at the prefecture level. P-values from permutation tests are in parentheses. Confidence intervals for p-values are given in squarebrackets.
45