Representing earth science concepts using …...Representing Earth Science Concepts Using...
232
This file is part of the following reference: Mills, Reece (2017) Representing earth science concepts using slowmation: influences on middle school students' conceptual change. PhD thesis, James Cook University. Access to this file is available from: http://researchonline.jcu.edu.au/50987/ The author has certified to JCU that they have made a reasonable effort to gain permission and acknowledge the owner of any third party copyright material included in this document. If you believe that this is not the case, please contact [email protected] and quote http://researchonline.jcu.edu.au/50987/ ResearchOnline@JCU
Transcript of Representing earth science concepts using …...Representing Earth Science Concepts Using...
This file is part of the following reference:
Mills, Reece (2017) Representing earth science concepts
using slowmation: influences on middle school students'
conceptual change. PhD thesis, James Cook University.
Access to this file is available from:
http://researchonline.jcu.edu.au/50987/
The author has certified to JCU that they have made a reasonable effort to gain
permission and acknowledge the owner of any third party copyright material
included in this document. If you believe that this is not the case, please contact
[email protected] and quote
http://researchonline.jcu.edu.au/50987/
ResearchOnline@JCU
Representing Earth Science Concepts Using Slowmation:Influences on Middle School Students’ Conceptual Change
Thesis submitted byReece Mills, B.Ed. (Hons)
For the Degree of Doctor of Philosophyin the College of Arts, Society & Education,
James Cook University
January 2017
ii
KeywordsEarth science
Conceptual change
Slowmation
Plate tectonics
Interest
Mixed methods intervention
iii
AbstractA number of challenges are currently impacting the quality of Earth science education in
Australia. These include the introduction of a new Australian Curriculum that requires
students learn about abstract Earth science concepts; the inadequacy of teachers’
professional knowledge to address pedagogically these demands; the limitations of
teacher education to alleviate pre-service teachers’ perceived pedagogical inadequacy in
teaching Earth science; and issues of students’ durably held alternative conceptions about
Earth science phenomena and perceived disengagement with the subject. These
challenges call for research that investigates the efficacy of innovative conceptual change
pedagogies that promote students’ engagement with Earth science and enhance their
conceptual understanding.
In response to this need, this study investigated the value of using student-generated stop-
motion animation, or ‘slowmation’, as a conceptual change instructional approach. This
study employed a mixed-methods intervention research design, generating both
quantitative and qualitative data, in order to investigate three research questions: (1) Does
the process of constructing a slowmation have a significant effect on students’ conceptual
change? (2) How does the process of constructing a slowmation influence students’
conceptual change; and (3) Is students’ interest, generated by the construction of a
slowmation, a significant predictor of conceptual change?
Four classes of Year 9 students participated in this study. Two classes were treated as an
intervention group and participated in the construction of a slowmation (N=52), while
two comparison classes experienced ‘teaching as usual’ (N=43). All students in the
intervention and comparison conditions completed a two-tiered multiple-choice test (i.e.,
the GeoQuiz), developed and validated by the researcher, which tested students’
alternative Earth science conceptions before and after their participation in the study. A
Likert-style survey that gauged students’ interest in learning science, the Student Interest
in Learning Science (SILS) Survey, was also administered to all students before and after
the project. Selected students from the intervention condition were audio recorded to
iv
capture their discussions during the construction process, and the same students were
interviewed about their learning experience upon completion of the project.
In answer to the first research question, a significant improvement was found in the
GeoQuiz scores of students who constructed a slowmation, which indicates that
conceptual change occurred. At the same time, a significant improvement was also found
for students in the comparison classes. This suggests that creating a slowmation was no
more effective in bringing about conceptual change than teaching as usual. In response to
the second research question, analysis of the qualitative data in this study found that the
construction process afforded ‘teachable moments’ as students recursively checked the
accuracy of their representations with their teacher. The construction process also
stimulated students’ enjoyment, which they perceived to enhance their learning. Despite
these affordances, however, significant pedagogical considerations arose from the use of
slowmation as an instructional strategy in a junior secondary school context. These issues
appeared to inhibit opportunities for conceptual change to occur. Finally, in answer to the
third research question, it was found that students’ interest in learning about science, and
geology, was significantly greater if they participated in the construction of a slowmation,
compared to teaching as usual. Interest was also found to be a significant predictor of
students’ conceptual change.
The findings from this study have important implications for understanding the value of
using slowmation construction as a conceptual change strategy in a junior secondary
science context. As such, they informed the development of a pedagogical framework,
the Learning with Slowmation framework, for constructing slowmations in a junior
secondary science context. This framework, as well as the significance and implications
of the broader findings for improving teaching practice in Earth science education, are
presented.
v
Table of ContentsKeywords..........................................................................................................................ii
Abstract ...........................................................................................................................iii
Table of Contents.............................................................................................................v
List of Tables....................................................................................................................x
List of Figures ................................................................................................................xii
Statement on the Contribution of Others ..................................................................xiii
Acknowledgements.......................................................................................................xiv
Publications and Presentations Arising From This Thesis.......................................xvi
CHAPTER ONE: INTRODUCTION............................................................................1
1.1 Context and Background .........................................................................................1
1.3 Aims and Research Questions.................................................................................4
1.4 Significance .............................................................................................................5
1.5 Thesis Overview......................................................................................................7
CHAPTER TWO: LITERATURE REVIEW ..............................................................9
2.1 Chapter Introduction................................................................................................9
2.2 Learning in Science .................................................................................................9
2.3 Conceptual Change in Science ..............................................................................10
2.3.1 The development of multiple perspectives...................................................14
2.3.2 The ‘warming’ trend.....................................................................................17
2.4 The Earth Science Context: A Systematic Review of Conceptual Change
Instructional Approaches.......................................................................................20
2.4.1 Problem formation........................................................................................20
2.4.2 Data collection..............................................................................................21
2.4.3 Data evaluation.............................................................................................22
2.4.4 Analysis ........................................................................................................23
2.4.4.1 General characteristics of the research.............................................24
2.4.4.2 Conceptual change instructional approaches and methods employed
to evaluate their effectiveness ..........................................................25
2.4.5 Interpretation ................................................................................................36
2.4.6 Implications for the Current Study...............................................................37
vi
2.4.6.1 The need for research that challenges traditional notions of
conceptual change ............................................................................38
2.4.6.2 The need for research that employs qualitative data collection
throughout the implementation of the instructional approach .........39
2.4.6.3 The need for research that focuses on the learning of geological
phenomena through the construction of multiple representations ...40
2.5 The Potential of Slowmation as a Conceptual Change Approach to Learning in
Science ..................................................................................................................42
2.5.1 The value of student-generated animation in science education ..................42
2.5.2 Positioning slowmation within a theoretical framework..............................43
2.6 Chapter Summary..................................................................................................45
CHAPTER THREE: RESEARCH DESIGN AND PROCEDURES .......................47
3.1 Chapter Introduction..............................................................................................47
3.2 Research Design ....................................................................................................47
3.3 The School and Class Contexts .............................................................................50
3.4 Research Procedures..............................................................................................51
3.4.1 Organisation .................................................................................................51
3.4.2 Methods of data generation ..........................................................................57
3.4.2.1 Two-tiered multiple-choice test: The GeoQuiz ...............................57
3.4.2.2 Student interest questionnaire: The SILS survey.............................59
3.4.2.3 Students thinking-aloud during construction ...................................59
3.4.2.4 Student interviews............................................................................60
3.4.3 Data Analysis ...............................................................................................60
3.4.3.1 Quantitative analysis ........................................................................60
3.4.3.2 Qualitative analysis ..........................................................................61
3.5 Chapter Summary..................................................................................................64
CHAPTER FOUR: INSTRUMENTATION...............................................................67
4.1 Chapter Introduction..............................................................................................67
4.2 Development of the GeoQuiz................................................................................67
4.2.1 Defining the content .....................................................................................68
4.2.2 Researching students’ alternative conceptions.............................................71
vii
4.2.2.1 Alternative conceptions from the literature .....................................71
4.2.2.2 Alternative conceptions from interviews-about-instances with
students ............................................................................................72
4.2.3 Developing and validating the instrument....................................................78
4.4 The Development of the SILS Survey ..................................................................80
4.4.1 Conceptual origin and adaptations ...............................................................80
4.4.2 Instrument reliability and validity ................................................................85
4.5 Chapter Summary..................................................................................................86
CHAPTER FIVE: QUANTITATIVE RESULTS ......................................................87
5.1 Chapter Introduction..............................................................................................87
5.2 GeoQuiz Results....................................................................................................87
5.2.1 How did students’ conceptions change from pretest to posttest?.................88
5.2.1.1 Students’ conceptions about the nature and movement of tectonic
plates ................................................................................................88
5.2.1.2 Students’ conceptions about the geological processes that occur at
tectonic plate boundaries, including the formation of landforms ....92
5.2.2 Was there a significant change in students’ overall GeoQuiz scores from
pretest to posttest? ........................................................................................97
5.2.3 Was there a significant change in students’ GeoQuiz scores for individual
items from pretest to posttest?......................................................................98
5.4 SILS Survey Results..............................................................................................99
5.4.1 Diagnostics and assumptions........................................................................99
5.4.2 Was there a significant change in students’ overall SILS survey scores from
pretest to posttest? ......................................................................................100
5.4.3 Was there a significant change in students’ overall SILS survey scores for
interest in learning geology topics from pretest to posttest? ......................102
5.4.4 Was students’ interest, generated by the project, a significant predictor of
their conceptual change? ............................................................................103
5.5 Chapter Summary................................................................................................104
CHAPTER SIX: QUALITATIVE RESULTS..........................................................107
6.1 Chapter Introduction............................................................................................107
viii
6.2 Overview of Audio-Recording and Interview Procedures and Analyses............107
6.3 Key Finding 1: Constructing a Slowmation Facilitated Students’ Conceptual
Development .......................................................................................................108
6.3.1 The teacher identified and/or corrected students’ alternative conceptions
during the construction process ..................................................................109
6.3.2 Students found their experience constructing a slowmation enjoyable, which
they perceived to enhance their learning ....................................................116
6.4 Key Finding 2: Pedagogical Issues Associated with Constructing a Slowmation
Inhibited Opportunities for Conceptual Change .................................................118
6.4.1 Students were preoccupied with the procedural aspects of constructing a
slowmation .................................................................................................118
6.4.2 Students lacked motivation to understand the science content and represent
it accurately ................................................................................................120
6.4.3 Students privileged and bypassed modes of representation .......................124
6.4.4 Constructing a slowmation took students “longer than expected”.............125
6.5 Chapter Summary................................................................................................130
CHAPTER SEVEN: DISCUSSION ..........................................................................133
7.1 Introduction .........................................................................................................133
7.2 Review of Aims, Research Methodology and Research Questions ....................133
7.3 Assertion 1: The Construction of a Slowmation Significantly Enhanced Students’
Conceptual Change as it Afforded ‘Teachable Moments’. .................................135
7.4 Assertion 2: Students’ Interest, Generated by their Participation in Constructing a
Slowmation, Facilitated Conceptual Change. .....................................................141
7.5 Assertion 3: Pedagogical Considerations Warrant the Development of a
Framework to Inform the use of Slowmation with School-Aged Learners. .......145
7.6 Towards a Framework for Learning with Slowmation .......................................149
7.7 Limitations of the Research.................................................................................154
7.8 Implications of the Research ...............................................................................157
7.8.1 Implications for curricular design and implementation..............................157
7.8.2 Implications for educational theory............................................................159
7.9 Chapter Conclusion .............................................................................................163

ix
CHAPTER EIGHT: CONCLUSION........................................................................167
References ....................................................................................................................173
Appendices ...................................................................................................................193
x
List of TablesTable 2.1. A summary of the conceptual change instructional approaches and studies
included in this section of the review (N=52)..........................................28Table 3.1. The learning sequence enacted in the comparison classes (adapted from
DETE, 2014)............................................................................................56Table 3.2. Scoring rubric for the GeoQuiz................................................................58Table 3.3. A summary of the key stages of the study, their timing and the relevant
procedures employed................................................................................66Table 4.1. Propositional knowledge statements required for understanding the
concepts covered in the Year 9 C2C unit ‘Changing Earth’....................69Table 4.2. Students’ alternative conceptions about the nature and movement of
tectonic plates...........................................................................................75Table 4.3. Students’ alternative conceptions about tectonic plate boundaries..........76Table 4.4. Students’ alternative conceptions about the occurrence of geological
events at tectonic plate boundaries, including the formation of landforms..................................................................................................78
Table 4.5. Specification grid showing the propositional knowledge statements addressed by each of the GeoQuiz items..................................................80
Table 4.6. Subscales and items of the SILS survey...................................................83Table 4.7. The scoring of students’ responses applied in the analysis of the SILS
survey.......................................................................................................84Table 4.8. Comparison of Cronbach’s for the original and adapted subscales used
in the SILS survey....................................................................................86Table 5.1. Students’ alternative conceptions about the nature and movement of
tectonic plates, as identified by the GeoQuiz...........................................90Table 5.2. The change in students with scientific reasoning about the nature and
movement of tectonic plates, from pretest to posttest..............................91Table 5.3. Students’ alternative conceptions about geological processes that operate
at tectonic plate boundaries, as identified by the GeoQuiz......................94Table 5.4. The change in students with scientific reasoning about the formation of
landforms at tectonic plate boundaries, from pretest to posttest..............95Table 5.5. Results of the paired samples t-tests, which examined changes in
students’ GeoQuiz scores from pretest to posttest...................................98Table 5.6. A summary of the descriptive statistics for the SILS survey
subscales..................................................................................................100Table 5.7. Results of the univariate analyses, which examined the significant
time*condition interaction.......................................................................101
xi
Table 5.8. Results of the paired samples t-tests, which examined changes in students’ interest from pretest to posttest...............................................................102
Table 5.9. Results of the paired samples t-tests, which examined changes in students’ interest in learning about geology topics, from pretest to posttest..........103
Table 5.10. Results of the correlation analysis, which examined relationships between the GeoQuiz and SILS survey change scores, for students who constructed a slowmation........................................................................104
Table 6.1. The sub-sample of students who were audio-recorded while they constructed their slowmation in groups..................................................108
Table 6.2. A summary of the data pertaining to students’ preoccupation with the procedural aspects of creating a slowmation...........................................119
Table F.1. Summary of all results from the intervention group’s pre-intervention SILS survey (N=52)................................................................................212
Table F.2. Summary of all results from the intervention group’s post-intervention SILS survey (N=52)................................................................................213
Table F.3. Summary of all results from the comparison group’s pre-intervention SILS survey (N=43)................................................................................214
Table F.4. Summary of all results from the comparison group’s post-intervention SILS survey (N=43)................................................................................215
xii
List of FiguresFigure 1.1. A diagrammatic representation of the issues influencing Earth science
education in Australia.............................................................................2Figure 2.1. A summary of the process of selecting studies to include in this
review...................................................................................................23Figure 2.2. The 5Rs model of learning through constructing a slowmation (from
Kidman et al., 2012, p.26)....................................................................44Figure 2.3. The MMAEPER model of learning and re-relearning through
slowmation (from Kidman et al., 2012, p.29)......................................45Figure 3.1. A representation of the mixed-methods intervention design adopted in
the research project...............................................................................49Figure 3.2. A representation of the tandem matched-pairs approach adopted in the
current study.........................................................................................50Figure 3.3. A summary of the slowmation construction task presented to students
in the intervention group......................................................................55Figure 3.4. An example item from the SILS survey...............................................59Figure 3.5. Example of how categories and themes were developed from initial
codes through pattern coding...............................................................64Figure 4.1. Approach to the design and validation of the GeoQuiz.......................68Figure 4.2. Concept map linking the unit’s underlying concepts and the
propositional knowledge statements written by the researcher............70Figure 4.3. An example item from the GeoQuiz....................................................79Figure 4.4. Conceptualisation of interest adopted in the current study..................81Figure 7.1. The Learning with Slowmation (LWS) framework...........................150
xiii
Statement on the Contribution of OthersI acknowledge the intellectual contribution of my supervisory team, Dr. Louisa Tomas
and Professor Brian Lewthwaite, who provided ongoing support throughout the design,
implementation and reporting of my research project. I also acknowledge the editorial
assistance they provided in the preparation of this thesis.
I have received financial assistance from the Queensland College of Teachers and the
College of Arts, Society & Education, James Cook University, in the form of travel grants
that have enabled me to attend and present at the Australasian Science Education
Research Association 2015 and 2016 conferences. I also received an Australian
Postgraduate Award stipend for the duration of my candidature. I have not sought or
received any other financial contributions.
The research reported in this thesis was conducted within the guidelines for research
ethics outlines in the National Statement on Ethical Conduct in Human Research (2015).
The research design and procedures received ethics clearance from James Cook
University’s Human Ethics Committee (Approval Number: H5966). The research project
was also approved by the Executive Principal at the College where the research was
undertaken, in accordance with the Guidelines for Conducting Research on Departmental
Sites.
xiv
AcknowledgementsMy sincerest thanks go to Dr. Louisa Tomas, who has shared my PhD journey. Louisa
has been tremendously helpful throughout my candidature and an enthusiastic supporter
of my research. She has been a constant wealth of knowledge and expertise, and I am
privileged to have her as a mentor. I hope that this thesis is the beginning of a long and
rewarding colleagueship.
I would also like to thank Professor Brian Lewthwaite for his intellectual contribution
throughout the design, implementation and reporting of this research. Brian’s extensive
experience in science education research and critical thinking, in particular, were
invaluable.
Thank you to the staff and students at Pine Mountain State College (a pseudonym) who
were involved in my research project. I am very appreciative of the time and patience
afforded to me in during the implementation of the slowmation lessons and the end-of-
project student interviews. A special thanks to the teachers who allowed me access to
their classrooms and did a fantastic job enacting my lesson sequences.
Thank you to Dr. Megan Preece for her assistance with the quantitative analysis of the
GeoQuiz and SILS survey data. This was an invaluable learning experience and I now
have knowledge of statistical analyses that will serve me well in my future academic
career. My gratitude also goes to Leeanne Mills and Erin Siostrom for their help
validating the GeoQuiz so that it effectively measured the College’s enacted curriculum.
I would like to acknowledge the support I received from the Australian Government in
the form of an Australian Postgraduate Award stipend. This enabled me to undertake my
PhD full-time. I would also like to acknowledge the Queensland College of Teachers and
James Cook University for the provision of travel grants that have enabled me to present
my research findings at the Australasian Science Education Research Association’s
annual conferences over the course of my candidature.

xv
Finally, a special thank you to my partner, Daniel, who has been my greatest advocate
during my candidature. I am so very grateful for your unconditional love and support. A
special thank you also to my family, particularly Mum and Dad, who have made many
sacrifices throughout their lives to ensure that I am successful in achieving my goals.
xvi
Publications and Presentations Arising From This ThesisMills, R., Tomas, L., & Lewthwaite, B. (2017). Junior secondary school students’
conceptions about plate tectonics. International Research in Geographical and
Environmental Education.
Mills, R., Tomas, L., & Lewthwaite, B. (2016). Learning in Earth and space science: A
review of conceptual change instructional approaches. International Journal of
Science Education, 38(5), 767-790.
Mills, R., & Tomas, L., & Lewthwaite, B. (2016, June). A cautionary tale of using
slowmation with school-aged learners. Paper presented at the annual Australasian
Science Education Research Association conference, Canberra, ACT.
Mills, R., Tomas, L., & Lewthwaite, B. (2015, July). Representing Earth science
conceptions through slowmation: Preliminary findings on students’ alternative
conceptions about plate tectonics. Paper presented at the annual Australasian
Science Education Research Association conference, Perth, WA.
1
CHAPTER ONE: INTRODUCTION
1.1 Context and Background
Learning about Earth’s physical systems is becoming increasingly important in school
science education. Earth science education provides students with the knowledge and
skills required to engage with contemporary issues such as dwindling natural resources,
climate change, threats to biodiversity, and more frequent and intense natural hazards
(Australian Curriculum and Assessment Reporting Authority [ACARA], 2016a; Dawson
& Carson, 2013). Despite its importance, Earth science education in Australia, where this
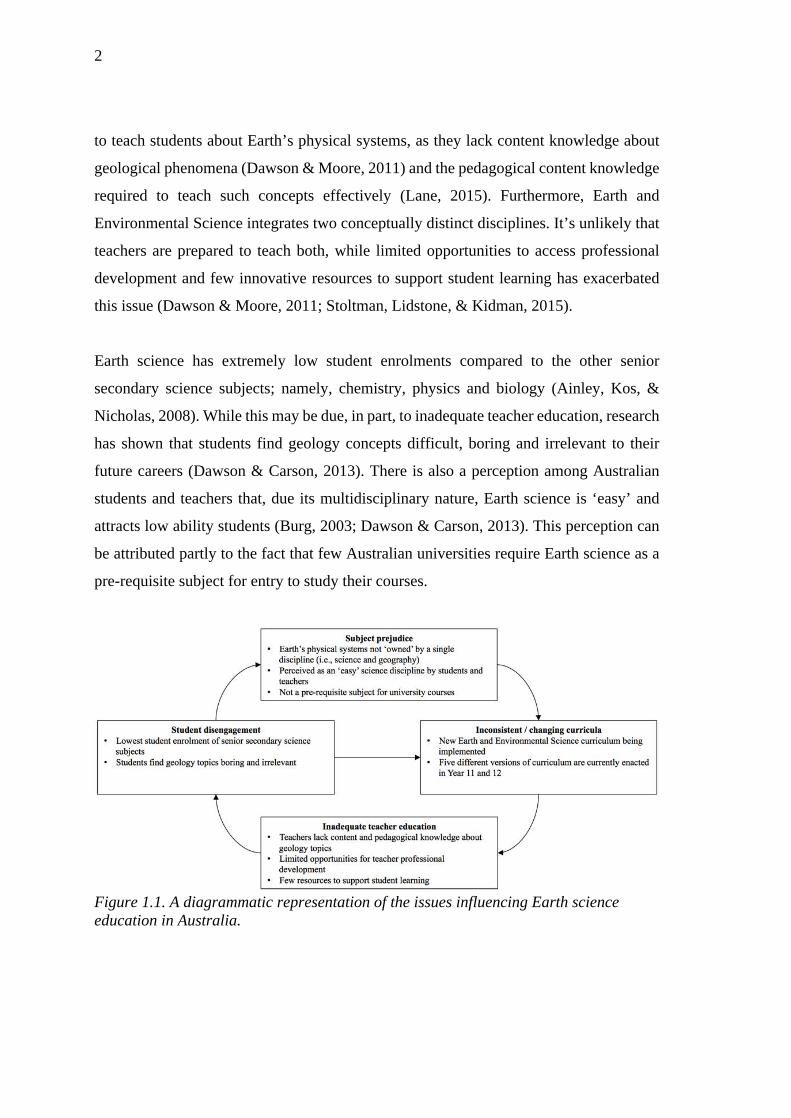
research was conducted, appears to be in a state of disarray, amidst issues of historical
prejudice against the subject (compared to other science disciplines); mandated attention
to Earth science in recent national curriculum changes; teachers questioned pedagogical
proficiency in delivering the Earth science curriculum, with its attention to abstract
science concepts; concerns around teacher preparedness to address these requirements;
and, most importantly for this study, students’ disengagement with Earth science, and the
durability of their alternative conceptions about Earth science phenomena (Figure 1.1).
In Australia, Earth science (i.e., learning about Earth’s physical systems) is mandated
from Preparatory to Year 10 in the Earth and Space Sciences sub-strand of the
Foundation to Year 10 Australian Curriculum: Science (ACARA, 2016b). Although
science is not yet compulsory in Australia’s senior secondary curriculum, students can
elect to study a subject called ‘Earth and Environmental Science’ (ACARA, 2016a). Each
state and territory is responsible for implementing its own senior secondary curricula. At
present, there are five different versions of Earth science enacted in senior secondary
schools. These are: ‘Earth and Environmental Science’ (Australian Capital Territory;
New South Wales; Western Australia); ‘Earth Science’ (Queensland); ‘Geology’
(Northern Territory; South Australia); ‘Environmental Science’ (Victoria); and
‘Environmental Science and Society’ (Tasmania).
The different Earth science curricula taught in Australian schools presents significant
challenges for teachers. In particular, there are concerns that teachers are underprepared
2
to teach students about Earth’s physical systems, as they lack content knowledge about
geological phenomena (Dawson & Moore, 2011) and the pedagogical content knowledge
required to teach such concepts effectively (Lane, 2015). Furthermore, Earth and
Environmental Science integrates two conceptually distinct disciplines. It’s unlikely that
teachers are prepared to teach both, while limited opportunities to access professional
development and few innovative resources to support student learning has exacerbated
this issue (Dawson & Moore, 2011; Stoltman, Lidstone, & Kidman, 2015).
Earth science has extremely low student enrolments compared to the other senior
secondary science subjects; namely, chemistry, physics and biology (Ainley, Kos, &
Nicholas, 2008). While this may be due, in part, to inadequate teacher education, research
has shown that students find geology concepts difficult, boring and irrelevant to their
future careers (Dawson & Carson, 2013). There is also a perception among Australian
students and teachers that, due its multidisciplinary nature, Earth science is ‘easy’ and
attracts low ability students (Burg, 2003; Dawson & Carson, 2013). This perception can
be attributed partly to the fact that few Australian universities require Earth science as a
pre-requisite subject for entry to study their courses.
Figure 1.1. A diagrammatic representation of the issues influencing Earth science education in Australia.
3
There is a distinct need for innovative research projects in the Earth science discipline,
such as the one presented in this thesis, that address these concerns and inform curricular
design and implementation at the classroom level. Although it is beyond the scope of this
thesis to address all of these concerns, it has been suggested that “pedagogies of the
science classroom … have a major influence on students’ choice of whether or not …
science should be part of their future education” (Pike & Dunne, 2011, p. 498). As such,
it follows that researchers should develop and evaluate instructional approaches that
engage school students in Earth science whilst enhancing their conceptual understanding.
In order to design a research project that achieves this aim, the researcher reflected on his
own junior secondary students’ learning about Earth science. He noticed that students
appeared to have incorrect pre-instructional ideas about Earth science topics, often
originating from their frequent misrepresentation in textbooks and popular culture, such
as science fiction and children’s movies. The researcher was frustrated because students’
incorrect ideas persisted after instruction, despite his attempts at facilitating conceptual
change. It was obvious that students rote learned content knowledge for assessment
purposes and their alternative conceptions remained firmly held and resilient to change.
Unsatisfied with the traditional, often behaviourist, instructional approaches already
enacted at his school, the researcher identified the need for a constructivist approach to
learning in Earth science that took into consideration the ideas that students bring with
them to the classroom, and the possibility of using new developments in teaching practice
to support student engagement and learning.
Research in science education confirms that students come to science classes with pre-
instructional alternative conceptions. These alternative conceptions are often incomplete
or incorrect and need to be aligned better with accepted scientific concepts through
instruction. While there is much evidence in the literature to suggest that students hold
alternative conceptions about Earth science concepts, there appears to be a paucity of
intervention studies aimed specifically at correcting these ideas (Cheek, 2010; Francek,
2013; King, 2008; Lelliott & Rollnick, 2010).
4
A review of conceptual change instructional approaches in the Earth science discipline,
elaborated further in Chapter 2, found that intervention studies in this discipline area have
both theoretical and methodological shortcomings (Mills, Tomas, & Lewthwaite, 2016).
First, there is a lack of research in this discipline that challenges traditional notions of
knowledge restructuring by adopting ‘multiple perspectives’ of conceptual change
(Tyson, Venville, Harrison, & Treagust, 1997). In particular, one perspective that remains
under-researched considers affective variables as causal mechanisms for change. While
factors such as interest, self-efficacy and emotion have been shown to influence students’
conceptual change in other science disciplines (e.g., Sinatra & Mason, 2013), research of
this nature has not been carried out in Earth science. Second, intervention studies that aim
to address students’ alternative conceptions about geological phenomena are rare (Cheek,
2010; Francek, 2013; King, 2008; Lelliott & Rollnick, 2010); other Earth science
phenomena (especially astronomical phenomena, which were included in the review)
have been researched to a much greater extent. Third, there is obvious merit in
instructional approaches that require the physical construction and manipulation of
multiple representations, through the use of new technologies. In these instances, there
are several opportunities for students to consider and revise their alternative conceptions.
While this is not an entirely new idea and has been researched in other science disciplines
such as chemistry (e.g., Chang, Quintana, & Krajcik, 2010), instructional approaches that
emphasise opportunities to construct multiple representations of Earth science
phenomena are virtually non-existent.
1.3 Aims and Research Questions
In response to some of the issues canvassed above, this research sought to investigate the
value of constructing slowmations as a conceptual change instructional approach in Earth
science. A slowmation representation is a student-generated stop-motion animation.
During the process of creating a slowmation, students used a variety of representations
(e.g., text, diagrams, physical models, narration) to explain the geological processes that
occur at tectonic plate boundaries. In this study, each manipulation was photographed
with an iPad™ using an application called MyCreate™, and the photographs were
displayed at two frames per second to create a moving animation.
5
The study was conducted with Year 9 students (N=95) at a Preparatory to Year 12 college
in South-East Queensland. Four science classes participated in the research and were
randomly assigned to intervention and comparison conditions. While two intervention
classes created a slowmation to represent a tectonic plate boundary, two comparison
classes experienced ‘teaching as usual’, in alignment with the College’s usual program
of instruction. The three research questions that guided the study were:
1. Does the process of constructing a slowmation have a significant effect on
students’ conceptual change in Earth science?
2. How does the process of constructing a slowmation influence students’
conceptual change?
3. Is students’ interest, generated by the construction of a slowmation, a
significant predictor of their conceptual change?
1.4 Significance
This research responds to the aforementioned theoretical and methodological
shortcomings of existing research. The research questions are very different from one
another, and each requires unique methods of data generation. Subsequently, the research
presented in this thesis is multifaceted and complex, and contributes to multiple fields of
educational theory and practice. Specifically, this study extends conceptual change
research in the Earth science discipline, particularly of geological phenomena;
investigates the interplay between students’ interest and conceptual change, thus
challenging traditional cognition-only views of knowledge restructuring; and contributes
to research that investigates the value of constructing multiple representations of
phenomena using slowmation.
This study’s findings have the potential to inform best practice in Earth science education
in schools and teacher education programs. It is important that research in this field is
developed since the Australian Curriculum now mandates that students studying Science
in Year 9 are required to learn about Earth science concepts such as continental
movement, plate tectonics and geologic activity (i.e., earthquakes and volcanoes). In
Queensland, where this study is located, this is embedded within a mandated unit for state
6
schools in the ‘Curriculum into the Classroom’ (C2C) unit of work entitled ‘Changing
Earth’ (Department of Education Training and Employment [DETE], 2014a)1. This is not
an isolated occurrence of Earth science across the Australian Curriculum, as Queensland
students studying Geography in Year 8 also complete a C2C unit entitled ‘Landscapes’
(DETE, 2014b), while Year 10 students studying Science complete a C2C unit entitled
‘The Universe’ (DETE, 2014c).
It is now undisputed in science education research that cognition-only models of
conceptual change are not appropriate given the emergence of constructivism as the major
theoretical perspective of learning. Despite emerging efforts to explore how affective
variables may bring about conceptual change, this area is still under-researched. In
particular, few studies have investigated how interest may bring about conceptual change.
Of those that do, there are contradictory findings. While some authors report that
students’ interest relates positively to conceptual change (Andre & Windschitl, 2003),
others argue that highly interested students may be more resistant to change (Dole &
Sinatra, 1998). In response to this, the current research aimed to determine the extent to
which students’ interest generated by constructing a slowmation influences their
conceptual change, and will extend existing conceptual change research that adopts an
affective perspective.
Existing studies that have investigated the efficacy of slowmation construction as a
conceptual change strategy strongly advocate for its use in teacher education courses, and
recommend extending its application to school-aged learners. Given that very limited
empirical research has explored this possibility, the current study responds to this gap in
the literature by investigating how creating a slowmation influences Year 9 science
students’ conceptual development. More broadly, the research also responds to a lack of
“efficient conceptual change instruction strategies” (Treagust & Duit, 2008, p. 35), and
1 Queensland schools have been enacting the Australian Curriculum from Preparatory to Year 10 in a range of learning areas since 2012. State schools (and, to some extent, independent and Catholic schools) have been supported by the resource ‘C2C’, which is a suite of whole-school and classroom curricula and resources. C2C curricula and resources are implemented by schools, and adapted to suit school contexts and individual student’s learning needs.
7
studies that further this research agenda are crucial if the theory-practice gap in relation
to conceptual change research is to be narrowed (Treagust & Duit, 2008).
1.5 Thesis Overview
This chapter has reviewed briefly the current state of Earth science education in Australia
and established the need for a conceptual change approach to learning in this discipline.
It presented the research questions that were investigated and the knowledge gaps that
they address. Chapter 2 offers a critical review of the literature that has informed the
study. This chapter, in part, systematically reviews conceptual change instructional
approaches that have been used in the Earth science discipline over the past 25 years. The
research design and procedures, including the methods of data generation and analysis,
are presented in Chapter 3. Chapter 4 describes the development and validation of the two
instruments employed in the study; namely, a two-tiered multiple-choice test (i.e., the
GeoQuiz) and a student questionnaire (i.e., the Student Interest in Learning Science
[SILS] Survey). The quantitative analysis of the results produced by these instruments is
presented in Chapter 5. To provide a more nuanced understanding of these results,
Chapter 6 presents two key findings that arose from the qualitative analysis of think-aloud
data, captured while students constructed a slowmation, and student interviews. A
discussion of the study’s overall findings is presented in Chapter 7. This chapter discusses
three claims that arose from the analysis of the data and introduces a pedagogical
framework, the Learning With Slowmation (LWS) Framework, that can be used by
teachers to facilitate the effective use of slowmation construction in junior secondary
science. Finally, in Chapter 8, concluding remarks and recommendations for further
research are presented.

8
9
CHAPTER TWO: LITERATURE REVIEW
2.1 Chapter Introduction
This chapter presents the literature that informed the project’s research aims and design.
It is presented in five main parts. Section 2.2 provides a brief introduction to learning in
science and situates the research within a constructivist orientation, which will be argued
is most aligned to the requirements of Earth science education given the aforementioned
concerns. For this reason, Section 2.3 is a critical review of the conceptual change
literature in science education generally. This section details the development of several
perspectives of conceptual change and examines the role of affective variables in bringing
about conceptual change. Section 2.4 is a systematic review of conceptual change
literature specifically relating to Earth Science education. This section reviews conceptual
change approaches that have been used previously in Earth science, and the methods that
have been used to evaluate the effectiveness of these approaches. Section 2.5 examines
research on student-generated animations, including slowmation, and establishes it as a
potential conceptual change approach by positioning it within a conceptual change
theoretical framework. Finally, in Section 2.6, the chapter concludes with a discussion of
the implications of the key findings of the literature review for the current study that
delineate it from existing conceptual change research, both in research aim and method.
2.2 Learning in Science
Traditional notions of learning in science are influenced by behaviourist learning theory.
The premise of behaviourist instruction, influenced mainly by the work of Skinner (1954),
is the idea that learning occurs as a result of reinforcing desired behaviours. This view of
learning in science assumed that the learner has no knowledge of a topic before being
formally taught, and the learner’s mind was viewed as a tabula rasa to be ‘filled’ with
science information (Gilbert, Osborne, & Fensham, 1982).
These early views are in stark contrast to the constructivist theories that now inform
learning in science. Constructivist approaches recognise the influence of prior experience
on how phenomena are perceived and interpreted, emphasising the importance of the
10
learner’s existing knowledge in the meanings that they construct (Ausubel, 1968; Driver
& Oldham, 1986; Gilbert et al., 1982; Osborne & Freyberg, 1985; Osborne & Wittrock,
1985; Vosniadou & Brewer, 1987). Thus, “the sense made of any event is seen to be
dependent not only on the situation itself but also on the individual’s … active
construction of meaning” (Driver & Oldham, 1986, p. 106).
The modification of an individual’s existing conceptual structures has been termed
‘conceptual change’ (Hewson, 1981; Posner, Strike, Hewson, & Gertzog, 1982).
Conceptual change theory, therefore, is concerned with how students’ pre-instructional
conceptions can be aligned better with accepted scientific concepts. The premise that an
individual’s existing ideas influence their learning is evident in models of conceptual
change that have permeated much of the science education research in the 1980s and
1990s. Significant attention is devoted to reviewing the conceptual change literature in
the following section.
2.3 Conceptual Change in Science
Notions of conceptual change have been evident in science education literature for the
past three decades. This section will detail the progression of conceptual change since the
early 1980s. It will draw on the views of prominent researchers in the field to make
assertions about the current state of conceptual change research.
Research in science education has shown that students commonly come to science classes
with incomplete or incorrect pre-instructional alternative conceptions that need to be
aligned better with accepted scientific concepts. The classical view of conceptual change
holds that alternative conceptions can be altered by or replaced with scientific concepts
(Hewson, 1981; Posner et al., 1982). There are three conditions that must be met for
conceptual change to occur: intelligibility, plausibility and fruitfulness (Posner et al.,
1982). A concept is intelligible once understood by the student; plausible if it aligns with
the student’s existing conceptions, and is thus believable; and fruitful if it is useful to the
student.
11
Proponents of the classical conceptual change model believe that it is possible to
determine the degree to which a student has met the conditions required for conceptual
change to occur. Treagust and Duit (2008) explore further how intelligibility, plausibility
and fruitfulness may manifest. Their research has shown that intelligibility often
manifests as a linguistic or symbolic representation of a given concept. For instance, a
concept is intelligible if a student can use an analogy, metaphor or diagram to represent
the concept, or they can provide a real-world example of the concept. If a student is able
to link the concept with observations or data from science lessons, or their individual past
experiences, then it can be assumed that the concept is believable, or plausible, to the
student. Finally, if a concept has wide applicability and the potential to solve problems
(particularly problems that arise from competing conceptions) then it is viewed as being
fruitful to the student.
It is well established that existing conceptions are often resistant to change, and as such,
conceptual change approaches commonly aim to cause ‘conceptual conflict’ (Hewson,
1981; Posner et al., 1982). This occurs when a student becomes aware that a scientific
conception does not align with his/her existing conception. Often, conceptual conflict is
a result of contradictory evidence, anomalous data or a discrepant event. Posner et al.
(1982) broadly term these examples ‘anomalies’; that is, unsuccessful attempts to
integrate a new conception within existing conceptual frameworks. Conceptual conflict
is often viewed as a fourth condition necessary for conceptual change to occur (Hewson,
1981; Posner et al., 1982).
Although the premise of conceptual change is simple, the interaction between existing
and new conceptions is complex. The outcome of the interaction is dependent on a
student’s ‘conceptual ecology’, a term that Posner et al. (1982) borrowed from earlier
work in cognitive science (Toulmin, 1972). A student’s conceptual ecology refers to the
“conceptual framework by which he or she makes sense of the world” (Hewson, 1981, p.
392). It includes an individual’s epistemological commitments and metaphysical beliefs
about science (Posner et al., 1982), and has evolved over the past three decades to include
a range of affective factors (Pintrich, Marx, & Boyle, 1993).
12
The ‘status’ afforded to a new conception depends on its relationship with existing
cognitive frameworks, and therefore, the degree to which the student finds the new
conception intelligible, plausible and fruitful (Hewson, 1981). A student may: (1) accept
the new concept and replace existing conceptions; (2) accept the new concept alongside
existing conceptions; (3) reject the new concept; or (4) compartmentalise the new concept
so that it does not interact with existing conceptions (i.e., rote learn) (Hewson, 1981;
Posner et al., 1982). If a new conception is preferred (i.e., has a higher conceptual status)
then it may be accepted and replace an existing conception. This has been termed
‘conceptual exchange’ (Hewson, 1981) or ‘accommodation’ (Posner et al., 1982). If
neither conception has a higher status, then the new conception may be accepted
alongside existing conceptions, and is known as ‘conceptual capture’ (Hewson, 1981) or
‘assimilation’ (Posner et al., 1982). This may involve the addition of a new conception
and/or reorganisation of existing conceptions. It has been suggested that this type of
conceptual change is most common (Duit & Treagust, 1998). Often, features of the
scientific concept will merge with existing conceptions, resulting in ‘peripheral’
conceptual change (Chinn & Brewer, 1993). This occurs because the scientific conception
is not a source of cognitive conflict. Rather, it is able to be reconciled with the student’s
existing conceptions, and is “seen in the context of his or her present knowledge and
understanding” (Hewson, 1981, p. 368). If the new conception is not accepted, no
conceptual change will occur. This may occur if the learner has a strong commitment to
their existing conception (Hewson, 1981). Finally, the new conception may have no
interaction with existing conceptions. This has been described as ‘cognitive segregation’,
where “students create a compartment for scientific knowledge from which it can be
retrieved on special occasions, such as a school exam, but in everyday life it has no affect”
(Cobern, 1996, p. 588). This occurs if a new concept is rote learnt.
Whether conceptual change occurs suddenly or develops slowly over time is a question
that has received much attention in the literature. In their classical conceptual change
model, Posner et al. (1982) drew from Thomas Kuhn’s work on ‘scientific revolutions’
and Piaget’s ideas of assimilation and accommodation (Treagust & Duit, 2008).
Conceptual changes were traditionally viewed as radical and abrupt. Since then, it has
13
been suggested that conceptual change lies on a continuum from ‘revolutionary’ to
‘evolutionary’. The nature of the conceptual change that occurs is dependent on factors
such as the concept being learned and the instructional approach (Treagust & Duit, 2008).
A developmental perspective also exists that suggests young children’s ideas are often
based on their everyday experience, and are fundamentally different from those of adults
or scientists. Therefore, conceptual change is viewed as a “gradual process during which
initial conceptual structures … are continuously enriched and restructured” (Vosniadou
& Ioannides, 1998, p. 1221; emphasis added). There is a general consensus now that
conceptual change occurs gradually over time, in alignment with this view. As such, this
is the view of conceptual change that has informed the current study.
At this point it is important to acknowledge and define relevant terminology in the field
of conceptual change, and clarify the terms that will be used henceforth in the current
study. The term ‘conception’ will be used to describe an “individual’s idiosyncratic
mental representations” (Duit & Treagust, 1995, p. 47) of a scientific phenomenon.
Conceptions are “dynamic, situated, and constantly changing representations that adapt
to contextual variables and/or to the learners’ developing knowledge” (Vosniadou, 2008,
p. 279). In contrast, the term ‘concept’ will refer to “firmly defined or widely accepted”
conceptions (Duit & Treagust, 1995, p. 47). The incorrect or incomplete pre-instructional
conceptions that students bring with them to science classes will be referred to as
‘alternative conceptions’, to emphasise the difference between students’ idiosyncratic
conceptions and more widely accepted scientific concepts. Finally, both ‘conceptual
change’ and ‘conceptual development’ have been used purposefully throughout the
thesis, to differentiate between ‘strong’ and ‘weak’ conceptual change respectively. In
other words, the term ‘conceptual change’ has been used to describe the complete
replacement or modification of an existing conception, whereas ‘conceptual
development’ has been used to describe the addition of scientific ‘elements’ to an existing
conception. It is to be noted that these definitions are not consistent with notions of
classical conceptual change as described above, but rather, they recognise that there are
multiple perspectives about the nature of misconceived knowledge and what constitutes
conceptual change.
14
2.3.1 The development of multiple perspectives
There are multiple perspectives concerning the nature of conceptual change that give rise
to different conceptual change models. One variation of the classical conceptual change
model suggests that alternative conceptions arise if students assign concepts to incorrect
ontological categories (Chi, Slotta, & De Leeuw, 1994). From this perspective,
conceptual change occurs when students change the way they perceive the nature of a
conception. Another variation considers the role of affective factors, such as motivation,
interest and self-efficacy, as variables that bring about conceptual change (Pintrich et al.,
1993). Finally, some authors have advocated for a multidimensional model that views
conceptual change from epistemological (classical), ontological and affective
perspectives (Treagust & Duit, 2008; Tyson et al., 1997).
Notions of conceptual change have developed over the last three decades in response to
much discussion in the field. Perhaps the most well known critique of the conceptual
change model is presented by Cobern (1996). His commentary presents two major
assumptions inherent to the model. First, the conceptual change model assumes that
scientific conceptions are superior to alternative conceptions (Cobern, 1996). Second, the
model assumes that students come to science classes with a scientifically compatible
worldview (Cobern, 1996). This is problematic given that science conceptions may not
always align with a student’s worldview, and therefore, their alternative conception will
persist, irrespective of whether the scientific concept is comprehended by the learner.
Cobern (1996) argues that “knowing is a metaphysical process by which one comes to
apprehend, that is to accept as true or valid, the concept one has comprehended. Of critical
importance is the fact that comprehension does not necessitate apprehension” (Cobern,
1996, p. 13). Others have acknowledged this view and have labeled the ideas that students
bring with them to science classes as sensible and useful (e.g., Osborne & Wittrock,
1985).
A second argument that surfaced shortly after the publication of Posner et al.’s (1982)
work concerns the role of affective factors in conceptual change. In the classical
conceptual change model, the authors describe learning as a “rational activity” (Posner et
15
al., 1982, p. 212) where judgments are made about ideas “on the basis of evidence” (Strike
& Posner, 1982, p. 232). It has been suggested that this “cognition-only model” (Pintrich,
et al., 1993, p. 167) is an over-rationalised view of learning that fails to consider the role
of factors such as motivation, interest, self-efficacy, feelings and emotions as “conceptual
supports for new knowledge” (Tytler & Prain, 2010, p. 2058). It is even suggested that
‘non-rational’ factors such as feelings “are integral parts of what learning is and not
simply … affective antecedents upon which learning depends” (West & Pines, 1983, p.
38). In a revision of their conceptual change model a decade after its publication, Strike
and Posner (1992) acknowledged that “a wider range of factors need to be taken into
account in attempting to describe a learner’s conceptual ecology” (p. 162). Despite the
argument for further research into the interplay between affect and conceptual change,
there remains little research that explores this.
Some studies, for example, those pioneered by Chi and colleagues (1994), have viewed
conceptual change from an ontological perspective. They argue that “although Posner’s
theory is widely accepted by science educators and easy to comprehend and apply to
learning activities … it does not delineate what the nature of a scientific concept is, which
causes difficulty in learning the concept” (Chi, Chou, & Liu, 2002, p. 689). Their
perspective of conceptual change is based upon three principles. First, conceptions belong
to one of three primary ontological categories, or ‘trees’ (namely matter, processes and
mental states); second, most scientific principles belong to a process category; and third,
alternative conceptions may arise if students incorrectly assign concepts to these
categories. They have argued that many science concepts are inaccurately conceptualised
as matter rather than processes, and alternative conceptions arise as a result. From this
perspective, conceptual change is how the student perceives the nature of a conception,
and occurs when students re-assign an ontological category to a conception (called ‘tree
swapping’). This suggests that conceptual change can occur if a student changes the way
he/she views a concept.
While the classical conceptual change model and many conceptual change studies over
the last three decades view conceptual change from an epistemological perspective,
16
‘affective conceptual change’ has been given greater attention in response to the
aforementioned arguments. The notion of affective conceptual change perhaps originated
from research conducted by Pintrich et al. (1993), although West and Pines (1983)
suggested that there is a relationship between affective factors and cognition much earlier.
Early studies in this area (e.g., Venville & Treagust, 1998) sought evidence of affective
conceptual change in students’ comments at interview, and only recently, more objective,
quantitative attempts to link affect and cognition have surfaced (e.g., Cordova, Sinatra,
Jones, Taasoobshirazi, & Lombardi, 2014; Linnenbrink-Garcia, Pugh, Koskey, &
Stewart, 2012). Section 2.3.2 gives significant attention to the role of affective variables
including achievement goals, epistemic motivations and beliefs, interest and self-efficacy
in bringing about conceptual change.
In the mid to late 1990s, some authors began to adopt a multidimensional perspective of
conceptual change (Venville & Treagust, 1998; Tyson et al., 1997). This approach views
conceptual change from epistemological, ontological and affective perspectives:
The ontological lens of the multidimensional framework of conceptual change
examines the way a student perceives the nature of the thing being studied; that
is, the student is looking “out” at the world. The epistemological lens examines
how the student perceives his or his own knowledge about the thing being studied;
that is, the student is looking “in” at their own knowledge. The social/affective
lens examines the social/affective conditions necessary for conceptual change to
occur. (Tyson et al., 1997, p. 398)
A multidimensional perspective of conceptual change has been used in a number of
studies, including an exploration of Year 10 students’ (N=79) conceptions of genes
during a 10-week genetics course (Venville & Treagust, 1998). The authors found that
each of the three perspectives of conceptual change had explanatory value and offered
different theoretical perspectives to make judgments about students’ conceptual
development.
17
Finally, since conceptual change models are firmly situated within constructivist
orientations, where students construct knowledge for themselves, the notion of
‘intentional conceptual change’ has arisen (Sinatra & Pintrich, 2003). From this
perspective, “learners do not necessarily plan to modify their knowledge in a particular
way” (Sinatra & Taasoobshirazi, 2011, p. 209). While a student may be intentionally
engaged in knowledge construction, they are not necessarily engaged in a deliberate
process of knowledge reconstruction. Intentional conceptual change is therefore
dependent on a variety of factors that may be considered self-regulatory, including
cognitive, metacognitive and motivational processes (Sinatra & Pintrich, 2003). Although
the notion of intentional conceptual change is probably not typical, instructional
approaches based on this perspective have the potential to bring about conceptual change
in instances where alternative conceptions about science are firmly held by students:
The intent to change and the self-regulation of the change process is critical in
science because students come to the science learning situation with deeply held
knowledge and beliefs that conflict with scientific understanding. To overcome
such strongly held misconceptions, self-regulated, intentional conceptual change
may provide the leverage needed to overcome these barriers. (Sinatra &
Taasoobshirazi, 2011, p. 210)
Recently, notions of classical conceptual change have been challenged throughout the
conceptual change literature. Adopting a multidimensional perspective of conceptual
change that includes combinations of classical, ontological and affective perspectives has
been suggested as the most current approach to furthering research in the field (Treagust
& Duit, 2008). The following section pays particular attention to affective variables that
influence students’ conceptual development by summarising the existing research
literature.
2.3.2 The ‘warming’ trend
Perhaps the most significant development in the field of conceptual change research is
the ‘warming trend’ that describes the move away from cognition-only models of
conceptual change (Sinatra, 2005). As identified in the previous section, early studies in
18
this area sought evidence of affective conceptual change in students’ comments at
interview, and only recently, more objective, quantitative attempts to link affect and
cognition have surfaced. The research that is emerging shows that certain ‘learner
characteristics’ seem to influence the occurrence of conceptual change (Sinatra & Mason,
2013). These include achievement goals (Taasoobshirazi & Sinatra, 2011); epistemic
motivations and beliefs (Qian & Pan, 2002); interest (both individual and situational
interest) (Andre & Windschitl, 2003; Mason, Gava, & Boldrin, 2008; Murphy &
Alexander, 2004; Venville & Treagust, 1998); and self-efficacy (including students’
commitment to and efficacy about alternative conceptions) (Linnenbrink-Garcia et al.,
2012). It also appears that a certain combination of affective characteristics might predict
conceptual change (Cordova et al., 2014; Linnenbrink-Garcia et al., 2012).
Increased attention has been paid to understanding the influence of these characteristics
in bringing about conceptual change. A review of studies that examine the relationship
between affective factors and conceptual change conducted by Sinatra and Mason (2013)
identifies research on the following affective variables: achievement goals; epistemic
motivations and beliefs; interest; and self-efficacy. These will now be briefly reviewed,
in turn.
Achievement goals: Both mastery and performance achievement goals have been
found to promote conceptual change (Linnenbrink & Pintrich, 2002; Qian & Pan,
2002; Taasoobshirazi & Sinatra, 2011).
Epistemic motivations and beliefs: An ‘avoiding closure’ motivation, where
students seek new information, question current ideas and solve discrepancies and
problems, has been positively linked to conceptual change (Kruglanski & Webster,
1996). Also, the belief that knowledge is changing rather than static has been
conducive to conceptual change (Qian & Alvermann, 1995).
Interest (topic interest and situational interest): Research regarding the impact of
interest on students’ conceptual change has yielded mixed results, with some
studies showing a positive link, and others showing a negative relationship (Andre
& Windschitl, 2003; Venville & Treagust, 1998).
19
Self-efficacy (students’ confidence in their capability and their commitment to
alternative conceptions): Studies that investigate students’ self-efficacy have also
produced mixed results. Some studies report that students’ self-efficacy creates
confidence in their capability to learn through changing their ideas (Cordova et al.,
2011), while others report that students’ self-efficacy enhances their commitment
to their alternative conceptions (Linnenbrink-Garcia et al., 2012).
Recent studies have examined how combinations of affective variables might predict
conceptual change. Cordova et al. (2014) point out that although several affective
variables are hypothesised to play a role in bringing about conceptual change, research
demonstrates that when these variables are considered in isolation, they are not successful
in doing so. When they are considered alongside other affective variables, however,
certain combinations have brought about conceptual change. For instance, when self-
efficacy, interest and prior knowledge are considered alone, they have been found to have
no influence on conceptual change, but when considered together, they support
conceptual change (e.g., Linnenbrink-Garcia et al., 2012).
The Cognitive Reconstruction of Knowledge Model (CRKM) describes the interaction
between a learner’s characteristics and a new concept (Dole & Sinatra, 1998). The model
pays particular attention to the influence of background knowledge (including the
strength and coherence of, and commitment to, existing conceptions) and motivational
factors on conceptual change. The premise of the model is that students will engage with
a concept at a certain level (from high engagement to low engagement) based on the
interaction between background knowledge, motivational factors and cognitive processes
(i.e., whether the concept meets the traditional conditions considered necessary for
conceptual change to occur). This, in turn, determines the conceptual change that takes
place: none, weak, strong or long lasting.
20
2.4 The Earth Science Context: A Systematic Review of Conceptual Change
Instructional Approaches
This section presents a systematic literature review of conceptual change instructional
approaches employed in the Earth science discipline over the past 25 years. The findings
of this review are also published in Mills et al. (2016). It is to be noted that instructional
approaches for teaching astronomy have been included in this section of the review. This
was a methodological decision made by the researcher in response to finding very few
intervention studies specific to geology topics. The decision to widen the scope of the
review is warranted, given that astronomical phenomena operate on spatial and temporal
scales that are difficult to directly observe, and research indicates that students have
widespread alterative conceptions about such phenomena (see Lelliott & Rollnick, 2010).
These challenges are common also to geological concepts. Furthermore, it would be
remiss not to review instructional approaches from such an intimately related discipline
wherein conceptual change research is more established, and use the findings to further
inform and justify the current study.
In this section of the literature review, procedures for reviewing the literature according
to Randolf (2009) were adopted. As the process of conducting secondary research mirrors
the process of conducting primary research, the tasks to conduct a systematic literature
review include: (1) problem formation; (2) data collection; (3) data evaluation; (4)
analysis; and (5) interpretation (Randolf, 2009). These tasks were operationalised as
outlined below.
2.4.1 Problem formation
The first task in problem formation is to develop questions that will guide the literature
review. In this review, the two research foci are instructional interventions and methods
of conceptual change literature within the Earth and space science discipline. It was the
researcher’s aim to integrate findings from multiple approaches and contexts. As such,
the following questions were developed to guide this section of the literature review:
1. What are the general characteristics of the literature?
21
2. What conceptual change instructional approaches have been used in an Earth
and space science education context?
3. What methods were used to evaluate the effectiveness of these approaches?
4. What are the recommendations for future research synthesised from the
existing literature?
For the purposes of this review, peer-reviewed empirical studies that met the following
two criteria were included: (1) quantitative and/or qualitative research methods were
employed; and (2) data were generated to determine the effectiveness of a conceptual
change instructional approach used in the Earth and space science discipline. The
researcher excluded research that simply identified students’ alternative Earth and space
science conceptions, or did not analyse learning from a conceptual change perspective.
2.4.2 Data collection
The studies included in this review were compiled from four sources: (1) a search of the
Education Resources Information Centre (ERIC) and PsychInfo databases for studies
published in 1980 onwards; (2) a manual search of recent issues of science education,
educational psychology, and cognitive science journals for studies published in 2010
onwards (a shorter time span was chosen due to the time intense nature of manually
searching journals); (3) the reference lists of studies identified as relevant; and (4) the
reference lists of three existing literature reviews.
The researcher began with a search of the two academic databases. The following search
terms were used: (“Earth science*” OR Geoscience* OR Geolog* OR Astronom*) AND
(“conceptual change*” OR “conceptual development*” OR misconcept* OR “alternative
framework*” OR “naïve idea*”). As much research now considers the impact of affective
variables on students’ conceptual change, follow-up searches using the above keywords
in addition to (affect* OR emotion* OR interest* OR efficacy) were conducted. The
number and specificity of the search terms was refined to ensure that the search results
would be a robust representation of the existing research. As well, recent issues of
particularly relevant journals were searched manually throughout the preparation of the
22
review to ensure data collection was thorough, namely the International Journal of
Science Education, the Journal of Research in Science Teaching, the Journal of Science
Teacher Education, Learning and Instruction, Research in Science Education, Science
Education, Studies in Science Education, Cognitive Psychology, Contemporary
Educational Psychology, Educational Psychologist, Educational Psychology Review, the
Journal of Educational Psychology, and the Journal of Learning Sciences. Two
discipline-specific science education journals were searched manually; the Journal of
Geoscience Education and Astronomy Education Review.
Finally, the reference lists of relevant studies were analysed to identify any further
relevant studies, and so on, until a point of saturation was reached where the researcher
was certain that no more relevant studies could be obtained from this process. Particular
attention was given to four existing literature reviews of Earth science or astronomy
education, conducted by Cheek (2010), Francek (2013), King (2008) and Lelliott and
Rollnick (2010).
2.4.3 Data evaluation
The overall approach to data collection and evaluation is shown in Figure 2.2. The
researcher identified potentially relevant studies from hundreds of search results by first
reading their title and abstract. Following this, many of the studies were read in full to
determine their relevance. Information was extracted from 52 studies only. The remaining
studies were excluded from the review for two main reasons. First, these studies did not
analyse learning from a conceptual change perspective. Instead, they presented
interventions that increased students’ conceptual knowledge, but were not specifically
designed to address students’ alternative conceptions or measure conceptual change (e.g.,
Gobert & Clement, 1999). Second, these studies were theoretical discussions, or simply
identified students’ alternative conceptions and did not evaluate an intervention
designed to change them (e.g., Blown & Bryce, 2006; Vosniadou & Brewer, 1992).
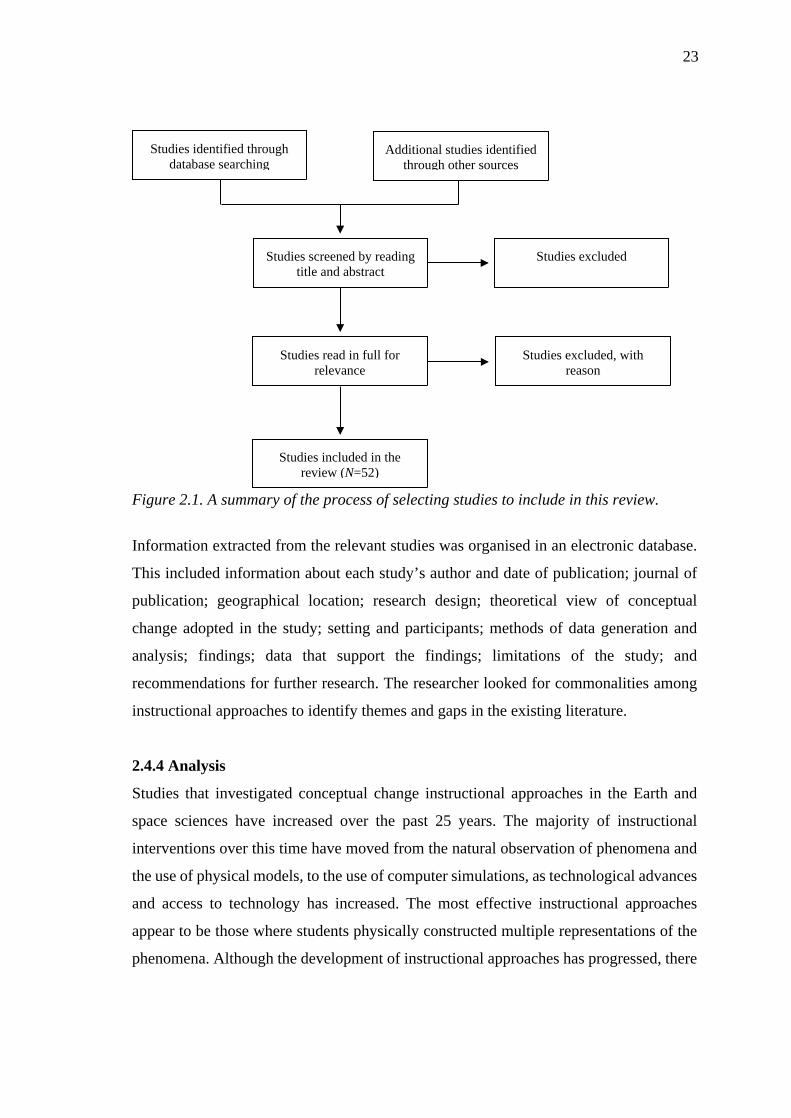
23
Figure 2.1. A summary of the process of selecting studies to include in this review.
Information extracted from the relevant studies was organised in an electronic database.
This included information about each study’s author and date of publication; journal of
publication; geographical location; research design; theoretical view of conceptual
change adopted in the study; setting and participants; methods of data generation and
analysis; findings; data that support the findings; limitations of the study; and
recommendations for further research. The researcher looked for commonalities among
instructional approaches to identify themes and gaps in the existing literature.
2.4.4 Analysis
Studies that investigated conceptual change instructional approaches in the Earth and
space sciences have increased over the past 25 years. The majority of instructional
interventions over this time have moved from the natural observation of phenomena and
the use of physical models, to the use of computer simulations, as technological advances
and access to technology has increased. The most effective instructional approaches
appear to be those where students physically constructed multiple representations of the
phenomena. Although the development of instructional approaches has progressed, there
Studies identified through database searching
Additional studies identified through other sources
Studies screened by reading title and abstract
Studies excluded
Studies read in full for relevance
Studies included in the review (N=52)
Studies excluded, with reason
24
have been limited theoretical and methodological progressions during this transition. This
is reflected in four assertions, evidenced by the findings of this review, as follows:
1. Astronomical phenomena have received greater attention in the literature than
geological phenomena;
2. Most studies have viewed conceptual change from a cognitive perspective
only;
3. Data about conceptual change is generated pre- and post-intervention only; and
4. The interventions reviewed present limited opportunities to involve students in
the physical construction of multiple representations.
The findings that support each of these assertions are presented below.
2.4.4.1 General characteristics of the research
The following section presents a summary of the general characteristics of the studies
included in this section of the review.
Publisher, date, and location of research. Most of the studies were published in leading
science education journals such as the Journal of Research in Science Teaching, rather
than discipline-specific journals such as the Journal of Geoscience Education or
Astronomy Education Review. Even fewer studies were published in educational
psychology journals. The number of intervention studies has increased over the past 25
years. Of the 52 studies included in this review, most were published in the previous
decade. Most of the research was conducted in the United States. Research has also been
carried out to a lesser extent in Australia, Canada, Cyprus, Finland, Greece, Israel, Italy,
Portugal, New Zealand, Taiwan, Turkey and the United Kingdom.
Earth and space science topics. Of all the studies included in the review, the majority
reported on an instructional approach designed to facilitate participants’ accurate
conceptions of astronomical phenomena (N=44). Fewer investigated instructional
approaches designed to facilitate participants’ accurate conceptions of geological
phenomena or other Earth science related phenomena such as climate change science
25
(N=8). The most widely researched astronomical phenomenon was the Earth-moon-sun
system, including the causes of moon phases and seasons. Other astronomical phenomena
researched are participants’ conceptions of Earth; the alternation of day and night; the
solar system; planetary motion; stars and the sun; light; galaxies; astronomical size and
scale; and tides.
Participants. A large proportion of studies were conducted with primary and secondary
school students. Some studies were conducted with undergraduate students or pre-service
teachers. Very few studies evaluated interventions targeting teachers’ alternative
conceptions. All of the studies that did so targeted primary school teachers; no studies
were aimed at facilitating secondary school teachers’ scientific conceptions.
Research design. The majority of studies were small-scale research projects conducted
with small groups of students, such as intact classes of elementary school students. Most
adopted some sort of single case study research design. As such, the research was mostly
exploratory and interpretive in nature. A smaller number of studies were quasi-
experimental and aimed to compare intervention and comparison groups.
Theoretical perspective of conceptual change. Almost all of the research conducted
viewed conceptual change from a cognitive perspective. Only two studies adopted an
affective perspective (Broughton, Sinatra, & Nussbaum, 2013; Cordova et al., 2014). In
these studies, the researchers aimed to determine the influence of affective variables on
participants’ conceptual change. No studies considered how an intervention impacted
students’ perception of a given concept (i.e., ontological conceptual change).
2.4.4.2 Conceptual change instructional approaches and methods employed to
evaluate their effectiveness
The reviewed studies employed several conceptual change approaches to align better the
participants’ alternative conceptions of astronomical or geological phenomena with
accepted scientific concepts. These included simulations, natural observation, refutational
text, physical models, analogy, cognitive conflict, student-generated animation and other
26
specific teaching and learning sequences (Table 2.1). In this section, each instructional
approach and its effectiveness are reviewed, in turn.
Simulations. Simulations present the most frequently researched instructional approach
for bringing about conceptual change. Ten studies investigated the effectiveness of
simulations in facilitating participants’ accurate conceptions of astronomical phenomena.
It is apparent that technological advances and access to technology are allowing
researchers (particularly in the last decade) to address the abstract nature of the Earth-
moon-sun system and related astronomical phenomena. The research focused on three
main simulations: Starry Night™ (Bell & Trundle, 2008; Binns, Bell, & Smetana, 2010;
Hobson, Trundle, & Saçkes, 2010; Trundle & Bell, 2010), Virtual Solar System™ (Gazit,
Yair, & Chen, 2005; Keating, Barnett, Barab, & Hay, 2002) and CosmoWorld™ (Bakas
& Mikropoulos, 2003). These simulations are interactive, allowing for students’ direct
manipulation of the phenomena under study. While Starry Night™ offers a two-
dimensional representation of the night sky, Virtual Solar System™ and CosmoWorld™
offer both three-dimensional representations of the Earth-moon-sun system. One other
general modeling program was used (Küçüközer, 2008; Küçüközer, Korkusuz,
Küçüközer, & Yürümezoglu, 2009). The majority of this research followed an inquiry-
oriented teaching and learning sequence, whereby students: (1) gathered, recorded and
shared data about the moon; (2) analysed their data and looked for patterns; and (3)
modelled the cause of moon phases (e.g., Bell & Trundle, 2008).
Data were generated pre- and post-intervention and were analysed from a cognitive
perspective. Data generation was typically qualitative, as pre- and post-interviews were
by far the most common method employed. At interview, students demonstrated their
conceptual understanding by completing drawing or modeling tasks. Participants’ pre-
and post-instructional conceptions were generally coded using a constant-comparative
approach. Participants’ pre- and post-instructional conceptions were coded using a
framework that categorised their ideas on a continuum that included ‘no conception’,
‘incomplete or alternative conceptions’, and ‘scientific conceptions’. In most cases, this
was quantified by assigning a score to the nature of students’ conceptions, allowing a per
27
cent increase from pre- to post-instruction to be calculated. Gazit and colleagues (2005)
employed an atypical approach by video-recording participants during instruction to
capture students’ interactions with the simulation.
The studies reviewed reported that there was typically an increase in the number of
students who held more scientific conceptions of phenomena post-instruction. It is likely
that simulations, being a simplified version of reality, provided access to phenomena that
were otherwise unobservable. In the case of Virtual Solar System™, this may be due to
the three-dimensional representation supporting students’ ability to visualise abstract
concepts from multiple viewpoints (Keating, Barnett, Barab, & Hay, 2002). This
particular simulation, which is especially interactive, is deemed beneficial because of its
descriptive and predictive ability; that is, it not only helps explain the Earth-moon-sun
system, but through interaction and manipulation, it also helps to explain what might be
expected when variables are changed (e.g., the time Earth takes to orbit the sun). One
study found that the use of a simulation reinforced students’ alternative conceptions
(Gazit et al., 2005). The authors suggest a few reasons for this, including that students
may have misinterpreted features of the simulation (e.g., the graphics) or experienced
difficulty comprehending the multiple viewpoints (i.e., not having a fixed point of
reference to view phenomena). Two studies had conflicting findings about the
effectiveness of using Starry Night™ over natural moon observations (Binns et al., 2010;
Trundle & Bell, 2010).
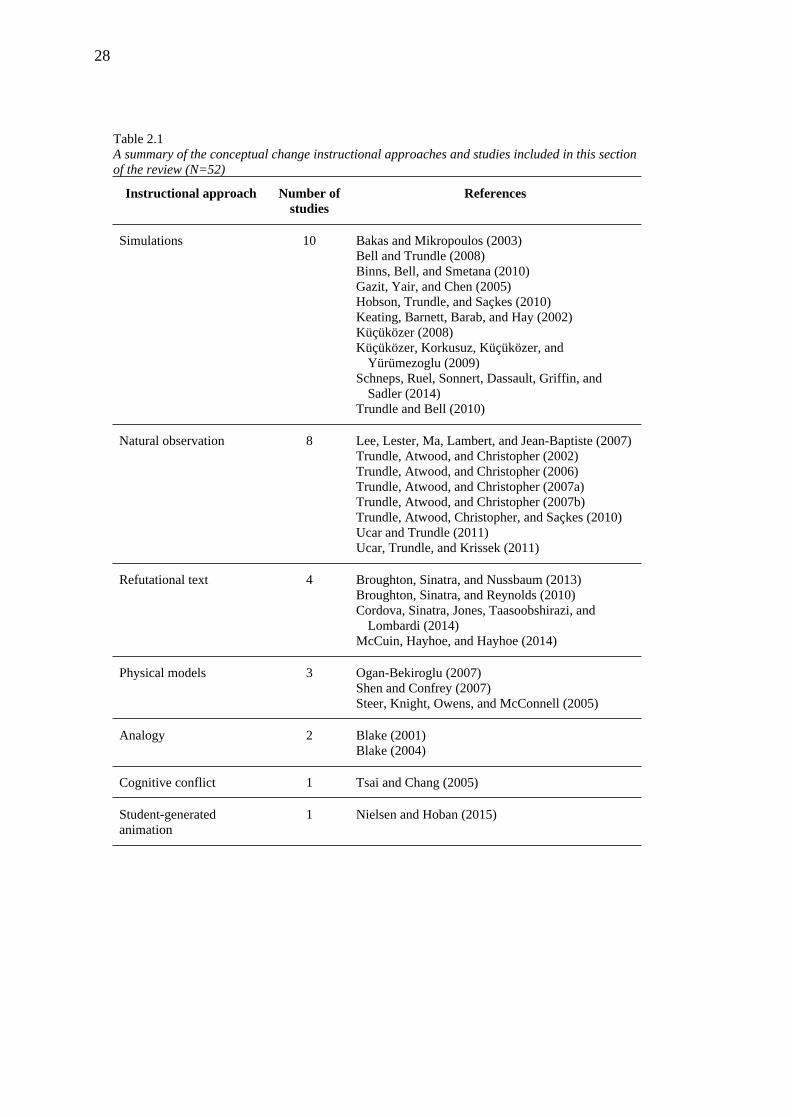
28
Table 2.1A summary of the conceptual change instructional approaches and studies included in this section of the review (N=52)
Instructional approach Number of studies
References
Simulations 10 Bakas and Mikropoulos (2003)Bell and Trundle (2008)Binns, Bell, and Smetana (2010)Gazit, Yair, and Chen (2005)Hobson, Trundle, and Saçkes (2010)Keating, Barnett, Barab, and Hay (2002)Küçüközer (2008)Küçüközer, Korkusuz, Küçüközer, and
Yürümezoglu (2009)Schneps, Ruel, Sonnert, Dassault, Griffin, and
Sadler (2014)Trundle and Bell (2010)
Natural observation 8 Lee, Lester, Ma, Lambert, and Jean-Baptiste (2007)Trundle, Atwood, and Christopher (2002)Trundle, Atwood, and Christopher (2006)Trundle, Atwood, and Christopher (2007a)Trundle, Atwood, and Christopher (2007b)Trundle, Atwood, Christopher, and Saçkes (2010)Ucar and Trundle (2011)Ucar, Trundle, and Krissek (2011)
Refutational text 4 Broughton, Sinatra, and Nussbaum (2013)Broughton, Sinatra, and Reynolds (2010)Cordova, Sinatra, Jones, Taasoobshirazi, and
Lombardi (2014)McCuin, Hayhoe, and Hayhoe (2014)
Physical models 3 Ogan-Bekiroglu (2007)Shen and Confrey (2007)Steer, Knight, Owens, and McConnell (2005)
Analogy 2 Blake (2001)Blake (2004)
Cognitive conflict 1 Tsai and Chang (2005)
Student-generated animation
1 Nielsen and Hoban (2015)
29
Other specific teaching and learning sequences
23 Barnett and Morran (2002)Bezzi (1996)Bulunuz and Jarrett (2010)Celikten, Ipekciouglu, Ertepinar, and Geban (2012)Chang and Barufaldi (1999)Chastenay (2016)Diakidoy and Kendeou (2001)Hayes, Goodhew, Heit, and Gillan (2003)Hsu (2008)Kali, Orion, and Eylon (2003)Lombardi, Sinatra, and Nussbaum (2013)Marques and Thompson (1997)Martinez, Bannan, and Kitsantas (2012)Nussbaum and Sharoni-Dagan (1983)Rebich and Gautier (2005)Salierno, Edelson, and Sherin (2005)Sharp and Sharp (2007)Sneider and Ohadi (1998)Stover and Saunders (2000)Taylor, Barker, and Jones (2003)Trumper (2006)Viiri and Saari (2004)Zeilik, Schau, and Mattern (1999)
One methodological limitation associated with simulations was evident in most of the
studies. In the many instances where simulations were embedded within a broader
teaching and learning sequence, the single case study research design did not delineate
the impact of individual instructional activities on the findings (e.g., Bell & Trundle,
2008). Therefore, any conceptual gains were not attributed to the use of the simulation
alone, but rather, to the broader instructional approach. Opportunities for further research
concern the optimal use of simulations, such as determining the minimum number of
Starry Night™ moon observations needed for conceptual change to occur (Bell &
Trundle, 2008).
Natural observation. The eight studies in this category employed an intervention
whereby participants observed astronomical phenomena directly or used second hand
data. An inquiry-oriented instructional sequence similar to the one employed by Bell and
Trundle (2008) was adopted in these studies (see Simulations). Two studies used this
instructional sequence to learn about tides by accessing tidal data online (Ucar & Trundle,
2011; Ucar, Trundle, & Krissek, 2011). One of these studies compared this inquiry-based
30
approach with traditional instruction that included lectures and group discussions (Ucar
& Trundle, 2011). No studies targeted participants’ alternative conceptions about
geological phenomena, perhaps due to the fact that many geological processes cannot be
directly observed, or occur too slowly to permit direct observation.
Data generation was almost exclusively qualitative, relying mostly on structured
interviews with participants. During interviews, participants generally completed
drawing or modelling tasks. Two studies relied on students’ diagrams only, as they
investigated the effect of the instruction on students’ ability to draw the moon’s phases
(Trundle, Atwood, & Christopher, 2006; Trundle, Atwood, & Christopher, 2007a). One
study adopted a mixed methods approach, and relied on qualitative and quantitative data
to determine the effectiveness of the intervention (Ucar et al., 2011). Structured
interviews and a multiple-choice test were the primary sources of data in this study. In all
of the studies, data collection occurred exclusively pre- and post-intervention. No studies
collected data throughout the intervention, thus preventing any insight into the
nature/process of conceptual change. Additionally, this meant that there was no indication
of how social interactions may have influenced students’ conceptual change, despite the
fact that group work was an important component of all of the instructional approaches.
One study was unique in that the authors conducted interviews six months after the
intervention to determine its effectiveness (Trundle, Atwood, & Christopher, 2007b).
Many studies claimed to have sourced data from classroom observations, document
analysis, and participants’ journals; however, these data were rarely analysed and used as
evidence to support the findings of the study (e.g. Trundle et al., 2002; Ucar et al., 2011).
Data analysis in these studies was consistent with the constant comparison approach
described in Simulations. A paired samples t-test was used in the one study that employed
a multiple-choice test instrument to measure conceptual change (Ucar et al., 2011). After
instruction, most students in all studies showed evidence of holding more accurate
scientific conceptions and fewer alternative conceptions. Participants in two studies were
more likely to be able to draw a scientific diagram of the moon’s phases as a result of the
intervention (Trundle et al., 2006; Trundle et al., 2007b). In the study that interviewed
31
participants six months after the intervention, most participants had retained scientific
conceptions of moon phases, however, some resorted back to their alternative conceptions
(Trundle et al., 2007a). It seems that the participants’ direct experience with the
phenomena (i.e., conducting natural moon observations or accessing real tidal data) was
a crucial aspect of the success of these instructional approaches. Also, as participants
worked in groups in all of the studies, the “interpretive, sense-making discussions”
(Trundle et al., 2002, p. 653) between individuals may have also been important (although
no evidence supports this claim). In the studies where participants analysed tidal data, the
fact that pre-service teachers were able to access data over a long period of time and from
a range of geographical locations was considered a critical aspect of the instruction (Ucar
et al., 2011). A possible explanation for students who did not have accurate scientific
conceptions post-intervention, suggested in one study, was that these individuals were
not metacognitively aware of the inconsistencies between their alternative conceptions
and the scientific conception presented during instruction (Trundle et al., 2007a). Another
possibility is that participants’ alternative conceptions were reinforced during the
physical modelling of phenomena (a part of the broader instructional sequence) due to
limitations of the model used (Trundle et al., 2002).
Although the use of natural observation as an instructional strategy holds obvious merit,
a variety of directions for future research were suggested. One such direction is that
research be conducted with school-aged students (Ucar et al., 2011). To date, research
has tended to investigate the effectiveness of this type of instructional approach on pre-
service teachers only. Only three studies have extended research to school-aged students
(Lee, Lester, Ma, Lambert, & Jean-Baptiste, 2007; Trundle at al., 2007b; Trundle,
Atwood, Christopher, & Saçkes, 2010). It has also been suggested that research on a
conceptual change intervention wherein participants metacognitively compare their pre-
and post-instructional ideas would be particularly insightful (Trundle et al., 2007a).
Finally, Ucar et al. (2011) advise that any research that addresses pre-service teachers’
alternative conceptions about tides would be beneficial due to the alarming number of
non-scientific ideas held by soon-to-be teachers on this topic.
32
Refutational text. Four studies employed refutational text to bring about conceptual
change (Broughton et al., 2013; Broughton, Sinatra, & Reynolds, 2010; Cordova et al.,
2014; McCuin, Hayhoe, & Hayhoe, 2014). Of particular interest is Broughton and
colleagues’ (2013) approach to determine if a refutational text about Pluto’s re-
classification as a dwarf planet would change students’ understanding of the definition of
a planet. The text was constructed from a range of magazine articles to explain the
changing nature of science, the role of evidence in making scientific decisions, and the
history of Pluto’s classification as a planet. Students’ knowledge about the planets and
the reclassification of Pluto were assessed using an open-ended questionnaire. It was
found that students held alternative conceptions about the definition of a planet, and about
Pluto’s size and orbit. There was a significant change from pre- to post-test on students’
understanding of why scientists changed the definition of a planet after they engaged with
the text.
This finding was accompanied by more positive emotion at post-test. This shift in
students’ emotions about Pluto’s reclassification may have resulted from their reading of
the refutation text and finding the scientific rationale for Pluto’s reclassification
acceptable. A series of regression tests revealed a relationship between students’
emotions and their conceptual development. At post-test, positive emotion was a strong
predictor of students’ belief that Pluto should no longer be a planet, the accepted scientific
viewpoint. Positive emotion was also a predictor of students providing scientific
reasoning for their decision. In summary, if students felt positive emotions after engaging
with the refutational text, they were more likely to hold scientifically accurate
conceptions about the definition of a planet and Pluto’s reclassification as a dwarf planet.
This was one of only two studies reviewed to consider conceptual change from an
affective perspective (see Section 2.4.4.1).
Physical models. The review identified three studies that investigated the use of physical
models in facilitating scientific conceptions. In one study, pre-service teachers worked in
groups to create models to represent the Earth-moon-sun system and presented their
model to their peers (Ogan-Bekiroglu, 2007). In another study, undergraduate science
33
students created multi-modal models of the Earth’s interior (Steer, Knight, Owens, &
McConnell, 2005). The final study was a phenomenological study that reported on one
primary school teacher’s experiences of conceptual change throughout a professional
development program on the moon’s phases (Shen & Confrey, 2007). Throughout the
program, the teacher constructed a variety of physical models to represent the phases of
the moon. Initially, she constructed a table using data on moon phases. She then
transformed this table into a two-dimensional diagram, and finally a three-dimensional
model.
Each of these studies employed different approaches to data generation. A range of data
sources was used, including video recordings, interviews, diagrams and questionnaires.
While two studies utilised a typical qualitative approach to data analysis and coded
participants’ pre- and post-treatment responses on a questionnaire/drawing task (Ogan-
Bekiroglu, 2007; Steer at al., 2005), one study took a novel approach and analysed the
participant’s real-time conceptual change by video-recording her experience (Shen &
Confrey, 2007). The authors of this study looked primarily for discussion and debate
occurring during group discussions (often revealing the teacher’s alternative conceptions
and instances of conceptual change). This allowed the researchers to capture the cognitive
processes embedded within social interactions, which they argued is key to understanding
conceptual change and is in accordance with the conditions of regular schooling. Despite
the merit of video-recording participants during the intervention, this was an uncommon
approach to data collection.
All of the instructional approaches where participants were constructing or manipulating
physical models were found to be effective. A significant finding from one study was that
profound conceptual development occurred when transforming information between
models and constructing multiple representations (Shen & Confrey, 2007). This was
attributed to the participant being actively involved in the modeling tasks, likening one
representation to another, and resolving inconsistencies within and between models.
Although the findings from another study suggested that such an approach is effective
overall, the authors cautioned against the use of student-generated models (Ogan-
34
Bekiroglu, 2007). Some pre-service teachers in this study retained their pre-instructional
alternative conceptions due to limitations of the model they constructed, supporting an
earlier finding by Trundle et al. (2002). This was probably because the teacher did not
play an active role in checking that the models were scientifically accurate. Despite this,
and based upon the positive results of the use of models as evidenced in these studies, it
appears that a call for further research into the use of models in learning Earth and space
science concepts, particularly geological phenomena such as plate tectonics, is justified
(Steer et al., 2005).
Analogy. Two studies investigated the effect of teaching elementary school students
about the rock cycle using the analogy of aluminum can recycling (Blake, 2001, 2004).
Students were introduced to the target (i.e., the rock cycle), taught the analogue (i.e.,
aluminum can recycling, which students had leant about previously), and then connected
the two. Afterwards, students pointed out some limitations of the analogy. Data were
gained from multiple sources, including a rock sorting task, concept maps and semi-
structured interviews. Students that participated in this treatment were more able to
scientifically describe and classify rocks. Blake (2004) suggested that the use of an
analogy might have assisted students to construct scientific conceptions of the rock cycle
by making links to their prior knowledge. However, one major limitation evident in this
study is that the data generally failed to give information about if and how the use of an
analogy facilitated conceptual development. This was perhaps because no data sources
provided an in-depth examination of the learning occurring throughout the intervention.
Repeating this type of research with a deliberate focus on audio-recording students during
the learning episode is a possibility for future research.
Cognitive conflict. Tsai and Chang (2005) propose a specific instruction based on
creating cognitive conflict as an approach to bringing about conceptual change. They
carried out a quasi-experimental investigation to determine the effect of the instruction
on Year 9 science students’ conceptions about the cause of seasons. While students in
one class experienced regular instruction, students in another class were presented with a
‘discrepant statement’ (e.g., “in winter, the Earth is slightly further from the sun, whereas
35
in summer the Earth is closer to the sun”) and a ‘critical statement’ (“if seasons were
caused by Earth’s distance to the sun, the Northern and Southern Hemispheres would
have the same season at the same time”) (Tsai & Chang, 2005, p. 1093) at the beginning
of instruction. Following this, the teacher presented both classes with a scientific
explanation. During this part of instruction, students were engaged in modeling the
Earth’s rotation around the sun with balls. Interviews were conducted one week, two
months and eight months after the treatment. At each interview, students in the
intervention class held more scientific conceptions and fewer alternative conceptions than
those in the control class; therefore, this study endorses the use of cognitive conflict based
instructional approaches as an effective means of promoting conceptual change. The
limited publications in this area and the promising results of this study warrants further
research into cognitive conflict as a conceptual change approach in other Earth and space
science education contexts.
Student-generated animation. Student-generated animations that do not require
specially designed software, such as slowmation (i.e., a from a stop-motion animation),
is a new approach that has been researched from a conceptual change perspective very
recently (Nielsen & Hoban, 2015). The construction of a slowmation representation is a
process whereby an animation is created from a series of still digital photographs that are
displayed in quick succession. The creation process involved three broad stages: (1)
planning; (2) chunking and sequencing information; and (3) constructing and
reconstructing. In the slowmation construction process, the participants of this study
researched a topic and then planned a storyboard. They used their own mobile phone or
a digital camera to photograph a multi-modal two-dimensional or three-dimensional
model as they manipulated it to demonstrate a concept or process. Their photographs were
then displayed at two frames per second using software or an iPhone/iPad™ application.
This approach was effective in promoting pre-service teachers’ scientific conceptions of
moon phases from pre- to post-interview (Nielsen & Hoban, 2015). In creating a
slowmation, the pre-service teachers demonstrated their understanding of moon phases
using different modes; for example, research notes and storyboards, three-dimensional
36
models, still images and narration. This was particularly effective at bringing about
conceptual change as the pre-service teachers were presented with multiple opportunities
to consider and revise their own alternative conceptions. Comparing their own
representations with expert representations was deemed essential in bringing about
conceptual change, as was the process of constructing and manipulating physical models
(Nielsen & Hoban, 2015).
Other specific teaching and learning sequences. Twenty-three studies reported a
variety of other instructional approaches that do not fit within the previous categories.
Instructional interventions in this category were generally a mix of teaching and learning
activities over a long period of time where the influence of a specific approach could not
be delineated. Some examples included:
An undergraduate astronomy course where concept mapping and group
discussions were emphasised (Zeilik, Schau, & Mattern, 1999);
A unit of work on six astronomical concepts that spanned several weeks and
included learning activities such as internet-based research, observations of the
moon, and the use of a three-dimensional computer model (Barnett & Morran,
2002);
An excursion to a planetarium (Chastenay, 2016; Stover & Saunders, 2000);
Diverse instruction that challenged more than one of students’ alternative
conceptions simultaneously (Hayes, Goodhew, Heit, & Gillan, 2003); and
An audio-tutorial that included explanations, guidance for analytical observation
of visuals, and instructions for manipulating concrete props (Nussbaum &
Sharoni-Dagan, 1983).
2.4.5 Interpretation
The most obvious trend in the existing literature is that intervention studies carried out in
the Earth and space science discipline employed what are now considered outdated
theoretical and methodological perspectives. The major theoretical shortcoming was that
almost all of the studies viewed conceptual change from a cognition-only perspective.
Although this approach is now being challenged in other science disciplines, researchers
37
are yet to substantially challenge traditional notions of conceptual change in the Earth
and space science discipline. Only two studies considered conceptual change from an
affective perspective; the remaining studies viewed conceptual change from a cognition-
only perspective. There were also a number of methodological shortcomings. First, the
learning of astronomical phenomena received significantly greater attention than
geological phenomena. Of the 52 studies included in this review, only eight studies
investigated the effectiveness of an intervention designed to facilitate scientifically
accurate conceptions of geological phenomena. Second, intervention studies in the Earth
and space science disciplines have generally investigated conceptual change by
measuring students’ conceptions pre- and post-intervention. The few studies that
generated data throughout the implementation of an instructional approach had a more
robust evaluation of the intervention, and provided additional insight into how the
instructional approach influenced students’ conceptual change. This was an atypical
approach to data collection; only three studies included in this review video-recorded
participants while they were learning. Third, intervention studies primarily required
participants to view or manipulate representations of phenomena. Notwithstanding the
effectiveness of this approach, in studies where conceptual change was most profound,
participants were creating representations (or multiple representations) of phenomena.
In light of these assertions, there is a clear need for conceptual change research in the
Earth and space science disciplines that: (1) challenges traditional notions of conceptual
change by considering data from affective perspectives; (2) focuses on the learning of
geological phenomena through the construction of multiple representations; and (3)
employs qualitative data collection methods throughout the implementation of an
instructional approach. The implications of these recommendations for the current
research are now presented.
2.4.6 Implications for the Current Study
This section has presented a review of the literature informing the study’s research
questions and design. In doing so, the literature review has highlighted the need for
research that (1) challenges traditional notions of conceptual change; (2) focuses on the
38
learning of geological phenomena through the construction of multiple representations;
and (3) employs qualitative data collection throughout the implementation of an
instruction approach. Each of these points will now be addressed, in turn.
2.4.6.1 The need for research that challenges traditional notions of conceptual
change
Despite the overwhelming and longstanding argument for further research into the
interplay between affective variables and conceptual change (Cobern, 1996; Pintrich et
al., 1993; Sinatra & Mason, 2013; Treagust & Duit, 2008; Tytler & Prain, 2010; West &
Pines, 1983; Zembylas, 2005), only two of the studies reviewed in Section 2.4 of this
thesis took such an approach (Broughton et al., 2013; Cordova et al., 2014). As identified
earlier, these studies explored the relationships between prior knowledge, efficacy,
interest, emotions and conceptual change. The remainder of the studies viewed
conceptual change as a purely cognitive construct.
As outlined in Section 2.3.1, science education researchers have increasingly criticised a
cognition-only approach to conceptual change learning. It has been suggested that
cognition-only models of conceptual change present an over-rationalised view of learning
that fails to consider the role of factors such as motivation, interest, self-efficacy, feelings
and emotions as conceptual supports for new knowledge (Pintrich et al., 1993). In fact, it
has been acknowledged that adopting a purely cognitive perspective of conceptual change
can constrain the interpretation of the learning process (Caravita & Hallden, 1994; Duit
& Treagust, 2003). If new research in Earth science education continues to ignore the
influence of affective variables on conceptual change, the assumption that affective
variables are irrelevant to teaching and learning in a cognitively demanding discipline
like science will remain unchallenged (Zembylas, 2005). Research that adopts an
affective or multidimensional perspective of conceptual change, therefore, is crucial
within this discipline where studies of this nature are virtually non-existent.
An in-depth examination of whether interest plays a role in students’ conceptual change
is an example of the type of research that is needed. There have been efforts to explore
39
this in other science disciplines. A common theme emerging from the findings is that this
area is under-researched and results are contradictory, substantiating the need for ongoing
research. Few studies have investigated how individual or situational interest may bring
about conceptual change (Sinatra & Mason, 2013; Treagust & Duit, 2008). Of those that
do, some authors report that students’ interest relates positively to conceptual change
(Andre & Windschitl, 2003), while others argue that highly interested students may be
more resistant to change (Dole & Sinatra, 1998). Further research of this nature will
challenge traditional notions of knowledge reconstruction and help to clarify the opposing
results reported to date. The findings from this type of research can also inform teachers’
choice of instructional approach so that classroom environments are conducive to
conceptual change.
2.4.6.2 The need for research that employs qualitative data collection throughout
the implementation of the instructional approach
Although each of the studies examined in Section 2.4 had a unique methodological
approach to determine the effectiveness of an intervention, most data were generated pre-
and post-intervention only. While this provides a broad insight into the effectiveness of
an instructional approach, a fine-grained analysis of the causal mechanisms of conceptual
change is not possible. For example, many of interventions discussed were carried out in
a group setting. Much of the conceptual change that was taking place, then, was
embedded within a broader social context. The socially driven knowledge reconstruction,
probably occurring from dialogue, scientific reasoning and argumentation between
participants or between participants and the teacher, could have provided valuable
information about how an intervention influenced conceptual change.
Three studies that adopted this approach were able to provide a more robust evaluation
of the effectiveness of an instructional approach (i.e., Gazit et al., 2005; Nielsen & Hoban,
2015; Shen & Confrey, 2007). These studies also aligned better with contemporary views
on cognitive science, such as the view that learning should support collective knowledge
construction (Klein, 2006). By capturing students’ real-time conceptual change, the
researchers were able to very specifically determine how the instructional approach
40
influenced participants’ conceptual change. This is in stark contrast to the studies that
could only identify that conceptual change increased from pre- to post-intervention, and
then speculate why this had occurred. Future research that employs qualitative data
collection throughout instruction (e.g., audio or video recording) will significantly
contribute to the conceptual change research in the Earth and space sciences and the
conceptual change field more broadly.
2.4.6.3 The need for research that focuses on the learning of geological phenomena
through the construction of multiple representations
As already reported, the majority of studies included in this review investigated the
effectiveness of an intervention designed to facilitate accurate conceptions of
astronomical phenomena. Although important, this finding is not surprising.
Traditionally, both students and teachers have not regarded Earth science as prestigiously
as the other ‘hard’ science disciplines, like physics and chemistry (Dawson & Carson,
2013). Similarly, Earth science has received little attention in conceptual change literature
compared to the physics and chemistry disciplines, where research of this nature
originated. Like these disciplines, however, Earth science deals with abstract and
unobservable concepts and processes that students hold many alternative conceptions
about. The construct of geological time, for instance, is particularly difficult for
individuals to comprehend (Dodick & Orion, 2003). The design of instructional
approaches that facilitate accurate conceptions of geological phenomena, therefore, is a
broad avenue for future research.
As identified in Section 2.4, the instructional approaches where conceptual change
appeared to be most profound were those that required the physical construction of
multiple representations (Nielsen & Hoban, 2015; Shen & Confrey, 2007). In these
instances, there were many opportunities for participants to consider and revise their
alternative conceptions. This finding supports an emerging way of thinking in science
education research. Researchers have suggested that ‘representational negotiation’ should
be a significant focus in the science classroom (Klein, 2006; Tytler & Prain, 2010). That
is, students should have many opportunities to “integrate, refine, and translate ideas
41
across representations” (Tytler & Prain, 2010, p. 2074). While this is not an entirely new
idea that has been researched in other science disciplines such as chemistry, instructional
approaches that emphasise opportunities to construct multiple representations of Earth
science phenomena are almost non-existent. The use of student-generated animation such
as slowmation, however, is one example of how this gap in the research can be addressed.
There is currently a paucity of research on the learning potential of student-generated
animations, making it an interesting avenue for future research, particularly from a
conceptual change perspective. A number of studies have noted the educational value of
students creating animations in chemistry (Chang et al., 2010; Schank & Kozma, 2002;
Stieff & Wilensky, 2003; Wilder & Brinkerhoff, 2007; Wu, Krajcik, & Soloway, 2001),
while another has examined the learning potential of creating animations in mathematics
(Hubscher-Younger & Narayanan, 2007). In these studies, the use of specially designed
software packages increased students’ conceptual understanding. For example, Year 7
students who used Chemation™ software to generate and explain an animation of a
chemical reaction had significantly higher post-test scores than students who viewed and
explained a teacher-generated animation (Chang at al., 2010). Other specially designed
software (ChemSense™, Connected Chemistry™, Chemscape Chime™ and eChem™)
has also yielded positive learning outcomes when students created their own animation
(Schank & Kozma, 2002; Stieff & Wilensky, 2003; Wilder & Brinkerhoff, 2007; Wu et
al., 2001).
Student-generated animation that does not require special software, such as slowmation,
has been researched to a lesser extent. Research on slowmation outside of the Earth and
space science disciplines has been situated in pre-service teacher education contexts.
Studies have found that slowmation is highly effective in supporting science pre-service
teachers to identify and change their own alternative conceptions of science concepts or
processes (Hoban & Nielsen, 2012, 2014; Kidman, Keast, & Cooper, 2012; Nielsen &
Hoban, 2015; Loughran, Berry, Cooper, Keast, & Hoban, 2012). An approach such as
this, where students are creating multiple representations of science phenomena, appears
42
to be well aligned with contemporary perspectives of learning in science and at the cutting
edge of conceptual change research in this discipline (Tytler & Prain, 2010).
2.5 The Potential of Slowmation as a Conceptual Change Approach to Learning in
Science
Although notions of conceptual change have developed over the last three decades, there
remains a paucity of evidence-based conceptual change instructional strategies (Treagust
& Duit, 2008). Recently, student-generated animation has been suggested as an efficient
approach for bringing about conceptual change in science. This section will consider the
potential of one type of student-generated animation, slowmation, in learning science.
2.5.1 The value of student-generated animation in science education
Animations are particularly suited to the sciences as they can be used to illustrate
effectively abstract concepts that change over time or are otherwise unobservable.
Student-generated animations that do not require specially designed software, such as
slowmation, have been researched recently in light of the value of engaging students in
the construction and manipulation of multiple representations. As outlined in Section
2.4.4.2, slowmation is a process where an animation is created from a series of still digital
photographs that are displayed in quick succession (Hoban, 2005, 2007). The creation
process involves three stages: (1) planning, (2) chunking and sequencing information,
and (3) constructing and reconstructing (adapted from Hoban & Nielsen, 2012). In the
slowmation creation process, students research a topic and then plan a storyboard. They
use a mobile phone or digital camera to photograph a multi-modal, two- or three-
dimensional model as they manipulate it to demonstrate a concept or process (generally,
the model is flat on a table or on the floor). The photographs are then displayed at about
two frames per second using computer software such as MovieMaker™ or a mobile phone
application such as MyCreate™.
Slowmation has been most widely researched in pre-service teacher education contexts.
Studies have found that slowmation is effective in facilitating science pre-service teachers
to identify and resolve their own alternative conceptions of science concepts or processes
43
(Hoban & Nielsen, 2012, 2014; Kidman et al., 2012; Nielsen & Hoban, 2015; Loughran
et al., 2012). To illustrate, a group of pre-service teachers had their understanding of
biological fitness questioned by their peers as their slowmation (‘Survival of the Fittest’)
showed a beetle being eaten by a frog, which in turn was eaten by a snake, and so on. A
pre-service teacher from another group argued that they had confused the concept of
‘survival of the fittest’ with the conception of a food chain (Loughran et al., 2012).
Slowmation has also been researched in school contexts, albeit to a lesser extent than pre-
service teacher education. The construction process has been shown to bring about
positive learning outcomes (e.g., Brown, Murcia & Hackling, 2013; Hoban, Ferry, Konza
& Vialle, 2007; Jablonski, Hoban, Ransom & Ward, 2015; Kidman & Hoban, 2009),
despite the seemingly high level of ‘representational competence’ necessary when
making knowledge claims using representations (elaborated further in the section below).
2.5.2 Positioning slowmation within a theoretical framework
Multiple theoretical frameworks have been used to understand better the learning that
occurs during the creation of a slowmation representation. One useful framework is
semiotics. Peirce’s (1931) triadic model of a semiotic system shows that there is a
relationship between: (1) the concept being represented (i.e., the referent); (2) the
representation itself; and (3) the meaning generated from the representation. The process
of creating a slowmation representation, then, can be viewed as a dynamic process, “as
the student makes meaning by iteratively checking the content whilst creating the
representation” (Hoban et al., 2011, p. 991).
From this foundation in semiotics, the 5Rs Model (Hoban & Nielsen, 2010) and the
Meaning-Making through Animation and Editing, Presentation and Explanation, and
Reflection (MMAEPER) Model (Kidman et al., 2012) have been developed. In the 5Rs
model, students translate their knowledge through five multi-modal representations (i.e.,
5Rs). The five representations are: (1) background notes; (2) storyboard; (3) models; (4)
digital photographs; and (5) the final animation (Hoban & Nielsen, 2010; Figure 2.2).
The five representations are interrelated “because one feeds into the next” (Hoban &
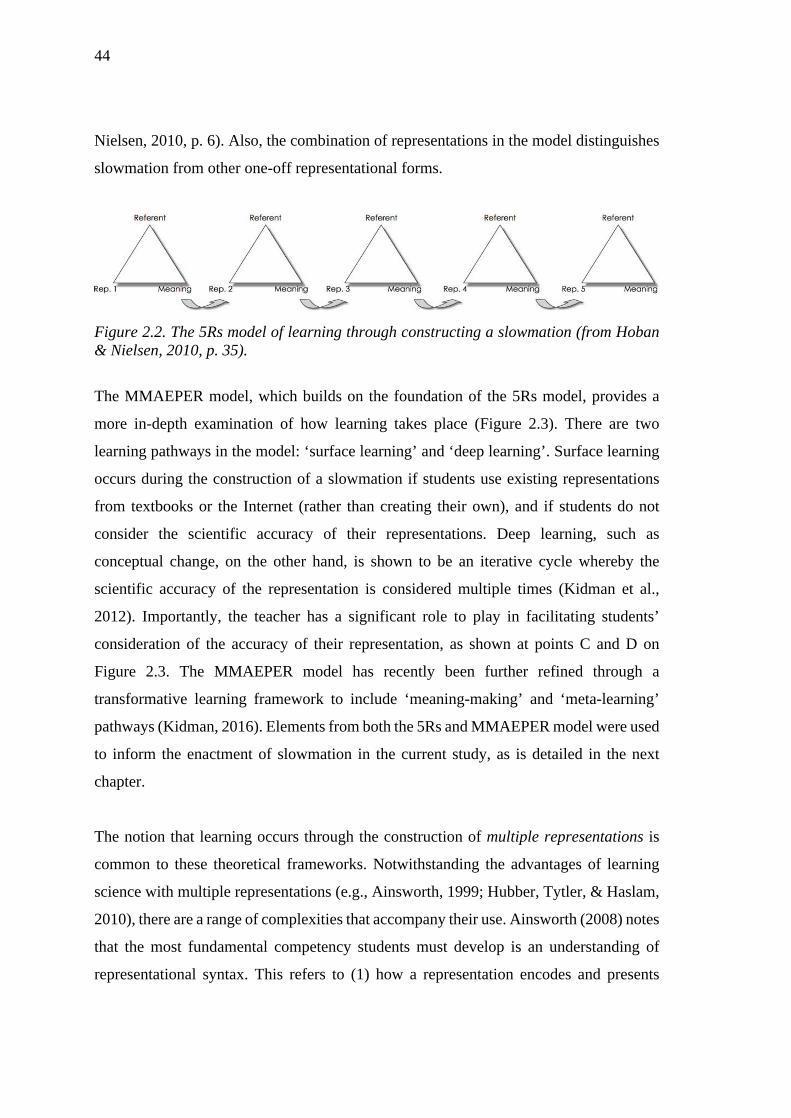
44
Nielsen, 2010, p. 6). Also, the combination of representations in the model distinguishes
slowmation from other one-off representational forms.
Figure 2.2. The 5Rs model of learning through constructing a slowmation (from Hoban & Nielsen, 2010, p. 35).
The MMAEPER model, which builds on the foundation of the 5Rs model, provides a
more in-depth examination of how learning takes place (Figure 2.3). There are two
learning pathways in the model: ‘surface learning’ and ‘deep learning’. Surface learning
occurs during the construction of a slowmation if students use existing representations
from textbooks or the Internet (rather than creating their own), and if students do not
consider the scientific accuracy of their representations. Deep learning, such as
conceptual change, on the other hand, is shown to be an iterative cycle whereby the
scientific accuracy of the representation is considered multiple times (Kidman et al.,
2012). Importantly, the teacher has a significant role to play in facilitating students’
consideration of the accuracy of their representation, as shown at points C and D on
Figure 2.3. The MMAEPER model has recently been further refined through a
transformative learning framework to include ‘meaning-making’ and ‘meta-learning’
pathways (Kidman, 2016). Elements from both the 5Rs and MMAEPER model were used
to inform the enactment of slowmation in the current study, as is detailed in the next
chapter.
The notion that learning occurs through the construction of multiple representations is
common to these theoretical frameworks. Notwithstanding the advantages of learning
science with multiple representations (e.g., Ainsworth, 1999; Hubber, Tytler, & Haslam,
2010), there are a range of complexities that accompany their use. Ainsworth (2008) notes
that the most fundamental competency students must develop is an understanding of
representational syntax. This refers to (1) how a representation encodes and presents
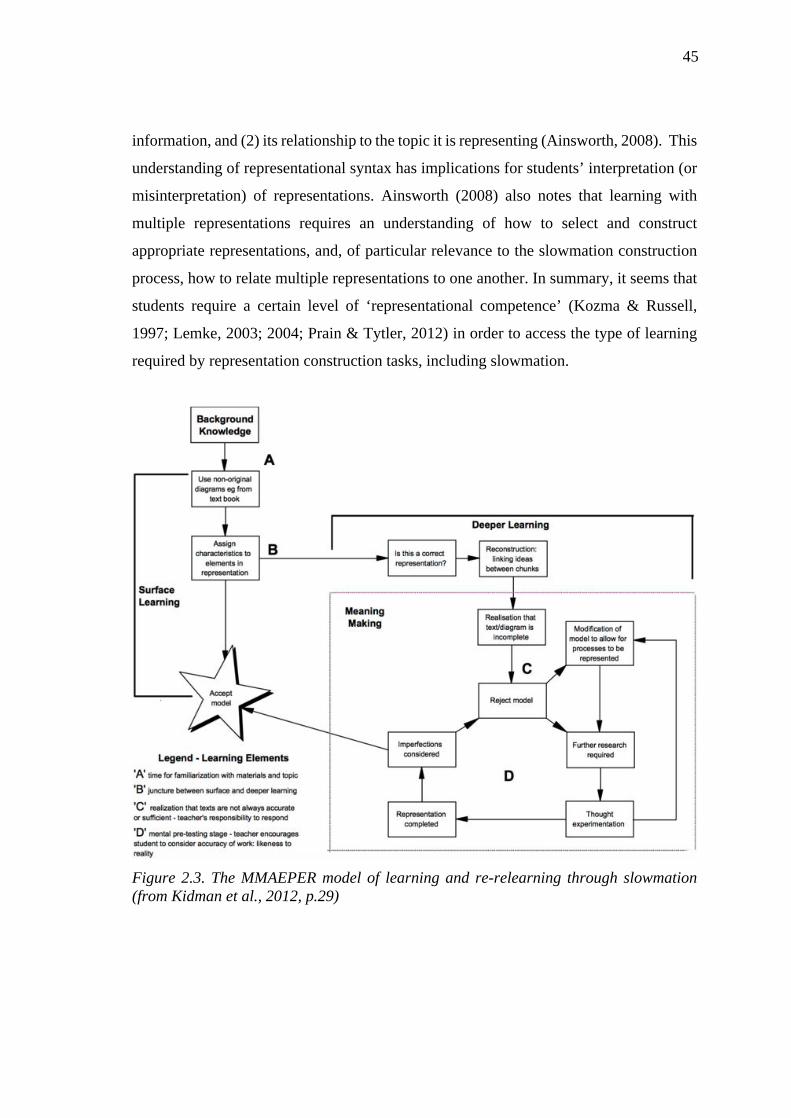
45
information, and (2) its relationship to the topic it is representing (Ainsworth, 2008). This
understanding of representational syntax has implications for students’ interpretation (or
misinterpretation) of representations. Ainsworth (2008) also notes that learning with
multiple representations requires an understanding of how to select and construct
appropriate representations, and, of particular relevance to the slowmation construction
process, how to relate multiple representations to one another. In summary, it seems that
students require a certain level of ‘representational competence’ (Kozma & Russell,
1997; Lemke, 2003; 2004; Prain & Tytler, 2012) in order to access the type of learning
required by representation construction tasks, including slowmation.
Figure 2.3. The MMAEPER model of learning and re-relearning through slowmation (from Kidman et al., 2012, p.29)
46
2.6 Chapter Summary
This chapter has detailed the literature that informed the project’s research aims and
design in response to evidence of students’ firmly held alternative conceptions about
Earth science phenomena, and the identified need for innovative conceptual change
instructional approaches in this discipline. Section 2.2 provided a general introduction to
constructivist learning in science. A critical review of conceptual change literature,
including the development of affective perspectives over the past three decades, was
provided in Section 2.3. Section 2.4 presented a systematic review of conceptual change
instructional approaches used in the Earth and space science discipline. It outlined
conceptual change approaches that have been used previously, and methods that have
been employed to evaluate the efficiency of those approaches. Section 2.5 detailed the
scope of current research on slowmation in science education, and the existing
pedagogical models aligned with its use, in response to recent studies that have suggested
it is an efficacious conceptual change approach in science education. As outlined in
Section 2.4.6, the literature has informed the research design of the current project,
ensuring it makes a significant contribution to the existing conceptual change literature
by adopting a cognitive-affective perspective of conceptual change; extends conceptual
change research in the Earth science discipline; and extends research that investigates the
learning potential of slowmation. The following chapter will present an overview of the
research design and the methods of data generation and analysis that were employed to
answer the research questions.
47
CHAPTER THREE: RESEARCH DESIGN AND PROCEDURES
3.1 Chapter Introduction
As demonstrated in the previous chapter, the aim of this research project was to
investigate how constructing a slowmation influenced students’ conceptual change, and
the relationship between students’ interest generated by the project and their conceptual
change. The research questions supporting these aims are:
1. Does the process of constructing a slowmation have a significant effect on
students’ conceptual change in Earth science?
2. How does the process of constructing a slowmation influence students’
conceptual change?
3. Is students’ interest, generated by the construction of a slowmation, a significant
predictor of conceptual change?
This chapter will outline the research project’s design and the procedures employed to
answer each research question. It is presented in four main parts. Section 3.2 will describe
the mixed methods intervention design and justify its suitability for answering the
research questions. Section 3.3 will detail the school and class contexts where the research
was carried out. Section 3.4 will outline the research project’s procedures, including the
project’s organisation (Section 3.4.1) and approach to data generation and analysis
(Section 3.4.2). These sections will demonstrate how quantitative and qualitative methods
have been integrated to answer the research questions. Finally, Section 3.5 will
acknowledge the research issues and limitations.
3.2 Research Design
This research project adopted a quasi-experimental, mixed methods intervention design
(Creswell, 2015) in order to answer the three research questions. This approach combines
the strengths of both quantitative and qualitative data. While quantitative data enables the
identification of trends that can be generalised across a population, qualitative data
facilitates a deeper understanding of individual participant’s experiences in a given
context (Creswell, 2005).
48
The principal aim of this study is to determine whether the process of constructing a
slowmation has a significant effect on students’ conceptual change. Since experimental
research is concerned with determining a cause-effect relationship, is it well-suited to this
aim (Lankshear & Knobel, 2004; Taber, 2013). In a true experiment, the researcher
controls the variables so that only the factor that is hypothesised to have an effect differs
between the intervention and comparison groups. Such control is rarely possible in
naturalistic, classroom-based research; however, it is sometimes possible to make
comparisons between situations that approximate the conditions needed for an
experiment. Therefore, a quasi-experimental (non-equivalent groups) design was
employed. This approach, despite some limitations, is used extensively in science
education, and, as identified in Chapter 2, has been previously used to evaluate the
effectiveness of conceptual change instructional approaches in astronomy and geology
education contexts (e.g., Trundle et al., 2002; Trundle & Bell, 2010; Tsai & Chang, 2005).
Although a dichotomy has traditionally existed between positivist and interpretivist
research philosophies, and qualitative and quantitative research methodologies,
considerable literature now supports a pragmatic research paradigm that uses mixed
methods (Creswell, 2005). Research that is conducted within the pragmatic paradigm is
problem-centred. This means that methods of data collection and analysis are chosen
based on their capacity to answer the research questions, rather than a philosophical
commitment to a given research paradigm (Mackenzie & Knipe, 2006). This was the
approach adopted in the current study, as the mixed methods chosen to answer the
research questions are both quantitative and qualitative, and associated with positivist and
interpretivist research paradigms, respectively. This approach combines the strength of
both types of data, in that quantitative data enables the identification of trends that can be
generalised across the sample populations, while qualitative data facilities a deeper
understanding of the context (Creswell, 2005).
In this study, therefore, data were generated from four Year 9 science classes (N=95) at a
Preparatory to Year 12 college in South-East Queensland, Australia. While students in
two intervention classes (N=52) worked in groups to create a slowmation, students in two
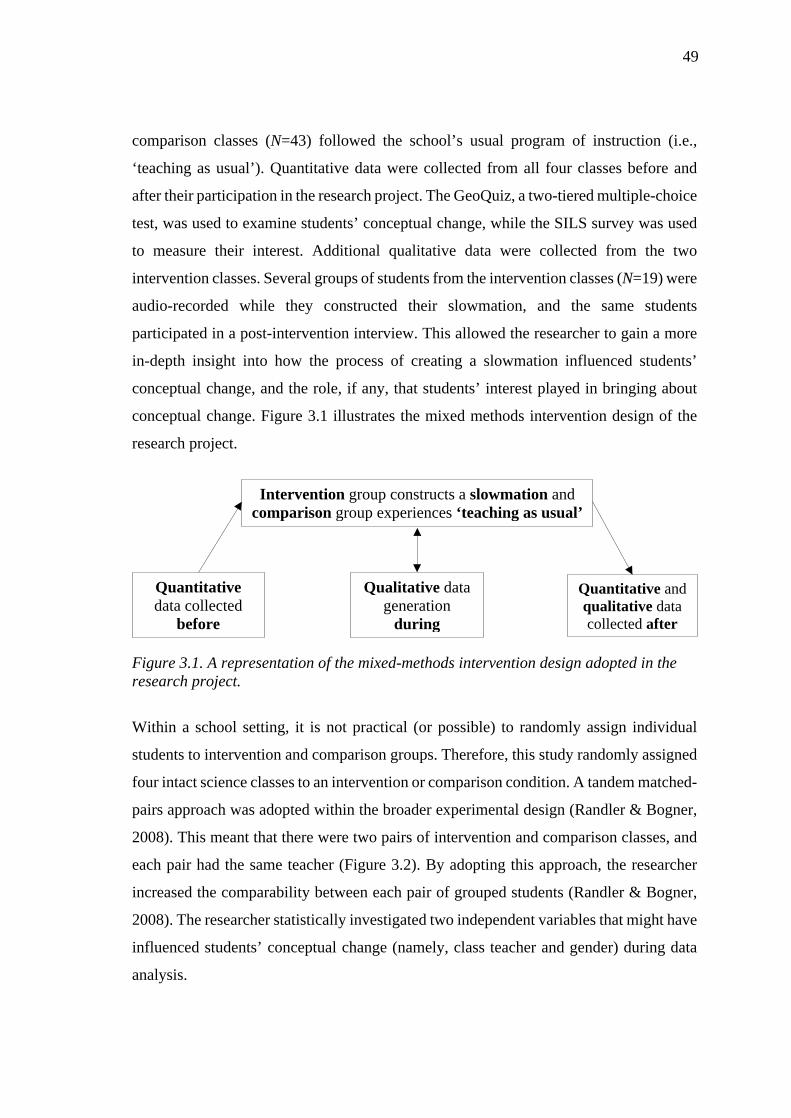
49
comparison classes (N=43) followed the school’s usual program of instruction (i.e.,
‘teaching as usual’). Quantitative data were collected from all four classes before and
after their participation in the research project. The GeoQuiz, a two-tiered multiple-choice
test, was used to examine students’ conceptual change, while the SILS survey was used
to measure their interest. Additional qualitative data were collected from the two
intervention classes. Several groups of students from the intervention classes (N=19) were
audio-recorded while they constructed their slowmation, and the same students
participated in a post-intervention interview. This allowed the researcher to gain a more
in-depth insight into how the process of creating a slowmation influenced students’
conceptual change, and the role, if any, that students’ interest played in bringing about
conceptual change. Figure 3.1 illustrates the mixed methods intervention design of the
research project.
Quantitative data collected
before
Quantitative and qualitative data collected after
Qualitative data generation
during
Intervention group constructs a slowmation and comparison group experiences ‘teaching as usual’
Figure 3.1. A representation of the mixed-methods intervention design adopted in the research project.
Within a school setting, it is not practical (or possible) to randomly assign individual
students to intervention and comparison groups. Therefore, this study randomly assigned
four intact science classes to an intervention or comparison condition. A tandem matched-
pairs approach was adopted within the broader experimental design (Randler & Bogner,
2008). This meant that there were two pairs of intervention and comparison classes, and
each pair had the same teacher (Figure 3.2). By adopting this approach, the researcher
increased the comparability between each pair of grouped students (Randler & Bogner,
2008). The researcher statistically investigated two independent variables that might have
influenced students’ conceptual change (namely, class teacher and gender) during data
analysis.
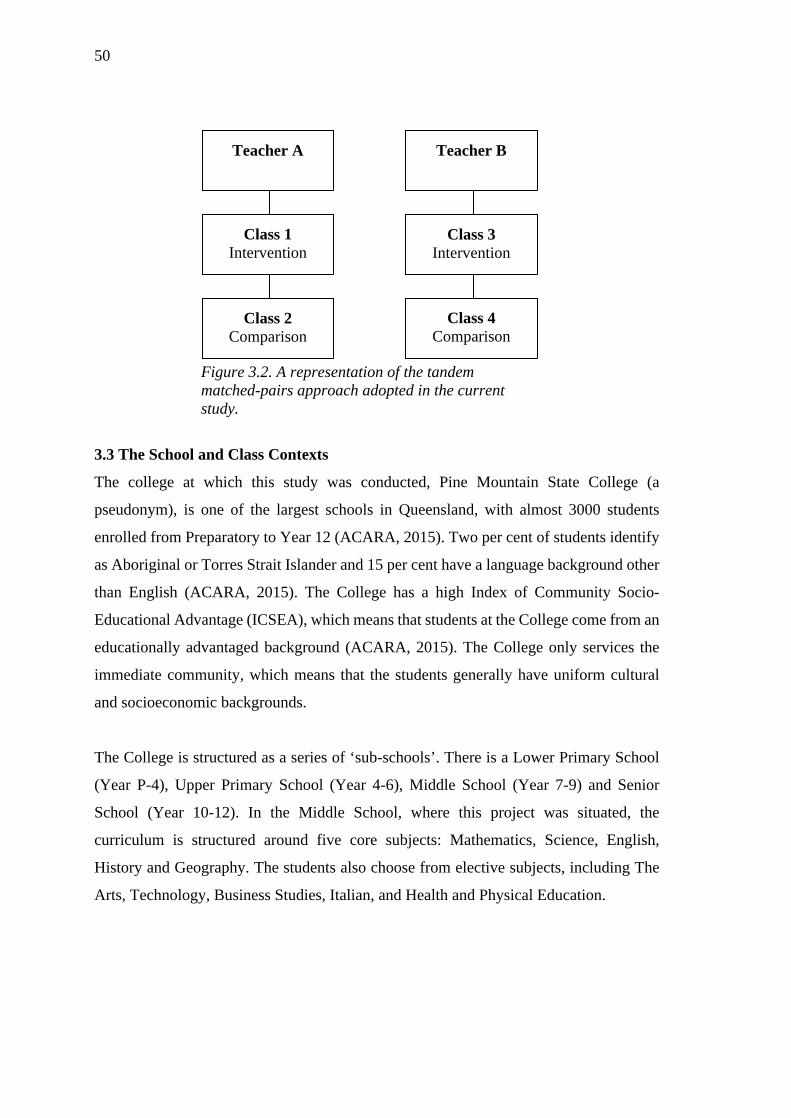
50
Figure 3.2. A representation of the tandem matched-pairs approach adopted in the current study.
3.3 The School and Class Contexts
The college at which this study was conducted, Pine Mountain State College (a
pseudonym), is one of the largest schools in Queensland, with almost 3000 students
enrolled from Preparatory to Year 12 (ACARA, 2015). Two per cent of students identify
as Aboriginal or Torres Strait Islander and 15 per cent have a language background other
than English (ACARA, 2015). The College has a high Index of Community Socio-
Educational Advantage (ICSEA), which means that students at the College come from an
educationally advantaged background (ACARA, 2015). The College only services the
immediate community, which means that the students generally have uniform cultural
and socioeconomic backgrounds.
The College is structured as a series of ‘sub-schools’. There is a Lower Primary School
(Year P-4), Upper Primary School (Year 4-6), Middle School (Year 7-9) and Senior
School (Year 10-12). In the Middle School, where this project was situated, the
curriculum is structured around five core subjects: Mathematics, Science, English,
History and Geography. The students also choose from elective subjects, including The
Arts, Technology, Business Studies, Italian, and Health and Physical Education.
Teacher A Teacher B
Class 1Intervention
Class 3Intervention
Class 2Comparison
Class 4Comparison
51
During the project’s implementation, Year 9 science students were completing a unit of
work from the Earth and Space Sciences sub-strand of the Foundation to Year 10
Australian Curriculum: Science (ACARA, 2016). The unit of work is a C2C unit called
‘Changing Earth’ (DETE, 2014a). This unit of work was common to Queensland students
enrolled in state schools at the time of the implementation of the intervention.
Four classes and two teachers were involved in the research project. The science classes
at Pine Mountain State College are not streamed according to previous academic results;
therefore, the students in the selected classes demonstrated a range of achievement levels.
Some variation was noted in students’ medical and cultural backgrounds. Some of the
students in the four classes speak English as a second language, or present with additional
learning needs (i.e., a state government verified disability or a learning difficulty). Other
students were identified as gifted and talented by the College. The classroom teachers
recommended that no differentiation was necessary in the delivery of the project, as all
students could participate equitably. The teachers involved in the research project were
experienced, and had each been teaching for more than 10 years across junior and senior
secondary science contexts.
3.4 Research Procedures
The following section is presented in two main parts. First, it describes how the research
project was implemented across three stages. Second, the methods of quantitative and
qualitative data generation and analysis are described to illustrate how the research
questions were answered.
3.4.1 Organisation
The research was carried out in three stages. In the first stage of the research project,
which occurred in Term 1, 2015 (26/01/15–03/04/15), the researcher developed and
validated a two-tiered multiple-choice test that was used to identify students’ alternative
conceptions before and after their participation in the research project. The GeoQuiz tests
students’ understanding of geologic concepts specific to the unit ‘Changing Earth’
(DETE, 2014a). The process that was followed involved three major tasks: (1) defining
52
the content; (2) researching students’ alternative conceptions; and (3) developing and
validating the final instrument (Treagust, 1988). Each of these tasks is described in detail
in Chapter 4. A justification for the use of a two-tiered test is also given later in the next
chapter.
In the second stage of the research project, which also occurred during Term 1, 2015
(26/01/15–03/04/15), a pilot study was conducted at the research site. This was carried
out to gain further insight into the use of slowmation with school-aged learners, given the
paucity of research conducted within this context (Chapter 2, Section 2.5.1). Stage 2 of
the project involved teaching the relevant teachers and students how to create a
slowmation, and familiarising the students with think-aloud protocols and the data
collection equipment (namely, audio-recording devices). The two teachers involved in
the research project completed an hour-long training course delivered by the researcher
during a faculty meeting. The researcher taught his colleagues about the purpose of a
slowmation representation, how to use the MyCreateTM application, and they co-
constructed an example slowmation. Then, students practised making a slowmation that
explained the flow of electricity through a circuit. During this process, the students were
audio-recorded and these data were analysed by the researcher to inform the
implementation of the project later in the year.
In the third and final stage, the research project was implemented. Data collection in this
phase, as reported in this thesis, occurred in Term 2, 2015 (20/04/15–26/06/15). Students
worked in pairs or groups of three to co-construct their slowmation representation over
four 70-minute lessons with their respective classroom teacher (students chose their own
groups and these were amended by the teacher if deemed necessary). In determining the
topic of students’ slowmations, the researcher identified the most common alternative
conceptions held by students using the results of the GeoQuiz administration during stage
one (i.e., development of the instrument). As most of students’ alternative conceptions
were about tectonic plates and tectonic plate boundaries, it was decided that students
would create a slowmation that explains the geological processes that occur at a tectonic
plate boundary of their choosing. The researcher administered the GeoQuiz and SILS
53
survey to all classes pre- and post-intervention. This occurred in the lesson prior to
students beginning construction of their slowmation representation and the lesson
immediately after completion (i.e., the administration of the test and questionnaire
occurred outside of the four 70-minute lessons).
The slowmation construction process included three broad stages: planning, construction
and presentation (adapted from Hoban & Nielsen, 2012). During the planning phase,
students researched a type of tectonic plate boundary using the Internet and created a
storyboard for their slowmation representations. The storyboard showed what materials
the students would manipulate and how they would be manipulated between each still
photograph in order to represent their chosen tectonic plate boundary. Students had a
range of craft materials available for use, including coloured paper, modeling clay,
sponges, pipe cleaners, paddle-pop sticks, markers and labels. In the construction phase,
students constructed, manipulated and photographed their representations of a tectonic
plate boundary using iPads™ that had the MyCreate™ application installed. Students
used the application to display the photographs at one second per frame and added
narration that explained the processes occurring. Finally, students viewed their peers’
animations in the presentation phase. To enhance the authenticity of the task, the Year 9
students presented their finished slowmation representations to the College’s younger
children. A summary of the task presented to students is presented in Figure 3.3.
A constructivist learning environment was encouraged throughout the implementation of
the project. This means that students were supported to independently translate
information between representations, consistent with the 5Rs model (Chapter 2, Section
2.5.2) and identified studies where this brought about conceptual change (Nielsen &
Hoban, 2015; Shen & Confrey, 2007). The role of the classroom teacher, as identified in
the MMAEPER model (Chapter 2, Section 2.5.2), was to ensure that students represented
scientifically accurate information throughout each stage of the construction process. In
doing so, the teacher moved between groups of students and prompted them to consider
the accuracy of their research notes, storyboards, models, images and final animations.
The teacher also prompted students to verbalise their thinking and explain their approach
54
to completing each of the stages. The researcher adopted an observer-participant role
(Creswell, 2015), and assisted with these tasks only if approached by a student. It is to be
noted that although a constructivist learning environment was encouraged, the researcher
had little control over the teachers’ and students’ perspectives of learning in science, nor
the type of learning environment that was normally established in the classroom.
Teaching as usual for the two comparison classes comprised the College’s enactment of
the Australian Curriculum; namely, the learning activities provided in the C2C unit
‘Changing Earth’ (DETE, 2014a). While the intervention classes were creating
slowmation representations, the comparison classes participated in the corresponding
C2C lessons. This meant that over the four science lessons, all four classes involved in
the project learnt the same underlying content about tectonic plates and tectonic plate
boundaries. Example learning activities from the ‘Changing Earth’ (DETE, 2014a) unit
plan include viewing a PowerPoint™ presentation about plate tectonics, drawing and
labeling diagrams of the earth’s layers and plate boundaries, watching short videos on
YouTube™, and engaging with interactive internet-based learning objects. Some the
learning activities were adapted as necessary to span four 70-minute science lessons
(Table 3.1).
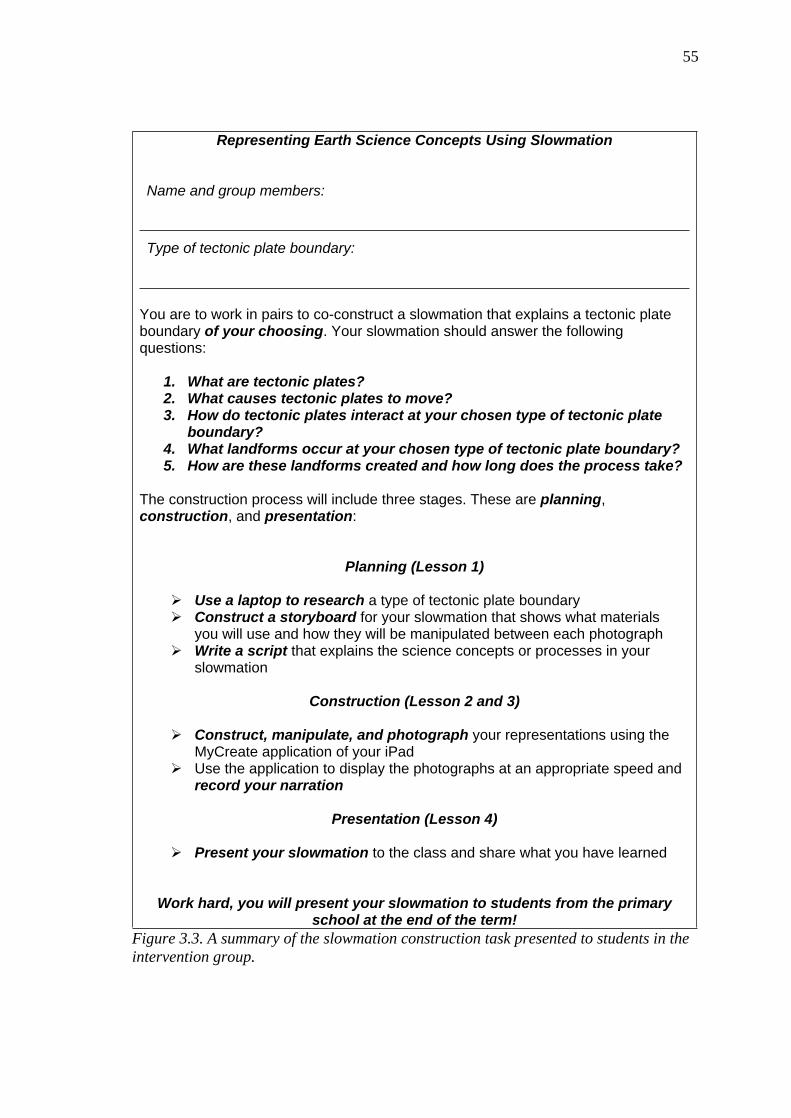
55
Representing Earth Science Concepts Using Slowmation
Name and group members:
Type of tectonic plate boundary:
You are to work in pairs to co-construct a slowmation that explains a tectonic plate boundary of your choosing. Your slowmation should answer the following questions:
1. What are tectonic plates?2. What causes tectonic plates to move?3. How do tectonic plates interact at your chosen type of tectonic plate
boundary?4. What landforms occur at your chosen type of tectonic plate boundary?5. How are these landforms created and how long does the process take?
The construction process will include three stages. These are planning, construction, and presentation:
Planning (Lesson 1)
Use a laptop to research a type of tectonic plate boundary Construct a storyboard for your slowmation that shows what materials
you will use and how they will be manipulated between each photograph Write a script that explains the science concepts or processes in your
slowmation
Construction (Lesson 2 and 3)
Construct, manipulate, and photograph your representations using the MyCreate application of your iPad
Use the application to display the photographs at an appropriate speed and record your narration
Presentation (Lesson 4)
Present your slowmation to the class and share what you have learned
Work hard, you will present your slowmation to students from the primary school at the end of the term!
Figure 3.3. A summary of the slowmation construction task presented to students in the intervention group.
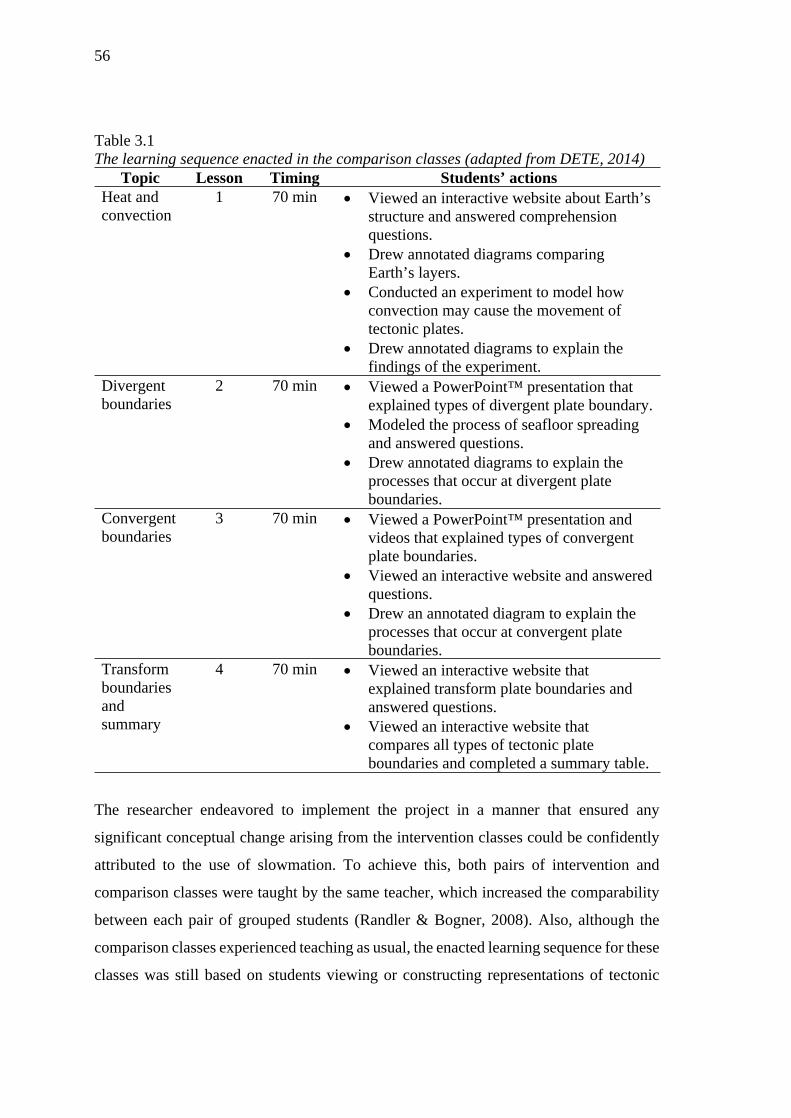
56
Table 3.1The learning sequence enacted in the comparison classes (adapted from DETE, 2014)
Topic Lesson Timing Students’ actionsHeat and convection
1 70 min Viewed an interactive website about Earth’s structure and answered comprehension questions.
Drew annotated diagrams comparing Earth’s layers.
Conducted an experiment to model how convection may cause the movement of tectonic plates.
Drew annotated diagrams to explain the findings of the experiment.
Divergent boundaries
2 70 min Viewed a PowerPoint™ presentation that explained types of divergent plate boundary.
Modeled the process of seafloor spreading and answered questions.
Drew annotated diagrams to explain the processes that occur at divergent plate boundaries.
Convergent boundaries
3 70 min Viewed a PowerPoint™ presentation and videos that explained types of convergent plate boundaries.
Viewed an interactive website and answered questions.
Drew an annotated diagram to explain the processes that occur at convergent plate boundaries.
Transform boundaries and summary
4 70 min Viewed an interactive website that explained transform plate boundaries and answered questions.
Viewed an interactive website that compares all types of tectonic plate boundaries and completed a summary table.
The researcher endeavored to implement the project in a manner that ensured any
significant conceptual change arising from the intervention classes could be confidently
attributed to the use of slowmation. To achieve this, both pairs of intervention and
comparison classes were taught by the same teacher, which increased the comparability
between each pair of grouped students (Randler & Bogner, 2008). Also, although the
comparison classes experienced teaching as usual, the enacted learning sequence for these
classes was still based on students viewing or constructing representations of tectonic
57
plate boundaries (e.g., diagrams and three-dimensional models). As such, the only major
difference between the conditions was the multi-representational nature of constructing a
slowmation, which required students to transform science information from one
representation to another. Other variables (e.g., socioeconomic variables and gender)
were comparable given the uniform student body at the College where the research
project was carried out (see Section 3.3) and the researcher’s choice of statistical tests
during data analysis (see Section 3.4.2.1).
3.4.2 Methods of data generation
The project employed mixed methods to generate coarse- and fine-grained data. Data
pertaining to students’ conceptual change were generated using:
the GeoQuiz, a two-tiered diagnostic test instrument administered to all students
before and after their participation in the research project;
audio recordings of selected students from the intervention classes thinking-aloud
during the creation of their slowmation; and
semi-structured, in-depth interviews conducted with selected students from the
intervention classes at the end of the project.
Data pertaining to students’ interest in learning science were generated from the SILS
survey administered to all students before and after their participation in the research
project; and semi-structured, in-depth interviews conducted with selected students from
the intervention classes.
An information sheet and consent form was distributed to each student to inform his/her
parents about each stage of the project (Appendix A). Informed consent was collected
from each student and their parents to allow the researcher to use all of the data collected
during the research project.
3.4.2.1 Two-tiered multiple-choice test: The GeoQuiz
The GeoQuiz was administered pre- and post-intervention to determine if the process of
creating a slowmation representation had a significant effect on students’ conceptual
change. It is to be noted that a delayed posttest was not conducted due to the scope and
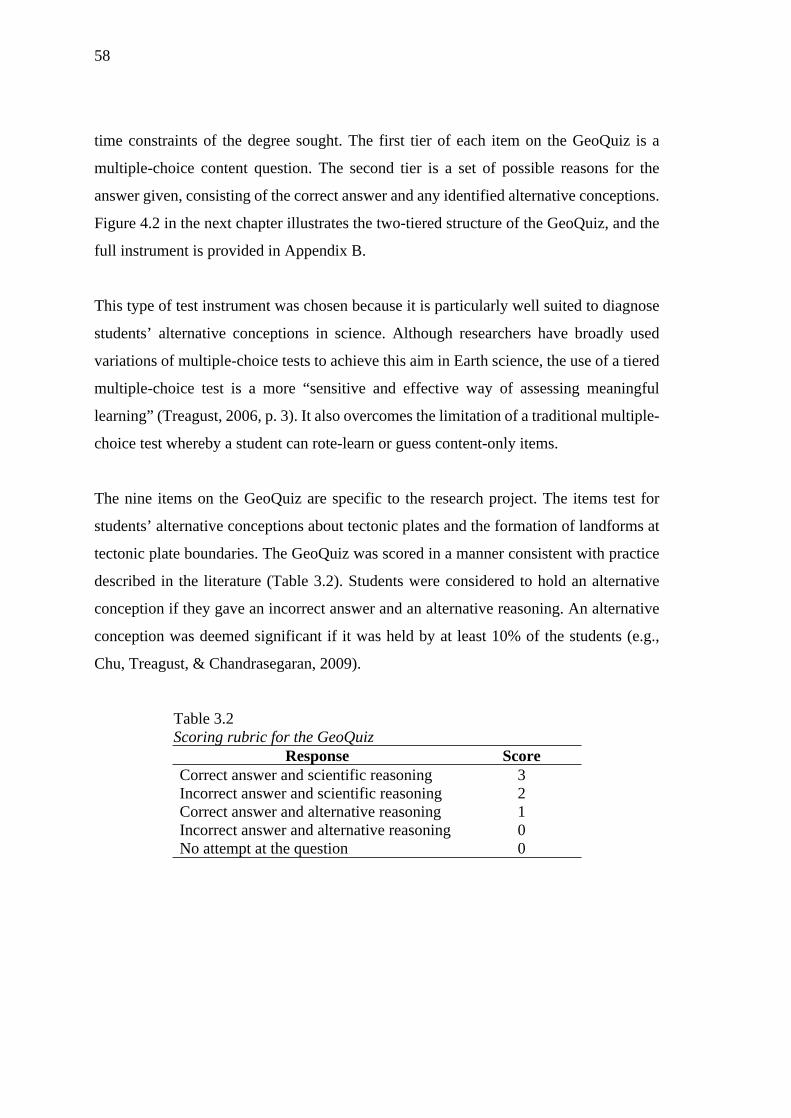
58
time constraints of the degree sought. The first tier of each item on the GeoQuiz is a
multiple-choice content question. The second tier is a set of possible reasons for the
answer given, consisting of the correct answer and any identified alternative conceptions.
Figure 4.2 in the next chapter illustrates the two-tiered structure of the GeoQuiz, and the
full instrument is provided in Appendix B.
This type of test instrument was chosen because it is particularly well suited to diagnose
students’ alternative conceptions in science. Although researchers have broadly used
variations of multiple-choice tests to achieve this aim in Earth science, the use of a tiered
multiple-choice test is a more “sensitive and effective way of assessing meaningful
learning” (Treagust, 2006, p. 3). It also overcomes the limitation of a traditional multiple-
choice test whereby a student can rote-learn or guess content-only items.
The nine items on the GeoQuiz are specific to the research project. The items test for
students’ alternative conceptions about tectonic plates and the formation of landforms at
tectonic plate boundaries. The GeoQuiz was scored in a manner consistent with practice
described in the literature (Table 3.2). Students were considered to hold an alternative
conception if they gave an incorrect answer and an alternative reasoning. An alternative
conception was deemed significant if it was held by at least 10% of the students (e.g.,
Chu, Treagust, & Chandrasegaran, 2009).
Table 3.2 Scoring rubric for the GeoQuiz
Response ScoreCorrect answer and scientific reasoning 3Incorrect answer and scientific reasoning 2Correct answer and alternative reasoning 1Incorrect answer and alternative reasoning 0No attempt at the question 0
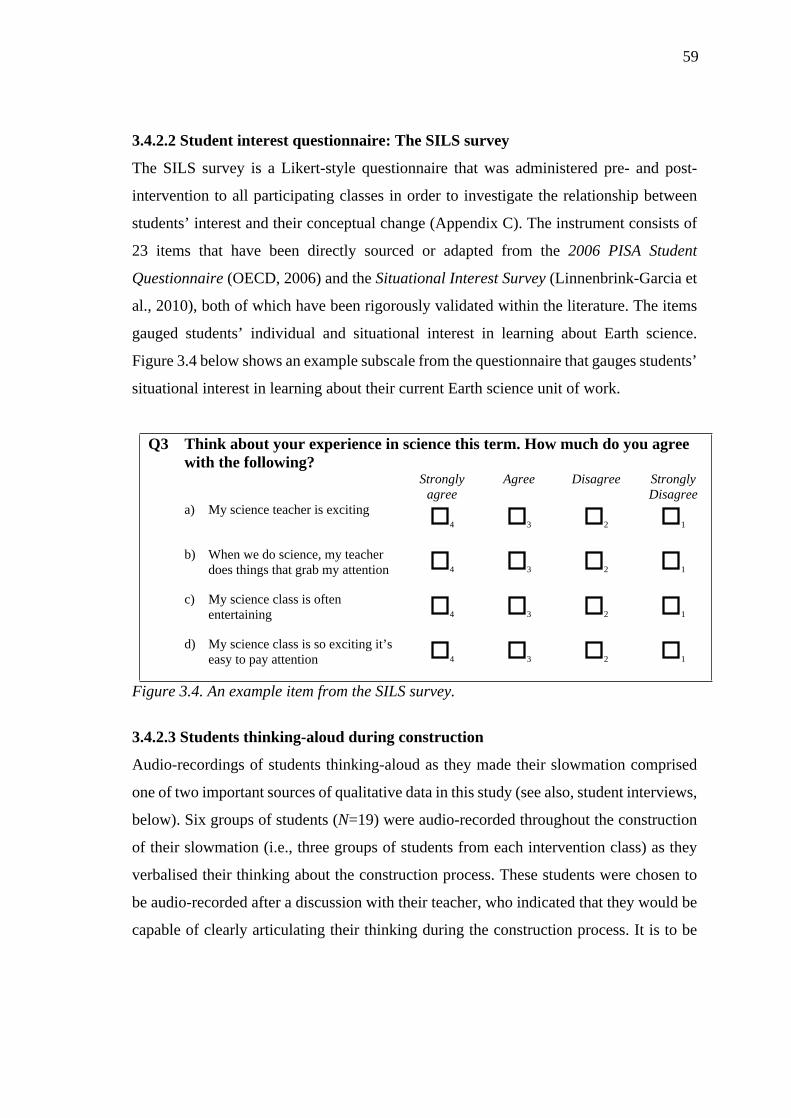
59
3.4.2.2 Student interest questionnaire: The SILS survey
The SILS survey is a Likert-style questionnaire that was administered pre- and post-
intervention to all participating classes in order to investigate the relationship between
students’ interest and their conceptual change (Appendix C). The instrument consists of
23 items that have been directly sourced or adapted from the 2006 PISA Student
Questionnaire (OECD, 2006) and the Situational Interest Survey (Linnenbrink-Garcia et
al., 2010), both of which have been rigorously validated within the literature. The items
gauged students’ individual and situational interest in learning about Earth science.
Figure 3.4 below shows an example subscale from the questionnaire that gauges students’
situational interest in learning about their current Earth science unit of work.
Q3 Think about your experience in science this term. How much do you agree with the following?
Strongly agree
Agree Disagree Strongly Disagree
a) My science teacher is exciting 4 3 2 1
b) When we do science, my teacher does things that grab my attention 4 3 2 1
c) My science class is often entertaining 4 3 2 1
d) My science class is so exciting it’s easy to pay attention 4 3 2 1
Figure 3.4. An example item from the SILS survey.
3.4.2.3 Students thinking-aloud during construction
Audio-recordings of students thinking-aloud as they made their slowmation comprised
one of two important sources of qualitative data in this study (see also, student interviews,
below). Six groups of students (N=19) were audio-recorded throughout the construction
of their slowmation (i.e., three groups of students from each intervention class) as they
verbalised their thinking about the construction process. These students were chosen to
be audio-recorded after a discussion with their teacher, who indicated that they would be
capable of clearly articulating their thinking during the construction process. It is to be
60
noted that the comparison group was not audio-recorded. This is because these data were
not needed to answer the research questions.
3.4.2.4 Student interviews
Semi-structured, in-depth interviews were the second source of qualitative data used to
gain insight into how creating a slowmation influenced students’ conceptual change.
Interviews were conducted with the same students who were audio-recorded throughout
the construction process (N=19). Rather than presenting a fixed schedule, a semi-
structured approach allowed for the elaboration of important themes that emerged during
the interviews (Heyl, 2001). At interview, students were asked questions that probed their
experiences of creating a slowmation, and their perceptions on how the experience
influenced their learning. Some questions students were asked at interview included, ‘Can
you tell me about your experience creating a slowmation?’ and ‘How do you think
creating a slowmation impacted on your learning?’. In order to enhance the validity of
the findings arising from interviews with students, the researcher spoke briefly to students
later in the school term to check that his interpretations of their perspectives at interview
were fair and representative (Creswell, 2005). Students from the comparison group were
not interviewed, as this data was not needed to answer the research questions.
3.4.3 Data Analysis
Quantitative data analysis was carried out to measure changes in students’ responses on
the GeoQuiz and SILS survey. The analysis techniques that were employed are described
in detail in Section 3.4.3.1. Qualitative analysis of the think-aloud data and student
interviews were used to complement and gain a deeper understanding of the quantitative
findings. The transcription and coding procedures that were employed are described in
detail in Section 3.4.3.2.
3.4.3.1 Quantitative analysis
Both item and statistical analyses were performed on the GeoQuiz data. Any changes in
students’ conceptions from pretest to posttest were initially analysed by using descriptive
statistics; specifically, the frequency of students with scientific and alternative
61
conceptions at pretest and posttest was compared within and between the conditions.
Following this, multivariate and univariate analyses were carried out on students’ overall
test scores to determine if the changes in students’ understanding of the science content
were significant. A repeated measures analysis of variance (ANOVA) was used to
examine whether constructing a slowmation had a significant effect on students’
conceptual change, and subsequent t-tests were used to investigate any identified
significant effects.
Multivariate and univariate statistics were also used to explore the differences between
students’ interest within and between conditions, and to determine if there were
significant changes in students’ mean survey scores. A multivariate analysis of variance
(MANOVA) was conducted to examine the change in students’ interest from pretest to
posttest. Follow-up ANOVAs and t-tests were used to investigate significant effects.
Correlation and regression analyses were carried out using the GeoQuiz and SILS survey
results to investigate the relationship between students’ interest and conceptual change.
3.4.3.2 Qualitative analysis
To facilitate qualitative analysis of student think-aloud and interview data, the researcher
first manually transcribed all audio-recordings, using pseudonyms for students’ names.
Interviews were transcribed in a manner that ensured the subtleties of spoken data were
not lost. In doing so, the following procedures, adapted from Psathas (1995), were
utilised:
Emphasis noted by using italics for parts of an utterance that are stressed.
Semi-colons indicate words that are stretched (e.g., so:::).
Square brackets indicate speech that is overlapped. Double brackets are used
when utterances start simultaneously.
Punctuation indicates pitch: a question mark (?) indicates a question, or rising
intonation; a comma (,) indicates continuing intonation; an animated tone is
indicated by ‘!’.
‘=’ indicates latching (i.e., no interval between the end of a prior and the start of
a next part of talk).
62
Numbers in parentheses indicates in seconds the length of an interval [e.g., (2)
represents a two-second pause]. Longer un-timed pauses are represented by
((gap)).
Cut off indicated with a single dash (e.g., bu-).
Descriptions of phenomena are enclosed in double parentheses [e.g., ((cough));
((telephone rings))].
Other than timed intervals, utterances in parentheses are in doubt. If single
parentheses are empty, no hearing was achieved.
‘…’ indicates an incomplete sentence.
Once transcribed, an initial exploratory analysis was carried out, whereby the transcripts
were read several times in their entirety to discern what was important in the data and
what was not. During this process, any ‘codable moments’ worthy of attention were
highlighted for ease of reference in later analyses. To code the data, an approach called
‘pragmatic eclecticism’ was adopted, whereby the researcher kept an open mind
throughout the initial data readings and subsequently selected a method that was “most
likely to yield a substantive analysis” (Saldaña, 2013, p. 56). Although there was no
specific a priori approach to coding the data, the research question ‘How does
constructing a slowmation influence students’ conceptual change?’ was used to focus the
analyses.
To begin, ‘initial coding’ procedures were employed to build a foundation for further
coding cycles (Charmaz, 2006; Saldaña, 2013). In doing so, the data were broken down
into discrete parts (i.e., the stages of constructing a slowmation used in this study –
researching, storyboarding and constructing), closely examined, and compared for
similarities and differences. Short segments of text were then coded in a manner
representative of their meaning. Throughout this process, the researcher reflected deeply
on the content and nuances of the data, and remained open to all possible theoretical
directions indicated by his readings (Saldaña, 2013). At times, re-coding was necessary
to filter and focus on features of the data that were salient to the research question being
investigated. For instance, although student ‘talk’ may have been considered a form of
63
representation in the current study (e.g., Lemke, 2001), the analysis was filtered to focus
on the physical forms of representation identified as pertinent to the slowmation
construction process identified in Chapter 2, Section 2.5.2. An electronic catalogue was
kept throughout the initial coding process, including the code name, definition, and
sample quotations (see Appendix D).
Following this, ‘pattern coding’ procedures were used to develop categories and then
themes from the data (Miles & Huberman, 1994; Saldaña, 2013). Pattern codes are
“explanatory or inferential” codes that “pull together a lot of material into a more
meaningful and parsimonious unit of analysis” (Miles & Huberman, 1994, p. 69). To
develop pattern codes, the researcher looked for similarities in meaning among the initial
codes. He then categorised and re-labeled similar codes in a manner that holistically
captured their ‘spirit’ (Saldaña, 2013). Although this iterative process is difficult to
represent, an example of the development of categories and themes from initial codes is
shown in Figure 3.5.
Finally, analytical memos were written throughout the process of coding the data in order
to document and reflect upon the emergent patterns. The researcher wrote his ‘musings’
in the margins of hard-copy transcripts, and later wrote more formal reflections about the
study’s research questions, his code choices and their operational definitions, and any
emergent categories and themes (Saldaña, 2013). These actions enabled the exploration
of “network relationships between and among concepts” (Saldaña, 2013, p. 45), and
created a “rising-above-the-data heuristic” (Saldaña, 2013, p. 41) necessary to formulate
meaningful assertions.
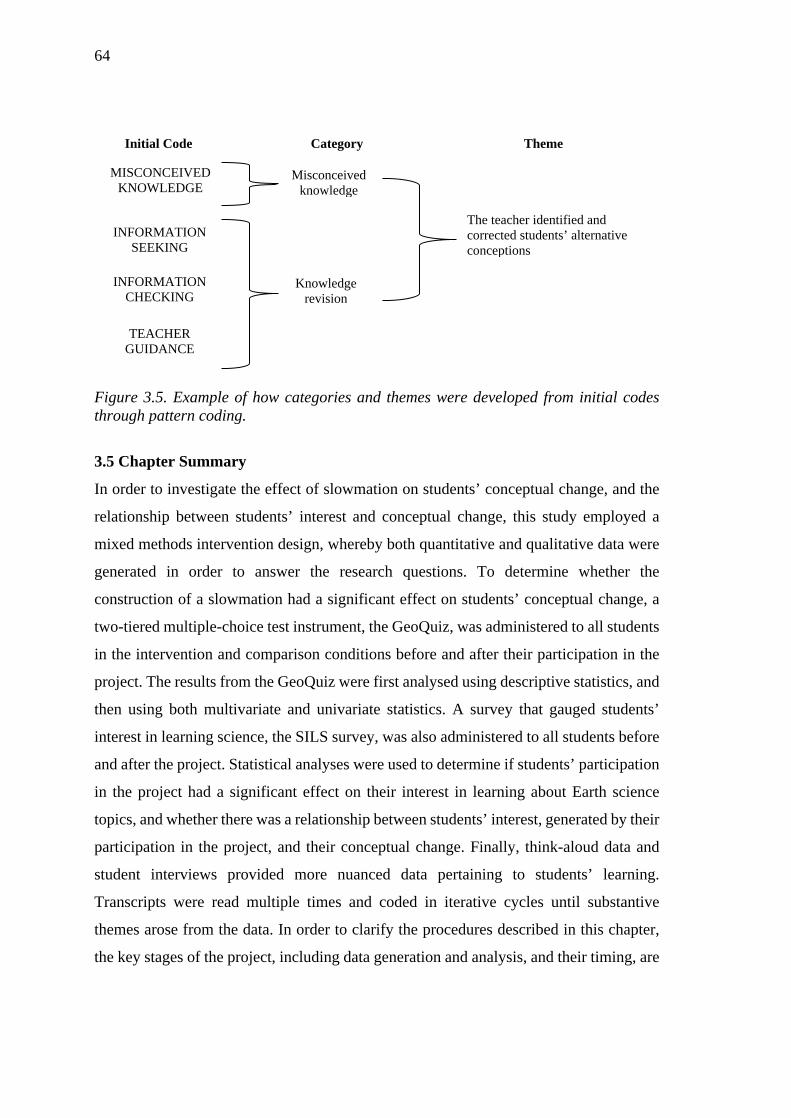
64
Initial Code Category Theme
MISCONCEIVED KNOWLEDGE
INFORMATION SEEKING
INFORMATION CHECKING
TEACHER GUIDANCE
Knowledge revision
Misconceived knowledge
The teacher identified and corrected students’ alternative conceptions
Figure 3.5. Example of how categories and themes were developed from initial codes through pattern coding.
3.5 Chapter Summary
In order to investigate the effect of slowmation on students’ conceptual change, and the
relationship between students’ interest and conceptual change, this study employed a
mixed methods intervention design, whereby both quantitative and qualitative data were
generated in order to answer the research questions. To determine whether the
construction of a slowmation had a significant effect on students’ conceptual change, a
two-tiered multiple-choice test instrument, the GeoQuiz, was administered to all students
in the intervention and comparison conditions before and after their participation in the
project. The results from the GeoQuiz were first analysed using descriptive statistics, and
then using both multivariate and univariate statistics. A survey that gauged students’
interest in learning science, the SILS survey, was also administered to all students before
and after the project. Statistical analyses were used to determine if students’ participation
in the project had a significant effect on their interest in learning about Earth science
topics, and whether there was a relationship between students’ interest, generated by their
participation in the project, and their conceptual change. Finally, think-aloud data and
student interviews provided more nuanced data pertaining to students’ learning.
Transcripts were read multiple times and coded in iterative cycles until substantive
themes arose from the data. In order to clarify the procedures described in this chapter,
the key stages of the project, including data generation and analysis, and their timing, are

65
presented in Table 3.3. The next chapter will describe the development and validation of
the GeoQuiz and SILS survey instruments.
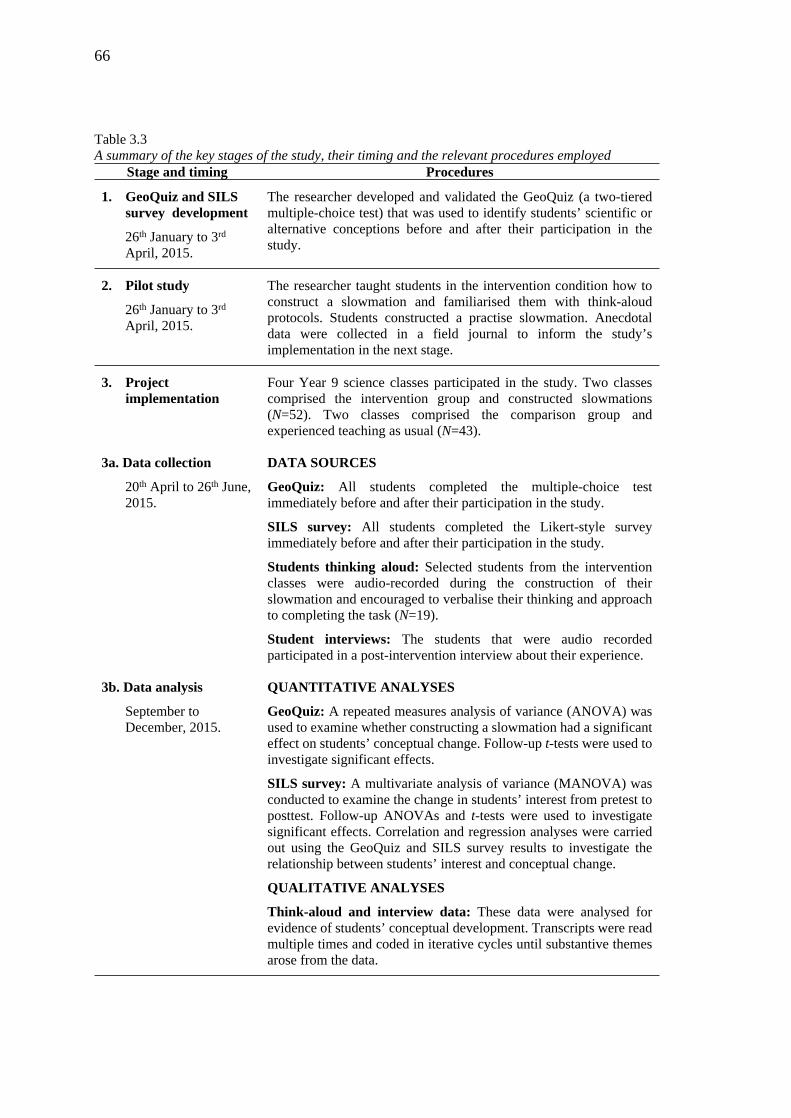
66
Table 3.3A summary of the key stages of the study, their timing and the relevant procedures employed
Stage and timing Procedures
1. GeoQuiz and SILS survey development
26th January to 3rd April, 2015.
The researcher developed and validated the GeoQuiz (a two-tiered multiple-choice test) that was used to identify students’ scientific or alternative conceptions before and after their participation in the study.
2. Pilot study
26th January to 3rd April, 2015.
The researcher taught students in the intervention condition how to construct a slowmation and familiarised them with think-aloud protocols. Students constructed a practise slowmation. Anecdotal data were collected in a field journal to inform the study’s implementation in the next stage.
3. Project implementation
Four Year 9 science classes participated in the study. Two classes comprised the intervention group and constructed slowmations (N=52). Two classes comprised the comparison group and experienced teaching as usual (N=43).
3a. Data collection
20th April to 26th June, 2015.
DATA SOURCES
GeoQuiz: All students completed the multiple-choice test immediately before and after their participation in the study.
SILS survey: All students completed the Likert-style survey immediately before and after their participation in the study.
Students thinking aloud: Selected students from the intervention classes were audio-recorded during the construction of their slowmation and encouraged to verbalise their thinking and approach to completing the task (N=19).
Student interviews: The students that were audio recorded participated in a post-intervention interview about their experience.
3b. Data analysis
September to December, 2015.
QUANTITATIVE ANALYSES
GeoQuiz: A repeated measures analysis of variance (ANOVA) was used to examine whether constructing a slowmation had a significant effect on students’ conceptual change. Follow-up t-tests were used to investigate significant effects.
SILS survey: A multivariate analysis of variance (MANOVA) was conducted to examine the change in students’ interest from pretest to posttest. Follow-up ANOVAs and t-tests were used to investigate significant effects. Correlation and regression analyses were carried out using the GeoQuiz and SILS survey results to investigate the relationship between students’ interest and conceptual change.
QUALITATIVE ANALYSES
Think-aloud and interview data: These data were analysed for evidence of students’ conceptual development. Transcripts were read multiple times and coded in iterative cycles until substantive themes arose from the data.
67
CHAPTER FOUR: INSTRUMENTATION
4.1 Chapter Introduction
This chapter details the development of the two key instruments employed in this study
to generate data pertaining to students’ conceptions of plate tectonics, and their interest
in learning about Earth science concepts through the project. It is presented in two main
sections. First, in Section 4.2, it will describe the development and validation of the
GeoQuiz, a two-tiered multiple-choice test instrument that was used to diagnose Year 9
students’ alternative conceptions about plate tectonics. Next, in Section 4.3, the
development of a questionnaire that gauges students’ interest in Earth science (i.e., topic
interest) and interest generated by the project (i.e., situational interest) is described: the
SILS survey. As identified in the previous chapter, both instruments were administered
to all four of the classes that participated in the study, pre- and post-intervention, so as to
identify any significant changes in their conceptual understanding and interest over the
course of the project.
4.2 Development of the GeoQuiz
There are many two-tiered test instruments available in the literature; however, none were
relevant to the unit of work under examination in the current study. It is for this reason
that the researcher developed the GeoQuiz, to elicit students’ alternative conceptions. The
design of the test instrument involved three broad tasks: (1) defining the content; (2)
researching students’ alternative conceptions; and (3) developing and validating the
instrument (Treagust, 1988). The steps to completing each of these tasks, as interpreted
in the context of the current research project, are summarised in Figure 4.1, and described
in detail in the sections that follow.
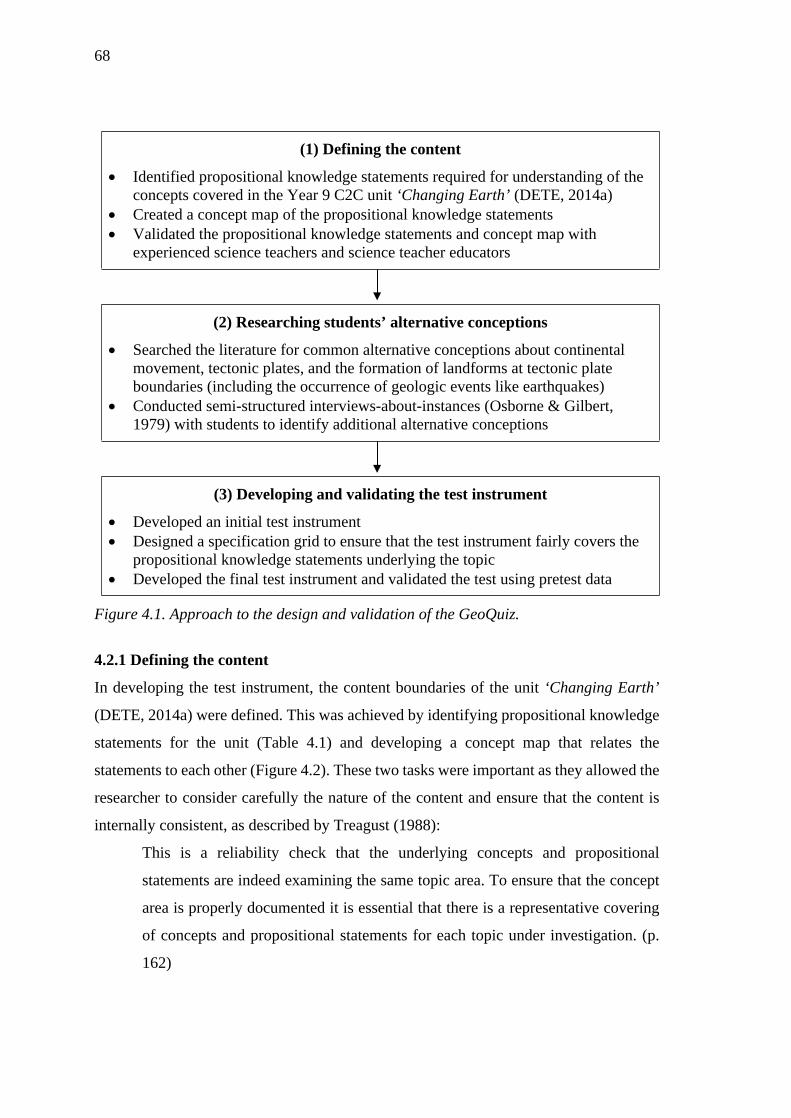
68
(1) Defining the content
Identified propositional knowledge statements required for understanding of the concepts covered in the Year 9 C2C unit ‘Changing Earth’ (DETE, 2014a)
Created a concept map of the propositional knowledge statements Validated the propositional knowledge statements and concept map with
experienced science teachers and science teacher educators
(2) Researching students’ alternative conceptions
Searched the literature for common alternative conceptions about continental movement, tectonic plates, and the formation of landforms at tectonic plate boundaries (including the occurrence of geologic events like earthquakes)
Conducted semi-structured interviews-about-instances (Osborne & Gilbert, 1979) with students to identify additional alternative conceptions
(3) Developing and validating the test instrument
Developed an initial test instrument Designed a specification grid to ensure that the test instrument fairly covers the
propositional knowledge statements underlying the topic Developed the final test instrument and validated the test using pretest data
Figure 4.1. Approach to the design and validation of the GeoQuiz.
4.2.1 Defining the content
In developing the test instrument, the content boundaries of the unit ‘Changing Earth’
(DETE, 2014a) were defined. This was achieved by identifying propositional knowledge
statements for the unit (Table 4.1) and developing a concept map that relates the
statements to each other (Figure 4.2). These two tasks were important as they allowed the
researcher to consider carefully the nature of the content and ensure that the content is
internally consistent, as described by Treagust (1988):
This is a reliability check that the underlying concepts and propositional
statements are indeed examining the same topic area. To ensure that the concept
area is properly documented it is essential that there is a representative covering
of concepts and propositional statements for each topic under investigation. (p.
162)
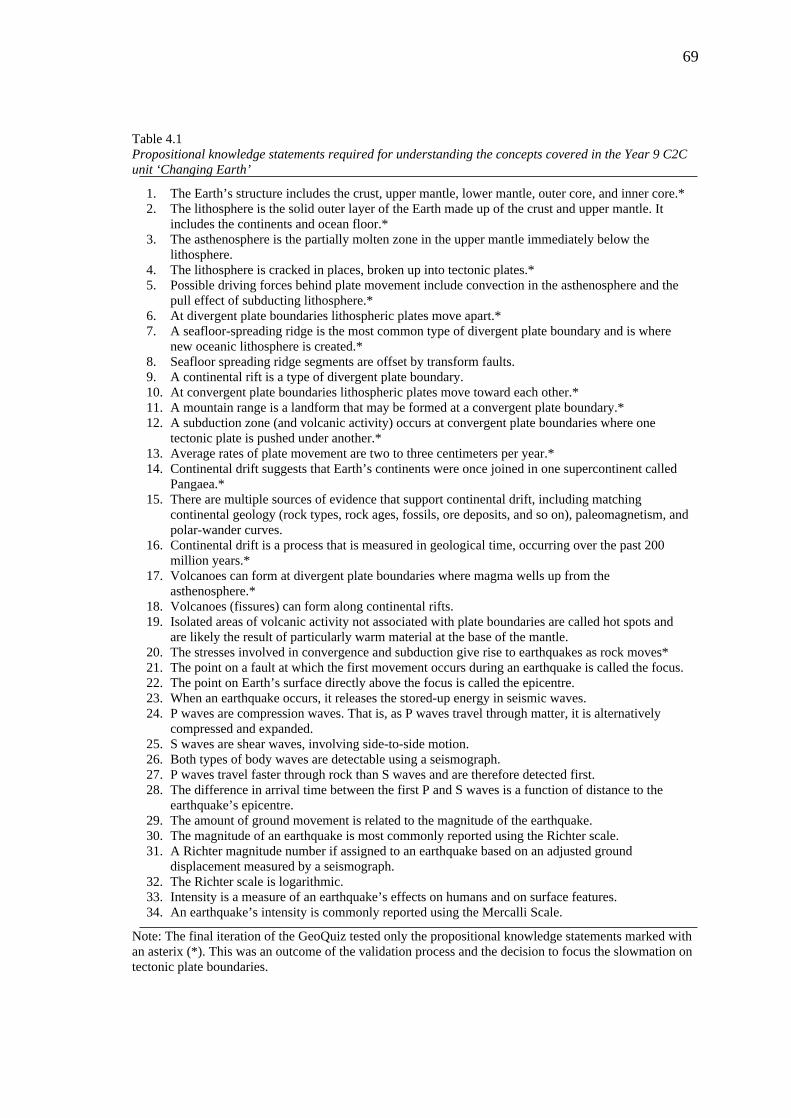
69
Table 4.1Propositional knowledge statements required for understanding the concepts covered in the Year 9 C2C unit ‘Changing Earth’
1. The Earth’s structure includes the crust, upper mantle, lower mantle, outer core, and inner core.*2. The lithosphere is the solid outer layer of the Earth made up of the crust and upper mantle. It
includes the continents and ocean floor.*3. The asthenosphere is the partially molten zone in the upper mantle immediately below the
lithosphere.4. The lithosphere is cracked in places, broken up into tectonic plates.*5. Possible driving forces behind plate movement include convection in the asthenosphere and the
pull effect of subducting lithosphere.*6. At divergent plate boundaries lithospheric plates move apart.*7. A seafloor-spreading ridge is the most common type of divergent plate boundary and is where
new oceanic lithosphere is created.*8. Seafloor spreading ridge segments are offset by transform faults.9. A continental rift is a type of divergent plate boundary.10. At convergent plate boundaries lithospheric plates move toward each other.*11. A mountain range is a landform that may be formed at a convergent plate boundary.*12. A subduction zone (and volcanic activity) occurs at convergent plate boundaries where one
tectonic plate is pushed under another.*13. Average rates of plate movement are two to three centimeters per year.*14. Continental drift suggests that Earth’s continents were once joined in one supercontinent called
Pangaea.*15. There are multiple sources of evidence that support continental drift, including matching
continental geology (rock types, rock ages, fossils, ore deposits, and so on), paleomagnetism, and polar-wander curves.
16. Continental drift is a process that is measured in geological time, occurring over the past 200 million years.*
17. Volcanoes can form at divergent plate boundaries where magma wells up from the asthenosphere.*
18. Volcanoes (fissures) can form along continental rifts.19. Isolated areas of volcanic activity not associated with plate boundaries are called hot spots and
are likely the result of particularly warm material at the base of the mantle.20. The stresses involved in convergence and subduction give rise to earthquakes as rock moves*21. The point on a fault at which the first movement occurs during an earthquake is called the focus.22. The point on Earth’s surface directly above the focus is called the epicentre.23. When an earthquake occurs, it releases the stored-up energy in seismic waves.24. P waves are compression waves. That is, as P waves travel through matter, it is alternatively
compressed and expanded.25. S waves are shear waves, involving side-to-side motion.26. Both types of body waves are detectable using a seismograph.27. P waves travel faster through rock than S waves and are therefore detected first.28. The difference in arrival time between the first P and S waves is a function of distance to the
earthquake’s epicentre.29. The amount of ground movement is related to the magnitude of the earthquake.30. The magnitude of an earthquake is most commonly reported using the Richter scale.31. A Richter magnitude number if assigned to an earthquake based on an adjusted ground
displacement measured by a seismograph.32. The Richter scale is logarithmic.33. Intensity is a measure of an earthquake’s effects on humans and on surface features.34. An earthquake’s intensity is commonly reported using the Mercalli Scale.
Note: The final iteration of the GeoQuiz tested only the propositional knowledge statements marked with an asterix (*). This was an outcome of the validation process and the decision to focus the slowmation on tectonic plate boundaries.
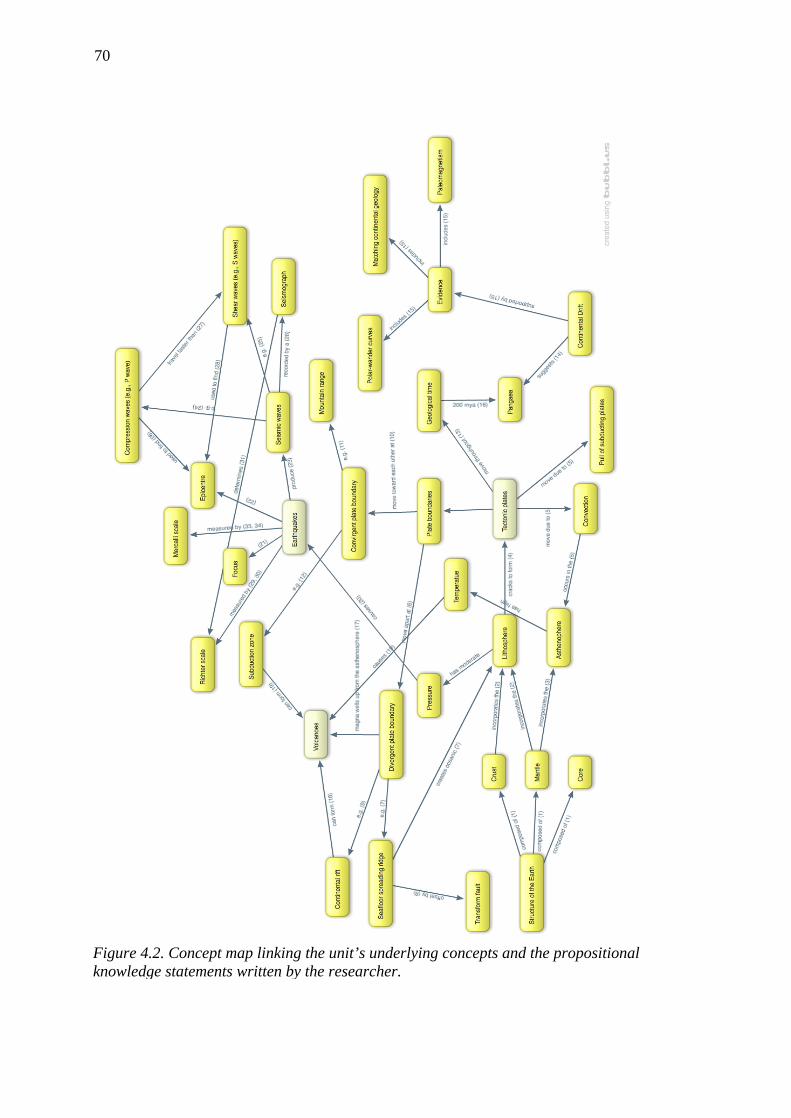
70
Figure 4.2. Concept map linking the unit’s underlying concepts and the propositional knowledge statements written by the researcher.
71
Experts in the field then validated the propositional knowledge statements and the concept
map. The purpose of this was twofold. First, it ensured that the content is scientifically
accurate (Treagust, 1988). Second, it ensured that the knowledge being tested is
thoroughly documented so that no questions are developed for the test that do not relate
clearly to the concepts being taught (Treagust, 1988). In this instance, a panel of four
experts validated the propositional knowledge statements and concept map: two
experienced Earth science teachers and two science teacher educators. Panel members
were asked to indicate if they thought each of the propositional knowledge statements
were representative of the understanding required by students in the unit of work
(Appendix E). Some of the initial propositional knowledge statements written by the
researcher were modified or removed as a result of this process.
4.2.2 Researching students’ alternative conceptions
Researching students’ alternative conceptions about continental movement, tectonic
plates and the formation of landforms at tectonic plate boundaries (i.e., the topics in the
‘Changing Earth’ unit of work), provided foundational information for the development
of the two-tiered multiple-choice questions. This was achieved in two ways. The
researcher first conducted a search of the literature for secondary school students’
alternative conceptions about the relevant topics, and then conducted semi-structured
interviews with students to identify any additional alternative conceptions.
4.2.2.1 Alternative conceptions from the literature
The researcher found one published study that investigated secondary school students’
alternative conceptions about plate tectonics. This study, conducted by Marques and
Thompson (1997), reported on Portuguese students’ alternative conceptions of
continental movement and plate tectonics. Students aged between 16 and 19 years
(N=270) held several alternative conceptions about plate tectonics. The authors collected
data from students’ written responses to open-ended questions. The most common
alternative conception, held by 64% of students, was that tectonic plates are stacked on
top of each other, in layers. Students that had this perspective thought that the oldest plates
comprised the bottom layers, while the youngest plates comprised the top layers. Twenty-
72
one per cent of students incorrectly thought that the coastlines of continents are the edges
of tectonic plates. It was suggested that terminology used in science classes that refers to
‘two types of plates’ – continental and oceanic – might reinforce this alternative
conception. Other alternative conceptions arising from their study were: the same
processes produce both continental and oceanic mountain ranges (40%); tectonic plates
move about a center axis (35%); and magnetic polar wandering causes the movement of
tectonic plates (34%).
4.2.2.2 Alternative conceptions from interviews-about-instances with students
Many more alternative conceptions were uncovered by the researcher’s own interviews
with students. A sample of Year 9 students (N=21) participated in individual interviews-
about-instances (Osborne & Gilbert, 1979). In line with how this method has been used
in science education, the researcher used photographs to prompt students’ consideration
of particular concepts concerning plate tectonics, and ensured that students voiced aloud
the reason for their response. Examples of the questions asked at interview include:
Is this a photograph of a tectonic plate? Why do you think that?
This is a satellite photograph of the Andes mountain range in South America. Is
this a tectonic plate boundary? Why do you think that?
These photographs were taken in Christchurch, New Zealand, after the earthquake
that occurred there in 2011. What do you think caused this earthquake? Why do
you think that?
As the interviews were semi-structured, the researcher did not strictly adhere to an
interview schedule. Rather, he pursued courses of fruitful dialogue as they arose and
sought out opportunities for gaining an in-depth understanding of students’ conceptions.
Interviews with students typically lasted 20 minutes, and were audio-recorded and
transcribed by the researcher for analysis. An initial exploratory analysis was performed
by reading all transcripts in their entirety several times to gain a general sense of the data.
Following this, the transcripts were divided into segments of text and coded according to
their meaning using NVivo™ software. An initial framework used for coding was adapted
from previous research on students’ alternative conceptions of Earth science phenomena.
73
Variations of this framework have been used previously to analyse school and university
students’ conceptions of Earth and space science topics, including moon phases (Nielsen
& Hoban, 2015; Trundle et al., 2002) and tides (Ucar et al., 2011), but not students’
conceptions about plate tectonics. This framework categorised students’ responses as ‘no
conception’ (e.g., “I don’t know”), ‘incomplete or alternative conception’ (e.g., “Whether
it’s hot underground will determine whether it’s a volcano or mountain”), and ‘scientific
conception’ (e.g., “The lithosphere is broken up into tectonic plates”). In alignment with
the researcher’s aim for this exercise, special attention was then given to identifying
alternative conceptions.
It was found that students held many alternative conceptions about plate tectonics, most
of which have not been reported in previous research. The data are presented here as
follows: (1) students’ conceptions about the nature and movement of tectonic plates; (2)
students’ conceptions about tectonic plate boundaries; and (3) students’ conceptions
about the occurrence of geologic events at tectonic plate boundaries2.
(1) Students’ conceptions about the nature and movement of tectonic plates
Interviews with students identified seven alternative conceptions about the nature and
movement of tectonic plates (Table 4.2). The most common alternative conception held
by students was that tectonic plates are underground and are not exposed at the Earth’s
surface. Often, students thought that tectonic plates are located deep below Earth’s crust.
The following excerpt from one interview transcript indicates a typical response when
students were questioned about their understanding of the nature of tectonic plates:
Researcher Can you explain to me in your own words what you think a
tectonic plate is?
John A layer of, like, I’m not sure, molten rock maybe? It sits slightly
under the surface.
2 Additional detail about data generation and analysis, including the development of these themes, can be found in Mills, Tomas, and Lewthwaite, 2017.
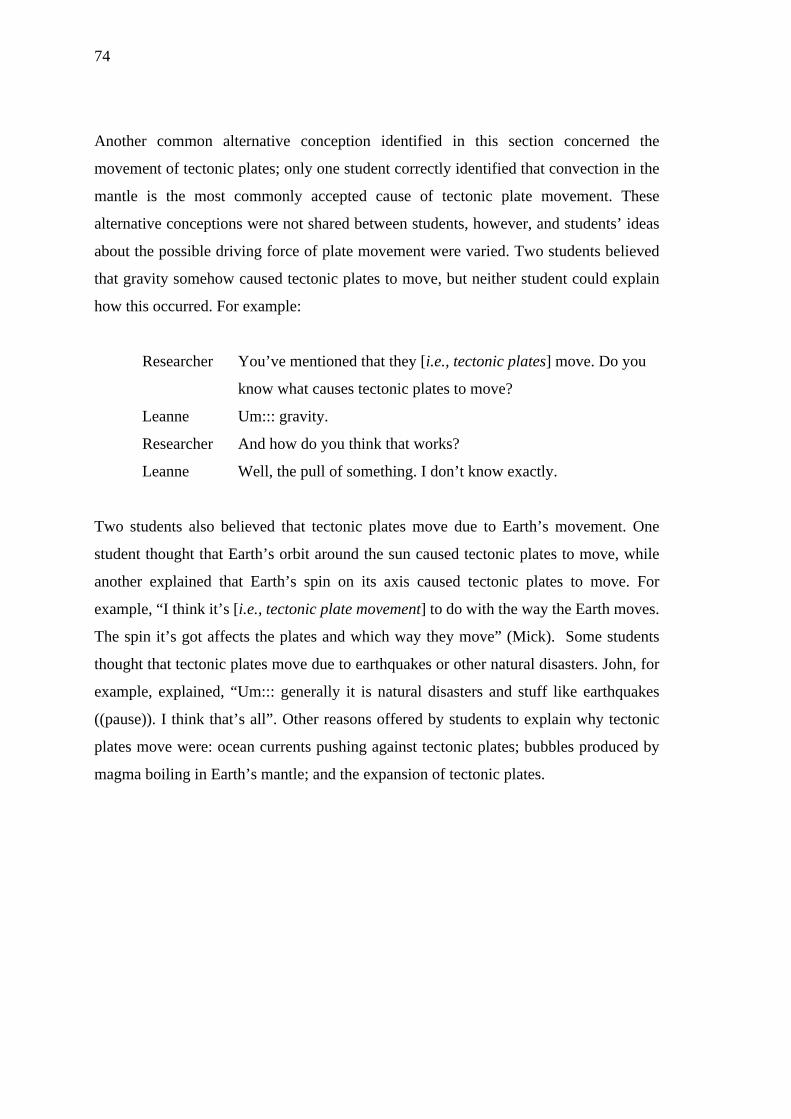
74
Another common alternative conception identified in this section concerned the
movement of tectonic plates; only one student correctly identified that convection in the
mantle is the most commonly accepted cause of tectonic plate movement. These
alternative conceptions were not shared between students, however, and students’ ideas
about the possible driving force of plate movement were varied. Two students believed
that gravity somehow caused tectonic plates to move, but neither student could explain
how this occurred. For example:
Researcher You’ve mentioned that they [i.e., tectonic plates] move. Do you
know what causes tectonic plates to move?
Leanne Um::: gravity.
Researcher And how do you think that works?
Leanne Well, the pull of something. I don’t know exactly.
Two students also believed that tectonic plates move due to Earth’s movement. One
student thought that Earth’s orbit around the sun caused tectonic plates to move, while
another explained that Earth’s spin on its axis caused tectonic plates to move. For
example, “I think it’s [i.e., tectonic plate movement] to do with the way the Earth moves.
The spin it’s got affects the plates and which way they move” (Mick). Some students
thought that tectonic plates move due to earthquakes or other natural disasters. John, for
example, explained, “Um::: generally it is natural disasters and stuff like earthquakes
((pause)). I think that’s all”. Other reasons offered by students to explain why tectonic
plates move were: ocean currents pushing against tectonic plates; bubbles produced by
magma boiling in Earth’s mantle; and the expansion of tectonic plates.
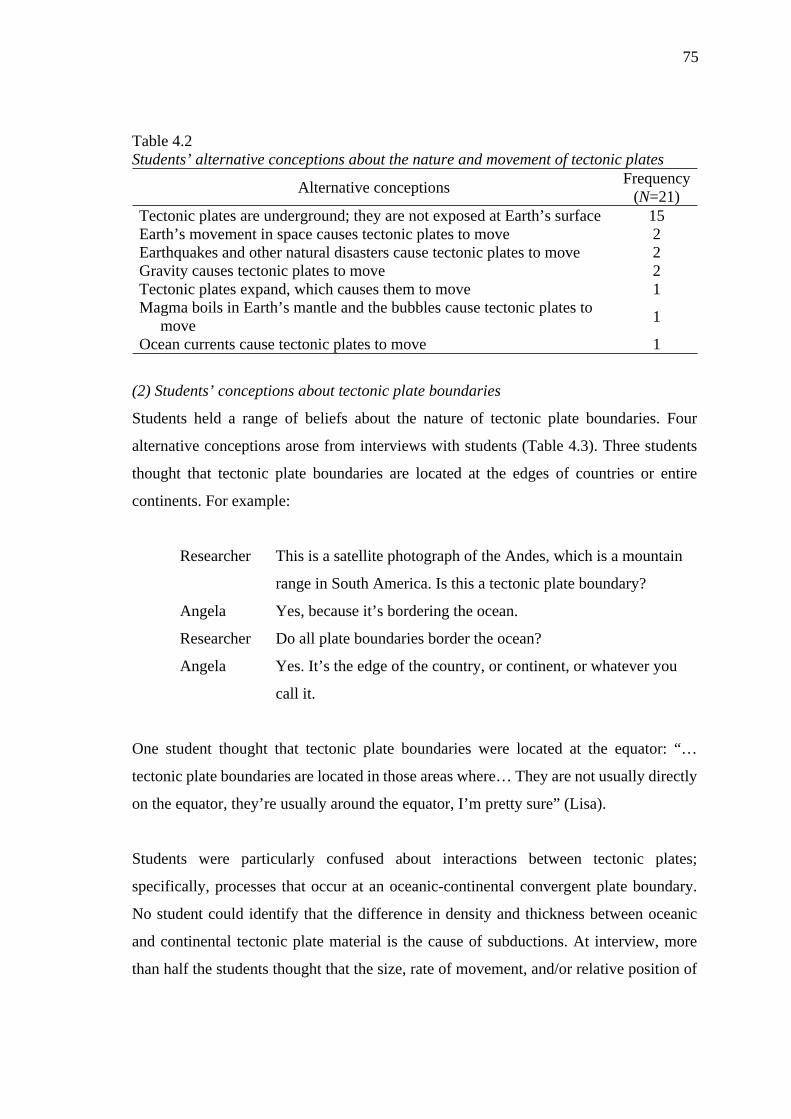
75
Table 4.2Students’ alternative conceptions about the nature and movement of tectonic plates
Alternative conceptions Frequency (N=21)
Tectonic plates are underground; they are not exposed at Earth’s surface 15Earth’s movement in space causes tectonic plates to move 2Earthquakes and other natural disasters cause tectonic plates to move 2Gravity causes tectonic plates to move 2Tectonic plates expand, which causes them to move 1Magma boils in Earth’s mantle and the bubbles cause tectonic plates to
move 1
Ocean currents cause tectonic plates to move 1
(2) Students’ conceptions about tectonic plate boundaries
Students held a range of beliefs about the nature of tectonic plate boundaries. Four
alternative conceptions arose from interviews with students (Table 4.3). Three students
thought that tectonic plate boundaries are located at the edges of countries or entire
continents. For example:
Researcher This is a satellite photograph of the Andes, which is a mountain
range in South America. Is this a tectonic plate boundary?
Angela Yes, because it’s bordering the ocean.
Researcher Do all plate boundaries border the ocean?
Angela Yes. It’s the edge of the country, or continent, or whatever you
call it.
One student thought that tectonic plate boundaries were located at the equator: “…
tectonic plate boundaries are located in those areas where… They are not usually directly
on the equator, they’re usually around the equator, I’m pretty sure” (Lisa).
Students were particularly confused about interactions between tectonic plates;
specifically, processes that occur at an oceanic-continental convergent plate boundary.
No student could identify that the difference in density and thickness between oceanic
and continental tectonic plate material is the cause of subductions. At interview, more
than half the students thought that the size, rate of movement, and/or relative position of
76
a tectonic plate at a convergent plate boundary influenced its interaction with another
plate. For instance, when Mick was shown the same satellite photograph of the Andes, he
thought that it represented a tectonic plate boundary in which the smaller tectonic plate
was pushed upward to form a mountain range: “Yeah I do believe that one of them, I
believe it was that side ((points)), was smaller than the other and pushed itself up and
created the mountains all the way across.” The same student also believed that the relative
position of a tectonic plate influenced the subduction process at an oceanic-continental
convergent plate boundary:
Researcher Do you think it’s just the size of the tectonic plate that influences
whether it goes above or below?
Mick Also the position it’s in. Because this side might be bigger
((points)) but the other side could just be higher so it just pushed
itself over.
Table 4.3Students’ alternative conceptions about tectonic plate boundaries
Alternative conceptions Frequency (N=21)
When two tectonic plates push together the size, speed, and/or relative position of the plates determines how they interact 12
Tectonic plate boundaries are located at the edge of countries 3When two tectonic plates move apart an empty gap forms between
them 1
Tectonic plate boundaries are located at the equator 1
(3) Students’ conceptions about geological events at tectonic plate boundaries
Students’ conceptions in this category were about the occurrence of geological events at
tectonic plate boundaries: the formation of mountains, the formation of volcanoes and the
cause of earthquakes. Alternative conceptions about landform formation were most
widespread (Table 4.4). The data pertaining to each of these geological events is
presented below.
77
A common idea was that mountains are only formed when the edge of one tectonic plate
is pushed upward. Five students explained that this happened when continental plate
material is at the edge of both tectonic plates, such at the boundary between the Indian
and Eurasian plates where the Himalayas formed. For example:
Nicole The way that mountains are formed are when two plates push
together and eventually they’ll just be pushing and pushing and
pushing until one sort of pops over and then that can sometimes
create a volcano, a mountain, and so forth.
Researcher So how do you think these mountains were formed ((points to
Himalayas))?
Nicole By tectonic plates pushing together and one, sort of… Just
pushing together and one going up.
One student thought that mountains are only formed when the edges of two tectonic plates
are pushed upward: “Well I’m thinking that they [the tectonic plates] have collided
together and both of them have gone up because that’s how mountains are formed”
(Mick). Other incorrect ideas were: mountains are formed when pieces of rock pile up;
mountains are formed by wind erosion; and all mountains are volcanoes.
The most common alternative conception about the formation of volcanoes, held by three
students at interview, was that volcanoes are located in places that have a high
temperature, like at the equator. Two students at interview thought that volcanoes are
formed when two tectonic plates that have continental plate material at their edge are both
pushed upward. Also, 11 students incorrectly understood the cause of earthquakes at
interview, believing that earthquakes occur when two tectonic plates crash together at a
convergent plate boundary.
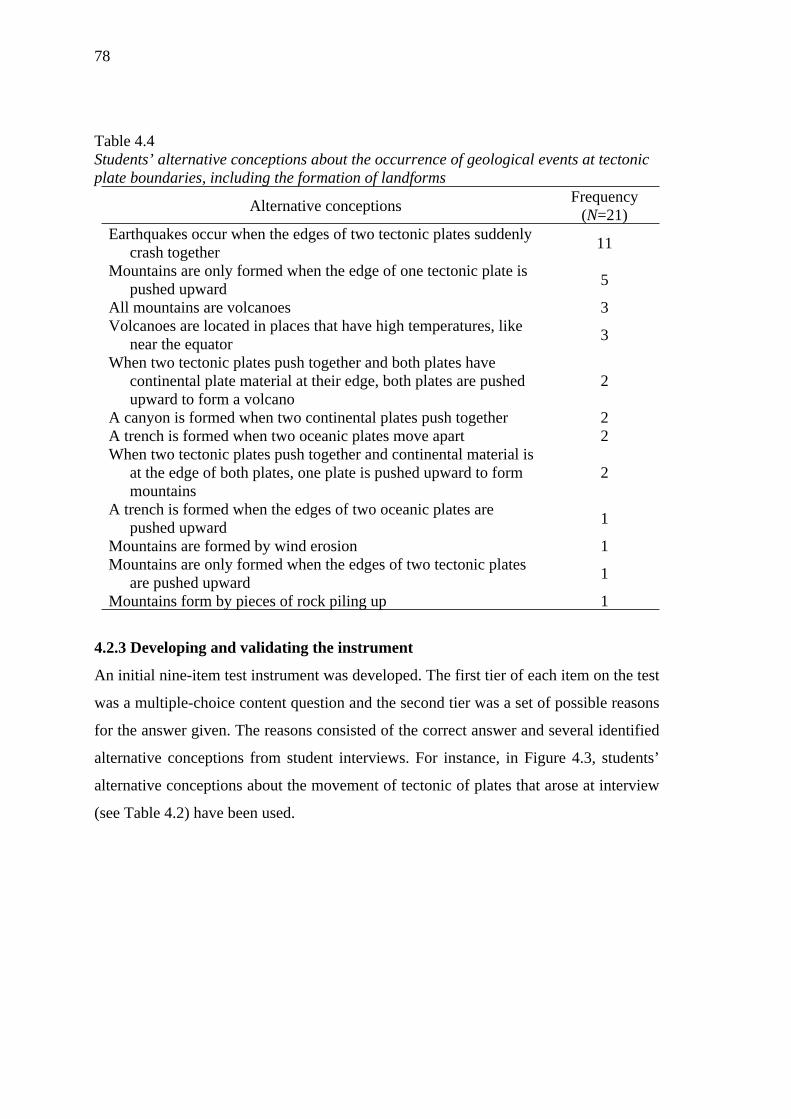
78
Table 4.4Students’ alternative conceptions about the occurrence of geological events at tectonic plate boundaries, including the formation of landforms
Alternative conceptions Frequency (N=21)
Earthquakes occur when the edges of two tectonic plates suddenly crash together 11
Mountains are only formed when the edge of one tectonic plate is pushed upward 5
All mountains are volcanoes 3Volcanoes are located in places that have high temperatures, like
near the equator 3
When two tectonic plates push together and both plates have continental plate material at their edge, both plates are pushed upward to form a volcano
2
A canyon is formed when two continental plates push together 2A trench is formed when two oceanic plates move apart 2When two tectonic plates push together and continental material is
at the edge of both plates, one plate is pushed upward to form mountains
2
A trench is formed when the edges of two oceanic plates are pushed upward 1
Mountains are formed by wind erosion 1Mountains are only formed when the edges of two tectonic plates
are pushed upward 1
Mountains form by pieces of rock piling up 1
4.2.3 Developing and validating the instrument
An initial nine-item test instrument was developed. The first tier of each item on the test
was a multiple-choice content question and the second tier was a set of possible reasons
for the answer given. The reasons consisted of the correct answer and several identified
alternative conceptions from student interviews. For instance, in Figure 4.3, students’
alternative conceptions about the movement of tectonic of plates that arose at interview
(see Table 4.2) have been used.
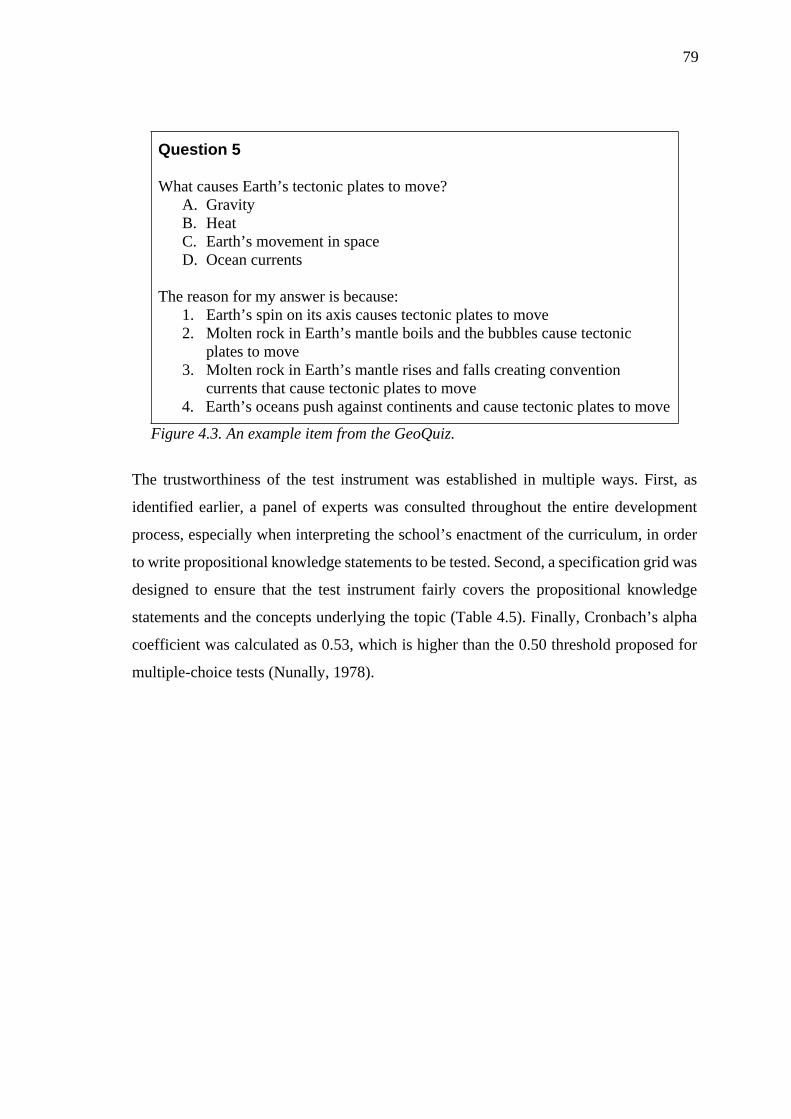
79
Question 5
What causes Earth’s tectonic plates to move?A. GravityB. HeatC. Earth’s movement in spaceD. Ocean currents
The reason for my answer is because:1. Earth’s spin on its axis causes tectonic plates to move2. Molten rock in Earth’s mantle boils and the bubbles cause tectonic
plates to move3. Molten rock in Earth’s mantle rises and falls creating convention
currents that cause tectonic plates to move4. Earth’s oceans push against continents and cause tectonic plates to move
Figure 4.3. An example item from the GeoQuiz.
The trustworthiness of the test instrument was established in multiple ways. First, as
identified earlier, a panel of experts was consulted throughout the entire development
process, especially when interpreting the school’s enactment of the curriculum, in order
to write propositional knowledge statements to be tested. Second, a specification grid was
designed to ensure that the test instrument fairly covers the propositional knowledge
statements and the concepts underlying the topic (Table 4.5). Finally, Cronbach’s alpha
coefficient was calculated as 0.53, which is higher than the 0.50 threshold proposed for
multiple-choice tests (Nunally, 1978).
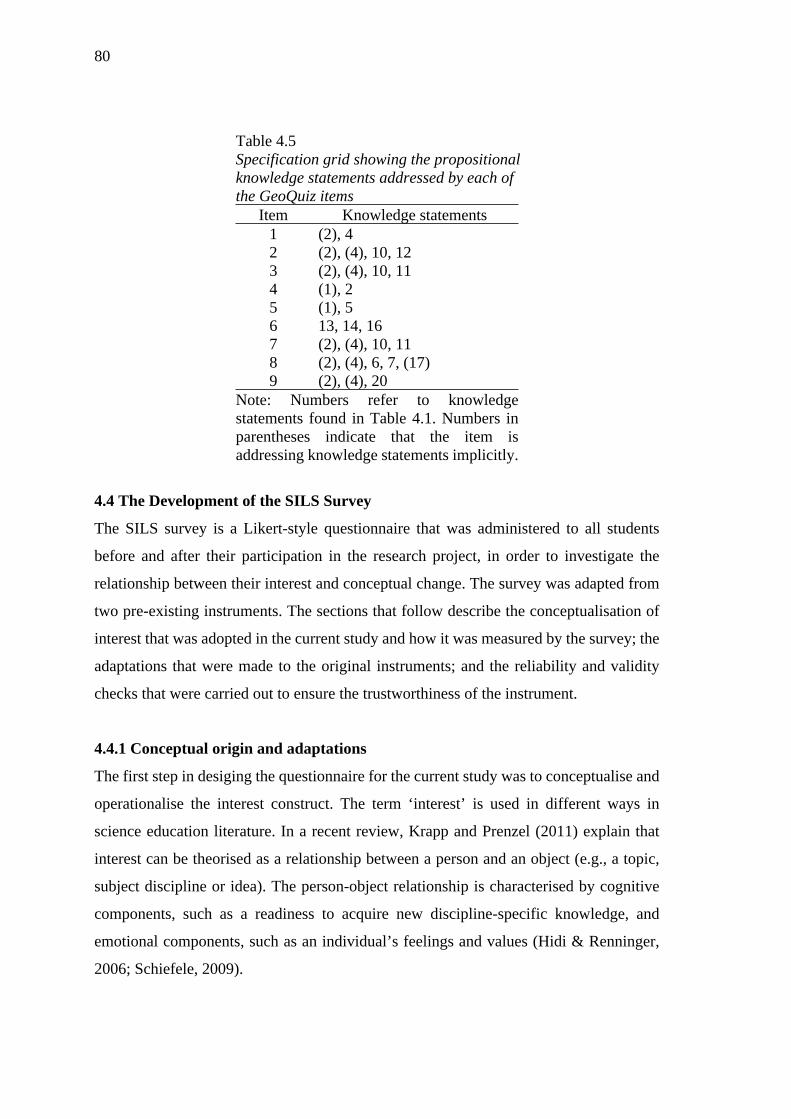
80
Table 4.5Specification grid showing the propositional knowledge statements addressed by each of the GeoQuiz items
Item Knowledge statements1 (2), 42 (2), (4), 10, 123 (2), (4), 10, 114 (1), 25 (1), 56 13, 14, 167 (2), (4), 10, 118 (2), (4), 6, 7, (17)9 (2), (4), 20
Note: Numbers refer to knowledge statements found in Table 4.1. Numbers in parentheses indicate that the item is addressing knowledge statements implicitly.
4.4 The Development of the SILS Survey
The SILS survey is a Likert-style questionnaire that was administered to all students
before and after their participation in the research project, in order to investigate the
relationship between their interest and conceptual change. The survey was adapted from
two pre-existing instruments. The sections that follow describe the conceptualisation of
interest that was adopted in the current study and how it was measured by the survey; the
adaptations that were made to the original instruments; and the reliability and validity
checks that were carried out to ensure the trustworthiness of the instrument.
4.4.1 Conceptual origin and adaptations
The first step in desiging the questionnaire for the current study was to conceptualise and
operationalise the interest construct. The term ‘interest’ is used in different ways in
science education literature. In a recent review, Krapp and Prenzel (2011) explain that
interest can be theorised as a relationship between a person and an object (e.g., a topic,
subject discipline or idea). The person-object relationship is characterised by cognitive
components, such as a readiness to acquire new discipline-specific knowledge, and
emotional components, such as an individual’s feelings and values (Hidi & Renninger,
2006; Schiefele, 2009).
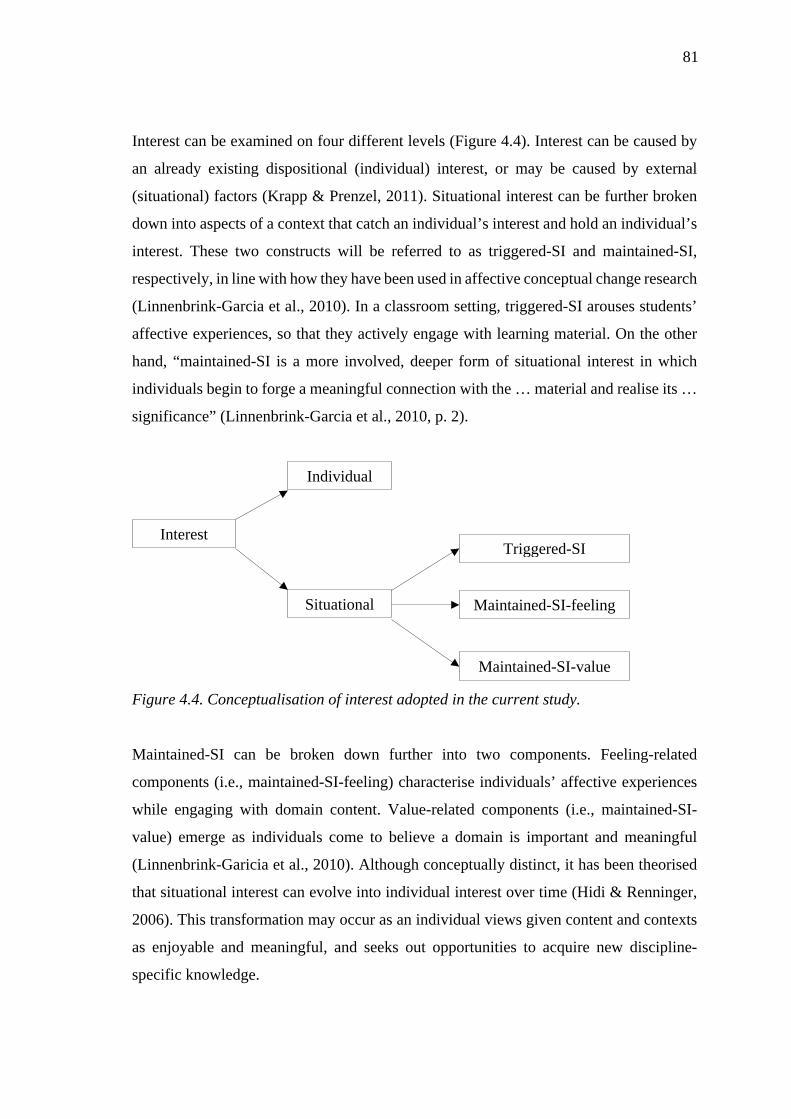
81
Interest can be examined on four different levels (Figure 4.4). Interest can be caused by
an already existing dispositional (individual) interest, or may be caused by external
(situational) factors (Krapp & Prenzel, 2011). Situational interest can be further broken
down into aspects of a context that catch an individual’s interest and hold an individual’s
interest. These two constructs will be referred to as triggered-SI and maintained-SI,
respectively, in line with how they have been used in affective conceptual change research
(Linnenbrink-Garcia et al., 2010). In a classroom setting, triggered-SI arouses students’
affective experiences, so that they actively engage with learning material. On the other
hand, “maintained-SI is a more involved, deeper form of situational interest in which
individuals begin to forge a meaningful connection with the … material and realise its …
significance” (Linnenbrink-Garcia et al., 2010, p. 2).
Interest
Individual
Situational
Triggered-SI
Maintained-SI-feeling
Maintained-SI-value
Figure 4.4. Conceptualisation of interest adopted in the current study.
Maintained-SI can be broken down further into two components. Feeling-related
components (i.e., maintained-SI-feeling) characterise individuals’ affective experiences
while engaging with domain content. Value-related components (i.e., maintained-SI-
value) emerge as individuals come to believe a domain is important and meaningful
(Linnenbrink-Garicia et al., 2010). Although conceptually distinct, it has been theorised
that situational interest can evolve into individual interest over time (Hidi & Renninger,
2006). This transformation may occur as an individual views given content and contexts
as enjoyable and meaningful, and seeks out opportunities to acquire new discipline-
specific knowledge.
82
Enjoyment is an affective variable that has been given considerable attention alongside
interest in the literature, particularly because both have been shown to contribute to
student learning and achievement (Ainley & Hidi, 2014). While interest can be defined
as feeling engrossed with, or abosrbed in, an activity, enjoyment can be defined as feeling
satistifed with, or pleased about, one’s participation in an activity (Ainley & Hidi, 2014;
Izard, 1977). While interest and enjoyment are generally referred to as being
complementary (Ainley & Hidi, 2014), there is no consensus in the literature as to
whether they overlap or are distinct concepts. While some scholars have described the
relationship between interest and enjoyment as intimately related and reciprocal (Ainley
& Hidi, 2014; Izard, 2007, 2009), others assert that these constructs are unique variables
that may occur independently of each other (Fredrickson, 2001; Hidi, 2006). Given the
recommendation that instrumentation designed to measure interest should include an
enjoyment component (Ainley & Hidi, 2014), it was decided that a subscale that measures
students’ enjoyment learning about Earth science would be included in the survey
instrument.
Keeping this conceptualisation of both interest and enjoyment in mind, the SILS survey
was developed. The survey consists of 24 items within five subscales that measures
aspects of students’ individual and situational interest: (1) individual interest in learning
about science; (2) enjoyment learning about Earth science; (3) triggered-SI; (4)
maintained-SI-feeling; and (5) maintained-SI-value (Table 4.6). The SILS survey was
adapted from two existing instruments: the PISA Student Questionnaire (OECD, 2006)
and the Situational Interest Survey (Linnenbrink-Garcia et al., 2010), both of which have
been rigorously validated.
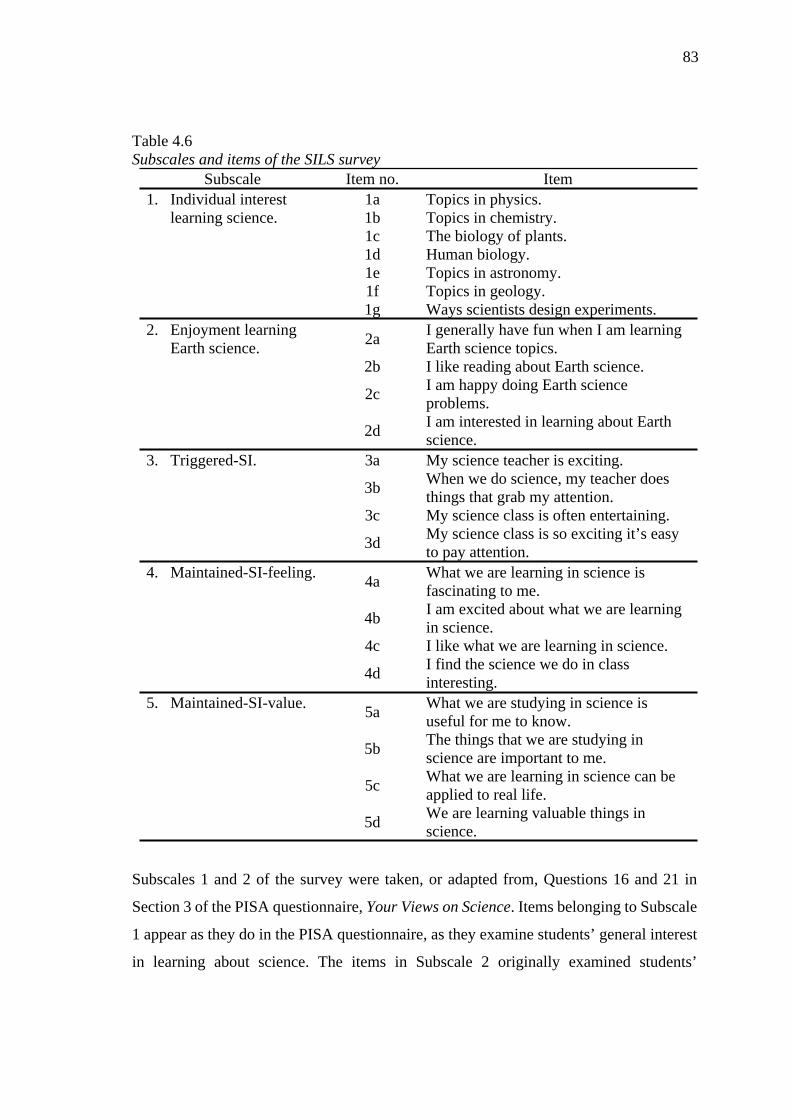
83
Table 4.6Subscales and items of the SILS survey
Subscale Item no. Item1a Topics in physics.1b Topics in chemistry.1c The biology of plants.1d Human biology.1e Topics in astronomy.1f Topics in geology.
1. Individual interest learning science.
1g Ways scientists design experiments.
2a I generally have fun when I am learning Earth science topics.
2b I like reading about Earth science.
2c I am happy doing Earth science problems.
2. Enjoyment learning Earth science.
2d I am interested in learning about Earth science.
3a My science teacher is exciting.
3b When we do science, my teacher does things that grab my attention.
3c My science class is often entertaining.
3. Triggered-SI.
3d My science class is so exciting it’s easy to pay attention.
4a What we are learning in science is fascinating to me.
4b I am excited about what we are learning in science.
4c I like what we are learning in science.
4. Maintained-SI-feeling.
4d I find the science we do in class interesting.
5a What we are studying in science is useful for me to know.
5b The things that we are studying in science are important to me.
5c What we are learning in science can be applied to real life.
5. Maintained-SI-value.
5d We are learning valuable things in science.
Subscales 1 and 2 of the survey were taken, or adapted from, Questions 16 and 21 in
Section 3 of the PISA questionnaire, Your Views on Science. Items belonging to Subscale
1 appear as they do in the PISA questionnaire, as they examine students’ general interest
in learning about science. The items in Subscale 2 originally examined students’
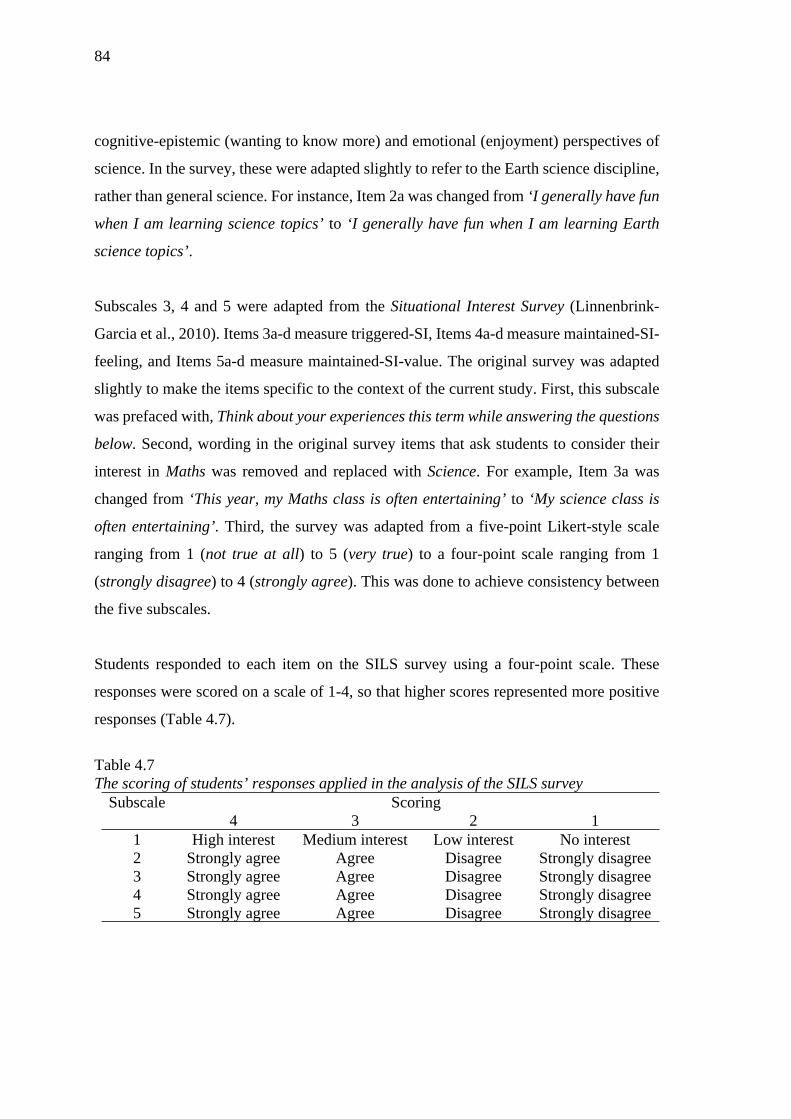
84
cognitive-epistemic (wanting to know more) and emotional (enjoyment) perspectives of
science. In the survey, these were adapted slightly to refer to the Earth science discipline,
rather than general science. For instance, Item 2a was changed from ‘I generally have fun
when I am learning science topics’ to ‘I generally have fun when I am learning Earth
science topics’.
Subscales 3, 4 and 5 were adapted from the Situational Interest Survey (Linnenbrink-
Garcia et al., 2010). Items 3a-d measure triggered-SI, Items 4a-d measure maintained-SI-
feeling, and Items 5a-d measure maintained-SI-value. The original survey was adapted
slightly to make the items specific to the context of the current study. First, this subscale
was prefaced with, Think about your experiences this term while answering the questions
below. Second, wording in the original survey items that ask students to consider their
interest in Maths was removed and replaced with Science. For example, Item 3a was
changed from ‘This year, my Maths class is often entertaining’ to ‘My science class is
often entertaining’. Third, the survey was adapted from a five-point Likert-style scale
ranging from 1 (not true at all) to 5 (very true) to a four-point scale ranging from 1
(strongly disagree) to 4 (strongly agree). This was done to achieve consistency between
the five subscales.
Students responded to each item on the SILS survey using a four-point scale. These
responses were scored on a scale of 1-4, so that higher scores represented more positive
responses (Table 4.7).
Table 4.7The scoring of students’ responses applied in the analysis of the SILS survey
ScoringSubscale4 3 2 1
1 High interest Medium interest Low interest No interest2 Strongly agree Agree Disagree Strongly disagree3 Strongly agree Agree Disagree Strongly disagree4 Strongly agree Agree Disagree Strongly disagree5 Strongly agree Agree Disagree Strongly disagree
85
4.4.2 Instrument reliability and validity
Estimates of reliability are essential to consider when developing an instrument, and can
be achieved via four methods: test-retest, parallel forms, internal consistency and inter-
rater reliability (Hubley & Zumbo, 1996). The most appropriate method depends on the
nature of the instrument. In the current study, establishing the internal consistency of the
survey’s subscales was deemed most appropriate. The other methods were discounted
with reason. Test-retest reliability was not appropriate as it was anticipated that the project
would impact students’ interest in learning science, and therefore a change in students’
responses was expected; the creation of an alternative form of the survey was a time-
consuming and impractical option, and unnecessary considering the survey’s conceptual
original is very closely related to the 2006 PISA Student Questionnaire (OECD, 2006)
and the Situational Interest Survey (Linnenbrink-Garcia et al., 2010); and inter-rater
reliability was not appropriate as the SILS survey is a self-report measure.
The SILS survey was found to be a reliable instrument to measure students’ individual
and situational interest in the current research project. The internal consistency of each of
the subscales at pretest was adequate, as Cronbach’s was >.70 (Hinkin, 1995).
Cronbach’s for the adapted subscales also corresponded favorably with the
international benchmarks established by PISA and Linnenbrink-Garcia et al. (2010), as
shown in Table 4.8.
Any further validation of the SILS survey was deemed unnecessary, as it is an
amalgamation of two already validated instruments and only very minor adaptations were
made (i.e., only one word in each item was changed). In further support of this decision,
Linnenbrink-Garcia et al. (2010) present a full confirmatory factor analysis that identifies
the three-factor structure of the Situational Interest Survey to be robust across different
educational contexts.
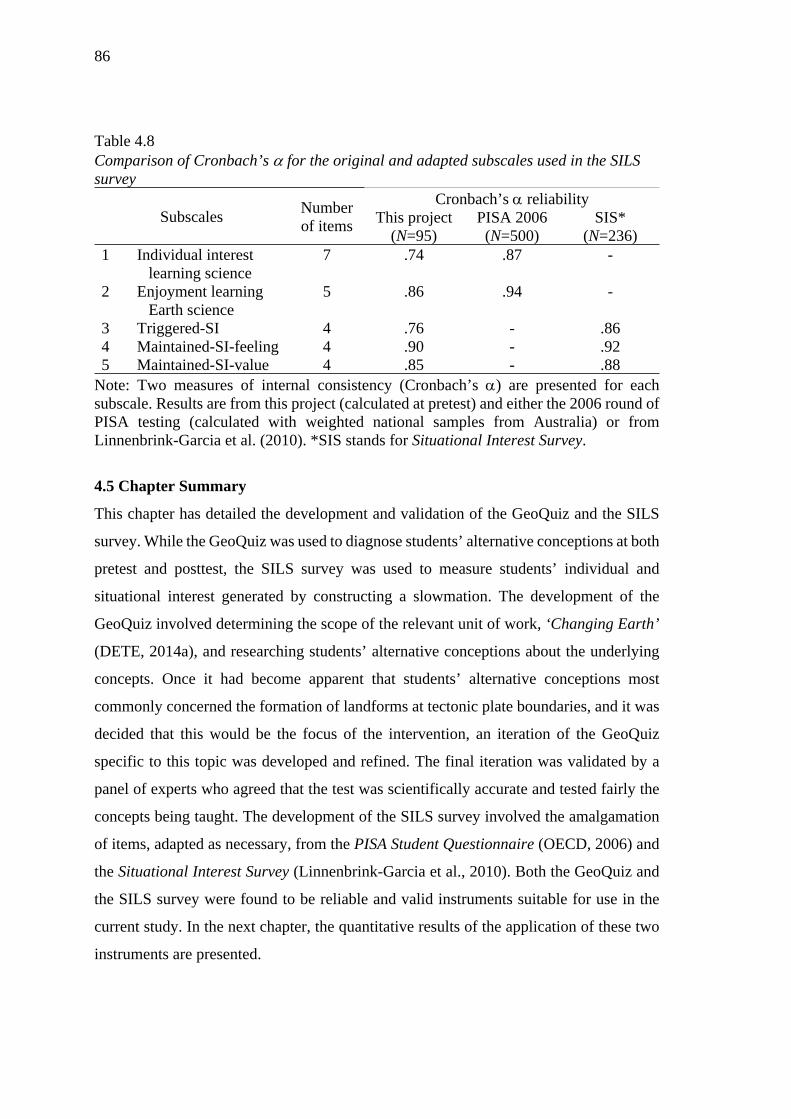
86
Table 4.8Comparison of Cronbach’s for the original and adapted subscales used in the SILS survey
Cronbach’s reliabilitySubscales Number
of items This project (N=95)
PISA 2006 (N=500)
SIS* (N=236)
1 Individual interest learning science
7 .74 .87 -
2 Enjoyment learning Earth science
5 .86 .94 -
3 Triggered-SI 4 .76 - .864 Maintained-SI-feeling 4 .90 - .925 Maintained-SI-value 4 .85 - .88
Note: Two measures of internal consistency (Cronbach’s ) are presented for each subscale. Results are from this project (calculated at pretest) and either the 2006 round of PISA testing (calculated with weighted national samples from Australia) or from Linnenbrink-Garcia et al. (2010). *SIS stands for Situational Interest Survey.
4.5 Chapter Summary
This chapter has detailed the development and validation of the GeoQuiz and the SILS
survey. While the GeoQuiz was used to diagnose students’ alternative conceptions at both
pretest and posttest, the SILS survey was used to measure students’ individual and
situational interest generated by constructing a slowmation. The development of the
GeoQuiz involved determining the scope of the relevant unit of work, ‘Changing Earth’
(DETE, 2014a), and researching students’ alternative conceptions about the underlying
concepts. Once it had become apparent that students’ alternative conceptions most
commonly concerned the formation of landforms at tectonic plate boundaries, and it was
decided that this would be the focus of the intervention, an iteration of the GeoQuiz
specific to this topic was developed and refined. The final iteration was validated by a
panel of experts who agreed that the test was scientifically accurate and tested fairly the
concepts being taught. The development of the SILS survey involved the amalgamation
of items, adapted as necessary, from the PISA Student Questionnaire (OECD, 2006) and
the Situational Interest Survey (Linnenbrink-Garcia et al., 2010). Both the GeoQuiz and
the SILS survey were found to be reliable and valid instruments suitable for use in the
current study. In the next chapter, the quantitative results of the application of these two
instruments are presented.
87
CHAPTER FIVE: QUANTITATIVE RESULTS
5.1 Chapter Introduction
The following chapter presents the quantitative results generated by the application of the
GeoQuiz and the SILS survey. Both instruments were administered to all students before
and after their participation in the project. The results of these analyses were interpreted
to answer the research questions:
(1) Does the process of creating a slowmation representation have a significant
effect on students’ conceptual change?
(2) Is students’ interest, generated by the construction of a slowmation, a
significant predictor of conceptual change?
The results of the GeoQuiz are analysed in Section 5.2 and the results of the SILS survey
are analysed in Section 5.3. These sections are organised around several sub-questions
that were used to interrogate the data. Finally, Section 5.4 provides a summary of the
combined analyses.
5.2 GeoQuiz Results
A two-tiered multiple-choice test was employed to determine the effect of creating a
slowmation representation on students’ conceptual change. The GeoQuiz was
administered to four classes of Year 9 students (N=95) before and after their participation
in the research project. While two intervention classes participated in the construction of
a slowmation (N=52), two comparison classes experienced teaching as usual (N=43). In
order to answer the first research question, a series of sub-questions were developed: (1)
How did students’ conceptions change from pretest to posttest? (2) Was there a significant
change in students’ overall GeoQuiz scores from pretest to posttest? and (3) Was there a
significant change in students’ GeoQuiz scores for individual items from pretest to
posttest? Both item and statistical analyses were performed to investigate these questions,
and the results are presented below.
88
5.2.1 How did students’ conceptions change from pretest to posttest?
Any change in students’ conceptions from pretest to posttest was initially analysed using
descriptive statistics; specifically, the frequency of students with scientific and alternative
conceptions at both pretest and posttest was compared within and between both the
intervention and comparison conditions. To ease these item analyses, the data were split
into questions that concern the nature and movement of tectonic plates (Items 1, 4, 5, and
6) and questions that concern the geological processes that operate at tectonic plate
boundaries, including the formation of landforms (Items 2, 3, 7, 8 and 9). Tables 5.1 and
5.2 show the frequencies of students in both the intervention and comparison groups who
had scientific and alternative conceptions at pretest and posttest. In line with how other
researchers have analysed the results of two-tiered multiple-choice test instruments (as
outlined in Chapter 3), responses were considered to be an alternative conception if they
were held by more than 10 per cent of students.
A detailed review of this analysis is presented in Sections 5.2.1.1 and 5.2.1.2. Overall,
the results indicate that prior to participating in the research project, a moderate
proportion of students in both the intervention and comparison groups had alternative
conceptions about plate tectonics. Students’ alternative conceptions most commonly
concerned the occurrence of geologic events and the formation of landforms at tectonic
plate boundaries. Both condition groups (intervention and comparison) generally
demonstrated an increase in the number of students with scientific conceptions and a
decrease in the number of students with alternative conceptions, from pretest to posttest.
Question 3 and Question 8 were exceptions; the number of students in both the
intervention and comparison groups with scientific conceptions decreased from pretest to
posttest.
5.2.1.1 Students’ conceptions about the nature and movement of tectonic plates
Item 1 required students to identify a tectonic plate boundary on a map (Table 5.1). At
pretest, the majority of students selected the correct reason choice by indicating that
tectonic plate boundaries occur where two tectonic plates meet. Sixty-four per cent of
students in the intervention group and 33 per cent of students in the comparison group
89
had this belief. Some students, however, believed that tectonic plate boundaries align with
the edges of the continents. Nineteen per cent of students in the intervention group and
28 per cent of students in the comparison group held this belief. Twenty-six per cent of
students in the comparison group believed that tectonic plate boundaries are found at the
equator. After instruction, at posttest, more students had a scientific understanding and
fewer students had alternative conceptions. The proportion of students who selected the
correct reason choice increased to 75 per cent in the intervention group and 63 per cent
in the comparison group; an increase of 11 per cent and 30 per cent for the intervention
and comparison groups, respectively (Table 5.2). While the number of students in the
intervention group who thought that tectonic plate boundaries are located along the edges
of continents remained the same (19 per cent), the number of students in the comparison
group with this belief decreased to 19 per cent. The number of students who believed that
tectonic plate boundaries are found at the equator decreased to nine per cent.
Item 4 examined students’ understanding of the nature of tectonic plates (Table 5.1). Prior
to their participation in the research project, most students correctly indicated that the
outer layer of Earth, including the continents and the ocean floor, consists of tectonic
plates. Sixty per cent of students in the intervention group and 51 per cent of students in
the comparison group held this belief. A considerable proportion, however, believed that
tectonic plates are located deep within the Earth and are not exposed at the surface. Thirty-
nine per cent of students in the intervention group and 42 per cent of students in the
comparison group held this belief. Having participated in one of the conditions –
intervention or comparison – equal or more students had a scientific conception and fewer
students had an alternative conception. Sixty per cent of students in the intervention group
and 67 per cent of students in the comparison group had a scientific conception, and 33
per cent of students in both the intervention and comparison groups retained an alternative
conception. Therefore, the number of students that had a scientific conception after
constructing a slowmation remained the same from pretest to posttest, whereas the
number of students that held a scientific conception after experiencing teaching as usual
increased by 16 per cent (Table 5.2). A moderate proportion of students retained their
alternative conception about the location of tectonic plates within Earth’s internal
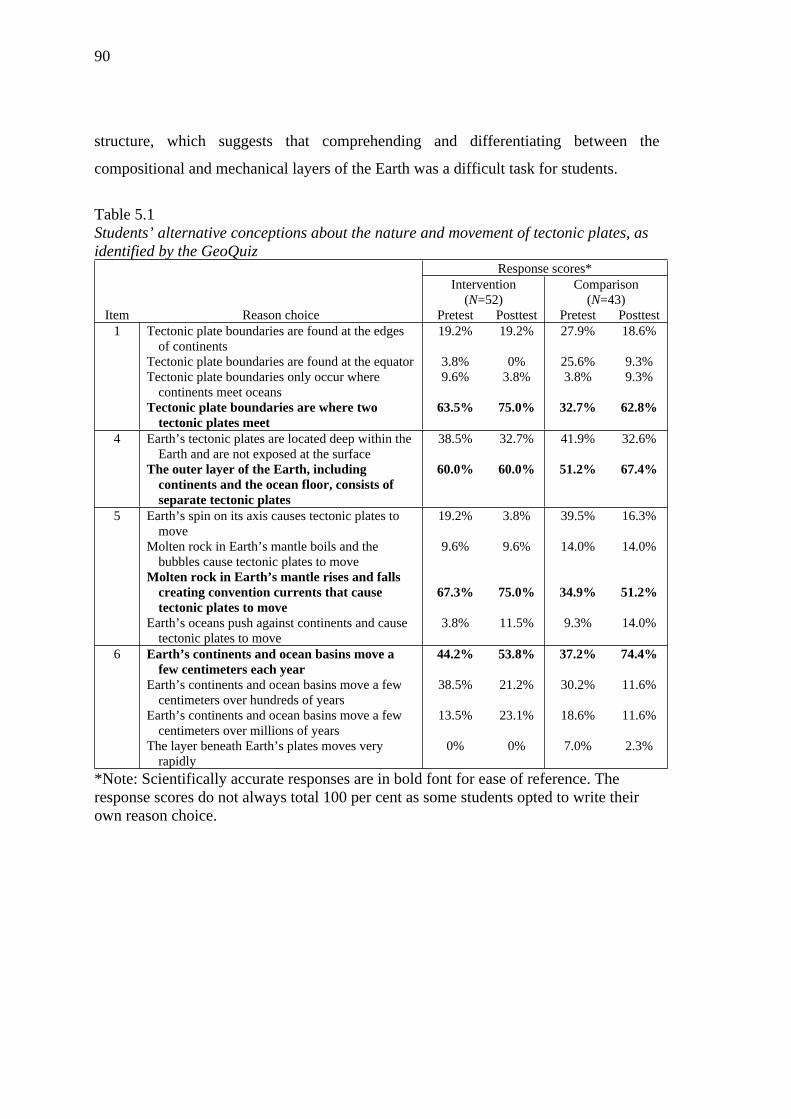
90
structure, which suggests that comprehending and differentiating between the
compositional and mechanical layers of the Earth was a difficult task for students.
Table 5.1Students’ alternative conceptions about the nature and movement of tectonic plates, as identified by the GeoQuiz
Response scores*Intervention
(N=52)Comparison
(N=43)Item Reason choice Pretest Posttest Pretest Posttest
1 Tectonic plate boundaries are found at the edges of continents
19.2% 19.2% 27.9% 18.6%
Tectonic plate boundaries are found at the equator 3.8% 0% 25.6% 9.3%Tectonic plate boundaries only occur where
continents meet oceans9.6% 3.8% 3.8% 9.3%
Tectonic plate boundaries are where two tectonic plates meet
63.5% 75.0% 32.7% 62.8%
4 Earth’s tectonic plates are located deep within the Earth and are not exposed at the surface
38.5% 32.7% 41.9% 32.6%
The outer layer of the Earth, including continents and the ocean floor, consists of separate tectonic plates
60.0% 60.0% 51.2% 67.4%
5 Earth’s spin on its axis causes tectonic plates to move
19.2% 3.8% 39.5% 16.3%
Molten rock in Earth’s mantle boils and the bubbles cause tectonic plates to move
9.6% 9.6% 14.0% 14.0%
Molten rock in Earth’s mantle rises and falls creating convention currents that cause tectonic plates to move
67.3% 75.0% 34.9% 51.2%
Earth’s oceans push against continents and cause tectonic plates to move
3.8% 11.5% 9.3% 14.0%
6 Earth’s continents and ocean basins move a few centimeters each year
44.2% 53.8% 37.2% 74.4%
Earth’s continents and ocean basins move a few centimeters over hundreds of years
38.5% 21.2% 30.2% 11.6%
Earth’s continents and ocean basins move a few centimeters over millions of years
13.5% 23.1% 18.6% 11.6%
The layer beneath Earth’s plates moves very rapidly
0% 0% 7.0% 2.3%
*Note: Scientifically accurate responses are in bold font for ease of reference. The response scores do not always total 100 per cent as some students opted to write their own reason choice.
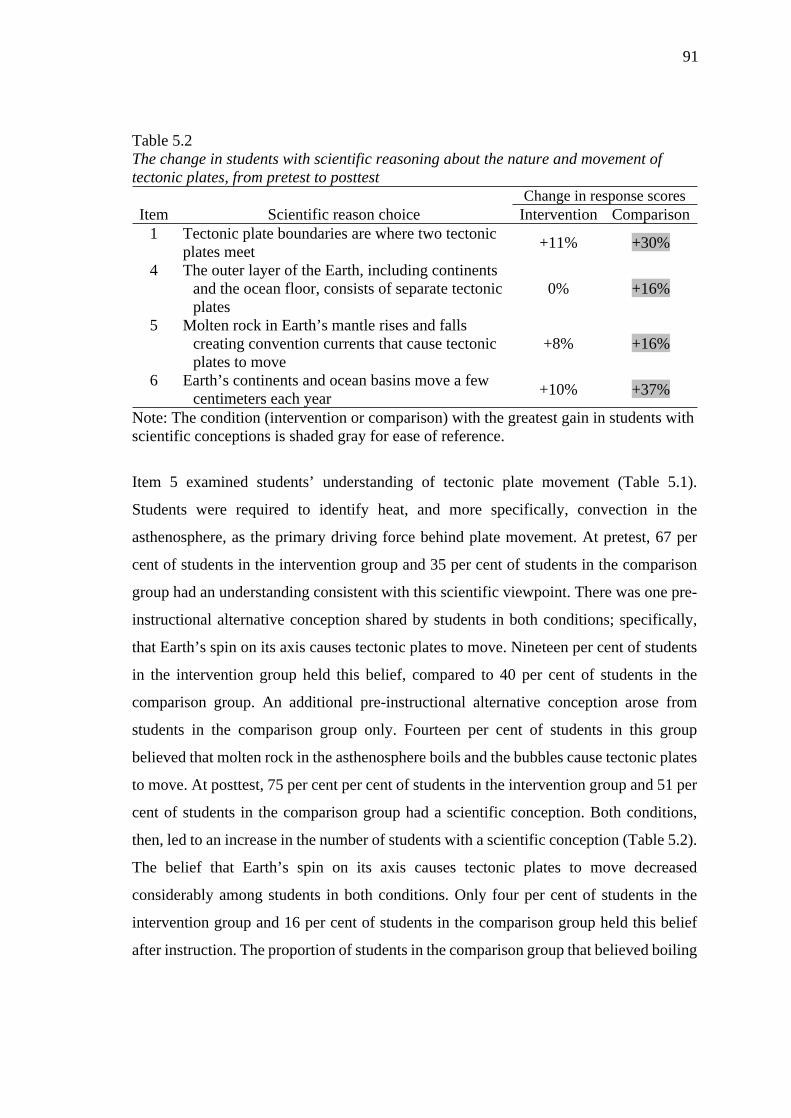
91
Table 5.2The change in students with scientific reasoning about the nature and movement of tectonic plates, from pretest to posttest
Change in response scoresItem Scientific reason choice Intervention Comparison
1 Tectonic plate boundaries are where two tectonic plates meet +11% +30%
4 The outer layer of the Earth, including continents and the ocean floor, consists of separate tectonic plates
0% +16%
5 Molten rock in Earth’s mantle rises and falls creating convention currents that cause tectonic plates to move
+8% +16%
6 Earth’s continents and ocean basins move a few centimeters each year +10% +37%
Note: The condition (intervention or comparison) with the greatest gain in students with scientific conceptions is shaded gray for ease of reference.
Item 5 examined students’ understanding of tectonic plate movement (Table 5.1).
Students were required to identify heat, and more specifically, convection in the
asthenosphere, as the primary driving force behind plate movement. At pretest, 67 per
cent of students in the intervention group and 35 per cent of students in the comparison
group had an understanding consistent with this scientific viewpoint. There was one pre-
instructional alternative conception shared by students in both conditions; specifically,
that Earth’s spin on its axis causes tectonic plates to move. Nineteen per cent of students
in the intervention group held this belief, compared to 40 per cent of students in the
comparison group. An additional pre-instructional alternative conception arose from
students in the comparison group only. Fourteen per cent of students in this group
believed that molten rock in the asthenosphere boils and the bubbles cause tectonic plates
to move. At posttest, 75 per cent per cent of students in the intervention group and 51 per
cent of students in the comparison group had a scientific conception. Both conditions,
then, led to an increase in the number of students with a scientific conception (Table 5.2).
The belief that Earth’s spin on its axis causes tectonic plates to move decreased
considerably among students in both conditions. Only four per cent of students in the
intervention group and 16 per cent of students in the comparison group held this belief
after instruction. The proportion of students in the comparison group that believed boiling
92
molten rock causes plate movement remained unchanged. Notably, after their
participation in the project, more students in both the intervention and comparison
conditions thought that Earth’s oceans push against continents and cause tectonic plates
to move. The number of students in the intervention group with this belief increased from
four per cent at pretest to 12 per cent at posttest, and the number of students in the
comparison group with this belief increased from nine per cent at pretest to 14 per cent at
posttest.
Item 6 elicited students’ conceptions about the movement of tectonic plates over time
(Table 5.1). Prior to any formal instruction, many students knew that Earth’s continents
and ocean basins move a few centimeters each year. Forty-four per cent of students in the
intervention group and 37 per cent of students in the comparison group held this belief.
Nevertheless, most students had an alternative conception about plate movement. Fifty-
two per cent of students in the treatment group and 49 per cent of students in the
comparison group thought that tectonic plates move a few centimeters over either
hundreds or millions of years. After instruction, 54 per cent of students in the intervention
group and 74 per cent of students in the comparison group selected the correct reason
choice; an increase of 10 per cent and 37 per cent for the intervention and comparison
groups, respectively (Table 5.2). The proportion of students who had an alternative
conception at posttest decreased. Forty-four per cent of students in the intervention group
and 23 per cent of students in the comparison group retained their belief that Earth’s
tectonic plates move a few centimeters over either hundreds or millions of years.
5.2.1.2 Students’ conceptions about the geological processes that occur at tectonic
plate boundaries, including the formation of landforms
Students’ pre-instructional alternative conceptions about the formation of landforms at
tectonic plate boundaries were particularly widespread. Item 2 required students to
identify on a map a tectonic plate boundary where a volcano was likely to occur (Table
5.3). Most students recognised that a volcano forms at a tectonic plate boundary when
two plates push together. At pretest, only 19 per cent of students in both the intervention
and comparison groups knew that when an oceanic tectonic plate and a continental
93
tectonic plate push together, the oceanic plate material is pushed downward and melts to
form a volcano. The remaining students thought that when two continental tectonic plates
push together, both plates are pushed upward to form volcanoes. Fifty-four per cent of
students in the intervention group and 65 per cent of students in the comparison group
held this belief. Some students also thought that volcanoes are exclusively located in
places that have high temperatures, like at the equator. Fourteen per cent of students in
both the intervention and comparison groups held this belief. At posttest, there was an
increase in students with a scientific conception, especially for students in the intervention
group (Table 5.4). Forty per cent could identify an oceanic-continental convergent plate
boundary on a map and understand that the subduction of oceanic lithosphere causes
volcanoes. In contrast, 28 per cent of students in the comparison group were capable of
this. There was generally a decrease in the number of students with alternative
conceptions across both the intervention and comparison groups.
Item 3 concerned the formation of mountains at tectonic plate boundaries (Table 5.3).
Again, at pretest, most students recognised that a mountain forms when two tectonic
plates push together. Thirty-nine per cent of students in the intervention group and 26 per
cent of students in the comparison group had correct scientific reasoning at pretest. A
considerable proportion of students, however, believed that the formation of mountains
occurs exclusively at continental-continental convergent plate boundaries, where the
edges of both tectonic plates are pushed upward. These students did not recognise that
mountains also form at oceanic-continental convergent plate boundaries, where oceanic
lithosphere is subducted. Forty-eight per cent of students in the intervention group and 47
per cent of students in the comparison group had this pre-instructional alternative
conception. Some students believed the opposite to be true, that mountains form
exclusively at an oceanic-continental convergent plate boundary. Twelve per cent of
students in the intervention group and 23 per cent of students in the comparison group
held this belief.
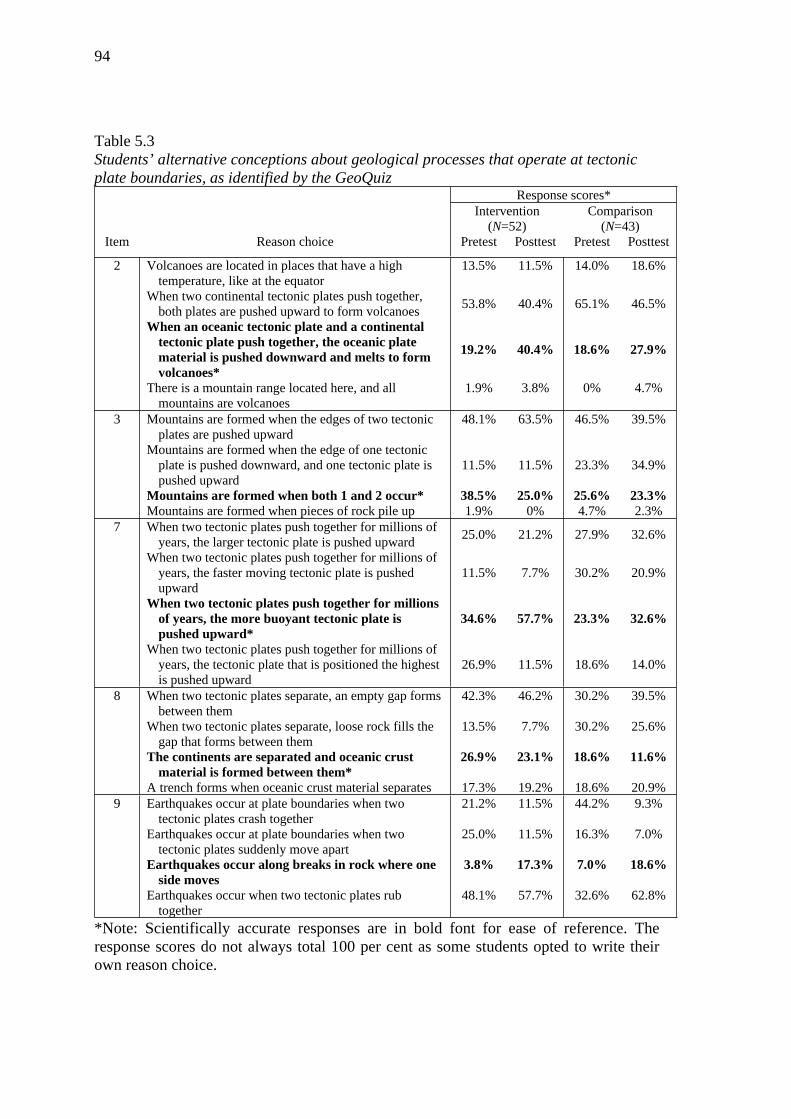
94
Table 5.3Students’ alternative conceptions about geological processes that operate at tectonic plate boundaries, as identified by the GeoQuiz
Response scores*Intervention
(N=52)Comparison
(N=43)Item Reason choice Pretest Posttest Pretest Posttest
2 Volcanoes are located in places that have a high temperature, like at the equator
13.5% 11.5% 14.0% 18.6%
When two continental tectonic plates push together, both plates are pushed upward to form volcanoes 53.8% 40.4% 65.1% 46.5%
When an oceanic tectonic plate and a continental tectonic plate push together, the oceanic plate material is pushed downward and melts to form volcanoes*
19.2% 40.4% 18.6% 27.9%
There is a mountain range located here, and all mountains are volcanoes
1.9% 3.8% 0% 4.7%
3 Mountains are formed when the edges of two tectonic plates are pushed upward
48.1% 63.5% 46.5% 39.5%
Mountains are formed when the edge of one tectonic plate is pushed downward, and one tectonic plate is pushed upward
11.5% 11.5% 23.3% 34.9%
Mountains are formed when both 1 and 2 occur* 38.5% 25.0% 25.6% 23.3%Mountains are formed when pieces of rock pile up 1.9% 0% 4.7% 2.3%
7 When two tectonic plates push together for millions of years, the larger tectonic plate is pushed upward 25.0% 21.2% 27.9% 32.6%
When two tectonic plates push together for millions of years, the faster moving tectonic plate is pushed upward
11.5% 7.7% 30.2% 20.9%
When two tectonic plates push together for millions of years, the more buoyant tectonic plate is pushed upward*
34.6% 57.7% 23.3% 32.6%
When two tectonic plates push together for millions of years, the tectonic plate that is positioned the highest is pushed upward
26.9% 11.5% 18.6% 14.0%
8 When two tectonic plates separate, an empty gap forms between them
42.3% 46.2% 30.2% 39.5%
When two tectonic plates separate, loose rock fills the gap that forms between them
13.5% 7.7% 30.2% 25.6%
The continents are separated and oceanic crust material is formed between them*
26.9% 23.1% 18.6% 11.6%
A trench forms when oceanic crust material separates 17.3% 19.2% 18.6% 20.9%9 Earthquakes occur at plate boundaries when two
tectonic plates crash together21.2% 11.5% 44.2% 9.3%
Earthquakes occur at plate boundaries when two tectonic plates suddenly move apart
25.0% 11.5% 16.3% 7.0%
Earthquakes occur along breaks in rock where one side moves
3.8% 17.3% 7.0% 18.6%
Earthquakes occur when two tectonic plates rub together
48.1% 57.7% 32.6% 62.8%
*Note: Scientifically accurate responses are in bold font for ease of reference. The response scores do not always total 100 per cent as some students opted to write their own reason choice.
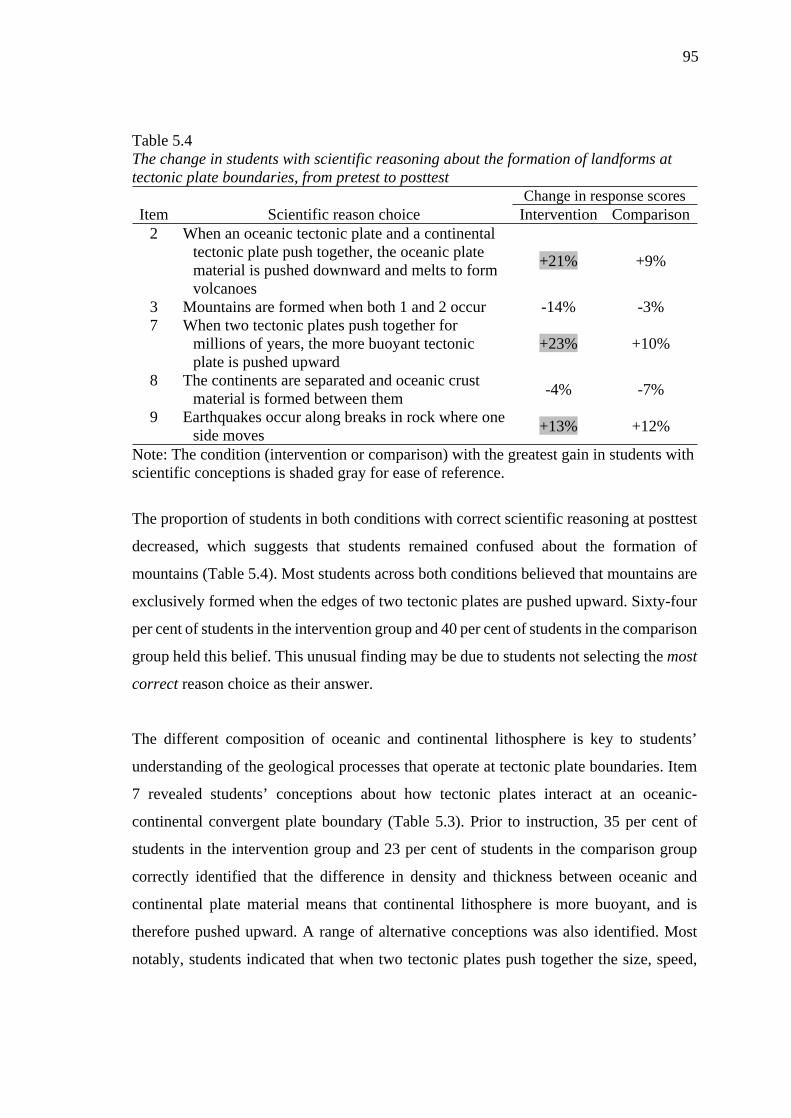
95
Table 5.4The change in students with scientific reasoning about the formation of landforms at tectonic plate boundaries, from pretest to posttest
Change in response scoresItem Scientific reason choice Intervention Comparison
2 When an oceanic tectonic plate and a continental tectonic plate push together, the oceanic plate material is pushed downward and melts to form volcanoes
+21% +9%
3 Mountains are formed when both 1 and 2 occur -14% -3%7 When two tectonic plates push together for
millions of years, the more buoyant tectonic plate is pushed upward
+23% +10%
8 The continents are separated and oceanic crust material is formed between them -4% -7%
9 Earthquakes occur along breaks in rock where one side moves +13% +12%
Note: The condition (intervention or comparison) with the greatest gain in students with scientific conceptions is shaded gray for ease of reference.
The proportion of students in both conditions with correct scientific reasoning at posttest
decreased, which suggests that students remained confused about the formation of
mountains (Table 5.4). Most students across both conditions believed that mountains are
exclusively formed when the edges of two tectonic plates are pushed upward. Sixty-four
per cent of students in the intervention group and 40 per cent of students in the comparison
group held this belief. This unusual finding may be due to students not selecting the most
correct reason choice as their answer.
The different composition of oceanic and continental lithosphere is key to students’
understanding of the geological processes that operate at tectonic plate boundaries. Item
7 revealed students’ conceptions about how tectonic plates interact at an oceanic-
continental convergent plate boundary (Table 5.3). Prior to instruction, 35 per cent of
students in the intervention group and 23 per cent of students in the comparison group
correctly identified that the difference in density and thickness between oceanic and
continental plate material means that continental lithosphere is more buoyant, and is
therefore pushed upward. A range of alternative conceptions was also identified. Most
notably, students indicated that when two tectonic plates push together the size, speed,
96
and/or relative position of the plates determines how they interact. Sixty-three per cent of
students in the intervention group and 77 per cent of students in the comparison group
had one of these incorrect beliefs. After participating in their respective instruction, 58
per cent per cent of students in the intervention group and 33 per cent of students in the
comparison group correctly chose a scientifically accurate reason choice; an increase of
23 per cent and 10 per cent for the intervention and comparison groups, respectively
(Table 5.4). The proportion of students with alternative conceptions decreased.
Item 8 examined students’ ideas about divergent plate boundaries, and more specifically,
that sea-floor spreading that occurs at a mid-ocean ridge (Table 5.3). At pretest, a
moderate proportion of students correctly identified that new oceanic crust forms at a
mid-ocean ridge. Twenty-seven per cent of students in the intervention group and 19 per
cent of students in the comparison group had this belief. Students also had pre-
instructional alternative conceptions. The most prevalent alternative conception was that
a gap remains when tectonic plates move apart. Forty-two per cent of students in the
intervention group and 30 per cent of students in the comparison group held this belief.
The other alternative conceptions that were identified are that loose rock fills the gap that
forms between two tectonic plates when they separate, and a trench forms when two
tectonic plates separate. It appears that students found the notion of sea-floor spreading
difficult to comprehend, as the number of students with a scientific conception at posttest
decreased to 23 per cent in the intervention group and 12 per cent in the comparison
group. The proportion of students with alternative conceptions increased. Students’
difficulty understanding the geological processes that operate at a divergent plate
boundary, and representing these processes using three-dimensional models, is given
further consideration in the next chapter.
Few students demonstrated a scientific understanding about how earthquakes occur in
response to Item 9 (Table 5.3). This was true at both pretest and posttest. Before
instruction, only four per cent of students in the intervention group and seven per cent of
students in the comparison group knew that earthquakes occur along breaks in a rock,
where one side moves relative to the other side. This only marginally increased post-
97
instruction. Seventeen per cent of students in the intervention group and 19 per cent of
students in the comparison group selected the correct reason choice. The most popular
response for this item was that earthquakes occur when two tectonic plates rub together.
Forty-eight per cent of students in the intervention group and 33 per cent of students in
the comparison group held this belief at pretest. The proportion of students with this belief
increased at posttest to 58 per cent of students in the intervention group and 62 per cent
of students in the comparison group. A moderate proportion of students in both groups
also believed that earthquakes occur when tectonic plates crash together or suddenly
move apart, however fewer students believed this at posttest.
5.2.2 Was there a significant change in students’ overall GeoQuiz scores from
pretest to posttest?
To investigate whether the process of creating a slowmation representation had a
significant effect on students’ conceptual change, quantitative analyses of the pretest and
posttest GeoQuiz data were performed. A repeated measures analysis of variance
(ANOVA) revealed a significant within-subjects effect for time, Wilks’s = 0.61, F(1,
93) = 59.96, p < .001, partial 2 = 0.39, which indicates that students’ mean test scores
changed from pretest to posttest. A significant between-subjects effect was observed for
condition, F(1, 93) = 13.89, p < .001, partial 2 = 0.13, as the treatment and comparison
groups had significantly different mean test scores at both pretest and posttest. The critical
time*condition interaction was non-significant, however, which indicates that both the
intervention and comparison groups’ mean test scores changed comparably from pretest
to posttest.
Follow-up t-tests were conducted to investigate the significant time and condition main
effects. Paired-samples t-tests revealed a significant improvement in the mean test scores
of both groups from pretest to posttest (Table 5.5). Large effect sizes, as measured by
Cohen’s d, were observed in each case, which is unusual for research in educational
settings (Tabachnick & Fidell, 2007). Independent-samples t-tests showed that the
intervention group’s test scores were significantly greater than the comparison group’s
scores at pretest, t(93) = 3.64, p = < .001, and posttest, t(93) = 3.08, p < .01.
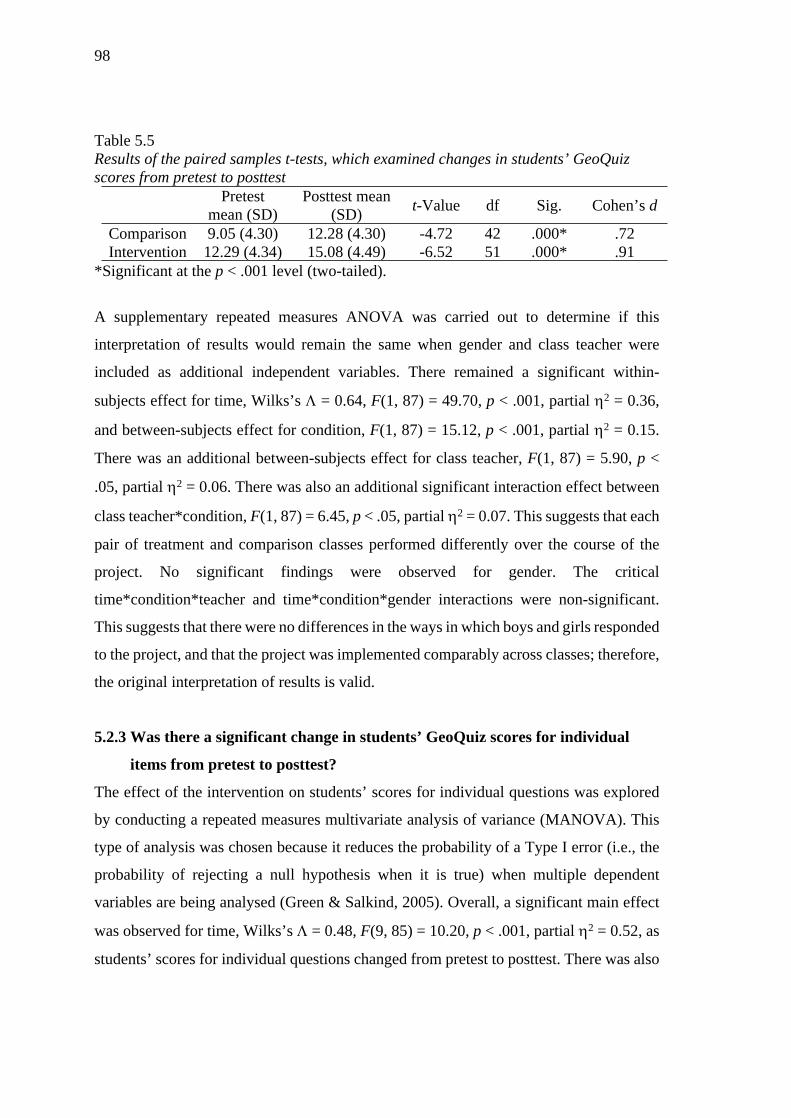
98
Table 5.5Results of the paired samples t-tests, which examined changes in students’ GeoQuiz scores from pretest to posttest
Pretest mean (SD)
Posttest mean (SD) t-Value df Sig. Cohen’s d
Comparison 9.05 (4.30) 12.28 (4.30) -4.72 42 .000* .72Intervention 12.29 (4.34) 15.08 (4.49) -6.52 51 .000* .91
*Significant at the p < .001 level (two-tailed).
A supplementary repeated measures ANOVA was carried out to determine if this
interpretation of results would remain the same when gender and class teacher were
included as additional independent variables. There remained a significant within-
subjects effect for time, Wilks’s = 0.64, F(1, 87) = 49.70, p < .001, partial 2 = 0.36,
and between-subjects effect for condition, F(1, 87) = 15.12, p < .001, partial 2 = 0.15.
There was an additional between-subjects effect for class teacher, F(1, 87) = 5.90, p <
.05, partial 2 = 0.06. There was also an additional significant interaction effect between
class teacher*condition, F(1, 87) = 6.45, p < .05, partial 2 = 0.07. This suggests that each
pair of treatment and comparison classes performed differently over the course of the
project. No significant findings were observed for gender. The critical
time*condition*teacher and time*condition*gender interactions were non-significant.
This suggests that there were no differences in the ways in which boys and girls responded
to the project, and that the project was implemented comparably across classes; therefore,
the original interpretation of results is valid.
5.2.3 Was there a significant change in students’ GeoQuiz scores for individual
items from pretest to posttest?
The effect of the intervention on students’ scores for individual questions was explored
by conducting a repeated measures multivariate analysis of variance (MANOVA). This
type of analysis was chosen because it reduces the probability of a Type I error (i.e., the
probability of rejecting a null hypothesis when it is true) when multiple dependent
variables are being analysed (Green & Salkind, 2005). Overall, a significant main effect
was observed for time, Wilks’s = 0.48, F(9, 85) = 10.20, p < .001, partial 2 = 0.52, as
students’ scores for individual questions changed from pretest to posttest. There was also
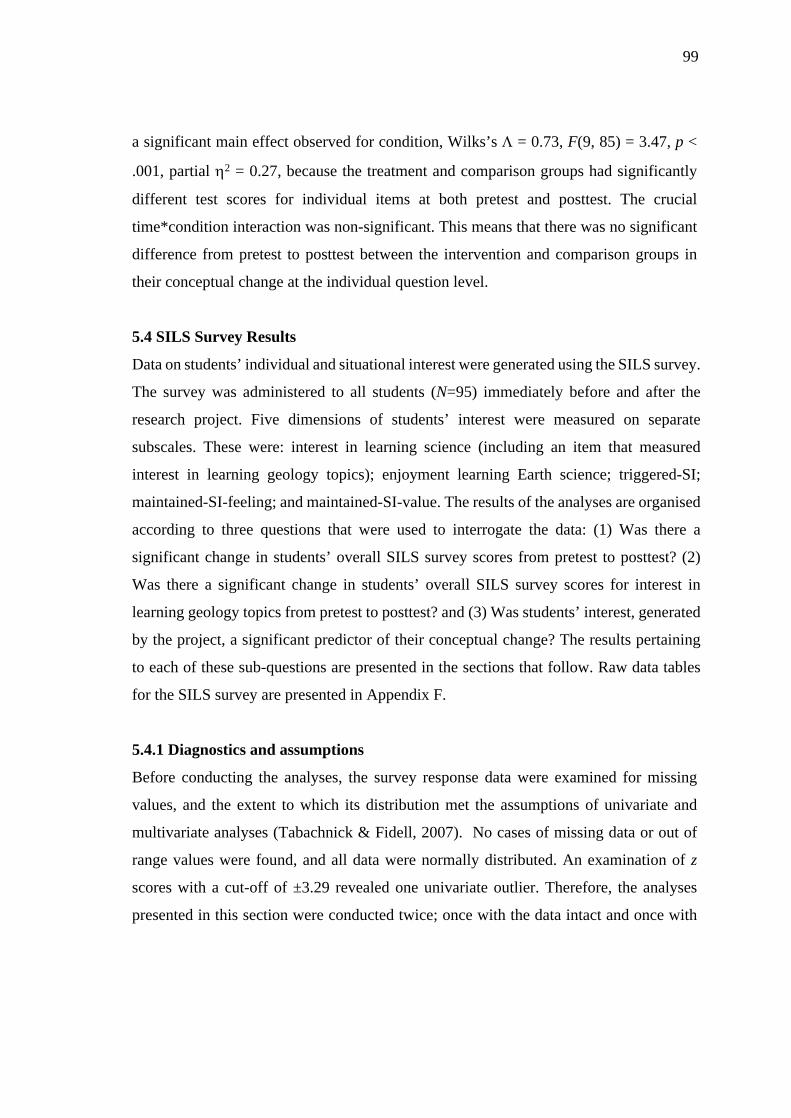
99
a significant main effect observed for condition, Wilks’s = 0.73, F(9, 85) = 3.47, p <
.001, partial 2 = 0.27, because the treatment and comparison groups had significantly
different test scores for individual items at both pretest and posttest. The crucial
time*condition interaction was non-significant. This means that there was no significant
difference from pretest to posttest between the intervention and comparison groups in
their conceptual change at the individual question level.
5.4 SILS Survey Results
Data on students’ individual and situational interest were generated using the SILS survey.
The survey was administered to all students (N=95) immediately before and after the
research project. Five dimensions of students’ interest were measured on separate
subscales. These were: interest in learning science (including an item that measured
interest in learning geology topics); enjoyment learning Earth science; triggered-SI;
maintained-SI-feeling; and maintained-SI-value. The results of the analyses are organised
according to three questions that were used to interrogate the data: (1) Was there a
significant change in students’ overall SILS survey scores from pretest to posttest? (2)
Was there a significant change in students’ overall SILS survey scores for interest in
learning geology topics from pretest to posttest? and (3) Was students’ interest, generated
by the project, a significant predictor of their conceptual change? The results pertaining
to each of these sub-questions are presented in the sections that follow. Raw data tables
for the SILS survey are presented in Appendix F.
5.4.1 Diagnostics and assumptions
Before conducting the analyses, the survey response data were examined for missing
values, and the extent to which its distribution met the assumptions of univariate and
multivariate analyses (Tabachnick & Fidell, 2007). No cases of missing data or out of
range values were found, and all data were normally distributed. An examination of z
scores with a cut-off of ±3.29 revealed one univariate outlier. Therefore, the analyses
presented in this section were conducted twice; once with the data intact and once with
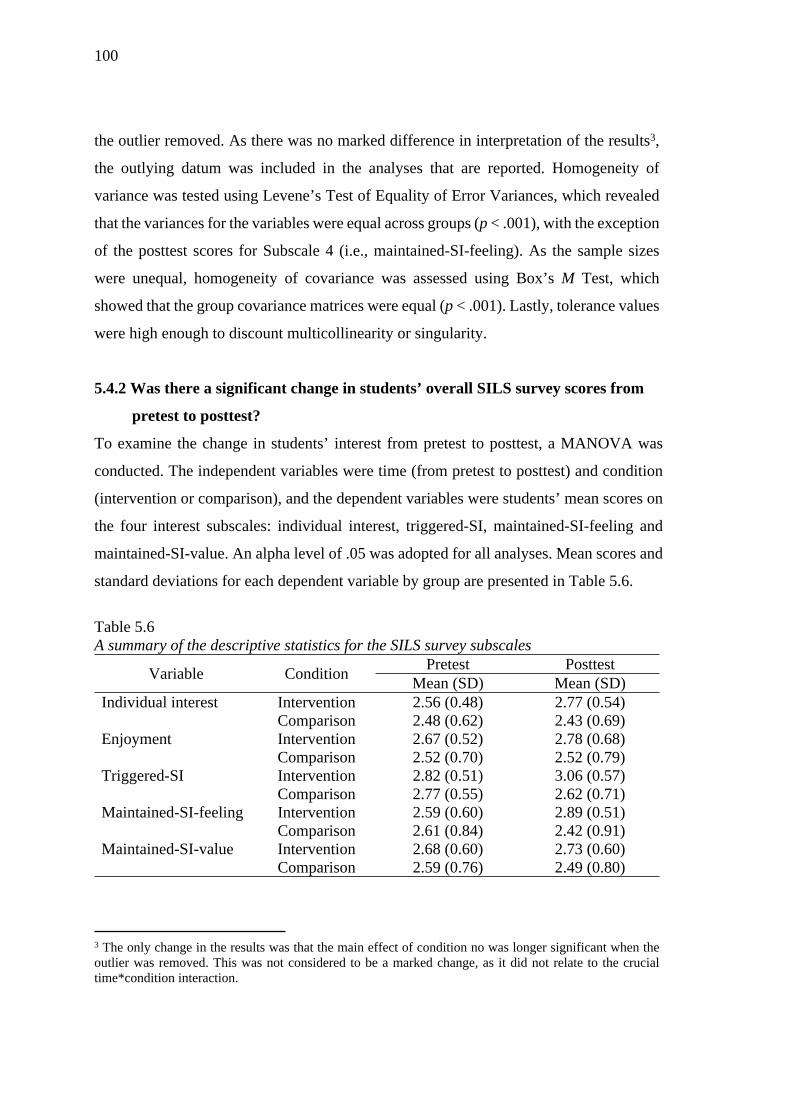
100
the outlier removed. As there was no marked difference in interpretation of the results3,
the outlying datum was included in the analyses that are reported. Homogeneity of
variance was tested using Levene’s Test of Equality of Error Variances, which revealed
that the variances for the variables were equal across groups (p < .001), with the exception
of the posttest scores for Subscale 4 (i.e., maintained-SI-feeling). As the sample sizes
were unequal, homogeneity of covariance was assessed using Box’s M Test, which
showed that the group covariance matrices were equal (p < .001). Lastly, tolerance values
were high enough to discount multicollinearity or singularity.
5.4.2 Was there a significant change in students’ overall SILS survey scores from
pretest to posttest?
To examine the change in students’ interest from pretest to posttest, a MANOVA was
conducted. The independent variables were time (from pretest to posttest) and condition
(intervention or comparison), and the dependent variables were students’ mean scores on
the four interest subscales: individual interest, triggered-SI, maintained-SI-feeling and
maintained-SI-value. An alpha level of .05 was adopted for all analyses. Mean scores and
standard deviations for each dependent variable by group are presented in Table 5.6.
Table 5.6A summary of the descriptive statistics for the SILS survey subscales
Pretest PosttestVariable Condition Mean (SD) Mean (SD)Individual interest Intervention 2.56 (0.48) 2.77 (0.54)
Comparison 2.48 (0.62) 2.43 (0.69)Enjoyment Intervention 2.67 (0.52) 2.78 (0.68)
Comparison 2.52 (0.70) 2.52 (0.79)Triggered-SI Intervention 2.82 (0.51) 3.06 (0.57)
Comparison 2.77 (0.55) 2.62 (0.71)Maintained-SI-feeling Intervention 2.59 (0.60) 2.89 (0.51)
Comparison 2.61 (0.84) 2.42 (0.91)Maintained-SI-value Intervention 2.68 (0.60) 2.73 (0.60)
Comparison 2.59 (0.76) 2.49 (0.80)
3 The only change in the results was that the main effect of condition no was longer significant when the outlier was removed. This was not considered to be a marked change, as it did not relate to the crucial time*condition interaction.
101
No significant main effect of time was observed. A significant main effect for condition
was observed, Wilks’s = 0.88, F(5, 88) = 2.36, p = .046, partial 2 = .12. The crucial
time*condition interaction effect was significant, Wilks’s = 0.80, F(4, 89) = 5.42, p =
.001, partial 2 = .20, which suggests the intervention and comparison groups performed
differently on the survey subscales over the project.
To explore further the critical time*condition interaction for each interest subscale, a
series of univariate ANOVAs were conducted. There was no main effect for time for each
interest subscale. While there were no main effects for condition on most subscales, there
was a significant main effect for condition for triggered situational interest (i.e., Subscale
2), F(1, 92) = 4.33, p = .04, partial 2 = .05. As shown in Table 5.7, there was a significant
time*condition interaction for individual interest in learning about science, triggered-SI,
and maintained-SI-feeling. There was no significant time*condition interaction for
enjoyment learning about Earth science or maintained-SI-value.
Table 5.7Results of the univariate analyses, which examined the significant time*condition interaction
Variable df F Sig.Individual interest 1 8.41 .005*Enjoyment 1 0.27 .61Triggered-SI 1 15.46 .000**Maintained-SI-feeling 1 13.90 .000**Maintained-SI-value 1 1.32 .25*Significant at the p < .05 level (two-tailed). ** Significant at the p < .001 level (two-tailed).
A series of paired samples t-tests were carried out to explore the univariate time*condition
interactions (Table 5.8). For the individual interest in learning about science subscale,
there was a significant increase in the intervention group’s interest level, which was not
observed for the comparison group. For the triggered-SI subscale, the intervention group’s
interest significantly increased, whereas the comparison group’s interest significantly
decreased. This trend was also observed for the maintained-SI-feeling subscale. Neither
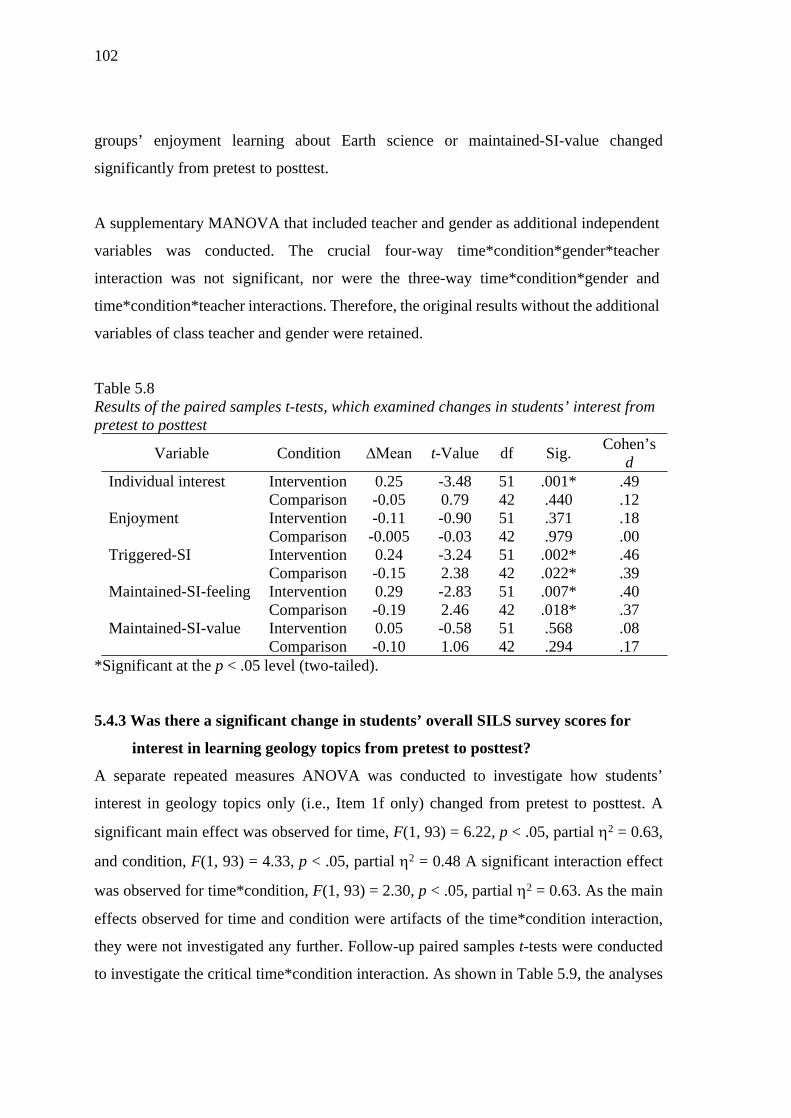
102
groups’ enjoyment learning about Earth science or maintained-SI-value changed
significantly from pretest to posttest.
A supplementary MANOVA that included teacher and gender as additional independent
variables was conducted. The crucial four-way time*condition*gender*teacher
interaction was not significant, nor were the three-way time*condition*gender and
time*condition*teacher interactions. Therefore, the original results without the additional
variables of class teacher and gender were retained.
Table 5.8Results of the paired samples t-tests, which examined changes in students’ interest from pretest to posttest
Variable Condition ∆Mean t-Value df Sig. Cohen’s d
Individual interest Intervention 0.25 -3.48 51 .001* .49Comparison -0.05 0.79 42 .440 .12
Enjoyment Intervention -0.11 -0.90 51 .371 .18Comparison -0.005 -0.03 42 .979 .00
Triggered-SI Intervention 0.24 -3.24 51 .002* .46Comparison -0.15 2.38 42 .022* .39
Maintained-SI-feeling Intervention 0.29 -2.83 51 .007* .40Comparison -0.19 2.46 42 .018* .37
Maintained-SI-value Intervention 0.05 -0.58 51 .568 .08Comparison -0.10 1.06 42 .294 .17
*Significant at the p < .05 level (two-tailed).
5.4.3 Was there a significant change in students’ overall SILS survey scores for
interest in learning geology topics from pretest to posttest?
A separate repeated measures ANOVA was conducted to investigate how students’
interest in geology topics only (i.e., Item 1f only) changed from pretest to posttest. A
significant main effect was observed for time, F(1, 93) = 6.22, p < .05, partial 2 = 0.63,
and condition, F(1, 93) = 4.33, p < .05, partial 2 = 0.48 A significant interaction effect
was observed for time*condition, F(1, 93) = 2.30, p < .05, partial 2 = 0.63. As the main
effects observed for time and condition were artifacts of the time*condition interaction,
they were not investigated any further. Follow-up paired samples t-tests were conducted
to investigate the critical time*condition interaction. As shown in Table 5.9, the analyses
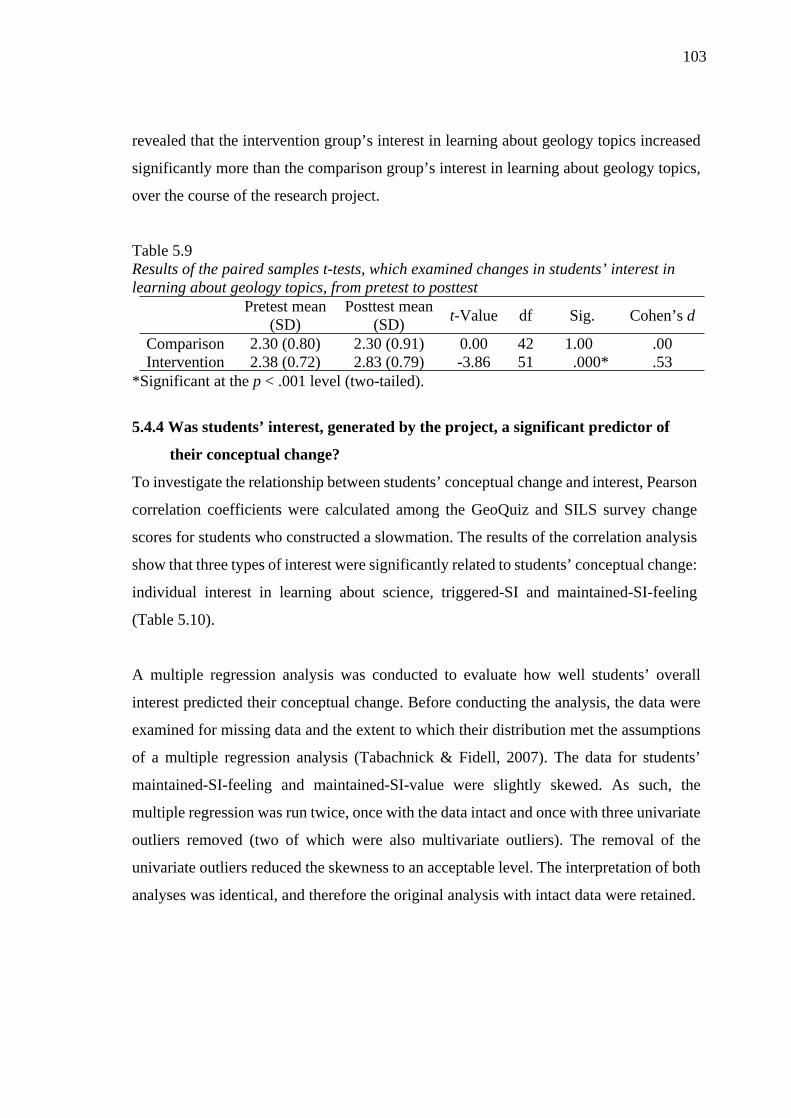
103
revealed that the intervention group’s interest in learning about geology topics increased
significantly more than the comparison group’s interest in learning about geology topics,
over the course of the research project.
Table 5.9Results of the paired samples t-tests, which examined changes in students’ interest in learning about geology topics, from pretest to posttest
Pretest mean (SD)
Posttest mean (SD) t-Value df Sig. Cohen’s d
Comparison 2.30 (0.80) 2.30 (0.91) 0.00 42 1.00 .00Intervention 2.38 (0.72) 2.83 (0.79) -3.86 51 .000* .53
*Significant at the p < .001 level (two-tailed).
5.4.4 Was students’ interest, generated by the project, a significant predictor of
their conceptual change?
To investigate the relationship between students’ conceptual change and interest, Pearson
correlation coefficients were calculated among the GeoQuiz and SILS survey change
scores for students who constructed a slowmation. The results of the correlation analysis
show that three types of interest were significantly related to students’ conceptual change:
individual interest in learning about science, triggered-SI and maintained-SI-feeling
(Table 5.10).
A multiple regression analysis was conducted to evaluate how well students’ overall
interest predicted their conceptual change. Before conducting the analysis, the data were
examined for missing data and the extent to which their distribution met the assumptions
of a multiple regression analysis (Tabachnick & Fidell, 2007). The data for students’
maintained-SI-feeling and maintained-SI-value were slightly skewed. As such, the
multiple regression was run twice, once with the data intact and once with three univariate
outliers removed (two of which were also multivariate outliers). The removal of the
univariate outliers reduced the skewness to an acceptable level. The interpretation of both
analyses was identical, and therefore the original analysis with intact data were retained.
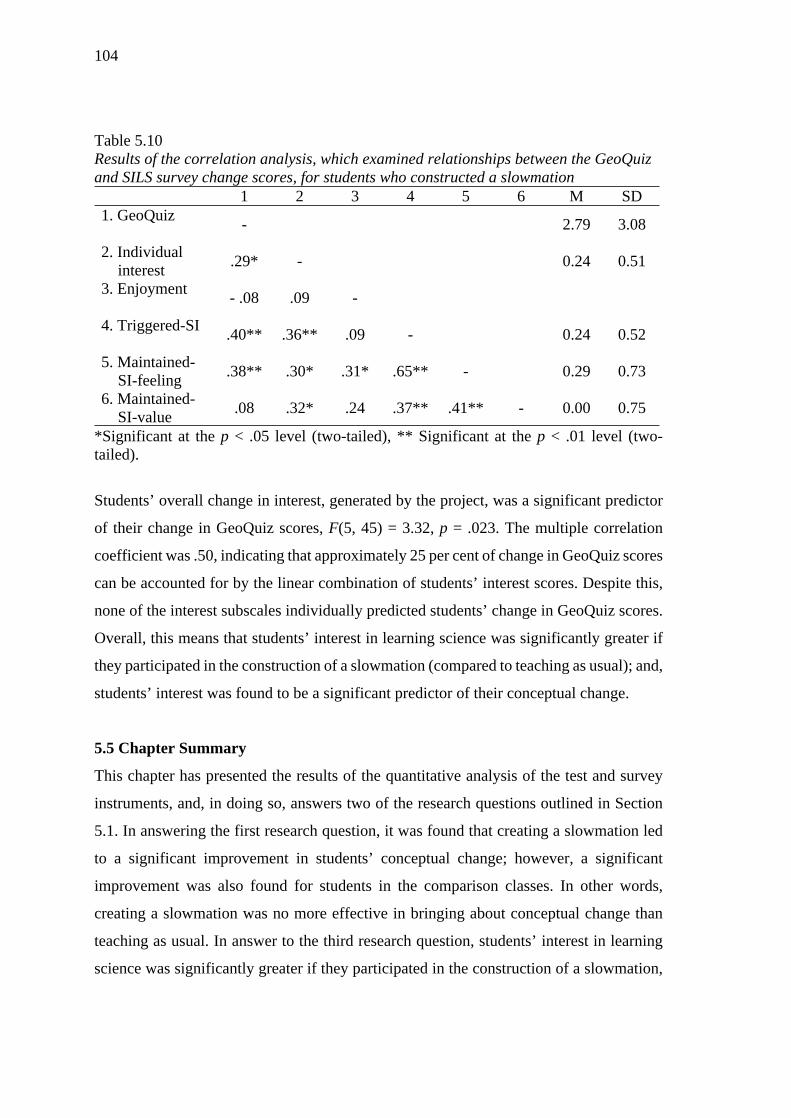
104
Table 5.10Results of the correlation analysis, which examined relationships between the GeoQuiz and SILS survey change scores, for students who constructed a slowmation
1 2 3 4 5 6 M SD1. GeoQuiz - 2.79 3.08
2. Individual interest .29* - 0.24 0.51
3. Enjoyment - .08 .09 -
4. Triggered-SI .40** .36** .09 - 0.24 0.52
5. Maintained-SI-feeling .38** .30* .31* .65** - 0.29 0.73
6. Maintained-SI-value .08 .32* .24 .37** .41** - 0.00 0.75
*Significant at the p < .05 level (two-tailed), ** Significant at the p < .01 level (two-tailed).
Students’ overall change in interest, generated by the project, was a significant predictor
of their change in GeoQuiz scores, F(5, 45) = 3.32, p = .023. The multiple correlation
coefficient was .50, indicating that approximately 25 per cent of change in GeoQuiz scores
can be accounted for by the linear combination of students’ interest scores. Despite this,
none of the interest subscales individually predicted students’ change in GeoQuiz scores.
Overall, this means that students’ interest in learning science was significantly greater if
they participated in the construction of a slowmation (compared to teaching as usual); and,
students’ interest was found to be a significant predictor of their conceptual change.
5.5 Chapter Summary
This chapter has presented the results of the quantitative analysis of the test and survey
instruments, and, in doing so, answers two of the research questions outlined in Section
5.1. In answering the first research question, it was found that creating a slowmation led
to a significant improvement in students’ conceptual change; however, a significant
improvement was also found for students in the comparison classes. In other words,
creating a slowmation was no more effective in bringing about conceptual change than
teaching as usual. In answer to the third research question, students’ interest in learning
science was significantly greater if they participated in the construction of a slowmation,

105
compared to teaching as usual. In addition, students’ interest was found to be a significant
predictor of their conceptual change. In the next chapter, the qualitative research findings
are presented.

106
107
CHAPTER SIX: QUALITATIVE RESULTS
6.1 Chapter Introduction
As outlined in Chapter 3, a sub-sample of students (N=19) were audio-recorded while
they worked in groups to provide an insight into how the slowmation construction process
influenced their conceptual change. Most of these students (N=17) also agreed to
participate in a post-intervention interview, where they were asked about their
experiences and perceptions of making a slowmation. The findings that emerged from the
post-intervention interviews were primarily used to gain further insight into the
relationship between students’ interest and conceptual change, and to triangulate the
findings of the SILS survey that were presented in the preceding chapter.
This chapter now presents the qualitative research findings. First, Section 6.2 presents a
brief overview of the audio-recording and interview procedures, and their analyses.
Second, Section 6.3 presents evidence to support the first key finding that constructing a
slowmation had a facilitating influence on students’ conceptual change. This occurred in
two ways: (1) the teacher identified and corrected students’ alternative conceptions; and
(2) students attributed their learning, in part, to the feelings of enjoyment aroused by
constructing a slowmation. Third, Section 6.4 presents evidence to support the second
key finding that despite its merit, constructing a slowmation also raised significant
pedagogical issues that appeared to inhibit opportunities for conceptual change to occur.
These were: (1) students’ preoccupation with the procedural aspects of constructing a
slowmation; (2) students’ apparent lack of motivation to understand the science content
and represent it accurately; (3) students’ privileging and bypassing modes of
representation; and (4) time constraints. Fourth, to conclude the chapter, a summary of
the qualitative research findings is presented in Section 6.5.
6.2 Overview of Audio-Recording and Interview Procedures and Analyses
Students constructed a slowmation across four 70-minute lessons. Six groups of students
(N=19) were audio-recorded throughout the construction of their slowmation (i.e., three
groups of students from each intervention class; Table 6.1). The researcher manually
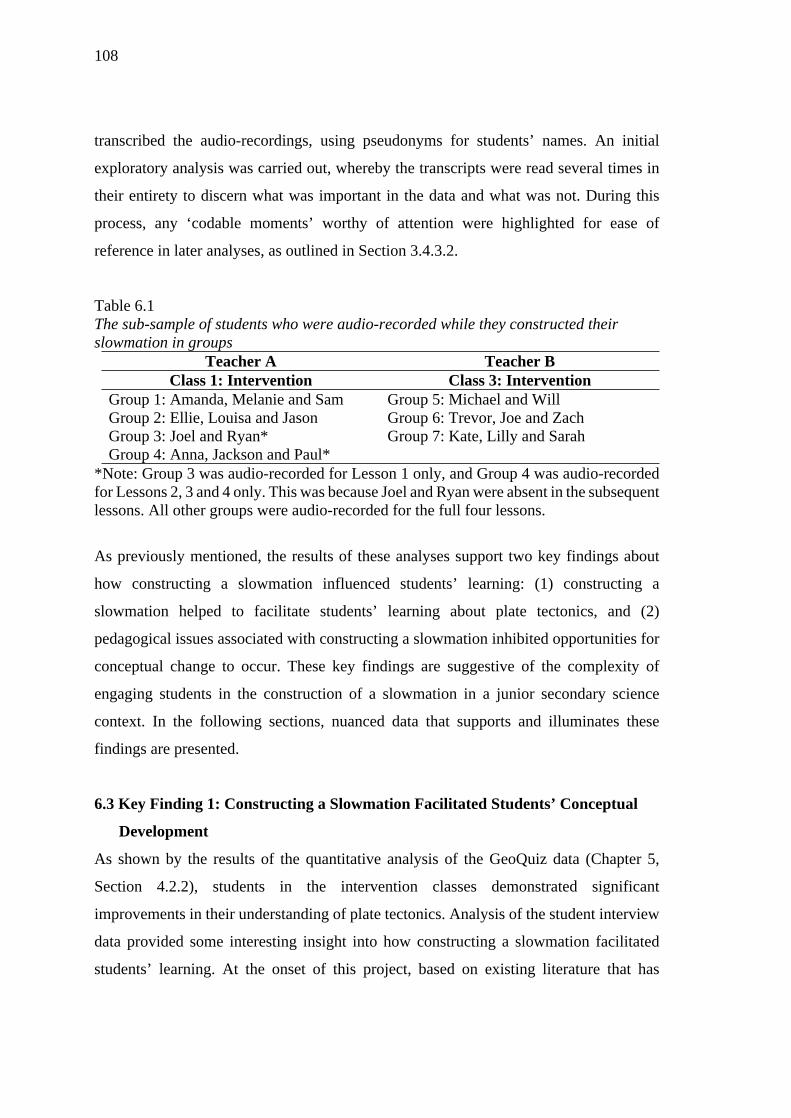
108
transcribed the audio-recordings, using pseudonyms for students’ names. An initial
exploratory analysis was carried out, whereby the transcripts were read several times in
their entirety to discern what was important in the data and what was not. During this
process, any ‘codable moments’ worthy of attention were highlighted for ease of
reference in later analyses, as outlined in Section 3.4.3.2.
Table 6.1The sub-sample of students who were audio-recorded while they constructed their slowmation in groups
Teacher A Teacher BClass 1: Intervention Class 3: Intervention
Group 1: Amanda, Melanie and SamGroup 2: Ellie, Louisa and JasonGroup 3: Joel and Ryan*Group 4: Anna, Jackson and Paul*
Group 5: Michael and WillGroup 6: Trevor, Joe and ZachGroup 7: Kate, Lilly and Sarah
*Note: Group 3 was audio-recorded for Lesson 1 only, and Group 4 was audio-recorded for Lessons 2, 3 and 4 only. This was because Joel and Ryan were absent in the subsequent lessons. All other groups were audio-recorded for the full four lessons.
As previously mentioned, the results of these analyses support two key findings about
how constructing a slowmation influenced students’ learning: (1) constructing a
slowmation helped to facilitate students’ learning about plate tectonics, and (2)
pedagogical issues associated with constructing a slowmation inhibited opportunities for
conceptual change to occur. These key findings are suggestive of the complexity of
engaging students in the construction of a slowmation in a junior secondary science
context. In the following sections, nuanced data that supports and illuminates these
findings are presented.
6.3 Key Finding 1: Constructing a Slowmation Facilitated Students’ Conceptual
Development
As shown by the results of the quantitative analysis of the GeoQuiz data (Chapter 5,
Section 4.2.2), students in the intervention classes demonstrated significant
improvements in their understanding of plate tectonics. Analysis of the student interview
data provided some interesting insight into how constructing a slowmation facilitated
students’ learning. At the onset of this project, based on existing literature that has
109
examined the efficacy of slowmation in pre-service teacher education contexts, it was
expected that constructing a slowmation would facilitate an active, student-centred
learning environment, wherein students learned about plate tectonics by producing
different representations, discussing their learning with one another and the teacher, and
refining their animations. What actually occurred, however, was very different. Instances
of conceptual development came about through instruction from the teacher, rather than
from the construction process itself. Despite this, the construction process was perceived
as particularly memorable for students. At interview, students recalled their enjoyment
constructing a slowmation, which they perceived to have enhanced their learning. The
evidence that supports these two claims is presented in the subsequent sections.
6.3.1 The teacher identified and/or corrected students’ alternative conceptions
during the construction process
There were several instances across the audio-recorded lessons where the teacher or
researcher (as observer-participant) identified and/or corrected students’ alternative
conceptions. In the first instance presented here, the researcher corrected one group’s
misconceived notion of geologic time.
While trying to accurately represent the formation of the Himalayas over time, two group
members, Anna and Paul, thought that the mountain range had formed relatively quickly,
over hundreds or thousands of years. Their third group member, Jackson, thought that the
mountain range had formed over millions of years:
Excerpt 6.1
Paul: So we’ve done that one, that one, that one… ((Reading))
“How are these landforms created and how long does the
process take?”
Jackson: It takes millions of years.
Anna: It probably took, like, 100 years or something.
Jackson: No, for mountains to form it would take, like, millions of
years-
110
Paul: Thousands.
Anna: It wouldn’t take millions of years! Otherwise we wouldn’t
have all the mountains we have today.
Jackson: Well the Earth is billions of years old, so there was plenty of
time.
It is obvious from the excerpt above that Anna and Paul do not understand that the
formation of a large mountain range, such as the Himalayas, may have taken around 100
million years. Later on in the construction process, the researcher unintentionally
corrected the students’ misunderstanding. He suggested to this group, “You know what
would be cool? If you used a label to show how long this process takes. It would have
taken millions of years.” Jackson, acknowledging that he was correct despite his group’s
reluctance to believe him, exclaimed, “Yes! I was right!” In this instance, the researcher
inadvertently addressed the students’ alternative conception. In this group’s final
slowmation, the geological time scale was represented accurately, which suggests that as
a result of the researcher’s comments, the students had a more scientific conception about
the timescale on which Earth’s geological processes operate.
In another instance, there was confusion between Joe and Zach about the direction of
plate movement, and the resulting landforms, at a divergent plate boundary. In Excerpt
6.2, they come to the conclusion that the plates move away from each other and a trench
is formed:
Excerpt 6.2
Zach: Joe?
Joe: Yeah?
Zach: Is a divergent plate boundary where they smash together and
one goes up and one goes down?
Joe: Um::: yeah. I believe one goes up and one goes down. I think.
Zack: I’ll check.
Joe: [Yeah, that’s right.]
111
Zack: OK. They move away and they make a trench.
Joe: Yeah.
This incorrect belief persisted throughout the planning and construction phases. When
discussing what to include in their slowmation, Zach suggested that they should “talk
about trenches”, while Joe replied, “We’ll explain that the crust pulls away from each
other and leaves a trench.” The teacher was again crucial in resolving the students’
confusion. In Excerpt 6.3, when the students begin to manipulate their three-dimensional
models, they ask the teacher for help:
Excerpt 6.3
Zach: When two continental ones [plates] move apart, does it create
a trench?
Teacher: No, not a trench. It creates what’s called a continental rift.
Zach: But-
Teacher: It’s kind of like-
Zach: [Just a gap?]
Teacher: -where the crust thins out and the magma below rises and can
erupt onto the surface.
Accepting that a continental rift occurs at a continental divergent plate boundary, the
students then turned their attention to representing this landform using their models. This
revealed further alternative conceptions about the spatial scale of geological processes
such as rifting, that were once again addressed through instruction from the teacher:
Excerpt 6.4
Zach: Do you think we could use this [two pieces of thick sponge]
and pull it in half and pretend that’s the crack opening? And
then we’ll just put magma coming through?
112
Teacher: Yeah if you want. You need to show what happens there [in
the space that is left from separating the two pieces of
sponge].
Trevor: Yeah we have to try and decide. Because originally we
thought we were going to put the trench in there but now
we’re not sure.
Teacher: Isn’t red [coloured paper on top of the pieces of sponge]
continental crust? Continental-continental. So this would be a
rift basin where you sometimes have eruptions happening.
Maybe show the crust in the basin and have some magma
coming up. It can’t stay as an empty gap.
Zach: Yeah:::
From the two previous exchanges it is evident that Zach had perceived a continental rift
as an empty “gap” or “crack” in Earth’s lithosphere, rather than a thinning of the
lithosphere over tens of kilometers. Therefore, in addition to him incorrectly believing
that this process forms a trench, he also had a misunderstanding of the spatial scale of
continental rifting. This is further evidenced by Zach’s suggestion that a rift can be
“joined back together” as the magma that rises to the Earth’s surface hardens over time.
The teacher explained to Zach that the extension of the lithosphere occurs until it
separates, and that by this time the basin that forms is sufficiently deep to be in-filled by
the ocean: “It won’t fill up with magma. It’s more likely to fill up with water and form a
rift lake or a new ocean basin.” In response, both students appeared to revise their initial
understanding of the process. Trevor said, “Ah I see! It’s like that!” and Zach said, “…
that makes sense.”
Ellie and Louisa also struggled to understand the nature of divergent plate boundaries and
the landforms that occur at these places. Ellie and Louisa began their research by
determining the direction of plate movement. After explicit instruction from the teacher,
the students came to know that tectonic plates move apart at a divergent plate boundary:
113
Excerpt 6.5
Louisa: Does it [the lithosphere] even come back together? I don’t
understand.
Ellie: No, it wouldn’t… Yeah it would have to because otherwise
the tectonic plates would have holes in them.
Louisa: I guess so. I’ll ask.
Louisa: We were just, um, a bit confused about divergent plate
boundaries. We’re wondering if they separate and then they
come back like that, or they come back like that?
Teacher: Neither. They keep separating.
This new information, however, did not fit with their understanding about how volcanoes
form in these areas. In Excerpt 6.6, the teacher explains that magma can find its way
easily to the Earth’s surface through the weakened lithosphere and cause volcanic
activity:
Excerpt 6.6:
Ellie: OK so how does a volcano form if the tectonic plates are
separating?
Teacher: Well, what do you think? What’s a volcano?
Ellie: Magma?
Teacher: Yeah. So if two pieces of lithosphere move apart over
hundreds of thousands of years, what’s left?
Ellie: A hole?
Teacher: And what’s going to fill the ‘hole’?
Ellie: Magma?
Teacher: Yeah.
Ellie: OK!
Louisa: [OK!]
114
The teacher further explains that this can occur on land at a continental rift or on ocean
floor at a mid-ocean ridge:
Excerpt 6.7
Teacher: The types of volcanoes that occur at divergent plate
boundaries… Well, it depends. If the plate boundary is
beneath the ocean, the process is called sea-floor spreading,
and the magma that rises from the asthenosphere ends up
forming crust – the ocean floor. OK?
Louisa: Yep.
Ellie: [Yep.]
Teacher: If it’s on land you end up with kind of like… What’s it called?
Um::: a continental rift. And you can have fissure eruptions.
That doesn’t look like a mountain, like a normal volcano does,
it’s just where the lithosphere has thinned out and there might
be lava on the Earth’s surface. Does that make sense?
Ellie: Yeah! Thank you!
Later, during the construction process, it becomes apparent that Louisa is still confused
about the direction of tectonic plate movement at a divergent plate boundary and the
subsequent formation of either a continental rift or a mid-ocean ridge. In the following
exchange, Excerpt 6.8, Louisa wants to “build up” the lithosphere by pushing two thick
sponges “inwards”. Louisa thinks that this will represent the formation of a volcano at a
divergent plate boundary:
Excerpt 6.8
Louisa: So cut this [a thick sponge] in half and put one here and here
to make the volcano? Ellie what are you thinking about?
Express your thoughts and feelings! ((Laugh))
Ellie: Like that. Not folded like that. It’s a volcano that forms out of
land-
115
Louisa: Out of land? ((Laugh))
Ellie: Out of magma.
Louisa: Are we going to make it so that there are plate boundaries and
build it up? So that it goes inwards sort of?
Ellie: What? I don’t know what you’re talking about. No these are
the plate boundaries. And the plate boundaries spread apart
and then magma comes in between them and then it [the
volcano] forms in the middle of it.
Louisa: Oh! OK! I don’t know how I’m going to () using sponges.
Ellie: I think you’re confused because the plates only go like this.
They don’t go up.
Louisa: [Yeah I am confused.]
As a result of the explicit instruction from the teacher, it is evident that Ellie had a more
scientific conception of divergent plate boundaries. She demonstrated her understanding
by explaining to Louisa that, “… the plate boundaries spread apart and then magma comes
in between them and [a volcano] forms.” Louisa, on the other hand, remained confused.
The importance of teacher intervention in helping to identify and modify students’
alternative conceptions was highlighted by one identified instance wherein two students’
misunderstanding about the formation of mountains and volcanoes persisted throughout
the project. In this instance, Michael and Will were researching landforms that occur at a
continental-continental convergent plate boundary. They were unable to distinguish
between the formation of mountains and volcanoes, as illustrated in the following excerpt:
Excerpt 6.36
Will: What was the question?
Michael: ((Reading)) “What landforms occur at your plate boundary?”
Will: Mountains, volcanoes-
Michael: Are you sure?
116
Will: Not one hundred per cent. Mountains and volcanoes will
occur, I know those.
Will’s alternative conception about the formation of these landforms persisted throughout
the planning and construction phases, where he suggests his group “… draw the
[continental] plates moving together and have them turn into a volcano.” He reveals his
belief that “… the volcano builds and erupts and then it turns into a mountain.” This
belief, unchallenged by Michael, was retained and represented in the students’ final
slowmation.
6.3.2 Students found their experience constructing a slowmation enjoyable, which
they perceived to enhance their learning
Although the analyses of the SILS survey results (Chapter 5, Section 5.4.2) showed only
a marginal increase in students’ enjoyment of learning about Earth science topics,
students’ comments during the post-intervention interviews indicated that the way in
which they learnt about this topic in the current study (i.e., through the construction of a
slowmation) was indeed enjoyable. Specifically, students noted that they enjoyed the
hands-on construction process, and the opportunity to represent science information in
creative ways. Importantly, when asked at interview, ‘How do you think making a
slowmation impacted upon your learning?’, students believed their enjoyment facilitated
better learning outcomes than teaching as usual. Students contrasted their experience
constructing a slowmation with their usual experience learning science by “reading from
textbooks” and “writing on a worksheet”, and perceived their learning to be greater in the
context of constructing a slowmation: “It’s better than doing normal stuff in class and it
helps you understand it more.” (Ellie). Excerpts 6.9 to 6.11 illustrate students expressing
this viewpoint at interview:
Excerpt 6.9
Researcher: How did you find making a slowmation?
Will: It was fun.
Researcher: Was there something that stood out as being really fun?
117
Will: I liked making the slides [still images] and seeing it all come
together.
Researcher: How do you think making a slowmation impacted your
learning?
Will: It helped me more because I prefer hands-on [learning]
instead of just writing and talking. That helped me understand
more.
Excerpt 6.10
Researcher: Can you tell me about your experience making a slowmation?
Lilly: It was fun.
Researcher: Was there something in particular that was really fun?
Lilly: I liked the whole thing. Instead of reading from textbooks and
stuff it was more fun. It was interesting for me to make stuff
and it taught me more.
Researcher: Why was it interesting to learn that way?
Lilly: Because we actually got to do stuff other than reading and
writing.
Excerpt 6.11
Researcher: Can you tell me about your experience making a slowmation?
Louisa: It was actually pretty fun. If Teacher A were teaching us that I
don’t think I would remember as much as I did.
Researcher: Why is that?
Louisa: Because I don’t usually listen in class.
Researcher: Why was doing the slowmation different?
Louisa: Because you had to learn the stuff and apply it. You weren’t
just writing it down you had to make stuff. It’s a more
enjoyable way to do it. Instead of writing on a worksheet for
70 minutes it’s taking pictures of the bits and pieces you’ve
created.
118
6.4 Key Finding 2: Pedagogical Issues Associated with Constructing a Slowmation
Inhibited Opportunities for Conceptual Change
Although in some ways constructing a slowmation facilitated students’ learning,
significant pedagogical issues arose from implementing this instructional approach in a
junior secondary school context that appeared to inhibit opportunities for conceptual
change. The analysis of classroom audio recordings suggests that such opportunities were
constrained by: (1) students’ preoccupation with the procedural aspects of constructing a
slowmation; (2) students’ apparent lack of motivation to understand the science content
and represent it accurately; (3) students’ privileging and bypassing particular modes of
representation; and (4) time constraints. In the sections that follow, the data that supports
each of these themes are presented in turn.
6.4.1 Students were preoccupied with the procedural aspects of constructing a
slowmation
The most prominent theme that arose from data analysis, evident across all groups, was
students’ preoccupation with the procedural aspects of constructing a slowmation. The
majority of discussion that occurred while students constructed their slowmation was
focused on the mode of representation, design elements, sequence and timing of the
slowmation (Table 6.2). Although it was necessary for students to discuss these factors,
the hundreds of distinct references to procedural aspects across the transcripts
demonstrate that this was an extremely pervasive theme.
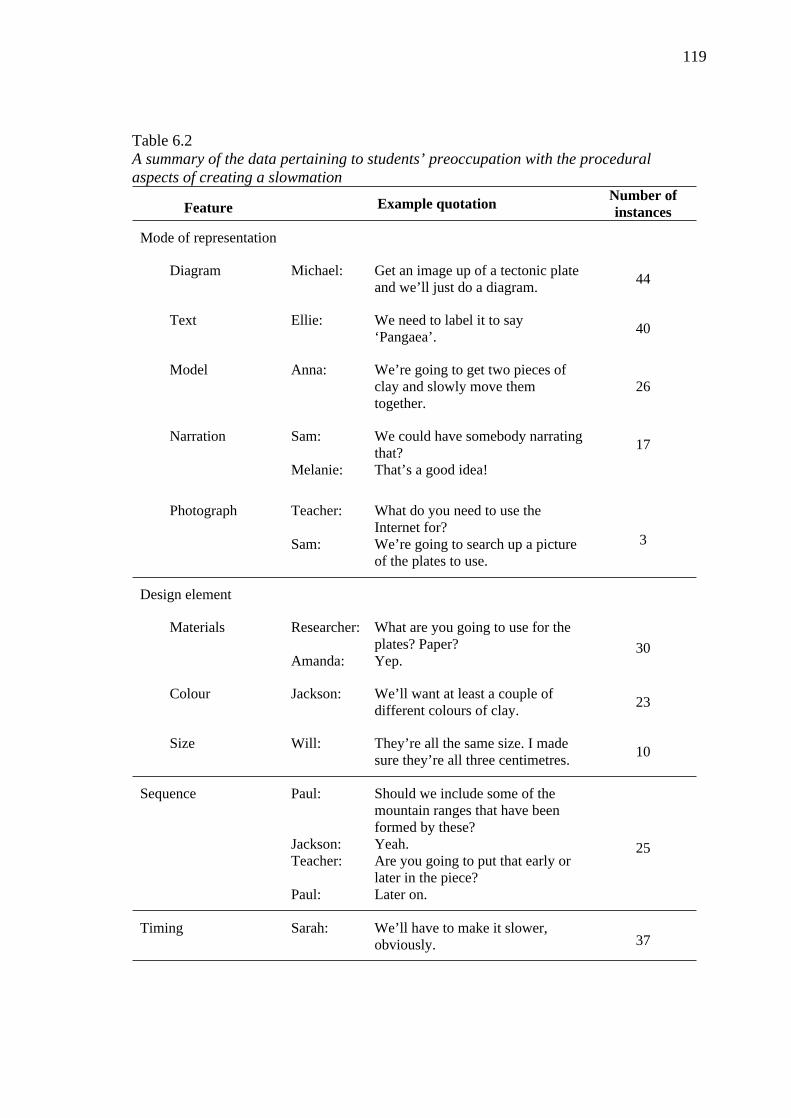
119
Table 6.2A summary of the data pertaining to students’ preoccupation with the procedural aspects of creating a slowmation
Feature Example quotation Number of instances
Mode of representation
Diagram Michael: Get an image up of a tectonic plate and we’ll just do a diagram. 44
Text Ellie: We need to label it to say ‘Pangaea’. 40
Model Anna: We’re going to get two pieces of clay and slowly move them together.
26
Narration Sam: We could have somebody narrating that? 17
Melanie: That’s a good idea!
Photograph Teacher: What do you need to use the Internet for?
Sam: We’re going to search up a picture of the plates to use.
3
Design element
Materials Researcher: What are you going to use for the plates? Paper?
Amanda: Yep.30
Colour Jackson: We’ll want at least a couple of different colours of clay. 23
Size Will: They’re all the same size. I made sure they’re all three centimetres. 10
Sequence Paul: Should we include some of the mountain ranges that have been formed by these?
Jackson: Yeah.Teacher: Are you going to put that early or
later in the piece?Paul: Later on.
25
Timing Sarah: We’ll have to make it slower, obviously. 37
120
Most of the discussion generated between students centered on the modes of
representation they would use in their slowmation (i.e., text, diagrams, photos, models
and/or narration). The design of the specific representations (i.e., material, colour and
size) was also frequently discussed. Although still mentioned a substantial number of
times, students were less concerned with the sequence and timing of information in their
slowmation. No evidence could be found in the data of students’ discussions about the
attributes of their animations (e.g., the size and colours of their models) being indicative
of science learning (e.g., deliberately using different colours to represent different layers
of the earth). As evident in the example quotations provided in Table 6.2, no conceptual
development occurred during these discussions, presumably because students were not
focused on the science that they were trying to represent.
Interestingly, during the post-instruction interviews, Trevor’s learning was primarily
about the procedural skills associated with constructing a slowmation. When asked about
his experience making a slowmation, he indicated that he learnt a lot about “animation
techniques” and “the most memorable part was learning … how to use the [MyCreate™]
program.”
6.4.2 Students lacked motivation to understand the science content and represent it
accurately
There were 32 instances where students appeared to lack motivation to understand the
science content and represent it accurately in their slowmation, as encapsulated by the
following quotation: “She [the teacher] won’t see it [the research notes]. It doesn’t really
matter if you don’t understand what it’s saying.” (Louisa). The following excerpts
document occasions where there were opportunities for conceptual development, but
these opportunities were not realised. In each case, it seems that students were not
motivated to understand better the science that they were trying to represent through their
models:
121
Excerpt 6.24
Louisa: What do they [tectonic plates] look like? Are they just, like,
ovals?
Ellie: Yeah I assume so.
Excerpt 6.25
Researcher: Do you think paper is the best way to represent a tectonic
plate?
Melanie: We could use a sponge or something because it’s thicker.
Researcher: It is thicker. Well what is a tectonic plate made up of?
Melanie: The crust?
Researcher: And?
Melanie: Other stuff.
Excerpt 6.26
Amanda: OK we didn’t explain anything. Because it goes, “Mountains
are caused by continental convergent plates”, but we never
really say how they form. Is it just, like, when they hit each
other or something?
Melanie: Yeah it’s when they hit each other. Maybe we’ll have to
narrate that.
The following remarks from students provide further evidence of students’ waning
motivation to develop a deep understanding of the science content:
“You don’t have to do it perfectly! We’re not being marked on this.” (Michael)
“It’s good enough. It doesn’t need to be perfect.” (Anna)
“That doesn’t make any sense to me, but that’s what my book says.” (Amanda)
“It’s not right, but that’s what we’re doing.” (Louisa)
Students often experienced difficulty locating and comprehending information on the
Internet during the researching stage, which could have impeded their willingness to
122
come to understand the material. With regards to locating information on the web,
remarks such as, “What did you search up to get your answer?” and “Where did you find
that?” occurred throughout the researching phase. Comprehending what they had found
presented further challenges for students. Louisa noted that, “There are a lot of
complicated words that I don’t know”. This sentiment was echoed by other students: “It
doesn’t really make sense. It says, ‘oceanic plates’, what the hell is that?” (Ellie). As
illustrated by Louisa and Ellie’s remarks, learning about difficult and abstract geologic
concepts through self-directed research was a challenging task. This difficulty is
exemplified further by Anna’s remark that, “I just didn’t understand because no one was
explaining it to me.” This sentiment was echoed during the post-intervention interviews,
as students recalled the challenge of finding and comprehending information during self-
directed research on the Internet:
Excerpt 6.27
Researcher: Were there any challenges [constructing a slowmation]?
Lilly: When we were making the storyboard it was hard to come up
with ideas. And some of the information we got was wrong so
we had to go back and fix it.
Excerpt 6.28
Researcher: Were there any challenges [constructing a slowmation]?
Melanie: If we didn’t have the right information then it was difficult.
Researcher: From the research phase?
Melanie: Yeah.
Excerpt 6.29
Researcher: What was most memorable [about the process of constructing
a slowmation]?
Anna: Seeing it at the end. Watching it in class.
Researcher: How did it make you feel?
123
Anna: I was a bit embarrassed because we didn’t know what we were
talking about.
Researcher: Why is that?
Anna: Because we didn’t research as much as we could have. It was
too hard.
Often students did not represent the science content accurately in their slowmation. In
these instances, students were more concerned about designing an entertaining
slowmation than ensuring it was scientifically accurate. Note the following discussion in
Excerpt 6.30 where Lilly identified that her group “just wanted it [the slowmation] to be
fun.”
Excerpt 6.30
Researcher: Is that just to reveal your title?
Sarah: Yeah.
Researcher: Are they representing a tectonic plate?
Sarah: Yeah technically diverging plates.
Kate: It was my idea!
Researcher: It’s not very scientific at the moment.
Sarah: Why?
Caitlyn: [Why?]
Researcher: Did you find out what makes up a tectonic plate? Where are
the crust and the upper mantle on your model? Do you know
what I mean? At the moment it just looks like two sponges.
Sarah: ((Laugh))
Lilly: We just wanted it to be fun!
Interestingly, on one occasion, a student understood the science content but was
seemingly unable to represent her understanding accurately. Sarah noted that, “It’s hard
to show that it’s [the tectonic plate] moving!” while she was modeling.
124
6.4.3 Students privileged and bypassed modes of representation
One of the merits of slowmation that is documented in the pre-service teacher education
literature is that it affords students opportunities to represent information in multiple
modalities (i.e., research notes, storyboard, physical models, text and narration), or a
semiotic progression (Hoban et al., 2011). In the current study, however, the data suggests
that students privileged particular modes of representation (namely, narration and text
[definitions and dot point summaries]) and chose not to employ other more cognitively
demanding ones, such as physical models. In doing so, there were fewer opportunities for
students to develop their conceptual understanding as they transformed information from
one mode to another.
In the following excerpts, students relied on text and narration to communicate science
ideas. For example, in Excerpts 6.31 and 6.32, the students discussed writing definitions
of tectonic plates to appear in their animations, presumably because it was the simplest
way to communicate their knowledge:
Excerpt 6.31
Michael: So let’s start making the sequencing stuff.
Will: Yes. So in the first sequence we could write the definition of a
tectonic plate. So um…
Michael: What is a tectonic plate? Go back.
Will: No we’ll just put, ((Writing)) “Write definition of a tectonic
plate.”
Michael: Go on then.
Excerpt 6.32
Sarah: OK we need to write the definition of a divergent plate
boundary. Ours is going to be so boring.
Lilly: Well go and see what other people are doing and see if theirs
is just as boring.
Sarah: Everyone else is using clay.
125
Lilly: So what?
Excerpt 6.33
Sam: I think we should explain what tectonic plates are. Um::: We
could have somebody narrating that?
Melanie: That’s a good idea!
The following excerpts illustrate students bypassing the use of three-dimensional physical
models in favour of drawings or sketches. Again, it is likely that this presented an easier
option than constructing models out of clay or other materials:
Excerpt 6.34
Researcher: So you’re doing all of yours as a sketch? You’re not going to
use any models?
Michael: No.
Will: [Probably not.]
Researcher: OK. You’ll have to make sure your diagrams are really detailed
and accurate.
Excerpt 6.35
Researcher: Are you going to make some models to move around?
Lilly: Maybe we could but we (are drawing them).
Researcher: Oh you’re only drawing?
Lilly: Yes.
6.4.4 Constructing a slowmation took students “longer than expected”
Another prominent theme that arose from the analysis of the audio-recordings was that
the limited period of time over which the project was implemented (recall that the project
took place over a series of four, 70-minute lessons; see Chapter 3). Thirty-five instances
were drawn from the transcripts wherein students indicated that they did not have enough
time to properly complete their slowmation. The time constraints placed upon students
126
were evident in exclamations like, “We’re only up to the first question!” (Melanie), and
“We only have half an hour left! I didn’t think we’d finish!” (Will). Melanie noted that,
for her, constructing a slowmation took “… a lot longer than … expected.” The teachers,
too, were aware of the limited time available. Throughout the construction process they
prompted students to “Hurry up!” and “Get a move on!” (Teacher A). The lack of time
also arose as an issue during the post-intervention interviews when students were asked
about the challenges they encountered while constructing a slowmation.
Students generally found the stop-motion aspect of slowmation to be the most time
consuming task. This was apparent when students opted out of manipulating their models
because it was too time consuming. For example, in Excerpt 6.11, the researcher noticed
that one group of students was not incorporating the stop-motion characteristic of
slowmation in their animation by frequently manipulating and photographing models.
Instead, they were creating a slideshow-style presentation. Similarly, Excerpts 6.12 and
6.14 illustrate how students chose to minimise the amount of stop-motion required to
construct their animations.
Excerpt 6.12
Researcher: Remember, because it’s a stop-motion animation, you might
like to do it letter by letter.
Anna: Yeah, but that takes too much time.
Excerpt 6.13
Anna: They’re moving together and then they kind of like-
Jackson: Collide with each other?
Paul: Do you know how long… If we do that step-by-step it will
take us too long to create! We’re not doing that!
127
Excerpt 6.14
Will: Should we do it [their diagram of tectonic plates] moving?
Michael: Nah, that would take way too long. Because this is already the
third lesson.
There were instances when the time constraints of the study led students to rush the
construction of their animations. In Excerpt 6.15, for example, Ellie and Louisa were
trying to accurately represent plate movement at their chosen tectonic plate boundary,
however they did not have time to discuss their learning with one another:
Excerpt 6.15
Ellie: We have to hurry up! Just do whatever!
Louisa: I don’t know what way it’s supposed to be though!
Ellie: It doesn’t matter! Just do whatever!
Students also commented that they felt rushed at interview. Amanda recalled that “…
everyone did rush a little bit and some groups ran out of time.” Likewise, it was noted by
Will that “… the most challenging thing was finishing in the time frame.” In order to
finish the slowmation in the four 70-minute lessons, his group “didn’t do everything
[they] wanted to” and “ had to cut a few parts out.”
Throughout the construction process, students spent a considerable amount of time
revisiting and clarifying the task requirements. There were 25 instances where students
asked their teacher or peers to explain an aspect of the task, which contributed further to
the time pressures that they experienced. This occurred throughout the researching,
storyboarding and construction phases, as demonstrated in Excerpts 6.16 to 6.18. Perhaps
this is not surprising given that this task was relatively new and unfamiliar to students.
128
Excerpt 6.16
Ellie: OK do we all have to write it [i.e. information from the
Internet] down?
Louisa: Yeah.
Jason: [Yeah.]
Louisa: Do we have to change it into our own words?
Ellie: Yeah.
Excerpt 6.17
Trevor: So in this task … What is the task exactly?
Zach: Is each sequence a photo?
Joe: Yeah, each sequence is a photo. I think.
Excerpt 6.18
Paul: Sir, can you check this?
Researcher: Where are your models? Have a look around the room for
some ideas. I know you’re stuck because a group member is
away but this isn’t very scientific.
Jackson: Yeah.
Researcher: Remember your slowmation should be answering five
questions. Check Paul’s task sheet.
Students also spent a considerable amount of time deciding how the workload would be
shared amongst group members. There were 52 instances where students assigned roles
(e.g., researcher, photographer and narrator) amongst themselves. Notably, students
seemed to dislike narrating their slowmation:
Excerpt 6.19
Trevor: Who’s going to do narration? Do you wanna do it? Rock,
paper, scissors?
Zach: Nah yesterday we already had it worked out.
129
Trevor: Joe is not here so we have to alter our roles. I got all the stuff
and set it up so I’ll take the pictures if you narrate.
Excerpt 6.20
Sarah: We’ve got to get the narration done.
Kate: That can be next lesson.
Sarah: Can someone else please do the narration?
Lilly: No way! My voice sounds stupid.
Sarah: But I hate my voice!
On two occasions, the assignment of roles caused discord between the students,
compounding the time constraints of the project. In Excerpt 6.21, Lilly was concerned
that her group members were “looking up videos” on the Internet rather than carrying out
the research for their slowmation:
Excerpt 6.21
Lilly: Guys can you just research?
Sarah: We are! I’m trying to find videos on it.
Lilly: Like you were!
Kate: [We are!]
Sarah: I wasn’t looking up videos, I was just…
Lilly: You are!
Sarah: I’ll search up ‘slowmation’ then.
Lilly noted during her post-intervention interview, “You’ve got to get your team to
work together. I think that was probably the most difficult thing.” Anna, who also
experienced difficultly getting her group to “work together”, shared similar concerns
during her interview:
130
Excerpt 6.22
Researcher: Can you tell me about your experience making a slowmation?
Anna: It was OK. It was a little hard.
Researcher: Why is that?
Anna: Well we weren’t actually cooperating.
Researcher: Oh! Did you have problems working in a group?
Anna: Well Jackson and I were fine but Paul didn’t want to do
anything.
Finally, during the construction phase, one group’s slowmation was deleted from their
iPad™, which had a significant impact on that group’s ability to finish their slowmation
in the allocated amount of time:
Excerpt 6.23
Sarah: Sir! The app froze and then it closed and we went back into it
and it deleted our whole thing!
Researcher: Really?
Kate: Yes! And we had 110 frames on there!
Researcher: Isn’t that weird?
Sarah: It deleted everything.
Researcher: OK you’ll have to re-do it really quickly.
Lilly: How are we supposed to re-do it quickly!
Researcher: You’ll just have to keep your chin up and do your best.
Lilly: OK.
Sarah: ((Sigh)) I’m really sad. We had so much.
Kate: I know.
6.5 Chapter Summary
Overall, constructing a slowmation provided opportunities for conceptual development
through discrete episodes of teacher instruction, and by stimulating students’ enjoyment
and willingness to learn. The importance of teacher intervention in identifying and
131
addressing students’ alternative conceptions was highlighted by one instance wherein two
students’ alternative conception about the formation of mountains and volcanoes
persisted through the construction process. Despite these affordances, however,
significant pedagogical issues arose from the use of slowmation construction as an
instructional strategy in a junior secondary school context. First, students were
preoccupied with the procedural aspects of constructing a slowmation. This included the
content, mode of representation, design elements, sequence, and timing of the
slowmation. Second, students demonstrated waning motivation to understand the science
content and represent it accurately. Instead, they were concerned with the aesthetics of
their slowmation (i.e., whether it looked “cute” or was “fun” to watch). This, in part,
appeared to be due to the student-directed research at the beginning of the construction
process, which students found particularly challenging. Third, students privileged ‘easy’
modes of representation such as text, and bypassed more challenging modes of
representation such as physical models. This may have reduced the opportunities for
conceptual development, as students avoided transforming the science content from one
representation to another. Fourth, the time constraints of the research project
compromised the quality of students’ slowmations. The stop-motion aspect of
slowmation took “way too long” to complete, and students spent a considerable amount
of time assigning and re-assigning roles (e.g., researcher, scribe, photographer and
narrator) amongst themselves. Students also had to regularly seek clarification about the
requirements of the task. These findings have important implications for our
understanding of the value of using slowmation as a conceptual change strategy in a junior
secondary science context. As such, they informed the development of a pedagogical
framework for constructing slowmations with school-aged learners. This framework is
presented and discussed in Chapter 7, as are the significance and implications of the
broader findings presented in the current chapter.

132
133
CHAPTER SEVEN: DISCUSSION
7.1 Introduction
In response to the need for research into conceptual change instructional approaches in
the Earth science discipline (Chapter 2), the current study investigated the use of
slowmation in a junior secondary Earth science context. This chapter will now review the
aims of the study, and discuss its findings and their implications. Section 7.2 presents a
review of the aims of the study, the research methodology and procedures adopted, and
the research questions investigated. Sections 7.3 to 7.5 present and discuss three
assertions that have arisen from the data, and in doing so, provide answers to the study’s
three research questions. These assertions refer to: (1) the enhancement of students’
conceptual change through their participation in the construction of a slowmation; (2) the
positive relationship between students’ conceptual change and their interest and
enjoyment; and (3) the need for a pedagogical framework to inform the use of slowmation
with school-aged learners. In response to the final assertion, Section 7.6 describes a
pedagogical framework informed by the findings of this study: the Learning with
Slowmation (LWS) framework. The limitations of this study are discussed in Section 7.7,
while the implications for science learning and science education research are presented
in Section 7.8. The final section of this chapter, Section 7.9, summarises the contribution
this study makes to science education practice and theory.
7.2 Review of Aims, Research Methodology and Research Questions
The principal aim of this research project was to investigate how constructing a
slowmation influenced Year 9 students’ conceptual change, and the relationship between
students’ interest generated by the project and their conceptual change. The study was
conducted with junior secondary science students at Pine Mountain State College, a
Preparatory to Year 12 college in South-East Queensland. Four intact groups of
participants (i.e., four Year 9 science classes, N=95) were randomly assigned to
intervention and comparison conditions. While two intervention classes (N=52) created a
slowmation to represent a type of tectonic plate boundary, two comparison classes (N=43)
experienced ‘teaching as usual’, in alignment with the College’s usual program of
134
instruction. Both the intervention and comparison conditions spanned four 70-minute
science lessons. A two-tiered multiple-choice test was administered to determine the
effect of creating a slowmation on students’ conceptual change, and data on students’
individual and situational interest were generated using items adapted from the
Situational Interest Survey (Linnenbrink-Garcia et al., 2010) and the PISA 2006 Student
Questionnaire (OECD, 2006). More nuanced qualitative data were generated by audio-
recording a sub-sample of students while they constructed their slowmation (N=19), and
at post-intervention interviews with the same students. The study was guided by the
investigation of the following research questions:
1. Does the process of constructing a slowmation have a significant effect on
students’ conceptual change?
2. How does the process of constructing a slowmation influence students’
conceptual change?
3. To what extent is students’ interest, generated by their participation in
constructing a slowmation, a predictor of their conceptual change?
In answering these questions, three assertions have been synthesised from the quantitative
and qualitative results presented in the preceding chapters:
Assertion 1: The construction of a slowmation significantly enhanced students’
conceptual change as it afforded ‘teachable moments’;
Assertion 2: Students’ interest and enjoyment, generated by their participation in
constructing a slowmation, facilitated conceptual change; and
Assertion 3: Pedagogical considerations warrant the development of a framework
to inform the use of slowmation with school-aged learners.
Assertion 1 answers Research Questions 1 and 2, while Assertion 2 answers Research
Question 3. Although Assertion 3 does not directly answer a research question, it reflects
the significance of the unexpected findings that arose from the analysis of the think-aloud
data. It also raises questions about the adequacy of existing learning frameworks that
inform the use of slowmation, particularly with school aged learners, and has substantial
implications for the development of a new learning framework, presented later in this
135
chapter. As such, the discussion of Assertion 3 is warranted and justified. Each of these
assertions will now be discussed in detail.
7.3 Assertion 1: The Construction of a Slowmation Significantly Enhanced
Students’ Conceptual Change as it Afforded ‘Teachable Moments’.
Evidence of students’ conceptual understanding about plate tectonics was generated from
two data sources: students’ responses to the GeoQuiz, pre- and post-intervention; and
audio-recordings of students thinking aloud while they constructed their slowmation. In
response to Research Question 1, the analysis of the GeoQuiz data provides evidence to
suggest that constructing a slowmation significantly enhanced students’ conceptual
change. In response to Research Question 2, the analysis of audio-recordings revealed
that the construction process afforded teachable moments wherein students’ alternative
conceptions were identified and corrected by the teacher.
The GeoQuiz examined students’ conceptual understanding of plate tectonics;
specifically, their conceptual understanding of the nature and movement of tectonic
plates, and the geologic processes that operate at tectonic plate boundaries. The
intervention and comparison groups both demonstrated an increase in the number of
students with scientific conceptions and a decrease in the number of students with
alternative conceptions, from pretest to posttest. The results of a repeated measures
ANOVA and subsequent paired samples t-tests revealed that the change in both groups’
GeoQuiz scores was statistically significant (Chapter 5, Table 5.5). Importantly, this
indicates that students’ participation in the construction of a slowmation led to
statistically significant conceptual change [t(95) = -4.72, p < .001, d = .91].
The analysis of students verbalising their thinking during the slowmation construction
process identified instances wherein their conceptual development was enhanced. It was
found that the classroom teacher was solely responsible for identifying and correcting
students’ alternative conceptions (Chapter 6, Excerpts 6.1-6.9). These teachable
moments, which occurred exclusively throughout the construction phase only, provided
opportunities for the teacher to view students’ representations and prompt them to
136
consider their accuracy. It is to be noted that teachable moments are described as bringing
about conceptual development (i.e., the addition of scientific ‘elements’ to an existing
conception), rather than conceptual change (i.e., the complete replacement or
modification of an existing conception). When considered alongside the results of the
GeoQuiz, however, it is likely that these teachable moments played a critical role in
contributing to students’ overall conceptual change through the repeated addition of
scientific elements to their existing conceptions. This is consistent with contemporary
notions of conceptual change that suggest it is a gradual process of knowledge
restructuring (Vosniadou & Ioannides, 1998). Without this input from the teacher, it
appeared that students’ alternative conceptions remained unchallenged and persisted
(Chapter 6, Excerpt 6.36).
These findings extend and support existing research on the value of constructing
slowmation representations in science education. As demonstrated in Chapter 2 (Section
2.5.2), there is a paucity of research on the value of slowmation construction with school-
aged learners. The researcher is only aware of two published conference proceedings
(Hoban et al., 2007; Kidman & Hoban, 2009) and two published journal articles (Brown
et al., 2013; Jablonski et al., 2015) that have explored this problem. Only one of these
studies has investigated the value of the construction process for junior secondary school
students (Jablonski et al., 2015). The findings of the current study complement those
reported by Jablonski et al. (2015), as both studies found that constructing a slowmation
had a statistically significant positive impact on students’ learning.
Unlike the study conducted by Jablonski at al. (2015), however, the current study adopted
a conceptual change perspective of learning, and therefore investigated the extent to
which the slowmation construction process resolved students’ alternative conceptions. In
doing so, this study’s findings support emerging research from pre-service teacher
education contexts. Most recently, Nielsen and Hoban (2015) found that constructing a
slowmation increased pre-service teachers’ scientific understanding of moon phases and
reduced their alternative conceptions. Similar findings have been demonstrated in other
137
research specific to slowmation construction in pre-service teacher education (Hoban &
Nielsen, 2012, 2014; Kidman et al., 2012; Nielsen & Hoban, 2015; Loughran et al., 2012).
In this body of research, the process of creating a slowmation afforded pre-service
teachers multiple opportunities to revise their understandings, as they translated science
information between several modes of representations (i.e., research notes, storyboards,
models, digital photographs and the final slowmation). Pre-service teachers also drew
upon their prior knowledge of the topic to engage in scientific reasoning and
argumentation with their peers, resulting in cogenerative dialogue that facilitated
conceptual change. The findings from the current study are very different, as the teacher
was solely responsible for identifying and correcting students’ alternative conceptions;
there appeared to be no other influences impacting upon students’ learning. This suggests
that the slowmation construction process has different affordances for pre-service
teachers and school-aged students.
In previous studies, pre-service teachers translated information between several modes of
representation in a cumulative semiotic progression during the construction process
(Hoban et al., 2011). This offers significant affordances for conceptual change, as the
resilient nature of alternative conceptions means that knowledge restructuring is unlikely
to occur until pre-service teachers experience several encounters with science content
(Hoban & Nielsen, 2013). A crucial aspect to this progression of meaning is its iterative
nature, which involves the “recursive checking of information with the Internet and with
previous representations” (Hoban et al., 2011, p. 1002, emphasis added). In the current
study, some students successfully translated information in a cumulative semiotic
progression. While these students checked the accuracy of their representations with the
teacher, which provided teachable moments, other students did not demonstrate the same
motivation to represent information accurately. Rather than recursively checking
information and iteratively evaluating their representations, such students were more
concerned with ensuring that their slowmation was aesthetically pleasing and entertaining
(Chapter 6, Excerpt 6.30). Moreover, some students experienced difficulty finding and
comprehending information on the Internet, which may have impeded their willingness
138
to iteratively check the accuracy of information between translations from one mode of
representation to another. These pedagogical issues have not arisen in pre-service teacher
education, and will be discussed further later in this chapter.
Notably, the teachable moments that occurred in the current study resonate with how
Kidman and colleagues (2012) conceptualise learning with slowmation. Their Model of
Learning and Re-learning Through Slowmation (Kidman et al., 2012) depicts two
pathways available for learners who are constructing a slowmation: a surface learning
pathway, and a deep learning pathway (Chapter 2, Section 2.5.3). The model explicitly
identifies the teacher as crucial to bringing about ‘deep learning’. Kidman et al. (2012)
suggest that throughout the construction process, the teacher has a responsibility to ensure
that students consider the accuracy of their representations and respond by revising the
flawed characteristics. This was observed in the current study, and proved to be crucial
in facilitating students’ conceptual change.
Cogenerative discussion has also facilitated pre-service teachers’ conceptual change
when learning with slowmation. Hoban and Nielsen (2014) assert that by “questioning,
stating [their] beliefs, seeking evidence and … making [knowledge] claims” (p. 74), pre-
service teachers are able to resolve their alternative conceptions. This was not observed
in the current study. It is possible that pre-service teachers have greater prior knowledge
than school-aged students, which enables them to more effectively participate in
cogenerative discussion about the science concept or process being represented. In
addition, if the pre-service teachers do not have substantial prior knowledge, they are
likely to be more capable than school-aged students of finding and comprehending the
information necessary to make and justify knowledge claims. As previously mentioned,
students in the current study found this self-directed research a complex task, and so
rather than evaluating their developing knowledge as they encountered new or discrepant
information, students tended to simply agree with one another, even if the science content
was incorrect (Chapter 6, Excerpts 6.24-6.26).
139
An affordance for facilitating cogenerative discussion that was not apparent in the current
study was pre-service teachers’ “need to understand the science in order to explain it”
(Hoban & Nielsen, 2014, p. 74). Hoban and Nielsen (2014) attributed pre-service
teachers’ ‘need to know’ to the task’s authentic purpose – to create an explanatory
resource for Year 6 primary school children. Although students in the current study were
also given a purpose for constructing a slowmation (i.e., to present their animation to
younger students), this did not appear to provide sufficient motivation to help them to
understand the science content and represent it accurately in their slowmation. Perhaps,
then, further strategies to maximise opportunities for cogenerative discussion are required
when enacting slowmation with school students. For school-aged learners, this may
require explicit instruction in cogenerative dialogue before commencing the planning
phase, so that it becomes part of the pedagogy that supports the use of slowmation in the
classroom, and students have the tools required to discuss their learning as it takes place.
Having contrasted how pre-service teachers and school-aged students learn with
slowmation, there are other findings arising from the current study that warrant attention.
First, a noteworthy finding drawn from students’ GeoQuiz responses was the prevalence
of alternative conceptions at pretest. The data show that students in both conditions had
many alternative conceptions about plate tectonics, most of which have not been reported
in previous research (Mills et al., 2017). Students’ alternative conceptions most
commonly concerned the formation of landforms at tectonic plate boundaries, and
students were particularly confused about the cause of subduction at an oceanic-
continental convergent plate boundary. It is also possible that the Australian context of
the research contributed to the novelty of this finding, as previous research reporting
school and university students’ conceptions of plate tectonics originates from elsewhere
(e.g., Marques & Thompson, 1997).
Second, upon closer examination of students’ conceptions about the nature and
movement of tectonic plates from pretest to posttest, it seems that students in the
comparison group had greater learning gains than students in the treatment group
(Chapter 4, Section 5.2.1.1). This is likely due to a difference in the enacted curriculum
140
in the first lesson of the study. When conceptualising the intervention and considering
what questions would guide students’ independent research, the researcher assumed that
students would spend an equal amount of time researching each key question (Chapter 3,
Section 3.4.1). This was not the case, however. Students spent very little time researching
the first two questions, ‘What are tectonic plates?’ and ‘What causes tectonic plates to
move?’, and considerably more time researching the remaining questions concerning the
formation of landforms at tectonic plate boundaries. This was presumably because
students focused their research on the questions that directly related to the topic of their
slowmation. While the intervention group started their self-directed research about
tectonic plate boundaries, the comparison group participated in a lesson entitled ‘Heat
and Convection’ (Chapter 3, Section 3.4.1). It is likely that this contributed to the
comparison group having a better understanding of the nature and movement of tectonic
plates as they experienced explicit instruction about this topic, while the intervention
group did not.
Third, although the findings from the GeoQuiz show that constructing a slowmation had
a significant effect on students’ conceptual development, it was no more effective than
teaching as usual. One possible explanation for this finding is the pedagogical issues that
appeared to constrain students’ conceptual change (e.g., students’ preoccupation with the
procedural and design elements of their slowmation, and time constraints). If these issues
were not present, opportunities for conceptual change may have been enhanced further.
Although it is not appropriate to make assumptions beyond this based on the data
generated in the current study, previous research can be used to consider this finding. It
is possible that more than one group of students in the intervention condition incorrectly
represented concepts throughout their slowmation. These flawed representations may
have remained undiagnosed by the classroom teacher, thus reinforcing other students’
alternative conceptions during the presentation stage. This has occurred in previous
studies where students were creating their own representations of scientific phenomena
(e.g., Ogan-Bekiroglu, 2007; Trundle et al., 2002). Alternatively, students may have
experienced difficulty using the technology or application MyCreate™. This arose as a
concern in one study where pre-service teachers created a slowmation (Hoban & Nielsen,
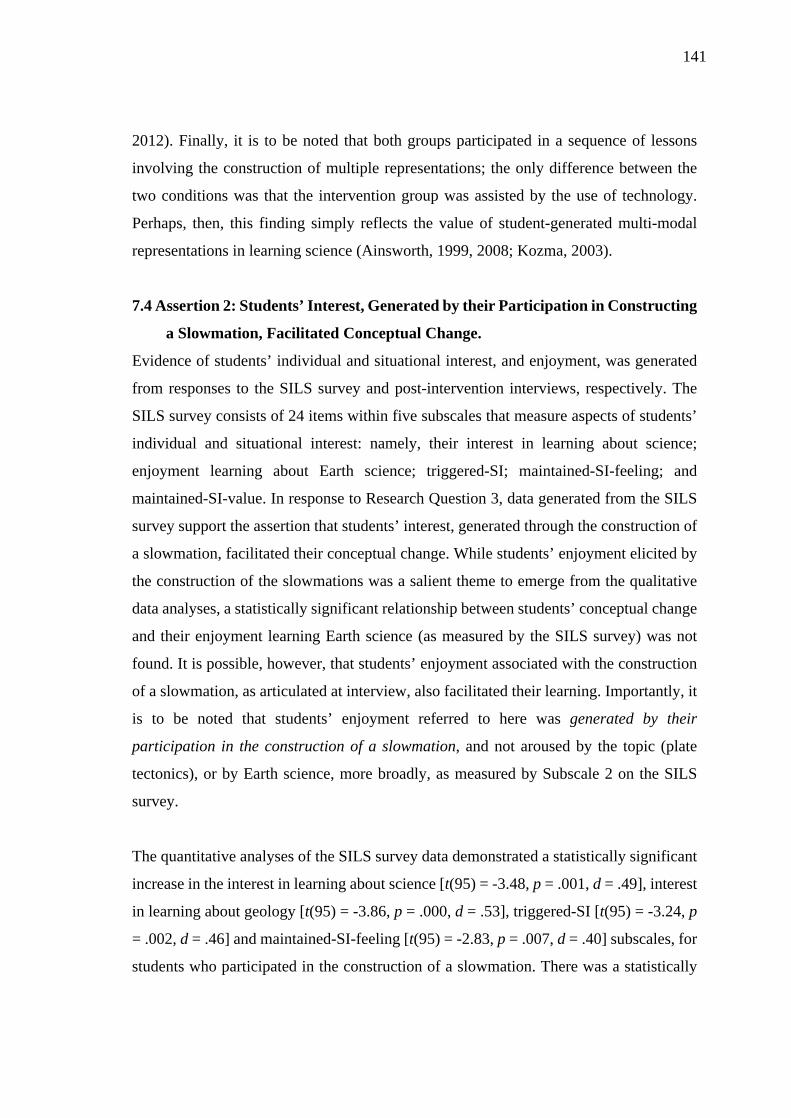
141
2012). Finally, it is to be noted that both groups participated in a sequence of lessons
involving the construction of multiple representations; the only difference between the
two conditions was that the intervention group was assisted by the use of technology.
Perhaps, then, this finding simply reflects the value of student-generated multi-modal
representations in learning science (Ainsworth, 1999, 2008; Kozma, 2003).
7.4 Assertion 2: Students’ Interest, Generated by their Participation in Constructing
a Slowmation, Facilitated Conceptual Change.
Evidence of students’ individual and situational interest, and enjoyment, was generated
from responses to the SILS survey and post-intervention interviews, respectively. The
SILS survey consists of 24 items within five subscales that measure aspects of students’
individual and situational interest: namely, their interest in learning about science;
enjoyment learning about Earth science; triggered-SI; maintained-SI-feeling; and
maintained-SI-value. In response to Research Question 3, data generated from the SILS
survey support the assertion that students’ interest, generated through the construction of
a slowmation, facilitated their conceptual change. While students’ enjoyment elicited by
the construction of the slowmations was a salient theme to emerge from the qualitative
data analyses, a statistically significant relationship between students’ conceptual change
and their enjoyment learning Earth science (as measured by the SILS survey) was not
found. It is possible, however, that students’ enjoyment associated with the construction
of a slowmation, as articulated at interview, also facilitated their learning. Importantly, it
is to be noted that students’ enjoyment referred to here was generated by their
participation in the construction of a slowmation, and not aroused by the topic (plate
tectonics), or by Earth science, more broadly, as measured by Subscale 2 on the SILS
survey.
The quantitative analyses of the SILS survey data demonstrated a statistically significant
increase in the interest in learning about science [t(95) = -3.48, p = .001, d = .49], interest
in learning about geology [t(95) = -3.86, p = .000, d = .53], triggered-SI [t(95) = -3.24, p
= .002, d = .46] and maintained-SI-feeling [t(95) = -2.83, p = .007, d = .40] subscales, for
students who participated in the construction of a slowmation. There was a statistically
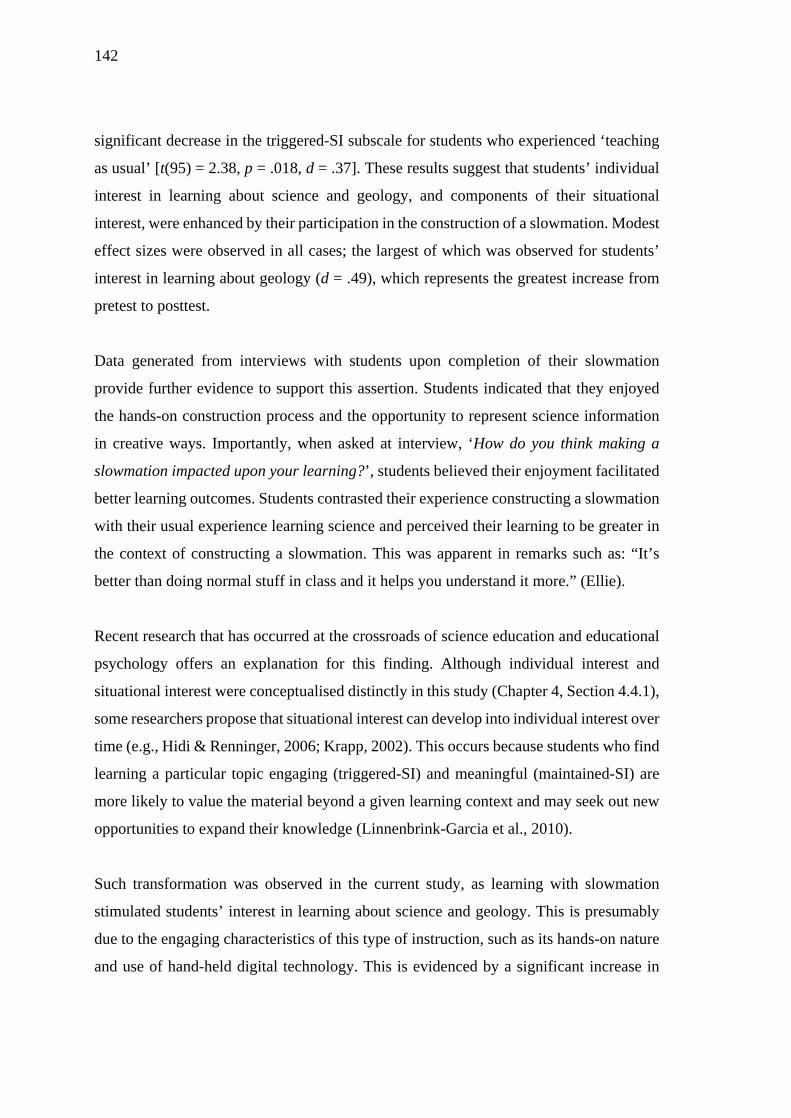
142
significant decrease in the triggered-SI subscale for students who experienced ‘teaching
as usual’ [t(95) = 2.38, p = .018, d = .37]. These results suggest that students’ individual
interest in learning about science and geology, and components of their situational
interest, were enhanced by their participation in the construction of a slowmation. Modest
effect sizes were observed in all cases; the largest of which was observed for students’
interest in learning about geology (d = .49), which represents the greatest increase from
pretest to posttest.
Data generated from interviews with students upon completion of their slowmation
provide further evidence to support this assertion. Students indicated that they enjoyed
the hands-on construction process and the opportunity to represent science information
in creative ways. Importantly, when asked at interview, ‘How do you think making a
slowmation impacted upon your learning?’, students believed their enjoyment facilitated
better learning outcomes. Students contrasted their experience constructing a slowmation
with their usual experience learning science and perceived their learning to be greater in
the context of constructing a slowmation. This was apparent in remarks such as: “It’s
better than doing normal stuff in class and it helps you understand it more.” (Ellie).
Recent research that has occurred at the crossroads of science education and educational
psychology offers an explanation for this finding. Although individual interest and
situational interest were conceptualised distinctly in this study (Chapter 4, Section 4.4.1),
some researchers propose that situational interest can develop into individual interest over
time (e.g., Hidi & Renninger, 2006; Krapp, 2002). This occurs because students who find
learning a particular topic engaging (triggered-SI) and meaningful (maintained-SI) are
more likely to value the material beyond a given learning context and may seek out new
opportunities to expand their knowledge (Linnenbrink-Garcia et al., 2010).
Such transformation was observed in the current study, as learning with slowmation
stimulated students’ interest in learning about science and geology. This is presumably
due to the engaging characteristics of this type of instruction, such as its hands-on nature
and use of hand-held digital technology. This is evidenced by a significant increase in
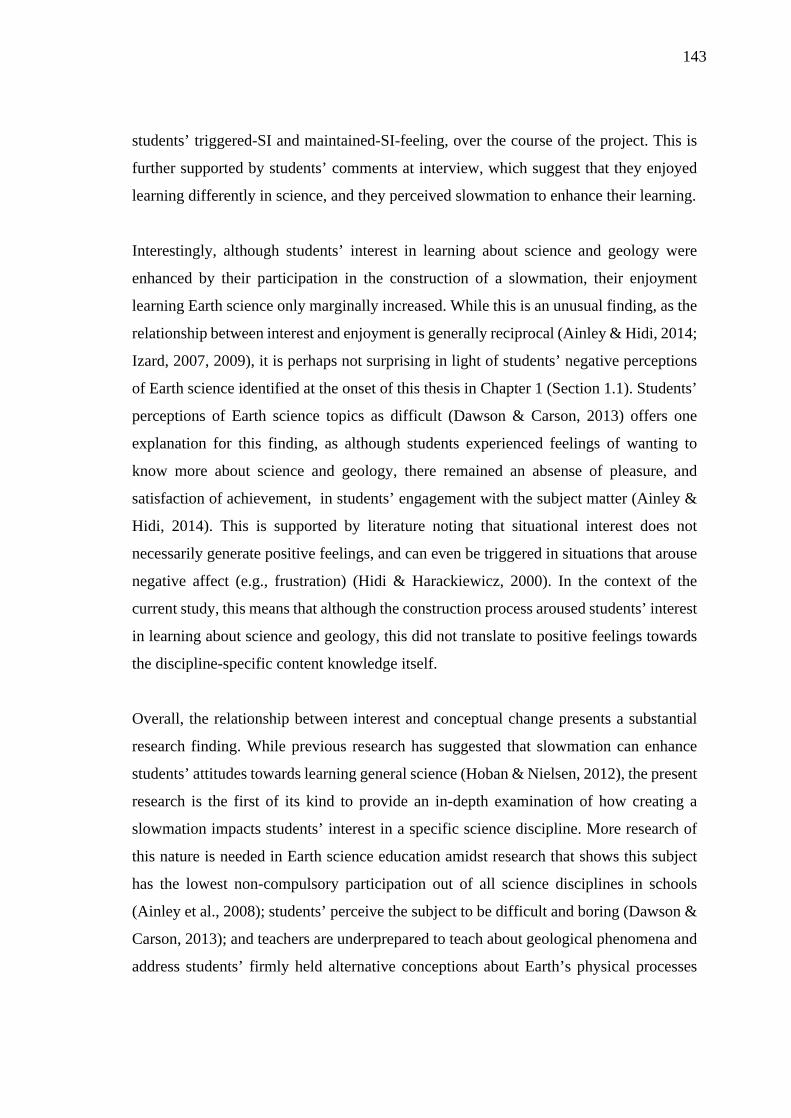
143
students’ triggered-SI and maintained-SI-feeling, over the course of the project. This is
further supported by students’ comments at interview, which suggest that they enjoyed
learning differently in science, and they perceived slowmation to enhance their learning.
Interestingly, although students’ interest in learning about science and geology were
enhanced by their participation in the construction of a slowmation, their enjoyment
learning Earth science only marginally increased. While this is an unusual finding, as the
relationship between interest and enjoyment is generally reciprocal (Ainley & Hidi, 2014;
Izard, 2007, 2009), it is perhaps not surprising in light of students’ negative perceptions
of Earth science identified at the onset of this thesis in Chapter 1 (Section 1.1). Students’
perceptions of Earth science topics as difficult (Dawson & Carson, 2013) offers one
explanation for this finding, as although students experienced feelings of wanting to
know more about science and geology, there remained an absense of pleasure, and
satisfaction of achievement, in students’ engagement with the subject matter (Ainley &
Hidi, 2014). This is supported by literature noting that situational interest does not
necessarily generate positive feelings, and can even be triggered in situations that arouse
negative affect (e.g., frustration) (Hidi & Harackiewicz, 2000). In the context of the
current study, this means that although the construction process aroused students’ interest
in learning about science and geology, this did not translate to positive feelings towards
the discipline-specific content knowledge itself.
Overall, the relationship between interest and conceptual change presents a substantial
research finding. While previous research has suggested that slowmation can enhance
students’ attitudes towards learning general science (Hoban & Nielsen, 2012), the present
research is the first of its kind to provide an in-depth examination of how creating a
slowmation impacts students’ interest in a specific science discipline. More research of
this nature is needed in Earth science education amidst research that shows this subject
has the lowest non-compulsory participation out of all science disciplines in schools
(Ainley et al., 2008); students’ perceive the subject to be difficult and boring (Dawson &
Carson, 2013); and teachers are underprepared to teach about geological phenomena and
address students’ firmly held alternative conceptions about Earth’s physical processes
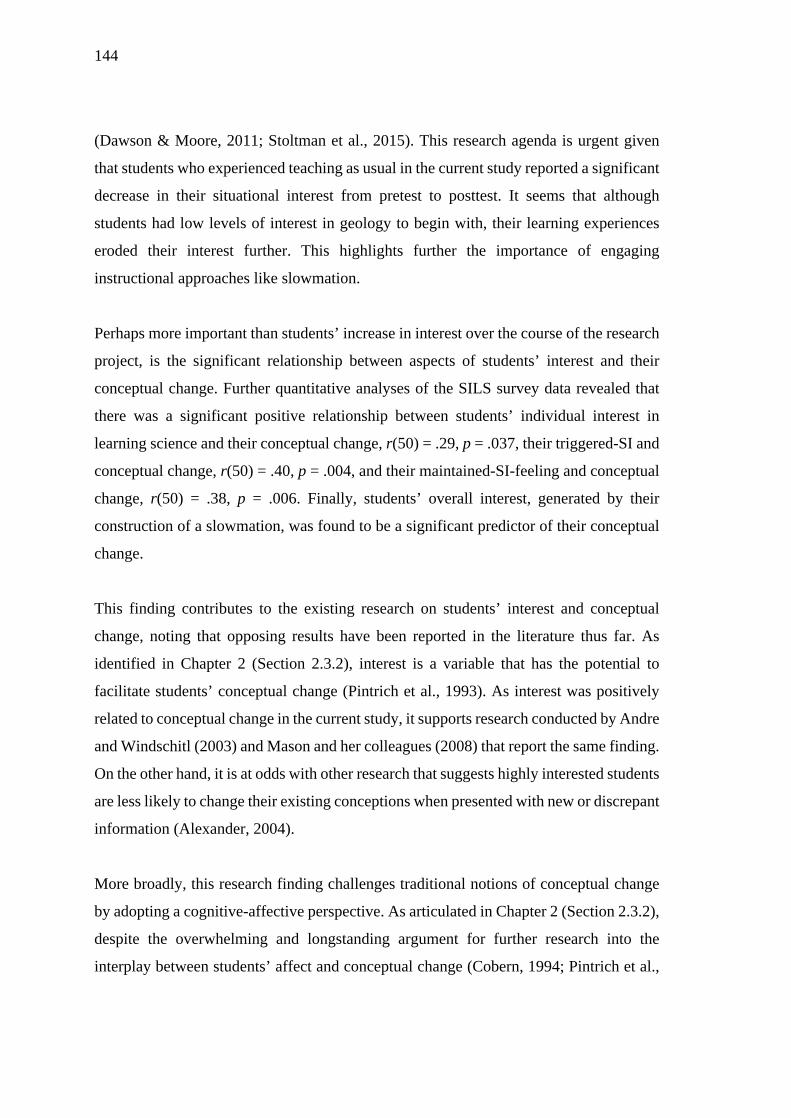
144
(Dawson & Moore, 2011; Stoltman et al., 2015). This research agenda is urgent given
that students who experienced teaching as usual in the current study reported a significant
decrease in their situational interest from pretest to posttest. It seems that although
students had low levels of interest in geology to begin with, their learning experiences
eroded their interest further. This highlights further the importance of engaging
instructional approaches like slowmation.
Perhaps more important than students’ increase in interest over the course of the research
project, is the significant relationship between aspects of students’ interest and their
conceptual change. Further quantitative analyses of the SILS survey data revealed that
there was a significant positive relationship between students’ individual interest in
learning science and their conceptual change, r(50) = .29, p = .037, their triggered-SI and
conceptual change, r(50) = .40, p = .004, and their maintained-SI-feeling and conceptual
change, r(50) = .38, p = .006. Finally, students’ overall interest, generated by their
construction of a slowmation, was found to be a significant predictor of their conceptual
change.
This finding contributes to the existing research on students’ interest and conceptual
change, noting that opposing results have been reported in the literature thus far. As
identified in Chapter 2 (Section 2.3.2), interest is a variable that has the potential to
facilitate students’ conceptual change (Pintrich et al., 1993). As interest was positively
related to conceptual change in the current study, it supports research conducted by Andre
and Windschitl (2003) and Mason and her colleagues (2008) that report the same finding.
On the other hand, it is at odds with other research that suggests highly interested students
are less likely to change their existing conceptions when presented with new or discrepant
information (Alexander, 2004).
More broadly, this research finding challenges traditional notions of conceptual change
by adopting a cognitive-affective perspective. As articulated in Chapter 2 (Section 2.3.2),
despite the overwhelming and longstanding argument for further research into the
interplay between students’ affect and conceptual change (Cobern, 1994; Pintrich et al.,
145
1993; Sinatra & Mason, 2013; Treagust & Duit, 2008; Tytler & Prain, 2010; West &
Pines, 1983; Zembylas, 2005), there are very few studies in Earth science that have
adopted this perspective (Mills et al., 2016). Adopting an affective perspective of
conceptual change, by investigating the relationship between students’ interest in learning
science and their conceptual change, is significant as it challenges the assumption that
affective variables like interest are irrelevant to learning in a cognitively demanding
discipline such as science (Zembylas, 2005).
7.5 Assertion 3: Pedagogical Considerations Warrant the Development of a
Framework to Inform the use of Slowmation with School-Aged Learners.
As already indicated, there are many studies that investigate the value of slowmation for
pre-service teachers’ learning in science. While all of these studies advocate for the use
of slowmation in teacher education courses, some also recommend the use of this
instructional approach with school-aged learners. Moreover, a recent study by Paige,
Bentley and Dobson (2016) reports that pre-service teachers are highly likely to
implement slowmation in their future science classroom after learning about it at
university. In light of the pedagogical implications presented in the previous chapter, and
the lack of empirical research conducted in school contexts, these reports elicit some
concern, and further consideration of how school-aged students learn with slowmation is
needed.
Section 7.3 of this chapter described major differences in the way pre-service teachers
and school-aged students learn with slowmation. While the translation of information
between representations and pre-service teachers’ cogenerative discussions have been
linked to conceptual change (e.g., Hoban & Nielsen, 2014; Nielsen & Hoban, 2015), this
was not observed in the current study; instead, a range of pedagogical issues appeared to
inhibit opportunities for conceptual change. Specifically, students in the current study
were preoccupied with the procedural aspects of constructing a slowmation; lacked
motivation to understand the science content and represent it accurately; privileged and
bypassed modes of representation in the construction stage; and did not have time to
properly complete their slowmation due to the time consuming nature of the stop-motion
146
animation process (Chapter 6, Section 6.4). While some of these outcomes may stem from
the task worksheet, with its focus on procedures and transposition of information from
the Internet (Figure 3.3), these pedagogical issues proved to be a particularly pervasive
theme that arose during data analysis, and as such, they raise questions about the adequacy
of current learning frameworks that inform teachers’ enactment of slowmation in the
classroom (e.g., the 5Rs model; Hoban & Nielsen, 2010).
In the current study, the procedural aspects of constructing a slowmation dominated
students’ conversations during the project. Students focused their attention on design
elements such as the colour, size, sequence and timing of their slowmation. Interestingly,
there was no evidence that students’ preoccupation with procedural aspects was indicative
of learning (e.g., using different colours to represent different layers of the Earth). This
finding is epitomised in the comments made by one student during his post-intervention
interview, where he indicated that he learnt a lot about “animation techniques” (Trevor).
This finding is consistent with other research that found that secondary school students
were more concerned with the design of the representations in their slowmation, rather
than the scientific processes the students were representing (Kidman & Hoban, 2009).
It was also found that students privileged or entirely bypassed modes of representation
during the modeling stage. While students privileged ‘easy’ modes of representation
(namely, narration and text [definitions and dot point summaries]), they chose not to use
other more cognitively demanding ones, such as three dimensional physical models. As
a result, there were fewer opportunities for students to develop their conceptual
understanding.
Together, these findings suggest that before they construct a slowmation, students require
some level of representational competence beyond constructing a practise slowmation
(Chapter 3, Section 3.4.1). Researchers have identified the crucial role of representational
competence in developing conceptual learning (e.g., diSessa, 2004; Lehrer & Schauble,
2006a, 2006b; Lemke, 2003, 2004). As noted by Lemke (2003), drawing on Peirce (1931-
1958), this competence is about knowing how to interpret and construct links between an
147
object, its representation (whether concrete, visual or symbolic) and its meaning. This
means that students need to understand the ‘partial’ nature of representations, and that
generating an explanatory account involves coordinating various representations, each
bringing a complementary perspective (Prain & Tytler, 2012). It is argued here that
building students’ representational competence, therefore, is a necessary prerequisite for
the construction of a slowmation. Representational competence could be taught explicitly
during one or more science lessons, or be embedded in prior learning experiences
throughout the school year or other key learning areas (e.g., Technologies). To achieve
this, teachers should mediate discussions, critiques and evaluations of the use of
representations (Tippett, 2016; Waldrip, Prain, & Carolan, 2010). Building students’
representational competence could alleviate students’ preoccupation with the procedural
aspects of constructing a slowmation, as one would expect that their design decisions
would be more informed and purposeful.
Throughout the construction process, students in the current study demonstrated waning
motivation to understand the science content and represent it accurately. Instead, they
were concerned with the aesthetics of their slowmation and ensuring it would be
entertaining for their peers. This was evident in statements such as ‘We just want it [their
slowmation] to be fun!’. There also seemed to be a sense of complacency among students,
evidenced in remarks like, ‘It [the slowmation] doesn’t need to be perfect’ and ‘It’s good
enough!’. These comments suggest that students did not value the accuracy or precision
of their slowmations highly. It is possible that this was because their final product was
not being assessed or used for reporting purposes. These findings raise questions about
the purpose of using slowmation in the science classroom, and support the suggestion
offered by other researchers that it could be used as an assessment tool to make judgments
about students’ learning (Brown, 2013; Jablonski et al., 2015). This would support
students to stay focused on accurately representing the desired science content.
Students’ lack of motivation to understand the science content appeared to be due, in part,
to the self-directed nature of the research that they undertook prior to constructing a
slowmation, as prescribed by the task worksheet (Figure 3.3). As students found locating
148
and comprehending information a challenging task, it is likely to have impeded their
willingness to come to understand the information. This is not an isolated finding, as the
junior secondary school students in Jablonski and his colleague’s (2015) study reported
that conducting research was the part of the slowmation construction process that students
enjoyed least, indicating that they also found independently locating and comprehending
information challenging. This suggests that the self-directed research task during the
planning phase needs to be adapted for junior secondary school students. This could be
achieved by incorporating teacher explanation into this phase. In addition to reducing the
complexity of the task, this would also prevent students from consulting inaccurate
representations on the Internet that reinforce further their alterative conceptions (King,
2010).
Finally, time constraints led students to rush the construction of their slowmations, which
compromised the quality of the final product, and presumably, opportunities for
conceptual change to occur. Students in the current study felt that constructing a
slowmation “took way too long”. They found the stop-motion aspect of slowmation the
most time consuming and, as such, they avoided representing information in this manner.
Interestingly, time constraints have been identified as an issue in some studies undertaken
with school-aged students (e.g., Hoban et al., 2007), but not in others (e.g., Jablonski et
al., 2015). This seems to be due to the contrasting pedagogical purposes for the use of
slowmation in science. Based upon a number of the constraints outlined in this section, it
appears that setting out to construct a ‘polished’ explanatory resource is not the most
effective purpose for constructing slowmation with school-aged learners; rather,
slowmation could be used as a learning and discussion tool to probe students’ developing
understandings during construction, and to identify and resolve students’ alternative
conceptions (Kidman et al., 2012).
In summary, despite the teachable moments afforded by the construction process, it
appears that the use of slowmation in the current study was only as effective as the
pedagogy that supported its implementation. This highlights the need for a pedagogical
149
framework for the use of slowmation with school-aged students. The next section will
describe a framework that responds to this need.
7.6 Towards a Framework for Learning with Slowmation
Previous research has given little attention to the pedagogy that might accompany the use
of slowmation in school classrooms, as is often the case with innovative approaches to
student learning (Jonassen, Peck, & Wilson, 1999). While there are frameworks that
describe how learning takes place throughout the construction process, there needs to be
a more thorough consideration of how slowmation is actually enacted, particularly in a
junior secondary school context, and the vital role of the teacher in facilitating a
constructivist-oriented classroom and establishing a learning environment conducive to
conceptual change. Although it is beyond the scope of this thesis to fully develop and test
a complete pedagogical framework, some lessons learned from the current study have
been organised into an initial, tentative framework, the LWS framework, which is now
described.
As students in the current study were not accustomed to learning in the way that was
required, the LWS framework is situated in a constructivist learning environment. Based
upon a broad view of the pedagogical considerations outlined in the preceding subsection,
it is necessary for both the teacher and students to view learning as an active process of
knowledge construction and reconstruction if slowmation is to bring about students’
conceptual change. In doing so, the teacher and students must be aware of, and familiar
with, their role in the learning process. For the teacher, this entails eliciting students’ pre-
instructional ideas, providing opportunities for students’ to experience new phenomena,
and facilitating group and whole-class discussions (Harlen, 2009). For students, this
entails discussing their own and others’ ideas, using their ideas to try to understand new
phenomena, modifying their ideas in light of their experiences, and developing ‘bigger’
ideas from ‘smaller’ ones (Harlen, 2009).
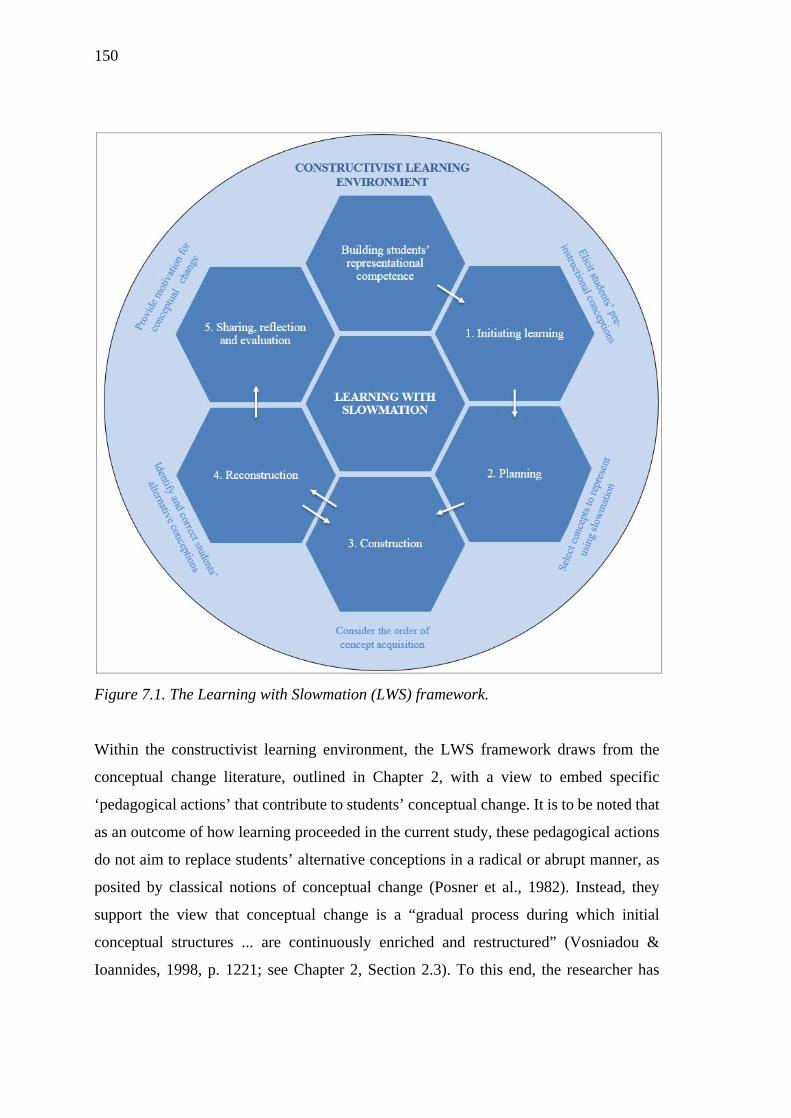
150
Figure 7.1. The Learning with Slowmation (LWS) framework.
Within the constructivist learning environment, the LWS framework draws from the
conceptual change literature, outlined in Chapter 2, with a view to embed specific
‘pedagogical actions’ that contribute to students’ conceptual change. It is to be noted that
as an outcome of how learning proceeded in the current study, these pedagogical actions
do not aim to replace students’ alternative conceptions in a radical or abrupt manner, as
posited by classical notions of conceptual change (Posner et al., 1982). Instead, they
support the view that conceptual change is a “gradual process during which initial
conceptual structures ... are continuously enriched and restructured” (Vosniadou &
Ioannides, 1998, p. 1221; see Chapter 2, Section 2.3). To this end, the researcher has
151
emphasised the role of the classroom teacher in: (1) eliciting students’ pre-instructional
conceptions; (2) selecting only few, key concepts to be represented using slowmation; (3)
ordering concept acquisition (recall that in the current study students in the intervention
group did not come to understand the geologic mechanisms driving plate tectonics, and
later had difficulty coming to understand the formation of landforms at tectonic plate
boundaries); (4) providing repeated knowledge enrichments by identifying and correcting
students’ alternative conceptions; and (5) establishing a motivating learning environment
that arouses students’ interest in learning about science (Vosniadou, Ioannides,
Dimitrakopoulou, & Papademetriou, 2001). It is to be noted that these pedagogical
actions do not strictly correspond with any given stage of the construction process, despite
their positioning in the diagram.
The LWS framework itself has stages based upon the slowmation construction process
identified in research conducted with pre-service teachers (Loughran, et al., 2012) and
further informed by the pedagogical issues that arose in the current study. The stages of
slowmation construction were adapted with a view to develop better students’
representational competence, and to incorporate instruction about the science concept or
process to be represented. Furthermore, the LWS framework acknowledges that students’
representations are ‘approximations’ (Prain & Tytler, 2012), and therefore views
slowmation as a learning tool rather than a means to construct a polished explanatory
resource. This is demonstrated by the addition of a reflection stage, whereby students are
able to share their slowmation with their peers and evaluate its explanatory adequacy. The
six stages of the LWS framework, therefore, are as follows:
Building students’ representational competence. This stage of the framework,
which precedes the formal construction stages, ensures that students have previous
experience in the design and evaluation of multi-modal representations of science
phenomena, beyond a ‘one-off’ practise, as was undertaken in the current study.
This is necessary so that students’ procedural decisions throughout the
slowmation construction process are informed and purposeful. Representational
competence could be explicitly developed during science lessons prior to the
152
formal construction stages, or representation construction activities could be
embedded in prior learning experiences over the course of the school year.
Initiating learning. This stage of the construction process replaces independent
research, which appeared to inhibit students’ conceptual change in the current
study. There are a number of important elements in this stage. First, students must
be oriented towards the purpose of the slowmation construction task and
positioned as active constructors of knowledge. In keeping with the constructivist
perspective of learning adopted in this study, and the pedagogical actions
identified in the LWS framework, this stage should bring students’ existing
conceptions to the fore. This could be achieved by student brainstorming, teacher-
led questioning or the use of a diagnostic instrument such as the GeoQuiz.
Second, this stage should include one or more exploratory learning experiences
that introduce students to the key science concepts to be learned. Such learning
experiences should actively engage students in hands on or experiential learning,
and the teacher should facilitate students’ learning by helping them to test ideas
or link ideas from one experience to a related one (i.e., considering the order of
concept acquisition; Harlen, 2009; Vosniadou et al., 2001). This should be
followed by a teacher explanation of the science content, in order to establish a
common language between the teacher and students (Vosniadou et al., 2001).
Third, leading into the next stages, the teacher should make explicit the students’
role in the construction process, and emphasise the importance of translating
information between representations and utilising multiple modes of
representation when modeling phenomena. The teacher should also emphasise the
iterative nature of the planning, construction and reconstruction stages, and make
explicit his/her role in checking the scientific accuracy of students’
representations at each stage, and developing students’ scientific conceptions by
addressing knowledge gaps and misconceived knowledge.
Planning. During the planning stage, students create a storyboard that shows how
they will represent the science concept or process. This involves ‘chunking and
sequencing’ the information in frames so that it tells a story (Loughran et al.,
153
2012). Students should also record the materials they will use in the next
construction phase, and how the materials will be manipulated between each
frame to represent the science concept or process and give a stop-motion
animation effect.
Construction and Reconstruction. The construction and reconstruction stages in
the LWS framework involve the physical construction and reconstruction of
multiple representations. Notably, and most importantly due to the resilient nature
of students’ alternative conceptions, these stages are an iterative process, whereby
the teacher and students recursively check the accuracy and adequacy of each
representation (i.e., storyboard, models, still photographs and the final
slowmation), refining and enriching it if necessary. In doing so, students can again
be prompted to verbally question, seek evidence and make knowledge claims, to
enhance further their conceptual change through cogenerative discussion (Hoban
& Nielsen, 2012). These are important stages in the slowmation construction
process, as students’ conceptions are constructed and re-constructed alongside
their physical representations in an interdependent process of knowledge
enrichment. As this reconstruction requires substantial effort from students’, the
learning environment should motivate conceptual change by arousing students’
interest and enjoyment.
Sharing, reflection and evaluation. In the final sharing and reflection stage,
students’ learning is enhanced further as they view their peers’ slowmations and
evaluate the strengths and limitations of their representations in conversation with
the teacher (Prain & Tytler, 2012; Tippett, 2016; Waldrip et al., 2010). This stage
should again facilitate metaconceptual awareness through the use of diagnostic
assessment, with particular attention given to the resolution of any persisting
alternative conceptions (Hoban & Nielsen, 2012).
As a range of accounts about how students learn with multiple representations exist (e.g.,
Ainsworth, 2006; diSessa, 2004; Hubber, Tytler, & Haslam, 2010; Kozma, 2003; Prain
& Tytler, 2012; Tang, Delgado, & Moje, 2014), future iterations of the LWS framework
154
could be developed further if aspects from the representations and multiple
representations literature were incorporated into the framework. Of potential value to the
LWS framework is the Representational Construction Affordances framework (Prain &
Tytler, 2012) and the Design, Functions, Tasks framework (Ainsworth, 2006). These
suggestions are discussed further in the next chapter, which provides recommendations
for future research.
7.7 Limitations of the Research
Since experimental research is concerned with determining a cause-effect relationship, a
quasi-experimental (non-equivalent groups) design was most appropriate in the current
study. This means that the intervention and comparison groups involved in this research
project were sufficiently similar that comparisons could be made between them. This
approach, despite some limitations, is used extensively in science education research and
has previously been widely used to evaluate the effectiveness of conceptual change
instructional approaches in Earth science (Mills et al., 2016).
Numerous challenges face researchers conducting classroom-based causal effects studies.
In the current study, for instance, the random assignment of students to the intervention
or comparison condition was not feasible due to class timetabling constraints. Instead,
classes were randomly assigned to a condition, ensuring that each teacher involved in the
research project taught one intervention class and one comparison class (Randler &
Bogner, 2008). Although this research design controlled teacher-related variables to some
extent, ‘comparison group contamination’ (Taylor, Kowalski, Wilson, Getty, & Carlson,
2013) may have occurred. For example, the teachers may have used key elements from
the intervention when teaching the comparison classes (e.g., purposefully diagnosing
students’ alternative conceptions). This limitation was minimised by investigating
possible class teacher and gender interaction effects that may have influenced students’
GeoQuiz scores. No significant effects were found, which suggests that the research
project was implemented uniformly across the four science classes, and had a similar
impact on both boys and girls. This enhanced the validity of the assertions made about
students’ conceptual change and interest, based on the GeoQuiz and SILS survey results.
155
The mixed methods approach to data generation was another way that limitations
regarding the research design were addressed. Quantitative methods were used to
understand trends in the data, particularly with respect to students’ conceptual change, as
evidenced by their GeoQuiz scores, and their individual and situational interest in
learning about Earth science, as evidenced by the SILS survey scores. Qualitative data
were then used to gain a deeper understanding about the causal mechanisms underpinning
students’ conceptual change and change in interest, and to illuminate students’ experience
participating in the research project. Together, both quantitative and qualitative
techniques developed a more robust insight into the value of slowmation as a conceptual
change instructional approach than either approach would individually (Creswell, 2005).
As with much research bounded within a naturalistic setting, it is problematic to
generalise beyond the context from which the results emerged. To some extent, this
limitation was offset by providing detailed descriptions of the organisation of the study,
and methods and data generation and analysis in Chapter 3. This serves to enhance the
transferability of this study, or the extent to which its findings will be useful in other
similar contexts. These descriptions seek to assist the reader in making an informed
judgment about the transferability of the findings to their own particular context.
Developing the learning sequence for the intervention so that it was aligned closely to
‘teaching as usual’, presented a challenge in the current study. When conceptualising the
intervention and considering what questions would guide students’ independent research,
it was assumed that students would spend a comparable amount of time researching each
key question (Chapter 3, Section 3.4.1). Instead, students spent considerably more time
researching questions about the formation of landforms at tectonic plate boundaries, as
this was central to the topic of their slowmation. The implication of this was that the
students in the comparison group had explicit instruction about the cause of tectonic plate
movement; specifically, they participated in a hands-on experiment that demonstrated
how heat causes convection. Students in the intervention group, on the other hand, glossed
over this content knowledge. This reduced the comparability between conditions and is a
156
possible explanation as to why students in the comparison group outperformed students
in the intervention group, for questions on the GeoQuiz relating to the nature and
movement of tectonic plates.
Although the GeoQuiz was intended to be unbiased to both the intervention and
comparison conditions, the researcher was responsible for its construction. As such, there
is a possibility that an unintentional bias influenced the findings of the research project
(Taylor et al., 2013). The only way to mitigate against unintentional experimental bias is
to have a third-party construct the relevant instrumentation. This was not feasible in the
current research project, in meeting the requirements of the higher research degree sought
(nor desirable, since a third-party would not be intimately familiar with the intervention
and be able to design an instrument sensitive to students’ conceptual change); therefore,
this potential limitation was unavoidable.
In the current study, students’ thinking aloud while they constructed their slowmation
was one source of data used to investigate their conceptual change. Although the
researcher taught the students how to verbalise their thinking prior to their involvement
in the research project, it seems that this was a difficult task for the students to master in
the given time. A number of rather pervasive themes arose from the analysis of the think-
aloud data, and each indicated that students’ dialogue was not focused on learning, but
rather the design aspects of making a slowmation, and whether the slowmation was ‘fun’
or ‘entertaining’. In part, this may have contributed to the lack of recorded instances
where conceptual change (i.e., the complete replacement or modification of an existing
conception) took place. In summary, while it can be assumed that conceptual change did
occur, as evidenced by the results of the GeoQuiz, these instances were not captured by
the think-aloud data due to the students’ limited ability to verbalise their change in
thinking, and the likelihood that their focus was consumed by the demands of the task at
hand.
157
7.8 Implications of the Research
The current study extends national and international research that investigates conceptual
change instructional approaches in Earth science. The results presented and discussed in
this and preceding chapters (i.e., Chapters 5 and 6) suggest that students’ participation in
the construction of a slowmation led to statistically significant conceptual change, and
enhanced their interest in learning about Earth science. There was a statistically
significant relationship between these two constructs, as students’ interest generated by
their participation in the construction of a slowmation facilitated their conceptual change.
As a culmination of the discussion thus far, the following subsections present the
implications of these findings for curricular design and educational theory.
7.8.1 Implications for curricular design and implementation
The results of the current study support existing research into the affordances of student-
generated animation for learning in science; namely, the value of the slowmation
construction process for bringing about conceptual change. Although the slowmation
construction process is well researched in pre-service teacher education contexts (Hoban
et al., 2011; Hoban & Nielsen, 2012, 2013, 2014; Nielsen & Hoban, 2015), there is an
absence of studies that have investigated its use with school-aged students (Brown et al.,
2013; Hoban et al., 2007; Jablonski et al., 2015; Kidman & Hoban, 2009). The significant
increase in students’ GeoQuiz and SILS survey scores arising from this study provide an
argument for the inclusion of slowmation in the junior secondary science classroom. The
following implications for learning with slowmation are offered:
1. Slowmation can complement current enactment of the curriculum with a
comparable amount of learning. In the current study, students in both condition
groups (intervention and comparison) had a significant increase in their GeoQuiz
scores, from pretest to posttest. This means that learning with slowmation can
complement ‘teaching as usual’. Given that students thoroughly enjoyed the
opportunity to learn ‘differently’ in science, as constructing a slowmation was
creative, hands-on, and engaged students in the use of digital technologies, this
recommendation seems particularly warranted. This finding also responds to
158
concerns that teachers are underprepared to teach students about Earth’s physical
systems (Dawson & Moore, 2011; Lane, 2015). Slowmation can be one of several
approaches used to engage students in Earth science and enhance their conceptual
change, provided that it is enacted in a well-considered manner.
2. Slowmation can be used as a learning tool to diagnose and resolve students’
alternative conceptions. As discussed in Section 7.3, students in the current study
successfully represented the formation of landforms at tectonic plate boundaries
in their slowmation. To do so, students translated information between multiple
representations in a semiotic progression (Hoban et al., 2011). The recursive
checking of information throughout this process afforded the teacher
opportunities to diagnose and resolve students’ alterative conceptions, which in
turn led to conceptual change. As such, slowmation should be used as a learning
tool in the science classroom, rather than a means to produce a polished
explanatory resource. This may also alleviate the time constraints experienced by
students, as they would not rush to complete their slowmation.
3. Slowmation can be used with a view to significantly enhance students’ interest in
learning about science. Several issues impacting the quality of Earth science
education in Australia were identified at the onset of this thesis. One of these
issues was students’ disengagement with Earth science and their perception of the
subject as difficult and boring (Dawson & Carson, 2013). The findings of this
study support the use of slowmation for learning Earth science, as it enhanced
students’ conceptual development and interest.
4. Slowmation should be enacted within an established constructivist learning
environment. Informed by the pedagogical considerations that arose in the current
study, the value of the slowmation construction process is dependent upon the
teacher and students’ view of learning, which should align with constructivist
principles. To enhance further opportunities for students’ conceptual change,
learning should be viewed as an active process of knowledge construction and
159
reconstruction, rather than a passive accumulation of knowledge. Both the teacher
and students must be aware of, and familiar with, their roles in this type of learning
environment, and the teacher should employ specific pedagogical actions to
facilitate students’ conceptual change (Harlen, 2009; Vosniadou et al., 2001).
5. Representational competence is an important precursor to learning with
slowmation. As discussed in Section 7.6, the LWS framework could inform the
use of slowmation in the junior secondary science classroom. Ensuring that
students have a moderate level of representational competence before they begin
constructing a slowmation is a crucial dimension of the framework. This could
mitigate students’ preoccupation with the design of their representations, and their
tendency to frivolously privilege and bypass modes of representation when
modeling scientific phenomena.
6. Students should be prompted to evaluate the explanatory adequacy of their
slowmation after its construction. Another crucial dimension of the LWS
framework is the sharing and reflecting phase. Like the findings that arose from
the current study, existing research has demonstrated that school students find
translating information between representations to be a highly complex task
(Ainsworth, 2006; Prain & Waldrip, 2006). It is important, therefore, that students
are encouraged to construct ‘approximations’ (i.e., non-expert representations),
and share the reasoning behind their design choices with their peers. This would
support students’ developing representational competence, but also support the
assertion that such reasoning is what leads to quality learning with representations
(Prain & Tytler, 2012).
7.8.2 Implications for educational theory
The results of the current study make a number of major contributions to educational
theory. The nature of the research questions, which are very different to each other, means
that the current study has significance to multiple fields of education. In particular, this
research extends conceptual change research in Earth science education, specifically of
160
geological phenomena; challenges traditional cognition-only notions of knowledge
restructuring; and contributes to research that investigates the value of constructing
multiple representations of science phenomena through student-generated slowmation.
Further contributions of this thesis to educational theory are a systematic literature review
on conceptual change instructional approaches in Earth science; the development and
validation of a two-tiered diagnostic test instrument (i.e., the GeoQuiz); and the
development of a tentative pedagogical framework for engaging school-aged learners
with slowmation. Each of these major contributions will now be discussed briefly:
1. Extends conceptual change research in Earth science education, specifically
about geological phenomena. At the onset of this thesis, it was described that
students come to science classes with pre-instructional alternative conceptions
that need to be better aligned with accepted scientific concepts through instruction
(Ausubel, 1968; Driver & Oldham, 1986; Osborne & Freyberg, 1985; Osborne &
Wittrock, 1985; Vosniadou & Brewer, 1987). While there is much evidence in the
literature to suggest that students hold alternative conceptions about geological
phenomena, including plate tectonics, there is a paucity of intervention studies
aimed specifically at correcting these ideas (Cheek, 2010; Francek, 2013; King,
2008; Lelliott & Rollnick, 2010; Mills et al., 2016). Therefore, as articulated in
Chapter 2, there is a need for research that evaluates the effectiveness of
conceptual change instructional approaches in Earth science education. The
findings of the current study address this gap in the literature, demonstrating that
the slowmation construction process facilitates students’ conceptual change. This
is evidenced by a significant increase in the intervention group’s GeoQuiz scores,
from pretest to posttest, and the teachable moments generated by students’
recursive checking of science information with the teacher.
2. Challenges traditional notions of knowledge restructuring by adopting a
cognitive-affective perspective of conceptual change. As described in Chapter 2,
conceptual change served as the theoretical framework for this study, as it remains
a dominant framework regarding the development of students’ naïve ideas (Duit
161
& Treagust, 2013; Treagust & Duit, 2008). The current study, in part, sought to
challenge traditional notions of conceptual change by investigating the
relationship between students’ interest and conceptual change. The positive
relationship arising in the present study makes a significant contribution to theory.
As mentioned in Chapter 2, the CRKM (Dole & Sinatra, 1998) is one of very few
cognitive-affective conceptual change models. It describes the interaction
between a learner’s ‘characteristics’ and a new concept and pays particular
attention to the influence of motivational variables, including interest, on
conceptual change. Notwithstanding the contribution of the CRKM to conceptual
change research, in the decade since its publication, it is yet to be tested and
validated by empirical research. Only one recent study has embarked on this
agenda, providing evidence that students’ need for cognition (i.e., the tendency to
engage in and enjoy effortful cognitive activities), goal orientation, and
motivation predicted students’ conceptual change (Taasoobshirazi & Sinatra,
2011). The findings of the current study contribute to the validation of the CRKM
by providing evidence that, for the students in this study, interest (both individual
and situational) is a significant predictor of conceptual change. Other constructs
from the CRKM such as self-efficacy, or new constructs that have been researched
in science education such as emotion, could be tested and validated in the future
with the aim of developing a more complete and contemporary cognitive-affective
model of conceptual change.
3. Contributes to research that investigates the value of constructing multiple
representations of science phenomena through student-generated animation. A
review of the literature on the learning potential of student-generated animations,
presented in Chapter 2, revealed a paucity of research in this field. A number of
studies noted the educational value of students creating animations in Chemistry
(Schank & Kozma, 2002; Stieff & Wilensky, 2003; Wilder & Brinkerhoff, 2007;
Wu et al., 2001), while another has examined the educational value of creating
animations in Mathematics (Hubscher-Younger & Hari Narayanan, 2008). In all
of these studies, students used specially designed animation software. Student-
162
generated animations that do not require specially designed software, such as
slowmation, have been researched more recently in pre-service teacher education;
however, there remains the need to investigate “how learners in different contexts
… make multimodal animations to represent science concepts” (Hoban et al.,
2011, p. 1004). The findings of the current study, therefore, respond to this need,
and also to the broader need for research on effective conceptual change
instructional approaches (Treagust & Duit, 2008). As discussed in the previous
subsection, the findings of the current study have substantial implications for
science teachers and teacher educators, which are crucial to narrowing the theory-
practice gap in relation to conceptual change research (Treagust & Duit, 2008).
4. Establishes the need for conceptual change instructional approaches in the Earth
science discipline through a systematic review of the literature. Chapter 2
presented a systematic literature review of conceptual change instructional
approaches used in the Earth and space science disciplines. In total, 52 studies
were identified and analysed. The analysis focused on the general characteristics
of the research, the conceptual change instructional approaches that were used,
and the methods employed to evaluate their effectiveness. This literature review
presents a significant contribution to the existing body of research in this field, as
it integrates findings from multiple approaches and contexts, and makes
recommendations for future research.
5. Contributes a two-tiered diagnostic instrument, the GeoQuiz, which measures
students’ alternative conceptions about plate tectonics. The current study used a
two-tiered multiple-choice test in order to evaluate students’ conceptions pre- and
post-intervention. As there were no existing test instruments relevant to the
science concepts underpinning the Changing Earth unit of work, the researcher
developed and validated the GeoQuiz. The contribution of the GeoQuiz to
existing diagnostic test instruments is significant given that appropriate
assessment tools have to be readily available for use by classroom teachers in
order to facilitate students’ understanding of scientific concepts and gauge the
163
effectiveness of classroom instruction (Treagust, 2006). The GeoQuiz is currently
the only two-tiered diagnostic test instrument to assess geological concepts
relevant to the Earth science discipline (see Treagust, 2006).
6. Contributes a tentative pedagogical framework to support the use of slowmation,
or other representation construction activities, with school-aged learners. A
number of pedagogical issues that appeared to inhibit opportunities for students’
conceptual change were discussed in Section 7.5. The prevalence of these issues
indicates that a pedagogical framework is required to inform teachers and teacher
educators about how to best use slowmation with school students. This thesis
presented a tentative pedagogical framework, the LWS framework, in Section 7.6.
While this framework is specific to the slowmation construction process, its
applicability could be extended to other representation construction activities,
including those that require the use of technology. As discussed, this framework
situates the construction process in a constructivist learning environment and
promotes conceptual change by emphasising the teacher’s role in learning as
students physically and cognitively construct and reconstruct their existing ideas.
Furthermore, the framework adapts the stages of slowmation construction from
pre-service teacher education contexts to develop better school students’
representational competence, and to incorporate instruction about the science
concept or process to be represented. In addition, the LWS framework
acknowledges that students’ representations are ‘approximations’ (Prain & Tytler,
2012), and therefore views slowmation as a learning tool rather than a means to
construct a polished explanatory resource. This is demonstrated by the addition of
a reflection stage, whereby students are able to share their slowmation with their
peers and evaluate its explanatory adequacy.
7.9 Chapter Conclusion
This chapter has discussed the results presented in earlier chapters, the implications of
the findings for curricular design and implementation, and educational theory, and the
limitations of the study. Three assertions were synthesised from the results of the
164
quantitative and qualitative data generated in this study, in response to the research
questions: the construction of a slowmation significantly enhanced students’ conceptual
change as it afforded teachable moments; students’ interest and enjoyment, generated by
their participation in constructing a slowmation, facilitated conceptual change; and
pedagogical considerations warrant the development of a learning framework to inform
the use of slowmation with school-aged learners.
Overall, this study has made a significant contribution to educational theory and practice.
In regards to Research Questions 1 and 2, it was found that students’ participation in the
construction of a slowmation significantly enhanced their conceptual change, as it
provided teachable moments wherein students’ alternative conceptions were identified
and corrected by the teacher. This finding complements existing research that
demonstrates the positive impact of slowmation on students’ learning. In contrast to
existing research, however, the teacher played a crucial role in facilitating students’
conceptual change. Rather than students’ conceptual change arising from the construction
of multiple representations or cogenerative discussion amongst themselves, which has
been reported in pre-service teacher education contexts, the teacher checked the accuracy
of students’ representations and prompted them to consider their explanatory value. These
teachable moments added scientific ‘elements’ to students existing conceptions, as
evidenced by the think-aloud data, which gradually culminated in conceptual change, as
evidenced by the change in students’ GeoQuiz scores. This finding responds to calls for
further research on the value of slowmation for learning in science (Hoban et al., 2011;
Hoban & Nielsen, 2013, 2014) and the evaluation of instructional approaches that target
students’ misconceived knowledge about Earth science phenomena (Francek, 2013;
King, 2008; Lelliott & Rollnick, 2010; Mills et al., 2016).
In regards to Research Question 3, it was found that students’ interest in learning science
was significantly greater if they participated in the construction of a slowmation, and
students’ interest was found to be a significant predictor of their conceptual change. This
finding extends the limited research that investigates whether students’ interest may bring
about conceptual change and helps to clarify the opposing results reported to date. More
165
broadly, by adopting a cognitive-affective perspective of conceptual change that
considers affective variables, like interest, as causal mechanisms for conceptual change,
this research has challenged traditional notions of knowledge restructuring in response to
recommendations for new research in this field to do so (Pintrich et al., 1993; Sinatra,
2013; Tyson et al., 1997; Venville & Treagust, 1998).
An unexpected finding from the current study was that several pedagogical issues arose
during the implementation of the research project, that appeared to constrain
opportunities for conceptual change. This finding, although not responding directly to a
research question, demonstrates the limitations of current learning frameworks that
inform the use of slowmation, and the need for a more well-considered and nuanced
framework that is specific to learning with slowmation in a junior secondary school
context. Although it was beyond the scope of this thesis to fully develop and test a
complete pedagogical framework, some lessons learned from the current study have been
organised into the LWS framework, an initial, tentative framework for further
development in future research. Concluding remarks for this study, which include
recommendations for future research arising from this thesis, are presented in the next
chapter.

166
167
CHAPTER EIGHT: CONCLUSION
This thesis has made major contributions to multiple fields of educational practice and
theory. In response to a range of challenges impacting the quality of Earth science
education in Australia, as articulated in Chapter 1, this study investigated how
constructing a slowmation influenced middle school students’ conceptual change, and the
relationship between students’ interest, generated by the construction process, and their
conceptual change. In doing so, the study challenges classical notions of conceptual
change theory by adopting a cognitive-affective perspective; extends conceptual change
research in Earth science education, specifically about geological phenomena; and
contributes to research that investigates the value of student-constructed slowmation. The
study’s findings indicate that slowmation can complement current enactment of the
curriculum with a comparable amount of learning, and can be used with a view to
significantly enhance students’ interest in learning about science and geology.
Notwithstanding the significance of this finding, a range of pedagogical issues arose
throughout the slowmation construction process, which suggest that a more thorough
consideration of the supporting pedagogy is required. As such, the present study
culminated with the presentation of the LWS framework, which integrates conceptual
change literature with the study’s findings to develop a pedagogically robust view of
learning with slowmation.
In the current study, all students in the research project, regardless of condition, had a
significant increase in their GeoQuiz scores from pretest to posttest. This means that the
construction of a slowmation had significant effect on students’ conceptual change.
Importantly, this finding suggests that slowmation can complement schools’ current
enactment of curriculum with a comparable amount of learning. This finding supports
other research on the positive effects of school students learning with slowmation (Brown
et al., 2013; Hoban et al., 2007; Jablonski et al., 2015; Kidman & Hoban, 2009). One
point of difference, however, was the researcher’s choice to audio-record students as they
verbalised their thinking during the construction process. While this methodological
decision was made with a view to provide a more fine-grained and nuanced understanding
168
about how the slowmation construction process facilitated students’ conceptual change,
this aim was not realised in full due to a range of pedagogical issues that arose over the
course of the study.
In investigating how constructing a slowmation influenced the conceptual change of the
students in this study, it was found that the slowmation construction process afforded
teachable moments wherein the teacher identified and corrected students’ alternative
conceptions. The teachable moments were a product of the students’ recursively checking
the accuracy of their information with the teacher as they translated information from one
representation to another in a semiotic progression (Hoban et al., 2011). Although no
instances of conceptual change per se were identified, when this finding is considered
alongside the increase in students’ GeoQuiz scores, it seems that the knowledge
enrichment that accompanied repeated additions of scientific ‘elements’ to students’
existing conceptions culminated in conceptual change. As research on the value of school
students learning with slowmation is scarce, this finding was considered with reference
to research conducted with pre-service teachers.
It seems that pre-service teachers and school-aged students learn with slowmation
differently. While the pre-service teachers in earlier studies (e.g., Hoban & Nielsen, 2014)
demonstrated a strong desire to understand the science content, and actively check the
accuracy of their information on the Internet, the Year 9 students in the current study
appeared to lack the motivation to understand the science content independently, and to
represent it accurately in their slowmation. In pre-service teacher education contexts, the
transformation of information between modal representations has been linked to
conceptual change, whereas in the current study, students privileged ‘easy’ modes of
representation such as narration and therefore did not have multiple opportunities to
review their knowledge. Furthermore, research conducted with pre-service teachers
indicates that the co-generative discussion amongst themselves is sufficient to bring about
conceptual change. In the current study, however, the classroom teacher was solely
responsible for identifying and correcting students’ misconceived knowledge. Finally,
unlike pre-service teachers, who are able to construct a slowmation in a short amount of
169
time, students in the current study could not complete their slowmation in the allocated
four 70-minute science lessons.
These differences indicate that greater attention to the pedagogy surrounding the use of
slowmation with school students is needed. First, and most importantly, the value of the
slowmation construction process is dependent upon the teacher and students’ view of
learning, which should align with constructivist principles. Second, students need a
moderate level of representational competence before they engage in the construction of
a slowmation in order to alleviate students’ preoccupation with the design of their
representations, and their tendency to privilege and bypass modes of representation when
modeling scientific phenomena. Third, slowmation should be used as a learning tool in
the science classroom, rather than a means to produce a polished explanatory resource.
In line with this perspective, students should be encouraged to evaluate the explanatory
adequacy of their slowmation after the construction process.
The LWS framework, although tentative, responds to these assertions. The framework is
situated within a constructivist learning environment wherein pedagogical actions likely
to bring about students’ conceptual change are given explicit attention. It also
incorporates a pre-construction stage that aims to build students’ representational
competence in prior learning experiences, and a post-construction stage wherein students’
learning is enhanced further as they view their peers’ slowmations, and evaluate the
strengths and limitations of their representations in conversation with the teacher.
In investigating the relationship between students’ interest and their conceptual change,
this study found that students’ interest in learning about science, and about geology topics
in particular, was significantly greater if they participated in the construction of a
slowmation, compared to teaching as usual. In addition, for students who participated in
the construction of a slowmation, their overall interest was found to be a significant
predictor of conceptual change. This finding challenges traditional notions of conceptual
change by demonstrating that there is a positive relationship between students’ interest
and their conceptual change. Furthermore, this finding has implications for teachers, who
170
can create learning environments conducive to conceptual change by using innovative
and engaging instructional approaches that capture students’ interest in learning about
science (i.e., triggered-SI).
A number of directions for future research can be drawn from the current study. As
articulated at the onset of this thesis, there are few studies that explore school students’
alternative conceptions of Earth science phenomena. Continued research into students’
conceptions, including how scientific and alternative conceptions may arise, is required
in order to develop conceptual change instructional approaches. Research of this nature
can inform professional development for teachers on effective implementation of Earth
science curricula, and could be used to evaluate instructional approaches. Research of this
nature is particularly timely in Australia, as a new Earth and Environmental Science
curriculum is being implemented in senior secondary schools (ACARA, 2016). Examples
of how this paucity of research is being addressed include the identification of students’
alternative conceptions about groundwater (Reinfried, 2006), cyclones (Lane & Coutts,
2012) and desertification (Schubert, 2014).
Research on teachers’ conceptions of Earth science phenomena is also required so that
common alternative conceptions can be addressed through professional development.
This is especially important given that teachers can inadvertently be a source of students’
alternative conceptions (King, 2000), and some Earth science teachers do not see value
in extensive and in depth content knowledge (Lane, 2015). An example of recent research
that meets this aim investigated teachers’ understanding of cyclones (Lane, 2011). Of
concern is that teachers held a range of alternative conceptions and lacked knowledge of
underlying scientific concepts. Research of this nature is especially warranted in the Earth
science discipline, given that many Australian teachers are underprepared to teach in this
area due to a lack of appropriate teacher education in this field (Dawson & Carson, 2013;
Stoltman et al., 2015).
Given that a significant development in the field of conceptual change research is the
‘warming trend’ that describes the move away from cognition only models of conceptual
171
change (Sinatra, 2005), further research on the relationship between affective variables
and conceptual change is warranted. Further research can focus on affective variables
such as achievement goals, interest and enjoyment, self-efficacy and emotions (Sinatra &
Mason, 2013). Moreover, certain combinations of these variables can be considered, in
light of emerging research that suggests they should not be considered in isolation
(Cordova et al., 2014; Linnenbrink-Garcia at al., 2012). Finally, as only few attempts
have been made at developing a cognitive-affective model of conceptual change (e.g.,
CRKM model; Dole & Sinatra, 1998), further research with the aim of developing a more
complete and contemporary cognitive-affective model of conceptual change would be
particularly valuable.
Strengthening the internal reliability of the test instrument used in this study, as measured
by Cronbach’s alpha coefficient, is another direction for future research. This could be
achieved by adding items of a similar quality to the test instrument. The researcher has
calculated that 21 items (i.e., an additional 11 items) would be needed for an even more
acceptable internal reliability of .60 (Nunally, 1978). A strengthened version of the test
instrument could be used in future research to diagnose students’ alternative conceptions
across multiple year levels or evaluate the effectiveness of another targeted intervention.
The development of the LWS framework presents a significant and potentially fruitful
avenue for future research arising from this study. Repeating the current study with
greater attention to the nature of the classroom learning environment and the role of the
classroom teacher, as informed by the framework, is one such avenue for future research.
Also, as previously mentioned, of potential value to the LWS framework is Prain and
Tytler’s (2012) Representational Construction Affordances framework. This framework
suggests that student-generated representations, such as slowmation, have affordances for
students’ learning that can be conceptualised as semiotic, epistemic and epistemological
(Prain & Tytler, 2012). The LWS framework, then, could be further developed to consider
how students’ learning is scaffolded among these interdependent domains. More
practically, aspects of the Design, Functions, Tasks framework (Ainsworth, 2006) could
be integrated within the LWS framework to further enhance teachers’ consideration of
172
the pedagogical demands of a multiple representations task such as constructing a
slowmation. For instance, the Design, Functions, Tasks framework (Ainsworth, 2006)
prompts teachers’ consideration of design principles (e.g., the number, sequence and form
of representations), students’ meta-representational competence (i.e., their ability to
understand and construct representations), and whether the characteristics of a given
representation facilitate or constrain students’ learning.
In addition to the important contribution that this study makes to informing effective
practice in Earth science education, the multi-faceted nature of the research also
represents a significant contribution in other fields of educational theory. In particular,
this research challenges cognition-only notions of knowledge restructuring by adopting
an affective perspective of conceptual change, and extends research that investigates the
value of constructing student-generated slowmation. While a number of directions for
future research have been suggested in this chapter, including enhancing the LWS
framework, it is clear that the slowmation construction process has the potential to bring
about school students’ conceptual change whilst also sparking their interest in learning
about science and geology. This is an important and timely contribution to the
development of Earth science education in Australia.
173
ReferencesAinley, M., & Hidi, S. (2014). Interest and enjoyment. In R. Pekrun & L. Linnenbrink-
Garcia (Eds.), International handbook of emotions in education (pp. 205-227).
New York, NY: Routledge.
Ainley, J., Kos, J., & Nicholas, M. (2008). Participation in science, mathematics and
technology in Australian education. Research Monograph no. 63, ACER,
Melbourne.
Ainsworth, S. (1999). The functions of multiple representations. Computers and
Education, 33(2-3), 131-152.
Ainsworth, S. (2006). DEFT: A conceptual framework for learning with multiple
representations. Learning and Instruction, 16(3), 183-198.
Ainsworth, S. (2008). The educational value of multiple-representations when learning
complex scientific concepts. In J. Gilbert, M. Reiner, & M. Nakhleh (Eds.),
Visualization: Theory and practice in science education (pp. 191-208).
Netherlands: Springer.
Andre, T., & Windschitl, M. (2003). Interest, epistemological belief, and intentional
conceptual change. In G. M. Sinatra & P. R. Pintrich (Eds.), Intentional
conceptual change (pp. 173–193). Mahwah, NJ: Lawrence Erlbaum Associates.
Australian Curriculum, Assessment and Reporting Authority. (2016a). Earth and
Environmental Science: Overview. Retrieved August 8, 2016, from
http://www.australiancurriculum.edu.au/seniorsecondary/science/earth-and-
environmental-science/rationaleaims
Australian Curriculum, Assessment and Reporting Authority. (2016b). Science:
Curriculum. Retrieved October 14, 2016, from
http://www.australiancurriculum.edu.au/science/curriculum/f-10?layout=1
Australian Curriculum, Assessment and Reporting Authority. (2015). School Profile:
Pine Mountain State College, QLD. Retrieved Ausust 8, 2016, from
https://www.myschool.edu.au
Ausubel, D. (1968). Educational psychology: A cognitive view. New York, NY: Hold,
Rinehart & Winston.
174
Bakas, C., & Mikropoulos, T. (2003). Design of virtual environments for the
comprehension of planetary phenomena based on students’ ideas. International
Journal of Science Education, 25(8), 949-967.
Barak, M., & Dori, Y. (2011). Science education in primary schools: Is an animation
worth a thousand pictures? Journal of Science Education and Technology, 20(5),
608–620.
Barak, M., & Hussein-Farraj, R. (2013). Integrating model-based learning and animations
for enhancing students’ understanding of proteins structure and function.
Research in Science Education, 43(02), 619–636.
Barnett, M., & Morran, J. (2002). Assessing children’s alternative frameworks of the
moon’s phases and eclipses. International Journal of Science Education, 24(8),
859-879.
Bell, R., & Trundle, K. (2008). The use of a computer simulation to promote scientific
conceptions of moon phases. Journal of Research in Science Teaching, 45(3),
346-372.
Bezzi, A. (1996). Use of repertory grids in facilitating knowledge construction and
reconstruction in Geology. Journal of Research in Science Teaching, 33(2), 179-
204.
Binns, I., Bell, R., & Smetana, L. (2010). Using technology to promote conceptual change
in secondary Earth science pupils’ understanding of moon phases. Journal of the
Research Centre for Educational Technology, 6(2), 112-129.
Blake, A. (2001). Developing young children’s understanding: An example from Earth
science. Evaluation & Research in Education, 15(3), 154-163.
Blake, A. (2004). Helping young children to see what is relevant and why: Supporting
cognitive change in Earth science using analogy. International Journal of Science
Education, 26(15), 1855-1873.
Blown, E., & Bryce, T. (2006). Knowledge restructuring in the development of children’s
cosmologies. International Journal of Science Education, 28(12), 1411-1462.
Brown, J., Murcia, K. & Hackling, M. (2013). Slowmation: A multi-modal strategy for
engaging children with primary science. Teaching Science, 59(4), 14-20.
175
Broughton, S., Sinatra, G., & Nussbaum, M. (2013). “Pluto has been a planet my whole
life!” Emotions, attitudes, and conceptual change in elementary students’ learning
about Pluto’s reclassification. Research in Science Education, 43(2), 529-550.
Broughton, S., Sinatra, G., & Reynolds, R. (2010). The nature of the refutation text effect:
An investigation of attention allocation. The Journal of Educational Research,
103(6), 407-423.
Bulunuz, N., & Jarrett, O. (2010). The effect of hands-on learning stations building
American elementary teachers’ understanding about Earth and Space Science
concepts. Eurasia Journal of Mathematics, Science, and Technology Education,
6(2), 85-99.
Burg, K. (2003). Earth and environmental science: Where to from here? Science
Education News, 52(2), 61-66.
Caravita, S., & Hallden, O. (1994). Re-framing the problem of conceptual change.
Learning and Instruction, 4(1), 89-111.
Celikten, O., Ipekciouglu, S., Ertepinar, H., & Geban, O. (2012). The effect of conceptual
change oriented instruction through cooperative learning on 4th grade students’
understanding of Earth and sky concepts. Science Education International, 23(1),
p. 84-96.
Chang, C., & Barufaldi, J. (1999). The use of a problem-solving-based instructional
model in initiating change in students’ achievement and alternative frameworks.
International Journal of Science Education, 21(4), 373-388.
Chang, H., Quintana, C., & Krajcik, J. S. (2010). The impact of designing and evaluating
molecular animations on how well middle school students understand the
particulate nature of matter. Science Education, 94(1), 73–94.
Charmaz, K. (2006). Constructing grounded theory: A practical guide through
qualitative analysis. Thousand Oaks, CA: Sage.
Chastenay, P. (2016). From geocentrism to allocentrism: Teaching the phases of the moon
in a digital full-dome planetarium. Research in Science Education, 46(1), 43-77.
Cheek, K. (2010). Commentary: A summary and analysis of twenty-seven years of
geoscience conceptions research. Journal of Geoscience Education, 58(3), 122-
134.
176
Chi, M., Slotta, J., & De Leeuw, N. (1994). From things to processes: A theory of
conceptual change for learning science concepts. Learning and Instruction, 4(1),
27-43.
Chi, M., Chou, C., & Liu, C. (2002). Dynamic processes of conceptual change: Analysis
of constructing mental models of chemical equilibrium. Journal of Research in
Science Teaching, 39(8), 688–712.
Chinn, C., & Brewer, F. (1993). The role of anomalous data in knowledge acquisition: A
theoretical framework and implications for science instruction. Review of
Educational Research, 63(1), 1–49.
Chu, H., Treagust, D., & Chandrasegaran, A. (2009). A stratified study of students’
understanding of basic optics concepts in different context using two-tier
multiple-choice items. Research in Science & Technological Education, 27(3),
253-265.
Cobern, W. (1996). Worldview theory and conceptual change in science education.
Science Education, 80(5), 579–610.
Cordova, J., Sinatra, G., Broughton, S., & Taasoobshirazi, G. (2011, April). Self-efficacy,
confidence in prior knowledge, and conceptual change. Paper presented at the
annual meeting of the American Educational Research Association. New Orleans,
LA.
Cordova, J., Sinatra, G., Jones, S., Taasoobshirazi, G., & Lombardi, D. (2014).
Confidence in prior knowledge, self-efficacy, interest, and prior knowledge:
Influences on conceptual change. Contemporary Educational Psychology, 39(2),
164-174.
Creswell, J. (2005). Educational research: Planning, conducting, and evaluating
quantitative and qualitative research (2nd ed.). Upper Saddle River, NJ: Merrill
Prentice Hall.
Creswell, J. (2015). A concise introduction to mixed methods research. Thousand Oaks,
CA: Sage.
Dawson, V., & Carson, K. (2013). Science teachers’ and senior secondary schools
students’ perceptions of Earth and environmental science topics. Australian
Journal of Environmental Education, 29(2), 202-220.
177
Dawson, V., & Moore, L. (2011). Teachers’ perspectives of the new Earth and
environmental science course: Lessons from the Australian curriculum. Teaching
Science, 57(1), 19-27.
Diakidoy, I., & Kendeou, P. (2001). Facilitating conceptual change in Astronomy: A
comparison of the effectiveness of two instructional approaches. Learning and
Instruction, 11(1), 1-20.
diSessa, A. (2004). Metarepresentation: Native competence and targets for instruction.
Cognition and Instruction, 22(3), 293-331.
Dodick, J., & Orion, N. (2003). Cognitive factors affecting student understanding of
geologic time. Journal of Research in Science Teaching, 40(4), 415-442.
Dole, J., & Sinatra, G. (1998). Reconceptualizing change in the cognitive construction of
knowledge. Educational Psychologist, 33(2/3), 109-128.
Department of Education, Training and Employment. (2014a). Changing Earth.
Retrieved August 8, 2016, from https://www.scootle.edu.au/ec/p/home
Department of Education, Training and Employment. (2014b). Landscapes. Retrieved
August 8, 2016, from https://www.scootle.edu.au/ec/p/home
Department of Education, Training and Employment. (2014c). The Universe. Retrieved
August 8, 2016, from https://www.scootle.edu.au/ec/p/home
Driver, R., & Oldham, V. (1986). A constructivist approach to curriculum development
in science. Studies in Science Education, 13(1), 105–122.
Duit, R., & Treagust, D. F. (1995). Students’ conceptions and constructivist teaching
approaches. In B. J. Fraser & H. J. Walberg (Eds.), Improving science education
(pp. 46–69). Chicago, Illinois: The National Society for the Study of Education.
Duit, R., & Treagust, D. F. (1998). Learning in science: From behaviourism towards
social constructivism and beyond. In B. J. Fraser & K. G. Tobin (Eds.),
International handbook of science education (pp. 3–25). Kluwer Academic
Publishers.
Duit, R., & Treagust, D. (2003). Conceptual change: A powerful framework for
improving science teaching and learning. International Journal of Science
Education, 25(6), 671-688.
178
Duit, R., & Treagust, D. (2013). Teaching science for conceptual change: Theory and
Practice. In S. Vosniadou (Ed.), International handbook of research on
conceptual change (2nd ed., pp. 487-503). New York, NY: Routledge.
Francek, M. (2013). A compilation and review of over 500 Geoscience misconceptions.
International Journal of Science Education, 35(1), 31-64.
Fredrickson, B. (2001). The role of positive emotions in positive psychology: The
broaden-and-build theory of positive emotions. American Psychologist, 56(3),
218-226.
Gazit, E., Yair, Y., & Chen, D. (2005). Emerging conceptual understanding of complex
astronomical phenomena by using a virtual Solar System. Journal of Science
Education and Technology, 14(5), 459-470.
Gilbert, J., Osborne, R., & Fensham, P. (1982). Children’s science and its consequences
for teaching. Science Education, 66(4), 623-633.
Gobert, J., & Clement, J. (1999). Effects of student-generated diagrams versus student-
generated summaries on conceptual understanding of causal and dynamic
knowledge in plate tectonics. Journal of Research in Science Teaching, 36(1), 39-
53.
Green S., & Salkind, N. (2005). Using SPSS for Windows and Macintosh: Analyzing and
Understanding Data. Upper Saddle River, NJ: Pearson Prentice Hall.
Harlen, W. (2009). Teaching and learning science for a better future. School Science
Review, 90(333), 33-42.
Hayes, B., Goodhew, A., Heit, E., & Gillan, J. (2003). The role of diverse instruction in
conceptual change. Journal of Experimental Child Psychology, 86(4), 253-276.
Heyl, B. (2001). Ethnographic interviewing. In P. Atkinson, A. Coffey, S. Delamont, J.
Lofland, & L. Lofland (Eds.), Handbook of ethnography (pp. 369-383). London:
Sage.
Hewson, P. (1981). A conceptual change approach to learning science. European Journal
of Science Education, 3(4), 383-396.
Hidi, S. (2006). Interest: A unique motivational variable. Educational Research Review,
1(2), 69-82.
179
Hidi, S., & Harackiewicz, J. (2000). Motivating the academically unmotivated: A critical
issue for the 21st century. Review of Educational Research, 70(2), 151-179.
Hidi, S., & Renninger, K. (2006). The four-phase model of interest development.
Educational Psychologist, 41, 111-127.
Hinkin, T. (1995). A review of scale development practices in the study of organizations.
Journal of Management, 21(5), 967-988.
Hoban, G. (2005). From claymation to slowmation: A teaching procedure to develop
students’ science understandings. Teaching Science, 51(2), 26–30.
Hoban, G. (2007). Using slowmation to engage preservice elementary teachers in
understanding science content knowledge. Contemporary Issues in Technology
and Teacher Education, 7(2), 75–91.
Hoban, G., Ferry, B., Konza, D., & Vialle, W. (2007). Slowmation: Exploring a new
teaching approach in primary school classrooms. Paper presented at the Australian
Teacher Education Association conference, Wollongong, NSW.
Hoban, G., Loughran, J., & Nielsen, W. (2011). Slowmation: Preservice elementary
teachers representing science knowledge through creating multimodal digital
animations. Journal of Research in Science Teaching, 48(9), 985–1009.
Hoban, G., & Nielsen, W. (2010). The 5 Rs: A new teaching approach to encourage
slowmations (student generated animations) of science concepts. Teaching
Science, 56(3), 33-38.
Hoban, G., & Nielsen, W. (2012). Using “slowmation” to enable preservice primary
teachers to create multimodal representations of science concepts. Research in
Science Education, 42(6), 1101–1119.
Hoban, G., & Nielsen, W. (2013). Learning science through creating a ‘Slowmation’: A
case study of preservice primary teachers. International Journal of Science
Education, 35(1), 119-146.
Hoban, G., & Nielsen, W. (2014). Creating a narrated stop-motion animation to explain
science: The affordances of “Slowmation” for generating discussion. Teaching
and Teacher Education, 42, 68-78.
180
Hobson, S., Trundle, K., & Saçkes, M. (2010). Using a planetarium software to promote
conceptual change with young children. Journal of Science Education and
Technology, 19(2), 165-176.
Hsu, Y. (2008). Learning about seasons in a technologically enhanced environment: The
impact of teacher-guided and student-centered instructional approaches on the
process of students’ conceptual change. Science Education, 92(2), 320-344.
Hubber, P., Tytler, R., & Haslam, F. (2010). Teaching and learning about force with a
representational focus: Pedagogy and teacher change. Research in Science
Education, 40(1), 5-28.
Hubley, A., & Zumbo, B. (1996). A dialectic on validity: Where we have been and where
we are going. The Journal of General Psychology, 123(3), 207-215.
Hubscher-Younger, T., & Narayanan, N. H. (2007). Turning the tables: Investigating
characteristics and efficacy of student-authored multimedia representations. In R.
Lowe & W. Schnotz (Eds.), Learning with animations (pp. 235–262). New York,
NY: Cambridge University Press.
Izard, C. (1997). Human emotions. New York, NY: Plenum Press.
Izard, C. (2007). Basic emotions, natural kinds, emotion schemas, and a new paradigm.
Perspectives on Psychological Science, 2(3), 260-280.
Izard, C. (2009). Emotion theory and research: Highlights, unanswered questions, and
emerging issues. Annual Review of Psychology, 60, 1-25.
Jablonski, D., Hoban, G., Ransom, H. & Ward, K. (2015). Exploring the use of
slowmation as a pedagogical alternative in science teaching and learning. Pacific-
Asian Education, 27, 5-20.
Jonassen, D., Peck, K., & Wilson, B. (1999). Learning with technology in the classroom:
A constructivist perspective. New York: Merrill Prentice-Hall.
Kali, Y., Orion, N., & Eylon, B. (2003). Effect of knowledge integration activities on
students’ perceptions of the Earth’s crust as a cyclic system. Journal of Research
in Science Teaching, 40(6), 545-565.
Keating, T., Barnett, M., Barab, S., & Hay, K. (2002). The virtual Solar System project:
Developing conceptual understanding of astronomical concepts through building
181
three-dimensional computational models. Journal of Science Education and
Technology, 11(3), 261-275.
Kidman, G. (2016). Pre-service teachers’ use of slowmation: Developing transformative
learning. In G. Hoban, W. Nielsen and A. Shepherd (Eds.), Student-generated
digital media in science education (pp. 166-175). New York, NY: Routledge.
Kidman, G. & Hoban, G. (2009). Biotechnology learnings using ‘claymation’ and
‘slowmation’. Paper presented at the National Association for Research in Science
Teaching, Orange County, CA.
Kidman, G., Keast, S., & Cooper, R. (2012). Understanding pre-service teacher
conceptual change through slowmation animation. In 2nd International STEM in
Education Conference. Beijing, China.
King, C. (2008). Geoscience education: An overview. Studies in Science Education,
44(2), 187-222.
King, C. (2010). An analysis of misconceptions in textbooks: Earth science in England
and Wales. International Journal of Science Education, 32(5), 565-601.
Klein, P. (2006). The challenges of scientific literacy: From the viewpoint of second
generation cognitive science. International Journal of Science Education, 28(2-
3), 143-178.
Kozma, R. (2003). The matieral features of multiple represenations and their cognitive
and social affordances for science understanding. Learning and Instruction, 13(2),
205-226.
Kozma, R., & Russell, J. Multimedia and understanding: Expert and novice responses to
difference representations of chemical phenomena. Journal of Research in
Science Teaching, 34(9), 949-968.
Krapp, A., & Prenzel, M. (2011). Research on interest in science: Theories, methods, and
findings. International Journal of Science Education, 33(1), 27-50.
Kruglanski, A., & Webster, D. (1996). Motivated closing of the mind: “Seizing” and
“freezing.” In E. T. Higgins & A. W. Kruglanski (Eds.), Motivational science: Social
and personality perspectives. New York, NY: Psychology Press.
Küçüközer, H. (2008). The effects of 3D computer modeling on conceptual change about
seasons and phases of the moon. Physics Education, 43(6), 632-636.
182
Küçüközer, H., Korkusuz, E., Küçüközer, A., and Yürümezoglu, K. (2009). The effect of
3D computer modeling and observation-based instruction on the conceptual
change regarding basic concepts of astronomy in elementary school students.
Astronomy Education Review, 8(1), 1-18.
Lane, R. (2015). Experienced geography teachers’ PCK of students’ ideas and beliefs
about learning and teaching. International Research in Geographical and
Environmental Education 24(1), 43-57.
Lane, R., & Coutts, P. (2012). Students’ alternative conceptions of tropical cyclone causes
and processes. International Research in Geographical and Environmental
Education, 21(3), 205-222.
Lankshear, C., & Knobel, M. (2004). A handbook for teacher research: From design to
implementation. Maidenhead, Berkshire: Open University Press.
Lee, O., Lester, B., Ma, L., Lambert, J., & Jean-Baptiste, M. (2007). Conceptions of the
greenhouse effect and global warming among elementary students from diverse
languages and cultures. Journal of Geoscience Education, 55(2), 117-125.
Lehrer, R., & Schauble, L. (2006a). Cultivating model-based reasoning in science
education. In K. Sawyer (Ed.), Cambridge handbook of the learning sciences (pp.
371-388). Cambridge, MA: Cambridge University Press.
Lehrer, R., & Schauble, L. (2006b). Scientific thinking and science literacy. In W. Damon
& R. Lerner (Eds.), Handbook of child psychology (Vol. 4, 6th ed.). Hoboken, NJ:
Wiley and Sons.
Lelliott, A., & Rollnick, M. (2010). Big ideas: A review of astronomy education research
1974-2008. International Journal of Science Education, 32(13), 1771-1799.
Lemke, J. (2001). Articulating communities: Sociocultural perspectives on science
education. Journal of Research in Science Teaching, 38(3), 296-316.
Lemke, J. (2003). Mathematics in the middle: Measure, picture, gesture, sign, and word.
In M. Anderson, A. Sàenz-Ludlow, S. Zellweger, & V. Cifarelli (Eds.),
Educational perspectives on mathematics as semiosis: From thinking to
interpreting to knowing (pp. 215-234). Ottawa: Legas Publishing.
Lemke, J. (2004). The literacies of science. In E. Saul (Ed.), Crossing borders in literacy
and science instruction: Perspectives on framework and practice (pp. 33-47).
183
Neward, DE: International Reading Association and National Science Teachers
Association.
Linnenbrink-Garcia, L., Durik, A., Conley, A., Barron, K., Tauer, J., Karabenick, S., &
Harackiewicz, J. (2010). Measuring situational interest in academic domains.
Educational and Psychological Measurement, 70, 647-671.
Linnenbrink, L., & Pintrich, P. (2002). The role of motivational beliefs in conceptual
change. In M. Limon & L. Mason (Eds.), Reconsidering conceptual change:
Issues in theory and practice (pp. 115–135). Dordrecht, The Netherlands: Kluwer
Academic Publishers.
Linnenbrink-Garcia, L., Pugh, K., Koskey, K., & Stewart, V. (2012). Developing
conceptual understanding of natural selection: The role of interest, efficacy, and
basic prior knowledge. The Journal of Experimental Education, 80(1), 45-68.
Lombardi, D., Sinatra, G., & Nussbaum, M. (2013). Plausibility reappraisals and shifts in
middle school students’ climate change conceptions. Learning and Instruction,
27, 50-62.
Loughran, J., Berry, A., Cooper, R., Keast, S., & Hoban, G. (2012). Preservice teachers
learning about teaching for conceptual change through slowmation. Asia-Pacific
Forum on Science Learning and Teaching, 13(1), 1–28.
Mackenzie, N., & Knipe, S. (2006). Research dilemmas: Paradigms, methods and
methodology. Issues in Educational Research, 16(2), 193-205.
Marques, L., & Thompson, D. (1997). Misconceptions and conceptual changes
concerning continental drift and plate tectonics among Portuguese students aged
16-17. Research in Science & Technological Education, 15(2), 195-222.
Martinez, P., Bannan, B., & Kitsantas, A. (2012). Bilingual students’ ideas and
conceptual change about slow geomorphological changes caused by water.
Journal of Geoscience Education, 60(1), 54-66.
Mason, L., Gava, M., & Boldrin, A. (2008). On warm conceptual change: The interplay
of text, epistemological beliefs, and topic interest. Journal of Educational
Psychology, 100(2), 291–309.
184
McClean, P., Johnson, C., Rogers, R., Daniels, L., Reber, J., Slator, B. M., … White, A.
(2005). Molecular and cellular biology animations: Development and impact on
student learning. Cell Biology Education, 4(2), 169–79.
McCuin, J., Hayhoe, K., & Hayhoe, D. (2014). Comparing the effects of traditional vs.
misconceptions-based instruction on student understanding of the greenhouse
effect. Journal of Geoscience Education, 63(3), 445-459.
Miles, M., & Huberman, A. (1994). Qualtiative data analysis (2nd ed.). Thousand Oaks,
CA: Sage.
Mills, R., Tomas, L., & Lewthwaite, B. (2016). Learning for conceptual change in Earth
and space science: A review of conceptual change instructional approaches.
International Journal of Science Education, 38(5), 767-790.
Mills, R., Tomas, L., & Lewthwaite, B. (2017). Junior secondary school students’
conceptions about plate tectonics. International Research in Geographical and
Environmental Education.
Murphy, P., & Alexander, P. (2004). Persuasion as a dynamic, multidimensional process:
An investigation of individual and intraindividual differences. American
Educational Research Journal, 41(2), 337–363.
Nielsen, W., & Hoban, G. (2015). Designing a digital teaching resource to explain phases
of the moon: A case study of preservice elementary teachers making a
slowmation. Journal of Research in Science Teaching, 52(9), 1207-1324.
Nunally, J. (1978). Psychometric theory. New York, NY: McGraw-Hill.
Nussbaum, J., & Sharoni-Dagan, N. (1983). Changes in second grade children’s
preconceptions about Earth as a cosmic body resulting from a short series of
audio-tutorial lessons. Science Education, 67(1), 99-114.
Ogan-Bekiroglu, F. (2007) Effects of model-based teaching on pre-service physics
teachers’ conceptions of the moon, moon phases, and other lunar phenomena.
International Journal of Science Education, 29(5), 555-593.
Organisation for Economic Co-operation and Development (OECD). (2006). Database:
PISA 2006. Retrieved August 9, 2016, from
https://www.oecd.org/pisa/pisaproducts/database-pisa2006.htm
185
Osborne, R., & Freyberg, P. (1985). Learning in science: The implications of children’s
science. Portsmouth, NH: Heinmann Educational Books.
Osborne, R., & Gilbert, J. (1979). Investigating student understanding of basic physics
concepts using an interview-about-instances technique. Research in Science
Education, 9(1), 85-93.
Osborne, R., & Wittrock, M. (1985). The generative learning model and its implications
for science education. Studies in Science Education, 12(1), 59–87.
Paige, K., Bentley, B. & Dobson, S. (2016). Slowmation: An innovative twenty-first
century learning tool for science and mathematics pre-service teachers. Australian
Journal of Teacher Education, 41(2), 1-15.
Peirce, C. (1931). Logic as semiotic: The theory of signs. In B. Justus (Ed.), Philosophical
writings of Peirce (pp. 1893–1910). New York: Dover.
Pike, A., & Dunne, M. (2011). Student reflections on choosing to study science post-16.
Cultural Studies in Science Education, 6(2), 485-500.
Pintrich, P., Marx, R., & Boyle, R. (1993). Beyond cold conceptual change: The role of
motivational beliefs and classroom contextual factors in the process of conceptual
change. Review of Educational Research, 63(2) 167-199.
Posner, G., Strike, K., Hewson, P., & Gertzog, W. (1982). Accommodation of a scientific
conception: Towards a theory of conceptual change. Science Education, 66(2),
211-227.
Prain, V., & Tytler, R. (2010). Learning through constructing representations in science:
A framework of representational construction affordances. International Journal
of Science Education, 34(17), 2751-2773.
Prain, V., & Waldrip, B. (2006). An exploratory study of teachers’ and students’ use of
multi-modal representations of concepts in primary science. International Journal
of Science Education, 28(15), 1843-1866.
Psathas, G. (1995). Conversation analysis: The study of talk-in-interaction. Thousand
Oaks, CA: Sage.
Qian, G., & Alvermann, D. (1995). Role of epistemological beliefs and learned
helplessness in secondary school students’ learning science concepts from text.
Journal of Educational Psychology, 87, 282–292.
186
Qian, G., & Pan, J. (2002). A comparison of epistemological beliefs and learning from
science text between American and Chinese high school students. In B. Hofer &
P. Pintrich (Eds.), Personal epistemology: The psychology of beliefs about
knowledge and knowing (pp. 365-385). Mahwah, NJ: Lawrence Erlbaum
Associates.
Randler, C., & Bogner, F. (2008). Planning experiments in science education research:
Comparison of a quasi-experimental approach with a matched pair tandem design.
International Journal of Environmental and Science Education, 3(3), 95-103.
Randolph, J. (2009). A guide to writing the dissertation literature review. Practical
Assessment, Research, and Evaluation, 14(13), 1-13.
Rebich, S., & Gautier, C. (2005). Concept mapping to reveal prior knowledge and
conceptual change in a mock summit course on global climate change. Journal of
Geoscience Education, 53(4), 355-365.
Reinfried, S. (2006). Conceptual change in physical geography and environmental
sciences through mental model building: The example of groundwater.
International Research in Geographical and Environmental Education, 15(1), 41-
61.
Rosen, Y. (2009). The effects of an animation-based on-line learning environment on
transfer of knowledge and on motivation for science and technology learning.
Journal of Educational Computing Research, 40(4), 451–467.
Saldaña, J. (2013). The coding manual for qualitative researchers (2nd ed.). Thousand
Oaks, CA: Sage.
Salierno, C., Edelson, D., & Sherin, B. (2005). The development of student conceptions
of the Earth-sun relationship in an inquiry-based curriculum. Journal of
Geoscience Education, 53(4), 422-431.
Schank, P., & Kozma, R. (2002). Learning chemistry through the use of a representation-
based knowledge building environment. Journal of Computers in Mathematics
and Science Teaching, 21(3), 253–279.
Schiefele, U. (2009). Situational and individual interest. In Wentzel, K., Wigfield, A., &
Miele, D. (Eds.) Handbook of Motivation at School (pp. 197-222). New York,
NY: Routledge.
187
Schneps, M., Ruel, J., Sonnert, G., Dussault, M., Griffin, M., & Sadler, P. (2014).
Conceptualiszing astronomical scale: Virtual simulations on handheld tablet
computers reverse misconceptions. Computers & Education, 70, 269-280.
Schubert, J. (2014). Causes, processes and consequences of “desertification”: Results of
a qualitative study about the conceptions of 12 and 13 year old students in
Germany. International Research in Geographical and Environmental
Education, 24(2), 148-166.
Sharp, J.C., & Sharp, J.G. (2007) Beyond shape and gravity: Children’s ideas about the
Earth in space reconsidered. Research Papers in Education, 22(3), 363-401.
Shen, J., & Confrey, J. (2007) From conceptual change to transformative modeling: A
case study of an elementary teacher. Science Education, 91(6), 948-966.
Sinatra, G. (2005). The warming trend in conceptual change research: The legacy of Paul
R. Pintrich. Educational psychologist, 40(2), 107-115.
Sinatra, G., & Mason, L. (2013). Beyond knowledge: Learner characteristics influencing
conceptual change. In S. Vosniadou (Ed.), International handbook of research on
conceptual change (2nd ed., pp. 377-394). New York, NY: Routledge.
Sinatra, G., & Pintrich, P. (2003). Intentional conceptual change. Mahwah, NJ: Lawrence
Erlbaum Associates.
Sinatra, G., & Taasoobshirazi, G. (2011). Intentional conceptual change: The self-
regulation of science learning. In B. J. Zimmerman & D. H. Schunk (Eds.),
Handbook of self-regulation of learning and performance. New York, NY:
Routledge.
Skinner, B. (1954). The science of learning and the art of teaching. Harvard Educational
Review, 24, 86-97.
Sneider, C., & Ohadi, M. (1998). Unraveling students’ misconceptions about the Earth’s
shape and gravity. Science Education, 82(2), 265-284.
Steer, D., Knight, C., Owens, K., & McConnell, D. (2005) Challenging students’ ideas
about Earth’s interior using a model-based conceptual change approach in a large
class setting. Journal of Geoscience Education, 53(4), 415-421.
188
Stieff, M., & Wilensky, U. (2003). Connected chemistry: Incorporating interactive
simulations into the chemistry classroom. Journal of Science Education and
Technology, 12(3), 285–302.
Stoltman, J., Lidstone, J., & Kidman, G. (2015). Physical geography education research:
Is it relevant? International Research in Geographical and Environmental
Education, 24(2), 103-104.
Stover, S., & Saunders, G. (2000). Astronomical misconceptions and the effectiveness of
science museums in promoting conceptual change. Journal of Elementary Science
Education, 12(1), 41-51.
Strike, K., & Posner, G. (1982). Conceptual change and science teaching. European
Journal of Science Education, 4(3), 231-240.
Strike, K., & Posner, G. (1992). A revisionist theory of conceptual change. In R. A.
Duschl & R. J. Hamilton (Eds.), Philosophy of science, cognitive psychology, and
educational theory and practice. Albany, NY: State University of New York
Press.
Taasoobshirazi, G., & Sinatra, G. (2011). A structural equation model of conceptual
change in physics. Journal of Research in Science Teaching, 48(8), 901-918.
Tabachnick, B., & Fidell, L. (2007). Using multivariate statistics (5th ed.). Boston, MA:
Allyn & Unwin.
Taber, K. (2013). Classroom-based research and evidence-based practice: An
introduction (2nd ed.). Thousand Oaks, CA: Sage.
Tang, K., Delgado, C., & Moje, E. (2014). An integrative framework for the analysis of
multiple and multimodal representations for meaning-making in science
education. Science Education, 98(2), 305-326.
Taylor, I., Barker, M., & Jones, A. (2003). Promoting mental model building in
astronomy. International Journal of Science Education, 25(10), 1205-1225.
Taylor, J., Kowalski, S., Wilson, C., Getty, S., & Carlson, J. (2013). Conducting causal
effects studies in science education: Considering methodological trade-offs in the
context of policies affecting research in schools. Journal of Research in Science
Teaching, 50(9), 1127-1141.
189
Thatcher, J. D. (2006). Computer animation and improved student comprehension of
basic science concepts. The Journal of the American Osteopathic Association,
106(1), 9–14.
Tippett, C. (2016). What recent research on diagrams suggests about learning with rather
from visual representations in science. International Journal of Science
Education, 338(5), 725-746.
Toulmin, S. (1972). Human understanding. Princeton: Princeton University Press.
Treagust, D. (1988). Development and use of diagnostic tests to evaluate students’
misconceptions in science. International Journal of Science Education, 10(2),
159–169.
Treagust, D. (2006). Diagnostic assessment in science as a means to improving teaching,
learning and retention. Paper presented at the Australian Conference on Science
and Mathematics Education, Sydney, NSW.
Treagust, D., & Duit, R. (2008). Conceptual change: A discussion of theoretical,
methodological and practical challenges for science education. Cultural Studies
of Science Education, 3(2), 297-328.
Trumper, R. (2006). Teaching future teachers basic astronomy concepts – seasonal
changes – at a time of reform in science education. Journal of Research in Science
Teaching, 43(9), 879-906.
Trundle, K., Atwood, R., & Christopher, J. (2002). Pre-service elementary teachers’
conceptions of moon phases before and after instruction. Journal of Research in
Science Teaching, 39(7), 633-658.
Trundle, K., Atwood, R., & Christopher, J. (2006). Pre-service elementary teachers’
knowledge of observable moon phases and pattern of change in phases. Journal
of Science Teacher Education, 17(2), 87-101.
Trundle, K., Atwood, R., & Christopher, J. (2007a). Fourth-grade elementary students’
conceptions of standards-based lunar concepts. International Journal of Science
Education, (29)5, 595-616.
Trundle, K., Atwood, R., & Christopher, J. (2007b). A longitudinal study of conceptual
change: Pre-service elementary teachers’ conceptions of moon phases. Journal of
Research in Science Teaching, 44(2), 303-326.
190
Trundle, K., Atwood, R., Christopher, J., & Saçkes, M. (2010). The effect of guided
inquiry-based instruction on middle school students’ understanding of lunar
concepts. Research In Science Education, 40(3), 451-478.
Trundle, K., & Bell, R. (2010). The use of a computer simulation to promote conceptual
change: A quasi-experimental study. Computers and Education, 54(4), 1078-
1088.
Tsai, C., & Chang, C. (2005). Lasting effects of instruction guided by the conflict map:
Experimental study of learning about the causes of the seasons. Journal of
Research in Science Teaching, 42(10), 1089-1111.
Tyson, L., Venville, G., Harrison, A., & Treagust, D. (1997). A multidimensional
framework for interpreting conceptual change events in the classroom. Science
Education, 81(4), 387-404.
Tytler, R., & Prain, V. (2010). A framework for re‐thinking learning in science from
recent cognitive science perspectives. International Journal of Science Education,
32(15), 2055–2078.
Ucar, S., & Trundle, K. (2011). Conducting a guided inquiry in science classes using
authentic, archived, we-based data. Computers and Education, 57(2), 1571-1582.
Ucar, S., Trundle, K., & Krissek, L. (2011). Inquiry-based instruction with archived,
online data: An intervention study with pre-service teachers. Research in Science
Education, 41(2), 261-282.
Venville, G. J., & Treagust, D. F. (1998). Exploring conceptual change in genetics using
a multidimensional interpretive framework. Journal of Research in Science
Teaching, 35(9), 1031–1055.
Viiri, J., & Saari, H. (2004). Research-based teaching unit on the tides. International
Journal of Science Education, 26(4), 463-481.
Vosniadou, S. (2008). Bridging culture with cognition: A commentary on “Culturing
conceptions: from first principles.” Cultural Studies of Science Education, 3(2),
277–282.
Vosniadou, S., & Brewer, W. (1992). Mental models of the Earth: A study of conceptual
change in childhood. Cognitive Psychology, 24(4), 535-585.
191
Vosniadou, S., & Brewer, W. (1987). Theories of knowledge restructuing in
development. Review of Educational Research, 57(1), 51-67.
Vosniadou, S., & Ioannides, C. (1998). From conceptual development to science
education: A psychological point of view. International Journal of Science
Education, 20(10), 1213–1230.
Vosniadou, S., & Ioannides, C., & Dimitrakopoulou, A., & Papademetriou, E. (2001).
Designing learning environments to promote conceptual change in science.
Learning and Instruction, 11(4), 381-419.
Waldrip, B., Prain, V., & Carolan, J. (2010). Using multi-modal representaions to
improve learning in junior secondary science. Research in Science Education, 40,
65-80.
West, L., & Pines, A. (1983). How “rational” is rationality? Science Education, 67(1),
37–39.
Wilder, A., & Brinkerhoff, J. (2007). Supporting representational competence in high
school biology with computer-based biomolecular visualisations. Journal of
Computers in Mathematics and Science Teaching, 26(1), 5–26.
Wu, H., Krajcik, J., & Soloway, E. (2001). Promoting understanding of chemical
representations: Students’ use of a visualization tool in the classroom. Journal of
Research in Science Teaching, 38(7), 821–842.
Yeung, A., Schmid, S., & George, A. (2007). Still pictures, animations or interactivity:
What is more effective for elearning? In UniServe Science Teaching and Learning
Research Proceedings (pp. 120–125).
Zelik, M., Schau, C., Mattern, N. (1999). Conceptual Astronomy. II. Replicating
conceptual gains, probing attitude change across three semesters. American
Journal of Physics, 67, 923-927.
Zembylas, M. (2005). Three perspectives in linking the cognitive and the emotional in
science learning: Conceptual change, socio-constructivism and poststructuralism.
Studies in Science Education, 41(1), 91-115.

192

193
Appendices
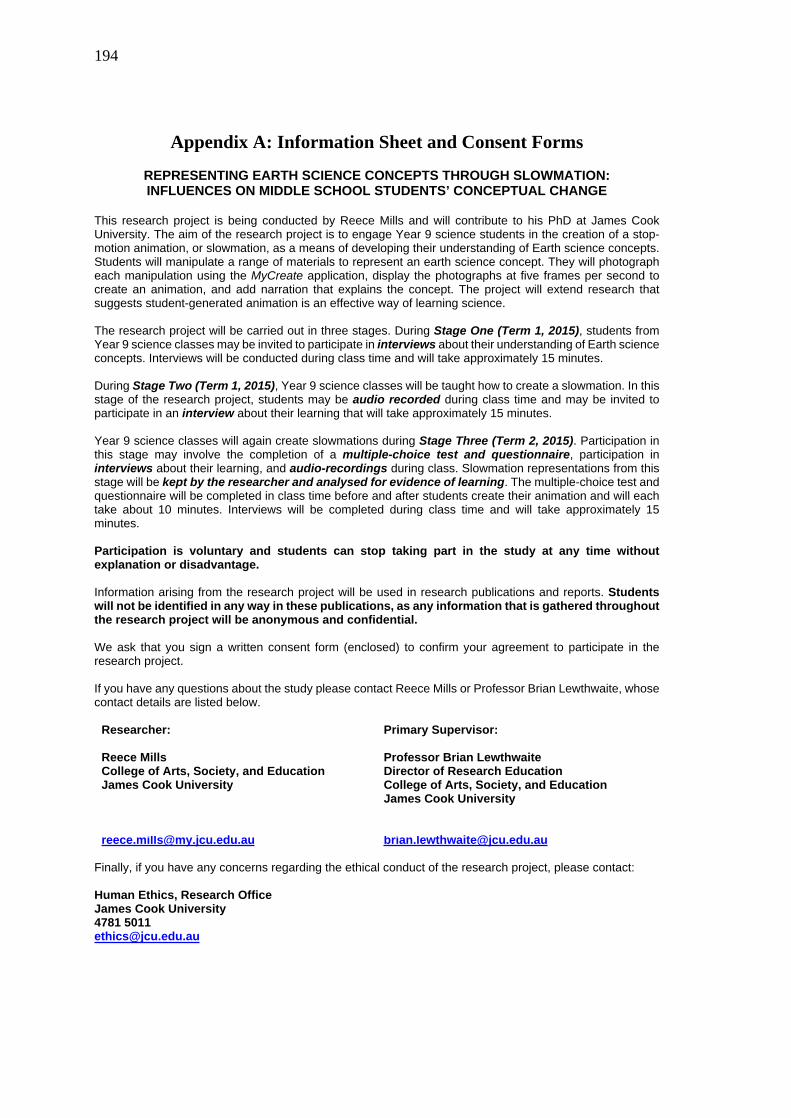
194
Appendix A: Information Sheet and Consent Forms
REPRESENTING EARTH SCIENCE CONCEPTS THROUGH SLOWMATION:INFLUENCES ON MIDDLE SCHOOL STUDENTS’ CONCEPTUAL CHANGE
This research project is being conducted by Reece Mills and will contribute to his PhD at James Cook University. The aim of the research project is to engage Year 9 science students in the creation of a stop-motion animation, or slowmation, as a means of developing their understanding of Earth science concepts. Students will manipulate a range of materials to represent an earth science concept. They will photograph each manipulation using the MyCreate application, display the photographs at five frames per second to create an animation, and add narration that explains the concept. The project will extend research that suggests student-generated animation is an effective way of learning science.
The research project will be carried out in three stages. During Stage One (Term 1, 2015), students from Year 9 science classes may be invited to participate in interviews about their understanding of Earth science concepts. Interviews will be conducted during class time and will take approximately 15 minutes.
During Stage Two (Term 1, 2015), Year 9 science classes will be taught how to create a slowmation. In this stage of the research project, students may be audio recorded during class time and may be invited to participate in an interview about their learning that will take approximately 15 minutes.
Year 9 science classes will again create slowmations during Stage Three (Term 2, 2015). Participation in this stage may involve the completion of a multiple-choice test and questionnaire, participation in interviews about their learning, and audio-recordings during class. Slowmation representations from this stage will be kept by the researcher and analysed for evidence of learning. The multiple-choice test and questionnaire will be completed in class time before and after students create their animation and will each take about 10 minutes. Interviews will be completed during class time and will take approximately 15 minutes.
Participation is voluntary and students can stop taking part in the study at any time without explanation or disadvantage.
Information arising from the research project will be used in research publications and reports. Students will not be identified in any way in these publications, as any information that is gathered throughout the research project will be anonymous and confidential.
We ask that you sign a written consent form (enclosed) to confirm your agreement to participate in the research project.
If you have any questions about the study please contact Reece Mills or Professor Brian Lewthwaite, whose contact details are listed below.
Researcher:
Reece MillsCollege of Arts, Society, and EducationJames Cook University
Primary Supervisor:
Professor Brian LewthwaiteDirector of Research EducationCollege of Arts, Society, and EducationJames Cook University
Finally, if you have any concerns regarding the ethical conduct of the research project, please contact:
Human Ethics, Research OfficeJames Cook University4781 [email protected]

195
Informed Consent Form for Participation in JCU Research

196
Informed Consent Form for Participation in JCU Research
197
Informed Consent Form for Participation in JCU Research
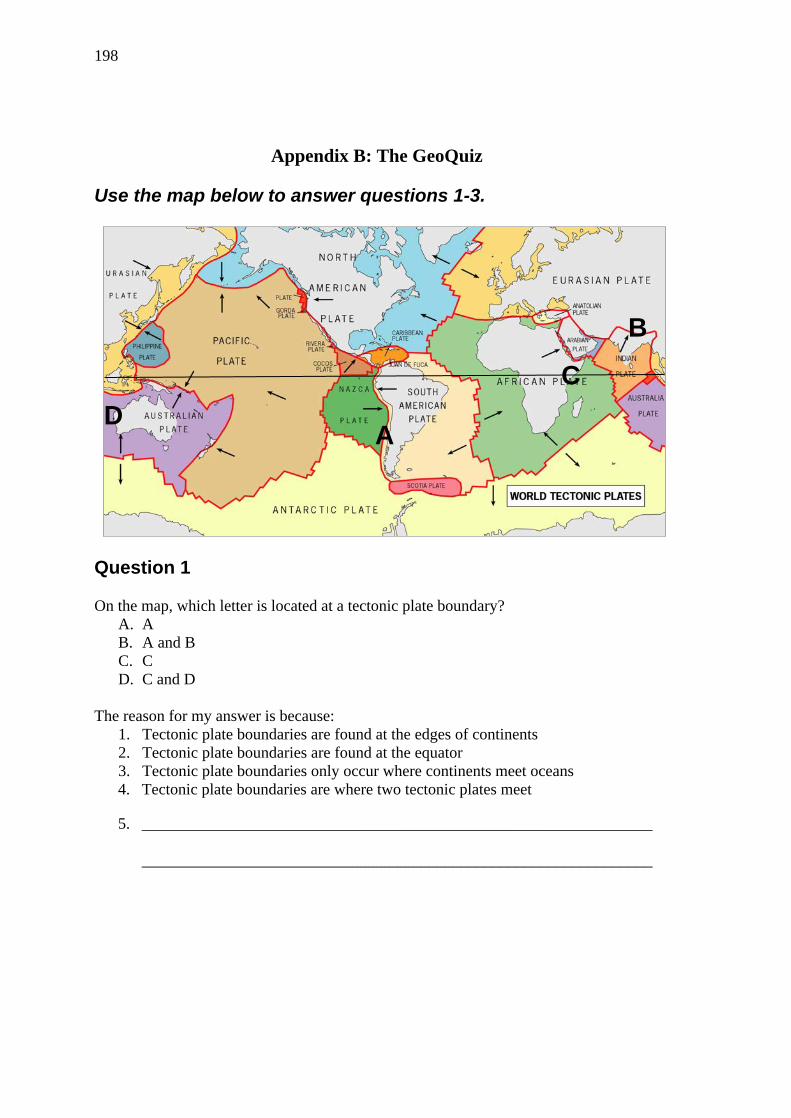
198
Appendix B: The GeoQuiz
Use the map below to answer questions 1-3.
AD
B
C
Question 1
On the map, which letter is located at a tectonic plate boundary?A. AB. A and BC. CD. C and D
The reason for my answer is because:1. Tectonic plate boundaries are found at the edges of continents2. Tectonic plate boundaries are found at the equator3. Tectonic plate boundaries only occur where continents meet oceans4. Tectonic plate boundaries are where two tectonic plates meet
5. ________________________________________________________________
________________________________________________________________
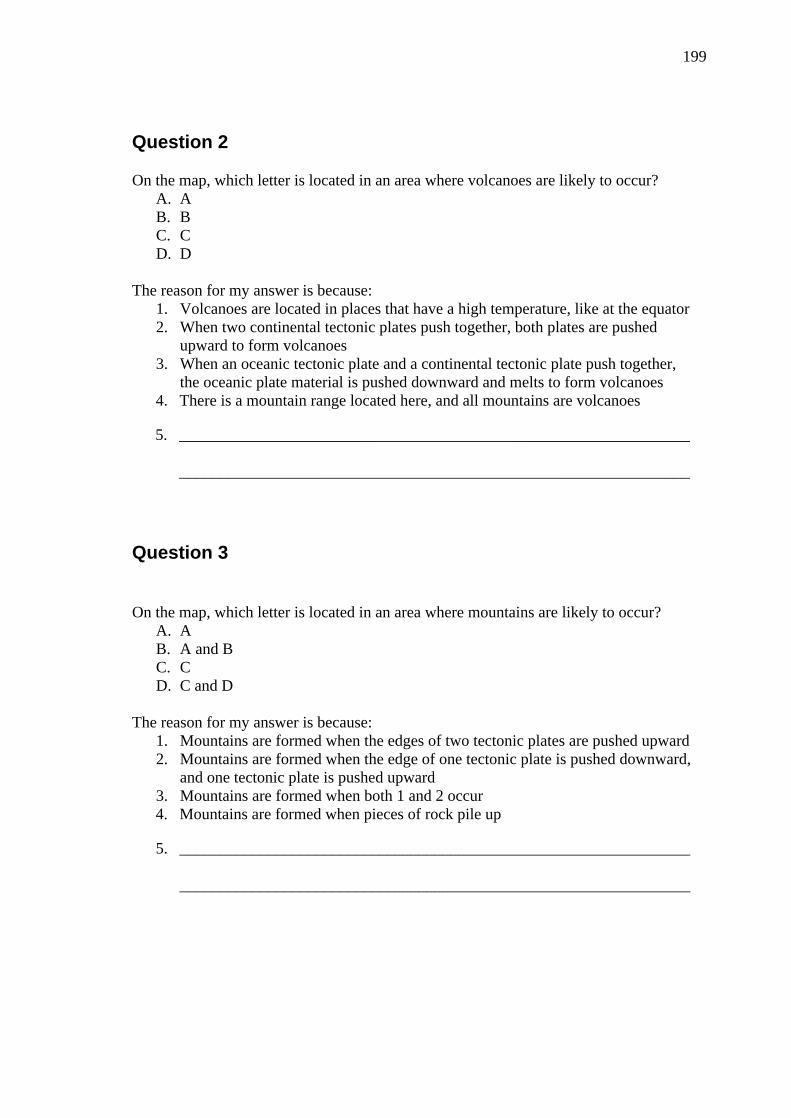
199
Question 2
On the map, which letter is located in an area where volcanoes are likely to occur?A. AB. BC. CD. D
The reason for my answer is because: 1. Volcanoes are located in places that have a high temperature, like at the equator2. When two continental tectonic plates push together, both plates are pushed
upward to form volcanoes3. When an oceanic tectonic plate and a continental tectonic plate push together,
the oceanic plate material is pushed downward and melts to form volcanoes4. There is a mountain range located here, and all mountains are volcanoes
5. ________________________________________________________________
________________________________________________________________
Question 3
On the map, which letter is located in an area where mountains are likely to occur?A. AB. A and BC. CD. C and D
The reason for my answer is because:1. Mountains are formed when the edges of two tectonic plates are pushed upward2. Mountains are formed when the edge of one tectonic plate is pushed downward,
and one tectonic plate is pushed upward3. Mountains are formed when both 1 and 2 occur4. Mountains are formed when pieces of rock pile up
5. ________________________________________________________________
________________________________________________________________
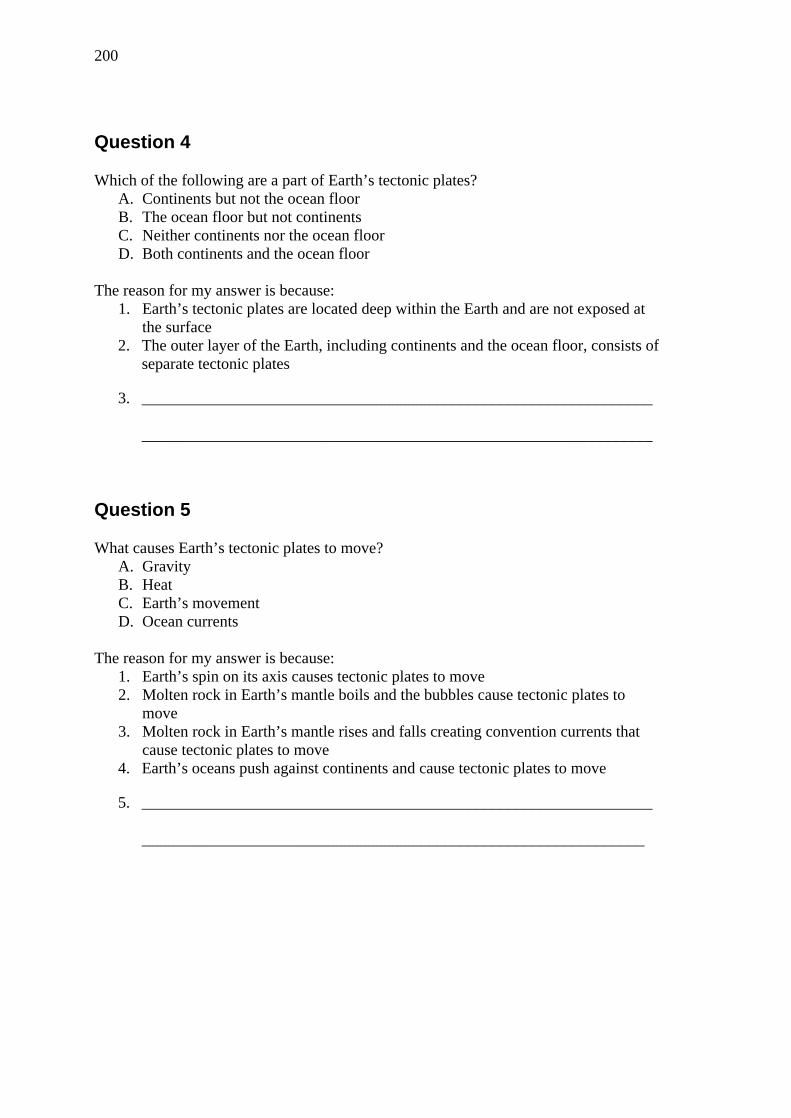
200
Question 4
Which of the following are a part of Earth’s tectonic plates?A. Continents but not the ocean floorB. The ocean floor but not continentsC. Neither continents nor the ocean floorD. Both continents and the ocean floor
The reason for my answer is because:1. Earth’s tectonic plates are located deep within the Earth and are not exposed at
the surface2. The outer layer of the Earth, including continents and the ocean floor, consists of
separate tectonic plates
3. ________________________________________________________________
________________________________________________________________
Question 5
What causes Earth’s tectonic plates to move?A. GravityB. HeatC. Earth’s movementD. Ocean currents
The reason for my answer is because:1. Earth’s spin on its axis causes tectonic plates to move2. Molten rock in Earth’s mantle boils and the bubbles cause tectonic plates to
move3. Molten rock in Earth’s mantle rises and falls creating convention currents that
cause tectonic plates to move4. Earth’s oceans push against continents and cause tectonic plates to move
5. ________________________________________________________________
_______________________________________________________________
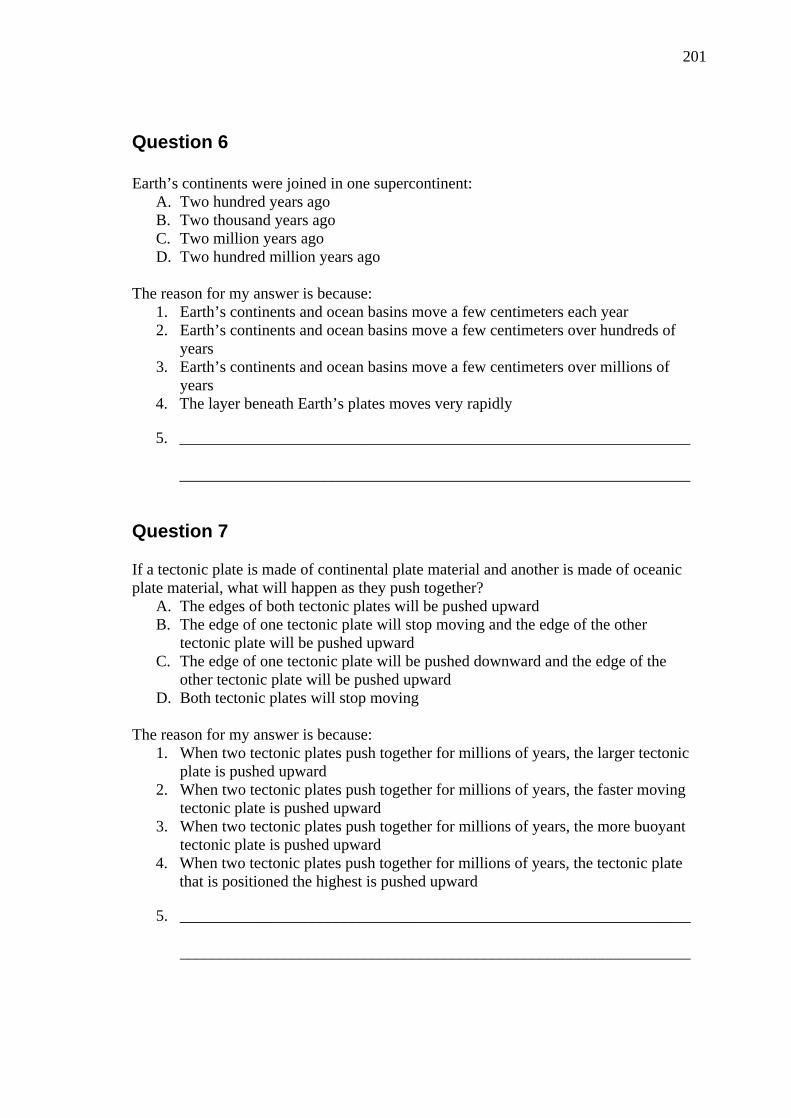
201
Question 6
Earth’s continents were joined in one supercontinent:A. Two hundred years agoB. Two thousand years agoC. Two million years agoD. Two hundred million years ago
The reason for my answer is because:1. Earth’s continents and ocean basins move a few centimeters each year2. Earth’s continents and ocean basins move a few centimeters over hundreds of
years3. Earth’s continents and ocean basins move a few centimeters over millions of
years4. The layer beneath Earth’s plates moves very rapidly
5. ________________________________________________________________
________________________________________________________________
Question 7
If a tectonic plate is made of continental plate material and another is made of oceanic plate material, what will happen as they push together?
A. The edges of both tectonic plates will be pushed upwardB. The edge of one tectonic plate will stop moving and the edge of the other
tectonic plate will be pushed upwardC. The edge of one tectonic plate will be pushed downward and the edge of the
other tectonic plate will be pushed upwardD. Both tectonic plates will stop moving
The reason for my answer is because:1. When two tectonic plates push together for millions of years, the larger tectonic
plate is pushed upward2. When two tectonic plates push together for millions of years, the faster moving
tectonic plate is pushed upward3. When two tectonic plates push together for millions of years, the more buoyant
tectonic plate is pushed upward4. When two tectonic plates push together for millions of years, the tectonic plate
that is positioned the highest is pushed upward
5. ________________________________________________________________
________________________________________________________________
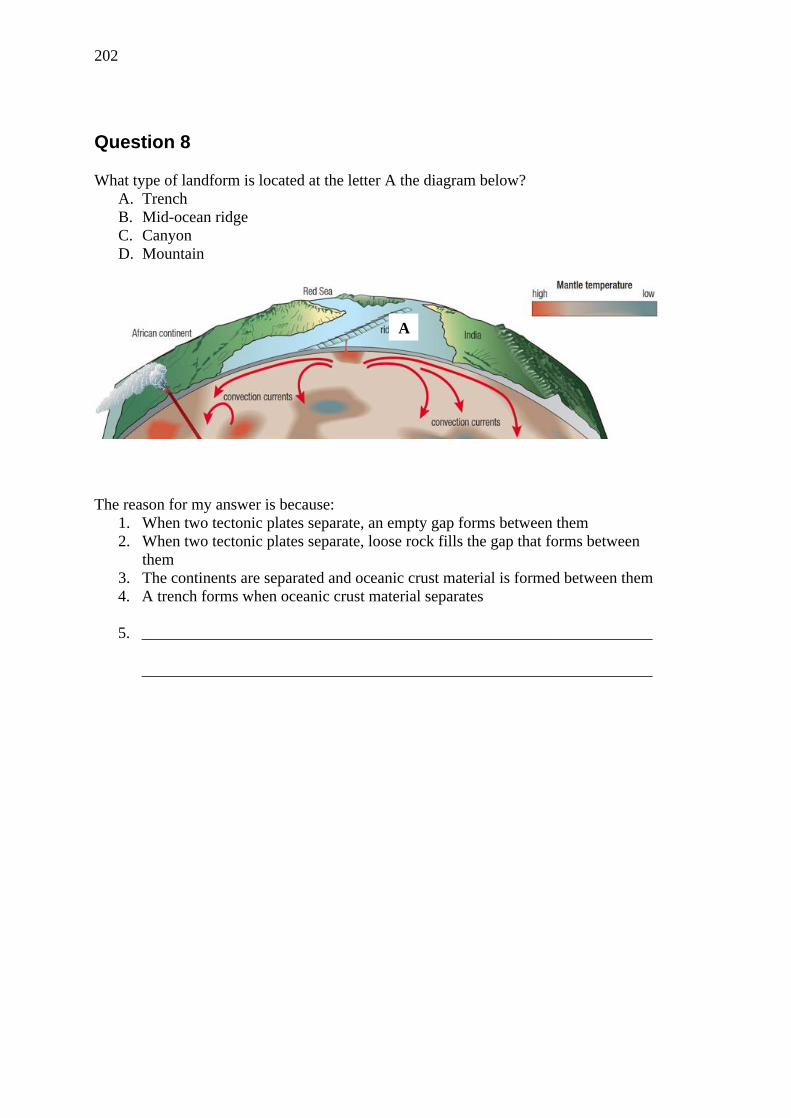
202
Question 8
What type of landform is located at the letter A the diagram below?A. TrenchB. Mid-ocean ridgeC. CanyonD. Mountain
The reason for my answer is because:1. When two tectonic plates separate, an empty gap forms between them2. When two tectonic plates separate, loose rock fills the gap that forms between
them3. The continents are separated and oceanic crust material is formed between them4. A trench forms when oceanic crust material separates
5. ________________________________________________________________
________________________________________________________________
A

203
Question 9
Which diagram below represents how an earthquake may occur?A. B. C.
The reason for my answer is because:1. Earthquakes occur at plate boundaries when two tectonic plates crash together2. Earthquakes occur at plate boundaries when two tectonic plates suddenly move
apart3. Earthquakes occur along breaks in rock where one side moves4. Earthquakes occur when two tectonic plates rub together
5. ________________________________________________________________
________________________________________________________________
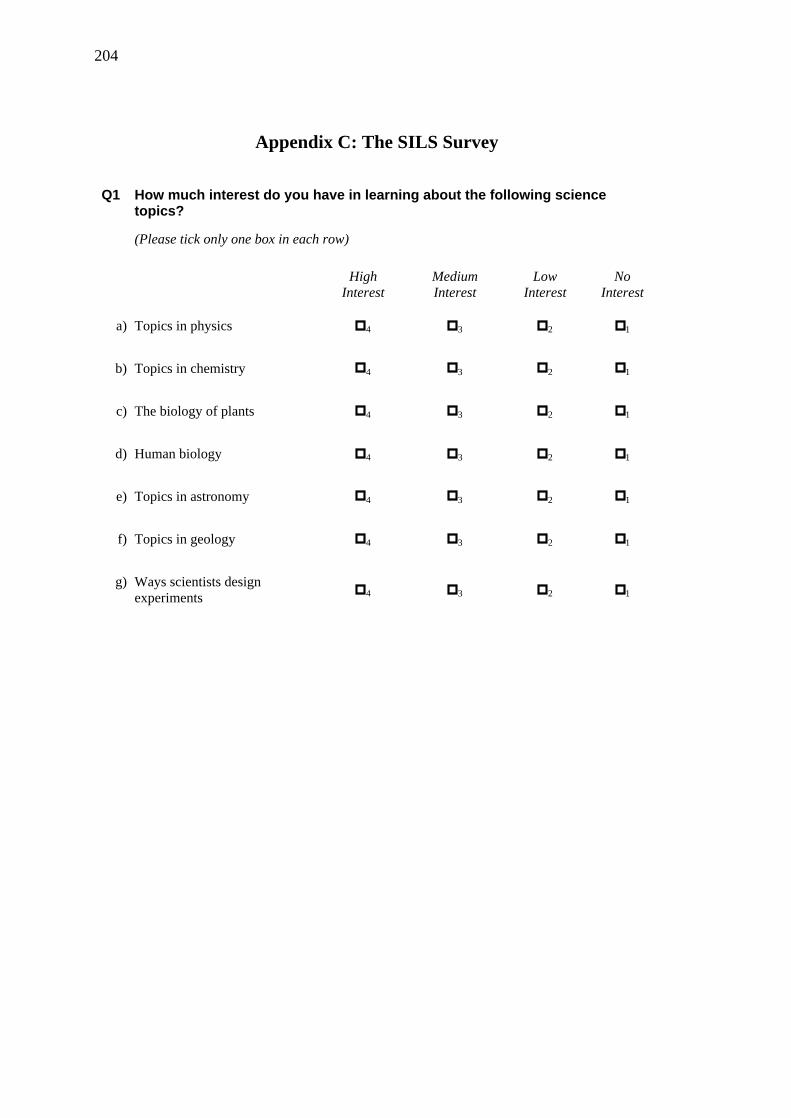
204
Appendix C: The SILS Survey
Q1 How much interest do you have in learning about the following science topics?
(Please tick only one box in each row)
High Interest
Medium Interest
Low Interest
No Interest
a) Topics in physics 4 3 2 1
b) Topics in chemistry 4 3 2 1
c) The biology of plants 4 3 2 1
d) Human biology 4 3 2 1
e) Topics in astronomy 4 3 2 1
f) Topics in geology 4 3 2 1
g) Ways scientists design experiments 4 3 2 1
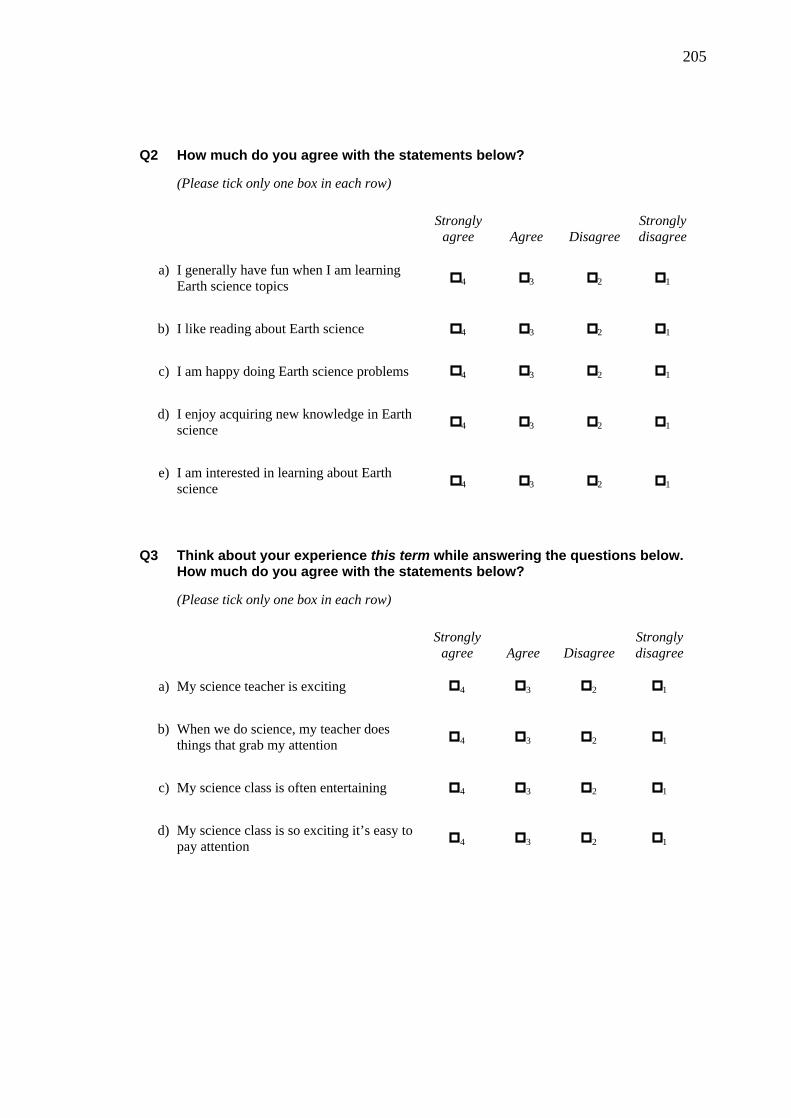
205
Q2 How much do you agree with the statements below?
(Please tick only one box in each row)
Strongly agree Agree Disagree
Strongly disagree
a) I generally have fun when I am learning Earth science topics 4 3 2 1
b) I like reading about Earth science 4 3 2 1
c) I am happy doing Earth science problems 4 3 2 1
d) I enjoy acquiring new knowledge in Earth science 4 3 2 1
e) I am interested in learning about Earth science 4 3 2 1
Q3 Think about your experience this term while answering the questions below. How much do you agree with the statements below?
(Please tick only one box in each row)
Strongly agree Agree Disagree
Strongly disagree
a) My science teacher is exciting 4 3 2 1
b) When we do science, my teacher does things that grab my attention 4 3 2 1
c) My science class is often entertaining 4 3 2 1
d) My science class is so exciting it’s easy to pay attention 4 3 2 1
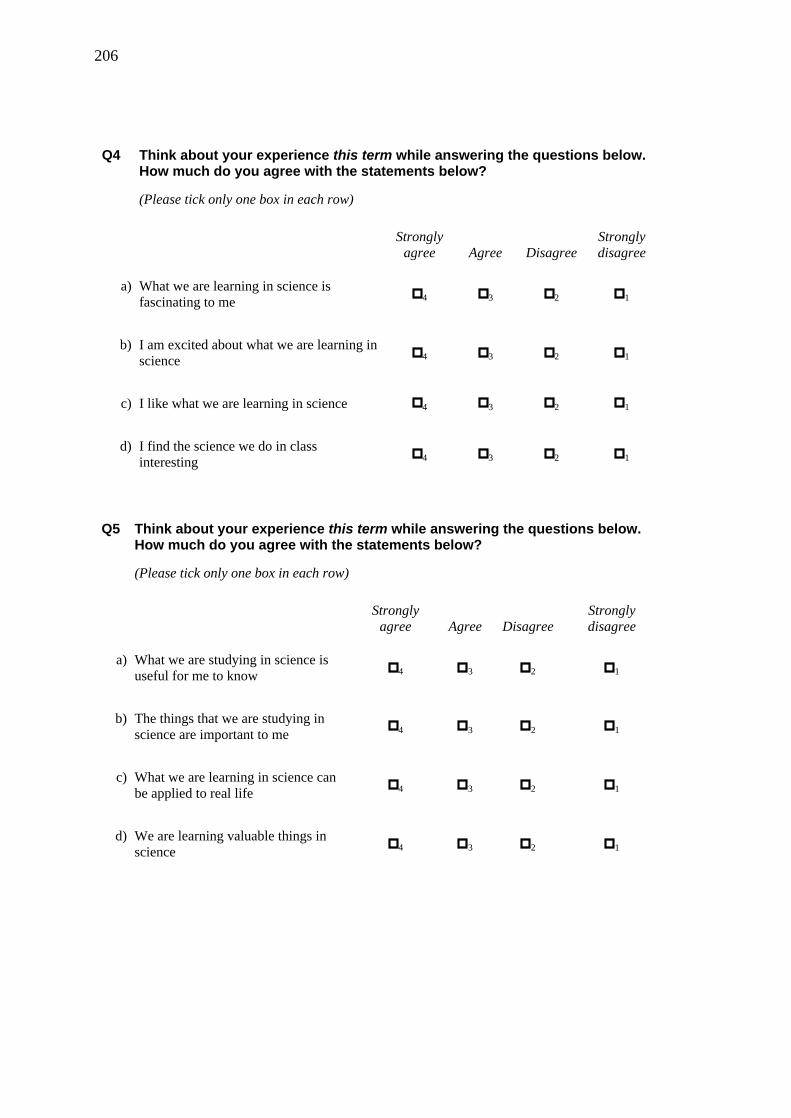
206
Q4 Think about your experience this term while answering the questions below. How much do you agree with the statements below?
(Please tick only one box in each row)
Strongly agree Agree Disagree
Strongly disagree
a) What we are learning in science is fascinating to me 4 3 2 1
b) I am excited about what we are learning in science 4 3 2 1
c) I like what we are learning in science 4 3 2 1
d) I find the science we do in class interesting 4 3 2 1
Q5 Think about your experience this term while answering the questions below. How much do you agree with the statements below?
(Please tick only one box in each row)
Strongly agree Agree Disagree
Strongly disagree
a) What we are studying in science is useful for me to know 4 3 2 1
b) The things that we are studying in science are important to me 4 3 2 1
c) What we are learning in science can be applied to real life 4 3 2 1
d) We are learning valuable things in science 4 3 2 1
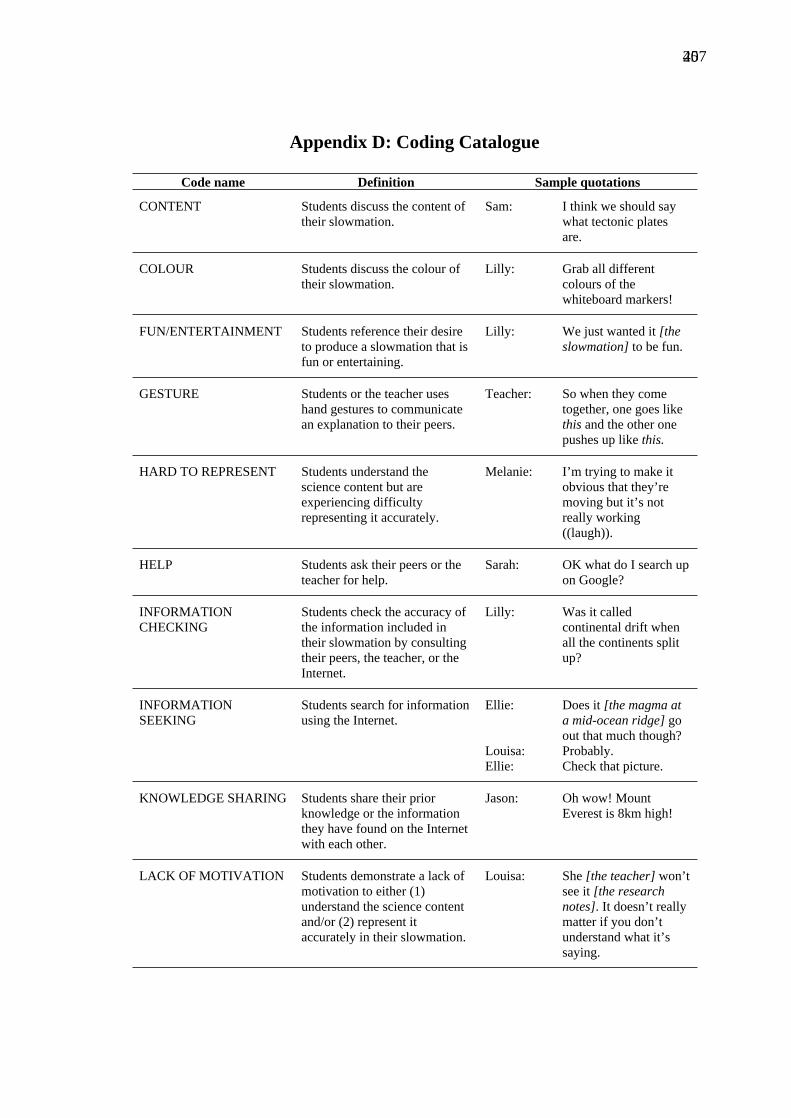
45207
Appendix D: Coding Catalogue
Code name Definition Sample quotations
CONTENT Students discuss the content of their slowmation.
Sam: I think we should say what tectonic plates are.
COLOUR Students discuss the colour of their slowmation.
Lilly: Grab all different colours of the whiteboard markers!
FUN/ENTERTAINMENT Students reference their desire to produce a slowmation that is fun or entertaining.
Lilly: We just wanted it [the slowmation] to be fun.
GESTURE Students or the teacher uses hand gestures to communicate an explanation to their peers.
Teacher: So when they come together, one goes like this and the other one pushes up like this.
HARD TO REPRESENT Students understand the science content but are experiencing difficulty representing it accurately.
Melanie: I’m trying to make it obvious that they’re moving but it’s not really working ((laugh)).
HELP Students ask their peers or the teacher for help.
Sarah: OK what do I search up on Google?
INFORMATION CHECKING
Students check the accuracy of the information included in their slowmation by consulting their peers, the teacher, or the Internet.
Lilly: Was it called continental drift when all the continents split up?
Ellie: Does it [the magma at a mid-ocean ridge] go out that much though?
Louisa: Probably.
INFORMATION SEEKING
Students search for information using the Internet.
Ellie: Check that picture.
KNOWLEDGE SHARING Students share their prior knowledge or the information they have found on the Internet with each other.
Jason: Oh wow! Mount Everest is 8km high!
LACK OF MOTIVATION Students demonstrate a lack of motivation to either (1) understand the science content and/or (2) represent it accurately in their slowmation.
Louisa: She [the teacher] won’t see it [the research notes]. It doesn’t really matter if you don’t understand what it’s saying.
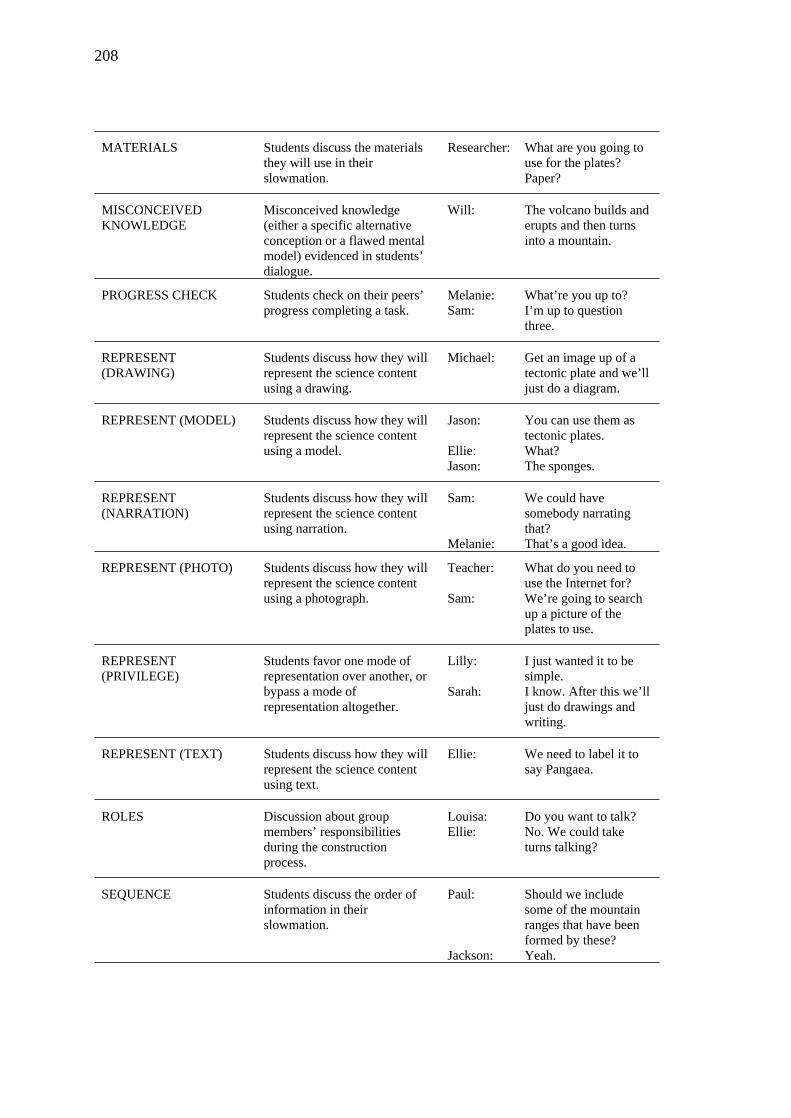
208
MATERIALS Students discuss the materials they will use in their slowmation.
Researcher: What are you going to use for the plates? Paper?
MISCONCEIVED KNOWLEDGE
Misconceived knowledge (either a specific alternative conception or a flawed mental model) evidenced in students’ dialogue.
Will: The volcano builds and erupts and then turns into a mountain.
Melanie: What’re you up to?PROGRESS CHECK Students check on their peers’ progress completing a task. Sam: I’m up to question
three.
REPRESENT (DRAWING)
Students discuss how they will represent the science content using a drawing.
Michael: Get an image up of a tectonic plate and we’ll just do a diagram.
Jason: You can use them as tectonic plates.
Ellie: What?
REPRESENT (MODEL) Students discuss how they will represent the science content using a model.
Jason: The sponges.
Sam: We could have somebody narrating that?
REPRESENT (NARRATION)
Students discuss how they will represent the science content using narration.
Melanie: That’s a good idea.
Teacher: What do you need to use the Internet for?
REPRESENT (PHOTO) Students discuss how they will represent the science content using a photograph. Sam: We’re going to search
up a picture of the plates to use.
Lilly: I just wanted it to be simple.
REPRESENT (PRIVILEGE)
Students favor one mode of representation over another, or bypass a mode of representation altogether.
Sarah: I know. After this we’ll just do drawings and writing.
REPRESENT (TEXT) Students discuss how they will represent the science content using text.
Ellie: We need to label it to say Pangaea.
Louisa: Do you want to talk?ROLES Discussion about group members’ responsibilities during the construction process.
Ellie: No. We could take turns talking?
Paul: Should we include some of the mountain ranges that have been formed by these?
SEQUENCE Students discuss the order of information in their slowmation.
Jackson: Yeah.
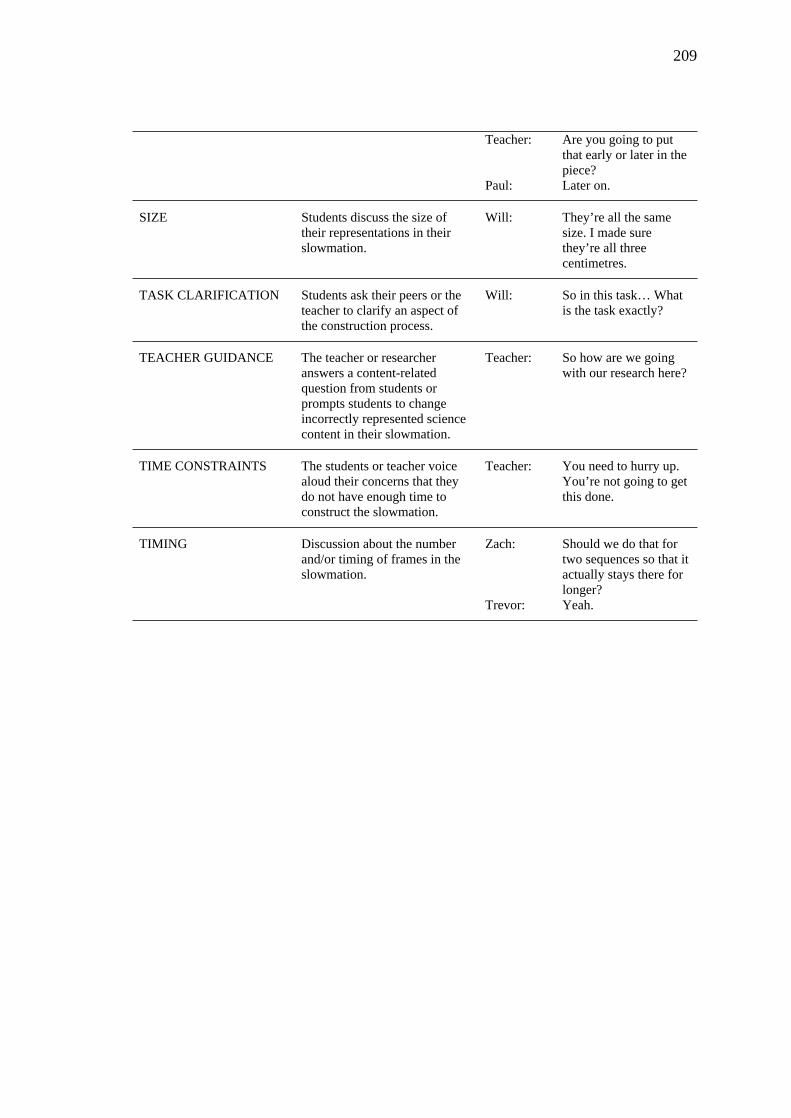
209
Teacher: Are you going to put that early or later in the piece?
Paul: Later on.
SIZE Students discuss the size of their representations in their slowmation.
Will: They’re all the same size. I made sure they’re all three centimetres.
TASK CLARIFICATION Students ask their peers or the teacher to clarify an aspect of the construction process.
Will: So in this task… What is the task exactly?
TEACHER GUIDANCE The teacher or researcher answers a content-related question from students or prompts students to change incorrectly represented science content in their slowmation.
Teacher: So how are we going with our research here?
TIME CONSTRAINTS The students or teacher voice aloud their concerns that they do not have enough time to construct the slowmation.
Teacher: You need to hurry up. You’re not going to get this done.
Zach: Should we do that for two sequences so that it actually stays there for longer?
TIMING Discussion about the number and/or timing of frames in the slowmation.
Trevor: Yeah.
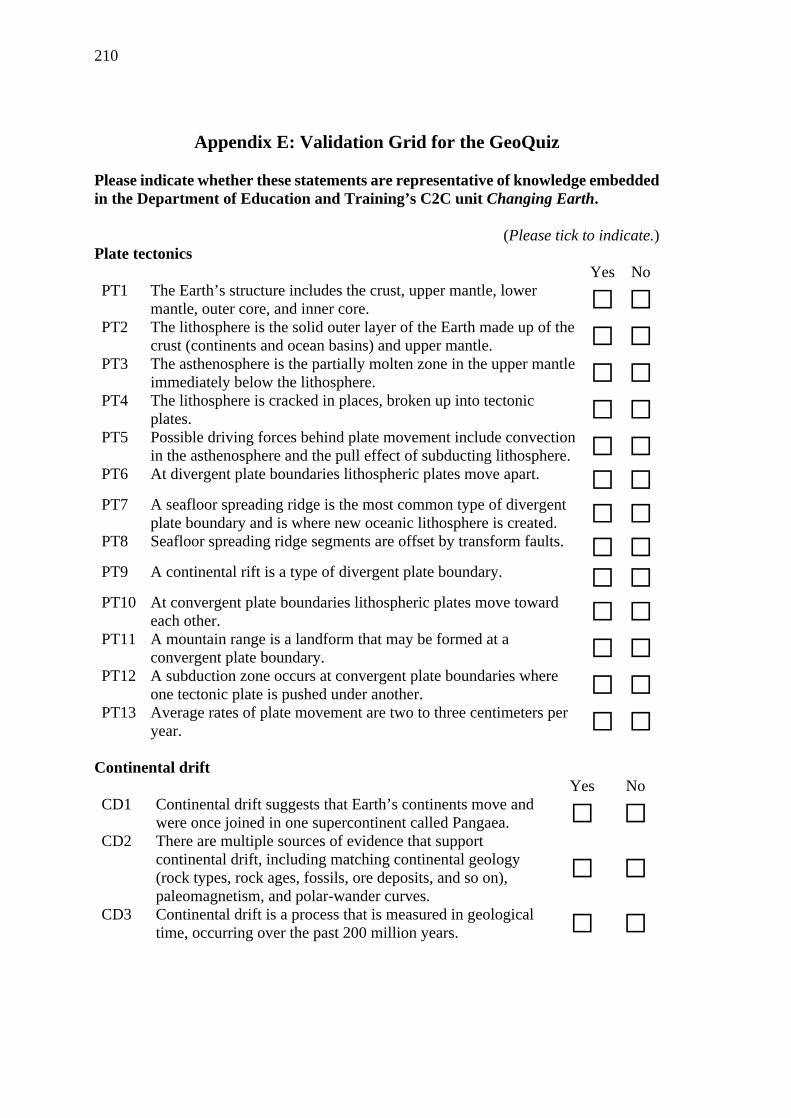
210
Appendix E: Validation Grid for the GeoQuiz
Please indicate whether these statements are representative of knowledge embedded in the Department of Education and Training’s C2C unit Changing Earth.
(Please tick to indicate.)Plate tectonics
Yes NoPT1 The Earth’s structure includes the crust, upper mantle, lower
mantle, outer core, and inner core. ☐ ☐PT2 The lithosphere is the solid outer layer of the Earth made up of the
crust (continents and ocean basins) and upper mantle. ☐ ☐PT3 The asthenosphere is the partially molten zone in the upper mantle
immediately below the lithosphere. ☐ ☐PT4 The lithosphere is cracked in places, broken up into tectonic
plates. ☐ ☐PT5 Possible driving forces behind plate movement include convection
in the asthenosphere and the pull effect of subducting lithosphere. ☐ ☐PT6 At divergent plate boundaries lithospheric plates move apart. ☐ ☐PT7 A seafloor spreading ridge is the most common type of divergent
plate boundary and is where new oceanic lithosphere is created. ☐ ☐PT8 Seafloor spreading ridge segments are offset by transform faults. ☐ ☐PT9 A continental rift is a type of divergent plate boundary. ☐ ☐PT10 At convergent plate boundaries lithospheric plates move toward
each other. ☐ ☐PT11 A mountain range is a landform that may be formed at a
convergent plate boundary. ☐ ☐PT12 A subduction zone occurs at convergent plate boundaries where
one tectonic plate is pushed under another. ☐ ☐PT13 Average rates of plate movement are two to three centimeters per
year. ☐ ☐Continental drift
Yes NoCD1 Continental drift suggests that Earth’s continents move and
were once joined in one supercontinent called Pangaea. ☐ ☐CD2 There are multiple sources of evidence that support
continental drift, including matching continental geology (rock types, rock ages, fossils, ore deposits, and so on), paleomagnetism, and polar-wander curves.
☐ ☐CD3 Continental drift is a process that is measured in geological
time, occurring over the past 200 million years. ☐ ☐
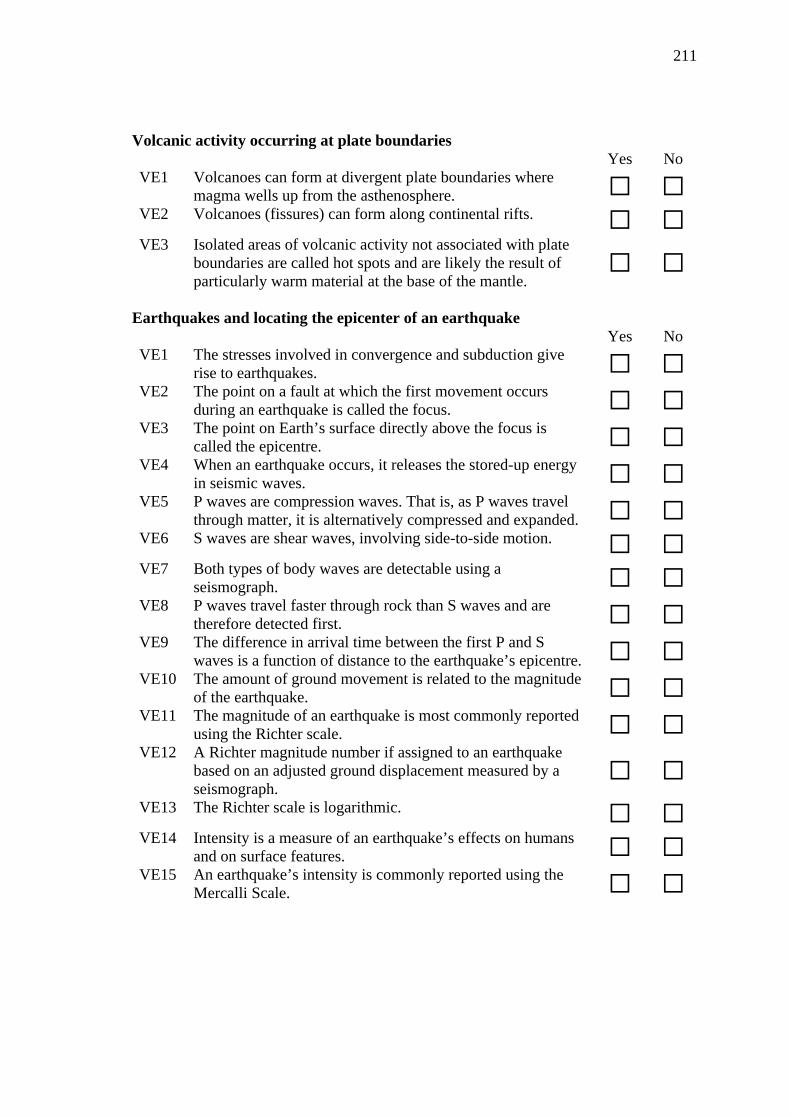
211
Volcanic activity occurring at plate boundariesYes No
VE1 Volcanoes can form at divergent plate boundaries where magma wells up from the asthenosphere. ☐ ☐
VE2 Volcanoes (fissures) can form along continental rifts. ☐ ☐VE3 Isolated areas of volcanic activity not associated with plate
boundaries are called hot spots and are likely the result of particularly warm material at the base of the mantle.
☐ ☐
Earthquakes and locating the epicenter of an earthquakeYes No
VE1 The stresses involved in convergence and subduction give rise to earthquakes. ☐ ☐
VE2 The point on a fault at which the first movement occurs during an earthquake is called the focus. ☐ ☐
VE3 The point on Earth’s surface directly above the focus is called the epicentre. ☐ ☐
VE4 When an earthquake occurs, it releases the stored-up energy in seismic waves. ☐ ☐
VE5 P waves are compression waves. That is, as P waves travel through matter, it is alternatively compressed and expanded. ☐ ☐
VE6 S waves are shear waves, involving side-to-side motion. ☐ ☐VE7 Both types of body waves are detectable using a
seismograph. ☐ ☐VE8 P waves travel faster through rock than S waves and are
therefore detected first. ☐ ☐VE9 The difference in arrival time between the first P and S
waves is a function of distance to the earthquake’s epicentre. ☐ ☐VE10 The amount of ground movement is related to the magnitude
of the earthquake. ☐ ☐VE11 The magnitude of an earthquake is most commonly reported
using the Richter scale. ☐ ☐VE12 A Richter magnitude number if assigned to an earthquake
based on an adjusted ground displacement measured by a seismograph.
☐ ☐VE13 The Richter scale is logarithmic. ☐ ☐VE14 Intensity is a measure of an earthquake’s effects on humans
and on surface features. ☐ ☐VE15 An earthquake’s intensity is commonly reported using the
Mercalli Scale. ☐ ☐
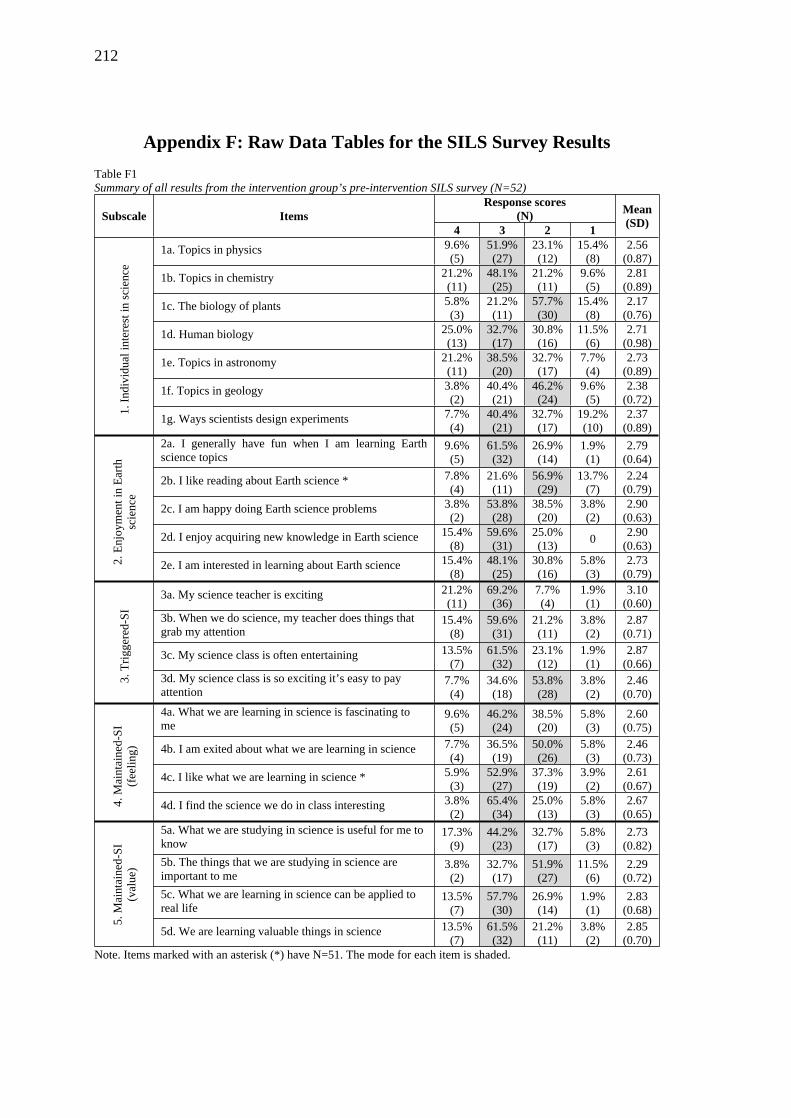
212
Appendix F: Raw Data Tables for the SILS Survey ResultsTable F1Summary of all results from the intervention group’s pre-intervention SILS survey (N=52)
Response scores(N)Subscale Items
4 3 2 1
Mean(SD)
1a. Topics in physics 9.6%(5)
51.9%(27)
23.1%(12)
15.4%(8)
2.56(0.87)
1b. Topics in chemistry 21.2%(11)
48.1%(25)
21.2%(11)
9.6%(5)
2.81(0.89)
1c. The biology of plants 5.8%(3)
21.2%(11)
57.7%(30)
15.4%(8)
2.17(0.76)
1d. Human biology 25.0%(13)
32.7%(17)
30.8%(16)
11.5%(6)
2.71(0.98)
1e. Topics in astronomy 21.2%(11)
38.5%(20)
32.7%(17)
7.7%(4)
2.73(0.89)
1f. Topics in geology 3.8%(2)
40.4%(21)
46.2%(24)
9.6%(5)
2.38(0.72)
1. In
divi
dual
inte
rest
in sc
ienc
e
1g. Ways scientists design experiments 7.7%(4)
40.4%(21)
32.7%(17)
19.2%(10)
2.37(0.89)
2a. I generally have fun when I am learning Earth science topics
9.6%(5)
61.5%(32)
26.9%(14)
1.9%(1)
2.79(0.64)
2b. I like reading about Earth science * 7.8%(4)
21.6%(11)
56.9%(29)
13.7%(7)
2.24(0.79)
2c. I am happy doing Earth science problems 3.8%(2)
53.8%(28)
38.5%(20)
3.8%(2)
2.90(0.63)
2d. I enjoy acquiring new knowledge in Earth science 15.4%(8)
59.6%(31)
25.0%(13) 0 2.90
(0.63)
2. E
njoy
men
t in
Earth
sc
ienc
e
2e. I am interested in learning about Earth science 15.4%(8)
48.1%(25)
30.8%(16)
5.8%(3)
2.73(0.79)
3a. My science teacher is exciting 21.2%(11)
69.2%(36)
7.7%(4)
1.9%(1)
3.10(0.60)
3b. When we do science, my teacher does things that grab my attention
15.4%(8)
59.6%(31)
21.2%(11)
3.8%(2)
2.87(0.71)
3c. My science class is often entertaining 13.5%(7)
61.5%(32)
23.1%(12)
1.9%(1)
2.87(0.66)
3. T
rigge
red-
SI
3d. My science class is so exciting it’s easy to pay attention
7.7%(4)
34.6%(18)
53.8%(28)
3.8%(2)
2.46(0.70)
4a. What we are learning in science is fascinating to me
9.6%(5)
46.2%(24)
38.5%(20)
5.8%(3)
2.60(0.75)
4b. I am exited about what we are learning in science 7.7%(4)
36.5%(19)
50.0%(26)
5.8%(3)
2.46(0.73)
4c. I like what we are learning in science * 5.9%(3)
52.9%(27)
37.3%(19)
3.9%(2)
2.61(0.67)
4. M
aint
aine
d-SI
(f
eelin
g)
4d. I find the science we do in class interesting 3.8%(2)
65.4%(34)
25.0%(13)
5.8%(3)
2.67(0.65)
5a. What we are studying in science is useful for me to know
17.3%(9)
44.2%(23)
32.7%(17)
5.8%(3)
2.73(0.82)
5b. The things that we are studying in science are important to me
3.8%(2)
32.7%(17)
51.9%(27)
11.5%(6)
2.29(0.72)
5c. What we are learning in science can be applied to real life
13.5%(7)
57.7%(30)
26.9%(14)
1.9%(1)
2.83(0.68)
5. M
aint
aine
d-SI
(v
alue
)
5d. We are learning valuable things in science 13.5%(7)
61.5%(32)
21.2%(11)
3.8%(2)
2.85(0.70)
Note. Items marked with an asterisk (*) have N=51. The mode for each item is shaded.
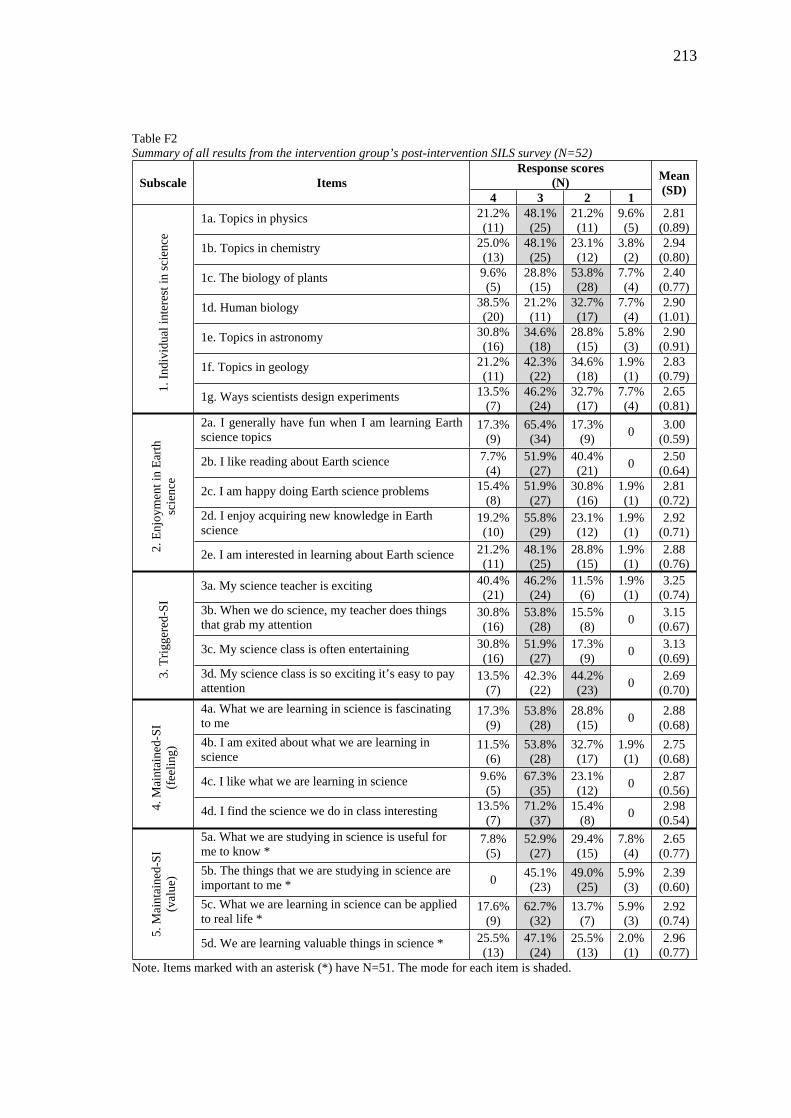
213
Table F2Summary of all results from the intervention group’s post-intervention SILS survey (N=52)
Response scores(N)Subscale Items
4 3 2 1
Mean(SD)
1a. Topics in physics 21.2%(11)
48.1%(25)
21.2%(11)
9.6%(5)
2.81(0.89)
1b. Topics in chemistry 25.0%(13)
48.1%(25)
23.1%(12)
3.8%(2)
2.94(0.80)
1c. The biology of plants 9.6%(5)
28.8%(15)
53.8%(28)
7.7%(4)
2.40(0.77)
1d. Human biology 38.5%(20)
21.2%(11)
32.7%(17)
7.7%(4)
2.90(1.01)
1e. Topics in astronomy 30.8%(16)
34.6%(18)
28.8%(15)
5.8%(3)
2.90(0.91)
1f. Topics in geology 21.2%(11)
42.3%(22)
34.6%(18)
1.9%(1)
2.83(0.79)
1. In
divi
dual
inte
rest
in sc
ienc
e
1g. Ways scientists design experiments 13.5%(7)
46.2%(24)
32.7%(17)
7.7%(4)
2.65(0.81)
2a. I generally have fun when I am learning Earth science topics
17.3%(9)
65.4%(34)
17.3%(9) 0 3.00
(0.59)
2b. I like reading about Earth science 7.7%(4)
51.9%(27)
40.4%(21) 0 2.50
(0.64)2c. I am happy doing Earth science problems 15.4%
(8)51.9%(27)
30.8%(16)
1.9%(1)
2.81(0.72)
2d. I enjoy acquiring new knowledge in Earth science
19.2%(10)
55.8%(29)
23.1%(12)
1.9%(1)
2.92(0.71)
2. E
njoy
men
t in
Earth
sc
ienc
e
2e. I am interested in learning about Earth science 21.2%(11)
48.1%(25)
28.8%(15)
1.9%(1)
2.88(0.76)
3a. My science teacher is exciting 40.4%(21)
46.2%(24)
11.5%(6)
1.9%(1)
3.25(0.74)
3b. When we do science, my teacher does things that grab my attention
30.8%(16)
53.8%(28)
15.5%(8) 0 3.15
(0.67)
3c. My science class is often entertaining 30.8%(16)
51.9%(27)
17.3%(9) 0 3.13
(0.69)
3. T
rigge
red-
SI
3d. My science class is so exciting it’s easy to pay attention
13.5%(7)
42.3%(22)
44.2%(23) 0 2.69
(0.70)4a. What we are learning in science is fascinating to me
17.3%(9)
53.8%(28)
28.8%(15) 0 2.88
(0.68)4b. I am exited about what we are learning in science
11.5%(6)
53.8%(28)
32.7%(17)
1.9%(1)
2.75(0.68)
4c. I like what we are learning in science 9.6%(5)
67.3%(35)
23.1%(12) 0 2.87
(0.56)
4. M
aint
aine
d-SI
(f
eelin
g)
4d. I find the science we do in class interesting 13.5%(7)
71.2%(37)
15.4%(8) 0 2.98
(0.54)5a. What we are studying in science is useful for me to know *
7.8%(5)
52.9%(27)
29.4%(15)
7.8%(4)
2.65(0.77)
5b. The things that we are studying in science are important to me * 0 45.1%
(23)49.0%(25)
5.9%(3)
2.39(0.60)
5c. What we are learning in science can be applied to real life *
17.6%(9)
62.7%(32)
13.7%(7)
5.9%(3)
2.92(0.74)
5. M
aint
aine
d-SI
(v
alue
)
5d. We are learning valuable things in science * 25.5%(13)
47.1%(24)
25.5%(13)
2.0%(1)
2.96(0.77)
Note. Items marked with an asterisk (*) have N=51. The mode for each item is shaded.
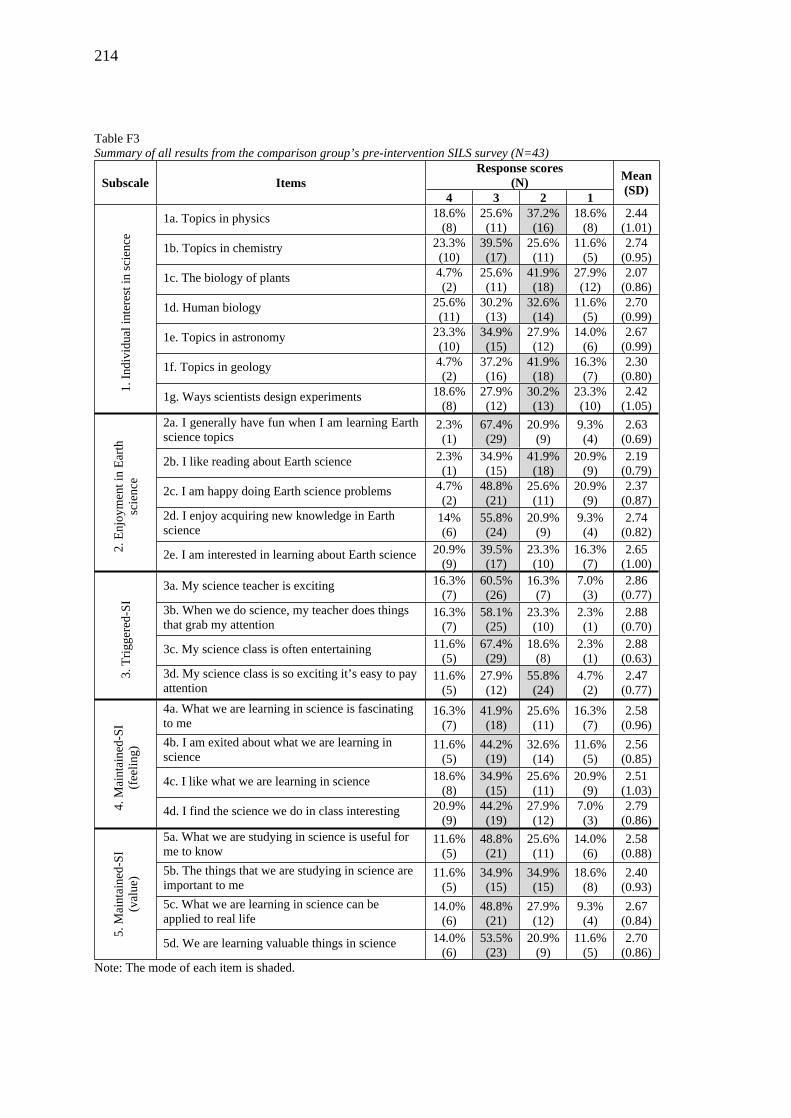
214
Table F3Summary of all results from the comparison group’s pre-intervention SILS survey (N=43)
Response scores(N)Subscale Items
4 3 2 1
Mean(SD)
1a. Topics in physics 18.6%(8)
25.6%(11)
37.2%(16)
18.6%(8)
2.44(1.01)
1b. Topics in chemistry 23.3%(10)
39.5%(17)
25.6%(11)
11.6%(5)
2.74(0.95)
1c. The biology of plants 4.7%(2)
25.6%(11)
41.9%(18)
27.9%(12)
2.07(0.86)
1d. Human biology 25.6%(11)
30.2%(13)
32.6%(14)
11.6%(5)
2.70(0.99)
1e. Topics in astronomy 23.3%(10)
34.9%(15)
27.9%(12)
14.0%(6)
2.67(0.99)
1f. Topics in geology 4.7%(2)
37.2%(16)
41.9%(18)
16.3%(7)
2.30(0.80)
1. In
divi
dual
inte
rest
in sc
ienc
e
1g. Ways scientists design experiments 18.6%(8)
27.9%(12)
30.2%(13)
23.3%(10)
2.42(1.05)
2a. I generally have fun when I am learning Earth science topics
2.3%(1)
67.4%(29)
20.9%(9)
9.3%(4)
2.63(0.69)
2b. I like reading about Earth science 2.3%(1)
34.9%(15)
41.9%(18)
20.9%(9)
2.19(0.79)
2c. I am happy doing Earth science problems 4.7%(2)
48.8%(21)
25.6%(11)
20.9%(9)
2.37(0.87)
2d. I enjoy acquiring new knowledge in Earth science
14%(6)
55.8%(24)
20.9%(9)
9.3%(4)
2.74(0.82)
2. E
njoy
men
t in
Earth
sc
ienc
e
2e. I am interested in learning about Earth science 20.9%(9)
39.5%(17)
23.3%(10)
16.3%(7)
2.65(1.00)
3a. My science teacher is exciting 16.3%(7)
60.5%(26)
16.3%(7)
7.0%(3)
2.86(0.77)
3b. When we do science, my teacher does things that grab my attention
16.3%(7)
58.1%(25)
23.3%(10)
2.3%(1)
2.88(0.70)
3c. My science class is often entertaining 11.6%(5)
67.4%(29)
18.6%(8)
2.3%(1)
2.88(0.63)
3. T
rigge
red-
SI
3d. My science class is so exciting it’s easy to pay attention
11.6%(5)
27.9%(12)
55.8%(24)
4.7%(2)
2.47(0.77)
4a. What we are learning in science is fascinating to me
16.3%(7)
41.9%(18)
25.6%(11)
16.3%(7)
2.58(0.96)
4b. I am exited about what we are learning in science
11.6%(5)
44.2%(19)
32.6%(14)
11.6%(5)
2.56(0.85)
4c. I like what we are learning in science 18.6%(8)
34.9%(15)
25.6%(11)
20.9%(9)
2.51(1.03)
4. M
aint
aine
d-SI
(f
eelin
g)
4d. I find the science we do in class interesting 20.9%(9)
44.2%(19)
27.9%(12)
7.0%(3)
2.79(0.86)
5a. What we are studying in science is useful for me to know
11.6%(5)
48.8%(21)
25.6%(11)
14.0%(6)
2.58(0.88)
5b. The things that we are studying in science are important to me
11.6%(5)
34.9%(15)
34.9%(15)
18.6%(8)
2.40(0.93)
5c. What we are learning in science can be applied to real life
14.0%(6)
48.8%(21)
27.9%(12)
9.3%(4)
2.67(0.84)
5. M
aint
aine
d-SI
(v
alue
)
5d. We are learning valuable things in science 14.0%(6)
53.5%(23)
20.9%(9)
11.6%(5)
2.70(0.86)
Note: The mode of each item is shaded.
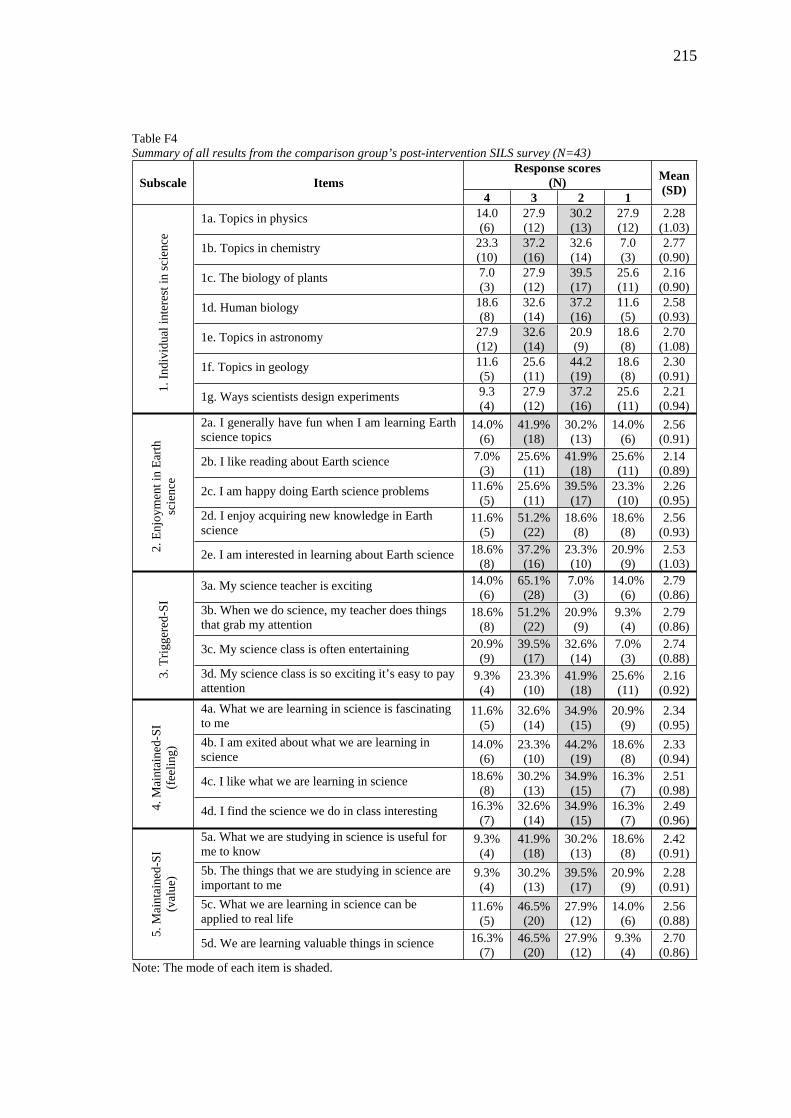
215
Table F4Summary of all results from the comparison group’s post-intervention SILS survey (N=43)
Response scores(N)Subscale Items
4 3 2 1
Mean(SD)
1a. Topics in physics 14.0(6)
27.9(12)
30.2(13)
27.9(12)
2.28(1.03)
1b. Topics in chemistry 23.3(10)
37.2(16)
32.6(14)
7.0(3)
2.77(0.90)
1c. The biology of plants 7.0(3)
27.9(12)
39.5(17)
25.6(11)
2.16(0.90)
1d. Human biology 18.6(8)
32.6(14)
37.2(16)
11.6(5)
2.58(0.93)
1e. Topics in astronomy 27.9(12)
32.6(14)
20.9(9)
18.6(8)
2.70(1.08)
1f. Topics in geology 11.6(5)
25.6(11)
44.2(19)
18.6(8)
2.30(0.91)
1. In
divi
dual
inte
rest
in sc
ienc
e
1g. Ways scientists design experiments 9.3(4)
27.9(12)
37.2(16)
25.6(11)
2.21(0.94)
2a. I generally have fun when I am learning Earth science topics
14.0%(6)
41.9%(18)
30.2%(13)
14.0%(6)
2.56(0.91)
2b. I like reading about Earth science 7.0%(3)
25.6%(11)
41.9%(18)
25.6%(11)
2.14(0.89)
2c. I am happy doing Earth science problems 11.6%(5)
25.6%(11)
39.5%(17)
23.3%(10)
2.26(0.95)
2d. I enjoy acquiring new knowledge in Earth science
11.6%(5)
51.2%(22)
18.6%(8)
18.6%(8)
2.56(0.93)
2. E
njoy
men
t in
Earth
sc
ienc
e
2e. I am interested in learning about Earth science 18.6%(8)
37.2%(16)
23.3%(10)
20.9%(9)
2.53(1.03)
3a. My science teacher is exciting 14.0%(6)
65.1%(28)
7.0%(3)
14.0%(6)
2.79(0.86)
3b. When we do science, my teacher does things that grab my attention
18.6%(8)
51.2%(22)
20.9%(9)
9.3%(4)
2.79(0.86)
3c. My science class is often entertaining 20.9%(9)
39.5%(17)
32.6%(14)
7.0%(3)
2.74(0.88)
3. T
rigge
red-
SI
3d. My science class is so exciting it’s easy to pay attention
9.3%(4)
23.3%(10)
41.9%(18)
25.6%(11)
2.16(0.92)
4a. What we are learning in science is fascinating to me
11.6%(5)
32.6%(14)
34.9%(15)
20.9%(9)
2.34(0.95)
4b. I am exited about what we are learning in science
14.0%(6)
23.3%(10)
44.2%(19)
18.6%(8)
2.33(0.94)
4c. I like what we are learning in science 18.6%(8)
30.2%(13)
34.9%(15)
16.3%(7)
2.51(0.98)
4. M
aint
aine
d-SI
(f
eelin
g)
4d. I find the science we do in class interesting 16.3%(7)
32.6%(14)
34.9%(15)
16.3%(7)
2.49(0.96)
5a. What we are studying in science is useful for me to know
9.3%(4)
41.9%(18)
30.2%(13)
18.6%(8)
2.42(0.91)
5b. The things that we are studying in science are important to me
9.3%(4)
30.2%(13)
39.5%(17)
20.9%(9)
2.28(0.91)
5c. What we are learning in science can be applied to real life
11.6%(5)
46.5%(20)
27.9%(12)
14.0%(6)
2.56(0.88)
5. M
aint
aine
d-SI
(v
alue
)
5d. We are learning valuable things in science 16.3%(7)
46.5%(20)
27.9%(12)
9.3%(4)
2.70(0.86)
Note: The mode of each item is shaded.