REPORTS - ARS Home : USDA ARS appeared ~60 million years ago ( 1). Cattle represent the Ruminantia,...
7
second model, the two main conditions were para- metrically modulated by the two categories, respectively (SOM, S5.1). The activation of the precuneus was higher for hard dominance-solvable games than for easy ones (Fig. 4A and table S10). The activation of the insula was higher for the highly focal coordination games than for less fo- cal ones (Fig. 4B and table S11). Previous studies also found that precuneus activity increased when the number of planned moves increased (40, 41). The higher demand for memory-related imagery and memory retrieval may explain the greater precuneus activation in hard dominance-solvable games. In highly focal coordination games, the participants may have felt quite strongly that the pool students must notice the same salient fea- ture. This may explain why insula activation cor- relates with NCI. Participants might have disagreed about which games were difficult. We built a third model to investigate whether the frontoparietal activation correlates with how hard a dominance-solvable game is and whether the activation in insula and ACC correlates with how easy a coordination game is. Here, the two main conditions were para- metrically modulated by each participant’ s proba- bility of obtaining a reward in each game (SOM, S2.2 and S5.2). We found a negative correlation between the activation of the precuneus and the participant’ s probability of obtaining a reward in dominance-solvable games (Fig. 4C and table S12), which suggests that dominance-solvable games that yielded lower payoffs presented harder mental challenges. In a previous study on work- ing memory, precuneus activity positively cor- related with response times, a measure of mental effort (24). Both findings are consistent with the interpretation that subjective measures reflecting harder tasks (higher efforts) correlate with acti- vation in precuneus. A positive correlation between insula activation and the participant’ s probability of obtaining a reward again suggests that co- ordination games with a highly salient feature strongly activated the “gut feeling” reported by many participants (Fig. 4D and table S13). A previous study found that the subjective rating of “chills intensity” in music correlates with activa- tion of insula (42). Both findings are consistent with the interpretation that the subjective inten- sity of how salient a stimulus is correlates with activation in insula. As mentioned, choices were made significant- ly faster in coordination games than in dominance- solvable games. The results of the second and third models provide additional support for the idea that intuitive and deliberative mental pro- cesses have quite different properties. The “slow and effortful” process was more heavily taxed when the dominance-solvable games were harder. The “fast and effortless” process was more strongly activated when coordination was easy. References and Notes 1. J. Schaeffer et al., Science 317, 1518 (2007). 2. Previous fMRI studies of game-playing include Gallagher et al. (43) and Bhatt and Camerer (44), but they address different issues. In particular, Bhatt and Camerer found higher insula and ACC activity when comparing choices to first-order beliefs in dominance-solvable games. 3. We are considering here coordination without visual or other contact. Nonhuman primates seem able to coordinate their actions (simultaneously pulling on bars to obtain food) when they are in visual contact (45). 4. J. Mehta, C. Starmer, R. Sugden, Am. Econ. Rev. 84, 658 (1994). 5. T. Schelling, J. Conflict Resolution 2, 203 (1958), p. 211. 6. D. Kahneman, Am. Psychol. 58, 697 (2003). 7. K. Stanovich, R. West, Behav. Brain Sci. 23, 645 (2000). 8. A. Rubinstein, Econ. J. 117, 1243 (2007). 9. See (46). In our experiment, the average number of steps required to find out the game-theoretic solution for all 40 dominance-solvable games is 3.675. 10. R. Jung, R. Haier, Behav. Brain Sci. 30, 135 (2007). 11. V. Goel, R. Dolan, Neuropsychologia 39, 901 (2001). 12. I. Noveck, V. Goel, K. Smith, Cortex 40, 613 (2004). 13. M. Atherton et al., Brain Res. Cogn. Brain Res. 16, 26 (2003). 14. P. Kyllonen, R. Christal, Intelligence 14, 389 (1990). 15. M. D’Esposito, Philos. Trans. R. Soc. London Ser. B 362, 761 (2007). 16. A. Baddeley, Nat. Rev. Neurosci. 4, 829 (2003). 17. In coordination games, the participant has to encode and hold this information as well. However, because the targets of both players are the same, the demand on this capacity should be smaller. 18. E. Smith, J. Jonides, Proc. Natl. Acad. Sci. U.S.A. 95, 12061 (1998). 19. N. Müller, R. Knight, Neuroscience 139, 51 (2006). 20. E. Smith, J. Jonides, Science 283, 1657 (1999). 21. T. Wager, E. Smith, Cogn. Affect. Behav. Neurosci. 3, 255 (2003). 22. M. Berryhill, I. Olson, Neuropsychologia 46, 1775 (2008). 23. A. Cavanna, M. Trimble, Brain 129, 564 (2006). 24. M. Wallentin, A. Roepstorff, R. Glover, N. Burgess, Neuroimage 32, 1850 (2006). 25. M. Wallentin, E. Weed, L. Østergaard, K. Mouridsen, A. Roepstorff, Hum. Brain Mapp. 29, 524 (2008). 26. A. D. Craig, Nat. Rev. Neurosci. 3, 655 (2002). 27. A. MacDonald III, J. Cohen, A. Stenger, C. Carter, Science 288, 1835 (2000). 28. J. Decety et al., Neuroimage 23, 744 (2004). 29. J. S. Winston et al., Nat. Neurosci. 5, 277 (2002). 30. T. Singer et al., Science 303, 1157 (2004). 31. A. Bartels, S. Zeki, Neuroreport 11, 3829 (2000). 32. J. Woodward, J. Allman, J. Physiol. (Paris) 101, 179 (2007). 33. A. D. Craig, Nat. Rev. Neurosci. 10, 59 (2009). 34. W. Seeley et al., J. Neurosci. 27, 2349 (2007). 35. J. Downar, A. Crawley, D. Mikulis, K. Davis, Nat. Neurosci. 3, 277 (2000). 36. J. Downar, A. Crawley, D. Mikulis, K. Davis, J. Neurophysiol. 87, 615 (2002). 37. K. Davis et al., J. Neurosci. 25, 8402 (2005). 38. K. Taylor, D. Seminowicz, K. Davis, Hum. Brain Mapp., in press; published online 15 December 2008; 10.1002/hbm.20705. 39. See (47). The NCI can be interpreted as the probability that two randomly chosen individuals make the same choice relative to the probability of successful coordination if all choose randomly (SOM, S2.5). 40. S. Newman, P. Carpenter, S. Varma, M. Just, Neuropsychologia 41, 1668 (2003). 41. J. Fincham et al., Proc. Natl. Acad. Sci. U.S.A. 99, 3346 (2002). 42. A. Blood, R. Zatorre, Proc. Natl. Acad. Sci. U.S.A. 98, 11818 (2001). 43. H. Gallagher, A. Jack, A. Roepstorff, C. Frith, Neuroimage 16, 814 (2002). 44. M. Bhatt, C. Camerer, Games Econ. Behav. 52, 424 (2005). 45. K. Mendres, F. de Waal, Anim. Behav. 60, 523 (2000). 46. C. Camerer, Behavioral Game Theory: Experiments in Strategic Interaction (Princeton Univ. Press, Princeton, NJ, 2003), Chap. 5. 47. N. Bardsley, J. Mehta, C. Starmer, R. Sugden, CeDEx Discussion Paper No. 2008-17 (Centre for Decision Research and Experimental Economics, Nottingham, UK, 2008); available at www.nottinghamnetlearning.com/ economics/cedex/papers/2008-17.pdf. 48. We thank M. Hsu for helpful comments on the manuscript and J.-Y. Leu, J.T.-Y. Wang, D. Niddam, and participants at many seminars for discussions. Technical assistance from C.-R. Chou, C.-T. Chen, C.-H. Lan, S.-C. Lin, K.-L. Chen, Y.-Y. Chung, W.-Y. Lin, S. Hsu, R. Chen, and the National Taiwan University Hospital MRI Laboratory is greatly appreciated. This work was supported by the National Science Council of Taiwan (grant NSC 94-2415-H-002-004). Supporting Online Material www.sciencemag.org/cgi/content/full/324/5926/519/DC1 Materials and Methods Figs. S1 to S9 Tables S1 to S18 References 8 September 2008; accepted 24 February 2009 10.1126/science.1165598 The Genome Sequence of Taurine Cattle: A Window to Ruminant Biology and Evolution The Bovine Genome Sequencing and Analysis Consortium,* Christine G. Elsik, 1 Ross L. Tellam, 2 Kim C. Worley 3 To understand the biology and evolution of ruminants, the cattle genome was sequenced to about sevenfold coverage. The cattle genome contains a minimum of 22,000 genes, with a core set of 14,345 orthologs shared among seven mammalian species of which 1217 are absent or undetected in noneutherian (marsupial or monotreme) genomes. Cattle-specific evolutionary breakpoint regions in chromosomes have a higher density of segmental duplications, enrichment of repetitive elements, and species-specific variations in genes associated with lactation and immune responsiveness. Genes involved in metabolism are generally highly conserved, although five metabolic genes are deleted or extensively diverged from their human orthologs. The cattle genome sequence thus provides a resource for understanding mammalian evolution and accelerating livestock genetic improvement for milk and meat production. D omesticated cattle ( Bos taurus and Bos taurus indicus ) provide a significant source of nutrition and livelihood to nearly 6.6 billion humans. Cattle belong to a clade phyloge- netically distant from humans and rodents, the Cetartiodactyl order of eutherian mammals, which 24 APRIL 2009 VOL 324 SCIENCE www.sciencemag.org 522 REPORTS on April 23, 2009 www.sciencemag.org Downloaded from
Transcript of REPORTS - ARS Home : USDA ARS appeared ~60 million years ago ( 1). Cattle represent the Ruminantia,...
second model, the two main conditions were para-metrically modulated by the two categories,respectively (SOM, S5.1). The activation of theprecuneus was higher for hard dominance-solvablegames than for easy ones (Fig. 4A and table S10).The activation of the insula was higher for thehighly focal coordination games than for less fo-cal ones (Fig. 4B and table S11). Previous studiesalso found that precuneus activity increased whenthe number of planned moves increased (40, 41).The higher demand for memory-related imageryand memory retrieval may explain the greaterprecuneus activation in hard dominance-solvablegames. In highly focal coordination games, theparticipants may have felt quite strongly that thepool students must notice the same salient fea-ture. This may explain why insula activation cor-relates with NCI.
Participants might have disagreed about whichgames were difficult. We built a third model toinvestigate whether the frontoparietal activationcorrelates with how hard a dominance-solvablegame is and whether the activation in insula andACC correlates with how easy a coordinationgame is. Here, the twomain conditions were para-metrically modulated by each participant’s proba-bility of obtaining a reward in each game (SOM,S2.2 and S5.2). We found a negative correlationbetween the activation of the precuneus and theparticipant’s probability of obtaining a reward indominance-solvable games (Fig. 4C and tableS12), which suggests that dominance-solvablegames that yielded lower payoffs presented hardermental challenges. In a previous study on work-ing memory, precuneus activity positively cor-related with response times, a measure of mentaleffort (24). Both findings are consistent with theinterpretation that subjective measures reflectingharder tasks (higher efforts) correlate with acti-vation in precuneus. A positive correlation betweeninsula activation and the participant’s probabilityof obtaining a reward again suggests that co-ordination games with a highly salient featurestrongly activated the “gut feeling” reported bymany participants (Fig. 4D and table S13). Aprevious study found that the subjective rating of“chills intensity” in music correlates with activa-tion of insula (42). Both findings are consistentwith the interpretation that the subjective inten-sity of how salient a stimulus is correlates withactivation in insula.
As mentioned, choices were made significant-ly faster in coordination games than in dominance-solvable games. The results of the second andthird models provide additional support for theidea that intuitive and deliberative mental pro-cesses have quite different properties. The “slowand effortful” process was more heavily taxedwhen the dominance-solvable games were harder.The “fast and effortless” process was morestrongly activated when coordination was easy.
References and Notes1. J. Schaeffer et al., Science 317, 1518 (2007).2. Previous fMRI studies of game-playing include Gallagher
et al. (43) and Bhatt and Camerer (44), but they address
different issues. In particular, Bhatt and Camerer foundhigher insula and ACC activity when comparing choices tofirst-order beliefs in dominance-solvable games.
3. We are considering here coordination without visual orother contact. Nonhuman primates seem able tocoordinate their actions (simultaneously pulling on barsto obtain food) when they are in visual contact (45).
4. J. Mehta, C. Starmer, R. Sugden, Am. Econ. Rev. 84, 658(1994).
5. T. Schelling, J. Conflict Resolution 2, 203 (1958), p. 211.6. D. Kahneman, Am. Psychol. 58, 697 (2003).7. K. Stanovich, R. West, Behav. Brain Sci. 23, 645 (2000).8. A. Rubinstein, Econ. J. 117, 1243 (2007).9. See (46). In our experiment, the average number of steps
required to find out the game-theoretic solution for all40 dominance-solvable games is 3.675.
10. R. Jung, R. Haier, Behav. Brain Sci. 30, 135 (2007).11. V. Goel, R. Dolan, Neuropsychologia 39, 901 (2001).12. I. Noveck, V. Goel, K. Smith, Cortex 40, 613 (2004).13. M. Atherton et al., Brain Res. Cogn. Brain Res. 16, 26 (2003).14. P. Kyllonen, R. Christal, Intelligence 14, 389 (1990).15. M. D’Esposito, Philos. Trans. R. Soc. London Ser. B 362,
761 (2007).16. A. Baddeley, Nat. Rev. Neurosci. 4, 829 (2003).17. In coordination games, the participant has to encode and
hold this information as well. However, because thetargets of both players are the same, the demand on thiscapacity should be smaller.
18. E. Smith, J. Jonides, Proc. Natl. Acad. Sci. U.S.A. 95,12061 (1998).
19. N. Müller, R. Knight, Neuroscience 139, 51 (2006).20. E. Smith, J. Jonides, Science 283, 1657 (1999).21. T. Wager, E. Smith, Cogn. Affect. Behav. Neurosci. 3, 255
(2003).22. M. Berryhill, I. Olson, Neuropsychologia 46, 1775 (2008).23. A. Cavanna, M. Trimble, Brain 129, 564 (2006).24. M. Wallentin, A. Roepstorff, R. Glover, N. Burgess,
Neuroimage 32, 1850 (2006).25. M. Wallentin, E. Weed, L. Østergaard, K. Mouridsen,
A. Roepstorff, Hum. Brain Mapp. 29, 524 (2008).26. A. D. Craig, Nat. Rev. Neurosci. 3, 655 (2002).27. A. MacDonald III, J. Cohen, A. Stenger, C. Carter, Science
288, 1835 (2000).28. J. Decety et al., Neuroimage 23, 744 (2004).29. J. S. Winston et al., Nat. Neurosci. 5, 277 (2002).30. T. Singer et al., Science 303, 1157 (2004).31. A. Bartels, S. Zeki, Neuroreport 11, 3829 (2000).32. J. Woodward, J. Allman, J. Physiol. (Paris) 101, 179 (2007).33. A. D. Craig, Nat. Rev. Neurosci. 10, 59 (2009).
34. W. Seeley et al., J. Neurosci. 27, 2349 (2007).35. J. Downar, A. Crawley, D. Mikulis, K. Davis, Nat. Neurosci.
3, 277 (2000).36. J. Downar, A. Crawley, D. Mikulis, K. Davis, J. Neurophysiol.
87, 615 (2002).37. K. Davis et al., J. Neurosci. 25, 8402 (2005).38. K. Taylor, D. Seminowicz, K. Davis, Hum. Brain Mapp.,
in press; published online 15 December 2008;10.1002/hbm.20705.
39. See (47). The NCI can be interpreted as the probabilitythat two randomly chosen individuals make the samechoice relative to the probability of successfulcoordination if all choose randomly (SOM, S2.5).
40. S. Newman, P. Carpenter, S. Varma, M. Just,Neuropsychologia 41, 1668 (2003).
41. J. Fincham et al., Proc. Natl. Acad. Sci. U.S.A. 99, 3346(2002).
42. A. Blood, R. Zatorre, Proc. Natl. Acad. Sci. U.S.A. 98,11818 (2001).
43. H. Gallagher, A. Jack, A. Roepstorff, C. Frith, Neuroimage16, 814 (2002).
44. M. Bhatt, C. Camerer, Games Econ. Behav. 52, 424 (2005).45. K. Mendres, F. de Waal, Anim. Behav. 60, 523 (2000).46. C. Camerer, Behavioral Game Theory: Experiments in
Strategic Interaction (Princeton Univ. Press, Princeton,NJ, 2003), Chap. 5.
47. N. Bardsley, J. Mehta, C. Starmer, R. Sugden, CeDExDiscussion Paper No. 2008-17 (Centre for DecisionResearch and Experimental Economics, Nottingham,UK, 2008); available at www.nottinghamnetlearning.com/economics/cedex/papers/2008-17.pdf.
48. We thank M. Hsu for helpful comments on themanuscript and J.-Y. Leu, J.T.-Y. Wang, D. Niddam, andparticipants at many seminars for discussions. Technicalassistance from C.-R. Chou, C.-T. Chen, C.-H. Lan,S.-C. Lin, K.-L. Chen, Y.-Y. Chung, W.-Y. Lin, S. Hsu,R. Chen, and the National Taiwan University Hospital MRILaboratory is greatly appreciated. This work wassupported by the National Science Council of Taiwan(grant NSC 94-2415-H-002-004).
Supporting Online Materialwww.sciencemag.org/cgi/content/full/324/5926/519/DC1Materials and MethodsFigs. S1 to S9Tables S1 to S18References
8 September 2008; accepted 24 February 200910.1126/science.1165598
The Genome Sequence of TaurineCattle: A Window to RuminantBiology and EvolutionThe Bovine Genome Sequencing and Analysis Consortium,* Christine G. Elsik,1Ross L. Tellam,2 Kim C. Worley3
To understand the biology and evolution of ruminants, the cattle genome was sequenced to about sevenfoldcoverage. The cattle genome contains a minimum of 22,000 genes, with a core set of 14,345 orthologsshared among seven mammalian species of which 1217 are absent or undetected in noneutherian(marsupial or monotreme) genomes. Cattle-specific evolutionary breakpoint regions in chromosomeshave a higher density of segmental duplications, enrichment of repetitive elements, and species-specificvariations in genes associated with lactation and immune responsiveness. Genes involved in metabolismare generally highly conserved, although five metabolic genes are deleted or extensively diverged fromtheir human orthologs. The cattle genome sequence thus provides a resource for understandingmammalian evolution and accelerating livestock genetic improvement for milk and meat production.
Domesticated cattle (Bos taurus and Bostaurus indicus) provide a significant sourceof nutrition and livelihood to nearly 6.6
billion humans. Cattle belong to a clade phyloge-netically distant from humans and rodents, theCetartiodactyl order of eutherian mammals, which
24 APRIL 2009 VOL 324 SCIENCE www.sciencemag.org522
REPORTS
on
Apr
il 23
, 200
9 w
ww
.sci
ence
mag
.org
Dow
nloa
ded
from
first appeared ~60 million years ago (1). Cattlerepresent the Ruminantia, which occupy diverseterrestrial environments with their ability toefficiently convert low-quality forage into energy-dense fat, muscle, and milk. These biologicalprocesses have been exploited by humans sincedomestication, which began in the Near East some8000 to 10,000 years ago (2). Since then, over 800cattle breeds have been established, representing animportant world heritage and a scientific resourcefor understanding the genetics of complex traits.
The cattle genome was assembled withmethods similar to those used for the rat and sea
urchin genomes (3, 4). The most recent assem-blies, Btau3.1 and Btau4.0, combined bacterialartificial chromosome (BAC) and whole-genomeshotgun (WGS) sequences. Btau3.1 was used forgene-specific analyses. Btau4.0, which includesfinished sequence data and used different map-ping methods to place the sequence on chromo-somes, was used for all global analyses otherthan gene prediction. The contig N50 (50% ofthe genome is in contigs of this size or greater)is 48.7 kb for both assemblies; the scaffold N50for Btau4.0 is 1.9 Mb. In the Btau4.0 assembly,90% of the total genome sequence was placedon the 29 autosomes and X chromosome andvalidated (3). Of 1.04million expressed sequencetag (EST) sequences, 95.0% were contained inthe assembled contigs. With an equivalent genedistribution in the remaining 5% of the genome,the estimated genome size is 2.87 Gbp. Compar-ison with 73 finished BACs and single-nucleotidepolymorphism (SNP) linkage data (5, 6) con-firmed this assembly quality with greater than92% genomic coverage, and fewer than 0.8% of
SNPs were incorrectly positioned at the resolu-tion of these maps (3, 4).
We used the cattle genome to catalog protein-coding genes, microRNA (miRNA) genes, andruminant-specific interspersed repeats, and wemanually annotated over 4000 genes. Theconsensus protein-coding gene set for Btau3.1(OGSv1), from six predicted gene sets (4),consists of 26,835 genes with a validation rateof 82% (4). On this basis, we estimate that thecattle genome contains at least 22,000 protein-coding genes. We identified 496 miRNA genesof which 135 were unpublished miRNAs (4).About half of the cattle miRNA occur in 60 ge-nomic miRNA clusters, containing two to sevenmiRNA genes separated by less than 10 kbp (fig.S2). The overall GC content of the cattle genomeis 41.7%, with an observed-to-expected CpGratio of 0.234, similar to that of other mammals.
The cattle genome has transposable elementclasses like those of other mammals, as well aslarge numbers of ruminant-specific repeats (tableS4) that compose 27% of its genome. The
1Department of Biology, 406 Reiss, Georgetown University,37th and O Streets, NW, Washington, DC 20057, USA. E-mail:[email protected] 2CSIRO Livestock Industries, 306 Carm-ody Road, St. Lucia, QLD 4067, Australia. E-mail: [email protected] 3Human Genome Sequencing Center, Department ofMolecular and Human Genetics, Baylor College of Medicine, MSBCM226, One Baylor Plaza, Houston, TX 77030, USA. E-mail:[email protected]
*All authors with their affiliations and contributions arelisted at the end of this paper.
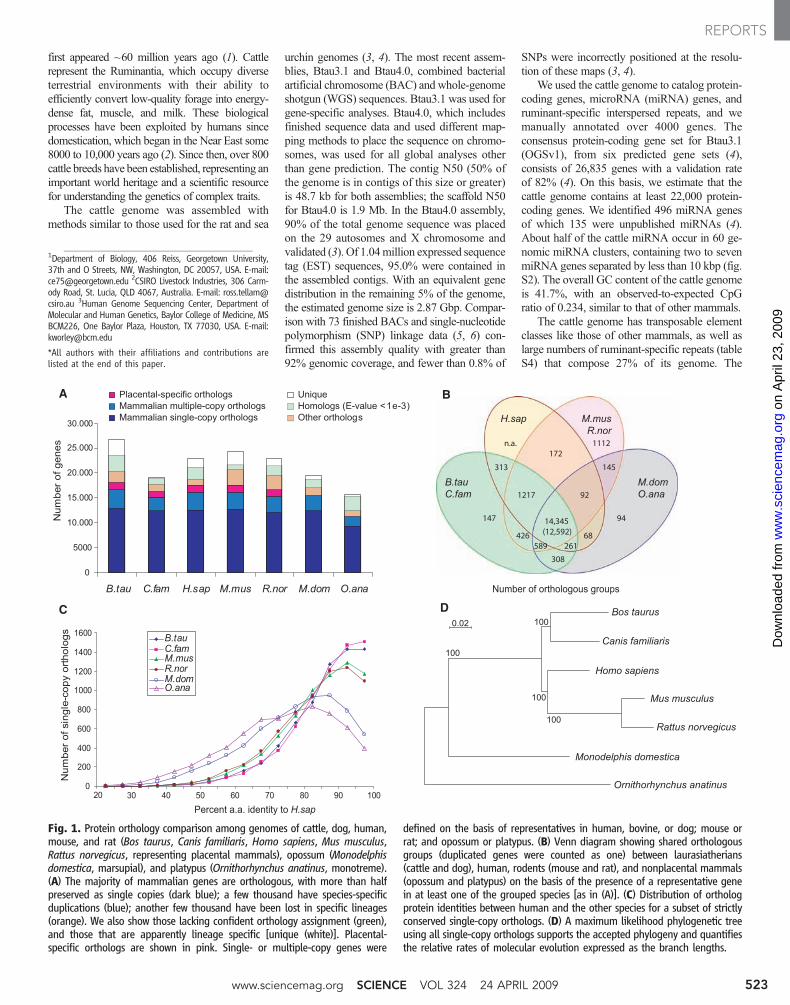
Fig. 1. Protein orthology comparison among genomes of cattle, dog, human,mouse, and rat (Bos taurus, Canis familiaris, Homo sapiens, Mus musculus,Rattus norvegicus, representing placental mammals), opossum (Monodelphisdomestica, marsupial), and platypus (Ornithorhynchus anatinus, monotreme).(A) The majority of mammalian genes are orthologous, with more than halfpreserved as single copies (dark blue); a few thousand have species-specificduplications (blue); another few thousand have been lost in specific lineages(orange). We also show those lacking confident orthology assignment (green),and those that are apparently lineage specific [unique (white)]. Placental-specific orthologs are shown in pink. Single- or multiple-copy genes were
defined on the basis of representatives in human, bovine, or dog; mouse orrat; and opossum or platypus. (B) Venn diagram showing shared orthologousgroups (duplicated genes were counted as one) between laurasiatherians(cattle and dog), human, rodents (mouse and rat), and nonplacental mammals(opossum and platypus) on the basis of the presence of a representative genein at least one of the grouped species [as in (A)]. (C) Distribution of orthologprotein identities between human and the other species for a subset of strictlyconserved single-copy orthologs. (D) A maximum likelihood phylogenetic treeusing all single-copy orthologs supports the accepted phylogeny and quantifiesthe relative rates of molecular evolution expressed as the branch lengths.
www.sciencemag.org SCIENCE VOL 324 24 APRIL 2009 523
REPORTS
on
Apr
il 23
, 200
9 w
ww
.sci
ence
mag
.org
Dow
nloa
ded
from
consensus sequence of Bov-B, a long interspersednuclear element (LINE) lacked a functional openreading frame (ORF), which suggested that it wasinactive (7). However, Bov-B repeats with intactORF were identified in the genome, and theirphylogeny (fig. S4) indicates that some are stillactively expanding and evolving. Mapping chro-mosomal segments of high- and low-densityancient repeat content, L2/MIR [a LINE/SINE(short interspersed nuclear element) pair] andBov-B, and more recent repeats, Bov-B/ART2A(Bov-B–derived SINE pair), revealed that thegenome consists of ancient regions enriched forL2/MIR and recent regions enriched for Bov-B/ART2A (fig. S7). Exclusion of Bov-B/ART2Afrom contiguous blocks of ancient repeats sug-gests that evolution of the ruminant or cattle ge-nome experienced invasions of new repeats intoregions lacking ancient repeats. Alternatively,older repeats may have been destroyed by inser-tion of ruminant- or cattle-specific repeats. AGCtrinucleotide repeats, the most common simple-sequence repeat (SSR) in artiodactyls (whichinclude cattle, pigs, and sheep), are 90- and 142-fold overrepresented in cattle compared with hu-man and dog, respectively (fig. S10). Of the
AGC repeats in the cattle genome, 39% wereassociated with Bov-A2 SINE elements.
A comparative analysis examined the rate ofprotein evolution and the conservation of generepertoires among orthologs in the genomes ofdog, human, mouse, and rat (representing placen-tal mammals); opossum (marsupial); and platy-pus (monotreme). Orthology was resolved for>75% of cattle and >80% of human genes (Fig.1A). There were 14,345 orthologous groups withrepresentatives in human, cattle, or dog; mouseor rat; and opossum or platypus, which represent16,749 cattle and 16,177 human genes, respec-tively, of which 12,592 are single-copy orthologs.We also identified 1217 placental mammal–specific orthologous groups with genes present inhuman, cattle, or dog; mouse or rat; but not opos-sum or platypus. About 1000 orthologs sharedbetween rodents and laurasiatherians (cattle anddog), many of which encode G protein–coupledreceptors, appear to have been lost or may bemisannotated in the human genome (Fig. 1B).Gene repertoire conservation among these mam-mals correlates with conservation at the aminoacid–sequence level (Fig. 1C). The elevated rateof evolution in rodents relative to other mammals(8) was supported by the higher amino acid se-quence identity between human and dog or cattleproteins relative to that between human and rodent
proteins. However, maximum-likelihood analysisof amino acid substitutions in single-copy ortho-logs supports the accepted sister lineage relation ofprimates and rodents (1) (Fig. 1D).
Alternative splicing is a major mechanism fortranscript diversification (9), yet the extent of itsevolutionary conservation and functional impactremain unclear. We used the cattle genome toanalyze the conservation of the most commonform of alternative splicing, exon skipping, de-fined as a triplet of exons in which the middleexon is absent in some transcripts, in a set of1930 exon-skipping events across human,mouse,dog, and cattle (4). We examined 277 cases, withdifferent conservation patterns between human andmouse, in 16 different cattle tissues with reversetranscription polymerase chain reaction (4). Thesesplicing events were divided into a shared set (163in both human and mouse) and a nonshared set(114 in human but not in mouse). Of the 277, wedetected exon-skipping for 188 cases in cattle (tableS5), which suggested that the majority of geneswith exon-skipping in human were present andregulated in cattle and that, if an event is sharedbetween human andmouse, it wasmore likely to befound in cattle. It was estimated that at most 40%ofexon-skipping is conserved amongmammals; thus,our data agree with the upper bound from previousanalyses with human and rodents [e.g., (10)].
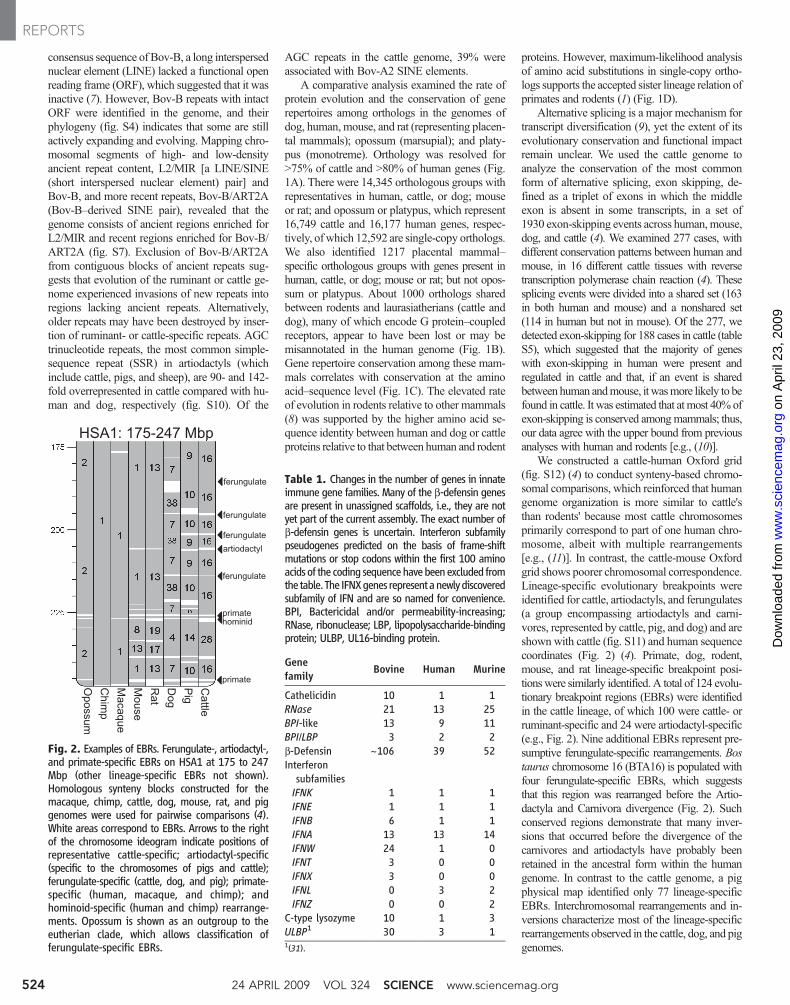
We constructed a cattle-human Oxford grid(fig. S12) (4) to conduct synteny-based chromo-somal comparisons, which reinforced that humangenome organization is more similar to cattle'sthan rodents' because most cattle chromosomesprimarily correspond to part of one human chro-mosome, albeit with multiple rearrangements[e.g., (11)]. In contrast, the cattle-mouse Oxfordgrid shows poorer chromosomal correspondence.Lineage-specific evolutionary breakpoints wereidentified for cattle, artiodactyls, and ferungulates(a group encompassing artiodactyls and carni-vores, represented by cattle, pig, and dog) and areshown with cattle (fig. S11) and human sequencecoordinates (Fig. 2) (4). Primate, dog, rodent,mouse, and rat lineage-specific breakpoint posi-tionswere similarly identified. A total of 124 evolu-tionary breakpoint regions (EBRs) were identifiedin the cattle lineage, of which 100 were cattle- orruminant-specific and 24 were artiodactyl-specific(e.g., Fig. 2). Nine additional EBRs represent pre-sumptive ferungulate-specific rearrangements. Bostaurus chromosome 16 (BTA16) is populated withfour ferungulate-specific EBRs, which suggeststhat this region was rearranged before the Artio-dactyla and Carnivora divergence (Fig. 2). Suchconserved regions demonstrate that many inver-sions that occurred before the divergence of thecarnivores and artiodactyls have probably beenretained in the ancestral form within the humangenome. In contrast to the cattle genome, a pigphysical map identified only 77 lineage-specificEBRs. Interchromosomal rearrangements and in-versions characterize most of the lineage-specificrearrangements observed in the cattle, dog, and piggenomes.
Fig. 2. Examples of EBRs. Ferungulate-, artiodactyl-,and primate-specific EBRs on HSA1 at 175 to 247Mbp (other lineage-specific EBRs not shown).Homologous synteny blocks constructed for themacaque, chimp, cattle, dog, mouse, rat, and piggenomes were used for pairwise comparisons (4).White areas correspond to EBRs. Arrows to the rightof the chromosome ideogram indicate positions ofrepresentative cattle-specific; artiodactyl-specific(specific to the chromosomes of pigs and cattle);ferungulate-specific (cattle, dog, and pig); primate-specific (human, macaque, and chimp); andhominoid-specific (human and chimp) rearrange-ments. Opossum is shown as an outgroup to theeutherian clade, which allows classification offerungulate-specific EBRs.
Table 1. Changes in the number of genes in innateimmune gene families. Many of the b-defensin genesare present in unassigned scaffolds, i.e., they are notyet part of the current assembly. The exact number ofb-defensin genes is uncertain. Interferon subfamilypseudogenes predicted on the basis of frame-shiftmutations or stop codons within the first 100 aminoacids of the coding sequencehavebeenexcluded fromthe table. The IFNXgenes representanewlydiscoveredsubfamily of IFN and are so named for convenience.BPI, Bactericidal and/or permeability-increasing;RNase, ribonuclease; LBP, lipopolysaccharide-bindingprotein; ULBP, UL16-binding protein.
Genefamily Bovine Human Murine
Cathelicidin 10 1 1RNase 21 13 25BPI-like 13 9 11BPI/LBP 3 2 2b-Defensin ~106 39 52InterferonsubfamiliesIFNK 1 1 1IFNE 1 1 1IFNB 6 1 1IFNA 13 13 14IFNW 24 1 0IFNT 3 0 0IFNX 3 0 0IFNL 0 3 2IFNZ 0 0 2
C-type lysozyme 10 1 3ULBP1 30 3 11(31).
24 APRIL 2009 VOL 324 SCIENCE www.sciencemag.org524
REPORTS
on
Apr
il 23
, 200
9 w
ww
.sci
ence
mag
.org
Dow
nloa
ded
from

An examination of repeat families and in-dividual transposable elements within cattle-,artiodactyl- and ferungulate-specific EBRs showeda significantly higher density of LINE-L1 ele-ments and the ruminant-specific LINE-RTE re-peat family (12) in cattle-specific EBRs relativeto the remainder of the cattle genome (table S6).In contrast, the SINE-BovA repeat family andthe more ancient tRNAGlu-derived SINE repeats(13) were present in lower density in cattle-specific EBRs, similar to other LINEs and SINEs(table S7). The differences in repeat densitieswere generally consistent in cattle-, artiodactyl-and ferungulate-specific EBRs, with the excep-tion of the tRNAGlu-derived and LTR-ERVLrepeats, which are at higher densities in artiodac-tyl EBRs compared with the rest of the genome.
The tRNAGlu-derived SINEs originated in thecommon ancestor of Suina (pigs and peccaries),Ruminantia, and Cetacea (whales) (13), whichsuggests that tRNAGlu-derived SINEs wereinvolved in ancestral artiodactyl chromosome re-arrangements. Furthermore, the lower density ofthe more ancient repeat families in cattle-specificEBRs suggests that either more recently arisingrepeat elements were inserted into regions lack-ing ancient repeats or that older repeats weredestroyed by this insertion (table S7). The repeatelements differing in density in EBRs were alsofound in regions of homologous synteny, whichsuggests that repeats may promote evolutionaryrearrangements (see below). Differences in repeatdensity in cattle-specific EBRs are thus unlikelyto be caused by the accumulation of repeats inEBRs after such rearrangements occur. Weidentified a cattle-specific EBR associated witha bidirectional promoter (figs. S14 and S15) thatmay affect control of the expression of theCYB5R4 gene, which has been implicated inhuman diabetes and, therefore, may be importantin the regulation of energy flow in cattle (4).
We identified 1020 segmental duplications(SDs) corresponding to 3.1% (94.4 Mbp) of thecattle genome (4). Duplications assigned to achromosome showed a bipartite distribution withrespect to length and percent identity (fig. S16),and interchromosomal duplications were shorter(median length 2.5 kbp) andmore divergent (<94%identity) relative to intrachromosomal duplications(median length 20 kbp, ~97% identity) and tendedto be locally clustered (fig. S17). Twenty-one ofthese duplications were >300 kbp and located inregions enriched for tandem duplications (e.g.,BTA18) (fig. S18). This pattern is reminiscent ofthe duplication pattern of the dog, rat, and mousebut different from that of primate and great-apegenomes (14, 15). On average, cattle SDs >10 kbprepresent 11.7% of base pairs in 10-kbp intervalslocated within cattle-specific EBRs and 23.0% ofbase pairs located within the artiodactyl-specificEBRs. By contrast, in the remainder of the genomesequence assigned to chromosomes the fraction ofSDs was 1.7% (P < 1 × 10⁻¹²). These data indicatethat SDs play a role in promoting chromosomerearrangements by nonallelic homologous recombi-
nation [e.g., (16)] and suggest that either asignificant fraction of the SDs observed in cattleoccurred before the Ruminant-Suina split, and/orthat the sites for accumulation of SDs are non-randomly distributed in artiodactyl genomes.
SDs involving genic regions may give rise tonew functional paralogs. Seventy-six percent(778 out of 1020) of the cattle SDs correspondto complete or partial gene duplications with highsequence identity (median 98.7%). This suggeststhat many of these gene duplications are specificto either the artiodactyla or the Bos lineage andtend to encode proteins that often interface withthe external environment, particularly immuneproteins and sensory and/or olfactory receptors.Several of these gene duplications are alsoduplicated in other mammalian lineages (e.g.,cytochrome P-450, sulfotransferase, ribonucleaseA, defensins, and pregnancy-associated glyco-proteins). Paralogs located in segmental duplica-tions that are present exclusively in cattle mayhave functional implications for the unique phys-iology, environment, and diet of cattle.
An overrepresentation of genes involved inreproduction in cattle SDs (tables S8 and S9) isassociated with several gene families expressed inthe ruminant placenta. These families encode theintercellular signaling proteins pregnancy-associatedglycoproteins (on BTA29), trophoblast Kunitzdomain proteins (on BTA13), and interferon tau(IFNT) (on BTA8). A gene family encodingprolactin-related proteins (on BTA23) was onlyidentified in the assembly-dependent analysis ofSDs. These genes regulate ruminant-specific aspectsof fetal growth, maternal adaptations to pregnancy,and the coordination of parturition (17, 18). Al-though type I interferon (IFN) genes are primarilyinvolved in host defense (19), IFNT prevents regres-sion of the corpus luteum during early pregnancy,which results in a uterine environment receptive toearly conceptus development (20).
Signatures of positive selection (obtained bymeasurement of their rates of synonymous andnonsynonymous substitutions) identified 71 genes(4), including 10 immune-related genes (i.e.,IFNAR2, IFNG, CD34, TREM1, TREML1,FCER1A, IL23R, IL24, IL15, and LEAP2). As pre-viously mentioned, immune genes are overrepre-sented in SDs (see Table 1 and fig. S20). Examplesof genes varying in cattle relative to mouse includea cluster of b-defensin genes, which encode anti-microbial peptides; the antimicrobial cathelicidingenes [which show increased sequence diversity ofthe mature cathelicidin peptides (21)]; and changesin the numbers of interferon genes (22) and the num-ber and organization of genes involved in adaptiveimmune responses in cattle compared with humanand mouse (4). This extensive duplication and di-vergence of genes involved in innate immunitymaybe because of the substantial load of microorga-nisms present in the rumen of cattle, which increasesthe risk of opportunistic infections at mucosal sur-faces and positive selection for the traits that enabledstronger and more diversified innate immune re-sponses at these locations. Another possibility is
that immunity may have been under selection dueto the herd structure, which can promote rapid dis-ease transmission. Also, immune function–relatedduplicated genes have gained nonimmune functions,e.g., IFNT (see above), and the C-class lysozymegenes, which are involved in microbial degradationin the abomasum (see below).
There has been substantial reorganization ofgene families encoding proteins present in milk.One such rearrangement affecting milk compo-sition involves the histatherin (HSTN) gene with-in the casein gene cluster on BTA6 (fig. S21). Inthe cattle genome, HSTN is juxtaposed to aregulatory element (BCE) important (23) for b-casein (CSN2) expression, and as a probableconsequence, HSTN is regulated like the caseingenes during the lactation cycle. This rearrange-ment that led to the juxtaposition ofHSTN next tothe BCE is also the probable cause of deletion ofone of the two copies of a-S2–like casein genes(CSN1S2A) present in other mammalian genomes(24). The biological implications of this changein casein gene copy number are not yet clear.
Additionally, the cattle serum amyloid A (SAA)gene cluster arose from both a laurasiatherianSD and a cattle-specific EBR, which resulted intwo mammary gland–expressed SAA3-like genes,SAA3.1 and SAA3.2 onBTA29, and an SAA3-likegene on BTA15 (fig. S21). SAA3.2 has beenshown to inhibit microbial growth (25). Two ad-ditional milk protein genes were associated withSDs: cathelicidin (CATHL1) and b2-microglobulin(B2M)—part of the neonatal Fc receptor (FcRn)that transfers immunoglobulin IgG across epithelialcells of many tissues including the gut andmammary gland (26, 27). IgG is the predominantimmunoglobulin in cow’s milk compared with IgAin human milk (28). Unlike humans, who acquirepassive immunity from the mother via placentaltransfer of immunoglobulins during pregnancy,calves acquire passive immunity by ingestion ofIgG in milk (28). B2M is also redistributed inepithelial cells upon calving, and it protects IgGfromdegradation (26).Agenetic variant ofB2M hasnegative effects on passive immune transfer (29).The additional copy of the gene encoding B2Mmight be associated with the abundance of IgG incows’milk and an increased capacity for uptake inthe neonatal gut. Considering that the passive trans-fer of immunity to the calf is one of the importantfunctions of milk, it is striking that lactation-relatedgenes affected by genomic rearrangements oftenencode immune-related proteins in milk.
Cattle metabolic pathways demonstrated astrong degree of conservation among the compre-hensive set of genes involved in core mammalianmetabolism (4) and permitted an examination ofunique genetic events that may be related toruminant-specific metabolic adaptations. How-ever, among 1032 genes examined from the hu-man metabolic pathways, five were deleted orextensively diverged in cattle:PLA2G4C (phospho-lipase A2, group IVC), FAAH2 (fatty acid amidehydrolase 2), IDI2 (isopentenyl-diphosphate deltaisomerase 2), GSTT2 (glutathione S-transferase
www.sciencemag.org SCIENCE VOL 324 24 APRIL 2009 525
REPORTS
on
Apr
il 23
, 200
9 w
ww
.sci
ence
mag
.org
Dow
nloa
ded
from

theta 2), and TYMP (thymidine phosphorylase),which may be adaptations that impact on fattyacid metabolism (PLA2G4C and FAAH2); themevalonate pathway (synthesis of dolichols, vita-mins, steroid hormones, and cholesterol) (IDI2);detoxification (GSTT2); and pyrimidine metabo-lism (TYMP). Phylogenetic analysis shows thatPLA2G4C was deleted ~87 to 97 million yearsago in the laurasiatherian lineages (fig. S22).Strikingly, ~20% of the sequences from twoabomasum (last chamber of the cattle stomach)EST libraries (a total of 2392 sequences) corre-spond to three C-type lysozyme genes. Lysozymeprimarily functions in animals as an antibacterialprotein, which suggests that they probably func-tion in the abomasum (similar to the monogastricstomach) to degrade the cell walls of bacteriaentering from the foregut (30). The cattle genomecontains 10 C-type lysozyme genes (table S14and fig. S23), and ESTevidence (fig. S23) showsthat six of the seven remaining C-type lysozymegenes are expressed primarily in the intestinaltract, which suggests additional roles for theencoded proteins in ruminant digestion.
In summary, the biological systems most af-fected by changes in the number and organizationof genes in the cattle lineage include reproduction,immunity, lactation, and digestion. We highlightedthe evolutionary activity associated with chromo-somal breakpoint regions and their propensity forpromoting gene birth and rearrangement. Thesechanges in the cattle lineage probably reflect meta-bolic, physiologic, and immune adaptations due tomicrobial fermentation in the rumen, the herdenvironment and its influence on disease transmis-sion, and the reproductive strategy of cattle. Thecattle genome and associated resources willfacilitate the identification of novel functions andregulatory systems of general importance in mam-mals and may provide an enabling tool for geneticimprovement within the beef and dairy industries.
References and Notes1. W. J. Murphy, P. A. Pevzner, S. J. O'Brien, Trends Genet.
20, 631 (2004).2. R. L. Willham, J. Anim. Sci. 62, 1742 (1986).3. Y. Liu et al., BMC Genomics 10, 180 (2009).4. Materials, methods, and additional discussion are available
on Science online.5. H. Nilsen et al., Anim. Genet. 39, 97 (2008).6. A. Prasad et al., BMC Genomics 8, 310 (2007).7. H. S. Malik, T. H. Eickbush, Mol. Biol. Evol. 15, 1123 (1998).8. C. I. Wu, W. H. Li, Proc. Natl. Acad. Sci. U.S.A. 82, 1741
(1985).9. B. Modrek, C. J. Lee, Nat. Genet. 34, 177 (2003).
10. R. Sorek, R. Shamir, G. Ast, Trends Genet. 20, 68 (2004).11. A. Everts-van der Wind et al., Proc. Natl. Acad. Sci. U.S.A.
102, 18526 (2005).12. D. Kordis, F. Gubensek, Gene 238, 171 (1999).13. M. Shimamura, H. Abe, M. Nikaido, K. Ohshima, N. Okada,
Mol. Biol. Evol. 16, 1046 (1999).14. J. A. Bailey, E. E. Eichler, Nat. Rev. Genet. 7, 552 (2006).15. J. A. Bailey et al., Science 297, 1003 (2002).16. W. J. Murphy et al., Science 309, 613 (2005).17. K. Hashizume et al., Reprod. Fertil. Dev. 19, 79 (2007).18. J. H. Larson et al., Physiol. Genomics 25, 405 (2006).19. S. Y. Zhang et al., Immunol. Rev. 226, 29 (2008).20. R. M. Roberts, Y. Chen, T. Ezashi, A. M. Walker, Semin.
Cell Dev. Biol. 19, 170 (2008).21. M. Scocchi, S. Wang, M. Zanetti, FEBS Lett. 417, 311 (1997).
22. M. G. Katze, Y. He, M. Gale Jr., Nat. Rev. Immunol. 2,675 (2002).
23. C. Schmidhauser et al., Mol. Biol. Cell 3, 699 (1992).24. M. Rijnkels, L. Elnitski, W. Miller, J. M. Rosen, Genomics
82, 417 (2003).25. A. J. Molenaar et al., Biomarkers 14, 26 (2009).26. B. Mayer et al., J. Dairy Res. 72 (suppl. S1), 107 (2005).27. D. C. Roopenian, S. Akilesh,Nat. Rev. Immunol.7, 715 (2007).28. T. J. Newby, C. R. Stokes, F. J. Bourne, Vet. Immunol.
Immunopathol. 3, 67 (1982).29. M. L. Clawson et al., Mamm. Genome 15, 227 (2004).30. D. M. Irwin, J. Mol. Evol. 41, 299 (1995).31. J. H. Larson et al., BMC Genomics 7, 227 (2006).32. Funded by the National Human Genome Research
Institute (NHGRI U54 HG003273); the U.S. Departmentof Agriculture's Agricultural Research Service (USDA-ARSagreement no. 59-0790-3-196) and Cooperative StateResearch, Education, and Extension Service NationalResearch Initiative (grant no. 2004-35216-14163); thestate of Texas; Genome Canada through Genome BritishColumbia; the Alberta Science and Research Authority;the Commonwealth Scientific and Industrial ResearchOrganization of Australia (CSIRO); Agritech InvestmentsLtd., Dairy Insight, Inc., and AgResearch Ltd., all of NewZealand; the Research Council of Norway; the KlebergFoundation; and the National, Texas, and South DakotaBeef Check-off Funds. The master accession for this WGSsequencing project is AAFC03000000. The individual WGSsequences are AAFC03000001 to AAFC03131728, and thescaffold records are CM000177 to CM000206 (chromosomes)and DS490632 to DS495890 (unplaced scaffolds).
The Bovine Genome Sequencing and Analysis Consortium
Principal Investigator: Richard A. Gibbs1
Analysis project leadership: Christine G. Elsik,2,3 Ross L. Tellam4
Sequencing project leadership: Richard A. Gibbs,1 Donna M.Muzny,1 George M. Weinstock5,1
Analysis group organization: David L. Adelson,6 Evan E. Eichler,7,8
Laura Elnitski,9 Christine G. Elsik,2,3 Roderic Guigó,10 Debora L.Hamernik,11 Steve M. Kappes,12 Harris A. Lewin,13,14 David J. Lynn,15
Frank W. Nicholas,16 Alexandre Reymond,17 Monique Rijnkels,18
Loren C. Skow,19 Ross L. Tellam,4 Kim C. Worley,1 Evgeny M.Zdobnov20,21,22
Sequencing project white paper: Richard A. Gibbs,1 Steve M.Kappes,12 Lawrence Schook,13 Loren C. Skow,19 George M.Weinstock,5,1 James Womack23
Gene prediction and consensus gene set: Tyler Alioto,10
Stylianos E. Antonarakis,20 Alex Astashyn,24 Charles E. Chapple,10
Hsiu-Chuan Chen,24 Jacqueline Chrast,17 Francisco Câmara,10
Christine G. Elsik2,3 (leader), Olga Ermolaeva,24 Roderic Guigó,10
Charlotte N. Henrichsen,17 Wratko Hlavina,24 Yuri Kapustin,24 BorisKiryutin,24 Paul Kitts,24 Felix Kokocinski,25 Melissa Landrum,24
Donna Maglott,24 Kim Pruitt,24 Alexandre Reymond,17 VictorSapojnikov,24 Stephen M. Searle,25 Victor Solovyev,26 AlexandreSouvorov,24 Catherine Ucla,20 George M. Weinstock,5,1 Carine Wyss20
Experimental validation of gene set: Tyler Alioto,10 Stylianos E.Antonarakis,20 Charles E. Chapple,10 Jacqueline Chrast,17 FranciscoCâmara,10 Roderic Guigó10 (leader), Charlotte N. Henrichsen,17
Alexandre Reymond,17 Catherine Ucla,20 Carine Wyss20
MicroRNA analysis: Juan M. Anzola,3 Daniel Gerlach,20,21 Evgeny M.Zdobnov20,21,22 (leader)GC composition analysis: Eran Elhaik,27,28 Christine G. Elsik2,3
(leader), Dan Graur,27 Justin T. Reese2
Repeat analysis: David L. Adelson6 (leader), Robert C. Edgar,29
John C. McEwan,30 Gemma M. Payne,30 Joy M. Raison31
Protein ortholog analysis: Thomas Junier,19,20 Evgenia V.Kriventseva,32 Evgeny M. Zdobnov20,21,22 (leader)Exon-skipping analysis: Jacqueline Chrast,17 Eduardo Eyras,33,34Charlotte N. Henrichsen,17 Mireya Plass,34 Alexandre Reymond17
(leader)Evolutionary breakpoint analysis and Oxford grid: RavikiranDonthu,13 Denis M. Larkin,13,14 Harris A. Lewin13,14 (leader), FrankW. Nicholas16
Bidirectional promoter analysis: Laura Elnitski9 (leader), Denis M.Larkin,13,14 Harris A. Lewin,13,14 James Reecy,35 Mary Q. Yang9
Segmental duplication analysis: David L. Adelson,6 Lin Chen,7 ZeCheng,7 Carol G. Chitko-McKown,36 Evan E. Eichler7,8 (leader),Laura Elnitski,9 Christine G. Elsik,2,3 George E. Liu,37 Lakshmi K.Matukumalli,38,37 Jiuzhou Song,39 Bin Zhu39
Analysis of gene ontology in segmental duplications: Christine G.
Elsik,2,3 David J. Lynn15 (leader), Justin T. Reese2
Adaptive evolution: Daniel G. Bradley,40 Fiona S.L. Brinkman,15Lilian P.L. Lau,40 David J. Lynn15 (leader), Matthew D. Whiteside15
Innate immunity: Ross L. Tellam4 (leader), Angela Walker,41
Thomas T. Wheeler42
Lactation: Theresa Casey,43 J. Bruce German,44,45 Danielle G. Lemay,45David J. Lynn,15 Nauman J. Maqbool,46 Adrian J. Molenaar,42
Monique Rijnkels18 (leader)Metabolism: Harris A. Lewin13,14 (leader), Seongwon Seo,47 PaulStothard48
Adaptive immunity: Cynthia L. Baldwin,49 Rebecca Baxter,50
Candice L. Brinkmeyer-Langford,19 Wendy C. Brown,51 ChristopherP. Childers,2 Timothy Connelley,52 Shirley A. Ellis,53 Krista Fritz,19
Elizabeth J. Glass,50 Carolyn T.A. Herzig,49 Antti Iivanainen,54
Kevin K. Lahmers,51 Loren C. Skow19 (leader)Annotation data management: Anna K. Bennett,2 Christopher P.Childers,2 C. Michael Dickens,3 Christine G. Elsik2,3 (leader), JamesG.R. Gilbert,25 Darren E. Hagen,2 Justin T. Reese,2 Hanni Salih3
Manual annotation organization: Jan Aerts,55 Alexandre R.Caetano,56 Brian Dalrymple,4 Christine G. Elsik,2,3 Jose FernandoGarcia,57 Richard A. Gibbs,1 Clare A. Gill,3,58 Debora L. Hamernik,11
Stefan G. Hiendleder,59 Erdogan Memili,60 Frank W. Nicholas,16
James Reecy,35 Monique Rijnkels,18 Loren C. Skow,19 DianeSpurlock,35 Paul Stothard,48 Ross L. Tellam,4 George M. Weinstock,5,1
John L. Williams,61 Kim C. Worley1
cDNA tissues, libraries, and sequencing: Lee Alexander,62
Michael J. Brownstein,63 Leluo Guan,48 Robert A. Holt64 (leader),Steven J.M. Jones64 (leader), Marco A. Marra64 (leader), RichardMoore,64 Stephen S. Moore48 (leader), Andy Roberts,62 MasaakiTaniguchi,65,48 Richard C. Waterman62
Genome sequence production: Joseph Chacko,1 Mimi M.Chandrabose,1 Andy Cree1 (leader), Marvin Diep Dao,1 Huyen H.Dinh1 (leader), Ramatu Ayiesha Gabisi,1 Sandra Hines,1 JenniferHume1 (leader), Shalini N. Jhangiani,1 Vandita Joshi,1 Christie L.Kovar1 (leader), Lora R. Lewis,1 Yih-shin Liu,1 John Lopez,1
Margaret B. Morgan,1 Donna M. Muzny1 (leader), Ngoc BichNguyen,1 Geoffrey O. Okwuonu,1 San Juana Ruiz,1 JirehSantibanez,1 Rita A. Wright1
Sequence finishing: Christian Buhay1 (leader), Yan Ding,1
Shannon Dugan-Rocha1 (leader), Judith Herdandez,1 MichaelHolder,1 Aniko Sabo1
Automated BAC assembly: Amy Egan,1 Jason Goodell,1 KatarzynaWilczek-Boney1
Sequence production informatics: Gerald R. Fowler1 (leader),Matthew Edward Hitchens,1 Ryan J. Lozado,1 Charles Moen,1 DavidSteffen,66,1 James T. Warren,1 Jingkun Zhang1
BAC mapping: Readman Chiu,64 Steven J.M. Jones,64 Marco A.Marra64 (leader), Jacqueline E. Schein64
Genome assembly: K. James Durbin,67,1 Paul Havlak,68,1 HuaiyangJiang,1 Yue Liu,1 Xiang Qin,1 Yanru Ren,1 Yufeng Shen,1,69 HenrySong,1 George M. Weinstock,5,1 Kim C. Worley1 (leader)Sequence library production: Stephanie Nicole Bell,1 Clay Davis,1
Angela Jolivet Johnson,1 Sandra Lee,1 Lynne V. Nazareth1 (leader),Bella Mayurkumar Patel,1 Ling-Ling Pu,1 Selina Vattathil,1 Rex LeeWilliams Jr.1
BAC production: Stacey Curry,1 Cerissa Hamilton,1 EricaSodergren5,1 (leader)Sequence variation detection: Lynne V. Nazareth,1 David A.Wheeler1
Markers and mapping: David L. Adelson,6 Jan Aerts,55 Wes Barris,4
Gary L. Bennett,36 Brian Dalrymple,4 André Eggen,70 Clare A. Gill,3,58
Ronnie D. Green,71 Gregory P. Harhay,36 Matthew Hobbs,72 OliverJann,50 Steve M. Kappes12 (leader), John W. Keele,36 Matthew P.Kent,73 Denis M. Larkin,13,14 Harris A. Lewin,13,14 Sigbjørn Lien,73
John C. McEwan,30 Stephanie D. McKay,74 Sean McWilliam,4
Stephen S. Moore,48 Frank W. Nicholas,16 Gemma M. Payne,30
Abhirami Ratnakumar,75,4 Hanni Salih,3 Robert D. Schnabel,74
Timothy Smith,36 Warren M. Snelling,36 Tad S. Sonstegard,37
Roger T. Stone,36 Yoshikazu Sugimoto,76 Akiko Takasuga,76 JeremyF. Taylor,74 Ross L. Tellam,4 Curtis P. Van Tassell,37 John L. Williams61
Genomic DNA: Michael D. MacNeil62Manual annotation: Antonio R.R. Abatepaulo,77 Colette A. Abbey,3Jan Aerts,55 Virpi Ahola,78 Iassudara G. Almeida,57 Ariel F. Amadio,79
Elen Anatriello,77 Suria M. Bahadue,2 Cynthia L. Baldwin,49 RebeccaBaxter,50 Anna K. Bennett,2 Fernando H. Biase,13 Clayton R. Boldt,3
Candice L. Brinkmeyer-Langford,19 Wendy C. Brown,51 Alexandre R.Caetano,56 Jeffery A. Carroll,80 Wanessa A. Carvalho,77 TheresaCasey,43 Eliane P. Cervelatti,57 Elsa Chacko,81 Jennifer E. Chapin,3 YeCheng,35 Christopher P. Childers,2 Jungwoo Choi,3 Adam J. Colley,82
Timothy Connelley,52 Tatiana A. de Campos,56 Marcos De Donato,83
24 APRIL 2009 VOL 324 SCIENCE www.sciencemag.org526
REPORTS
on
Apr
il 23
, 200
9 w
ww
.sci
ence
mag
.org
Dow
nloa
ded
from

Isabel K.F. de Miranda Santos,56,77 Carlo J.F. de Oliveira,77 HeatherDeobald,84 Eve Devinoy,85 C. Michael Dickens,3 Kaitlin E. Donohue,2
Peter Dovc,86 Annett Eberlein,87 Shirley A. Ellis,53 Carolyn J.Fitzsimmons,59 Alessandra M. Franzin,77 Krista Fritz,19 Gustavo R.Garcia,77 Jose Fernando Garcia,57 Sem Genini,61 J. Bruce German,44,45
James G.R. Gilbert,25 Clare A. Gill,3,58 Cody J. Gladney,3 Elizabeth J.Glass,50 Jason R. Grant,48 Marion L. Greaser,88 Jonathan A. Green,74
Darryl L. Hadsell,18 Darren E. Hagen,2 Hatam A. Hakimov,89 RobHalgren,43 Jennifer L. Harrow,25 Elizabeth A. Hart,25 NicolaHastings,90,50 Marta Hernandez,91 Carolyn T.A. Herzig,49 Stefan G.Hiendleder,59 Matthew Hobbs,72 Zhi-Liang Hu,35 Antti Iivanainen,54
Aaron Ingham,4 Terhi Iso-Touru,78 Catherine Jamis,2 Oliver Jann,50
Kirsty Jensen,50 Dimos Kapetis,61 Tovah Kerr,51 Sari S. Khalil,2 HasanKhatib,92 Davood Kolbehdari,48,93 Charu G. Kumar,13 DineshKumar,94,35 Richard Leach,50 Justin C-M Lee,2 Danielle G. Lemay,45
Changxi Li,95,48 George E. Liu,37 Krystin M. Logan,96 RobertoMalinverni,61 Nauman J. Maqbool,46 Elisa Marques,48 William F.Martin,45 Natalia F. Martins,56 Sandra R. Maruyama,77 RaffaeleMazza,97 Kim L. McLean,84 Juan F. Medrano,98 Erdogan Memili,60
Adrian J. Molenaar,42 Barbara T. Moreno,57 Daniela D. Moré,77 Carl T.Muntean,3 Hari P. Nandakumar,19 Marcelo F.G. Nogueira,99 IngridOlsaker,100 Sameer D. Pant,82 Francesca Panzitta,61 Rosemeire C.P.Pastor,57 Mario A. Poli,101 Nathan Poslusny,2 SatyanarayanaRachagani,35 Shoba Ranganathan,81,102 Andrej Razpet,86 JamesReecy,35 Penny K. Riggs,3,58 Monique Rijnkels,18 Gonzalo Rincon,98
Nelida Rodriguez-Osorio,60,103 Sandra L. Rodriguez-Zas,13 NatashaE. Romero,3 Anne Rosenwald,2 Lillian Sando,4 Sheila M. Schmutz,84
Seongwon Seo,47 Libing Shen,2 Laura Sherman,48 Loren C. Skow,19
Bruce R. Southey,104 Diane Spurlock,35 Ylva Strandberg Lutzow,4
Jonathan V. Sweedler,104 Imke Tammen,72 Masaaki Taniguchi,65,48
Ross L. Tellam,4 Bhanu Prakash V.L. Telugu,74 Jennifer M. Urbanski,2
Yuri T. Utsunomiya,57 Chris P. Verschoor,82 Ashley J. Waardenberg,4,105
Angela Walker,41 Zhiquan Wang,48 Robert Ward,106 RosemarieWeikard,87 Thomas H. Welsh Jr.,3,58 Thomas T. Wheeler,42 StephenN. White,51,107 John L. Williams,61 Laurens G. Wilming,25 Kris R.Wunderlich,3 Jianqi Yang,108 Feng-Qi Zhao109
1HumanGenomeSequencing Center, Department ofMolecularand Human Genetics, Baylor College of Medicine, One BaylorPlaza, Houston, TX 77030, USA. 2Department of Biology, 406Reiss, Georgetown University, 37th & O Streets NW,Washington, DC 20057, USA. 3Department of Animal Science,Texas A&MUniversity, 2471 TAMU, College Station, TX 77843–2471, USA. 4Livestock Industries, Commonwealth Scientificand Industrial Research Organization (CSIRO), 306 CarmodyRoad, St. Lucia, Queensland, 4067, Australia. 5The GenomeCenter atWashingtonUniversity,WashingtonUniversity Schoolof Medicine, 4444 Forest Park Avenue, St. Louis, MO 63108,USA. 6School of Molecular and Biomedical Science, School ofAgriculture, Food and Wine, The University of Adelaide,Adelaide, SA, 5005, Australia. 7Department of GenomeSciences, University of Washington, 1705 NE Pacific Street,Seattle, WA 98195–5065, USA. 8Howard Hughes MedicalInstitute, Seattle, WA 98195, USA. 9National Human GenomeResearch Institute, National Institutes of Health, 5625 FishersLane, Rockville, MD 20878, USA. 10Center for GenomicRegulation and Grup de Recerca en Informática Biomédica,Institut Municipal d’Investigació Mèdica, Universitat PompeuFabra, 08003 Barcelona, Catalonia, Spain. 11U.S. Departmentof Agriculture (USDA), Cooperative State Research, Education,& Extension Service, 1400 Independence Avenue SW, Stop2220, Washington, DC 20250–2220, USA. 12NationalProgram Staff, USDA–Agricultural Research Service, 5601Sunnyside Avenue, Beltsville, MD20705,USA. 13Department ofAnimal Sciences, University of Illinois at Urbana–Champaign,1201 West Gregory Drive, Urbana, IL 61801, USA. 14Institutefor Genomic Biology, University of Illinois at Urbana–Champaign,1201 West Gregory Drive, Urbana, IL 61801, USA. 15Depart-ment of Molecular Biology and Biochemistry, Simon FraserUniversity, 8888 University Drive, Burnaby, BC, V5A 1S6,Canada. 16Faculty of Veterinary Science, University of Sydney,Sydney, NSW, 2006, Australia. 17Center for IntegrativeGenomics, University of Lausanne, Lausanne, 1015, Switzer-land. 18Children's Nutrition Research Center, USDA–AgriculturalResearch Service, Department of Pediatrics–Nutrition, BaylorCollege of Medicine, 1100 Bates Street, Houston, TX 77030–2600, USA. 19Department of Veterinary Integrative Bio-sciences, Texas A&M University, College Station, TX 77843,USA. 20Department of Genetic Medicine and Development,University of Geneva Medical School, 1 rue Michel-Servet,
Geneva, 1211, Switzerland. 21Swiss Institute of Bioinformatics,1 rue Michel-Servet, Geneva, 1211, Switzerland. 22Division ofMolecular Biosciences, Imperial College London, SouthKensington Campus, London, SW7 2AZ, UK. 23Department ofVeterinary Pathobiology, Texas A&M University, CollegeStation, TX 77843, USA. 24National Center for BiotechnologyInformation, National Library of Medicine, National Institutesof Health, Bethesda, MD 20892, USA. 25Informatics Depart-ment, Wellcome Trust Sanger Institute, Hinxton, Cambridge,CB10 1HH, UK. 26Department of Computer Science, Universityof London, Royal Holloway, Egham, Surrey, TW20 0EX, UK.27Department of Biology and Biochemistry, University ofHouston, Houston, TX 77204, USA. 28McKusick—NathansInstitute of Genetic Medicine, BRB 579, Johns HopkinsUniversity School of Medicine, 733North Broadway, Baltimore,MD 21205, USA. 2945 Monterey Drive, Tiburon, CA 94920,USA. 30Animal Genomics, AgResearch, Invermay, PB 50034,Mosgiel, 9053, New Zealand. 31eResearch SA, University ofAdelaide, North Terrace, Adelaide, SA, 5005, Australia.32Department of Structural Biology and Bioinformatics,University of Geneva Medical School, 1 rue Michel-Servet,Geneva, 1211, Switzerland. 33Catalan Institution for Researchand Advanced Studies, 08010 Barcelona, Catalonia, Spain.34Computational Genomics, Universitat Pompeu Fabra, 08003Barcelona, Catalonia, Spain. 35Department of Animal Science,Iowa State University, 2255 Kildee Hall, Ames, IA 50011–3150, USA. 36Meat Animal Research Center, USDA–AgriculturalResearch Service, Clay Center, NE 68933, USA. 37Bovine Func-tional Genomics Laboratory, USDA–Agricultural Research Service,Beltsville Agricultural Research Center (BARC)–East, Beltsville,MD 20705, USA. 38Department of Bioinformatics and Computa-tional Biology, George Mason University, 10900 University Blvd,Manassas, VA 20110, USA. 39Department of Bioengineering,University of Maryland, College Park, MD 20742, USA. 40SmurfitInstitute of Genetics, Trinity College Dublin, Dublin 2, Ireland.41Department of Veterinary Pathobiology, 245 Bond Life Sci-ences Center, University of Missouri, Columbia, MO 65211, USA.42Dairy Science and Technology Section, AgResearch, RuakuraResearch Centre, East Street, Private Bag 3123, Hamilton, 3240,New Zealand. 43Department of Animal Science, Michigan StateUniversity, East Lansing, MI 48824–1225, USA. 44Nestlé Re-search Centre, Vers chez les Blanc CH, Lausanne 26, 1000,Switzerland. 45Department of Food Science and Technology,University of California–Davis, Davis, CA 95616, USA. 46Bio-informatics, Mathematics and Statistics, AgResearch, RuakuraResearch Centre, East Street, Private Bag 3123, Hamilton, 3240,New Zealand. 47Division of Animal Science and Resource,Chungnam National University, Daejeon, 305-764, Korea.48Department of Agricultural, Food and Nutritional Science, Uni-versity of Alberta, 410 AgFor Centre, Edmonton, AL, T6G 2P5,Canada. 49Department of Veterinary and Animal Sciences,University of Massachusetts, Amherst, MA 01003, USA. 50TheRoslin Institute and Royal (Dick) School of Veterinary Studies,University of Edinburgh, Roslin, Midlothian, EH25 9PS, UK.51Department of Veterinary Microbiology and Pathology, Wash-ington State University, Pullman, WA 99164, USA. 52Division ofInfection and Immunity, The Roslin Institute, Royal (Dick)School of Veterinary Science, University of Edinburgh, Roslin,Midlothian, EH25 9RG, UK. 53Immunology Division, Institutefor Animal Health, Compton, RG20 7NN, UK. 54Department ofBasic Veterinary Sciences, University of Helsinki, Post OfficeBox 66, Helsinki, FIN-00014, Finland. 55Genome Dynamicsand Evolution, Wellcome Trust Sanger Institute, Hinxton,Cambridge, CB10 1SA, UK. 56Embrapa Recursos Genéticos eBiotecnologia, Final Avenida W/5 Norte, Brasilia, DF, 70770-900, Brazil. 57Animal Production and Health Department,UNESP—Sao Paulo State University, Aracatuba, SP, 16050-680, Brazil. 58Texas AgriLife Research, College Station, TX77843, USA. 59JS Davies Epigenetics and Genetics Group,School of Agriculture, Food & Wine and Research Centre forReproductive Health, The University of Adelaide, RoseworthyCampus, Roseworthy, SA, 5371, Australia. 60Department ofAnimal and Dairy Sciences, Mississippi Agricultural and For-estry Experiment Station, Mississippi State University, Mis-sissippi State, MS 39762, USA. 61Parco Tecnologico Padano,Via Einstein, Polo Universitario, Lodi, 26900, Italy. 62FortKeogh Livestock and Range Research Laboratory, USDA-Agricultural Research Service, Miles City, MT 59301, USA.63Laboratory of Genetics, National Institute of Mental Health,NIH, Building 49, B1EE16, 49 Convent Drive, Bethesda, MD
20892, USA. 64Genome Sciences Centre, British ColumbiaCancer Agency, 675 West 10th Avenue, Vancouver, BC, V5Z1L3, Canada. 65Division of Animal Sciences, National Instituteof Agrobiological Sciences, Tsukuba, Ibaraki, 305-8602, Japan.66Bioinformatics Research Center, Baylor College of Medicine,One Baylor Plaza, Houston, TX 77030, USA. 67Department ofBiomolecular Engineering, University of California at SantaCruz, Santa Cruz, CA 95064, USA. 68Department of ComputerScience, University of Houston, Houston, TX 77204–3010,USA. 69Department of Computer Science and Center forComputational Biology and Bioinformatics, Columbia Uni-versity, New York, NY 10032, USA. 70INRA, Animal Geneticsand Integrative Biology, Bovine Genetics and Genomics, 78350Jouy-en-Josas, France. 71Pfizer Animal Genetics, Pfizer AnimalHealth, New York, NY 10017, USA. 72Faculty of VeterinaryScience, University of Sydney, Camden, NSW, 2570, Australia.73Centre for Integrative Genetics and Department of Animaland Aquacultural Sciences, Norwegian University of LifeSciences, Arboretveien 6, Ås, 1432, Norway. 74Division ofAnimal Sciences, University of Missouri, 920 East CampusDrive, Columbia, MO 65211, USA. 75Department of MedicalBiochemistry and Microbiology, Uppsala University, UppsalaBiomedical Centre Husargatan 3, Uppsala, 75 123, Sweden.76Shirakawa Institute of Animal Genetics, Nishigo, Fukushima961-8061, Japan. 77Department of Biochemistry and Immu-nology, Ribeirão Preto Medical School, University of São Paulo,Av Bandeirantes 3900, Ribeirão Preto, SP, 14049-900, Brazil.78Biotechnology and Food Research, MTT Agrifood ResearchFinland, Jokioinen, FI-31600, Finland. 79EEA Rafaela, InstitutoNacional de Tecnología Agropecuaria (INTA), Ruta 34 Km 227,Rafaela, Santa Fe, 2300, Argentina. 80Livestock Issues ResearchUnit, USDA–Agricultural Research Service, Lubbock, TX 79403,USA. 81Department of Chemistry and Biomolecular Sciences& ARC Centre of Excellence in Bioinformatics, MacquarieUniversity, Sydney, 2109, NSW, Australia. 82Department ofAnimal and Poultry Science, University of Guelph, Guelph, ON,N1G2W1, Canada. 83Instituto de Investigaciones en Bio-medicina y Ciencias Aplicadas, Universidad de Oriente, AvenidaUniversidad, Cumana, Sucre, 6101, Venezuela. 84Departmentof Animal and Poultry Science, University of Saskatchewan,Saskatoon, SK, S7N 5A8, Canada. 85INRA–UR1196, Génomiqueet Physiologie de la Lactation, F78352 Jouy-en-Josas, France.86Department of Animal Science, University of Ljubljana, Groblje3,Domzale, SI-1230, Slovenia. 87ResearchUnitMolecularBiology,Research Institute for the Biology of Farm Animals (FBN),Dummerstorf, 18196, Germany. 88Department of AnimalSciences, University of Wisconsin–Madison, 1805 Linden Drive,Madison,WI 53706,USA. 89Department ofMolecular and CellularBiology, University of Guelph, Guelph, ON, N1G 2W1, Canada.90Cell Biology and Biophysics, European Molecular BiologyLaboratory (EMBL)–Heidelberg, Meyerhofstrasse 1, Heidelberg,Germany. 91Laboratory of Molecular Biology, Instituto TecnologicoAgrario de Castilla y Leon (ITACyL), Carretera de Burgos km 119,Valladolid, 47071, Spain. 92Department of Dairy Science,University of Wisconsin, Madison, WI 53706, USA. 93MonsantoCompany, 3302 SE Convenience Blvd, Ankeny, IA 50021, USA.94Genes & Genetic Resources Molecular Analysis Lab, NationalBureau of Animal Genetic Resources, Baldi Bye Pass, Karnal,Haryana, 132001, India. 95Lacombe Research Centre, Agri-culture and Agri-Food Canada, Lacombe, AL, T4L 1W1, Canada.96Biomedical Sciences, University of Guelph, Guelph, ON, N1G2W6, Canada. 97Zootechnics Institute, Università Cattolica delSacro Cuore, via Emilia Parmense 84, Piacenza, 29100, Italy.98Department of Animal Science, University of California atDavis, One Shields Avenue, Davis, CA 95616, USA. 99Departa-mento de Ciências Biológicas, Faculdade de Ciências e Letras,UNESP–São Paulo State University, Av Dom Antônio 2100,Vila Tênis Clube, Assis, SP, 19806-900, Brazil. 100Depart-ment of Basic Sciences and Aquatic Medicine, NorwegianSchool of Veterinary Science, Post Office Box 8146 Dep,Oslo, NO-0033, Norway. 101Instituto de Genética EwaldFavret, Instituto Nacional de Tecnología Agropecuaria (INTA),Las Cabañas y de Los Reseros s/n CC25, Castelar, Buenos Aires,B1712WAA, Argentina. 102Department of Biochemistry, YongLoo Lin School of Medicine, National University of Singapore,8 Medical Drive, Singapore, 117597, Singapore. 103GrupoCENTAURO, Universidad de Antioquia, Medellín, Colombia.104Department of Chemistry, University of Illinois, Urbana,IL 61801, USA. 105Eskitis Institute for Cell and MolecularTherapies, Griffith University, Nathan, QLD, 4111, Australia.
www.sciencemag.org SCIENCE VOL 324 24 APRIL 2009 527
REPORTS
on
Apr
il 23
, 200
9 w
ww
.sci
ence
mag
.org
Dow
nloa
ded
from

106Nutrition and Food Sciences, Utah State University,Logan, UT 84322, USA. 107Animal Disease Research Unit,USDA–Agricultural Research Service, Pullman, WA 99164,USA. 108Department of Pharmacology, 2-344 BSB, Uni-versity of Iowa, 51 Newton Road, Iowa City, IA 52242,USA. 109Department of Animal Science, 211 Terrill, Uni-
versity of Vermont, 570 Main Street, Burlington, VT05405, USA.
Supporting Online Materialwww.sciencemag.org/cgi/content/full/324/5926/522/DC1Materials and Methods
Figs. S1 to S23Tables S1 to S14References
10 December 2008; accepted 16 March 200910.1126/science.1169588
Genome-Wide Survey of SNPVariation Uncovers the GeneticStructure of Cattle BreedsThe Bovine HapMap Consortium*
The imprints of domestication and breed development on the genomes of livestock likely differfrom those of companion animals. A deep draft sequence assembly of shotgun reads from a singleHereford female and comparative sequences sampled from six additional breeds were used todevelop probes to interrogate 37,470 single-nucleotide polymorphisms (SNPs) in 497 cattle from19 geographically and biologically diverse breeds. These data show that cattle have undergone arapid recent decrease in effective population size from a very large ancestral population, possiblydue to bottlenecks associated with domestication, selection, and breed formation. Domesticationand artificial selection appear to have left detectable signatures of selection within the cattle genome,yet the current levels of diversity within breeds are at least as great as exists within humans.
The emergence of modern civilization wasaccompanied by adaptation, assimilation,and interbreeding of captive animals. In
cattle (Bos taurus), this resulted in the develop-
ment of individual breeds differing in, for ex-ample, milk yield, meat quality, draft ability, andtolerance or resistance to disease and pests. How-ever, despite mapping and diversity studies (1–5)and the identification of mutations affecting somequantitative phenotypes (6–8), the detailed geneticstructure and history of cattle are not known.
Cattle occur as two major geographic types,the taurine (humpless—European, African, andAsian) and indicine (humped—South Asian, andEast African), which diverged >250 thousandyears ago (Kya) (3). We sampled individualsrepresenting 14 taurine (n = 376), three indicine(n = 73) (table S1), and two hybrid breeds (n =48), as well as two individuals each of Bubalusquarlesi and Bubalus bubalis, which divergedfrom Bos taurus ~1.25 to 2.0 Mya (9, 10). Allbreeds except Red Angus (n = 12) were rep-resented by at least 24 individuals. We preferredindividuals that were unrelated for ≥4 genera-tions; however, each breed had one or two sire,dam, and progeny trios to allow assessment ofgenotype quality.
Single-nucleotide polymorphisms (SNPs) thatwere polymorphic in many populations were pri-marily derived by comparing whole-genome se-quence reads representing five taurine and oneindicine breed to the reference genome assemblyobtained from a Hereford cow (10) (table S2).This led to the ascertainment of SNPs with highminor allele frequencies (MAFs) within the dis-covery breeds (table S5). Thus, as expected, withtrio progeny removed, SNPs discovered withinthe taurine breeds had higher average MAFs
*The full list of authors with their contributions and affiliationsis included at the end of the manuscript.
A B
admixed breeds
Principal Component 1
Prin
cipa
l Com
pone
nt 2
B. indicus
admixed breeds
B. taurus
-0.05 0.00 0.05 0.10
-0.1
0.0
0.1
0.2
K=2
K=3
K=9
Fig. 1. (A) Population structure assessed by InStruct. Bar plot, generatedby DISTRUCT, depicts classifications with the highest probability underthe model that assumes independent allele frequencies and inbreedingcoefficients among assumed clusters. Each individual is represented by avertical bar, often partitioned into colored segments with the length ofeach segment representing the proportion of the individual’s genomefrom K = 2, 3, or 9 ancestral populations. Breeds are separated by black
lines. NDA, N'Dama; SHK, Sheko; NEL, Nelore; BRM, Brahman; GIR, Gir;SGT, Santa Gertrudis; BMA, Beefmaster; ANG, Angus; RGU, Red Angus;HFD, Hereford; NRC, Norwegian Red; HOL, Holstein; LMS, Limousin; CHL,Charolais; BSW, Brown Swiss; JER, Jersey; GNS, Guernsey; PMT, Piedmontese;RMG, Romagnola. (B) Principal components PC1 and PC2 from all SNPs.Taurine breeds remain separated from indicine breeds, and admixed breedsare intermediate.
24 APRIL 2009 VOL 324 SCIENCE www.sciencemag.org528
REPORTS
on
Apr
il 23
, 200
9 w
ww
.sci
ence
mag
.org
Dow
nloa
ded
from