
Reports and Financial Statements - University of Cambridge · The commentary that follows is...
73
Reports and Financial Statements for the year ended 31 July 2014
Transcript of Reports and Financial Statements - University of Cambridge · The commentary that follows is...

Reports and Financial Statements for the year ended 31 July 2014

32 University of Cambridge Annual Report 2014
Financial review 33
Corporate governance 44
Members of the Council 46
Statement of public benefit 47
Statement of internal control 49
Statement of responsibilities of the Council 50
Independent auditors’ report to the Council 51
Statement of principal accounting policies 53
Consolidated income and expenditure account 58
Note of consolidated historical cost result 59
Consolidated statement of total recognised gains and losses 60
Balance sheets 61
Consolidated cash flow statement 62
Notes to the accounts 63
notes to the accounts 25 – 48
Reports and financial statementsfor the year ended 31 July 2014

Reports and Financial Statements 33
Preliminary
The commentary that follows is intended to give the readers of the financial statements an overview of the finances and operations of the University group including Cambridge Assessment and Cambridge University Press. It should be read in conjunction with the Annual Report of the Council and the Annual Report of the General Board to the Council for the academical year 2013–14, which are published alongside these financial statements. The financial position of the teaching and research activities of the University may be seen more clearly in the Financial Management Information published in the Reporter. Further detailed information about the finances and operations of Cambridge Assessment and Cambridge University Press is given in the annual reports of those entities which are also published.
Scope of the Financial Statements
The consolidated financial statements cover the teaching and research activities of the University, its subsidiary companies which undertake activities which for legal or commercial reasons are more appropriately carried out by limited companies, Cambridge Assessment and Cambridge University Press and their subsidiary companies and joint ventures, and the Gates Cambridge Trust and the Cambridge Commonwealth, European and International Trust (the ‘Associated Trusts’).
Cambridge Assessment and Cambridge University Press are constituent parts of the corporation known as the Chancellor, Masters and Scholars of the University of Cambridge. Cambridge Assessment’s primary work is the conduct and administration of examinations in schools and for persons who are not members of the University. Cambridge University Press is the publishing house of the University dedicated to publishing for the advancement of knowledge, education, and learning worldwide.
The Associated Trusts are separately constituted charities. They are deemed to be subsidiary undertakings of the University since it appoints the majority of the trustees of each Trust. The purposes of these Trusts are to support the University by enabling persons from outside the United Kingdom to benefit from education in the University by the provision of scholarships and grants and otherwise.
Mission
The mission of the University of Cambridge is to contribute to society through the pursuit of education, learning, and research at the highest international levels of excellence.
Its principal activities are teaching and learning, research, stewardship of collections and ancient buildings, and the examinations and publishing activities of Cambridge Assessment and Cambridge University Press respectively.
Financial review

34 University of Cambridge Annual Report 2014
Financial Review
Funding
The sources of income of the University are:• The government, which through the Higher Education Funding Council for England
(HEFCE) provides a block grant for teaching and a grant determined by the quality and volume of research through the Research Assessment Exercise (Research Excellence Framework for 2014).
• Students through fees charged for instruction and facilities.• Research income from publicly funded Research Councils, charitable foundations, European
Union funding, and through collaborations with the private sector. • Benefactions and donations for current use.• Investment income from our accumulated endowment and other assets.• Income from services provided to external customers, including the customers of Cambridge
Assessment and Cambridge University Press.• A small but increasing income from commercialisation of intellectual property.
Accounting for endowment and investment income
The main investment pool generating endowment and investment income is the Cambridge University Endowment Fund (CUEF). The CUEF is managed on a total return basis, such that the amount distributed annually for budgetary expenditure is determined by a formula which has regard to the total return reasonably to be expected over the long term. The CUEF’s portfolio is largely invested indirectly through fund managers with the approach intended to maximise total investment return within acceptable risk. A substantial proportion of the CUEF’s investments yield little or no income in the form of dividends, interest or rents. In the year ended 31 July 2014, distributions by the CUEF exceeded the income received from its underlying investments by £66m (2013: £61m), the balance of the distributions being funded by drawing on long-term capital growth.
In these financial statements total endowment and investment income includes the income from CUEF’s underlying investments rather than the distributions made by the CUEF. The impact is that endowment and investment income is £66m less than it would have been had it been based on distributions, with a corresponding increase in capital gains (reflected in the statement of recognised gains and losses). For the individual trust funds and other endowment funds which have invested capital in the CUEF, the full distribution remains available as income.

Reports and Financial Statements 35
Financial Review
Financial performance for the year
The consolidated results for the year ended 31 July 2014 are summarized in Table 1.
Table 1 2013-14 2012-13 Change
£m £m %
Income 1,504 1,438 +4.6%
Expenditure (1,510) (1,415) +6.8%
(Deficit) / surplus on continuing operations (6) 23
Transfer from restricted endowments 50 50
Surplus for the year retained within general reserves 44 73
Net assets 3,177 3,074 +3.4%
Corresponding figures including the element of CUEF distributions funded out of long-term capital growth, as explained above, are:
2013-14 2012-13
£m £m
Income 1,570 1,499
Surplus for the year retained within general reserves 74 99
This consolidated position is built up from the University’s three main segments: its core academic activities and the examination and publishing activities carried out by Cambridge Assessment and Cambridge University Press respectively. Within the group there are a number of intra-group transactions, principally the financial and other support for the University’s academic activities made by both Cambridge Assessment and the Press. Table 2 gives segmental information.

36 University of Cambridge Annual Report 2014
Financial Review
Table 2
Surplus / (deficit) on continuing operations
Income ExpenditureSurplus /
(deficit)
£m £m £m
Results by segment Education and research 909 964 (55)
Cambridge Assessment 351 313 38
Cambridge University Press 265 261 4
Financial support of the University by Cambridge Assessment (16) (16) –
Financial support of the University by Cambridge University Press (2) (2) –
Pension scheme and other adjustments (3) (10) 7
1,504 1,510 (6)
The University Group’s revenues exceeded £1.5 billion for the first time. Although Cambridge Assessment and the Cambridge University Press remained in surplus, Cambridge Assessment strongly so, the Education and research activities result was a deficit of £55m after accounting for investment income as described above. Including the element of CUEF distributions funded out of long-term capital growth, the segment’s surplus on continuing operations was £11m.
Research grants and contracts income increased by £39m (+12%) to £371m, with particular growth in European Commission-funded research and reflecting the full year effect of research institutes transferred to the University from Cancer Research UK and the Medical Research Council. Academic fees increased by £25m (+14%) with a further year of undergraduate fees at the higher rate and increased fees for post-graduate courses. This increase was offset somewhat by a reduction in recurrent funding from HEFCE as the new funding regime for Home/EU undergraduates was phased in.
The University’s international exams group Cambridge Assessment designs and delivers assessments to over 8 million learners in over 170 countries. Cambridge Assessment offers these qualifications through three exam boards: Cambridge English Language Assessment, Cambridge International Examinations, and Oxford Cambridge and RSA Examinations (OCR). Income from its examination and assessment services increased to £341m (2013: £317m) in the year. The international businesses of English language testing and of international examinations continued to be particularly strong, offsetting a difficult environment for OCR which saw a significant reduction in revenue as a result of changes in national policy on qualifications in the UK. Cambridge Assessment transferred £16m (2013: £16m) during the year in support of the University’s education and research activities.
The Cambridge University Press is the University’s publishing arm and furthers through publication the University’s objective of advancing learning, knowledge and research worldwide. It collaborates with Cambridge Assessment where appropriate, notably in English language materials and testing. The Press is organized into three main streams: Academic books and journals, English language teaching materials and Education publishing. Revenue from the University’s publishing

Reports and Financial Statements 37
Financial Review
activity was overall broadly level. A substantial proportion of the Press’s sales are denominated in foreign currencies, and the general strengthening of sterling had an adverse impact on the level of reported sales, despite underlying growth of close to 5%. This reflected steady growth in the English Language and Education streams but the Academic books and journals publishing business remained challenging.
The University receives and generates significant Other Income, including contributions from Health and hospital authorities, income from intellectual property managed primarily through Cambridge Enterprise Limited, unrestricted donations of £13m (2013: £14m), rents from its non-operational properties, and in some years significant donations of, and for the purchase of, heritage assets.
Change in financial position
Table 3 below gives the movement in net assets showing the capital flows into the group, analysed into its three main segments, and the impact of changes in the values of investment assets.
Table 3Movement in net assets
Education and
researchCambridge
Assessment
Cambridge University
Press
University Assistants
Pension scheme Total
£m £m £m £m £m
Net assets at 1 August 2013 2,965 356 44 (291) 3,074Surplus / (deficit) on continuing operations (55) 38 4 7 (6)New endowment capital 30 – – – 30External funding for capital expenditure 12 – – – 12Actuarial loss on retirement benefits – – (8) (54) (62)Increase in investment values 133 6 – – 139Currency and other adjustments – – (9) (1) (10)
Net assets at 31 July 2014 3,085 400 31 (339) 3,177
Net assets for the University Group increased by £103m (+3.4%). New capital receipts for endowment and for capital expenditure in aggregate £52m were received and the investment portfolio made gains, partially offset by actuarial loss arising from accounting for the Group’s pension schemes on an FRS17 basis.
38 University of Cambridge Annual Report 2014
Financial Review
Capital expenditure
The University continues its investment in refreshing, renewing and expanding its operational estate and equipment and in the physical facilities and IT infrastructure for Cambridge Assessment and Cambridge University Press. This continual investment in infrastructure is essential if the University is to remain globally competitive. The level of capital expenditure is projected to increase substantially over the next few years.
Major capital expenditure projects, mainly new buildings, are funded from a combination of sources including operating cash flows, government funding through HEFCE and external donations. Equipment is funded mainly by research grant sponsors, supplemented by operating cash flows. The University’s capital planning framework schedules buildings and large equipment purchases over a planning period of up to 25 years to match academic priorities and to take account of inter-dependencies between projects. Cambridge Assessment and the Press similarly have major programmes of capital expenditure on office and logistics buildings and on enhanced business systems.
Over the year the University’s total capital expenditure on property, plant and equipment was £188m, of which £118m was in respect of the University’s academic activities.
During the year there was capital expenditure of £25m for preparatory works on the North West Cambridge development. On other sites major items of expenditure incurred in the year included the new building for Chemical Engineering and Biotechnology, the Data Centre, extension to the CAPE building (all on the West Cambridge site), the Cambridge Conservation Centre and various projects on the Cambridge Biomedical Campus.
Other investment was made over a number of projects across the University’s main sites, and in capital expenditure, primarily on business systems, by Cambridge Assessment and Cambridge University Press.
North West Cambridge Development
The University is developing its site at North West Cambridge, currently comprising primarily agricultural land. The proposals include site infrastructure and landscaping, University housing for letting to staff, market housing for sale and let, supermarket and retail units and further sites for research. This will contribute to the strategic need to provide affordable and high quality housing for post-doctoral research staff and others at the beginning of their careers with the University. The development will add to the long-term strategy of the University in allowing further expansion of academic activities. The market housing, which will number 1,500 units, and retail and commercial developments contribute significantly to the viability of the development.
Planning permission has now been obtained for the majority of the buildings in Phase 1 and key construction contracts have been let, including the site-wide infrastructure contract. Contracts with private residential developers to build the market housing on the development are close to finalization and work has been initiated to seek developers and operators for a hotel and a senior care facility.

Reports and Financial Statements 39
Financial Review
Endowment and other investments
The University’s endowment and other investments support posts and activities and gives important financial assistance to students. The investment assets are managed in three principal pools:
(i) Cambridge University Endowment Fund (CUEF)
The majority of fixed asset investments and endowment assets are held in the CUEF, which is managed by the University’s Investment Office with the advice and oversight of the Investment Board. Colleges and other charities linked with the University are permitted to invest in the CUEF, to gain from its scale, diversification and professional management. The Associated Trusts are substantially invested in the CUEF, and a number of Colleges have made investments.
The CUEF’s long run investment objective is to achieve or exceed an average annual rate of total return (i.e. income and net capital gains), net of all costs and before distributions are taken into account, equal to RPI plus 5.25%, such that after the distributions for expenditure in the operating budget are taken into account the capital is maintained in real terms. A further objective is to manage judiciously the risk taken in order to meet the total return objective by utilising diversification of investment strategies, of investment asset classes and of investment managers.
The amount distributed for expenditure in the operating budget is determined by a formula based on underlying capital values combined with factors which smooth the rate of spending changes from year to year, allowing a degree of certainty for planning purposes.
During the year ended 30 June 2014 the CUEF had an investment return of 10.4% (2013: 20.0%). After payment of distributions to investors the unit value increased by 6.4% (2013: 15.2%). The Fund has returned an annualized 13.1% return over a rolling 5 year period.
The value of the CUEF at 30 June 2014 was £2,291m (2013: £2,072m). The asset allocation and investment selection in the Fund is aimed at optimizing the expected future long run total return bearing in mind expected future volatility. The CUEF’s asset allocation at that date was:
Public equity 63%
Private investment 10%
Absolute return 12%
Credit 3%
Real assets 11%
Fixed interest/cash 1%
40 University of Cambridge Annual Report 2014
Financial Review
(ii) Money market investments
The majority of the University and Group current asset investments are invested in the deposit pool. This pool is managed by the Finance Division according to guidelines on diversification, exposure, and credit quality agreed by the Finance Committee. The investments are principally short-term deposits with banks and similar institutions.
(iii) Other investment assets
Some long-term investments are held outside the CUEF including certain investment properties in Cambridge, other securities, and equity investments in spin-out companies overseen by the University’s technology transfer company Cambridge Enterprise.
Public Bond
On 17 October 2012 the University issued £350m of 3.75% unsecured bonds due October 2052. The bonds are listed on the London Stock Exchange. The net proceeds of the issue of £342m are for general corporate purposes, including investment in research facilities, accommodation and other assets. Pending application to the capital programme and in the North West Cambridge development the funds raised are invested conservatively in the CUEF and other investment vehicles.
The University is rated Aaa (stable) by Moody’s Investor Services.
Staff costs and pensions
Staff costs make up 46% of the University group’s total operating expenditure and 56% in respect of the University’s education and research activities (which comprise three-quarters of the total group staff costs). Total staff costs increased by 7.5% over the prior year to £650m through the increase in Research Grants and contracts volumes and business growth of Cambridge Assessment, against continuing pay restraint in the uncertain economic conditions.
The costs and risks of the pension schemes to which the University is exposed remain of concern; in particular the Universities Superannuation Scheme (USS). The deficit of the USS is not yet reflected in the University’s balance sheet but is a major exposure for the University. Changes introduced recently by the USS for benefits in respect of future service were insufficient and proposals are currently under discussion for more radical changes to benefits in order to make the scheme affordable and sustainable. The University’s contribution to the USS continues at 16% of pensionable pay; this is expected to increase following the USS’s triennial valuation as at 31 March 2014.
The University group has three other major schemes: the Cambridge University Assistants’ Contributory Pension Scheme (CPS) for assistant staff, and two schemes for staff of the Cambridge University Press. The CPS is a hybrid defined benefit scheme with a DC component and remains open to new joiners and to future accrual. The University is making deficit-recovery contributions

Reports and Financial Statements 41
Financial Review
to the scheme of £14.6m per annum for fourteen years commencing August 2011. Certain changes to future service benefits were introduced from 1 January 2013 in order to reduce risk and cost to the University in the interests of making the CPS affordable and sustainable. The Cambridge University Press defined benefit schemes are closed to new joiners and are subject to a recovery plan projecting an aggregate deficit contribution of £47.6m over the nine years to 2022.
The CPS and the Press’s schemes, being single-employer schemes, are included in the financial statements following Financial Reporting Standard 17 (FRS 17). The total net pension liability under FRS 17 is £417m (2013: £364m), of which £79m relates to the Press’s schemes.
Development and alumni relations
The benefits of philanthropy are long-term, strengthening Cambridge’s financial security for posterity at a time of intensifying global competition and uncertainty. The University and the Cambridge Colleges are committed to continued investment in fundraising and in building close relationships with alumni and supporters internationally. During 2013-14 the University received £30m (2013: £41m) in new endowment capital and £13m (2013: £14m) in unrestricted donations.
Planning for the next campaign has continued, with academic needs being identified in order to focus fund-raising priorities. An internal announcement of the campaign to the Collegiate University took place on 1 October 2014, looking towards a public launch in autumn 2015.
The financial outlook
The financial landscape is continuing to evolve as policy changes in student funding are implemented and government policy for Higher Education funding develops. The recurrent research and capital grants from HEFCE are likely to remain a core part of the University’s income. Although the teaching grant has been severely reduced, this is offset by an increase in home/EU student tuition fees, albeit reducing annually in real terms whilst the fee remains fixed at £9,000. Collegiate Cambridge makes a material loss on undergraduate education and to contain this, and maintain the quality of education, the University’s undergraduate numbers will remain broadly constant. Graduate numbers are expected to continue to follow the historic trend of around 2% growth per annum and with a continuing revision of our post-graduate fees should provide a steady net increase in funding.
Research grant and contract income has increased substantially, both organically and by transfers-in of research institutes in Cambridge. This volume growth is compounding the problem of inadequate recovery of the indirect costs of research from sponsors. A TRAC based analysis indicates that the University recovers only 89p for every £1 it spends on research and it is evaluating the options available to it for mitigating this loss.
The University faces significant challenges in funding its ambitious but essential strategic capital expenditure programme, including replacing the significant reduction in HEFCE’s capital funding stream.

42 University of Cambridge Annual Report 2014
Financial Review
Cambridge Assessment’s overseas activities are expected to continue to thrive while the OCR business stream is subject to policy and regulatory changes in the UK. OCR is investing for the future and projects a return to surplus. Cambridge Assessment has an ambitious programme of investment in systems, warehouse facilities, and a major new office building in Cambridge to accommodate growth and achieve operational efficiencies. Cambridge University Press continues to find its markets demanding, particularly in the US, and is addressing the acceleration of digital publishing and changing profile of its customers. The Press is expected to increase steadily its turnover and its surplus.
Performance of investment assets has been strong, with favourable impact on the University’s endowment and the assets of its pension schemes. However, global economic uncertainties have emerged more strongly in recent months and returns at the target levels look challenging over the near future.
Principal risks and uncertainties affecting the long-term financial position
The principal risks the University must address do not change: its long-term ability to maintain and develop its research funding, to attract the best staff and students, and to maintain and renew its physical facilities. The activities of Cambridge Assessment and Cambridge University Press are subject to the pressures of international competition, and they must balance the need to generate sufficient net income to ensure that they thrive with the need to support the University’s core academic activities whenever possible.
The key financial uncertainties and risks are:• the possibility of further cuts to government support for teaching and research, and the
erosion in real terms of the Home/EU undergraduate fee;• the outcome of the Research Excellence Framework exercise in 2014, which will have a major
impact on the University’s research funding;• funding of sponsored research by charities and foundations, and their unwillingness to cover the
full costs, and an increase in EC-sponsored research also at a level below full economic costs;• movements in investment markets reducing the value of the endowment and other
investment assets;• increasing and uncertain costs of pension provision;• pay inflation, against a background of pay restraint in recent years;• the ability to continue to invest in buildings, infrastructure and equipment for both teaching
and research, against a background of reduced government and research council capital funding;
• the support by benefactors for endowment, capital expenditure and for current use; and• the economic success of Cambridge Assessment and the Press, which operate in challenging
international markets. Cambridge Assessment provides an increasingly important source of unrestricted funding for the teaching and research activities of the University.
The University is proposing significant capital expenditure in the coming years on academic buildings, office buildings for Cambridge Assessment, and the North West Cambridge development. The University has strong cash flows from its operations, holds liquid assets

Reports and Financial Statements 43
Financial Review
following the recent issuance of a public bond, and substantial long-term investment assets. However, it will continue to be dependent on support by benefactors to achieve its objectives.
The costs and risks of the pension schemes to which the University is exposed remain of particular concern, and in this respect changes to the USS benefit structure are necessary.
In conclusion
The University group’s financial operating performance has allowed a surplus to be retained in general reserves for future investment. Academic activities remained finely balanced, but Cambridge Assessment’s operations were again at a significant surplus. Operating cash flows remain strong and there was another good performance by the University’s investments in the year, building a steady long-term growth.
The future comprehensive spending review is likely to be challenging for the UK higher education sector, and the outcome of the 2014 Research Excellence Framework will be critical for the University. The new undergraduate fee regime has been absorbed satisfactorily. The University continues to diversify its funding sources and is now focusing in particular on building its philanthropic income. The principal financial challenge over the coming decade will be the funding of the strategic capital programme.
The University is one of the world’s leading academic institutions and has a reputation for outstanding academic achievement. This reputation has been built up over a long time and is an important factor in attracting the best academic staff and the best students. Maintaining the financial ability to continue to attract and retain the best staff and to provide research and teaching facilities commensurate with our standing as one of the world’s leading universities remains an ongoing challenge.
Professor Steve Young
Senior Pro-Vice-Chancellor
44 University of Cambridge Annual Report 2014
Corporate governance
1. The following statement is provided by the Council to enable readers of the financial statements to obtain a better understanding of the arrangements in the University for the management of its resources and for audit.
2. The University endeavours to conduct its business in accordance with the seven principles identified by the Committee on Standards in Public Life (selflessness, integrity, objectivity, accountability, openness, honesty, and leadership) and within the general principles of the Guidance to Universities which has been provided by the Committee of University Chairmen and its ‘Guide for Members of Governing Bodies of Universities and Colleges in England, Wales and Northern Ireland’. Further information is given at paragraph 9 below.
Under the Statutes, the Governing Body of the University is the Regent House, which comprises the resident senior members of the University and the Colleges, together with the Chancellor, the High Steward, the Deputy High Steward, and the Commissary. Subject to the Regent House, the Council of the University is the principal executive and policy-making body of the University, with general responsibility for the administration of the University, for the planning of its work, and for the management of its resources. The membership of the Council includes four external members, one of whom chairs the Audit Committee (see paragraph 7 below). The Statutes provide for the appointment of a Deputy Chairman of the Council, normally one of the external members, to take the chair as necessary or when it would be inappropriate for the Vice-Chancellor to do so, in particular in relation to the Vice-Chancellor’s own accountability. The General Board of the Faculties is responsible, subject to the Regent House and to the responsibilities of the Council, for the academic and educational policy of the University.
3. The University is an exempt charity and is subject to regulation by the Higher Education Funding Council for England. The members of the University Council are the charity trustees and are responsible for ensuring compliance with charity law.
4. The Council is advised in carrying out its duties by a number of Committees, including the Planning and Resources Committee, the Finance Committee, the Audit Committee, the Remuneration Committee, the Investment Board, and the Risk Steering Committee. The Planning and Resources Committee is a joint committee of the Council and the General Board. Its responsibilities include the development and oversight of the University’s Strategic Plan, and the preparation of the University’s budget. The Finance Committee is chaired by the Vice-Chancellor and advises the Council on the management of the University’s assets, including real property, monies, and securities, and on the care and maintenance of all University sites and buildings. The Audit Committee, which has a majority of external members, governs the work of the Internal and External Auditors, reporting on these matters directly to the Council. The Remuneration Committee is chaired by an external member of the Council and advises the Council on the remuneration of senior staff in the University. The Investment Board, which has a majority of external members, advises the Council on the management of the University’s investment assets. The Risk Steering Committee is responsible to the Council for the identification of the major corporate risks and their management.
Reports and Financial Statements 45
5. Under the terms of the Financial Memorandum between the University and the Higher Education Funding Council for England, the Vice-Chancellor is the Accountable Officer of the University.
6. Under the Statutes, it is the duty of the Council to exercise general supervision over the finances of all institutions in the University other than the University Press (which is governed by the Council and the Press Syndicate through separate statutory arrangements); to keep under review the University’s financial position and to make a report thereon to the University at least once in each year; to recommend bankers for appointment by the Regent House; and to prepare and publish the annual accounts of the University in accordance with UK-applicable accounting standards such that the accounts give a true and fair view of the state of affairs of the University.
7. It is the duty of the Audit Committee to keep under review the effectiveness of the University’s internal systems of financial and other controls; to advise the Council on the appointment of external and internal auditors; to consider reports submitted by the auditors, both external and internal; to monitor the implementation of recommendations made by the internal auditors; to satisfy themselves that satisfactory arrangements are adopted throughout the University for promoting economy, efficiency, and effectiveness; to establish appropriate performance measures and to monitor the effectiveness of external and internal audit; to make an annual report to the Council, the Vice-Chancellor, and the Higher Education Funding Council for England; to receive reports from the National Audit Office and the Higher Education Funding Council for England. Membership of the Audit Committee includes as a majority five external members (including the chair of the Committee), appointed by the Council with regard to their professional expertise and experience in comparable roles in corporate life.
8. There are Registers of Interests of Members of the Council, the General Board, the Finance Committee and the Audit Committee, and of the senior administrative officers. Declarations of interest are made systematically at meetings.
9. The University is a self-governing community whose members act in accordance with the seven principles of public life (see paragraph 2 above) and in pursuit of the objectives and purposes of the University as set out in its Statutes. The University complies with most but not all of the voluntary Governance Code of Practice published in March 2009 by the Committee of University Chairmen. In particular the Vice-Chancellor is chair of the Council, which does not have a majority of external members, and the Council is subject to the statutory authority of the Regent House. The University has no immediate plans to change these arrangements, which have proved reliable over many years in enabling the University to achieve its academic objectives.
Corporate Governance
46 University of Cambridge Annual Report 2014
The Chancellor, external members, student members, Professor Lethbridge, Professor Yates, The Reverend Caddick and Mr Du Quesnay are not employees of the University. Professor Thomas was an employee of the University until 31 December 2014. Professor Lethbridge was an employee of the Gates Cambridge Trust, a subsidiary undertaking. The other members of the Council are employees of the University. No member of the Council receives payment for serving as a member of the Council.
Members of the Council and the charity trustees during the year ended 31 July 2014
The Chancellor Lord Sainsbury of Turville
The Vice-Chancellor Professor Sir Leszek Borysiewicz
Heads of CollegesProfessor Ian WhiteProfessor David YatesProfessor Francis KellyProfessor Dame Jean Thomas (from 8 November 2013)Professor Robert Lethbridge (to 30 September 2013)
Professors or ReadersProfessor Fiona KaretProfessor Dame Athene DonaldProfessor Nicholas GayProfessor Andrew Hopper
Members of the Regent HouseThe Reverend Jeremy CaddickDr Rebecca LingwoodDr David GoodDr Rachael PadmanDr Nick BamposDr Stephen CowleyMr Ian Du QuesnayDr Susan Oosthuizen
Student MembersMr Richard JonesMs Rosalyn Old (to 30 June 2014)Ms Flick Osborn (to 30 June 2014)Ms Evianne van Gijn (from 1 July 2014)Ms Helen Hoogewerf McComb (from 1 July 2014)
External MembersMr Mark LewisohnDame Mavis McDonald (Deputy Chair)Professor Dame Shirley PearceMr John Shakeshaft
Reports and Financial Statements 47
Statement of Public Benefit
The University is an exempt charity subject to regulation by the HEFCE under the Charities Act 2006. The University reports annually on the ways in which it has delivered charitable purposes for the public benefit.
The Council, in reviewing the University’s activities in this regard, has taken into account the Charity Commission’s guidance on public benefit. The Council is satisfied that the activities of the University as described in these Reports and Financial Statements, and in the Annual Report of the Council, fully meet the public benefit requirements.
The Mission of the University
The Mission of the University is ‘to contribute to society through the pursuit of education, learning and research at the highest international levels of excellence’. The University makes a significant contribution, through these activities, directly and most obviously to the advancement of education, research and dissemination of knowledge.
Research
The University is widely recognised as one of the leading research universities in the world both in terms of quality and in terms of scope and breadth. Research is undertaken at the highest level across a wide range of areas. The University takes seriously its obligations to disseminate and make publicly accessible the outcomes of its academic research activities through publication, teaching, conferences, consultancy and other knowledge transfer and outreach activities. It therefore offers public benefit through the continued advancement of knowledge across the sciences, medicine, arts, humanities, culture and heritage.
A substantial proportion of the research undertaken in the University across the fields of clinical medicine, biomedicine, physics of medicine and engineering leads directly to the advancement of health and the saving of lives. Research is also carried out in the area of sustainability, environmental protection and improvement.
Research work in the University is focussed at local, national and international levels. The products of this research have a wide-ranging influence through the advancement of understanding and its application in scientific and technological advances, and through informing public debate on policy. The impact of the University’s research extends to governments, public sector bodies and charities.
Education
The University’s research activities feed directly into its teaching at every level. Around 19,000 students, of whom 12,000 are undergraduates, pursue courses across a wide range of disciplines. The quality of the education (and, as importantly, the educational experience) which the University provides is consistently recognised by the University’s status at or near the top of national and international rankings.

48 University of Cambridge Annual Report 2014
The University is committed to admitting students of the highest intellectual potential, irrespective of social, racial, religious, financial or other considerations. The University ensures that individuals from all backgrounds can benefit from the opportunities afforded by a first-rate education and are not unreasonably excluded from those opportunities by the charging of fees. The University ensures that bursaries are available where necessary and outreach activities are undertaken to improve participation by under-represented groups. Financial support is provided to students from overseas through University funds and by trusts associated with the University. Further information is available at: http://www.admin.cam.ac.uk/univ/cambridgebursary/ and http://www.admin.cam.ac.uk/offices/gradstud/fees/funding/new.html
The University is aware that there are significant variations in the educational opportunities, information and support available to individuals. It therefore invests significant resource and effort into its access and widening participation activities. The University encourages applications from people with disabilities and from mature students.
For the wider community a broad range of lectures, seminars and courses provide the opportunity for members of the wider public to share in the University’s educational provision. The University’s Institute of Continuing Education offers short non-credit courses, residential and summer schools.
The University is committed to equipping those who participate in its educational programmes with the highest quality of teaching and pastoral, infrastructural and academic support. It is fundamental to the University’s mission that its students are personally, academically and professionally equipped to contribute positively to society. In this regard, the quality and depth of their student experience benefits them directly but also benefits the societies to which they will contribute, through their participation in the workforce and as informed and questioning citizens.
The wider applications of the University’s commitment to disseminating knowledge
The University’s publishing house the Cambridge University Press contributes to the University’s commitment to make publicly accessible the outcomes of academic research activities in Cambridge and from across the world by publishing peer-reviewed academic material and other educational publications. Through Cambridge Assessment the University develops and delivers a range of widely used and respected examinations, benefiting the UK and world-wide community by offering internationally recognized qualifications, raising aspirations and transforming lives.
Statement of Public Benefit

Reports and Financial Statements 49
1. The Council is responsible for maintaining a sound system of internal control which supports the achievement of policies, aims, and objectives, while safeguarding the public and other funds and assets for which the Council is responsible, in accordance with the Statutes and Ordinances and the Financial Memorandum with the HEFCE.
2. The system of internal control is designed to manage rather than eliminate the risk of failure to achieve policies, aims, and objectives; it therefore provides reasonable but not absolute assurance of effectiveness.
3. The system of internal control is designed to identify the principal risks to the achievement of policies, aims, and objectives; to evaluate the nature and extent of those risks; and to manage them efficiently, effectively, and economically. This process was in place for the year ended 31 July 2014 and up to the date of approval of the financial statements, and accords with HEFCE guidance.
4. The Council is responsible for reviewing the effectiveness of the system of internal control. The following processes have been established:(a) The Council meets eleven times throughout the year to consider the plans and strategic
direction of the University. (b) The Council receives periodic reports from the Chairman of the Audit Committee
concerning internal control and the minutes of all meetings of the Audit Committee. (c) The Council’s Risk Steering Committee oversees risk management. The Council receives
periodic reports from the Chairman of the Risk Steering Committee and the minutes of all meetings of the Risk Steering Committee.
(d) The Audit Committee receives regular reports from the internal auditors, which include the internal auditors’ independent opinion on the adequacy and effectiveness of the University’s system of internal control and risk management, together with recommendations for improvement. Risk management is a standing item on the Audit Committee agenda.
(e) The University provides information (primarily through web-based resources) to those who own or manage central or School risks.
(f ) A system of indicators has been developed for the University’s key strategic risks. (g) A robust risk prioritization methodology based on risk ranking and cost-benefit analysis
has been established.
The Council’s review of the effectiveness of the system of internal control is informed by the work of the internal auditors, Deloitte LLP.
5. The Council’s review of the effectiveness of the system of internal control is also informed by the work of the senior officers and the risk owners within the University, who have responsibility for the development and maintenance of the internal control framework, and by comments made by the external auditors in their management letter and other reports.
Statement of internal control

50 University of Cambridge Annual Report 2014
Under the University’s Statutes and Ordinances it is the duty of the Council to prepare and to publish the annual accounts of the University in accordance with UK applicable accounting standards such that the accounts give a true and fair view of the state of affairs of the University.
The Council is responsible for keeping proper accounting records which disclose with reasonable accuracy at any time the financial position of the University.
In preparing the financial statements the Council is required to:(a) select suitable accounting policies and then apply them consistently;(b) make judgements and estimates that are reasonable and prudent;(c) state whether applicable accounting standards have been followed;(d) prepare the financial statements on a going concern basis unless it is inappropriate to
presume that the University will continue to operate;(e) ensure that income has been applied in accordance with the University’s Statutes and
Ordinances, and its Financial Memorandum with the HEFCE and the funding agreement with the National College for Teaching and Leadership; and
(f ) safeguard the assets of the University and take reasonable steps to prevent and detect fraud and other irregularities.
Statement of the responsibilities of the Council
Reports and Financial Statements 51
Report on the financial statementsOur opinion In our opinion, the financial statements, defined below:• give a true and fair view of the state of the group’s and of the University’s affairs as at 31 July
2014 and of the group’s income and expenditure, recognised gains and losses and cash flows for the year then ended;
• have been properly prepared in accordance with United Kingdom Generally Accepted Accounting Practice; and
• have been properly prepared in accordance with the Statement of Recommended Practice – Accounting for Further and Higher Education.
This opinion is to be read in the context of what we say in the remainder of this report.
What we have audited The group financial statements and University financial statements (the “financial statements”), which are prepared by the University of Cambridge, comprise:• the group and University Balance Sheets as at 31 July 2014;• the consolidated income and expenditure account for the year then ended;• the note of consolidated historical cost result for the year then ended;• the consolidated statement of total recognised gains and losses for the year then ended;• the consolidated cash flow statement for the year then ended; • the statement of principal accounting policies; and• the notes to the financial statements, which include other explanatory information.
The financial reporting framework that has been applied in their preparation is the Statement of Recommended Practice for Further and Higher Education, incorporating United Kingdom Generally Accepted Accounting Practice.
In applying the financial reporting framework, the Council has made a number of subjective judgements, for example in respect of significant accounting estimates. In making such estimates, it has made assumptions and considered future events.
What an audit of financial statements involves We conducted our audit in accordance with International Standards on Auditing (UK and Ireland) (“ISAs (UK & Ireland)”). An audit involves obtaining evidence about the amounts and disclosures in the financial statements sufficient to give reasonable assurance that the financial statements are free from material misstatement, whether caused by fraud or error. This includes an assessment of:
• whether the accounting policies are appropriate to the group and University’s circumstances and have been consistently applied and adequately disclosed;
• the reasonableness of significant accounting estimates made by the Council; and • the overall presentation of the financial statements.
In addition, we read all the financial and non-financial information in the Annual Report of the Council, the Annual Report of the General Board to the Council and the Reports on pages 33 to 50 to identify material inconsistencies with the audited financial statements and to identify any information that is apparently materially incorrect based on, or materially inconsistent with, the knowledge acquired by us in the course of performing the audit. If we become aware of any apparent material misstatements or inconsistencies we consider the implications for our report.
Independent auditors’ report to the Council of the University of Cambridge (the “University”)

52 University of Cambridge Annual Report 2014
Opinions on other matters prescribed in the HEFCE Audit Code of Practices issued under the Further and Higher Education Act 1992In our opinion, in all material respects:• funds from whatever source administered by the University for specific purposes have been
properly applied to those purposes and, if relevant, managed in accordance with relevant legislation;
• income has been applied in accordance with the Statutes and Ordinances of the University; and
• funds provided by HEFCE have been applied in accordance with the Financial Memorandum and any other terms and conditions attached to them.
Other matters on which we are required to report by exceptionUnder the HEFCE Audit Code of Practice issued under the Further and Higher Education Act 1992 we are required to report to you if, in our opinion the statement of internal control is inconsistent with our knowledge of the University and group. We have no exceptions to report from this responsibility.
Responsibilities for the financial statements and the auditRespective responsibilities of the Council and auditorsAs explained more fully in the Statement of Responsibilities of the Council set out on page 50 the Council is responsible for the preparation of the financial statements and for being satisfied that they give a true and fair view. Our responsibility is to audit and express an opinion on the financial statements in accordance with applicable law and ISAs (UK & Ireland). Those standards require us to comply with the Auditing Practices Board’s Ethical Standards for Auditors.
This report, including the opinions, has been prepared for and only for the Council as a body in accordance with the Statutes and Ordinances of the University and for no other purpose. We do not, in giving these opinions, accept or assume responsibility for any other purpose or to any other person to whom this report is shown or into whose hands it may come save where expressly agreed by our prior consent in writing.
PricewaterhouseCoopers LLP Chartered Accountants and Statutory Auditors Cambridge 24 November 2014
(a) The maintenance and integrity of the University of Cambridge’s website is the responsibility of the Council; the work carried out by the auditors does not involve consideration of these matters and, accordingly, the auditors accept no responsibility for any changes that may have occurred to the financial statements since they were initially presented on the website.
(b) Legislation in the United Kingdom governing the preparation and dissemination of the financial statements may differ from legislation in other jurisdictions.
Independent auditors’ report
Reports and Financial Statements 53
Statement of Principal Accounting Policies
Basis of preparation
The financial statements have been prepared in accordance with applicable United Kingdom accounting standards and the Statement of Recommended Practice: Accounting for Further and Higher Education 2007 (the SORP).
The income and expenditure account includes captions additional to those specified by the SORP in order to present an appropriate overview for the specific circumstances of the University.
Basis of accounting
The financial statements have been prepared under the historical cost convention, modified in respect of the treatment of investments and certain operational properties which are included at valuation.
Basis of consolidation
The consolidated financial statements include the University and its subsidiary undertakings including the Gates Cambridge Trust and other Associated Trusts. Details of the subsidiary undertakings included are given in note 31. Intra-group transactions and balances are eliminated on consolidation.
The consolidated financial statements do not include the accounts of the 31 Colleges in the University (‘the Colleges’), each of which is an independent corporation. Transactions with the Colleges are disclosed in note 33.
The consolidated financial statements do not include the accounts of Cambridge University Students’ Union or of the Cambridge University Graduate Union, as these are separate bodies in which the University has no financial interest and over whose policy decisions it has no control.
Recognition of income
Recurrent grant Recurrent grant received from the Higher Education Funding Council for England (HEFCE) is recognised as income in the period to which it relates.
Restricted grant income Grants received for restricted purposes, principally from HEFCE and research sponsors, are recognised as income to the extent that relevant expenditure has been incurred.
Charitable donations Charitable donations are recognised on receipt or where there is certainty of future receipt and the value can be measured reliably. The accounting treatment of a donation depends on the nature and extent of restrictions specified by the donor. Donations with no substantial restrictions are recognised as income in the income and expenditure account. Donations which are to be retained

54 University of Cambridge Annual Report 2014
for the future benefit of the University, and other donations with substantially restricted purposes, other than for the acquisition or construction of tangible fixed assets, are recognised in the statement of total recognised gains and losses as new endowments.
Capital grants and donations Grants and donations are received for the purposes of funding the acquisition and construction of tangible fixed assets. In the case of depreciable assets these are credited to deferred capital grants and released to income over the expected useful life of the respective assets in line with the depreciation policy. Grants and donations of, or for the acquisition of, freehold land or heritage assets, which are non-depreciable assets, are credited to income in the year of acquisition.
Academic fees Tuition fees for degree courses are charged to students by academic term. Income is recognised for academic terms falling within the period. For short courses, income is recognised to the extent that the course duration falls within the period.
Examination and assessment services Income from examination-based assessments is recognised when services are rendered and substantially complete. Income from qualifications not based on examination sessions is recognised in proportion to the number of modules achieved by candidates.
Publishing and printing In the case of books and other print publications, income is recognised on delivery of the goods to the customer. Income generated from electronic publishing, including the provision of perpetual access, is recognised when the material is initially made available. Subscriptions income is recognised evenly over subscription periods. Journals income is recognised when the journals are published and shipped.
Other income Income is received from a range of activities including residences, catering, conferences, and other services rendered. Income is recognised on the exchange of the relevant goods or services.
Endowment and investment income All investment income is credited to the income and expenditure account in the period in which it is earned. Income from restricted endowments not expended in the period is transferred from the income and expenditure account to restricted endowments.
Foreign currency translation
Transactions denominated in foreign currencies are recorded at the rate of exchange ruling at the date of the transactions. Where foreign branches and subsidiaries of Cambridge University Press accounting in foreign currencies operate as separate businesses, all their assets and liabilities are translated into sterling at year-end rates and the net effect of currency adjustments is taken directly to reserves. Otherwise, monetary assets and liabilities denominated in foreign currencies are translated into sterling at year-end rates and translation differences are taken to the income and expenditure account.
Statement of Principal Accounting Policies

Reports and Financial Statements 55
Statement of Principal Accounting Policies
Tangible fixed assets
Land and buildings Operational land and buildings are included in the financial statements at their 1994 valuation with subsequent additions at cost. On the adoption of Financial Reporting Standard (FRS) 15 (Tangible fixed assets), the University followed the transitional provision to retain the book value of land and buildings, which had last been revalued on 1 August 1994 on the basis of market value for existing use, but not to adopt a policy of revaluations of these properties in the future.
No depreciation is provided on freehold land or on assets in construction. Freehold buildings are written off on a straight line basis over their estimated useful lives, which are between 15 and 50 years, and leasehold properties are written off over the length of the lease.
Equipment Equipment costing less than £30,000 per individual item is written off in the year of purchase. All other equipment is capitalised and depreciated so that it is written off on a straight line basis over its estimated useful life of between four and ten years.
Heritage assets The University holds and conserves a number of collections, exhibits, artefacts, and other assets of historical, artistic or scientific importance. In accordance with FRS 15 and FRS 30 (Heritage assets), heritage assets acquired before 1 August 1999 have not been capitalised, since reliable estimates of cost or value are not available on a cost-benefit basis. Acquisitions since 1 August 1999 have been capitalised at cost or, in the case of donated assets, at expert valuation on receipt. In line with the accounting policy in respect of equipment, the threshold for capitalising assets is £30,000. Heritage assets are not depreciated since their long economic life and high residual value mean that any depreciation would not be material.
Intangible fixed assets: goodwill
Goodwill arises on consolidation and is based on the fair value of the consideration given for the subsidiary and the fair value of its assets at the date of acquisition. Goodwill is amortised over its estimated economic life of between five and ten years on a straight line basis. Where there is impairment in the carrying value of goodwill, the loss is included in the results of the period.
Investments
Fixed asset investments and endowment assets are included in the balance sheet at market value, except for investments in subsidiary undertakings which are stated in the University’s balance sheet at cost and eliminated on consolidation. Properties held for investment purposes are valued annually on the basis of estimated open market values on an existing use basis by Knight Frank or, in the case of local non-operational properties, by chartered surveyors employed by the University. Marketable securities are valued at midmarket valuation on 31 July. Investments in spin-out companies are valued in accordance with the International Private Equity and Venture Capital Guidelines, and other non-marketable securities are included at valuation by the Council. Current asset investments are included in the balance sheet at the lower of cost and net realisable value.

56 University of Cambridge Annual Report 2014
Statement of Principal Accounting Policies
Stocks and work in progress
Stocks are stated at the lower of cost and net realisable value after making provision for slow moving and obsolete items. In respect of publishing and printing services, (a) direct costs incurred prior to publication are included in stocks and work in progress and are written off over a period of up to three years from the publication date; and (b) the University makes full provision against the cost of stock in excess of one and a half times the most recent year’s sales on all publications dated more than two years before the reporting date.
Bond liabilities
The Bond liabilities are the unsecured Bonds issued by the University in October 2012 and listed on the London Stock Exchange. The Bonds were initially measured at the proceeds of issue less all transaction costs directly attributable to the issue. After initial recognition, the Bonds are measured at amortised cost using the effective interest rate method.
Endowment funds
Endowment funds are classified under three headings: • Where the donor has specified that the fund is to be permanently invested to generate
an income stream for the general purposes of the University, the fund is classified as an unrestricted permanent endowment.
• Where the donor has specified that the fund is to be permanently invested to generate an income stream to be applied for a restricted purpose, the fund is classified as a restricted permanent endowment.
• Where the donor has specified a particular objective other than the acquisition or construction of tangible fixed assets, and that the University must or may convert the donated sum into income, the fund is classified as a restricted expendable endowment.
Pension costs
The University contributes to a number of defined benefit pension schemes and accounts for the costs in relation to these schemes in accordance with FRS 17 (Retirement benefits).
Where the University is unable to identify its share of the underlying assets and liabilities in a scheme on a reasonable and consistent basis, it accounts as if the scheme were a defined contribution scheme, so that the cost is equal to the total of contributions payable in the year.
For other defined benefit schemes, the assets of each scheme are measured at fair value, and the liabilities are measured on an actuarial basis using the projected unit method and discounted at an appropriate rate of return. The University’s share of the surplus or deficit of the scheme is recognised as an asset or liability on the balance sheet. The current service cost, being the actuarially determined present value of the pension benefits earned by employees in the current period, and the past service cost are included within staff costs. Endowment and investment income includes the net of the expected return on assets, being the actuarial forecast of total

Reports and Financial Statements 57
Statement of Principal Accounting Policies
return on the assets of the scheme, and the interest cost being the notional interest cost arising from unwinding the discount on the scheme liabilities. All changes in the pension surplus or deficit due to changes in actuarial assumptions or differences between actuarial forecasts and the actual out-turn are reported in the statement of total recognised gains and losses.
Segmental reporting
The University operates in a number of different classes of business. For the purpose of segmental reporting as required by Statement of Standard Accounting Practice 25 (Segmental reporting), classes of business have been identified by reference to the nature of activity, the nature of funding and the management organisation.

58 University of Cambridge Annual Report 2014
Consolidated income and expenditure account for the year ended 31 July 2014
Year ended31 July 2014
Year ended31 July 2013
Note £m £mIncome
Funding body grants 1 179 184 Academic fees and support grants 2 207 182 Research grants and contracts 3 371 332 Examination and assessment services 4 341 317 Publishing services 258 263 Other income 5 123 140 Endowment and investment income 6 25 20
Total income 1,504 1,438
ExpenditureStaff costs 7 650 605 Other operating expenses 8 756 714 Depreciation 8 88 77 Interest and other finance costs 8 16 19
Total expenditure 8 1,510 1,415
(Deficit) / surplus on continuing operations (6) 23 Transfer from restricted endowments 23 50 50
Surplus for the year retained in general reserves 24 44 73
The income and expenditure account is in respect of continuing activities.

Reports and Financial Statements 59
Note of consolidated historical cost result for the year ended 31 July 2014
Year ended Year ended 31 July 2014 31 July 2013
£m £m
Total income on a distribution basis 1,570 1,499
Surplus for the year retained in general reserves on a distribution basis 74 99
Year ended 31 July 2014
Year ended31 July 2013
Note £m £m
(Deficit) / surplus on continuing operations (6) 23 Realisation of gains on disposal of fixed asset investments 24 72 37 Depreciation on revaluation element of tangible fixed assets 24 6 6
Historical cost surplus for the year 72 66
Additional information:
Total income and surplus on continuing operations as stated above do not include the element of Cambridge University Endowment Fund distributions funded out of long-term capital growth, as described in note 6, amounting to £66m (2013: £61m). The surplus retained in general reserves does not include the proportion of this element relating to reserves, amounting to £30m (2013: £26m). The corresponding figures including these elements are:
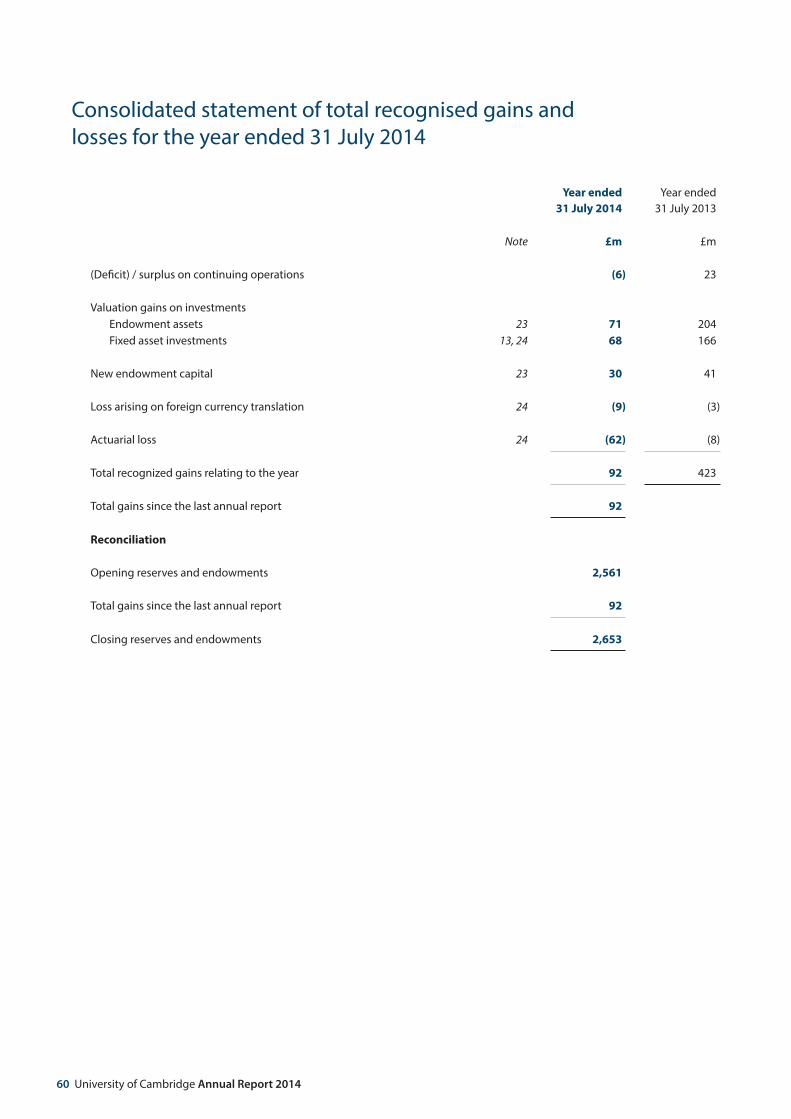
60 University of Cambridge Annual Report 2014
Year ended31 July 2014
Year ended31 July 2013
Note £m £m
(Deficit) / surplus on continuing operations (6) 23
Valuation gains on investmentsEndowment assets 23 71 204 Fixed asset investments 13, 24 68 166
New endowment capital 23 30 41
Loss arising on foreign currency translation 24 (9) (3)
Actuarial loss 24 (62) (8)
Total recognized gains relating to the year 92 423
Total gains since the last annual report 92
Reconciliation
Opening reserves and endowments 2,561
Total gains since the last annual report 92
Closing reserves and endowments 2,653
Consolidated statement of total recognised gains and losses for the year ended 31 July 2014

Reports and Financial Statements 61
Balance sheets as at 31 July 2014
Group31 July 2014
Group University31 July 2014
University31 July 2013 31 July 2013
Note £m £m £m £m Fixed assets
Intangible assets 11 4 6 2 3 Tangible assets 12 1,272 1,194 1,272 1,193 Investments 13 1,200 1,100 1,017 892
2,476 2,300 2,291 2,088
Endowment assets 14 1,303 1,252 1,082 1,039
Current assetsStocks and work in progress 15 54 60 47 50 Debtors 16 296 273 310 302 Investments
University 17 308 374 270 305 Held on behalf of others 17 105 78 547 566
Cash at bank and in hand 50 61 27 37
813 846 1,201 1,260
Creditors: amounts falling due within one year 18 (631) (588) (1,041) (1,002)
Net current assets 182 258 160 258
Total assets less current liabilities 3,961 3,810 3,533 3,385
Creditors: amounts falling due after more than one year 19 (346) (348) (345) (346)Pension liabilities 20 (417) (364) (79) (72)Other retirement benefits liability 21 (21) (24) (21) (24)
Total net assets 3,177 3,074 3,088 2,943
Represented by:
Deferred capital grants 22 523 511 523 511
EndowmentsExpendable endowments 23 442 430 225 218 Permanent endowments 23 861 822 857 821
23 1,303 1,252 1,082 1,039
ReservesGeneral reserves 24 974 922 1,156 1,066 Operational property revaluation reserve 24 115 121 115 121 Fixed asset investment revaluation reserve 24 261 266 212 206
24 1,350 1,309 1,483 1,393
Reserves and endowments 2,653 2,561 2,565 2,432
Minority interest in subsidiary undertakings 1 2 - -
Total 3,177 3,074 3,088 2,943
The financial statements on pages 53-102 were approved by the Council on 24 November 2014 and signed on its behalf by:
Professor Sir Leszek Borysiewicz Vice-Chancellor
Dame Mavis McDonald Member of Council
Andrew ReidDirector of Finance
62 University of Cambridge Annual Report 2014
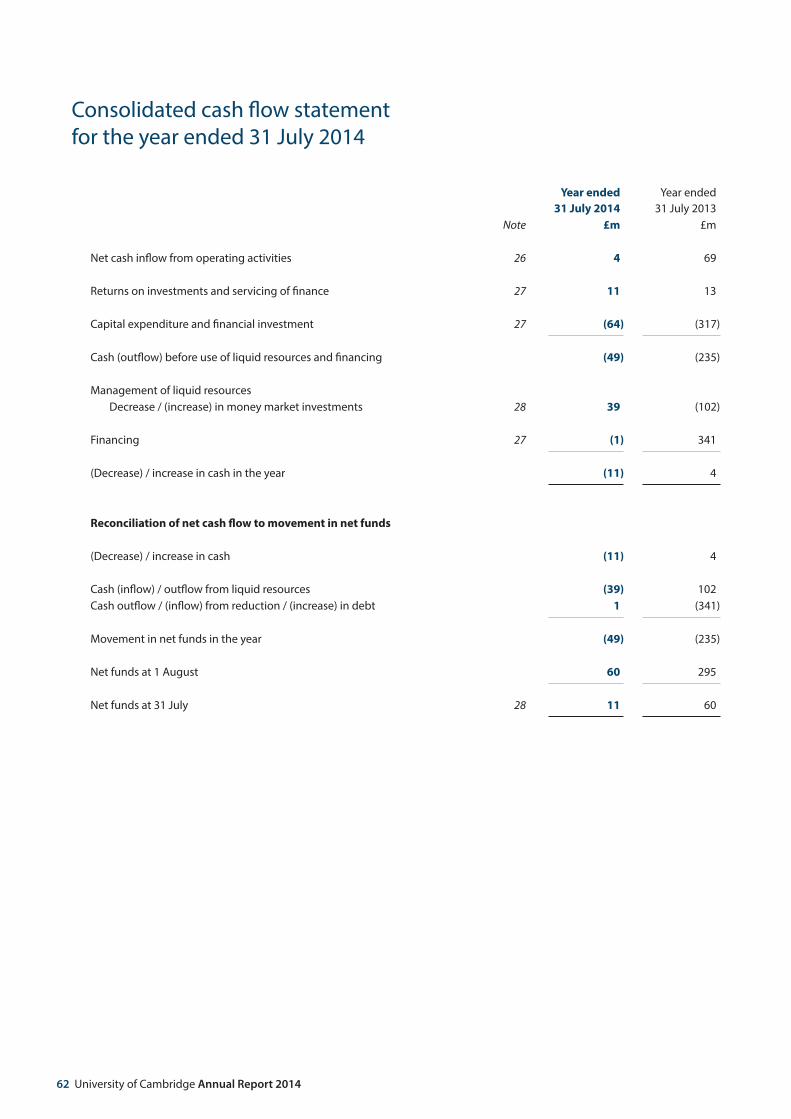
Consolidated cash flow statement for the year ended 31 July 2014
Year ended31 July 2014
Year ended31 July 2013
Note £m £m
Net cash inflow from operating activities 26 4 69
Returns on investments and servicing of finance 27 11 13
Capital expenditure and financial investment 27 (64) (317)
Cash (outflow) before use of liquid resources and financing (49) (235)
Management of liquid resourcesDecrease / (increase) in money market investments 28 39 (102)
Financing 27 (1) 341
(Decrease) / increase in cash in the year (11) 4
Reconciliation of net cash flow to movement in net funds
(Decrease) / increase in cash (11) 4
Cash (inflow) / outflow from liquid resources (39) 102 Cash outflow / (inflow) from reduction / (increase) in debt 1 (341)
Movement in net funds in the year (49) (235)
Net funds at 1 August 60 295
Net funds at 31 July 28 11 60

Reports and Financial Statements 63
Notes to the accounts
2014 2013£m £m
Higher Education Funding Council for England (HEFCE)Recurrent grant 158.8 167.4 Specific grants 3.9 1.8 Deferred capital grant released in year (see note 22)
Equipment 13.8 12.2 Buildings 2.1 2.3
HEFCE total 178.6 183.7 National College for Teaching and Leadership: recurrent grant – 0.1
178.6 183.8
2 Academic fees and support grantsFull-time home / EU students 88.2 72.6 Full-time overseas (non-EU) students 70.2 62.9 Other course fees 22.4 20.8 Research Training Support Grants 26.7 26.4
207.5 182.7
3 Income: research grants and contractsResearch councils 119.4 105.7 UK-based charities 112.8 104.5 Other bodies 139.0 121.6
371.2 331.8
Total research grants and contracts income excludes grants of £18.1m (2013: £12.8m) for the purchase of equipment but includes £13.8m (2013: £11.1m) released from deferred capital grants to match depreciation of which £10.2m (2013: £7.6m) related to equipment. See note 22.
4 Examination and assessment servicesExamination fees 306.8 290.3 Other examination and assessment services 34.4 26.5
341.2 316.8
1 Funding body grants
64 University of Cambridge Annual Report 2014
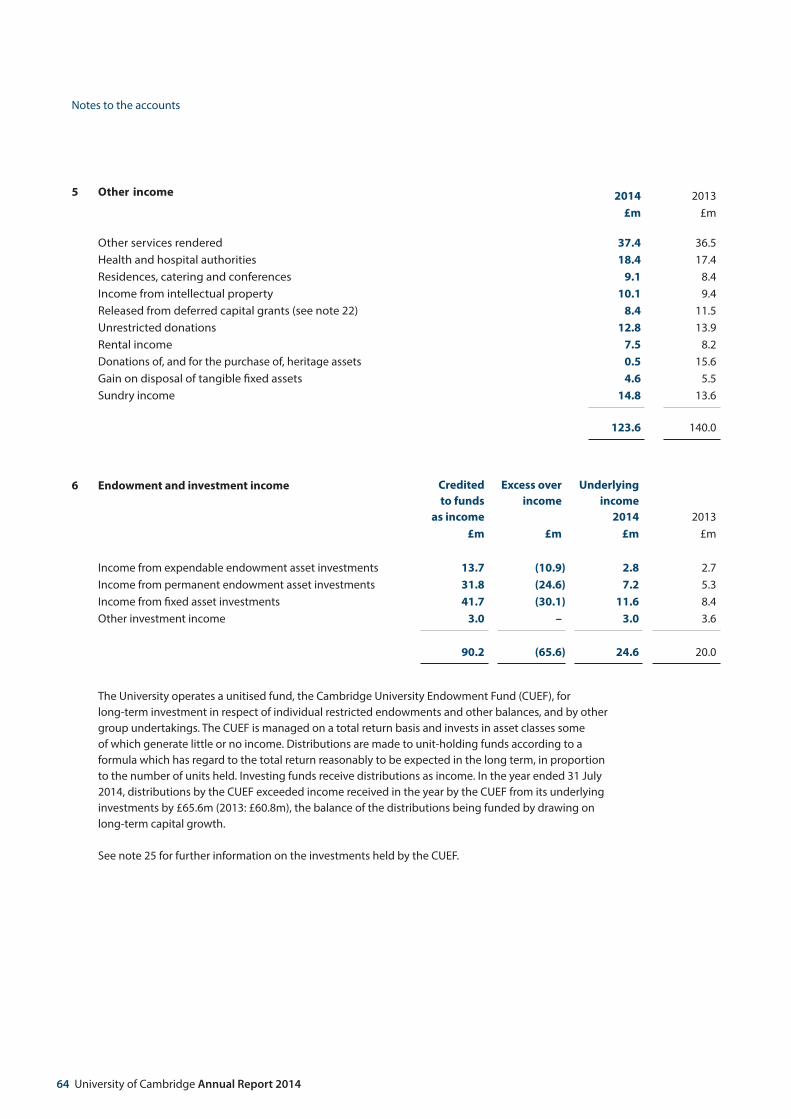
2014 2013£m £m
Other services rendered 37.4 36.5 Health and hospital authorities 18.4 17.4 Residences, catering and conferences 9.1 8.4 Income from intellectual property 10.1 9.4 Released from deferred capital grants (see note 22) 8.4 11.5 Unrestricted donations 12.8 13.9 Rental income 7.5 8.2 Donations of, and for the purchase of, heritage assets 0.5 15.6 Gain on disposal of tangible fixed assets 4.6 5.5 Sundry income 14.8 13.6
123.6 140.0
Credited to funds
as income
Excess over income
Underlyingincome
2014 2013£m £m £m £m
Income from expendable endowment asset investments 13.7 (10.9) 2.8 2.7 Income from permanent endowment asset investments 31.8 (24.6) 7.2 5.3 Income from fixed asset investments 41.7 (30.1) 11.6 8.4 Other investment income 3.0 – 3.0 3.6
90.2 (65.6) 24.6 20.0
The University operates a unitised fund, the Cambridge University Endowment Fund (CUEF), for long-term investment in respect of individual restricted endowments and other balances, and by other group undertakings. The CUEF is managed on a total return basis and invests in asset classes some of which generate little or no income. Distributions are made to unit-holding funds according to a formula which has regard to the total return reasonably to be expected in the long term, in proportion to the number of units held. Investing funds receive distributions as income. In the year ended 31 July 2014, distributions by the CUEF exceeded income received in the year by the CUEF from its underlying investments by £65.6m (2013: £60.8m), the balance of the distributions being funded by drawing on long-term capital growth. See note 25 for further information on the investments held by the CUEF.
5 Other income
6 Endowment and investment income
Notes to the accounts

Reports and Financial Statements 65
Notes to the accounts
7 Staff costs 2014 2013£m £m
Wages and salaries 506.2 469.4 Social security costs 45.8 42.4 Pension costs (see note 30) 98.2 93.1
650.2 604.9
Remuneration of the Vice-Chancellor 2014 2013 £000 £000
Salary 288 282 Benefits in kind 10 7
Total excluding employer pension contributions 298 289 Employer pension contributions 46 45
344 334
66 University of Cambridge Annual Report 2014
Notes to the accounts
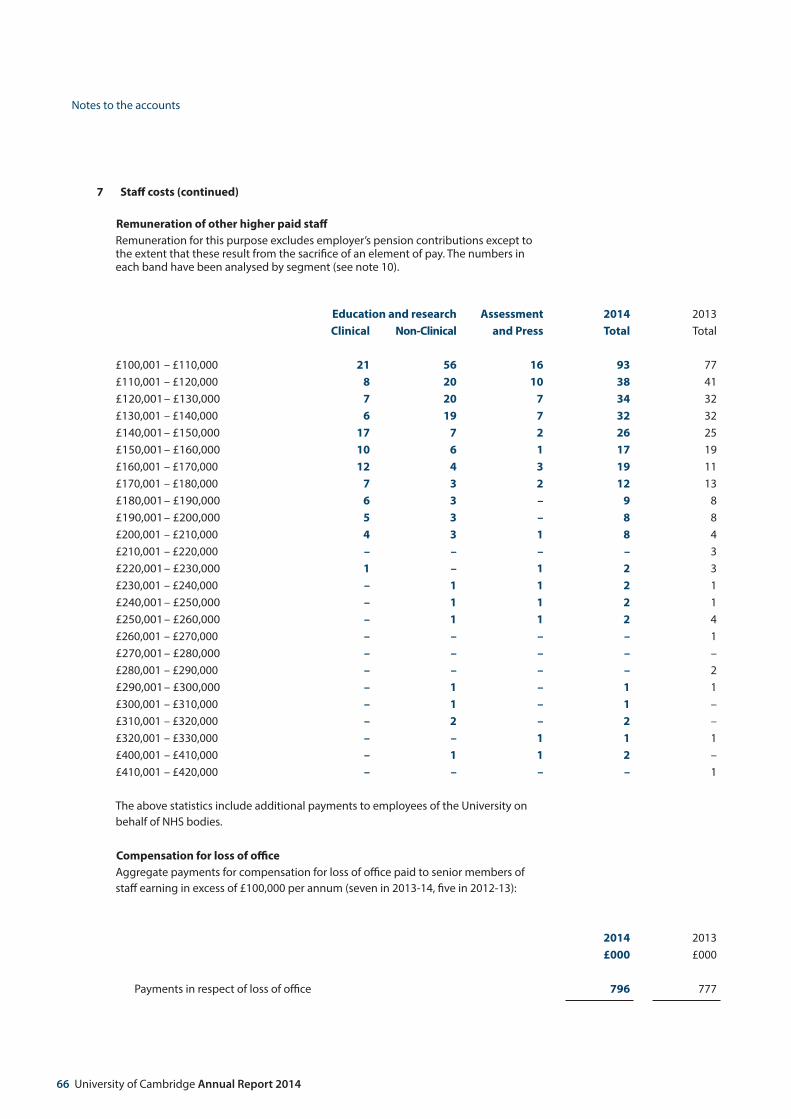
7 Staff costs (continued)
Remuneration of other higher paid staffRemuneration for this purpose excludes employer’s pension contributions except to the extent that these result from the sacrifice of an element of pay. The numbers in each band have been analysed by segment (see note 10).
Education and research Assessment 2014 2013Clinical Non-Clinical and Press Total Total
£100,001 – £110,000 21 56 16 93 77 £110,001 – £120,000 8 20 10 38 41 £120,001– £130,000 7 20 7 34 32 £130,001 – £140,000 6 19 7 32 32 £140,001– £150,000 17 7 2 26 25 £150,001– £160,000 10 6 1 17 19 £160,001 – £170,000 12 4 3 19 11 £170,001 – £180,000 7 3 2 12 13 £180,001– £190,000 6 3 – 9 8 £190,001– £200,000 5 3 – 8 8 £200,001 – £210,000 4 3 1 8 4 £210,001 – £220,000 – – – – 3 £220,001 – £230,000 1 – 1 2 3 £230,001 – £240,000 – 1 1 2 1 £240,001– £250,000 – 1 1 2 1 £250,001– £260,000 – 1 1 2 4 £260,001 – £270,000 – – – – 1 £270,001– £280,000 – – – – –£280,001 – £290,000 – – – – 2 £290,001– £300,000 – 1 – 1 1 £300,001 – £310,000 – 1 – 1 –£310,001 – £320,000 – 2 – 2 –£320,001 – £330,000 – – 1 1 1 £400,001 – £410,000 – 1 1 2 – £410,001 – £420,000 – – – – 1
The above statistics include additional payments to employees of the University on behalf of NHS bodies.
Compensation for loss of office Aggregate payments for compensation for loss of office paid to senior members of staff earning in excess of £100,000 per annum (seven in 2013-14, five in 2012-13):
2014 2013£000 £000
Payments in respect of loss of office 796 777

Reports and Financial Statements 67
Notes to the accounts
8 Analysis of expenditure by activity
Staff costs
Otheroperatingexpenses
Depreciation Interest payable
2014Total
2013
£m £m £m £m £m £m
Academic departments 214.1 59.6 7.8 – 281.5 263.6 Academic services 26.2 16.1 0.8 – 43.1 41.4 Payments to Colleges (see note 33) – 44.9 – – 44.9 43.3 Research grants and contracts 164.5 139.4 13.8 – 317.7 282.6
Other activitiesExamination and assessment services 91.5 187.2 16.7 – 295.4 271.5 Publishing and printing services 82.7 168.0 6.8 1.4 258.9 258.9 Other services rendered 8.6 24.6 – – 33.2 31.4 Intellectual property 2.6 4.6 – – 7.2 5.7 Residences, catering and conferences 2.3 8.8 – – 11.1 10.1
Other activities total 187.7 393.2 23.5 1.4 605.8 577.6
Administration and central servicesAdministration 40.3 2.9 2.9 – 46.1 41.1 General educational 2.4 49.5 0.1 – 52.0 52.5 Staff and student facilities 3.3 1.1 – – 4.4 5.0 Development office 3.8 4.1 – – 7.9 7.3 Other 2.9 2.6 – – 5.5 11.0
Administration and central services total 52.7 60.2 3.0 – 115.9 116.9 Premises 12.9 43.0 39.5 – 95.4 88.9 Interest payable on Bond liabilities – – – 13.1 13.1 10.5 Pension cost adjustments for CPS (see note 30)
(7.9) – – 1.2 (6.7) (9.8)
Total per income and expenditure account 650.2 756.4 88.4 15.7 1,510.7 1,415.0
The depreciation charge has been funded by:Deferred capital grants (see note 22) 38.1 Revaluation reserve (see note 24) 6.0 General income 44.3
88.4

68 University of Cambridge Annual Report 2014
8 Analysis of expenditure by activity (continued)
Other operating expenses include: 2014 2013 £000 £000
Auditors’ remunerationAudit fees payable to the University’s external auditors 688 729 Other fees payable to the University’s external auditors 152 312 Audit fees payable to other firms 80 79
Payments to trusteesReimbursement of expenses to three (2013: three) external members of Council 5 4
These amounts include related irrecoverable VAT.
9 Surplus on reserves 2014 2013
£m £m
The surplus for the year retained in general reserves is made up as follows:University’s surplus for the year 41.7 76.3 Surplus generated by subsidiary undertakings and transferred to the University 8.4 8.9
Surplus dealt with in the accounts of the University 50.1 85.2 Group level adjustments: Contributory Pension Scheme 6.7 9.8 Deficit retained in subsidiary undertakings (13.1) (21.9)
43.7 73.1
Notes to the accounts

Reports and Financial Statements 69
Notes to the accounts
10 Segmental reporting
The Group consisting of the University and its subsidiary undertakings has three principal classes of activity:
Education and researchAssessment Examination and assessment services, carried out by the University of Cambridge Local
Examinations Syndicate and subsidiary undertakings, collectively known as Cambridge Assessment
Press Publishing and printing services, carried out by the Cambridge University Press Syndicate and subsidiary undertakings
Income, result for the year and net assets at the year end are attributable to the three segments as follows:
Segment total
income
Inter- segment
income
Income from third
parties
(Deficit) / surplus
Net assets
£m £m £m £m £m Year ended 31 July 2014Education and research 908.9 20.6 888.3 (55.3) 3,084.8 Assessment 351.0 – 351.0 38.2 400.2 Press 265.1 – 265.1 4.1 30.6
1,525.0 20.6 1,504.4 (13.0) 3,515.6
Unallocated re Contributory Pension Scheme – – – 6.7 (338.5)
Group 1,525.0 20.6 1,504.4 (6.3) 3,177.1
Year ended 31 July 2013Education and research 856.3 17.5 838.8 (38.2) 2,963.8 Assessment 324.2 – 324.2 36.7 356.6 Press 275.2 – 275.2 14.8 44.1
1,455.7 17.5 1,438.2 13.3 3,364.5
Unallocated re Contributory Pension Scheme – – – 9.8 (291.1)
Group 1,455.7 17.5 1,438.2 23.1 3,073.4
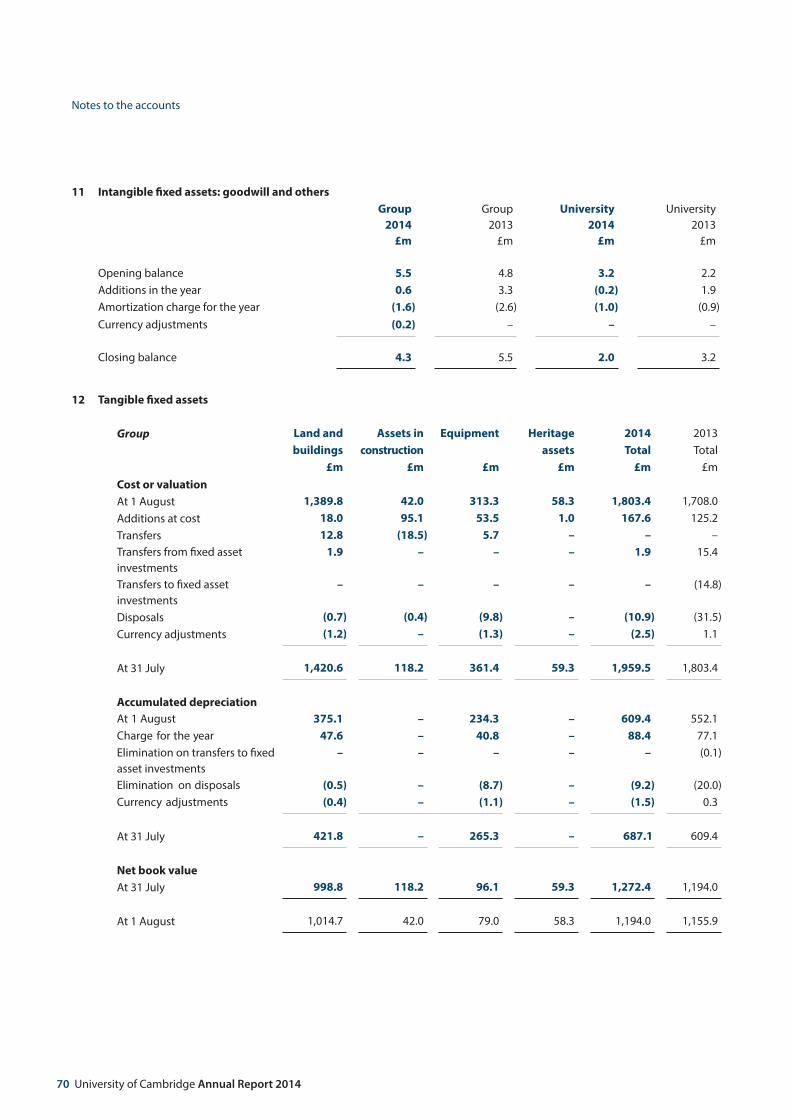
70 University of Cambridge Annual Report 2014
11 Intangible fixed assets: goodwill and othersGroup
2014£m
Group 2013
£m
University 2014
£m
University2013
£m
Opening balance 5.5 4.8 3.2 2.2 Additions in the year 0.6 3.3 (0.2) 1.9 Amortization charge for the year (1.6) (2.6) (1.0) (0.9)Currency adjustments (0.2) – – –
Closing balance 4.3 5.5 2.0 3.2
Notes to the accounts
12 Tangible fixed assets
Group Land and Assets in Equipment Heritage 2014 2013buildings construction assets Total Total
£m £m £m £m £m £m Cost or valuationAt 1 August 1,389.8 42.0 313.3 58.3 1,803.4 1,708.0 Additions at cost 18.0 95.1 53.5 1.0 167.6 125.2 Transfers 12.8 (18.5) 5.7 – – –Transfers from fixed asset investments
1.9 – – – 1.9 15.4
Transfers to fixed asset investments
– – – – – (14.8)
Disposals (0.7) (0.4) (9.8) – (10.9) (31.5)Currency adjustments (1.2) – (1.3) – (2.5) 1.1
At 31 July 1,420.6 118.2 361.4 59.3 1,959.5 1,803.4
Accumulated depreciationAt 1 August 375.1 – 234.3 – 609.4 552.1 Charge for the year 47.6 – 40.8 – 88.4 77.1 Elimination on transfers to fixed asset investments
– – – – – (0.1)
Elimination on disposals (0.5) – (8.7) – (9.2) (20.0)Currency adjustments (0.4) – (1.1) – (1.5) 0.3
At 31 July 421.8 – 265.3 – 687.1 609.4
Net book valueAt 31 July 998.8 118.2 96.1 59.3 1,272.4 1,194.0
At 1 August 1,014.7 42.0 79.0 58.3 1,194.0 1,155.9

Reports and Financial Statements 71
Notes to the accounts
12 Tangible fixed assets (continued)
Land and Assets in Equipment Heritage 2014 2013buildings construction assets Total Total
University £m £m £m £m £m £m
Cost or valuationAt 1 August 1,393.7 42.0 301.2 58.3 1,795.2 1,691.9 Additions at cost 18.0 95.6 52.7 1.0 167.3 124.4 Transfers 13.4 (19.1) 5.7 – – –Transfers from fixed asset investments
1.9 – – – 1.9 15.4
Transfers to fixed asset investments
– – – – – (14.8)
Disposals (0.6) (0.4) (8.3) – (9.3) (22.9)Currency adjustments (1.0) – (0.3) – (1.3) 1.2
At 31 July 1,425.4 118.1 351.0 59.3 1,953.8 1,795.2
Accumulated depreciationAt 1 August 377.5 – 224.6 – 602.1 538.3 Charge for the year 48.0 – 39.7 – 87.7 75.4 Elimination on transfers to fixed asset investments
– – – – – (0.1)
Elimination on disposals (0.4) – (7.4) – (7.8) (11.8)Currency adjustments (0.3) – (0.2) – (0.5) 0.3
At 31 July 424.8 – 256.7 – 681.5 602.1
Net book valueAt 31 July 1,000.6 118.1 94.3 59.3 1,272.3 1,193.1
At 1 August 1,016.2 42.0 76.6 58.3 1,193.1 1,153.6
Land and buildings includes land totalling £87.7m (2013: £84.1m) which is not depreciated.
The cost to the group of freehold buildings and assets in construction consists of the cost incurred by the University less the surplus recorded in the accounts of Lynxvale Limited, a subsidiary undertaking, and eliminated on consolidation.
Heritage assetsThe University holds and conserves certain collections, artefacts and other assets of historical, artistic or scientific importance. Most of these are housed in the University’s nationally accredited museums and collections and in its libraries, providing a valuable research and educational resource locally, nationally and internationally as well as an unrivalled opportunity to present the University’s work to a wide audience. Other collections are held in academic departments or are on display as public art. Major collections include those held by the University Library, a legal deposit, the Botanic Garden and the Fitzwilliam Museum.

72 University of Cambridge Annual Report 2014
Notes to the accounts
12 Tangible fixed assets (continued)
Additions for the current and previous four years were as follows:
2014 2013 2012 2011 2010
£m £m £m £m £m
Acquisitions purchased with specific donations 0.4 4.0 0.9 0.1 1.7 Value of acquisitions by donation 0.1 11.6 4.7 1.2 1.9
Total acquired by, or funded by, donations 0.5 15.6 5.6 1.3 3.6 Acquisitions purchased with University funds 0.5 0.7 0.3 0.1 0.1
Total acquisitions capitalised 1.0 16.3 5.9 1.4 3.7
13 Fixed asset investmentsGroup
2014£m
Group 2013
£m
University 2014
£m
University2013
£m
Opening balance 1,099.7 705.1 892.2 529.9 Net transfers to tangible fixed assets (see note 12) (1.9) (0.7) (1.9) (0.7)Other net additions in the year 34.5 228.9 72.9 236.4 Valuation gains on investments 68.0 166.4 53.6 126.6
Closing balance 1,200.3 1,099.7 1,016.8 892.2
Represented by:CUEF units (see note 25) 1,002.1 918.1 803.7 693.4 Property 100.2 66.1 99.7 66.1 Securities 80.2 100.1 80.2 100.1 Money market investments 0.1 0.1 0.1 0.1 Investments in subsidiary undertakings – – 24.7 25.4 Spin-out and similar companies (see note 31) 16.7 14.3 8.4 7.1 Investments in joint ventures 1.0 1.0 – –
1,200.3 1,099.7 1,016.8 892.2
In respect of its major collections, the University’s practice, in accordance with the national accreditation standards, is: to preserve, conserve and manage the objects in its care; to augment the collections where appropriate and within the resources available; to enable and encourage access to and use of the collections for teaching and research; and to enable wide access to and engagement with the collections by members of the public. As stated in the statement of principal accounting policies, heritage assets acquired since 1 August 1999 have been capitalised. The majority of assets held in the University’s collections were acquired before 1 August 1999; because reliable estimates of cost or valuation are not available for these on a cost-benefit basis they have not been capitalised. As a result the total included in the balance sheet is partial.
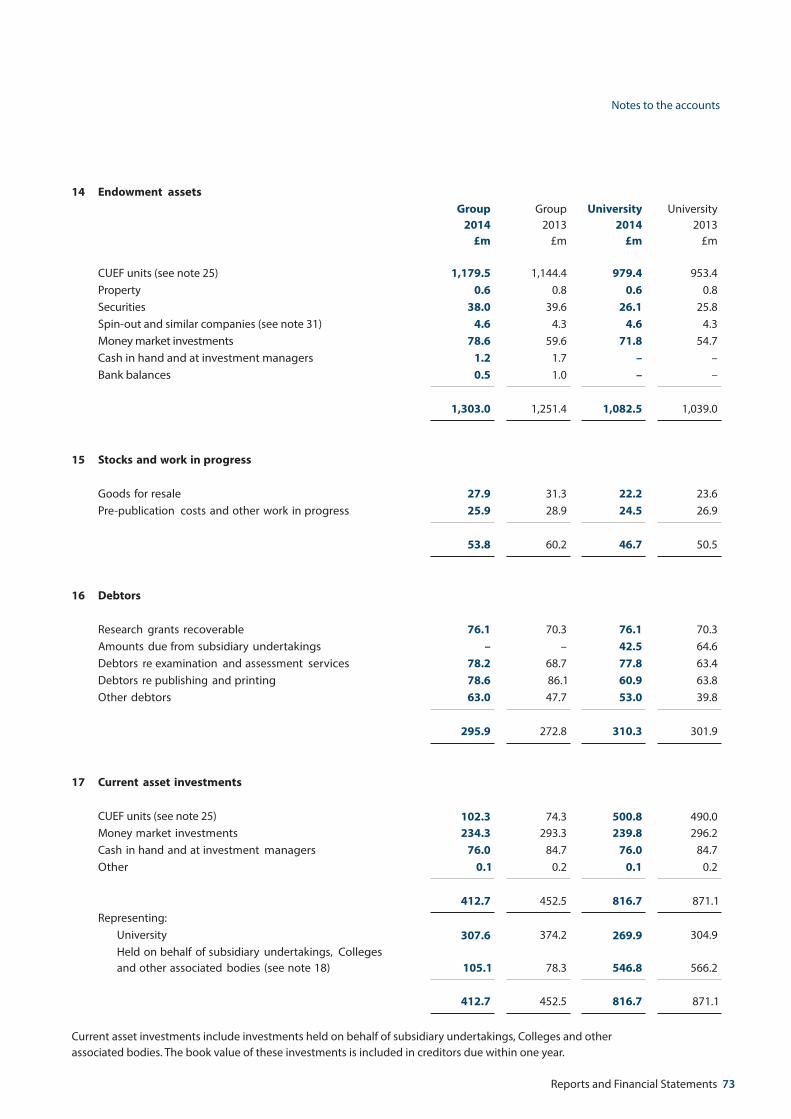
Reports and Financial Statements 73
Notes to the accounts
14 Endowment assetsGroup
2014£m
Group 2013
£m
University 2014
£m
University2013
£m
CUEF units (see note 25) 1,179.5 1,144.4 979.4 953.4 Property 0.6 0.8 0.6 0.8 Securities 38.0 39.6 26.1 25.8 Spin-out and similar companies (see note 31) 4.6 4.3 4.6 4.3 Money market investments 78.6 59.6 71.8 54.7 Cash in hand and at investment managers 1.2 1.7 – –Bank balances 0.5 1.0 – –
1,303.0 1,251.4 1,082.5 1,039.0
15 Stocks and work in progress
Goods for resale 27.9 31.3 22.2 23.6 Pre-publication costs and other work in progress 25.9 28.9 24.5 26.9
53.8 60.2 46.7 50.5
16 Debtors
Research grants recoverable 76.1 70.3 76.1 70.3 Amounts due from subsidiary undertakings – – 42.5 64.6 Debtors re examination and assessment services 78.2 68.7 77.8 63.4 Debtors re publishing and printing 78.6 86.1 60.9 63.8 Other debtors 63.0 47.7 53.0 39.8
295.9 272.8 310.3 301.9
17 Current asset investments
CUEF units (see note 25) 102.3 74.3 500.8 490.0 Money market investments 234.3 293.3 239.8 296.2 Cash in hand and at investment managers 76.0 84.7 76.0 84.7 Other 0.1 0.2 0.1 0.2
412.7 452.5 816.7 871.1 Representing:
University 307.6 374.2 269.9 304.9 Held on behalf of subsidiary undertakings, Colleges and other associated bodies (see note 18) 105.1 78.3 546.8 566.2
412.7 452.5 816.7 871.1
Current asset investments include investments held on behalf of subsidiary undertakings, Colleges and other associated bodies. The book value of these investments is included in creditors due within one year.
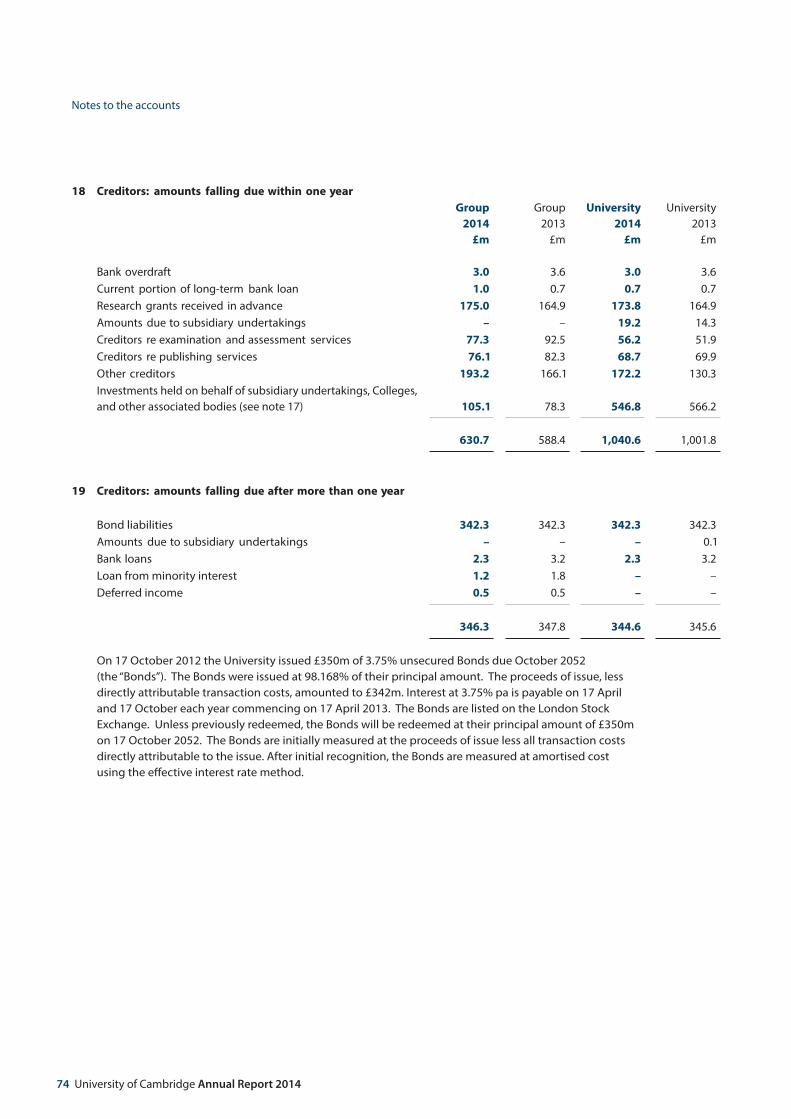
74 University of Cambridge Annual Report 2014
Notes to the accounts
18 Creditors: amounts falling due within one year
Group 2014
£m
Group 2013
£m
University 2014
£m
University2013
£m
Bank overdraft 3.0 3.6 3.0 3.6 Current portion of long-term bank loan 1.0 0.7 0.7 0.7 Research grants received in advance 175.0 164.9 173.8 164.9 Amounts due to subsidiary undertakings – – 19.2 14.3 Creditors re examination and assessment services 77.3 92.5 56.2 51.9 Creditors re publishing services 76.1 82.3 68.7 69.9 Other creditors 193.2 166.1 172.2 130.3 Investments held on behalf of subsidiary undertakings, Colleges, and other associated bodies (see note 17) 105.1 78.3 546.8 566.2
630.7 588.4 1,040.6 1,001.8
19 Creditors: amounts falling due after more than one year
Bond liabilities 342.3 342.3 342.3 342.3 Amounts due to subsidiary undertakings – – – 0.1 Bank loans 2.3 3.2 2.3 3.2 Loan from minority interest 1.2 1.8 – – Deferred income 0.5 0.5 – –
346.3 347.8 344.6 345.6
On 17 October 2012 the University issued £350m of 3.75% unsecured Bonds due October 2052 (the “Bonds”). The Bonds were issued at 98.168% of their principal amount. The proceeds of issue, less directly attributable transaction costs, amounted to £342m. Interest at 3.75% pa is payable on 17 April and 17 October each year commencing on 17 April 2013. The Bonds are listed on the London Stock Exchange. Unless previously redeemed, the Bonds will be redeemed at their principal amount of £350m on 17 October 2052. The Bonds are initially measured at the proceeds of issue less all transaction costs directly attributable to the issue. After initial recognition, the Bonds are measured at amortised cost using the effective interest rate method.

Reports and Financial Statements 75
Notes to the accounts
20 Pension liabilitiesGroup
2014£m
Group 2013
£m
University 2014
£m
University2013
£m
The pension liabilities have been measured in accordance with the requirements of FRS 17.
Opening balance 363.6 369.3 72.5 103.6 Movement in year:
Current service cost including life assurance 22.5 24.2 2.6 2.1 Contributions (35.0) (42.7) (7.2) (6.8)Other finance cost 1.4 6.9 0.2 3.0 Currency adjustments (0.3) 0.2 (0.3) 0.2 Actuarial loss recognized in statement of total recognized gains and losses 65.2 5.7 11.1 (29.6)
Closing balance 417.4 363.6 78.9 72.5
These liabilities relate to the following defined benefit schemes disclosed in note 30:Cambridge University Assistants’ Contributory Pension Scheme (CPS)
338.5 291.1 – –
Cambridge University Press UK defined benefit schemes (PCPF and PSSPS)
76.9 69.6 76.9 69.6
Cambridge University Press US defined benefit plan (DBP) 2.0 2.9 2.0 2.9
417.4 363.6 78.9 72.5
21 Other retirement benefits liability
Group and University 2014£m
2013£m
The liability has been measured in accordance with the requirements of FRS 17 and relates to unfunded post-retirement medical and insurance schemes.
Opening balance 24.2 20.5 Movement attributable to the year:
Current service cost less benefits paid (0.1) 0.3 Contributions (0.3) (0.4)Other finance cost 1.0 1.0 Currency adjustments (0.5) 0.2 Actuarial loss recognized in statement of total recognized gains and losses (3.3) 2.6
Closing balance 21.0 24.2

76 University of Cambridge Annual Report 2014
Notes to the accounts
22 Deferred capital grants FundingCouncil
£m
ResearchGrants
£m
OtherGrants
£m
2014Total
£m
2013
£mGroup and University
Balance 1 AugustBuildings 253.1 62.1 173.5 488.7 482.0 Equipment 3.6 18.4 0.5 22.5 20.0
256.7 80.5 174.0 511.2 502.0 Grants received
Buildings 18.0 0.4 13.8 32.2 30.1 Equipment 0.1 18.1 – 18.2 12.6
18.1 18.5 13.8 50.4 42.7 Released to income and expenditure
Buildings – for depreciation (13.8) (3.6) (8.4) (25.8) (23.4)Equipment – for depreciation (2.1) (10.2) – (12.3) (10.0)Equipment – on disposals (0.1) (0.1) – (0.2) (0.1)
(16.0) (13.9) (8.4) (38.3) (33.5)
Balance 31 JulyBuildings 257.3 58.9 178.9 495.1 488.7 Equipment 1.5 26.2 0.5 28.2 22.5
258.8 85.1 179.4 523.3 511.2
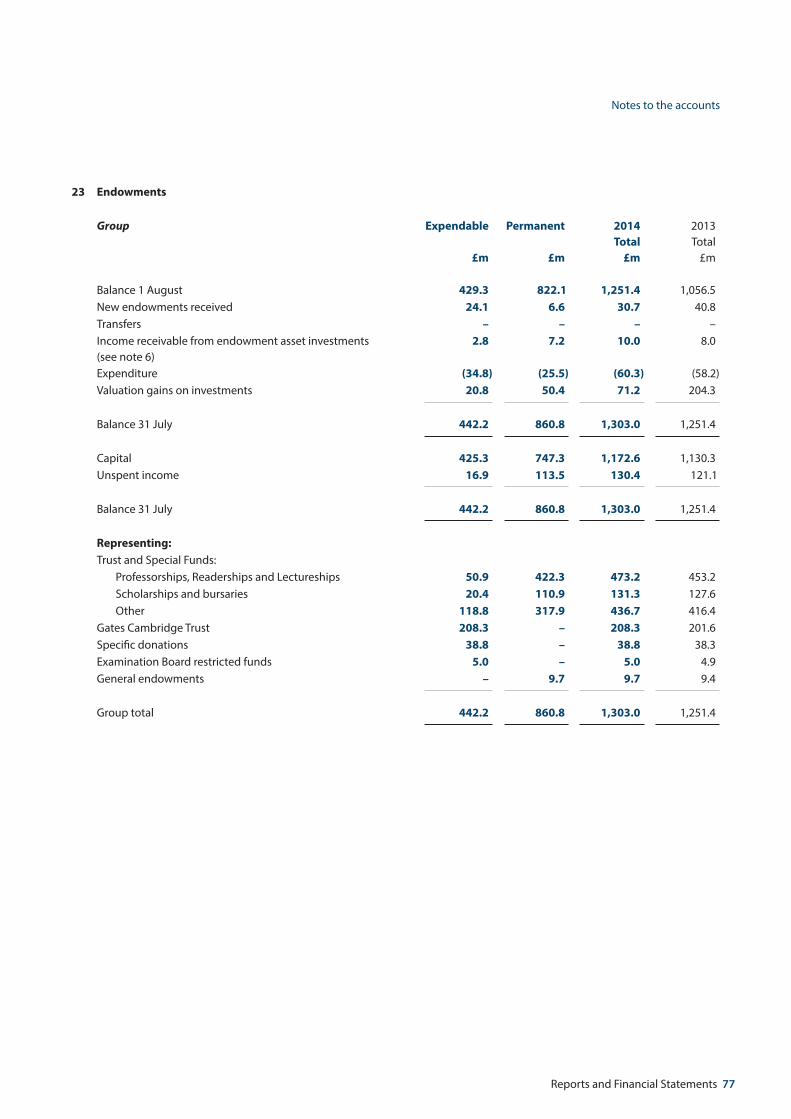
Reports and Financial Statements 77
Notes to the accounts
23 Endowments
Group Expendable
£m
Permanent
£m
2014Total
£m
2013Total
£m
Balance 1 August 429.3 822.1 1,251.4 1,056.5 New endowments received 24.1 6.6 30.7 40.8 Transfers – – – – Income receivable from endowment asset investments (see note 6)
2.8 7.2 10.0 8.0
Expenditure (34.8) (25.5) (60.3) (58.2)Valuation gains on investments 20.8 50.4 71.2 204.3
Balance 31 July 442.2 860.8 1,303.0 1,251.4
Capital 425.3 747.3 1,172.6 1,130.3 Unspent income 16.9 113.5 130.4 121.1
Balance 31 July 442.2 860.8 1,303.0 1,251.4
Representing:Trust and Special Funds:
Professorships, Readerships and Lectureships 50.9 422.3 473.2 453.2 Scholarships and bursaries 20.4 110.9 131.3 127.6 Other 118.8 317.9 436.7 416.4
Gates Cambridge Trust 208.3 – 208.3 201.6 Specific donations 38.8 – 38.8 38.3 Examination Board restricted funds 5.0 – 5.0 4.9 General endowments – 9.7 9.7 9.4
Group total 442.2 860.8 1,303.0 1,251.4

78 University of Cambridge Annual Report 2014
Notes to the accounts
23 Endowments (continued)
Transfer to income and expenditure accountThe transfer from endowments to the income and expenditure account represents the extent to which expenditure has been funded from endowment funds, after deducting the related investment income which is credited separately as part of total income. The transfer is calculated as follows:
Expendable
£m
Permanent
£m
2014Total
£m
2013Total
£m
Expenditure 34.8 25.5 60.3 58.2 Less investment income (2.8) (7.2) (10.0) (8.0)
Transfer to income and expenditure account 32.0 18.3 50.3 50.2
University
Balance 1 August 218.5 820.5 1,039.0 873.3 New endowments received 17.0 4.6 21.6 33.6 Income receivable from endowment asset investments 1.5 7.2 8.7 6.7 Expenditure (20.4) (25.2) (45.6) (43.6)Valuation gains on investments 8.5 50.3 58.8 169.0
Balance 31 July 225.1 857.4 1,082.5 1,039.0
Capital 208.2 743.9 952.1 918.1 Unspent income 16.9 113.5 130.4 120.9
Balance 31 July 225.1 857.4 1,082.5 1,039.0
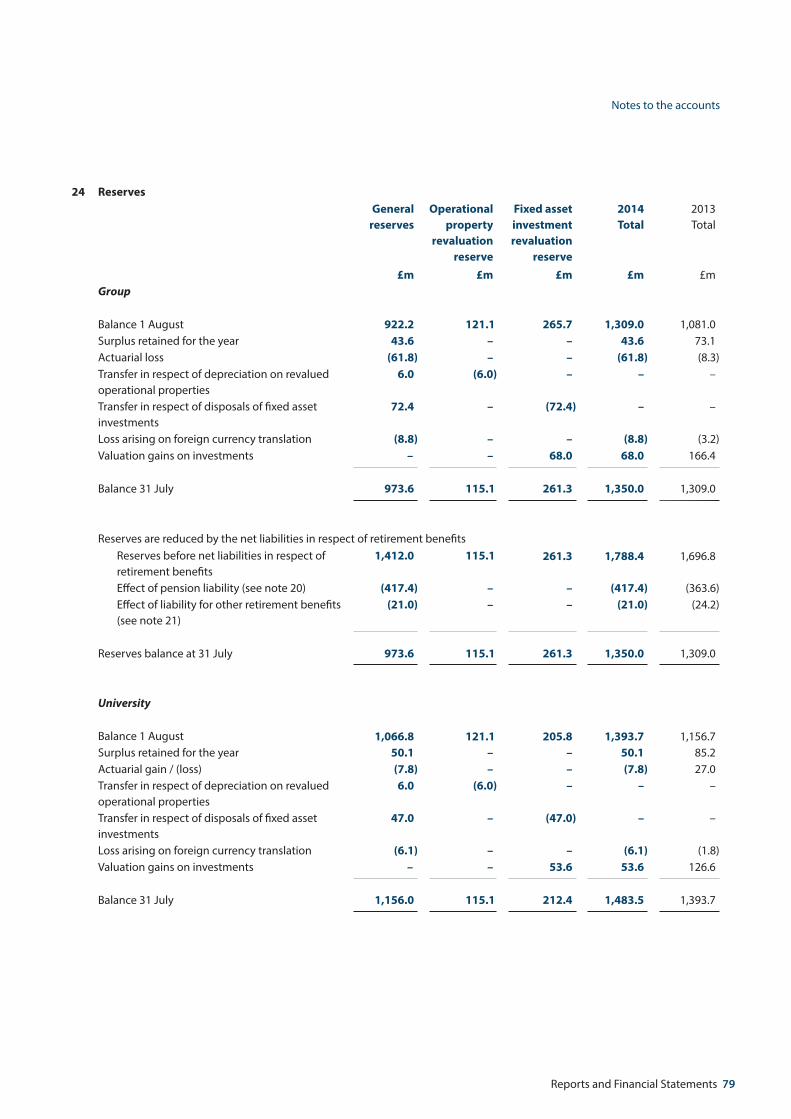
Reports and Financial Statements 79
Notes to the accounts
24 ReservesGeneral
reserves Operational
propertyrevaluation
reserve
Fixed asset investment revaluation
reserve
2014Total
2013Total
£m £m £m £m £mGroup
Balance 1 August 922.2 121.1 265.7 1,309.0 1,081.0 Surplus retained for the year 43.6 – – 43.6 73.1 Actuarial loss (61.8) – – (61.8) (8.3)Transfer in respect of depreciation on revalued operational properties
6.0 (6.0) – – –
Transfer in respect of disposals of fixed asset investments
72.4 – (72.4) – –
Loss arising on foreign currency translation (8.8) – – (8.8) (3.2)Valuation gains on investments – – 68.0 68.0 166.4
Balance 31 July 973.6 115.1 261.3 1,350.0 1,309.0
Reserves are reduced by the net liabilities in respect of retirement benefitsReserves before net liabilities in respect of retirement benefits
1,412.0 115.1 261.3 1,788.4 1,696.8
Effect of pension liability (see note 20) (417.4) – – (417.4) (363.6)Effect of liability for other retirement benefits (see note 21)
(21.0) – – (21.0) (24.2)
Reserves balance at 31 July 973.6 115.1 261.3 1,350.0 1,309.0
University
Balance 1 August 1,066.8 121.1 205.8 1,393.7 1,156.7 Surplus retained for the year 50.1 – – 50.1 85.2 Actuarial gain / (loss) (7.8) – – (7.8) 27.0 Transfer in respect of depreciation on revalued operational properties
6.0 (6.0) – – –
Transfer in respect of disposals of fixed asset investments
47.0 – (47.0) – –
Loss arising on foreign currency translation (6.1) – – (6.1) (1.8)Valuation gains on investments – – 53.6 53.6 126.6
Balance 31 July 1,156.0 115.1 212.4 1,483.5 1,393.7

80 University of Cambridge Annual Report 2014
Notes to the accounts
25 Cambridge University Endowment Fund (CUEF)The University operates a unitized fund, the Cambridge University Endowment Fund (CUEF), for long-term investment in respect of individual restricted endowments and other balances, and by other group undertakings. The assets of the CUEF were held in the following categories:
31 July 2014 31 July 2013£m % £m %
Public equity 1,449.6 63.5 1,280.2 59.9Private investment 206.8 9.1 175.9 8.2Absolute return 269.5 11.8 259.6 12.2Credit 72.9 3.2 66.2 3.1Real assets 195.7 8.6 211.0 9.9Fixed interest / cash 89.4 3.9 143.9 6.7
Total value of fund 2,283.9 100.0 2,136.8 100.0
Public equity includes all equity stocks traded on a liquid market, together with related index funds and derivatives (such as futures).
Private investment includes investments where initial capital commitments are drawn down over a period, and the proceeds of the investments once disposed of are returned over the life of each fund. The underlying investments may include unlisted equities and / or corporate credits (such as bonds, loans and other claims).
Absolute return includes investments in trading strategies which are to some degree independent of overall equity market movements. Funds where different equities are simultaneously held (long) and sold (short) are included in this category.
Credit includes corporate securities (such as bonds and loans) traded on a liquid public market.
Real assets includes investments which are expected to some degree to increase in nominal value to match inflation. This category includes commercial property, and securities which reflect the level of commodity values. Inflation-linked government securities are, however, included in the fixed interest category below.
Fixed interest / cash includes cash at bank and on deposit, government securities, the net value of foreign currency contracts and any amounts receivable in general; less amounts payable, including those arising from holding derivative contracts.
The assets of the CUEF are included in the following balance sheet captions in proportion to the number of units held by the relevant funds:
Group2014
£m
Group2013
£m
University2014
£m
University2013
£m
Fixed asset investments (see note 13) 1,002.1 918.1 803.7 693.4 Endowment assets (see note 14) 1,179.5 1,144.4 979.4 953.4 Current asset investments (see note 17) – balances held on behalf of:
Subsidiary undertakings – – 398.5 415.7 Colleges 91.2 65.6 91.2 65.6 Other associated bodies 11.1 8.7 11.1 8.7
Total included in current asset investments 102.3 74.3 500.8 490.0
Total value of units 2,283.9 2,136.8 2,283.9 2,136.8
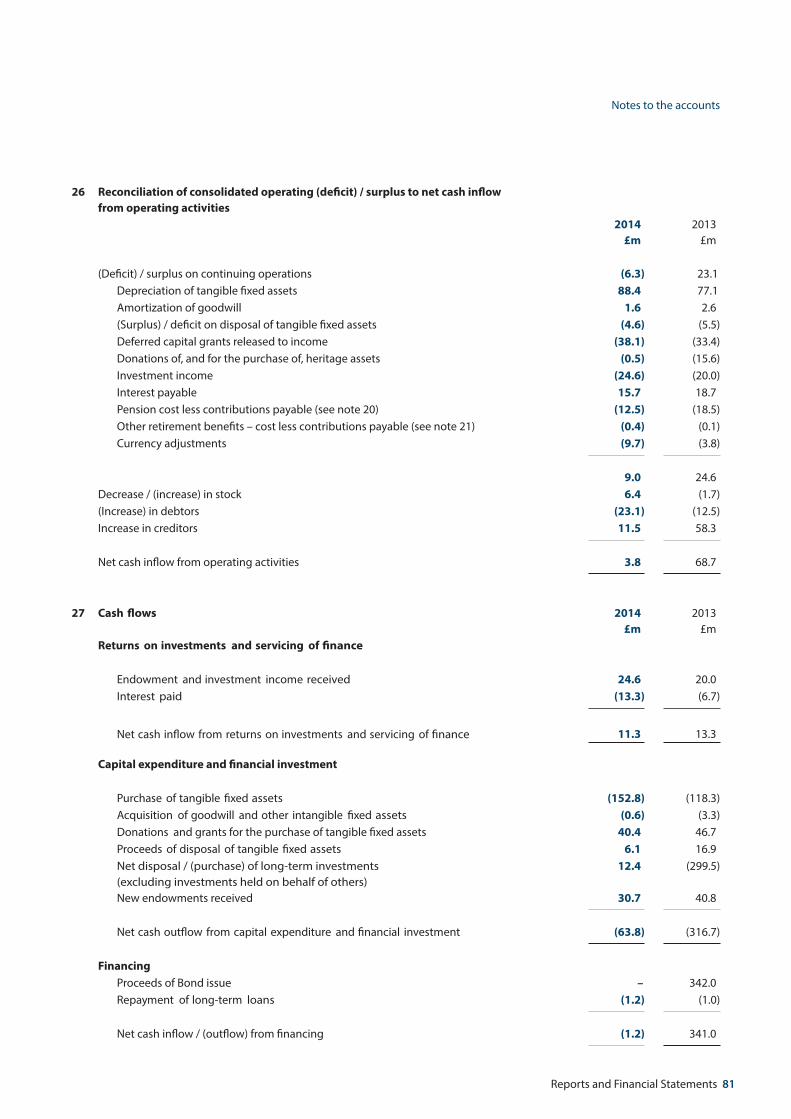
Reports and Financial Statements 81
Notes to the accounts
26 Reconciliation of consolidated operating (deficit) / surplus to net cash inflow from operating activities
2014£m
2013 £m
(Deficit) / surplus on continuing operations (6.3) 23.1 Depreciation of tangible fixed assets 88.4 77.1 Amortization of goodwill 1.6 2.6 (Surplus) / deficit on disposal of tangible fixed assets (4.6) (5.5) Deferred capital grants released to income (38.1) (33.4)Donations of, and for the purchase of, heritage assets (0.5) (15.6)Investment income (24.6) (20.0)Interest payable 15.7 18.7 Pension cost less contributions payable (see note 20) (12.5) (18.5)Other retirement benefits – cost less contributions payable (see note 21) (0.4) (0.1)Currency adjustments (9.7) (3.8)
9.0 24.6 Decrease / (increase) in stock 6.4 (1.7)(Increase) in debtors (23.1) (12.5)Increase in creditors 11.5 58.3
Net cash inflow from operating activities 3.8 68.7
27 Cash flows 2014£m
2013 £m
Returns on investments and servicing of finance
Endowment and investment income received 24.6 20.0 Interest paid (13.3) (6.7)
Net cash inflow from returns on investments and servicing of finance 11.3 13.3
Capital expenditure and financial investment
Purchase of tangible fixed assets (152.8) (118.3)Acquisition of goodwill and other intangible fixed assets (0.6) (3.3)Donations and grants for the purchase of tangible fixed assets 40.4 46.7 Proceeds of disposal of tangible fixed assets 6.1 16.9 Net disposal / (purchase) of long-term investments (excluding investments held on behalf of others)
12.4 (299.5)
New endowments received 30.7 40.8
Net cash outflow from capital expenditure and financial investment (63.8) (316.7)
FinancingProceeds of Bond issue – 342.0 Repayment of long-term loans (1.2) (1.0)
Net cash inflow / (outflow) from financing (1.2) 341.0

82 University of Cambridge Annual Report 2014
Notes to the accounts
28 Analysis of net funds Group
2014
£m
Group2013
£m
Increase / (decrease)
2014 £m
Increase / (decrease)
2013 £m
Cash at bank and in hand 50.1 61.3 (11.2) 10.2 Bank balances included in endowment assets (note 14) 0.5 1.0 (0.5) (4.0)Bank overdrafts (note 18) (3.0) (3.6) 0.6 (1.1)
Net cash and bank overdraft 47.6 58.7 (11.1) 5.1 Money market investments: Included in endowment assets (note 14) 78.6 59.6 19.0 8.9 Included in current asset investments (note 17) 234.3 293.3 (59.0) 94.4 Less held on behalf of others (2.8) (4.0) 1.2 (1.8)Debt due after one year (note 19) (345.8) (347.3) 1.5 (345.0)Debt due within one year (note 18) (1.0) (0.7) (0.3) 3.7
Net funds 10.9 59.6 (48.7) (234.7)
29 Capital commitments2014
£m2013
£mCommitments for capital expenditure:
Commitments contracted at 31 July 167.2 117.6
Authorized but not contracted at 31 July 351.0 100.9
Commitments for capital calls on investments 193.3 163.7
30 Pension schemes
The two principal pension schemes for the University’s staff are the Universities Superannuation Scheme (USS) and the Cambridge University Assistants’ Contributory Pension Scheme (CPS). Cambridge University Press operates two defined benefit schemes for its UK staff, the Press Contributory Pension Fund (PCPF) and the Press Senior Staff Pension Scheme (PSSPS). With the exception (from 1 January 2013) of the CPS, employees covered by the schemes are contracted out of the State Second Pension. The assets of the schemes are held in separate trustee-administered funds. The USS and the CPS are not closed, nor is the age profile of their active membership rising significantly. The PCPF and the PSSPS have been closed to new members. The schemes are defined benefit schemes which are valued every three years using the projected unit method by professionally qualified actuaries, the rates of contribution payable being determined by the trustees on the advice of the actuaries.
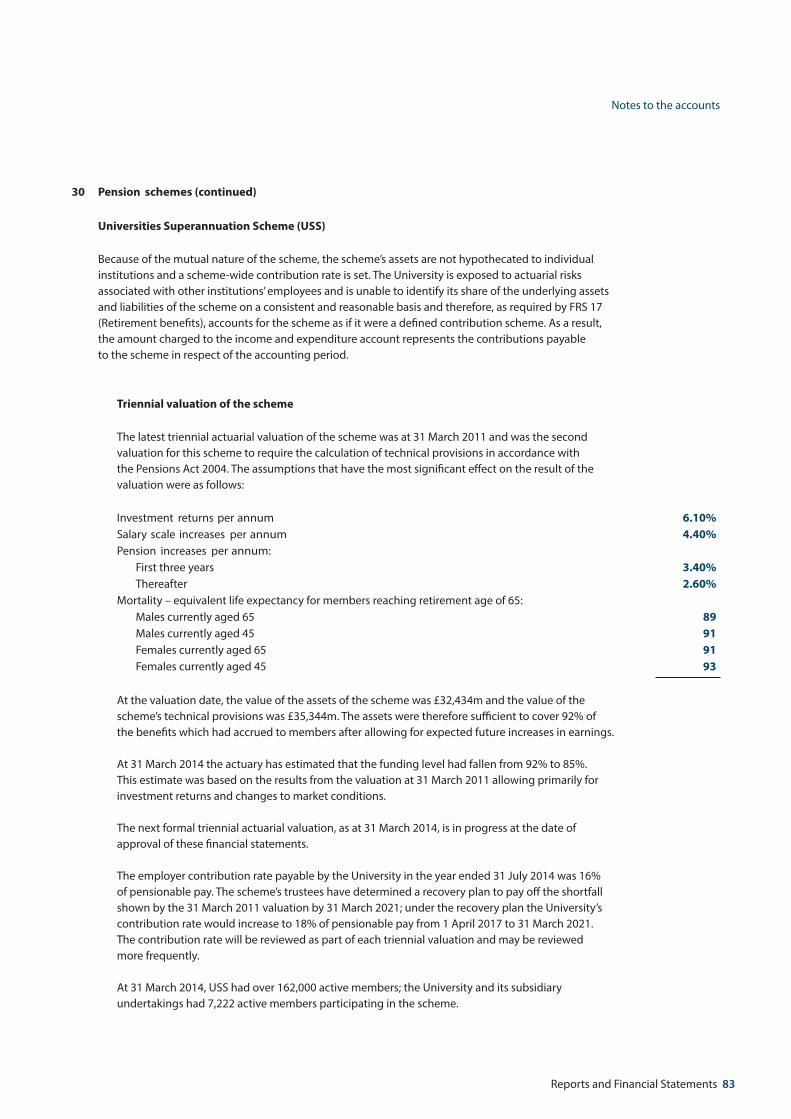
Reports and Financial Statements 83
Notes to the accounts
30 Pension schemes (continued)
Universities Superannuation Scheme (USS)
Because of the mutual nature of the scheme, the scheme’s assets are not hypothecated to individual institutions and a scheme-wide contribution rate is set. The University is exposed to actuarial risks associated with other institutions’ employees and is unable to identify its share of the underlying assets and liabilities of the scheme on a consistent and reasonable basis and therefore, as required by FRS 17 (Retirement benefits), accounts for the scheme as if it were a defined contribution scheme. As a result, the amount charged to the income and expenditure account represents the contributions payable to the scheme in respect of the accounting period.
Triennial valuation of the scheme
The latest triennial actuarial valuation of the scheme was at 31 March 2011 and was the second valuation for this scheme to require the calculation of technical provisions in accordance with the Pensions Act 2004. The assumptions that have the most significant effect on the result of the valuation were as follows:
Investment returns per annum 6.10%Salary scale increases per annum 4.40%Pension increases per annum:
First three years 3.40%Thereafter 2.60%
Mortality – equivalent life expectancy for members reaching retirement age of 65:Males currently aged 65 89 Males currently aged 45 91 Females currently aged 65 91 Females currently aged 45 93
At the valuation date, the value of the assets of the scheme was £32,434m and the value of the scheme’s technical provisions was £35,344m. The assets were therefore sufficient to cover 92% of the benefits which had accrued to members after allowing for expected future increases in earnings. At 31 March 2014 the actuary has estimated that the funding level had fallen from 92% to 85%. This estimate was based on the results from the valuation at 31 March 2011 allowing primarily for investment returns and changes to market conditions.
The next formal triennial actuarial valuation, as at 31 March 2014, is in progress at the date of approval of these financial statements.
The employer contribution rate payable by the University in the year ended 31 July 2014 was 16% of pensionable pay. The scheme’s trustees have determined a recovery plan to pay off the shortfall shown by the 31 March 2011 valuation by 31 March 2021; under the recovery plan the University’s contribution rate would increase to 18% of pensionable pay from 1 April 2017 to 31 March 2021. The contribution rate will be reviewed as part of each triennial valuation and may be reviewed more frequently.
At 31 March 2014, USS had over 162,000 active members; the University and its subsidiary undertakings had 7,222 active members participating in the scheme.

84 University of Cambridge Annual Report 2014
Notes to the accounts
30 Pension schemes (continued)
Cambridge University Assistants’ Contributory Pension Scheme (CPS)
The CPS was established under the authority of the Universities of Oxford and Cambridge Act 1923. It is a registered pension scheme for the purposes of the Finance Act 2004. The active members of the scheme are employees of the University and its subsidiary undertakings. The scheme’s benefit structure changed significantly from 1 January 2013, at which point employees covered by the schemes ceased to be contracted out of the State Second Pension.
Triennial valuation of the scheme
A full triennial valuation of the scheme was carried out by the actuary for the trustees of the scheme for funding purposes as at 31 July 2012. The results showed the actuarial value of the scheme’s assets as £377m. These were insufficient to cover the scheme’s past service liabilities of £511m; the scheme had a deficit of £134m and was 74% funded. From 1 August 2011 to 31 July 2013 normal employer contributions were set at 20.3% of pensionable pay. From 1 August 2013 employer contributions were set at 11.5% of pensionable pay for existing members at 31 December 2012 and 5.8% of pensionable pay (together with contributions at 5.0% to a separate defined contribution arrangement) for new entrants from 1 January 2013. In addition fixed employer contributions totalling £14.6m per annum are payable over the period from 1 August 2011 to 31 July 2025.
CPS: Pension costs under FRS 17
For accounting purposes the scheme’s assets are measured at market value and liabilities are valued using the projected unit method and discounted using the gross redemption yield for corporate AA rated bonds. The valuation uses market-based assumptions and asset valuations, and represents a current valuation. It does not impact on the joint contribution rate set by the trustees of the scheme. The principal assumptions used by the actuary were:
2014 2013
Discount rate 4.20% 4.60%Expected rate of return on scheme assets at beginning of year 7.15% 7.15%Rate of increase in salaries 4.15% 4.15%Rate of increase in pensions in deferment 3.40% 3.40%Rate of increase in pensions in payment 3.40% 3.40%Mortality – equivalent life expectancy for members reaching the age of 65:Males currently aged 65 87 87 Males currently aged 45 88 88 Females currently aged 65 90 90 Females currently aged 45 92 92
The following results were measured in accordance with the requirements of FRS 17, based on the assumptions summarized above:
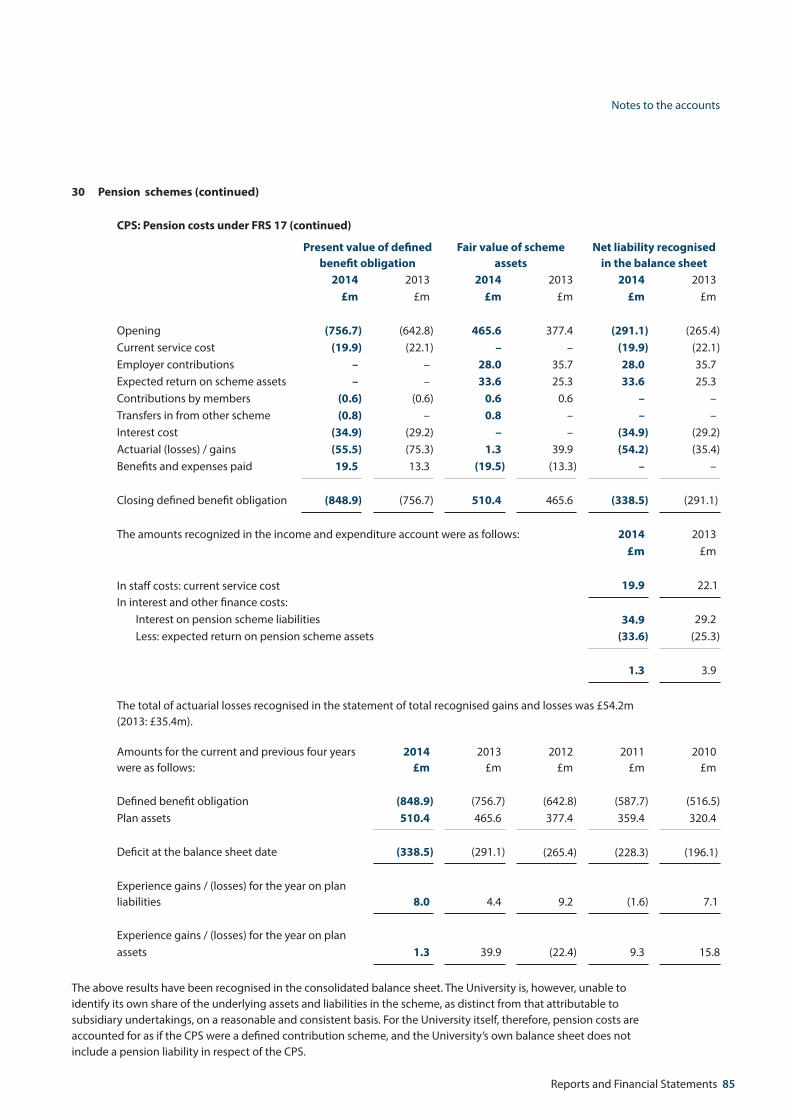
Reports and Financial Statements 85
Notes to the accounts
30 Pension schemes (continued)
CPS: Pension costs under FRS 17 (continued)
Present value of defined benefit obligation
Fair value of scheme assets
Net liability recognised in the balance sheet
2014 2013 2014 2013 2014 2013£m £m £m £m £m £m
Opening (756.7) (642.8) 465.6 377.4 (291.1) (265.4)Current service cost (19.9) (22.1) – – (19.9) (22.1)Employer contributions – – 28.0 35.7 28.0 35.7 Expected return on scheme assets – – 33.6 25.3 33.6 25.3 Contributions by members (0.6) (0.6) 0.6 0.6 – – Transfers in from other scheme (0.8) – 0.8 – – – Interest cost (34.9) (29.2) – – (34.9) (29.2)Actuarial (losses) / gains (55.5) (75.3) 1.3 39.9 (54.2) (35.4)Benefits and expenses paid 19.5 13.3 (19.5) (13.3) – –
Closing defined benefit obligation (848.9) (756.7) 510.4 465.6 (338.5) (291.1)
The amounts recognized in the income and expenditure account were as follows: 2014 2013£m £m
In staff costs: current service cost 19.9 22.1 In interest and other finance costs:
Interest on pension scheme liabilities 34.9 29.2 Less: expected return on pension scheme assets (33.6) (25.3)
1.3 3.9
The total of actuarial losses recognised in the statement of total recognised gains and losses was £54.2m (2013: £35.4m).
Amounts for the current and previous four years were as follows:
2014£m
2013£m
2012£m
2011£m
2010£m
Defined benefit obligation (848.9) (756.7) (642.8) (587.7) (516.5)Plan assets 510.4 465.6 377.4 359.4 320.4
Deficit at the balance sheet date (338.5) (291.1) (265.4) (228.3) (196.1)
Experience gains / (losses) for the year on plan liabilities 8.0 4.4 9.2 (1.6) 7.1
Experience gains / (losses) for the year on planassets 1.3 39.9 (22.4) 9.3 15.8
The above results have been recognised in the consolidated balance sheet. The University is, however, unable to identify its own share of the underlying assets and liabilities in the scheme, as distinct from that attributable to subsidiary undertakings, on a reasonable and consistent basis. For the University itself, therefore, pension costs are accounted for as if the CPS were a defined contribution scheme, and the University’s own balance sheet does not include a pension liability in respect of the CPS.
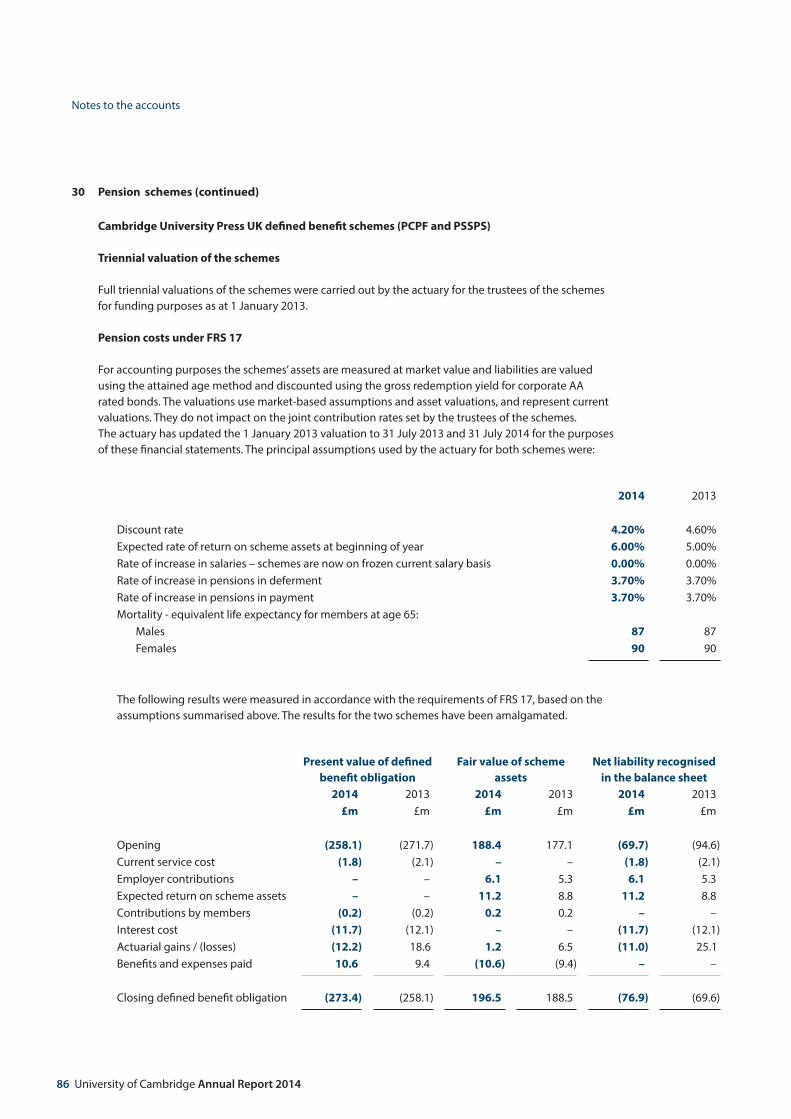
86 University of Cambridge Annual Report 2014
Notes to the accounts
30 Pension schemes (continued)
Cambridge University Press UK defined benefit schemes (PCPF and PSSPS)
Triennial valuation of the schemes
Full triennial valuations of the schemes were carried out by the actuary for the trustees of the schemes for funding purposes as at 1 January 2013.
Pension costs under FRS 17
For accounting purposes the schemes’ assets are measured at market value and liabilities are valued using the attained age method and discounted using the gross redemption yield for corporate AA rated bonds. The valuations use market-based assumptions and asset valuations, and represent current valuations. They do not impact on the joint contribution rates set by the trustees of the schemes. The actuary has updated the 1 January 2013 valuation to 31 July 2013 and 31 July 2014 for the purposes of these financial statements. The principal assumptions used by the actuary for both schemes were:
2014 2013
Discount rate 4.20% 4.60%Expected rate of return on scheme assets at beginning of year 6.00% 5.00%Rate of increase in salaries – schemes are now on frozen current salary basis 0.00% 0.00%Rate of increase in pensions in deferment 3.70% 3.70%Rate of increase in pensions in payment 3.70% 3.70%Mortality - equivalent life expectancy for members at age 65:
Males 87 87Females 90 90
The following results were measured in accordance with the requirements of FRS 17, based on the assumptions summarised above. The results for the two schemes have been amalgamated.
Present value of defined benefit obligation
Fair value of scheme assets
Net liability recognised in the balance sheet
2014 2013 2014 2013 2014 2013£m £m £m £m £m £m
Opening (258.1) (271.7) 188.4 177.1 (69.7) (94.6)Current service cost (1.8) (2.1) – – (1.8) (2.1)Employer contributions – – 6.1 5.3 6.1 5.3 Expected return on scheme assets – – 11.2 8.8 11.2 8.8 Contributions by members (0.2) (0.2) 0.2 0.2 – –Interest cost (11.7) (12.1) – – (11.7) (12.1)Actuarial gains / (losses) (12.2) 18.6 1.2 6.5 (11.0) 25.1 Benefits and expenses paid 10.6 9.4 (10.6) (9.4) – –
Closing defined benefit obligation (273.4) (258.1) 196.5 188.5 (76.9) (69.6)

Reports and Financial Statements 87
Notes to the accounts
30 Pension schemes (continued)
PCPF and PSSPS: Pension costs under FRS 17 (continued)
The amounts recognized in the income and expenditure account were as follows: 2014£m
2013£m
In staff costs: current service cost 1.8 2.1
In interest and other finance costs:Interest on pension scheme liabilities 11.7 12.1 Less: expected return on pension scheme assets (11.2) (8.8)
0.5 3.3
The total of actuarial losses recognised in the statement of total recognised gains and losses was £11.0m (2013: gains £25.1m).
Amounts for the current and previous four years were as follows:
2014£m
2013£m
2012£m
2011£m
2010£m
Defined benefit obligation (273.4) (258.1) (271.7) (241.4) (223.2)Plan assets 196.5 188.5 177.1 166.9 152.4
Deficit at the balance sheet date (76.9) (69.6) (94.6) (74.5) (70.8)
Experience gains / (losses) for the year on plan liabilities – 17.8 (4.2) (8.4) (2.4)
Experience gains / (losses) for the year on plan assets 1.2 6.5 3.5 10.9 8.5
The University also has a smaller number of staff in other pension schemes, including the National Health Service Pension Scheme (NHSPS). Further disclosures are not given as the balances and movements are not material.
The total pension cost for the year (see note 7) was:
Employer contributions
2014
FRS 17 adjustment
2014
Total 2014
Employer contributions
2013
FRS 17 adjustment
2013
Total 2013
£m £m £m £m £m £mUSS 69.6 – 69.6 63.1 – 63.1 CPS 28.1 (8.1) 20.0 35.7 (13.6) 22.1 PCPF 2.6 (1.2) 1.4 2.8 (1.2) 1.6 PSSPS 3.5 (3.1) 0.4 2.6 (2.0) 0.6 NHSPS 2.1 – 2.1 1.9 – 1.9 Other pension schemes 4.8 (0.1) 4.7 3.8 (1.7) 3.8
110.7 (12.5) 98.2 109.9 (18.5) 93.1
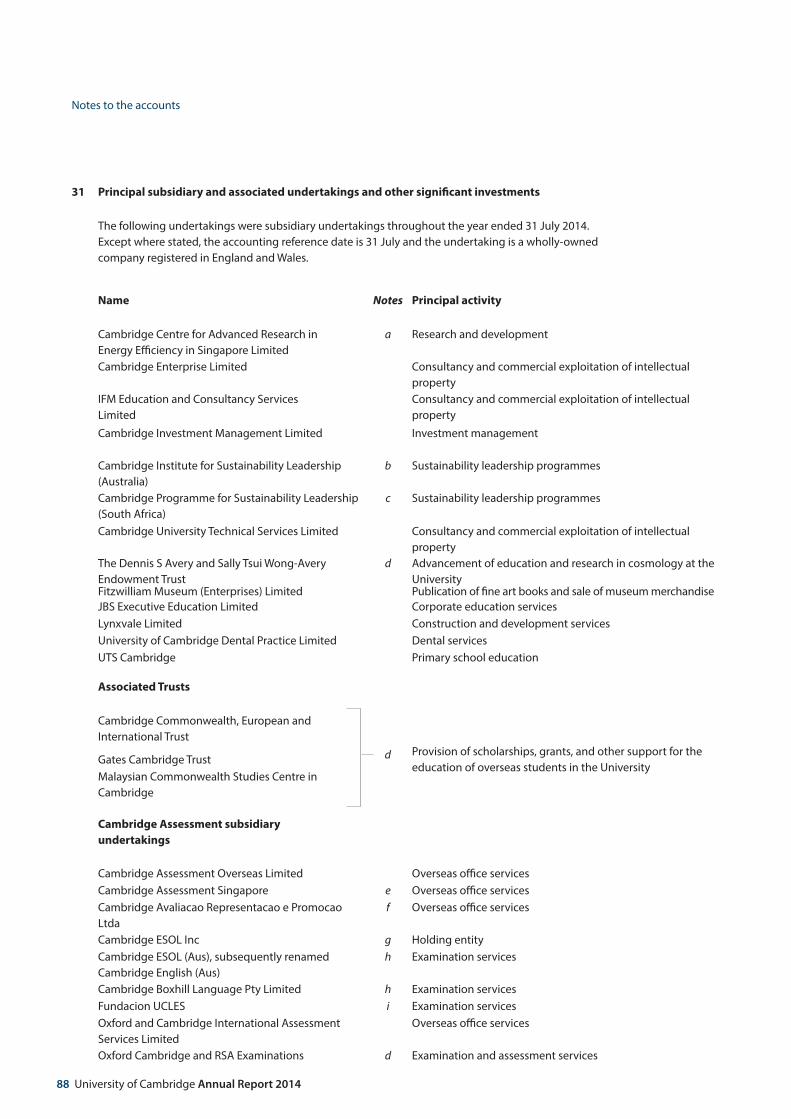
88 University of Cambridge Annual Report 2014
Notes to the accounts
31 Principal subsidiary and associated undertakings and other significant investments
The following undertakings were subsidiary undertakings throughout the year ended 31 July 2014. Except where stated, the accounting reference date is 31 July and the undertaking is a wholly-owned company registered in England and Wales.
Name Notes Principal activity
Cambridge Centre for Advanced Research in Energy Efficiency in Singapore Limited
a Research and development
Cambridge Enterprise Limited Consultancy and commercial exploitation of intellectual property
IFM Education and Consultancy Services Limited
Consultancy and commercial exploitation of intellectual property
Cambridge Investment Management Limited
Investment management
Cambridge Institute for Sustainability Leadership (Australia)
b Sustainability leadership programmes
Cambridge Programme for Sustainability Leadership (South Africa)
c Sustainability leadership programmes
Cambridge University Technical Services Limited Consultancy and commercial exploitation of intellectual property
The Dennis S Avery and Sally Tsui Wong-Avery Endowment Trust
d Advancement of education and research in cosmology at the University
Fitzwilliam Museum (Enterprises) Limited Publication of fine art books and sale of museum merchandiseJBS Executive Education Limited Corporate education services Lynxvale Limited Construction and development servicesUniversity of Cambridge Dental Practice Limited Dental servicesUTS Cambridge Primary school education
Associated Trusts
Cambridge Commonwealth, European and International Trust
Provision of scholarships, grants, and other support for the education of overseas students in the University
Gates Cambridge Trust Malaysian Commonwealth Studies Centre in Cambridge
Cambridge Assessment subsidiary undertakings
Cambridge Assessment Overseas Limited Overseas office servicesCambridge Assessment Singapore e Overseas office servicesCambridge Avaliacao Representacao e Promocao Ltda
f Overseas office services
Cambridge ESOL Inc g Holding entityCambridge ESOL (Aus), subsequently renamed Cambridge English (Aus)
h Examination services
Cambridge Boxhill Language Pty Limited h Examination servicesFundacion UCLES i Examination servicesOxford and Cambridge International Assessment Services Limited
Overseas office services
Oxford Cambridge and RSA Examinations d Examination and assessment services
d

Reports and Financial Statements 89
Notes to the accounts
31 Principal subsidiary and associated undertakings and other significant investments (continued)
Name Notes Principal activity
Cambridge University Press subsidiary undertakings
j
Academic Journal Publishing Pty Limited h Intermediate holding companyAustralian Academic Press Pty Group Limited h Publishing and distributionCambridge Knowledge (China) Limited k Representative officeCambridge University Press (Greece) EPE l Representative officeCambridge University Press (Holdings) Limited Multi-purpose holding companyCambridge University Press India (Private) Limited m Publishing and distributionCambridge University Press Japan KK n Representative officeCambridge University Press Panama SA o DistributionCambridge University Press South Africa (Proprietary) Limited
p Publishing and distribution
Cambridge Hitachi-Solutions Education Limited q E-learningEditorial Edicambridge Cia Ltda r Representative officeDigital Services Cambridge Limited Software developmentELT Trading Limited s PublishingFoundation e-Learning (Private) Limited m Publishing and distributionHOTmaths Pty Limited t Web-based maths digital learning management systemsUnited Publishers Services Limited k Distribution
a Cambridge Centre for Advanced Research in Energy Efficiency in Singapore Limited is incorporated in Singapore and has an accounting reference date of 31 March for commercial reasons. The effect of this is not material to the consolidated accounts.
b Cambridge Institute for Sustainability Leadership (Australia) is incorporated in Australia and has an accounting reference date of 30 June for commercial reasons. The effect of this is not material to the consolidated accounts.
c Cambridge Programme for Sustainability Leadership (South Africa) is incorporated in South Africa.
d These entities are exempt charities established by trust deeds (see note 34).e Cambridge Assessment Singapore is incorporated in Singapore. f Cambridge Avaliacao Representacao e Promocao Ltda is incorporated in Brazil.
g Cambridge ESOL Inc is a United States non-stock non-profit corporation. h Cambridge English (Aus), Cambridge Boxhill Language Pty Limited, Academic Journal Publishing
Pty Limited and Australian Academic Press Pty Group Limited are incorporated in Australia. i Fundacion UCLES is incorporated in Spain. j Cambridge University Press subsidiary undertakings have an accounting reference date of 30 April
for commercial reasons, with the exceptions of the companies incorporated in India (31 March) and Mexico (31 December).
k Cambridge Knowledge (China) Limited and United Publishers Services Limited are incorporated in Hong Kong.
l Cambridge University Press (Greece) EPE is incorporated in Greece. m Cambridge University Press India (Private) Limited and Foundation e-Learning (Private) Limited are
incorporated in India. n Cambridge University Press Japan KK is incorporated in Japan.

90 University of Cambridge Annual Report 2014
Notes to the accounts
o Cambridge University Press Panama SA is incorporated in Panama. p Cambridge University Press South Africa (Proprietary) Limited is a 75% subsidiary incorporated in
South Africa. q The University holds 60% of the issued share capital in Cambridge Hitachi-Solutions Education
Limited. r Editorial Edicambridge Cia Ltda is incorporated in Ecuador. s ELT Trading Limited is incorporated in Mexico. t HOTmaths Pty Limited is a 55% subsidiary incorporated in Australia.
Other significant investments
The University has interests in a number of spin-out companies formed to exploit intellectual property rights or inventions. These are included at valuation in fixed asset investments (see note 13) and endowment assets (see note 14). In some cases the University’s interest amounted to 20% or more of the share capital at the year end, and these companies are listed below. As the University does not exercise a significant influence over these investments and they are not intended to be held for the long-term, they are not accounted for as associated undertakings. Other undertakings where the University’s investment amounts to 20% or more are also listed below. These are not accounted for as associated undertakings as the effect on the financial statements would not be material.
Name % interest Principal Activity
Ampika Limited 40 Commercial exploitation of intellectual propertyAQDOT Limited 20 Commercial exploitation of intellectual propertyCambridge Epigenetix Limited 24 Commercial exploitation of intellectual propertyCambridge in America 22 FundraisingJukedeck Limited 22 Commercial exploitation of intellectual propertyMicrobial Technics Limited 23 Commercial exploitation of intellectual propertySphere Fluidics Limited 30 Commercial exploitation of intellectual propertyThe CRISP Consortium Limited 45 Commercial exploitation of intellectual property
In addition, at the year end the University held an interest of 33.5% in Cambridge Innovation Capital plc as part of its investment portfolio. Movements in the carrying value of this investment are not taken through the income and expenditure account.
31 Principal subsidiary and associated undertakings and other significant investments (continued)
Reports and Financial Statements 91
Notes to the accounts
32 Related party transactions
The financial statements of the University include transactions with related parties. In accordance with FRS 8 (Related Party Transactions), these are disclosed where members of the Council disclose an interest in a body with whom the University undertakes transactions which are considered material to the University’s financial statements and / or to the other party. Due to the nature of the University’s operations and the composition of its Council, it is inevitable that the University will enter into transactions in the normal course of business with Colleges, NHS Trusts, Research Councils, other grant-awarding bodies and other private and public sector organisations in which members of the Council may have an interest. All transactions involving organisations in which members of Council may have such an interest, including those summarised below, are conducted in accordance with the University’s financial regulations and usual procurement procedures. A register of the interests of the members of the Council is maintained. The University has taken advantage of the exemption within FRS 8 and has not disclosed transactions with other group entities where it holds 100% of the voting rights. Transactions with Colleges are summarized in note 33 below. Included within the financial statements are other transactions with the following related parties:
Academy of Medical Sciences The Academy of Medical Sciences is an independent registered charity governed by a Council that includes a member of the University’s Council. Research grants and contracts income for the year ended 31 July 2014 includes £243,000 in respect of grants funded by the Academy. Cambridge University Students Union The President and the Education Officer of Cambridge University Students Union were also members of the University’s Council for the 2013-14 financial year. Under Statutes and Ordinances, Chapter II, the University has discretion to provide financial assistance to the Union and, in the year ending 31 July 2014, provided a grant of £154,000 and made other payments totalling £17,000 for services provided. The Union made payments to the University totalling £17,000 for temporary staff, network and other services provided.
Gatsby Charitable Foundation Lord Sainsbury of Turville, who was elected as Chancellor of the University in October 2011, is settlor of the Gatsby Charitable Foundation (Gatsby) and, together with the Gatsby Trustees, is actively involved in setting the Foundation’s strategic direction and approving its activities. In 2006 the University approved a proposal to establish a Sainsbury Laboratory for plant science in Cambridge, with Gatsby providing capital funding and research funds over a ten year period. The Sainsbury Laboratory was completed in the year ended 31 July 2011, with Gatsby capital contributions totalling £74m. Research grants and contracts income for the year ended 31 July 2014 includes £6.2m in respect of continuing grants funded by Gatsby. Higher Education Funding Council for England The Higher Education Funding Council for England (HEFCE) allocates funding from the Government to universities and colleges in England. HEFCE is led by the HEFCE Board that includes a member of the University’s Council. Funding received from HEFCE is included in funding body grants (see note 1) and in deferred capital grants (see note 22) in accordance with the University’s accounting policies. At 31 July 2014 current liabilities included £34.6m in respect of funding received from HEFCE but not yet recognised as deferred capital grants or as income. Kidney Research UK Kidney Research UK is a registered charity governed by a Board of Trustees that includes a member of the University’s Council. Research grants and contracts income for the year ended 31 July 2014 includes £140,000 receivable in respect of grants funded by Kidney Research UK.

92 University of Cambridge Annual Report 2014
Notes to the accounts
32 Related party transactions (continued)
Royal Society The Royal Society is a registered charity governed by a Council of distinguished scientists that includes a member of the University’s Council. Research grants and contracts income for the year ended 31 July 2014 includes £5.9m in respect of grants funded by the Royal Society.
University of Cambridge Graduate Union The President of the Graduate Union was also a member of the University’s Council for the 2013-14 financial year. Under Statutes and Ordinances, Chapter II, the University has discretion to provide financial assistance to the Graduate Union and, in the year ending 31 July 2014, provided a grant of £76,000 and made other payments totalling £10,000 for services provided. The Union made payments to the University totalling £12,000 for network and other services provided.
33 Colleges
There are 31 Colleges, each of which is an independent corporation with its own property and income. Each College publishes its own financial statements, in a form specified by the University. During the year payments were made by the University from HEFCE funding in respect of the College fees of publicly-funded undergraduates of £44.9m (2013: £43.3m). These payments are included as “Payments to Colleges” in note 8 above. The University also made payments in respect of the College fees of postgraduate students totalling £5.4m (2013: £5.3m). These payments are included in other operating expenses. Other operating expenses also include £5.0m (2013: £4.9m) in respect of payments to the Isaac Newton Trust, a charitable trust established by Trinity College, as contributions to a bursary scheme for students of the University. The University distributed third party donations to the Colleges totalling £9.3m (2013: £7.3m distributed by the Cambridge Foundation); these payments are not included in the consolidated income and expenditure account. During the year the University provided printing, network and other services to the Colleges for which the Colleges paid a total of £2.9m (2013: £2.8m), and the Colleges provided accommodation, catering and other services to the University for which the University paid a total of £8.2m (2013: £7.7m). During the year the Colleges made donations to the University totalling £2.1m (2013: £1.9m) of which £1.2m was credited to specific endowments. Current asset investments include £91.2m (2013: £65.6m) held on behalf of ten (2013: seven) Colleges in the form of CUEF units (see note 17) and £9.0m (2013: £6.7m) held on behalf of the Isaac Newton Trust.
Colleges Fund 2014£000
2013£000
Balance at 1 August 15 55
Contributions received from Colleges 3,979 3,757
Interest earned 3 3
Payments to Colleges (3,980) (3,800)
Balance at 31 July included in creditors 17 15
The Colleges Fund is administered by the University on behalf of the Colleges, who make all contributions to and receive all allocations from the Fund. The transactions on the Colleges Fund are not included in the income and expenditure account.
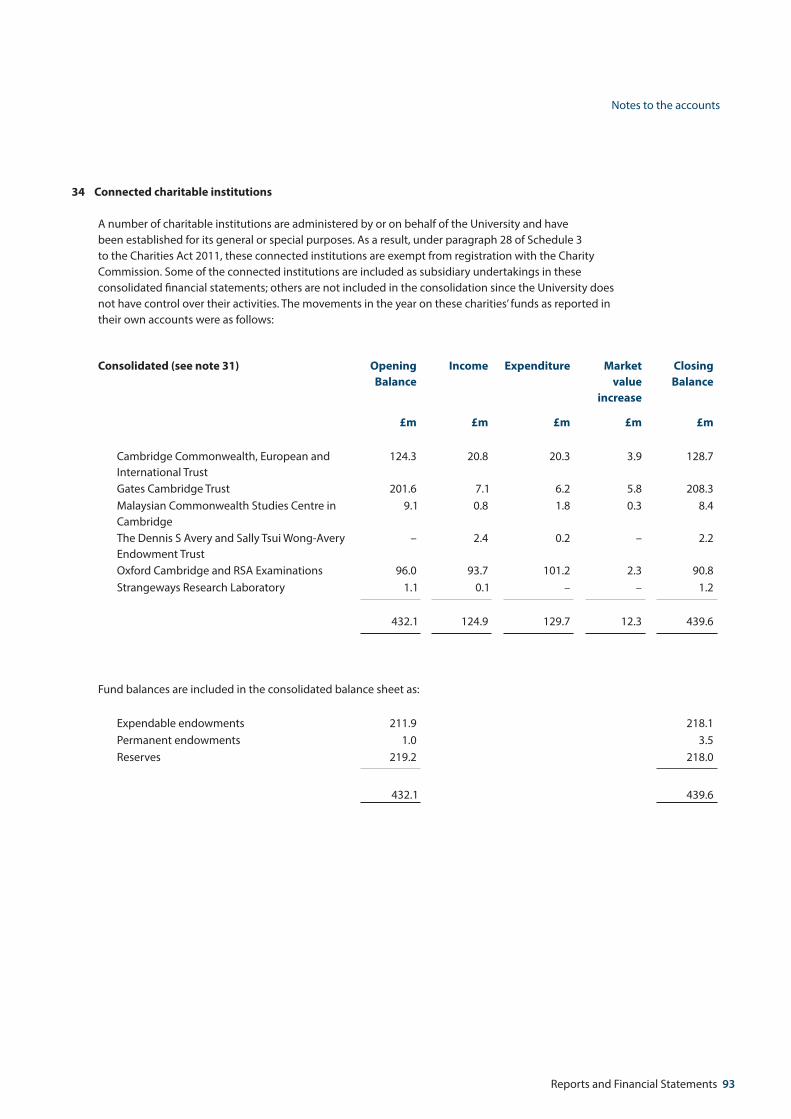
Reports and Financial Statements 93
Notes to the accounts
34 Connected charitable institutions
A number of charitable institutions are administered by or on behalf of the University and have been established for its general or special purposes. As a result, under paragraph 28 of Schedule 3 to the Charities Act 2011, these connected institutions are exempt from registration with the Charity Commission. Some of the connected institutions are included as subsidiary undertakings in these consolidated financial statements; others are not included in the consolidation since the University does not have control over their activities. The movements in the year on these charities’ funds as reported in their own accounts were as follows:
Consolidated (see note 31) OpeningBalance
Income Expenditure Market value
increase
ClosingBalance
£m £m £m £m £m
Cambridge Commonwealth, European and International Trust
124.3 20.8 20.3 3.9 128.7
Gates Cambridge Trust 201.6 7.1 6.2 5.8 208.3 Malaysian Commonwealth Studies Centre in Cambridge
9.1 0.8 1.8 0.3 8.4
The Dennis S Avery and Sally Tsui Wong-Avery Endowment Trust
– 2.4 0.2 – 2.2
Oxford Cambridge and RSA Examinations 96.0 93.7 101.2 2.3 90.8 Strangeways Research Laboratory 1.1 0.1 – – 1.2
432.1 124.9 129.7 12.3 439.6
Fund balances are included in the consolidated balance sheet as:
Expendable endowments 211.9 218.1 Permanent endowments 1.0 3.5 Reserves 219.2 218.0
432.1 439.6

94 University of Cambridge Annual Report 2014
Notes to the accounts
OpeningBalance
Income Expenditure Market value
increase
ClosingBalance
£m £m £m £m £mNot consolidatedIsaac Newton Trust, established by Trinity College (see note 33) to promote education, learning, and research in the University (accounts drawn up to 30 June 2014)
22.0 8.5 8.9 1.1 22.7
University of Cambridge Veterinary School Trust, for the support of veterinary education in the University
1.1 0.2 0.2 – 1.1
One smaller scholarship trust 0.3 – – – 0.3Registered clubs and societies:
Cambridge University Amateur Dramatic Club 0.1 0.2 0.2 – 0.1 Cambridge University Boat Club 1.8 0.5 0.4 – 1.9 Cambridge University Eco Racing – 0.1 – – 0.1 Cambridge University Law Society – 0.2 0.2 – –Cambridge University Polo Club 0.3 0.1 0.1 – 0.3 Cambridge University Rag – 0.1 0.1 – – Cambridge University Real Tennis Club 0.1 0.1 0.1 – 0.1 Cambridge University Rugby Union Football Club
0.8 0.6 0.5 – 0.9
Cambridge University Women’s Boat Club – 0.5 0.3 – 0.2 381 smaller clubs and societies 2.7 1.8 1.9 – 2.7
29.2 12.9 12.9 1.1 30.4
35 HEFCE Access Funds 2014£000
2013£000
Access to Learning Fund allocation 147 134 Disbursed to students (129) (133)Contribution to administration costs – (1)
Balance unspent at 31 July 18 –
Access to Learning Fund grants are available for students: the University acts only as agent. The grants and related disbursements are therefore excluded from the income and expenditure account.
34 Connected charitable institutions (continued)

Reports and Financial Statements 95
Notes to the accounts
36 Financial risk management
In the ordinary course of its activities, the University manages a variety of financial risks including credit risk, liquidity risk and market risk. The principal risks and the University’s approach to managing them are set out below. In view of the significance of the Cambridge University Endowment Fund (CUEF, see note 25), some aspects of financial risk management are considered for CUEF and non-CUEF separately.
Through the CUEF, the University invests in various categories of assets for the long term in order to achieve the CUEF’s investment objective of a total return of RPI plus 5.25 per cent per annum. The CUEF is managed by the University’s Investment Office, with the oversight of the University’s Investment Board. In order to pursue its investment objective the CUEF seeks exposure to a variety of risks. This exposure could result in a reduction in the University’s net assets.
a Credit risk
Credit risk is the risk that the University would incur a financial loss if a counterparty were to fail to discharge its obligations to the University.
Credit risk exposureThe University is exposed to credit risk in respect of its financial assets held with various counterparties. The following table details the maximum exposure to credit risk at 31 July:
2014 £m
2013 £m
Interest-bearing securities 15.0 17.7 Derivative financial instrument asset positions 25.0 101.3 Investment cash balances 162.1 129.4 Trade debtors: invoices receivable 156.1 174.7 Other debtors 145.4 98.6 Money market investments 313.0 353.0 Cash at bank 50.1 62.3
Total financial assets exposed to credit risk 866.7 937.0
Of the above financial assets only certain trade debtors, as detailed below, were past their due date or were impaired during the year.
Trade debtors: outstanding invoices 161.6 180.7 Less: Provision for impairment of receivables (5.5) (6.0)
156.1 174.7

96 University of Cambridge Annual Report 2014
Notes to the accounts
Trade debtors that are less than three months past their due date are not considered impaired unless they are included in the specific provision. At 31 July 2014, trade debtors with carryingvalue of £53.5m (2013: £46.8m) were past their due date but not impaired.
2014 £m
2013 £m
Balances against which a provision has been made 11.3 14.2 Balances not past their due date 96.8 119.7 Up to 3 months past due 36.7 31.2 3 to 6 months past due 9.5 9.3 Over 6 months past due 7.3 6.3
161.6 180.7
Movement on provision of impairment of receivables
Opening balance 6.0 Provided in year 0.9 Balances written off (1.4)
Closing balance 5.5
Risk management policies and proceduresThe University aims to minimise its counterparty credit risk exposure by monitoring the size of its credit exposure to, and the creditworthiness of, counterparties, including setting appropriate exposure limits and maturities. The creditworthiness and financial strength of trading customers and research sponsors is assessed at inception and on an ongoing basis. Counterparties for investment assets and bank accounts are selected based on their financial ratings, regulatory environments and specific circumstances. In respect of the CUEF, fund managers appointed by the CUEF have responsibility for choosing reliable counterparties. Where CUEF investments are managed directly by the University, investment transactions are carried out with well established, approved brokers. Investment transactions are done on a cash against receipt or cash against delivery basis. Term deposits and cash balances outside the CUEF are subject to authorised limits and rating criteria which are subject to annual review.
The ratings of term deposits and cash balances at 31 July were as follows:
Fitch credit quality rating (short / long term) 2014 £m
2013 £m
F1+ / AA Highest / Very High 94.8 63.9 F1 / A+ Highest / High 8.7 17.2 F1 / A Highest / High 236.7 289.5 F2 / A- Good / High 16.1 30.8 F3 / BBB Fair / Good 6.6 7.2 Lower ratings 0.2 6.7
363.1 415.3
36 Financial risk management (continued)
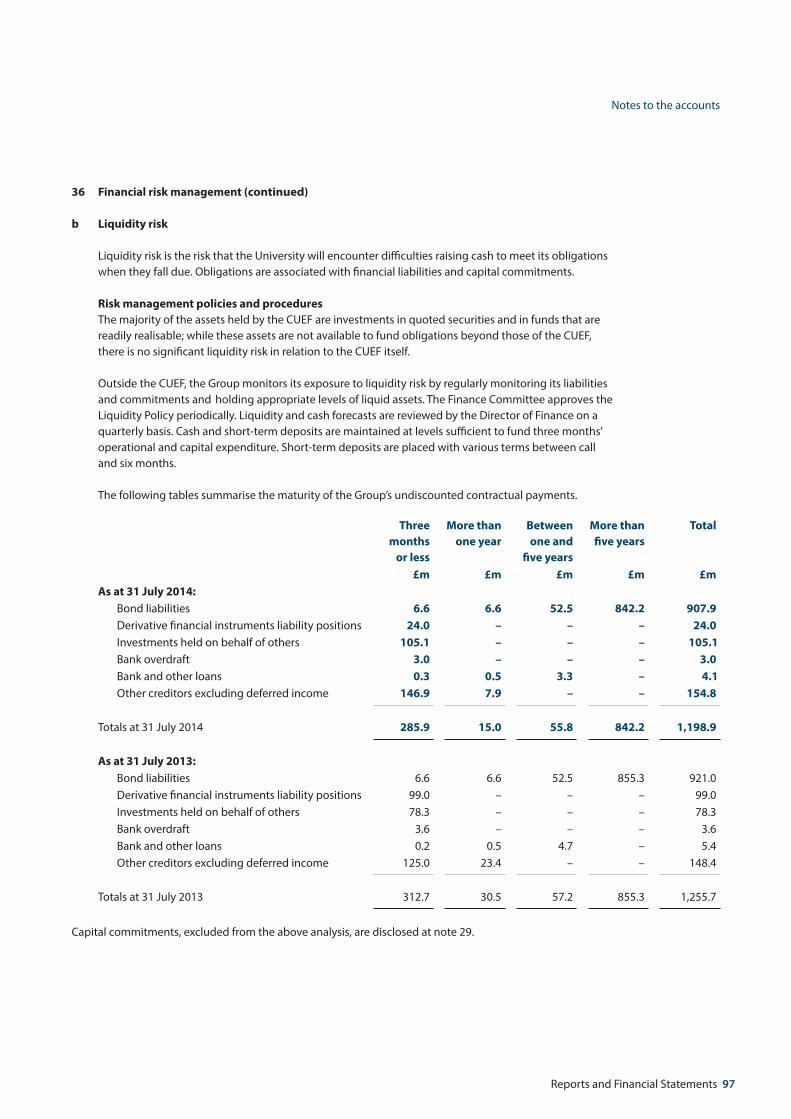
Reports and Financial Statements 97
Notes to the accounts
36 Financial risk management (continued)
b Liquidity risk
Liquidity risk is the risk that the University will encounter difficulties raising cash to meet its obligations when they fall due. Obligations are associated with financial liabilities and capital commitments.
Risk management policies and procedures The majority of the assets held by the CUEF are investments in quoted securities and in funds that are
readily realisable; while these assets are not available to fund obligations beyond those of the CUEF, there is no significant liquidity risk in relation to the CUEF itself.
Outside the CUEF, the Group monitors its exposure to liquidity risk by regularly monitoring its liabilities and commitments and holding appropriate levels of liquid assets. The Finance Committee approves the Liquidity Policy periodically. Liquidity and cash forecasts are reviewed by the Director of Finance on a quarterly basis. Cash and short-term deposits are maintained at levels sufficient to fund three months’ operational and capital expenditure. Short-term deposits are placed with various terms between call and six months.
The following tables summarise the maturity of the Group’s undiscounted contractual payments.
Three months
or less
More than one year
Between one and
five years
More than five years
Total
£m £m £m £m £mAs at 31 July 2014:
Bond liabilities 6.6 6.6 52.5 842.2 907.9 Derivative financial instruments liability positions 24.0 – – – 24.0 Investments held on behalf of others 105.1 – – – 105.1 Bank overdraft 3.0 – – – 3.0 Bank and other loans 0.3 0.5 3.3 – 4.1 Other creditors excluding deferred income 146.9 7.9 – – 154.8
Totals at 31 July 2014 285.9 15.0 55.8 842.2 1,198.9
As at 31 July 2013:Bond liabilities 6.6 6.6 52.5 855.3 921.0 Derivative financial instruments liability positions 99.0 – – – 99.0 Investments held on behalf of others 78.3 – – – 78.3 Bank overdraft 3.6 – – – 3.6 Bank and other loans 0.2 0.5 4.7 – 5.4 Other creditors excluding deferred income 125.0 23.4 – – 148.4
Totals at 31 July 2013 312.7 30.5 57.2 855.3 1,255.7
Capital commitments, excluded from the above analysis, are disclosed at note 29.

98 University of Cambridge Annual Report 2014
Notes to the accounts
36 Financial risk management (continued)
c Market risk
Market risk is the risk of changes to the fair value of the Group’s financial instruments. Market risk embodies the potential for both losses and gains and includes currency risk, interest rate risk and other price risk.
CUEF The Investment Board advises the Council and is made up of investment professionals. The Investment Board monitors the performance of the Investment Office as well as providing advice to it. Investments in the CUEF are selected and combined with the aim of optimising the future long-term total return bearing in mind the expected future volatility of the return. The risk taken in order to meet the total return objective is managed by utilising diversification of investment strategies, of investment asset classes and of external investment managers. The CUEF operates an evolving asset allocation, in the context of a long-term direction. The proposed changes over the following twelve months are revised quarterly in discussion with the Investment Board. Within each asset class, fund managers are appointed and carry out the day-to-day investment transactions.
c(i) Currency risk
Currency risk is the risk that the value of an asset or liability will fluctuate due to changes to foreign currency exchange rates. The functional currency of the University and the presentational currency of the Group is Sterling. However, the Group has investment assets denominated in currencies other than Sterling and is impacted by fluctuations in foreign currency exchange rates.
At 31 July the CUEF had the following principal net exposures:2014 2013
Pounds sterling 51.4% 50.3%US dollar 30.4% 29.9%Euro 4.6% 6.4%Japanese Yen 4.5% 4.5%Other currency 9.1% 8.9%
100.0% 100.0%
The currency exposure for overseas investments is based on the quotation or reporting currency of each holding, while the currency exposure for net monetary assets is based on the currency in which each asset or liability is denominated.

Reports and Financial Statements 99
Notes to the accounts
36 Financial risk management (continued)
The following table summarizes the significant assets and liabilities exposed to currency risk as at 31 July 2014:
US Dollar$m
Euro€m
US Dollar£m
Euro£m
Other£m
Total£m
CUEF investment assets excluding currency contracts
1,736.0 248.8 1,028.3 197.2 361.2 1,586.7
CUEF forward currency contracts (563.2) (117.6) (333.6) (93.2) (49.1) (475.9)
Net exposure of CUEF 1,172.8 131.2 694.7 104.0 312.1 1,110.8 Exposures outside CUEF:
Debtors 35.1 15.6 20.8 12.4 20.1 53.3 Money market investments 4.0 8.5 2.4 6.8 – 9.2 Cash balances 9.0 5.0 5.4 4.0 12.5 21.9 Creditors including bank and other loans
(34.0) (4.0) (20.2) (3.2) (13.0) (36.4)
Forward currency contracts (39.5) (47.5) (23.4) (37.6) – (61.0)
Net exposure 1,147.4 108.8 679.7 86.4 331.7 1,097.8
Impact on total recognized gains for the year 2013–1410% US Dollar appreciation 68.0 10% Euro appreciation 8.6
The following table summarises the significant assets and liabilities exposed to currency risk as at 31 July 2013:
US Dollar$m
Euro€m
US Dollar£m
Euro£m
Other£m
Total£m
CUEF investment assets excluding currency contracts
1,434.1 256.7 945.9 224.8 321.3 1,492.0
CUEF forward currency contracts (468.0) (100.2) (308.7) (87.8) (35.9) (432.4)Net exposure of CUEF 966.1 156.5 637.2 137.0 285.4 1,059.6 Exposures outside CUEF: –
Debtors 28.5 5.1 18.8 4.5 19.9 43.2 Money market investments – 14.0 – 11.9 – 11.9 Cash balances 19.8 8.8 13.1 7.7 11.6 32.4 Creditors including bank and other loans
(22.1) (3.3) (14.6) (2.9) (13.4) (30.9)
Forward currency contracts (12.0) (26.0) (7.9) (22.8) – (30.7)
Net exposure 980.3 155.1 646.6 135.4 303.5 1,085.5

100 University of Cambridge Annual Report 2014
Notes to the accounts
Impact on total recognized gains for the year 2012–13Total
£m10% US Dollar appreciation 64.7 10% Euro appreciation 13.5
Risk management policies and procedures Currency positions in the assets and liabilities of the CUEF are reviewed regularly by the Chief Investment
Officer and the currency exposure is managed within the asset allocation strategy.
c(ii) Interest rate risk
Interest rate risk arises from the risk that the value of an asset or liability will fluctuate due to changes in market interest rates (i.e. for fixed interest rate assets or liabilities) or that future cash flows will fluctuate due to changes in interest rates (i.e. for floating rate assets or liabilities).
Interest rate exposure and sensitivity As stated in the accounting policies, the University’s bond liabilities are measured at amortized cost
using the effective interest rate method, rather than at fair value. The University has not invested in variable rate deposits or interest-bearing securities.
Interest rate risk is focused on the potential impact of interest rate changes on the fair value of investments in fixed interest securities.
At 31 July 2014 the University held £15.0m (2013: £17.7m) of corporate and overseas government bonds with fixed interest.
Risk management policies and procedures The University takes into account the possible effects of a change in interest rates on the fair value and
cash flows of the interest-bearing financial assets and liabilities when making investment decisions.
c(iii) Other price risk
Price risk is the risk that the value of an asset or liability will fluctuate due to changes in market price (other than those arising from currency risk or interest rate risk), caused by factors specific to the individual financial instrument or its issuer, or factors affecting all similar financial instruments traded in the market.
This is a key risk for the University because of the significance of the endowments and other funds invested in the CUEF and the dependence of future plans on maintaining the value of CUEF units in real terms.
Concentration of exposure to other price risk As the majority of the CUEF’s investments are carried at fair value, all changes in market conditions will
directly affect the University’s net assets. The fund’s asset allocation at the reporting date is shown in note 25.
36 Financial risk management (continued)

Reports and Financial Statements 101
Notes to the accounts
37 Fair value Debtors and current liabilities are stated in the Group balance sheet at book values which are not
materially different from their fair values. The Bond liabilities are measured at amortised cost of £342.3m (2013: £342.3m, see note 19), whereas the fair value of the Bond liabilities at 31 July 2014 was £370m (2013: £330m) based on trading nearest to the balance sheet date. The book values of the Group’s other financial assets and liabilities shown on the balance sheet are the same as the fair values.
The following table categorises the fair values of the Group’s investment assets and liabilities based on the inputs to the valuation. Categorisation within the hierarchy has been determined on the basis of the lowest level input that is significant to the fair value measurement of the relevant asset as follows:
Level 1: Valued using quoted prices in active markets for identical assets. Level 2: Valued by reference to valuation techniques using observable inputs other than quoted prices
included within Level 1. Level 3: Valued by reference to valuation techniques using inputs that are not based on observable
market data.
Fair value measurements using the FRS 29 fair value hierarchies Level 1£m
Level 2£m
Level 3£m
Total £m
Investment assets at fair value as at 31 July 2014CUEF: Quoted investments 816.3 – – 816.3
Unquoted investments – 1,312.6 29.8 1,342.4 Derivative financial instruments asset positions 25.0 – – 25.0 Cash in hand and at investment managers 67.3 56.9 – 124.2
Total CUEF assets 908.6 1,369.5 29.8 2,307.9 Other quoted investments 28.6 – – 28.6 Other unquoted investments – 69.5 42.4 111.9 Investment properties – 100.8 – 100.8 Money market investments 313.0 – – 313.0 Cash in hand and at investment managers 6.0 71.5 – 77.5
Total investment assets at fair value 1,256.2 1,611.3 72.2 2,939.7 Derivative financial instruments liability positions (CUEF) (24.0) – – (24.0)
Total investments at fair value at 31 July 2014 1,232.2 1,611.3 72.2 2,915.7

102 University of Cambridge Annual Report 2014
Notes to the accounts
37 Fair value (continued)
Investment assets at fair value as at 31 July 2013
The following analysis differs from that presented in the 2013 financial statements, having been restated following the receipt of additional information from the University’s custodian.
Level 1£m
Level 2£m
Level 3£m
Total £m
CUEF: Quoted investments 781.4 – – 781.4 Unquoted investments – 1,151.0 30.3 1,181.3 Derivative financial instruments asset positions 103.7 – – 103.7 Cash in hand and at investment managers 53.6 118.2 – 171.8
Total CUEF assets 938.7 1,269.2 30.3 2,238.2 Other quoted investments 28.0 – – 28.0 Other unquoted investments – 84.8 46.4 131.2 Investment properties – 67.3 – 67.3 Money market investments 353.0 – – 353.0 Cash in hand and at investment managers 12.5 74.9 – 87.4
Total investment assets at fair value 1,332.2 1,496.2 76.7 2,905.1 Derivative financial instruments liability positions (CUEF) (101.3) – – (101.3)
Total investments at fair value at 31 July 2013 1,230.9 1,496.2 76.7 2,803.8
A reconciliation of the opening and closing balances for Level 3 assets measured at fair value is detailed in the table below:
Fair value 1 August 2013 76.7 Purchases less sales proceeds (6.7)Total gains / (losses) 2.2 Transfers into Level 3 –Transfers out of Level 3 –
Fair value 31 July 2014 72.2
Unquoted investments include investments in hedge funds, private equity funds and property funds. The fair values of unquoted investments and derivative financial instruments held through pooled funds and partnerships are based on valuations of the underlying investments as supplied to the University’s custodian by the administrators of those funds or partnerships. The Council considers that no reasonably foreseeable change to key assumptions in the Level 3 valuations would result in a significant change in fair value. Transfers into and out of Level 3 occur when the classification of the underlying assets and liabilities of these funds changes.

Reports and Financial Statements 103


![scriptureworkshop.com · the ending of Nehemiah and connects it with what readers can see running through his 600-plus-page commentary: "[Nehemiah] proved to be an extraordinary leader](https://static.fdocuments.in/doc/165x107/5ecd20e1cfa9ad74ee0e9cfb/the-ending-of-nehemiah-and-connects-it-with-what-readers-can-see-running-through.jpg)


![Universal Multiple-Octet Coded Character Set International ...[1993a] Mastronade, Donald J. – Euripides Phoenissae. Edited with introduction and commentary. – Cambridge 1993, ISBN](https://static.fdocuments.in/doc/165x107/60b5f6f7e588472af51134b4/universal-multiple-octet-coded-character-set-international-1993a-mastronade.jpg)

![Berlioz’s Orchestration Treatise - Assets€¦ · Berlioz’s orchestration treatise: a translation and commentary/[translation, commentary by] Hugh Macdonald. p. cm. – (Cambridge](https://static.fdocuments.in/doc/165x107/5ebff74880edf7600f4a44fa/berliozas-orchestration-treatise-assets-berliozas-orchestration-treatise.jpg)


