
reports-archive.adm.cs.cmu.edureports-archive.adm.cs.cmu.edu/anon/anon/home/ftp/2010/... ·...
173
Privacy-Preserving Distributed, Automated Signature-Based Detection of New Internet Worms Hyang-Ah Kim May 2010 CMU-CS-10-122 School of Computer Science Carnegie Mellon University Pittsburgh, PA 15213 Thesis Committee: David R. O’Hallaron, Co-Chair Dawn Song, Co-Chair Brad Karp, University College London Vern Paxson, ICSI Submitted in partial fulfillment of the requirements for the degree of Doctor of Philosophy c 2010 Hyang-Ah Kim This work is sponsored in part by the National Science Foundation under Grants CNS-0509004 and IIS-0429334, in part by a subcontract from the Southern California Earthquake Center’s CME Project as part of NSF ITR EAR-01-22464, and in part by support from the Intel Corporation, and Carnegie Mellon CyLab. Any opinions, findings, and conclusions or recommendations expressed in this material are those of the author and do not necessarily reflect the views of NSF, the Intel Corporation, Carnegie Mellon CyLab, or other funding parties.
Transcript of reports-archive.adm.cs.cmu.edureports-archive.adm.cs.cmu.edu/anon/anon/home/ftp/2010/... ·...

Privacy-Preserving Distributed, AutomatedSignature-Based Detection of New Internet
Worms
Hyang-Ah KimMay 2010
CMU-CS-10-122
School of Computer ScienceCarnegie Mellon University
Pittsburgh, PA 15213
Thesis Committee:David R. O’Hallaron, Co-Chair
Dawn Song, Co-ChairBrad Karp, University College London
Vern Paxson, ICSI
Submitted in partial fulfillment of the requirementsfor the degree of Doctor of Philosophy
c© 2010 Hyang-Ah Kim
This work is sponsored in part by the National Science Foundation under Grants CNS-0509004 and IIS-0429334,in part by a subcontract from the Southern California Earthquake Center’s CME Project as part of NSF ITREAR-01-22464, and in part by support from the Intel Corporation, and Carnegie Mellon CyLab.
Any opinions, findings, and conclusions or recommendations expressed in this material are those of the authorand do not necessarily reflect the views of NSF, the Intel Corporation, Carnegie Mellon CyLab, or other fundingparties.

Keywords: Internet Worm Containment, Worm Signature Generation, Content Preva-lence Analysis, Privacy-Preserving Collaboration, Distributed Monitoring


Abstract
This dissertation develops techniques, based on monitoring network traffic, that automatesignature generation for wide-spreading malicious payloads such as Internet worms. Fastsignature detection is required to achieve effective content-based filtering. The main thesis isthat content prevalence analysis in network payloads across distributed networks is a goodbasis for automated signature generation for wide-spreading malicious payloads, and canbe performed without compromising the privacy of participating networks.
Content-prevalence analysis extracts unique payload patterns that are identical and in-variant over all the flows that convey a wide-spreading malicious payload. Distributedmonitoring enables us to rapidly capture many sample payloads, thus expediting the sig-nature generation. Extra care for privacy encourages more networks to participate in thedistributed monitoring and makes the approach practical.
The first part of this dissertation presents a system, Autograph, that generates networkpayload signatures for Internet worms by utilizing the content invariance and wide-spreadingcommunication patterns of Internet worm traffic. Signature generation speed is improvedfurther by extending Autograph to share port scanner lists with distributed Autograph mon-itors. Trace-driven simulation shows the fundamental trade-off between early generation ofsignatures for novel worms and specificity of the generated signatures.
Distributed monitoring is a recognized technique in security to expedite worm detection.However, extra care for privacy must be taken. The second part of the dissertation presentstwo techniques for privacy-preserving distributed signature generation. HotItemID pro-tects the data and owner privacy by using sampling techniques and hiding private data ina crowd. Another technique protects privacy using privacy-preserving multiset operationframework. The technique relies on a semantically secure homomorphic cryptosystem andarithmetic operations over polynomial representation of sets. Both techniques protect pri-vacy based on the assumption that a payload appearing in multiple locations should not beprivate. The dissertation confirms the assumption by studying real network traffic traces,and shows that privacy-preserving distributed worm signature detection is feasible.
v

vi

Acknowledgments
I am deeply grateful to my advisors, David R. O’Hallaron and Dawn Song. David has of-fered advice on which classes to take, how to do research, write papers, and give talks,interact with collegues, and hack systems. He was also my English teacher. He providedme much more freedom than any student could ask for, but was always there to listen,help, and encourage whenever I was lost and needed his help, and never gave up on me.Dawn has provided many constuctive feedbacks and advices on what to read and how toapproach problems. Her enthusiasic and energetic attitute, and breadth of knowledge insecurity, cryptography, and privacy, was impressive and she was one of my role models inmy graduate school life.
I would like to thank Brad Karp, who served as my unofficial advisor and later my thesiscommittee member. I met Brad when I did internship in Intel Research Pittsburgh. Hewas my advisor in Intel and we developed Autograph together. He guided me through thedesign and implementation of the system from defining the problem, getting resources, towriting papers, giving presentations, and releasing the code of Autograph as open-source.
I would also like to thank my thesis committee member, Vern Paxson for his feedbackand support. Much of his work in network-based intrusion detection, measurement, andworm analysis were the foundations of my work. I deeply appreciated his detailed andconstructive comments on my thesis.
I would also like to thank professors in Carnegie Mellon, Michael Reiter, Hui Zhang,Srinivasan Seshan, Peter Steenkiste, Satya, Mor Harchol-Balter, and Garth Gibson, for theirvaluable advice which was not limited only on research. I would like to thank all of mycolleagues and coauthors, Yinglian Xie, Lea Kissner, and those who often attended networkseminars, listened to my talks, and gave many valuable comments.
I am grateful to Vern Paxon of ICSI, Sue Moon and her students of KAIST, Yong Lee andHyong Kim of KISA and Cylab-Korea, Casey Helfrich and James Gurganus of Intel ResearchPittsburgh, for their support that granted me the access to traces and analysis infrastructure,and for valuable feedback on my work. Without their support, I couldn’t write this thesis.
vii

Many people made my years at Carnegie Mellon enjoyable and memorable. I’d like tothank all of my friends and classmates, including but not limited to: Hisun Kim, YejongKim, Keywon Chong, Sungwoo Park, Sehyun Yang, Mukesh Agrawal, Maverick Wu, Soy-oung Park, Rajesh Balan, Amit Manjhi, Yiannis Koutis, Stavros Harizopoulos, Stratos Pa-padomanolakis, Bianca Schroder, Tiankai Tu, Julio Lopez.
The Computer Science Department and Carnegie Mellon has been an excellent educa-tional environment which supported me throughout the course of this work. I’d like tothank all of my teachers. I would like to thank all those who made the gears run smoothly,including Sharon Burks, Deborah Cavlovich, Catherine Copetas, and Barbara Grandillo.
I would like to thank my feline friends Kiki and Aki.Most of all, I am grateful to my family, Mom and Dad, my sister Heejoo and brother
Kangwon, my best friend and now my husband Spiros Papadimitriou and his parents. With-out their constant love, support, and encouragement, none of this would have been possible.
viii

Contents
1 Introduction 11.1 Wide-spreading Malicious Payloads . . . . . . . . . . . . . . . . . . . . . . . . 2
1.1.1 Network Viruses and Worms . . . . . . . . . . . . . . . . . . . . . . . . 2
1.1.2 E-mail Spams . . . . . . . . . . . . . . . . . . . . . . . . . . . . . . . . . 3
1.1.3 Link Spams . . . . . . . . . . . . . . . . . . . . . . . . . . . . . . . . . . 4
1.2 Worm Defense and Challenges . . . . . . . . . . . . . . . . . . . . . . . . . . . 5
1.3 Technical Approaches . . . . . . . . . . . . . . . . . . . . . . . . . . . . . . . . 8
1.4 Contributions and Dissertation Outline . . . . . . . . . . . . . . . . . . . . . . 9
I Content-based Automated Signature Generation 11
2 Introduction 132.1 Background and Motivation . . . . . . . . . . . . . . . . . . . . . . . . . . . . . 14
2.2 Desirable Properties . . . . . . . . . . . . . . . . . . . . . . . . . . . . . . . . . 15
2.3 Outline of Part I . . . . . . . . . . . . . . . . . . . . . . . . . . . . . . . . . . . . 18
3 Automated Worm Signature Generation using Content Prevalence Analysis 193.1 Autograph System Overview . . . . . . . . . . . . . . . . . . . . . . . . . . . . 20
3.2 Selecting Suspicious Traffic . . . . . . . . . . . . . . . . . . . . . . . . . . . . . 21
3.3 Content-Based Signature Generation . . . . . . . . . . . . . . . . . . . . . . . . 23
3.3.1 COPP: COntent-based Payload Partitioning Algorithm . . . . . . . . . 23
3.3.2 Selecting Prevalent Content Blocks . . . . . . . . . . . . . . . . . . . . . 24
3.3.3 Innocuous Traffic Included in Suspicious Flow Pool . . . . . . . . . . . 25
3.4 Evaluation: Local Signature Generation . . . . . . . . . . . . . . . . . . . . . . 27
3.4.1 Offline Signature Generation on DMZ Traces . . . . . . . . . . . . . . . 27
3.4.2 Polymorphic and Metamorphic Worms . . . . . . . . . . . . . . . . . . 34
ix
3.5 P2P Traffic and Signature Generation . . . . . . . . . . . . . . . . . . . . . . . . 35
3.5.1 Empirical Results: False Positives . . . . . . . . . . . . . . . . . . . . . 36
3.5.2 P2P Application Traffic Properties . . . . . . . . . . . . . . . . . . . . . 37
3.5.3 Preventing Unspecific Signature Generation from P2P Traffic . . . . . 40
3.6 Attacks and Limitations . . . . . . . . . . . . . . . . . . . . . . . . . . . . . . . 42
3.7 Summary . . . . . . . . . . . . . . . . . . . . . . . . . . . . . . . . . . . . . . . . 43
4 Distributed Signature Generation with Port-Scanner List Sharing 45
4.1 Single vs. Multiple Monitors . . . . . . . . . . . . . . . . . . . . . . . . . . . . . 46
4.2 tattler: Distributed Gathering of Suspect IP Addresses . . . . . . . . . . . . . . 49
4.3 Bandwidth Consumption . . . . . . . . . . . . . . . . . . . . . . . . . . . . . . 51
4.4 Worm Payload Accumulation Speed . . . . . . . . . . . . . . . . . . . . . . . . 52
4.5 Online, Distributed, DMZ-Trace-Driven Evaluation . . . . . . . . . . . . . . . 53
4.6 Discussion . . . . . . . . . . . . . . . . . . . . . . . . . . . . . . . . . . . . . . . 55
4.7 Summary . . . . . . . . . . . . . . . . . . . . . . . . . . . . . . . . . . . . . . . . 57
II Privacy-Preserving Signature Generation 59
5 Introduction 61
5.1 Motivation for Distributed Payload Sharing . . . . . . . . . . . . . . . . . . . . 61
5.1.1 Random Scanning Worm Propagation Model . . . . . . . . . . . . . . . 62
5.1.2 Localized Scanning Worms . . . . . . . . . . . . . . . . . . . . . . . . . 64
5.1.3 Why Distributed? . . . . . . . . . . . . . . . . . . . . . . . . . . . . . . . 67
5.2 Privacy Consideration . . . . . . . . . . . . . . . . . . . . . . . . . . . . . . . . 68
6 A Framework for Distributed Payload Sharing 69
6.1 Distributed Payload Sharing Framework . . . . . . . . . . . . . . . . . . . . . 69
6.1.1 Honeypot . . . . . . . . . . . . . . . . . . . . . . . . . . . . . . . . . . . 73
6.1.2 Analysis of GSD . . . . . . . . . . . . . . . . . . . . . . . . . . . . . . . 73
6.1.3 Analysis of LSD . . . . . . . . . . . . . . . . . . . . . . . . . . . . . . . . 74
6.2 Simulation Results . . . . . . . . . . . . . . . . . . . . . . . . . . . . . . . . . . 76
6.3 Legitimate Traffic . . . . . . . . . . . . . . . . . . . . . . . . . . . . . . . . . . . 78
6.4 Summary . . . . . . . . . . . . . . . . . . . . . . . . . . . . . . . . . . . . . . . . 81
x
7 Preserving Privacy using HOTITEM-ID 87
7.1 Overview . . . . . . . . . . . . . . . . . . . . . . . . . . . . . . . . . . . . . . . . 87
7.1.1 Adversary Model . . . . . . . . . . . . . . . . . . . . . . . . . . . . . . . 88
7.1.2 Correctness and Privacy Protection . . . . . . . . . . . . . . . . . . . . 88
7.2 HOTITEM-ID Protocol . . . . . . . . . . . . . . . . . . . . . . . . . . . . . . . . 89
7.2.1 Approximate Heavy-Hitter Detection . . . . . . . . . . . . . . . . . . . 90
7.2.2 One-Show Tags . . . . . . . . . . . . . . . . . . . . . . . . . . . . . . . . 91
7.2.3 Approximate Distinct Element Counting . . . . . . . . . . . . . . . . . 93
7.2.4 Anonymous Communication . . . . . . . . . . . . . . . . . . . . . . . . 94
7.2.5 Distributed One-Show Tag Collection . . . . . . . . . . . . . . . . . . . 94
7.2.6 Putting HOTITEM-ID to Work . . . . . . . . . . . . . . . . . . . . . . . 95
7.2.7 Correctness Analysis of HOTITEM-ID . . . . . . . . . . . . . . . . . . . 95
7.2.8 Privacy in HOTITEM-ID . . . . . . . . . . . . . . . . . . . . . . . . . . . 99
7.3 Distributed Worm Signature Detection . . . . . . . . . . . . . . . . . . . . . . . 100
7.3.1 Candidate Signature Advertisement (LSD) . . . . . . . . . . . . . . . . 103
7.3.2 Suspicious Payload Sharing (GSD) . . . . . . . . . . . . . . . . . . . . . 104
7.4 Experimental Results . . . . . . . . . . . . . . . . . . . . . . . . . . . . . . . . . 104
7.4.1 Simulation Method . . . . . . . . . . . . . . . . . . . . . . . . . . . . . . 105
7.4.2 Bandwidth Consumption and Accuracy . . . . . . . . . . . . . . . . . . 107
7.5 Summary . . . . . . . . . . . . . . . . . . . . . . . . . . . . . . . . . . . . . . . . 109
8 Preserving Privacy using Privacy-Preserving Multiset Operations 111
8.1 Problem Definition . . . . . . . . . . . . . . . . . . . . . . . . . . . . . . . . . . 112
8.2 Preliminaries . . . . . . . . . . . . . . . . . . . . . . . . . . . . . . . . . . . . . . 113
8.2.1 Threshold Homomorphic Cryptosystem . . . . . . . . . . . . . . . . . 113
8.2.2 Privacy-Preserving Set Operations . . . . . . . . . . . . . . . . . . . . . 114
8.3 Protocols . . . . . . . . . . . . . . . . . . . . . . . . . . . . . . . . . . . . . . . . 116
8.3.1 Basic Protocol . . . . . . . . . . . . . . . . . . . . . . . . . . . . . . . . . 116
8.3.2 Extended Protocol for Reducing Computational Cost . . . . . . . . . . 116
8.3.3 Approximate Payload Pattern Counting . . . . . . . . . . . . . . . . . . 118
8.4 Implementation . . . . . . . . . . . . . . . . . . . . . . . . . . . . . . . . . . . . 118
8.5 Experimental Results . . . . . . . . . . . . . . . . . . . . . . . . . . . . . . . . . 119
8.6 Summary . . . . . . . . . . . . . . . . . . . . . . . . . . . . . . . . . . . . . . . . 121
xi

9 Related Work 1259.1 Automated Worm Signature Generation . . . . . . . . . . . . . . . . . . . . . . 1259.2 Distributed Monitoring . . . . . . . . . . . . . . . . . . . . . . . . . . . . . . . . 1279.3 Privacy-Preserving Hot Item Identification . . . . . . . . . . . . . . . . . . . . 128
10 Conclusions 13110.1 Desired Requirements Revisited . . . . . . . . . . . . . . . . . . . . . . . . . . 13110.2 Contributions . . . . . . . . . . . . . . . . . . . . . . . . . . . . . . . . . . . . . 13310.3 Lessons Learned . . . . . . . . . . . . . . . . . . . . . . . . . . . . . . . . . . . . 134
A Extended Protocol for Reducing Network Delay 137
xii
List of Figures
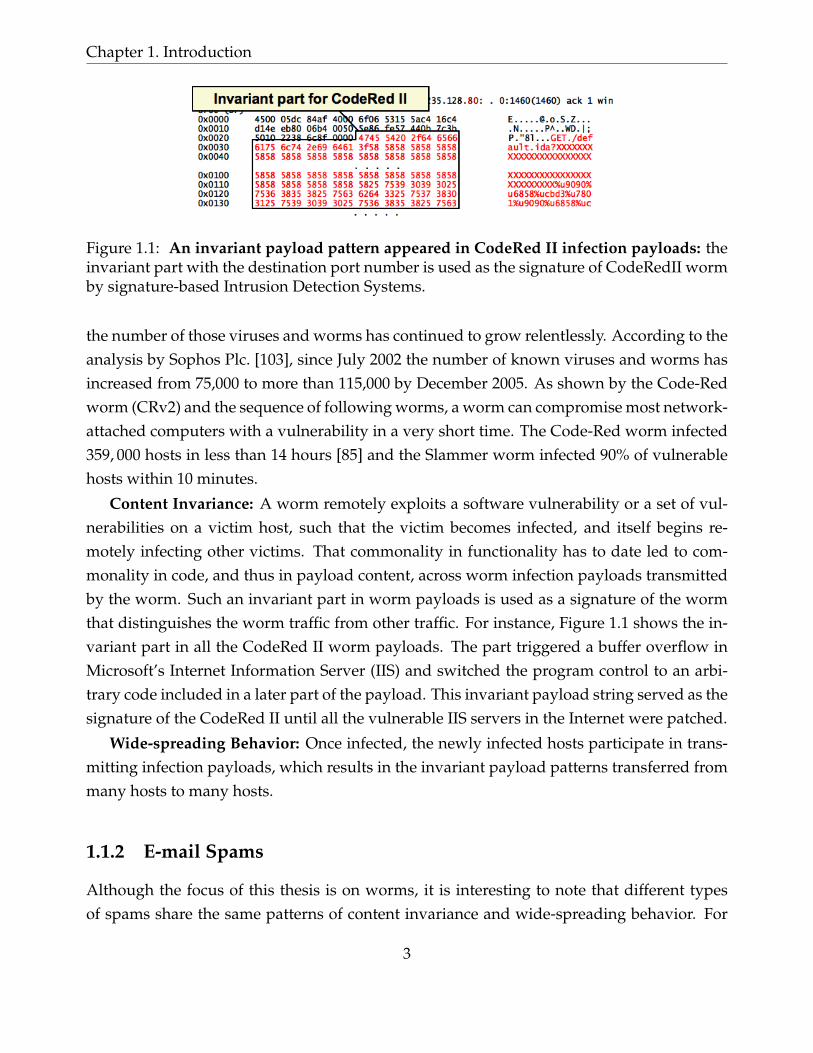
1.1 An invariant payload pattern appeared in CodeRed II infection payloads:the invariant part with the destination port number is used as the signatureof CodeRedII worm by signature-based Intrusion Detection Systems. . . . . . 3
2.1 Combinations of sensitivity and specificity. . . . . . . . . . . . . . . . . . . . 16
3.1 Architecture of an Autograph Monitor: A single Autograph monitor con-sists of 1) a suspicious flow selection stage and, 2) a content-based signaturegeneration stage. . . . . . . . . . . . . . . . . . . . . . . . . . . . . . . . . . . . 20
3.2 COPP with a breakmark of Rabin f ingerprint(“0007”) . . . . . . . . . . . . . 24
3.3 Prevalence histogram of content blocks, a=64 bytes, ICSI2 DMZ trace, day 3(24 hrs): Content blocks from misclassified innocuous flows in the suspiciousflow pool form the tail of the prevalence distribution, while content blocksfrom worm flows top the prevalence histogram. . . . . . . . . . . . . . . . . . 26
3.4 Prevalence of Selected Content Blocks in Suspicious Flow Pool, ICSI DMZtrace (24 hrs): Most flows are worms except for a few misclassified flows.Autograph generates signatures for every worm in the pool. . . . . . . . . . . 29
3.5 Sensitivity and Efficiency of Selected Signatures, ICSI DMZ trace (24 hrs):Sensitivity represents the fraction of true positives. Efficiency represents thefraction of true positives to all flagged flows. . . . . . . . . . . . . . . . . . . . 31
3.6 Number of Signatures, ICSI DMZ trace (24 hrs): For IDS efficiency, a smallernumber of signatures is preferred. . . . . . . . . . . . . . . . . . . . . . . . . . 32
3.7 Content block size vs. number of signatures: Autograph finds a short sig-nature that match all instances of a polymorphic worm if content block sizeparameters (m: minimum content block size) are set to small values. . . . . . 34
xiii
3.8 Unspecific Signatures Generated by Autograph: port 9493 is used by a P2P-based file sharing system. The system uses HTTP. SIG1 belongs to the headerof messages that indicates the version of application software. SIG2 is froma query message. Private parts are sanitized with XX. SIG3 is from a websearch crawler, and SIG4 is from HTTP ending. Except the SIG2, generatingsignature blacklist for them is not difficult. . . . . . . . . . . . . . . . . . . . . 37
3.9 Ports used by P2P applications . . . . . . . . . . . . . . . . . . . . . . . . . . . . 38
3.10 CDF of Payload Pattern Strings for Each P2P Application: there are non-negligible
fraction of frequently appearing P2P payload pattern strings. Because of multicast
search requests, more than 5% of patterns from FileGuri traffic appear more than
once. eDonkey patterns have less similarity across requests, but one of the payload
patterns in eDonkey traffic appeared 2666 times. . . . . . . . . . . . . . . . . . . . 39
3.11 Number of external peers of P2P hosts and non-P2P hosts: CDF of internal hosts
based on the number of external peers. P2P hosts tend to communicate with many
hosts. More than 50% of P2P hosts were contacted by more than 10 external hosts for
5 minutes, while most non-P2P hosts were contacted by less than ten external hosts.
This trend could look like the address dispersion property of worm traffic. . . . . . . 40
3.12 Distinct source and destination counts per applications: Each dot represents the
number of distinct sources (x-axis) and destinations (y-axis) of a payload pattern that
appeared more than 10 times during a 10 minute time interval. Payload patterns
exchanged between many hosts satisfy address dispersion and content prevalence
criteria. Thus, signature generation systems that rely only on the two properties will
generate ’unspecific’ signatures based on the payload patterns. . . . . . . . . . . . 41
4.1 Infection progress for a simulated Code-RedI-v2-like worm. . . . . . . . . . 48
4.2 Payloads observed over time: single, isolated monitors. . . . . . . . . . . . . 48
4.3 Bandwidth consumed by tattler: during a Code-RedI v2 epidemic, for vary-ing numbers of deployed monitors. The peak bandwidth required by 10%deployment (630 monitors) is a mere 15Kbps. . . . . . . . . . . . . . . . . . . . 51
4.4 Payloads observed over time (with Tattler): tattler among 63 distributedmonitors. . . . . . . . . . . . . . . . . . . . . . . . . . . . . . . . . . . . . . . . . 52
4.5 Background “noise” flows classified as suspicious vs. time: with varyingport-scanner thresholds; ICSI DMZ trace. . . . . . . . . . . . . . . . . . . . . . 54
xiv
4.6 Early Signature Detection vs. Quality of Signature: (a) Fraction of vulner-able hosts uninfected when worm signature detected vs. θ, number of suspi-cious flows required to trigger signature detection. (b) Number of unspecificsignatures generated vs. θ, number of suspicious flows required to trigger sig-nature detection. . . . . . . . . . . . . . . . . . . . . . . . . . . . . . . . . . . . 55
5.1 Code-RedI-v2: Number of Received Worm Payloads vs. Network Size. (a)Simulated Code-RedI-v2 propagation with scanning rate S=358 probes/minute.(b) The actual number of received worm payloads depends on the size m ofthe monitored network. . . . . . . . . . . . . . . . . . . . . . . . . . . . . . . . 62
5.2 Slammer: Number of Received Worm Payloads vs. Network Size. (a) Sim-ulated Slammer propagation with scanning rate S=4000 probes/minute. (b)The actual number of received worm payloads depends on the size m of themonitored network. . . . . . . . . . . . . . . . . . . . . . . . . . . . . . . . . . 63
5.3 Spam source IP distribution: is highly non-uniform. Only 9387 /16 networksinvolved in the identified spam activities. This non-uniformity in vulnerablehost distribution makes localized scanning worms propagate faster than ran-dom scanning worms. . . . . . . . . . . . . . . . . . . . . . . . . . . . . . . . . 65
5.4 Scanning Strategies vs. Propagation Speed: the non-uniformity of vulner-able host distribution makes LS more effective. With a high local scanningpreference value q, LS can infect most of the vulnerable hosts in the same /lnetwork immediately after a host is infected. . . . . . . . . . . . . . . . . . . . 66
5.5 Monitored network size vs. Number of worm payloads: the number of ac-cumulated worm payloads when 5% of vulnerable hosts are infected by LS(S=6000/min, q=0.5, l=16). The monitor (MAX) close to infected hosts mayaccumulate more than 105 payloads. . . . . . . . . . . . . . . . . . . . . . . . . 67
6.1 GSD Framework Overview . . . . . . . . . . . . . . . . . . . . . . . . . . . . . 70
6.2 LSD Framework Overview . . . . . . . . . . . . . . . . . . . . . . . . . . . . . 71
6.3 Content Blocks in Suspicious Flow Pool and Payload Sharing Thresholds:Prevalence histogram generated from the suspicious flow pool for port 9493traffic. For an hour, hundreds content blocks were generated, but only contentblocks whose f (P) exceed θG are shared in GSD. If f (P) exceeds λG , P isreported as a candidate signature in LSD. Only a handful number of contentblocks pass the threshold conditions. . . . . . . . . . . . . . . . . . . . . . . . 72
xv
6.4 1024 GSD Monitors: Signature Detection Probability vs. θG, λG and in-fection rate I(t). The white cells indicate that GSD finds a signature for oursimulated Code-RedI-v2 worm with a probability of 1 when the combinationof corresponding λG and θG is used. The signature detection probability isgoverned mostly by θG in random scanning worm signature detection. . . . . 75
6.5 128 GSD Monitors: Signature Detection Probability vs. θG, λG and infec-tion rate I(t). Since the total number of monitors is only 128, the global thresh-old λG should be selected accordingly. If we use a local threshold θG lowerthan 5 and a global threshold λG lower than 38, we can detect the signature ofthis example random worm before 2% of hosts are infected. . . . . . . . . . . 75
6.6 Random Scanning Worm Detection Time: Time is measured as the fractionof infected hosts when the detection system completes a signature identifi-cation. GSD with 128 213 IP address spaces detects the signature when lessthan 0.1% of vulnerable hosts are infected. LSD with 128 monitors detects thesignature when less than 0.2% of hosts are infected. . . . . . . . . . . . . . . . 78
6.7 Localized Scanning Worm Detection Time: Time is measured as the fractionof infected hosts when the system completes a signature identification. GSDwith more than 128 213 IP address space detects about 2% of hosts are infected.LSD outperforms a 216 IP address space monitor when the lag is lower than 1minute. . . . . . . . . . . . . . . . . . . . . . . . . . . . . . . . . . . . . . . . . . 79
6.8 Payload Pattern Sharing: HTTP port 80 traffic. Breakdown of content blocksbased on the number of networks reporting the same content block. Eachnumber on top of a bar shows the total number of content blocks that arereported by the monitor. With a higher local threshold (θG = 2), most contentblocks are filtered out. For example, the monitor in net2 reported 3 contentblocks in total but none of them appeared in other networks. Those contentblocks. . . . . . . . . . . . . . . . . . . . . . . . . . . . . . . . . . . . . . . . . . 83
6.9 Payload Pattern Sharing: SMTP port 25 traffic. . . . . . . . . . . . . . . . . . . 84
6.10 Payload Pattern Sharing: p2p port 9493 traffic. . . . . . . . . . . . . . . . . . 85
xvi
7.1 Components of HOTITEM-ID protocol: HOTITEM-ID defines how to effi-ciently compute an approximate representation of Rλ in distributed fashion.Each monitor i (0 ≤ i < M) constructs local filters to approximately representhis private input set Si, generates one-show tags for marked bits in filters,and sends a subset of those one-show tags to the network using anonymousrouting. Those tags in the network are aggregated using a distributed count-ing protocol that estimates the number of distinct elements. At the end of theprotocol, all monitors learn the global filters that approximate Rk. At the rightside of the figure we list the purpose of each component. . . . . . . . . . . . . 90
7.2 Approximate Heavy Hitter Detection: In our HOTITEM-ID protocol, eachplayer i constructs a set of local filters from his private input set Si (darkbits are ‘hit’). The players then construct global filters using an approximatecounting scheme; if a bit was hit by at least λ players, then it is ‘hit’ (dark) aswell. If an element hashes to a dark bit in each of the global filters, then it isclassified as hot. . . . . . . . . . . . . . . . . . . . . . . . . . . . . . . . . . . . . 91
7.3 The degree of data privacy for an element with frequency FP is Φ(FP)|M| . We graph
this function in (a), showing the increase in protection for items that show up in
few players’ inputs. The same function is graphed in (b) on a logarithmic scale, for
increased detail. Note that rare items are indistinguishable from a large proportion
of the domain, giving them a large degree of data-privacy. . . . . . . . . . . . . . . 101
7.4 Number of hosts vs. Innocuous content blocks: Number of unique hosts thatreport each content block. The content blocks are generated from suspiciousflows collected for 1 hour time window. . . . . . . . . . . . . . . . . . . . . . . 106
7.5 Normalized bandwidth consumption per player in performing hot itemidentification (λG = 100): Numbers in parentheses denote cases with falsenegatives. Underlines denote cases with false positives. Numbers in boldface fonts are the most efficient but accurate cases in each set of experiments. 108
8.1 Modified THRESHOLD-SET-UNION-HBC Protocol: secure against honest-but-curious adversaries . . . . . . . . . . . . . . . . . . . . . . . . . . . . . . . . . . 122
8.2 Running time for one THRESHOLD-SET-UNION-HBC computation: (a) Therunning time increases quadratically to the number of monitors M and theaverage set size E [Si]. (b) Running time vs. c (a threshold cryptosystem pa-rameter). E [Si] = 1. M=128. . . . . . . . . . . . . . . . . . . . . . . . . . . . . . 123
A.1 Components of new collection phase in the extended protocol. . . . . . . . . 139
xvii

xviii

List of Tables
3.1 Autograph’s signature generation parameters. . . . . . . . . . . . . . . . . . . 273.2 Summary of traces. . . . . . . . . . . . . . . . . . . . . . . . . . . . . . . . . . . 28
7.1 Traces and the number of generated content blocks . . . . . . . . . . . . . . . 106
8.1 Speed (ms) of operations of 1024-bit threshold Paillier cryptosystem . . . . . . 120
xix

xx
Chapter 1
Introduction
Attacks by Internet worms, viruses, and unwanted e-mails such as spams have threatenedthe Internet since its inception [118]. Although much work has been done to prevent suchattacks, the threat does not seem to diminish. Rather, the volume, intensity, and severityof attacks has increased as modern society relies more on the Internet, and attackers findthe ways to profit from them [132, 143, 53]. A trend analysis reports that since July 2002the number of known viruses has increased from 75,000 to more than 115,000 by December2005 [103].
Attacks aim to reach as many computers and users as possible in a short period of time.Internet worms and viruses expedite their propagation by using infected computers to infectthe next victims. Spammers launch million copies of advertisement messages to distributedhosts using automated spam tools from multiple computers. Such wide-spreading maliciouspayloads share some common communication patterns: 1) relying on many-to-many commu-nication to reach multiple thousands of computers quickly, and 2) having unique byte pat-terns that are invariant across all the payload instances.1 The byte patterns that distinguishwide-spreading malicious payloads from other legitimate traffic are called the signatures ofthe malicious payload.
Our thesis is that content prevalence analysis in network payloads across distributed networksis a good basis for automated signature generation for wide-spreading malicious payloads, and can beperformed without compromising the privacy of participating networks.
In this dissertation, we show the validity of our thesis by applying the privacy-preservingdistributed content prevalence analysis approach to develop automated signature genera-
1It is believed that spam e-mails have varying content to avoid spam filtering. However, many of spame-mails still have advertisers’ URLs or similar contact information the potential clients can use to contact them,and such information is hard to change.
1
1.1. Wide-spreading Malicious Payloads
tion systems for novel Internet worms. The approach is generally applicable to a broaderrange of wide-spreading malicious payload detection such as spam messages and networkvirus detection, if such malicious activities involve the transmission of unique, identicalpayload patterns from multiple computers to a large number of computers.
The rest of this chapter examines the traffic patterns of wide-spreading malicious payloadtransmission; gives an overview of automated worm containment based on content-basedfiltering; introduces our technical approach to build the automated signature generationsystem; and discusses the key contributions of this dissertation.
1.1 Wide-spreading Malicious Payloads
Modern Internet attacks attempt to infect or damage as many victims as possible beforebeing detected. Thus, they often employ automated propagation techniques and launch at-tacks from multiple hosts. In this section, we survey three common Internet attacks: worms,e-mail spams, and blog comment spams. The survey suggests that the traffic from theseattacks exhibits the following characteristics of typical wide-spreading malicious payloads:
• Content Invariance: all flows over which wide-spreading malicious payloads spreadcontain an identical, invariant portion of payload if it exploits a specific vulnerabilityor its goal is to advertise a certain piece of information.
• Wide-spreading Behavior: they propagate from many sources to many destinationsso that they can contact millions of destinations quickly.
1.1.1 Network Viruses and Worms
Network viruses and worms are self-replicating programs. Originally, the term virus wasused for a program that inserts a possibly evolved copy of itself into a host, including op-erating systems, to propagate. Unlike a virus that requires a user to activate it, a worm isself-contained and propagates without any human intervention by exploiting a softwarevulnerability on remote computers [113]. Elimination of human intervention allows a care-fully crafted worm to spread over many vulnerable hosts at high speed. Infectious programssuch as the Nimda worm [20] propagate using both virus-like and worm-like schemes sothat the distinction between viruses and worms has blurred.
After the Morris worm infected 10% of ARPANET hosts [37], worms and network viruseshave drawn much attention from the research community and the governments. However,
2
Chapter 1. Introduction
Figure 1.1: An invariant payload pattern appeared in CodeRed II infection payloads: theinvariant part with the destination port number is used as the signature of CodeRedII wormby signature-based Intrusion Detection Systems.
the number of those viruses and worms has continued to grow relentlessly. According to theanalysis by Sophos Plc. [103], since July 2002 the number of known viruses and worms hasincreased from 75,000 to more than 115,000 by December 2005. As shown by the Code-Redworm (CRv2) and the sequence of following worms, a worm can compromise most network-attached computers with a vulnerability in a very short time. The Code-Red worm infected359, 000 hosts in less than 14 hours [85] and the Slammer worm infected 90% of vulnerablehosts within 10 minutes.
Content Invariance: A worm remotely exploits a software vulnerability or a set of vul-nerabilities on a victim host, such that the victim becomes infected, and itself begins re-motely infecting other victims. That commonality in functionality has to date led to com-monality in code, and thus in payload content, across worm infection payloads transmittedby the worm. Such an invariant part in worm payloads is used as a signature of the wormthat distinguishes the worm traffic from other traffic. For instance, Figure 1.1 shows the in-variant part in all the CodeRed II worm payloads. The part triggered a buffer overflow inMicrosoft’s Internet Information Server (IIS) and switched the program control to an arbi-trary code included in a later part of the payload. This invariant payload string served as thesignature of the CodeRed II until all the vulnerable IIS servers in the Internet were patched.
Wide-spreading Behavior: Once infected, the newly infected hosts participate in trans-mitting infection payloads, which results in the invariant payload patterns transferred frommany hosts to many hosts.
1.1.2 E-mail Spams
Although the focus of this thesis is on worms, it is interesting to note that different typesof spams share the same patterns of content invariance and wide-spreading behavior. For
3
1.1. Wide-spreading Malicious Payloads
example, e-mail spam has become one of the greatest threats to the use of e-mail as a formof communication. The Messaging Anti-Abuse Working Group (MAAWG) estimates thatabout 80% of incoming mail is ”abusive email”2, as of the 1st quarter of 2006, after analyzing435.6 million mailboxes [83].
The severity of spams goes far beyond mere inconvenience. Unsolicited e-mail spamscost average U.S. organizations 1.4% of employee productivity, or $874 per employee peryear in 2003 [98]. Note that the total cost would be much higher if we included the extraoverhead due to overloaded e-mail systems and missing important e-mails. Besides adver-tisement, e-mail spams are also used for more malicious purposes, such as scam distribution,personal information collection, and virus propagation.
Content Invariance: Many spam-filtering techniques work by searching for patterns inheaders or bodies of e-mail messages. In order to avoid being detected, e-mail spams obfus-cate their message content by intentionally misspelling commonly-filtered words, insertingHTML comments between letters, or presenting the text as an image. Note, however, thatthe common purpose of spamming is to advertise products or to attract people to a fake website. Thus, spams often include URLs, phone numbers, or mail addresses. Obfuscating suchcontact information is not impossible but requires more effort than changing other parts ofe-mail messages. Our analysis with traces from a spam honeypot (total 411K spam e-mailsduring a week of Jan 2006) showed that 55% of e-mail spams contain some contact infor-mation in the forms of URL or e-mail addresses, even though content obfuscation is widelyused in the spamming community.
Wide-spreading Behavior: Spam traffic exhibits the many-to-many communication pat-tern. By definition, spams are sent to a large number of users. Because almost all Internetservice providers and mail service providers forbid the use of their services to send spam,spammers make use of open relays/proxies, bots, and infected hosts distributed in the In-ternet. Utilizing the fact that many e-mail spams hold the two properties of wide-spreadingmalicious payloads, several spam filtering techniques [133] have been proposed to detectspams.
1.1.3 Link Spams
Since mid-1990’s, link-based ranking algorithms, such as Google’s PageRank algorithm [13]have been widely used for web search. The rise of link-based ranking algorithms has spawned
2Because the precise definition of spam differs slightly from jurisdiction to jurisdiction in accordance withlocal laws, MAAWG avoids using the term ”spam” in this report. Abusive emails are communications thatseek to exploit the end user.
4
Chapter 1. Introduction
a new type of spams called link spam.Link spam is distributed by automatically posting random comments to publicly accessi-
ble web applications that accept and display hyperlinks submitted by visitors. Blogs, publicbulletin boards, web guestbooks, forums, and wikis are good targets for link spams. Addinghyperlinks (URL) pointing to the spammers’ intended web sites artificially increases thesites’ ranking in web search results computed with link-based ranking algorithms. An in-creased ranking often results in the spammer’s commercial site being listed ahead of othersites, increasing the number of potential visitors and customers.
Even though most web applications attempt to provide various filtering methods to pre-vent or reduce such annoying link spams, spammers have become smarter. Akismet, a blogspam filtering service [2], reports that spam comments account for 95% out of all commentsreported to the service, and the number of link spam continues to grow.
Content Invariance: Unlike e-mail spams, link spams always contain URL informationpointing to the intended web sites. It is not impossible for spammers to create link farms [56],with multiple web pages and make those pages point to an intended web site. However,utilizing many host and domain names is not as simple as e-mail spam message obfuscation.Spammers, thus, often reuse the same URLs or domain names when they post link spammessages in open blogs and open bulletin board systems. Those URLs posted by spammerscan be used as a signature to distinguish spam messages from legitimate messages.
Wide-spreading Behavior: Like other types of spam, link spam aims to be distributedin many web pages. In order to spread spam links on many web pages efficiently, spam-mers use automated spamming tools running on multiple computers, possibly a group ofcompromised machines or bots under attackers’ control.
Recently, these two properties have inspired collaborative spam filtering services suchas LinkSleeve [79], Akismet [2], and Eolin Anti-Spam [130] services. These techniques stripposted message of included URLs and keywords, and count the number of blogs that re-ceived the same URLs. If a threshold is exceeded, the message is more likely to be a spam.
1.2 Worm Defense and Challenges
Internet worms have exploited the relative lack of diversity in the software on Internet-attached hosts, and the ease with which those hosts can communicate. A worm program isself-replicating. It remotely exploits a software vulnerability on a victim host, such that thevictim becomes infected, and itself begins remotely infecting other victims. The severity ofthe worm threat goes far beyond mere inconvenience. The total cost of the Code Red worm
5
1.2. Worm Defense and Challenges
epidemic, as measured in lost productivity owing to interruptions in computer and networkservices, is estimated at $2.6 billion. Technology market researcher Computer Economicsestimated that the SQL Slammer worm cost between $750 million and $1 billion to clean up,which seemed less costly than the Code Red worm epidemic that impacted more machines.However, considering that the Slammer worm clogged and downed financial systems suchas banks networks and ATMs, many security experts argued that the Slammer worm wasworse than the Code Red worm [75]. A worm can install backdoors and abuse infected hostsfor Denial-of-Service attacks, spamming, and private information leakage. For example,many worms such as the Sasser worm [33], open backdoors on infected hosts and forma large botnet [107] through which worm writers can control compromised hosts. Wormwriters may choose to sell access to infected machines to black hats, which creates financialincentives for writing malicious worms [114].
Because worms can spread too rapidly for humans to respond [127, 140], automation ofworm defense is a key element in preventing worms. In recent years, the research com-munity has proposed various methods for automatically detecting and containing worms byquarantining infected hosts or filtering worm traffic. Broadly speaking, three chief strate-gies exist to filter worm traffic: 1) blocking all traffic destined for the ports on which wormsspread (port blocking), 2) blocking all traffic for the relevent ports from worm-infected hosts(source-address blocking), and 3) blocking all flows that exhibit anomalous payload or commu-nication patterns (signatures) that only a worm shows in its infection attempts (signature-based filtering). Filtering all traffic based on destination port alone can block legitimateInternet traffic. Moore et al. [89] compared the relative efficacy of source-address filteringand signature-based filtering. Their results show that signature-based filtering impedes thespreading of a worm more effectively, provided the signatures are discovered and deployedbefore the worm starts its exponential growth.
We can classify the signature into two groups based on what aspects of worm’s propertyit encodes:
• Network payload signatures are the unique byte patterns occurring in worm’s net-work payloads. Signature-based filters that use network payload signatures (content-based filtering) can block worm traffic within both networks and transport layers ofhosts. They do not need application-specific knowledge more than payload patterns.Cisco’s nbar [28], bro [102], snort [131] are examples of content-based filters using net-work payload signatures. Network payload signatures are simple and efficient to use.These content-based filtering techniques are quite mature compared to techniques us-ing different types of signatures. However, it is sometimes impossible to define net-
6
Chapter 1. Introduction
work payload signatures if a worm uses strong polymorphism or propagates over en-crypted channels. In this thesis, we focus on the systems that generate network pay-load signatures.
• Host payload signatures used in Shield [136], Vigilante [34], are usable by filters in-stalled immediately above the network stack of a host. Application-specific knowl-edge is required to generate those signatures. Because the filters operate at the ap-plication layer, they can handle IPSec-encrypted traffic. Encrypted messages abovethe transport layer are still difficult to detect, but researchers envision that appropri-ate programmable hooks, provided by applications and libraries, can enable to definemore powerful signatures and filtering policy [136]. Also, more powerful comparisonsthansimple pattern matching is feasible because the volume of traffic one host dealswith would be much less than the aggregated volume of traffic a content-based filteron network links has to handle. For example, one can choose a signature that tests ifthe length of a GET request copied to the stack exceeds 240 bytes in order to detectworms that exploit IIS .ida vulnerability.
• Network behavioral signatures [43] describe anomalous, spatial and temporal com-munication patterns observed from networks during a worm infection process. Forexample, a host infected by an aggressive, random-scanning worm may contact a sig-nificant number of hosts, and we can encode this fact as a network behavioral signa-ture. A worm that recruit participants of a botnet would make a connection to one ofthe master servers that control the botnet. Then, the list of master servers would bea signature if they are not used for legitimate communication. Behavioral signaturescan catch polymorphic and encrypted worms if the worms show obviously abnormalcommunication patterns. If normal traffic pattern changes or the worms’ propagationpatterns are similar to a normal traffic pattern, the signatures can cause false posi-tives. Compared to filters using payload signatures, filters using network behavioralsignatures require more memory and computation power because they must maintainall the communication history useful for correlation. Some systems such as Bro [102]can utilize behavioral signatures (policy, in bro language) but an automated system togenerate behavioral signatures is not yet available.
The basic premise when using signature-based filtering for automatic worm containmentis that signatures of a worm must be known beforehand. Unfortunately, today’s signaturedetection process requires human involvement, and thus is slow. For instance, when Ben
7
1.3. Technical Approaches
Koshy3 from W3 International Media first reported the Slammer worm propagation inci-dent to a mailing list 4, more than 5 hours had already passed since the worm was released.The delay included the time to notice a worm outbreak via out-of-band communication (i.e.,emails, newsgroups, phone, security companies’ help desks), capture worm traces, selectsignatures based on manual analysis, and publish/deploy them. According to Moore etal. [89], signatures should be deployed within 60 minutes of a worm’s release to containslow-spreading worms such as CodeRed, and within less than 5 minutes to contain fast-spreading worms such as Slammer. Staniford et al. citeWeaverWarchol demonstrated thata worm that is carefully designed to efficiently scan victims (hitlist, permutation-scanning,topological scanning, and efficient threading) can infect most vulnerable hosts before anyhuman intervention. Automation of worm signature detection is required to achieve effec-tive automated worm containment with content-based filtering.
An automated signature generation system must 1) generate signatures that catch all pos-sible variants of a worm, but not block legitimate traffic and 2) generate signatures quicklyenough to prevent global infection, 3) require minimal real-time operator intervention, 4)minimize the effect on legitimate Internet use, and 5) preserve privacy if information needsto be exchanged among multiple monitoring points.
In this dissertation, we present the design and implementation of a distributed, auto-mated worm signature generation system, Autograph, and evaluate the system based on theaforementioned requirements in designing an automated signature generation system. Au-tograph combines information from distributed monitors within an enterprise network or inhoneypots [125]. For fast and accurate signature generation, monitors from different sites inthe Internet can also exchange their observations. The signatures determined by Autographcan then be disseminated automatically to content filters in networks and hosts before theworm infects a significant fraction of vulnerable hosts.
1.3 Technical Approaches
As discussed in Section 1.1.1, worms have invariant parts in their payloads and their prop-agation shows a typical many-to-many communication pattern. We solve the automatedsignature generation problem by exploiting these properties:
3Ben Koshy has been credited with being one of the first persons to identify the Slammer worm.4Archives of the NTBUGTRAQ mailing list. http://listserv.ntbugtraq.com/archives/
ntbugtraq.html
8
Chapter 1. Introduction
• Content-prevalence analysis: Autograph analyzes the content of network flow pay-loads and chooses the most frequently occuring byte patterns as signatures. Two prop-erties of worms suggest that content-prevalence analysis is fruitful. First, all flows overwhich a worm spreads contain an identical, invariant portion of payload if the wormexploits a specific vulnerability. Second, a worm generates voluminous network trafficas it spreads, because of its self-propagating nature.
• Distributed monitoring: Autograph takes advantage of distributed monitoring. Thevolume of worm traffic one monitor observes will be small at the early stage of a wormepidemic or for slowly propagating worms. However, the aggregated volume thatmultiple monitors receive will be large. Intuitively, the more monitors we deploy, themore quickly we capture worm traffic. When a worm does not propagate randomlyor the vulnerability density across the Internet is not uniform, distributed monitoringhelps shorten the time needed to catch worm traffic. Moreover, distributed monitoringallows Autograph to utilize many exploit detectors with different server versions andconfigurations, to verify the quality of generated signatures.
• Privacy-preserving payload sharing: Autograph expedites signature detection by ag-gregating suspicious flow payloads observed by distributed monitors. However, thispayload sharing may compromise privacy. To allow privacy-protecting payload shar-ing, we rely on the observation that a single payload observed at many sites should notbe private, and thus may be shared as long as the payload providers are not disclosed.
1.4 Contributions and Dissertation Outline
This dissertation explores approaches for automatically and quickly generating Internetworms. Here are the specific contributions:
1. Distributed, automated worm signature generation: We present a new system, calledAutograph, that automatically generates payload signatures for Internet worms by com-bining suspicious flow selection heuristics and content-prevalence analysis on selectedflows (Chapter 3). We extend the system to share port scan reports among distributedmonitor instances. Using trace-driven simulation, we demonstrate the value of thistechnique in speeding the generation of signature for novel worms (Chapter 4).
2. Privacy-preserving distributed, content-prevalence analysis: We present a distributedpayload sharing framework that improves automated signature detection speed, and
9
1.4. Contributions and Dissertation Outline
validate our assumption on the privacy of globally prevalent payload pattern stringsby examining real network traces (Chapter 6). In distributed payload sharing, pri-vacy is the major concern. We present two privacy-preserving, distributed content-prevalence analysis techniques that disclose a payload pattern only when it belongs toworm traffic that is observed at multiple monitoring sites.
• The first technique meets the goal by applying HotItemID protocol [69], whichrelies an approximate counting techniques. This technique is suitable for an en-vironment where a large number of autonomous sites or hosts participate, andwhen a worm attacks a large fraction of those participating sites.
• The second technique derives from a privacy-preserving multiset operation frame-work that relies on a semantically secure homomorphic cryptosystem and arith-metic operations over polynomial representation of sets [70]. Combined withsampling, this technique can scale from tens to hundreds of participating moni-tors. To our knowledge, this is the first work that applies Threshold-Set-Intersectionframework in practice and evaluates its performance.
This thesis consists of two parts.In Part I, we focus on the automated signature detection technique that exploits worm’s
unique properties. Chapter 2 discusses the desired properties of automated signature gen-eration systems. Chapter 3 presents our system Autograph that automates signature genera-tion process by content prevalence analysis. Chapter 4 extends Autograph to use distributedmonitors for port-scanner detection.
In Part II, we explore techniques that allow information sharing beyond port-scanner IPaddresses, so allows collaborative suspicious flow accumulation. The information sharingmust preserve the privacy of participating networks. Chapter 5 motivates distributed pay-load sharing and discusses the privacy-related issues. Chapter 6 presents our distributedpayload sharing framework and its signature detection speed. Chapter 7 explores the ideaof hiding private data in a crowd using our HOTITEM-ID protocol. Chapter 8 presents an-other technique to build a privacy-preserving distributed signature generation system. Thesystem uses the theoretically proven privacy-preserving Threshold-Set-Intersection frame-work.
Finally, we review the related work in Chapter 9 and conclude by summarizing our find-ings and contributions in Chapter 10.
10
Part I
Content-based Automated SignatureGeneration
11


Chapter 2
Introduction
Today’s Internet intrusion detection systems (IDSes) monitor edge networks’ DMZs 1 toidentify and/or filter malicious flows. While an IDS helps protect the hosts on its localedge network from compromise and denial of service, it cannot alone effectively interveneto halt and reverse the spreading of novel Internet worms. Generation of the worm signa-tures required by an IDS—the byte patterns sought in monitored traffic to identify worms—today entails non-trivial human labor, and thus significant delay: as network operators de-tect anomalous behavior, they communicate with one another and manually study packettraces to produce a worm signature. Yet intervention must occur early in an epidemic tohalt a worm’s spread. In this part, we introduce Autograph, a system that automaticallygenerates signatures for novel Internet worms that propagate by randomly scanning the IPaddress space. Autograph generates signatures by analyzing the prevalence of portions of flowpayloads, and thus uses no knowledge of protocol semantics above the transport level. It isdesigned to produce signatures that exhibit high sensitivity (high true positives) and highspecificity (low false positives); our evaluation of the system on real DMZ traces validatesthat it achieves these goals. We extend Autograph to share port scan reports among dis-tributed monitor instances, and using trace-driven simulation, demonstrate the value of thistechnique in speeding the generation of signatures for novel worms. Our results elucidatethe fundamental trade-off between early generation of signatures for novel worms and thespecificity of these generated signatures.
1DMZ is a physical or logical subnetwork placed in between an organization’s internal network and a larger,untrusted network such as the Internet. DMZ may contain and expose the organization’s external services.External attackers only have access to the services and equipments in the DMZ, rather than the organization’sinternal network.
13

2.1. Background and Motivation
2.1 Background and Motivation
Motivated in large part by the costs of Internet worm epidemics, the research communityhas investigated worm propagation and how to thwart it. Initial investigations focused oncase studies of the spreading of successful worms [85], and on comparatively modeling di-verse propagation strategies future worms might use [127, 140]. More recently, attentionhas turned to methods for containing the spread of a worm. Broadly speaking, three chiefstrategies exist for containing worms by blocking their connections to potential victims: dis-covering ports on which worms appear to be spreading, and filtering all traffic destined forthose ports; discovering source addresses of all traffic destined for those ports; discover-ing source addresses of infected hosts and filtering all traffic (or perhaps traffic destined fora few ports) from those source addresses; and discovering the payload content string thata worm uses in its infection attempts, and filtering all flows whose payloads contain thatcontent string.
Detecting that a worm appears to be active on a particular port [145] is a useful first steptoward containment, but is often too blunt an instrument to be used alone; simply blockingall traffic for port 80 at edge networks across the Internet shuts down the entire web when aworm that targets web servers is released. Moore et al. [89] compared the relative efficacy ofsource-address filtering and content-based filtering. Their results show that content-basedfiltering of infection attempts slows the spreading of a worm more effectively: to confinean epidemic within a particular target fraction of the vulnerable host population, one maybegin content-based filtering far later after the release of a worm than address-based filter-ing. Motivated by the efficacy of content-based filtering, we seek in this thesis to answerthe complementary question unanswered in prior work: how should one obtain worm contentsignatures for use in content-based filtering?
Here, a signature is a tuple (IP-proto, dst-port, byteseq), where IP-proto
is an IP protocol number, dst-port is a destination port number for that protocol, andbyteseq is a variable-length, fixed sequence of bytes.2 Content-based filtering consists ofmatching network flows (possibly requiring flow reassembly) against signatures; a matchoccurs when byteseq is found within the payload of a flow using the IP-proto protocoldestined for dst-port. We restrict our investigation to worms that propagate over TCP inthis work, and thus hereafter consider signatures as (dst-port, byteseq) tuples.
Today, there exist TCP-flow-matching systems that are “consumers” of these sorts of sig-
2Signatures may employ more complicated payload patterns, such as regular expressions. We restrict ourattention to fixed byte sequences.
14

Chapter 2. Introduction
natures. Intrusion detection systems (IDSes), such as Bro 3 and Snort 4, monitor all incomingtraffic at an edge network’s DMZ, perform TCP flow reassembly, and search for knownworm signatures. These systems log the occurrence of inbound worm connections they ob-serve, and can be configured (in the case of Bro) to change access control lists in the edgenetwork’s router(s) to block traffic from source IP addresses that have sent known wormpayloads. Cisco’s NBAR system 5 for routers searches for signatures in flow payloads, andblocks flows on the fly whose payloads are found to contain known worm signatures. Welimit the scope of our inquiry to the detection and generation of signatures for use by these andfuture content-based filtering systems.
It is important to note that all the content-based filtering systems use databases of wormsignatures that are manually generated: as network operators detect anomalous behavior,they communicate with one another, manually study packet traces to produce a worm signa-ture, and publish that signature so that it may be added to IDS systems’ signature databases.This labor-intensive, human-mediated process of signature generation is slow (on the orderof hours or longer), and renders today’s IDSes unhelpful in stemming worm epidemics—bythe time a signature has been found manually by network operators, a worm may alreadyhave compromised a significant fraction of vulnerable hosts on the Internet.
We seek to build a system that automatically, without foreknowledge of a worm’s pay-load or time of introduction, detects the signature of any worm that propagates by randomlyscanning IP addresses. We assume the system monitors all inbound network traffic at anedge network’s DMZ. Autograph, our worm signature detection system, has been designedto meet that goal. The system consists of three interconnected modules: a flow classifier, acontent-based signature generator, and tattler, a protocol through which multiple distributedAutograph monitors may share information, in the interest of speeding detection of a signa-ture that matches a newly released worm.
2.2 Desirable Properties
While the initial motivation of automated signature detection is to speed the signature gen-eration by taking the human out of signature generation process, we must also ensure thatthe system generates good signatures and consume reasonable amount of resources. More
3Bro Intrusion Detection System [102]. http://www.bro-ids.org4The Snort Project. http://www.snort.org/5More information is at http://www.cisco.com/univercd/cc/td/doc/product/software/
ios122/122newft/122t/122t8/dtnbarad.htm
15
2.2. Desirable Properties
True Positive
Sensitive, Specific
Sensitive, Unspecific
High
Insensitive, Specific
Low
False Positive
Insensitive, Unspecific
High
Low
Figure 2.1: Combinations of sensitivity and specificity.
specifically, developing and evaluating an automated signature detection system must con-sider the following metrics:
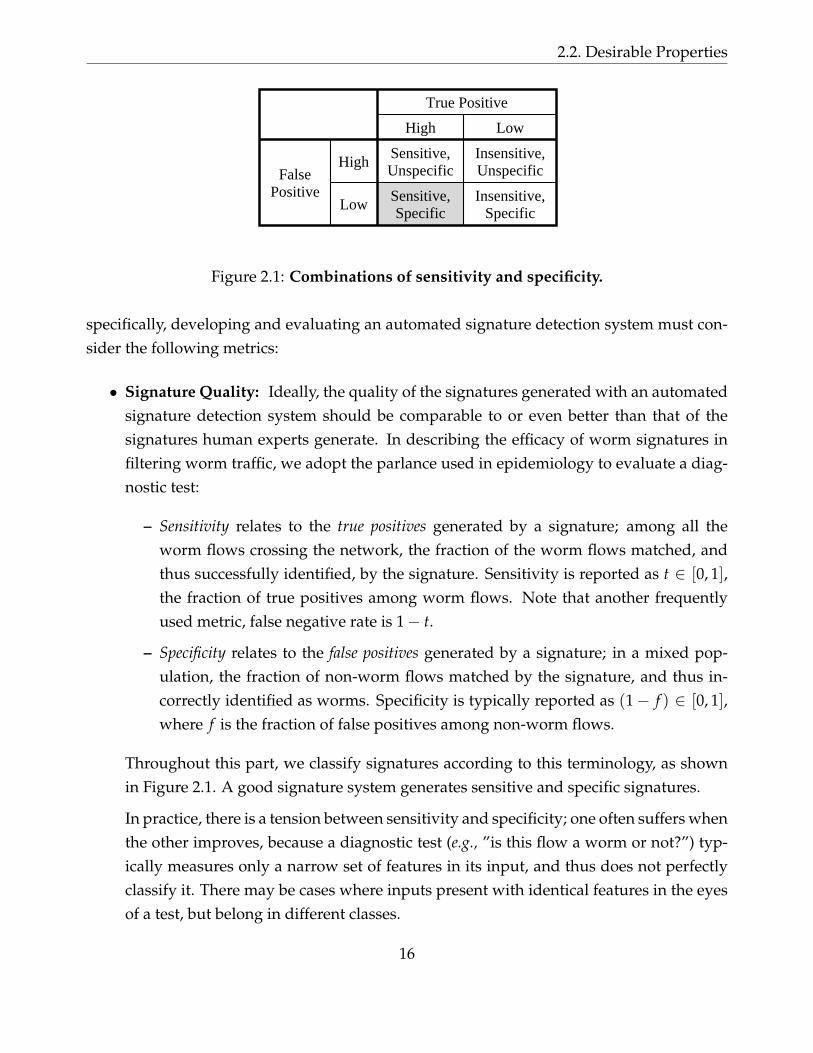
• Signature Quality: Ideally, the quality of the signatures generated with an automatedsignature detection system should be comparable to or even better than that of thesignatures human experts generate. In describing the efficacy of worm signatures infiltering worm traffic, we adopt the parlance used in epidemiology to evaluate a diag-nostic test:
– Sensitivity relates to the true positives generated by a signature; among all theworm flows crossing the network, the fraction of the worm flows matched, andthus successfully identified, by the signature. Sensitivity is reported as t ∈ [0, 1],the fraction of true positives among worm flows. Note that another frequentlyused metric, false negative rate is 1− t.
– Specificity relates to the false positives generated by a signature; in a mixed pop-ulation, the fraction of non-worm flows matched by the signature, and thus in-correctly identified as worms. Specificity is typically reported as (1− f ) ∈ [0, 1],where f is the fraction of false positives among non-worm flows.
Throughout this part, we classify signatures according to this terminology, as shownin Figure 2.1. A good signature system generates sensitive and specific signatures.
In practice, there is a tension between sensitivity and specificity; one often suffers whenthe other improves, because a diagnostic test (e.g., ”is this flow a worm or not?”) typ-ically measures only a narrow set of features in its input, and thus does not perfectlyclassify it. There may be cases where inputs present with identical features in the eyesof a test, but belong in different classes.
16

Chapter 2. Introduction
• Signature quantity and length: A content-based filter maintains a list of signaturesand matches every packet (or data injected from networks) against the signaturesknown for the IP protocol and port. In practice, network administrators maintain thelist as small as possible because the filter’s performance degrades linearly with thenumber of signatures in the list [5]. For example, Snort [131] users use tens of sig-natures only for active, serious attacks, even though there are more than 3000 rulesavailable currently. Thus, fewer signatures that cover a wide range of worms are de-sirable.
Similarly, the cost of signature matching increases with the length of each signature.For example, when we express the signature with a regular expression which is imple-mented as a Deterministic Finite Automation (DFA), the matching always takes timelinear in the length of the signature regardless of the specifics of the signature. Theparallel Boyer-Moore approaches have been explored for fast signature matching ofmultiple fixed strings [30, 49], and they have been adopted in Snort. However, theypresent a wide range of running times – potentially sublinear but also potentially su-perlinear in the length of the string. A different approach using Bloom filters in FieldProgrammable Gate Arrays (FPGA) has been proposed to speed network packet pay-load pattern matching [38]. This technique requires to group and store the signatures inparallel Bloom filters based on their lengths, so limiting the lengths of signatures is stillimportant for its performance. Therefore, short signatures are preferable to long ones.Note that the signature length profoundly affects specificity and sensitivity: when onesignature is a subsequence of another, the longer one is expected to match fewer flowsthan the shorter one.
• Timeliness of detection: Left unchecked by patches, traffic filtering, or other means,worms infect vulnerable hosts at an exponential rate, until the infected populationsaturates. Provos [105] shows in simulation that patching of infected hosts is more ef-fective the earlier it is begun after the initial release of a new worm, and that in practi-cal deployment scenarios, patching must begin quickly (before 5% of vulnerable hostsbecome infected) in order to have hope of stemming an epidemic such that no morethan 50% of vulnerable hosts ever become infected. Moore et al. [89] show similarlythat signature-based filtering of worm traffic stops worm propagation most effectivelywhen begun early.
• Automation: This metric is tightly related to the timeliness of detection. A signaturedetection system must require minimal real-time operator intervention. Vetting sig-
17
2.3. Outline of Part I
natures for specificity with human eyes, e.g., is at odds with timeliness of signaturedetection for novel worms.
• Efficient resource consumption: A signature detection system that monitors host statemust not affect host performance significantly, so CPU and memory usage must besmall. A signature detection system that monitors network traffic must keep up withthe large volume of aggregated traffic on fast links, so signature detection algorithmsmust be simple and fast. If a signature detection system is deployed in a distributedfashion, such that distributed monitors communicate with one another about their ob-servations, that communication should remain scalable, even when a worm generatestremendous network activity as it tries to spread. That is, monitor-to-monitor commu-nication should grow slowly as worm activity increases.
• Robustness against attacks and polymorphism: A polymorphic worm changes its pay-load in successive infection attempts. Such worms pose a particular challenge to matchwith signatures, as a signature sensitive to a portion of one worm payload may not besensitive to any part of another worm payload. If a worm were “ideally” polymor-phic, each of its payloads would contain no byte sequence in common with any other,and content-based filtering is no longer effective for such worms. However, if a wormexhibits polymorphism but does not change one or more relatively long subsequencesacross its variants, an efficient signature detection system will generate signatures thatmatch these invariant subsequences. This will minimize the number of signatures re-quired to mach all the worm’s variants. Also, a signature detection system must berobust against abuse, such that an attacker forces the system to generate unspecificsignatures. Those signatures will result in Denial-of-Service attacks against networksusing automatically generated signatures.
2.3 Outline of Part I
In the remainder of Part I, we present an automated signature generation system that satis-fies the above requirements. In Chapter 3, we design Autograph, our worm signature detec-tion system that analyzes traffic of a single network. In Chapter 4, we extend Autograph ina distributed monitoring setting to enable fast signature generation.
18
Chapter 3
Automated Worm Signature Generationusing Content Prevalence Analysis
In this chapter we propose a new system, Autograph, that generates worm signatures bydetecting prevalent payload pattern strings across suspicious traffic flows. The main contri-butions of our work can be summarized as follows:
• We introduce a novel pattern-extraction-based network signature generation approachbased on the two properties of worms: content invariance and magnitude of traffic vol-ume. These two traits of worm traffic were exploited by many other pattern-extraction-based network signature generation systems proposed concomitantly [119, 73] and af-ter our work [93, 139, 67, 17, 76, 94].
• We propose COPP, a payload partitioning algorithm derived from a work in the filesystem domain [91]. COPP generates variable-size, non-overlapping content blocks bydetermining the boundaries of each block based on payload content. COPP is resilientagainst modest level of payload pattern changes.
• We show that pattern-extraction-based network signature generation approaches gen-erally suffer from the advent of new Internet applications such as P2P file sharingprograms because their communication patterns are similar to that of worm traffic. Inorder to avoid false positives caused by such benign P2P application traffic, Autographneeds to apply better flow selection heuristics.
We provide the overview of a single Autograph monitor in Section 3.1. We then describethe detailed workings of Autograph’s suspicious flow selection classifier and content-based
19

3.1. Autograph System Overview
Suspicious Flow Selection
Selecting Suspicious traffic using heuristics
Signature Generation
PrevalenceHistogram
ConstructionFlow
reassembly
PayloadPartitioning
(COPP)Suspicious inbound packets
Content blocks
Prevalence Histogram
Non-suspicious inboundpackets
Wo
rm S
ign
atu
res
Cro
ss-D
MZ
tra
ffic
tattler Other Autograph Monitors
Port-scanner IP addresses
Figure 3.1: Architecture of an Autograph Monitor: A single Autograph monitor consists of1) a suspicious flow selection stage and, 2) a content-based signature generation stage.
signature generation in Section 3.2 and Section 3.3 respectively. We evaluate the quality ofthe signatures Autograph finds when run on real DMZ traces from two edge networks inSection 3.4. In Section 3.5, we study the P2P file sharing application traffic that mimics wormtraffic and explain how Autograph can cope with the noise caused by the new application.After cataloguing limitations of Autograph and possible attacks against it in Section 3.6, wesummarize our work in Section 3.7.
3.1 Autograph System Overview
Motivated by the design goals given in the previous chapter, we now present Autograph.We begin with a schematic overview of the system, shown in Figure 3.1. A single Autographmonitor’s input is all traffic crossing an edge network’s DMZ, and its output is a list of wormsignatures. We defer discussion of tattler, used in distributed deployments of Autograph, toChapter 4. There are two main stages in a single Autograph monitor’s analysis of traffic.First, a suspicious flow selection stage uses heuristics to classify inbound TCP flows as eithersuspicious or non-suspicious.
After classification, packets for these inbound flows are stored on disk in a suspicious flowpool and non-suspicious flow pool, respectively. For clarity, throughout this thesis, we refer tothe output of the classifier using those terms, and refer to the true nature of a flow as maliciousor innocuous. Further processing occurs only on payloads in the suspicious flow pool. Thus,flow classification reduces the volume of traffic that must be processed subsequently. Weassume in our work that such heuristics will be far from perfectly accurate. Yet any heuristicthat generates a suspicious flow pool in which truly malicious flows are a greater fraction of
20

Chapter 3. Automated Worm Signature Generation using Content Prevalence Analysis
flows than in the total inbound traffic mix crossing the DMZ will likely reduce generation ofsignatures that cause false positives, by focusing Autograph’s further processing on a flowpopulation containing a lesser fraction of innocuous traffic. Autograph performs TCP flowreassembly for inbound payloads in the suspicious flow pool. The resulting reassembledpayloads are analyzed in Autograph’s second stage, signature generation.
We stress that Autograph segregates flows by destination port for signature generation;in the remainder of this thesis, one should envision one separate instance of signature gen-eration for each destination port, operating on flows in the suspicious flow pool destinedfor that port. Signature generation involves analysis of the content of payloads of suspi-cious flows to select sensitive and specific signatures. Two properties of worms suggest thatcontent analysis may be fruitful. First, a worm propagates by exploiting one software vul-nerability or a set of such vulnerabilities. That commonality in functionality has to date ledto commonality in code, and thus in payload content, across worm infection payloads. Infact, Internet worms to date have had a single, unchanging payload in most cases. Even inthose cases where multiple variants of a worm’s payload have existed (e.g., Nimda), thosevariants have shared significant overlapping content.1 Second, a worm generates volumi-nous network traffic as it spreads; this trait stems from worms’ self-propagating nature. Forport-scanning worms, the exponential growth in the population of infected hosts and atten-dant exponential growth in infection attempt traffic are well known [85]. As also noted andexploited by Singh et al. [119], taken together, these two traits of worm traffic—content com-monality and magnitude of traffic volume—suggest that analyzing the frequency of payloadcontent should be useful in identifying worm payloads. During signature generation, Auto-graph measures the frequency with which non-overlapping payload substrings occur acrossall suspicious flow payloads, and proposes the most frequently occurring substrings as can-didate signatures.
3.2 Selecting Suspicious Traffic
In this work, we use a simple port-scanner detection technique as a heuristic to identify ma-licious traffic; we classify all flows from port-scanning sources as suspicious. Note that wedo not focus on the design of suspicious flow classifiers herein; Autograph can adopt anyanomaly detection technique that classifies worm flows as suspicious with high probability.In fact, we deliberately use a port-scanning flow classifier because it is simple, computa-
1Future worms may be designed to minimize the overlap in their successive infection payloads; we considersuch worms in Section 3.4.2.
21
3.2. Selecting Suspicious Traffic
tionally efficient, and clearly imperfect; our aim is to demonstrate that Autograph generateshighly selective and specific signatures, even with a naive flow classifier. With more accurateflow classifiers, one will only expect the quality of Autograph’s signatures to improve.
Many worms rely on scanning of the IP address space to search for vulnerable hostswhile spreading. If a worm finds another machine that runs the desired service on the tar-get port, it sends its infectious payload. Probing a non-existent host or service, however,results in an unsuccessful connection attempt, easily detectable by monitoring outboundICMP host/port unreachable messages, or identifying unanswered inbound SYN packets.Hit-list worms [127, 88] violate this port-scanning assumption; we do not address them inthis thesis, but comment on them briefly in Section 3.6.
Autograph stores the source and destination addresses of each inbound unsuccessfulTCP connection it observes. Once an external host has made unsuccessful connection at-tempts to more than s internal IP addresses, the flow classifier considers it to be a scanner.All successful connections from an IP address flagged as a scanner are classified as suspi-cious, and their inbound packets written to the suspicious flow pool, until that IP address isremoved after a timeout (24 hours in the current prototype).2 Packets held in the suspiciousflow pool are dropped from storage after a configurable interval t. Thus, the suspicious flowpool contains all packets received from suspicious sources in the past time period t.3
Autograph reassembles all TCP flows in the suspicious flow pool, continuously examinesthe suspicious flow pool that contains all the reassembled TCP flows for the last t minutes.The signature generation process is initiated when for a single destination port, the suspi-cious flow pool contains more than a threshold number of flows θ.
Honeypots [125] are useful sources of suspicious traffic for Autograph. Because all trafficarriving at a honeypot is inherently suspicious, no port scan detection may be necessary; allpayloads received at a honeypot may be included in Autograph’s suspicious traffic pool.However, remember that the incoming traffic to Honeypot still can contain innocuous con-tents; for instance, an attacker can send a common connection request to determine whetherthe destination is a honeypot or a valid server. Thus, we still need the content-based analysisto extract sensitive and selective signatures.
2Note that an IP address may have sent traffic before being identified as a scanner; such traffic will stored inthe non-suspicious flow pool. We include only subsequently arriving traffic in the suspicious flow pool, in theinterest of simplicity, at the expense of potentially missing worm traffic sent by the scanner before our havingdetected it as such.
3Worms that propagate very slowly may only accumulate in sufficient volume to be detected by Autographfor long values of t.
22

Chapter 3. Automated Worm Signature Generation using Content Prevalence Analysis
3.3 Content-Based Signature Generation
After selecting suspicious flows, Autograph selects the most frequently occurring byte se-quences across the flows in the suspicious flow pool as signatures. To do so, it divides eachsuspicious flow into smaller content blocks, and counts the number of suspicious flows inwhich each content block occurs. We term this count a content block’s prevalence, and rankcontent blocks from most to least prevalent. As previously described, the intuition behindthis ranking is that a worm’s payload appears increasingly frequently as that worm spreads.When all worm flows contain a common, worm-specific byte sequence, that byte sequencewill be observed in many suspicious flows, and so will be highly ranked.
3.3.1 COPP: COntent-based Payload Partitioning Algorithm
Let us first describe how Autograph divides suspicious flows’ payloads into shorter blocks.One might naively divide payloads into fixed-size, non-overlapping blocks, and computethe prevalence of those blocks across all suspicious flows. That approach, however, is brittleif worms even trivially obfuscate their payloads by reordering them, or inserting or deletinga few bytes. To see why, consider what occurs when a single byte is deleted or inserted froma worm’s payload; all fixed-size blocks beyond the insertion or deletion will most likelychange in content. Thus, a worm author could evade accurate counting of its substrings bytrivial changes in its payload, if fixed-size, non-overlapping blocks were used to partitionpayloads for counting substring prevalence.
Instead, as first done in the file system domain in LBFS [91], we divide a flow’s pay-load into variable-length content blocks using COntent-based Payload Partitioning (COPP).Because COPP determines the boundaries of each block based on payload content, the set ofblocks COPP generates changes little under byte insertion or deletion.
To partition a flow’s payload into content blocks, COPP computes a series of Rabin fin-gerprints ri over a sliding k-byte window of the flow’s payload, beginning with the first kbytes in the payload, and sliding one byte at a time toward the end of the payload. It isefficient to compute a Rabin fingerprint over a sliding window [108]. As COPP slides itswindow along the payload, it ends a content block when ri matches a predetermined break-mark, B; when ri ≡ B (mod a). The average content block size produced by COPP, a, isconfigurable; assuming random payload content, the window at any byte position withinthe payload equals the breakmark B (mod a) with probability 1/a.
Figure 3.2 presents an example of COPP, using a 2-byte window, for two flows f0 and f1.
23
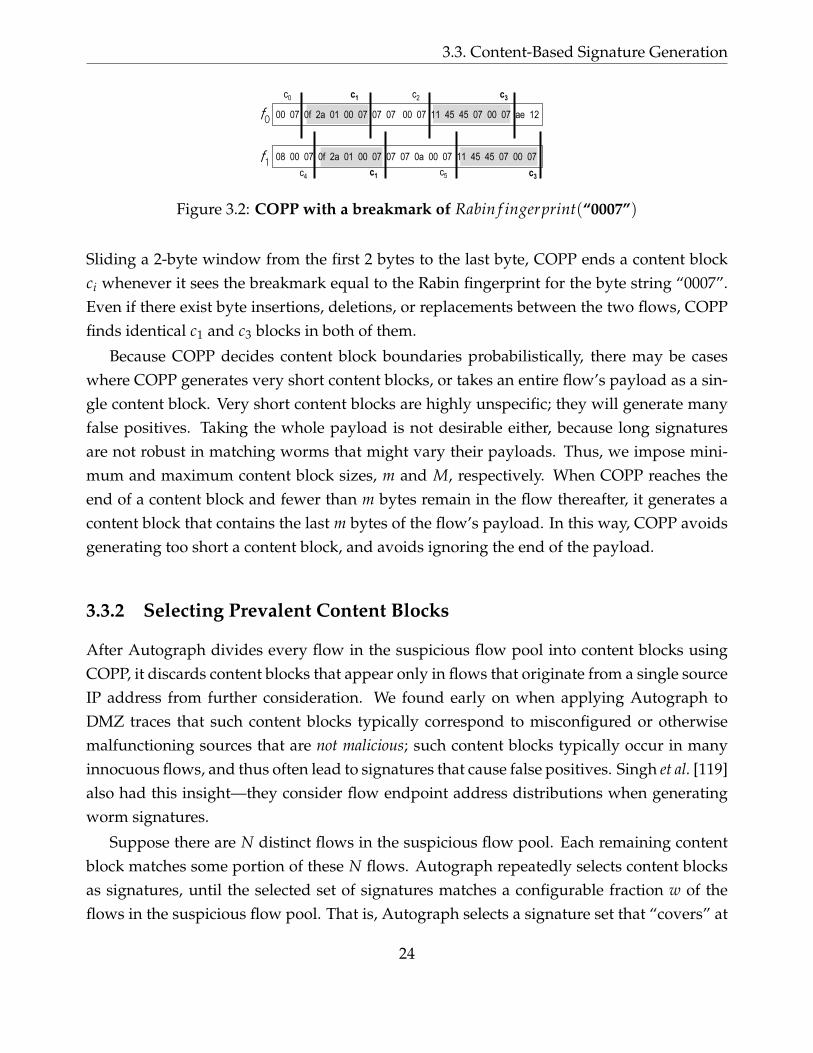
3.3. Content-Based Signature Generation
00 07 0f 2a 01 00 07 07 07 00 07 11 45 45 07 00 07 ae 12
08 00 07 0f 2a 01 00 07 07 07 0a 00 07 11 45 45 07 00 07
c1
c4
c1
c5
c2
c0 c
3
c3
Figure 3.2: COPP with a breakmark of Rabin f ingerprint(“0007”)
Sliding a 2-byte window from the first 2 bytes to the last byte, COPP ends a content blockci whenever it sees the breakmark equal to the Rabin fingerprint for the byte string “0007”.Even if there exist byte insertions, deletions, or replacements between the two flows, COPPfinds identical c1 and c3 blocks in both of them.
Because COPP decides content block boundaries probabilistically, there may be caseswhere COPP generates very short content blocks, or takes an entire flow’s payload as a sin-gle content block. Very short content blocks are highly unspecific; they will generate manyfalse positives. Taking the whole payload is not desirable either, because long signaturesare not robust in matching worms that might vary their payloads. Thus, we impose mini-mum and maximum content block sizes, m and M, respectively. When COPP reaches theend of a content block and fewer than m bytes remain in the flow thereafter, it generates acontent block that contains the last m bytes of the flow’s payload. In this way, COPP avoidsgenerating too short a content block, and avoids ignoring the end of the payload.
3.3.2 Selecting Prevalent Content Blocks
After Autograph divides every flow in the suspicious flow pool into content blocks usingCOPP, it discards content blocks that appear only in flows that originate from a single sourceIP address from further consideration. We found early on when applying Autograph toDMZ traces that such content blocks typically correspond to misconfigured or otherwisemalfunctioning sources that are not malicious; such content blocks typically occur in manyinnocuous flows, and thus often lead to signatures that cause false positives. Singh et al. [119]also had this insight—they consider flow endpoint address distributions when generatingworm signatures.
Suppose there are N distinct flows in the suspicious flow pool. Each remaining contentblock matches some portion of these N flows. Autograph repeatedly selects content blocksas signatures, until the selected set of signatures matches a configurable fraction w of theflows in the suspicious flow pool. That is, Autograph selects a signature set that “covers” at
24
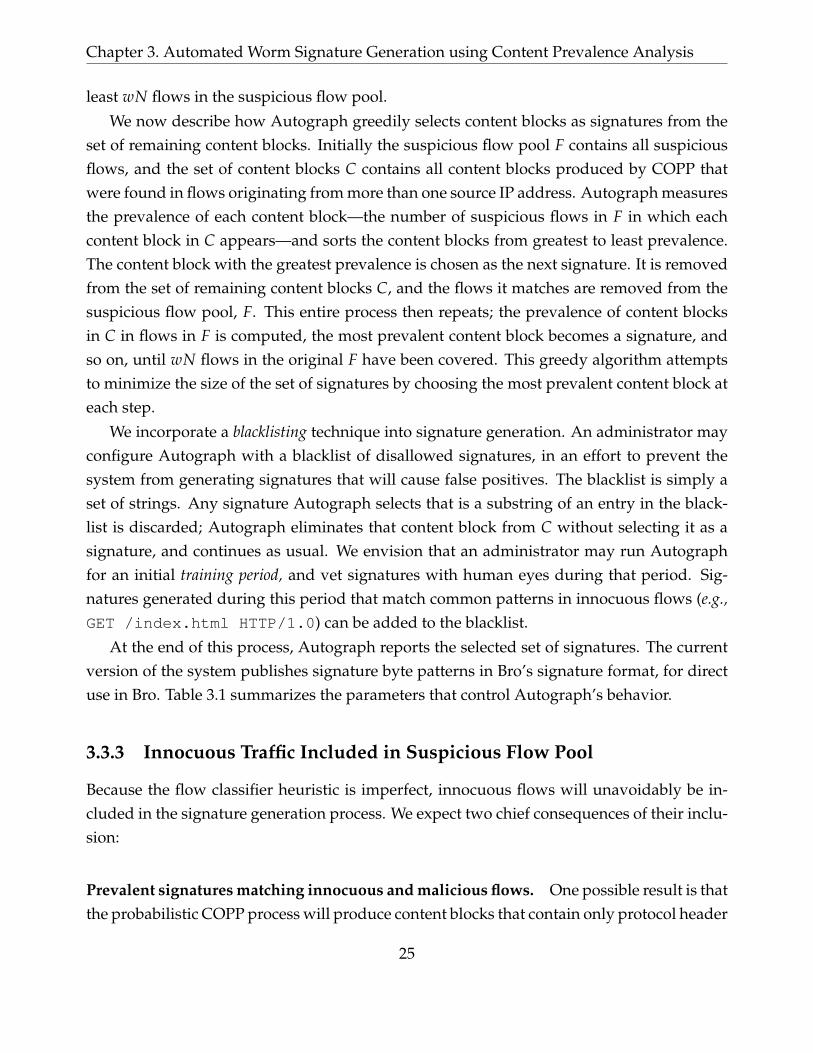
Chapter 3. Automated Worm Signature Generation using Content Prevalence Analysis
least wN flows in the suspicious flow pool.
We now describe how Autograph greedily selects content blocks as signatures from theset of remaining content blocks. Initially the suspicious flow pool F contains all suspiciousflows, and the set of content blocks C contains all content blocks produced by COPP thatwere found in flows originating from more than one source IP address. Autograph measuresthe prevalence of each content block—the number of suspicious flows in F in which eachcontent block in C appears—and sorts the content blocks from greatest to least prevalence.The content block with the greatest prevalence is chosen as the next signature. It is removedfrom the set of remaining content blocks C, and the flows it matches are removed from thesuspicious flow pool, F. This entire process then repeats; the prevalence of content blocksin C in flows in F is computed, the most prevalent content block becomes a signature, andso on, until wN flows in the original F have been covered. This greedy algorithm attemptsto minimize the size of the set of signatures by choosing the most prevalent content block ateach step.
We incorporate a blacklisting technique into signature generation. An administrator mayconfigure Autograph with a blacklist of disallowed signatures, in an effort to prevent thesystem from generating signatures that will cause false positives. The blacklist is simply aset of strings. Any signature Autograph selects that is a substring of an entry in the black-list is discarded; Autograph eliminates that content block from C without selecting it as asignature, and continues as usual. We envision that an administrator may run Autographfor an initial training period, and vet signatures with human eyes during that period. Sig-natures generated during this period that match common patterns in innocuous flows (e.g.,GET /index.html HTTP/1.0) can be added to the blacklist.
At the end of this process, Autograph reports the selected set of signatures. The currentversion of the system publishes signature byte patterns in Bro’s signature format, for directuse in Bro. Table 3.1 summarizes the parameters that control Autograph’s behavior.
3.3.3 Innocuous Traffic Included in Suspicious Flow Pool
Because the flow classifier heuristic is imperfect, innocuous flows will unavoidably be in-cluded in the signature generation process. We expect two chief consequences of their inclu-sion:
Prevalent signatures matching innocuous and malicious flows. One possible result is thatthe probabilistic COPP process will produce content blocks that contain only protocol header
25
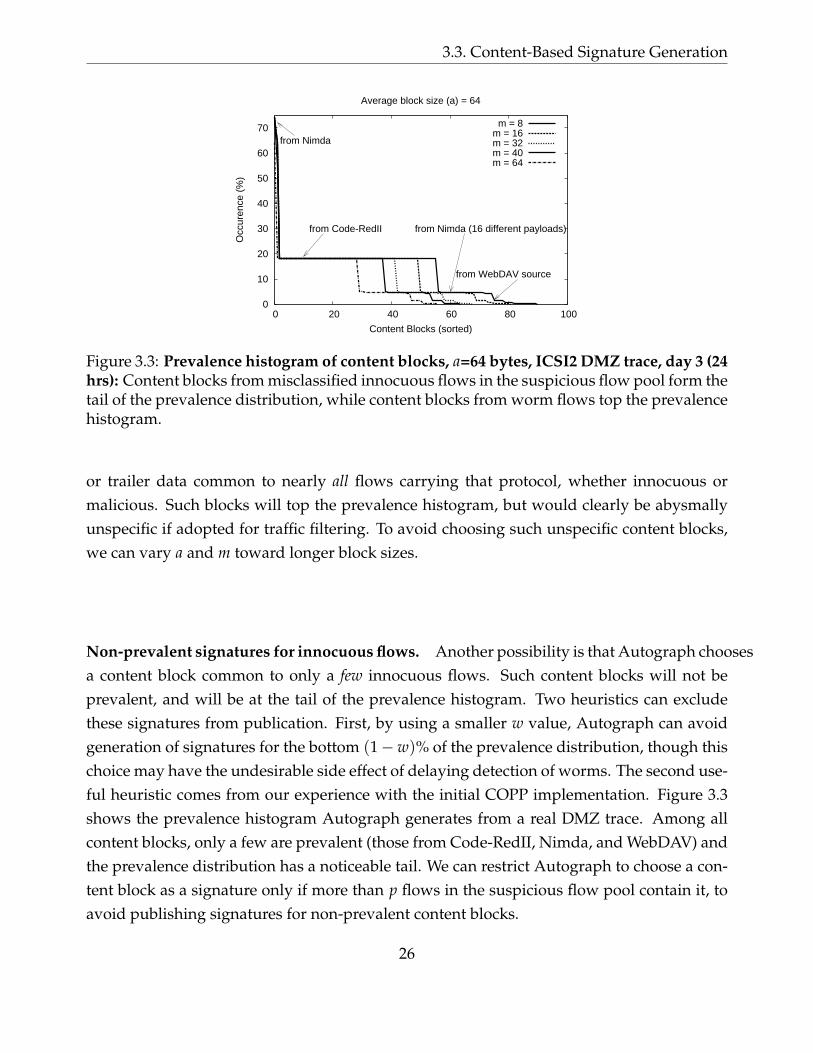
3.3. Content-Based Signature Generation
0
10
20
30
40
50
60
70
0 20 40 60 80 100
Occ
uren
ce (
%)
Content Blocks (sorted)
Average block size (a) = 64
from Nimda
from Code-RedII from Nimda (16 different payloads)
from WebDAV source
m = 8m = 16m = 32m = 40m = 64
Figure 3.3: Prevalence histogram of content blocks, a=64 bytes, ICSI2 DMZ trace, day 3 (24hrs): Content blocks from misclassified innocuous flows in the suspicious flow pool form thetail of the prevalence distribution, while content blocks from worm flows top the prevalencehistogram.
or trailer data common to nearly all flows carrying that protocol, whether innocuous ormalicious. Such blocks will top the prevalence histogram, but would clearly be abysmallyunspecific if adopted for traffic filtering. To avoid choosing such unspecific content blocks,we can vary a and m toward longer block sizes.
Non-prevalent signatures for innocuous flows. Another possibility is that Autograph choosesa content block common to only a few innocuous flows. Such content blocks will not beprevalent, and will be at the tail of the prevalence histogram. Two heuristics can excludethese signatures from publication. First, by using a smaller w value, Autograph can avoidgeneration of signatures for the bottom (1−w)% of the prevalence distribution, though thischoice may have the undesirable side effect of delaying detection of worms. The second use-ful heuristic comes from our experience with the initial COPP implementation. Figure 3.3shows the prevalence histogram Autograph generates from a real DMZ trace. Among allcontent blocks, only a few are prevalent (those from Code-RedII, Nimda, and WebDAV) andthe prevalence distribution has a noticeable tail. We can restrict Autograph to choose a con-tent block as a signature only if more than p flows in the suspicious flow pool contain it, toavoid publishing signatures for non-prevalent content blocks.
26

Chapter 3. Automated Worm Signature Generation using Content Prevalence Analysis
Symbol Descriptions Port scanner detection thresholda COPP parameter: average content block sizem COPP parameter: minimum content block sizeM COPP parameter: maximum content block sizew Target percentage of suspicious flows to be represented
in generated signaturesp Minimum content block prevalence for use as signaturet Duration suspicious flows held in suspicious flow poolθ Minimum size of suspicious flow pool to triggers
signature generation process
Table 3.1: Autograph’s signature generation parameters.
3.4 Evaluation: Local Signature Generation
We now evaluate the quality of signatures Autograph generates. In this section, we answerthe following two questions: First, how does content block size affect the the sensitivity andspecificity of the signatures Autograph generates? And second, how robust is Autograph toworms that vary their payloads?
Our experiments demonstrate that as content block size decreases, the likelihood thatAutograph detects commonality across suspicious flows increases. As a result, as contentblock size decreases, Autograph generates progressively more sensitive but less specificsignatures. They also reveal that small block sizes are more resilient to worms that varytheir content, in that they can detect smaller common parts among worm payloads. Finally,they reveal that when run on real web traffic from a DMZ, Autograph with blacklistingcan achieve zero false positives; can detect signatures for all worms present; and can quicklygenerate signatures for “established” worms with pre-existing populations of active infectedhosts.
3.4.1 Offline Signature Generation on DMZ Traces
We first investigate the effect of content block size on the quality of the signatures generatedby Autograph. In this subsection, we use a suspicious flow pool accumulated during aninterval t of 24 hours, and consider only a single invocation of signature generation on thatflow pool. No blacklisting is used in the results in this subsection, and filtering of contentblocks that appear only from one source address before signature generation is disabled. Allresults we present herein are for a COPP Rabin fingerprint window of width k = 4 bytes.4
4We have since adopted a 16-byte COPP window in our implementation, to make it harder for worm au-thors to construct payloads so as to force particular content block boundaries; results are quite similar for
27

3.4. Evaluation: Local Signature Generation
IRP ICSI ICSI2Measurement Period Aug 1-7 Jan 26 Mar 22-29
2003 2004 20041 week 24 hours 1 week
Inbound HTTP packets 70K 793K 6353KInbound HTTP flows 26K 102K 825KHTTP worm sources 72 351 1582
scanned 56 303 1344not scanned 16 48 238
Nimda sources 18 57 254CodeRed II sources 54 294 997
WebDav exploit sources - - 336HTTP worm flows 375 1396 7127
Nimda flows 303 1022 5392CodeRed flows 72 374 1365
WebDav exploit flows - - 370
Table 3.2: Summary of traces.
In our experiments, we feed Autograph one of three packet traces from the DMZs oftwo research labs; one from Intel Research Pittsburgh (Pittsburgh, USA) and two from ICSI(Berkeley, USA). IRP’s Internet link was a T1 at the time our trace was taken, whereas ICSI’sis over a 100 Mbps fiber to UC Berkeley. All three traces contain the full payloads of allpackets. The ICSI and ICSI2 traces only contain inbound traffic to TCP port 80, and are IP-source-anonymized. Both sites have address spaces of 29 IP addresses, but the ICSI tracescontain more port 80 traffic, as ICSI’s web servers are more frequently visited than IRP’s.
For comparison, we obtain the full list of HTTP worms in the traces using Bro withwell-known signatures for the Code-Red, Code-RedII, and Nimda HTTP worms, and foran Agobot worm variant that exploits the WebDAV buffer overflow vulnerability (presentonly in the ICSI2 trace). Table 3.2 summarizes the characteristics of all three traces.
Autograph’s suspicious flow classifier identifies unsuccessful connection attempts ineach trace. For the IRP trace, Autograph uses ICMP host/port unreachable messages tocompile the list of suspicious remote IP addresses. As neither ICSI trace includes outboundICMP packets, Autograph infers failed connection attempts in those traces by looking atincoming TCP SYN and ACK pairs.
We run Autograph with varied scanner detection thresholds, s ∈ 1, 2, 4. These thresh-olds are lower than those used by Bro and Snort, in the interest of catching as many wormpayloads as possible (crucial early in an epidemic). As a result, our flow classifier misclassi-
k = 16.
28

Chapter 3. Automated Worm Signature Generation using Content Prevalence Analysis
0
0.2
0.4
0.6
0.8
1
0 5 10 15 20
CD
F
Selected Content Block ID
Popularity Distribution of Suspicious Flows (s=1, m=64, a=64), ICSI
CodeRedIINimda(1)
Nimda(16)Misclassified(1)
Figure 3.4: Prevalence of Selected Content Blocks in Suspicious Flow Pool, ICSI DMZtrace (24 hrs): Most flows are worms except for a few misclassified flows. Autograph gener-ates signatures for every worm in the pool.
fies flows as suspicious more often, and more innocuous flows are submitted for signaturegeneration.
We also vary the minimum content block size (m) and average content block size (a)parameters that govern COPP, but fix the maximum content block size (M) at 1024 bytes.We vary w ∈ [10%, 100%] in our experiments. Recall that w limits the fraction of suspiciousflows that may contribute content to the signature set. COPP adds content blocks to thesignature set (most prevalent content block first, and then in order of decreasing prevalence)until one or more content blocks in the set match w percent of flows in the suspicious flowpool.
We first characterize the content block prevalence distribution found by Autograph witha simple example. Figure 3.4 shows the prevalence of content blocks found by COPP whenwe run COPP with m = 64, a = 64, and w = 100% over a suspicious flow pool capturedfrom the full 24-hour ICSI trace with s = 1. At w = 100%, COPP adds content blocks to thesignature set until all suspicious flows are matched by one or more content blocks in the set.Here, the x axis represents the order in which COPP adds content blocks to the signatureset (most prevalent first). The y axis represents the cumulative fraction of the populationof suspicious flows containing any of the set of signatures, as the set of signatures grows.The trace contains Code-RedII, Nimda, and WebDAV worm flows. Nimda sources send 16different flows with every infection attempt, to search for vulnerabilities under 16 differentURLs. The first signature COPP generates matches Code-RedII; 28% of the suspicious flowsare Code-RedII instances. Next, COPP selects 16 content blocks as signatures, one for each
29
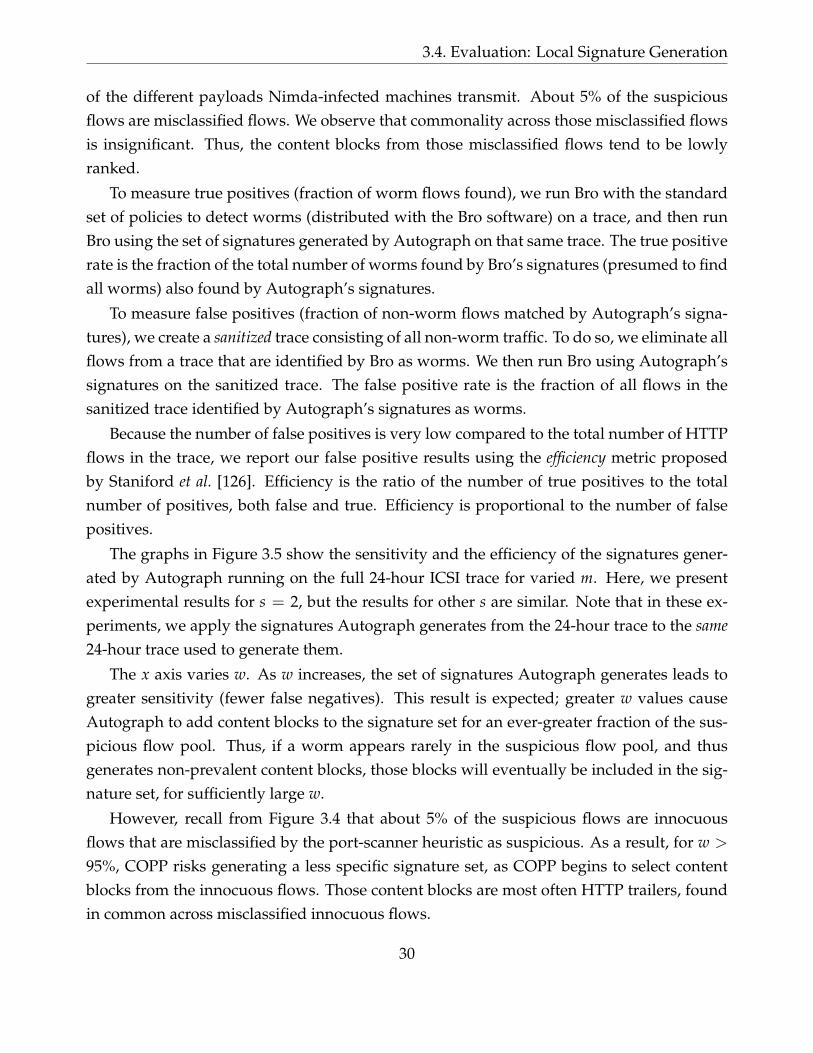
3.4. Evaluation: Local Signature Generation
of the different payloads Nimda-infected machines transmit. About 5% of the suspiciousflows are misclassified flows. We observe that commonality across those misclassified flowsis insignificant. Thus, the content blocks from those misclassified flows tend to be lowlyranked.
To measure true positives (fraction of worm flows found), we run Bro with the standardset of policies to detect worms (distributed with the Bro software) on a trace, and then runBro using the set of signatures generated by Autograph on that same trace. The true positiverate is the fraction of the total number of worms found by Bro’s signatures (presumed to findall worms) also found by Autograph’s signatures.
To measure false positives (fraction of non-worm flows matched by Autograph’s signa-tures), we create a sanitized trace consisting of all non-worm traffic. To do so, we eliminate allflows from a trace that are identified by Bro as worms. We then run Bro using Autograph’ssignatures on the sanitized trace. The false positive rate is the fraction of all flows in thesanitized trace identified by Autograph’s signatures as worms.
Because the number of false positives is very low compared to the total number of HTTPflows in the trace, we report our false positive results using the efficiency metric proposedby Staniford et al. [126]. Efficiency is the ratio of the number of true positives to the totalnumber of positives, both false and true. Efficiency is proportional to the number of falsepositives.
The graphs in Figure 3.5 show the sensitivity and the efficiency of the signatures gener-ated by Autograph running on the full 24-hour ICSI trace for varied m. Here, we presentexperimental results for s = 2, but the results for other s are similar. Note that in these ex-periments, we apply the signatures Autograph generates from the 24-hour trace to the same24-hour trace used to generate them.
The x axis varies w. As w increases, the set of signatures Autograph generates leads togreater sensitivity (fewer false negatives). This result is expected; greater w values causeAutograph to add content blocks to the signature set for an ever-greater fraction of the sus-picious flow pool. Thus, if a worm appears rarely in the suspicious flow pool, and thusgenerates non-prevalent content blocks, those blocks will eventually be included in the sig-nature set, for sufficiently large w.
However, recall from Figure 3.4 that about 5% of the suspicious flows are innocuousflows that are misclassified by the port-scanner heuristic as suspicious. As a result, for w >
95%, COPP risks generating a less specific signature set, as COPP begins to select contentblocks from the innocuous flows. Those content blocks are most often HTTP trailers, foundin common across misclassified innocuous flows.
30
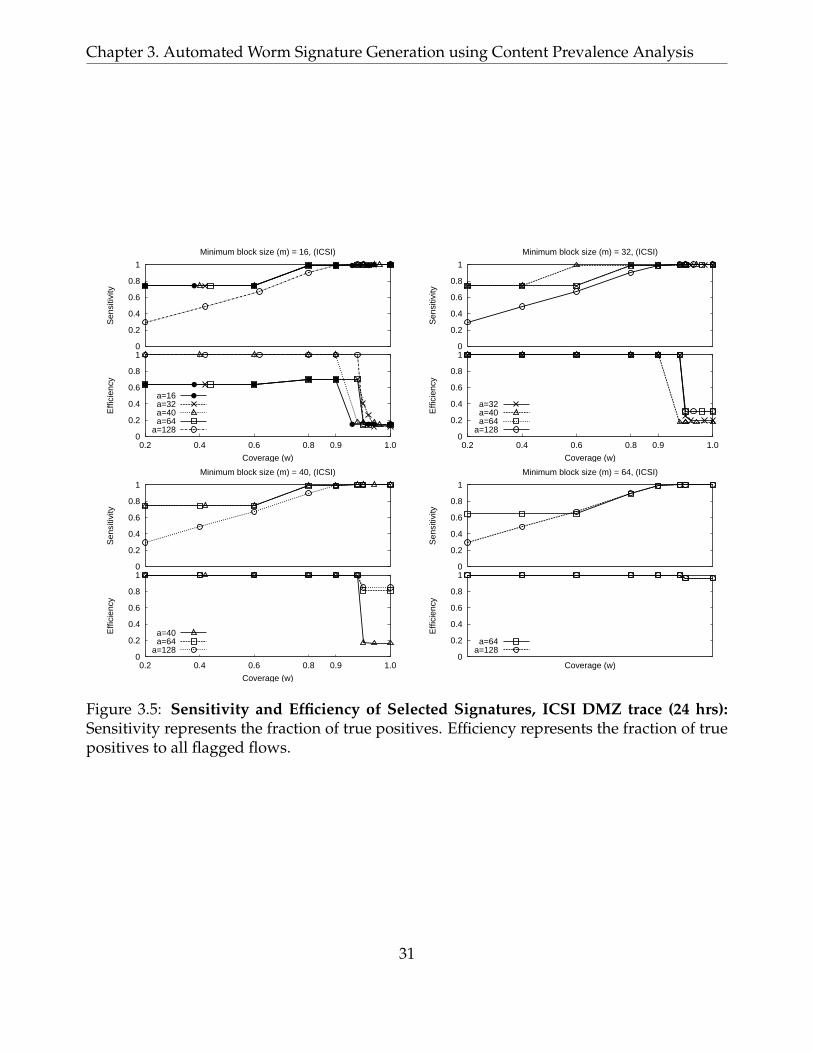
Chapter 3. Automated Worm Signature Generation using Content Prevalence Analysis
0
0.2
0.4
0.6
0.8
1
0.2 0.4 0.6 0.8 0.9 1.0
Effi
cien
cy
Coverage (w)
a=16a=32a=40a=64
a=128
0
0.2
0.4
0.6
0.8
1
Sen
sitiv
ity
Minimum block size (m) = 16, (ICSI)
0
0.2
0.4
0.6
0.8
1
0.2 0.4 0.6 0.8 0.9 1.0
Effi
cien
cy
Coverage (w)
a=32a=40a=64
a=128
0
0.2
0.4
0.6
0.8
1
Sen
sitiv
ity
Minimum block size (m) = 32, (ICSI)
0
0.2
0.4
0.6
0.8
1
0.2 0.4 0.6 0.8 0.9 1.0
Effi
cien
cy
Coverage (w)
a=40a=64
a=128
0
0.2
0.4
0.6
0.8
1
Sen
sitiv
ity
Minimum block size (m) = 40, (ICSI)
0
0.2
0.4
0.6
0.8
1
Effi
cien
cy
Coverage (w)
a=64a=128
0
0.2
0.4
0.6
0.8
1
Sen
sitiv
ity
Minimum block size (m) = 64, (ICSI)
Figure 3.5: Sensitivity and Efficiency of Selected Signatures, ICSI DMZ trace (24 hrs):Sensitivity represents the fraction of true positives. Efficiency represents the fraction of truepositives to all flagged flows.
31
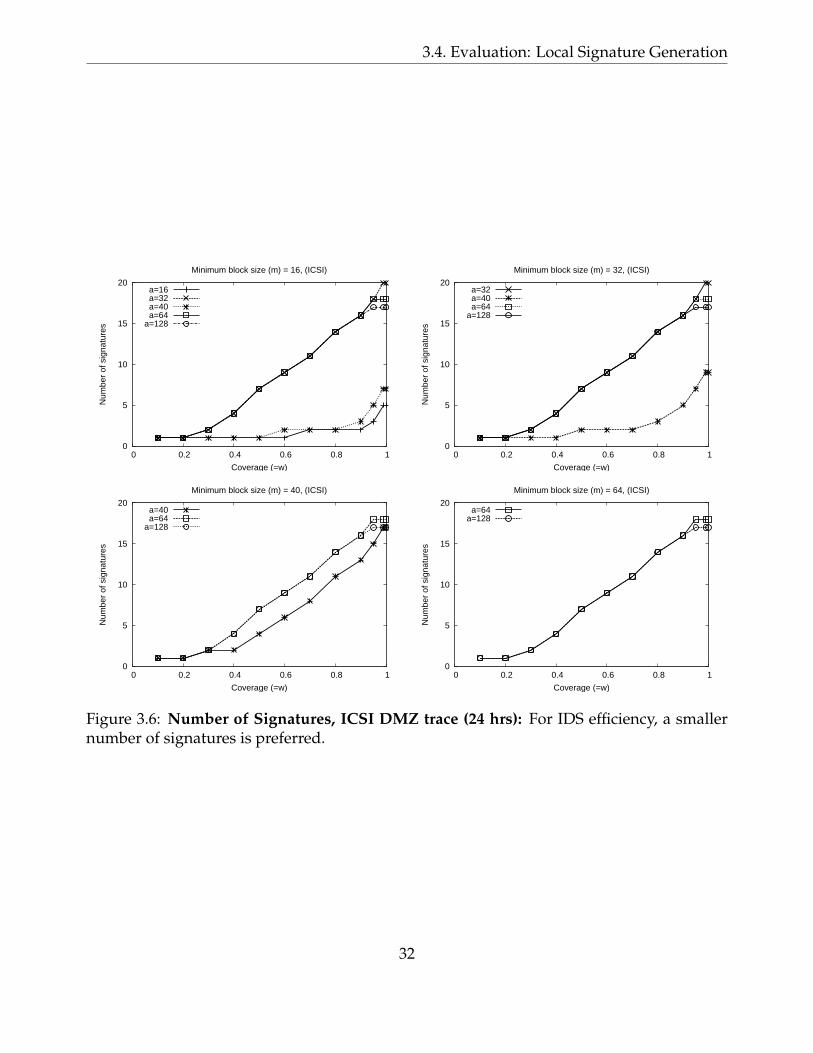
3.4. Evaluation: Local Signature Generation
0
5
10
15
20
0 0.2 0.4 0.6 0.8 1
Num
ber
of s
igna
ture
s
Coverage (=w)
Minimum block size (m) = 16, (ICSI)
a=16 a=32 a=40 a=64
a=128
0
5
10
15
20
0 0.2 0.4 0.6 0.8 1
Num
ber
of s
igna
ture
s
Coverage (=w)
Minimum block size (m) = 32, (ICSI)
a=32 a=40 a=64
a=128
0
5
10
15
20
0 0.2 0.4 0.6 0.8 1
Num
ber
of s
igna
ture
s
Coverage (=w)
Minimum block size (m) = 40, (ICSI)
a=40 a=64
a=128
0
5
10
15
20
0 0.2 0.4 0.6 0.8 1
Num
ber
of s
igna
ture
s
Coverage (=w)
Minimum block size (m) = 64, (ICSI)
a=64 a=128
Figure 3.6: Number of Signatures, ICSI DMZ trace (24 hrs): For IDS efficiency, a smallernumber of signatures is preferred.
32

Chapter 3. Automated Worm Signature Generation using Content Prevalence Analysis
For this trace, COPP with w ∈ [90%, 94.8%] produces a set of signatures that is perfect: itcauses 0 false negatives and 0 false positives. Our claim is not that this w parameter value isvalid for traces at different sites, or even at different times; on the contrary, we expect that therange in which no false positives and no false negatives occurs is sensitive to the details ofthe suspicious flow population. Note, however, that the existence of a range of w values forwhich perfect sensitivity and specificity are possible serves as a very preliminary validationof the COPP approach—if no such range existed for this trace, COPP would always be forcedto trade false negatives for false positives, or vice-versa, for any w parameter setting. Furtherevaluation of COPP on a more diverse and numerous set of traffic traces is clearly requiredto determine whether such a range exists for a wider range of workloads.
During examination of the false positive cases found by Autograph-generated signa-tures when w > 94.8%, we noted with interest that Autograph’s signatures detected Nimdasources not detected by Bro’s stock signatures. There are only three stock signatures usedby Bro to spot a Nimda source, and the Nimda sources in the ICSI trace did not transmitthose particular payloads. We removed these few cases from the count of false positives,as Autograph’s signatures correctly identified them as worm flows, and thus we had erro-neously flagged them as false positives by assuming that any flow not caught by Bro’s stocksignatures is not a worm.
We now turn to the effect of content block size on the specificity and the number ofsignatures Autograph generates. Even in the presence of innocuous flows misclassified assuspicious, the largest average and minimum content block sizes (such as 64 and 128 bytes)avoid most false positives; efficiency remains close to 1. We expect this result because in-creased block size lowers the probability of finding common content across misclassifiedflows during the signature generation process. Moreover, as signature length increases, thenumber of innocuous flows that match a signature decreases. Thus, choosing larger a and mvalues will help Autograph avoid generating signatures that cause false positives.
Note, however, there is a trade-off between content block length and the number of sig-natures Autograph generates, too. For large a and m, it is more difficult for COPP to detectcommonality across worm flows unless the flows are identical. So as a and m increase, COPPmust select more signatures to match any group of variants of a worm that contain somecommon content. The graphs in Figure 3.6 present the size of the signature set Autographgenerates as a function of w. For smaller a and m, Autograph needs fewer content blocks tocover w percent of the suspicious flows. In this trace, for example, COPP can select a shortbyte sequence in common across different Nimda payload variants (e.g., cmd.exe?c+dirHTTP/1.0..Host:www..Connection: close....) when we use small a and m, such
33

3.4. Evaluation: Local Signature Generation
as 16. The size of the signature set becomes a particular concern when worms aggressivelyvary their content across infection attempts, as we discuss in the next section. Before contin-uing on, we note that results obtained running Autograph on the IRP and ICSI2 traces arequite similar to those reported above.
3.4.2 Polymorphic and Metamorphic Worms
0
2
4
6
8
10
12
14
16
18
8 24 16 32 40 48 64 128
Average Chunk Size (a)
Num
ber
of S
igna
ture
s
m=8 m=16 m=24 m=32 m=40 m=48 m=64
Figure 3.7: Content block size vs. number of signatures: Autograph finds a short signa-ture that match all instances of a polymorphic worm if content block size parameters (m:minimum content block size) are set to small values.
We expect short content blocks to be most robust against worms that vary their content,such as polymorphic worms, which encrypt their content differently on each connection,and metamorphic worms, which obfuscate their instruction sequences on each connection.Unfortunately (fortunately?) no such Internet worm has yet been reported in the wild. Totest Autograph’s robustness against these varying worms, we generate a synthetic polymor-phic worm based on the Code-RedII payload. A Code-RedII worm payload consists of aregular HTTP GET header, more than 220 filler characters, a sequence of Unicode, and themain worm executable code. The Unicode sequence causes a buffer overflow and transfersexecution flow to the subsequent worm binary. We use random values for all filler bytes, andeven for the worm code, but leave the HTTP GET command and 56-byte Unicode sequence
34
Chapter 3. Automated Worm Signature Generation using Content Prevalence Analysis
fixed. This degree of variation in content is more severe than that introduced by the vari-ous obfuscation techniques discussed by Christodorescu et al. [25]. As shown in Figure 3.7,when a relatively short, invariant string is present in a polymorphic or metamorphic worm,Autograph can find a short signature that matches it, when run with small average and min-imum content block sizes. However, such short content block sizes may be unspecific, andthus yield signatures that cause false positives.
3.5 P2P Traffic and Signature Generation
Since the early 2000s, peer-to-peer (P2P) networks have been widely used in large file shar-ing application development, and the volume of P2P application traffic continues to grow [66].P2P applications use many-to-many connections to distribute data efficiently, which leadsto similarity between P2P application traffic and worm traffic in terms of content prevalenceand wide-spreading behavior. This similarity could introduce significant amount of noiseinto Autograph.
In this section, we analyze the effect of P2P application traffic on Autograph. In particu-lar, we are interested in answering the following three questions.
• How frequently does Autograph generate false signatures due to P2P application traf-fic?
• How similar is P2P traffic with worm traffic? And,
• how do we reduce the false positives caused by P2P application traffic?
To answer the questions, we test Autograph with a trace collected at a gateway of auniversity campus network. We will describe the details of the trace in Section 3.5.1 as wereport our observation.
Our experiments show that Autograph does generate a few unspecific signatures fromP2P file sharing application traffic. Even though the number of those unspecific signatures issmall, the use of those unspecific signatures may interrupt one of the popular applications.Our investigation of P2P application traffic shows that traffic from many popular P2P filesharing applications mimics the traffic characteristics of worm traffic. Moreover, it may bedifficult to avoid generating unspecific signatures from P2P traffic if automated signaturegeneration systems rely only on content invariance and wide-spreading behavior analysis.Combining other worm detection heuristics such as port scanner detection helps avoid gen-erating unspecific signatures.
35
3.5. P2P Traffic and Signature Generation
3.5.1 Empirical Results: False Positives
We first examine the quality of the signatures Autograph generates in an online setting andthe number of signatures generated from P2P application traffic. In an online deployment,Autograph holds suspicious flows observed during the last t minutes, provided that thenumber of suspicious flows accumulated exceeds θ.
The suspicious flow pool stores all suspicious flows observed during the last t minutes.If t is too short, it is unlikely that the pool will contain enough flows to generate a signaturefor a slowly propagating worm early in its propagation. Too long a t is also undesirable, asthe number of flows Autograph has to store and process will be large. Moreover, the longert is, the more likely the pool will include content blocks from innocuous flows from multiplesources. We enable filtering of content blocks that originate at only one source IP addressbefore signature generation, as described in Section 3.3. In this experiment, we consider t =10 minutes, which is long enough for this network to generate signatures for the CodeRedI-v2 worm before the worm infects 5% of vulnerable hosts in the Internet.5 We set w and s tobe w = 94% and s = 2 respectively. We set the average content block size a = 64Bytes.
In our experiments, we feed Autograph an 1-hour traffic payload trace collected froma campus network gateway in August 2005. The network has one class-B address blockand one class-C address block. The trace was captured with a DAG-4 monitor and packetcapture software [44] installed on an 1 Gbps interface at the border gateway. The gatewayhas three 1 Gbps interfaces and performs load balancing. Thus, the trace capture one thirdof incoming traffic toward the campus. The trace includes 376 millions of IP packets (i.e., 185GB in byte volume). We check the trace with bro and its worm signature definitions [102],and find none of well-known recent worms are present in the trace.
With the above parameter setting, Autograph generates four ’unspecific’ signatures: twosignatures from port 80, and two other signatures from port 9493. Figure 3.8 shows thosefour payload pattern strings with the port numbers. Port 9493 is used by a P2P-based filesharing system (FileGuri 6) popular in Asia. Port 80 is a well-known web port. Both portsuse the HTTP-based protocol, so we could easily find where this payload pattern belongsin each flow. SIG1 specifies the application name and its version number, and they appearin the HTTP header portion of every control message of the P2P system. SIG3 and SIG4
are from the HTTP headers of messages. Understanding the structure of the HTTP protocol,
5The measurement window length t is computed based on simulation, where every infected host scans atthe rate of 358 scans/minute and 360, 000 vulnerable hosts exist. The campus network has more than 3300hosts with port 80 open.
6FileGuri (Korean P2P file sharing application) http://www.fileguri.com
36
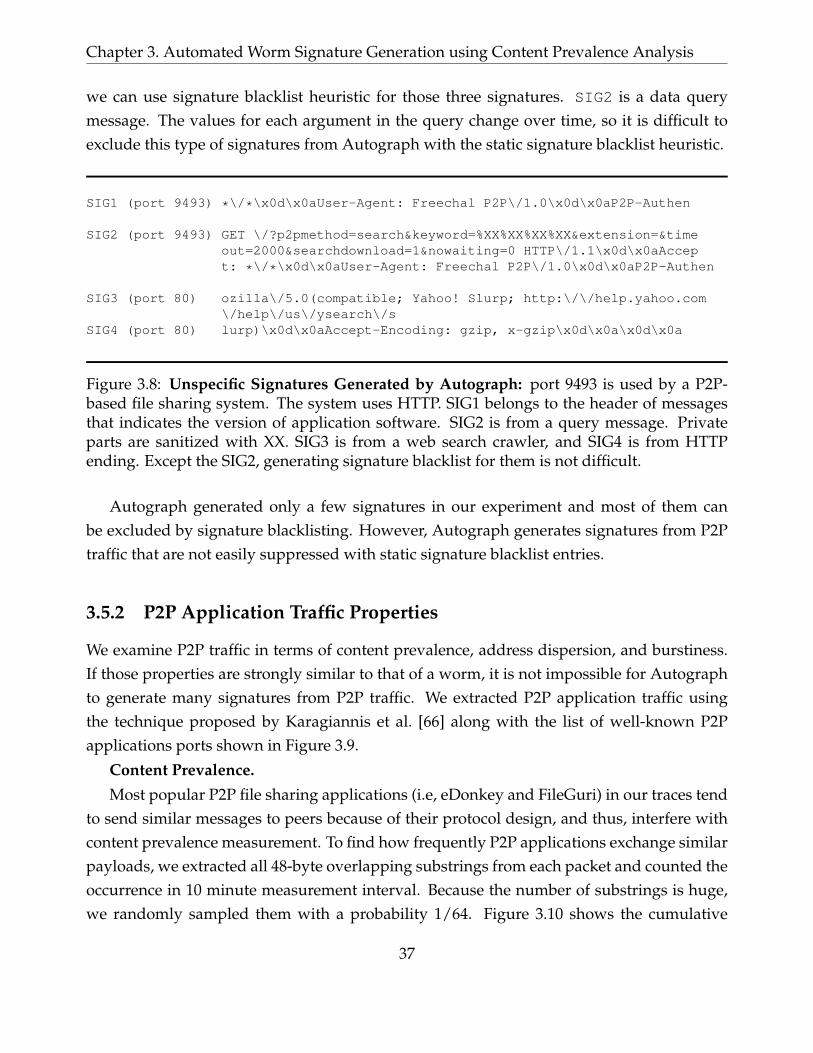
Chapter 3. Automated Worm Signature Generation using Content Prevalence Analysis
we can use signature blacklist heuristic for those three signatures. SIG2 is a data querymessage. The values for each argument in the query change over time, so it is difficult toexclude this type of signatures from Autograph with the static signature blacklist heuristic.
SIG1 (port 9493) *\/*\x0d\x0aUser-Agent: Freechal P2P\/1.0\x0d\x0aP2P-Authen
SIG2 (port 9493) GET \/?p2pmethod=search&keyword=%XX%XX%XX%XX&extension=&timeout=2000&searchdownload=1&nowaiting=0 HTTP\/1.1\x0d\x0aAccept: *\/*\x0d\x0aUser-Agent: Freechal P2P\/1.0\x0d\x0aP2P-Authen
SIG3 (port 80) ozilla\/5.0(compatible; Yahoo! Slurp; http:\/\/help.yahoo.com\/help\/us\/ysearch\/s
SIG4 (port 80) lurp)\x0d\x0aAccept-Encoding: gzip, x-gzip\x0d\x0a\x0d\x0a
Figure 3.8: Unspecific Signatures Generated by Autograph: port 9493 is used by a P2P-based file sharing system. The system uses HTTP. SIG1 belongs to the header of messagesthat indicates the version of application software. SIG2 is from a query message. Privateparts are sanitized with XX. SIG3 is from a web search crawler, and SIG4 is from HTTPending. Except the SIG2, generating signature blacklist for them is not difficult.
Autograph generated only a few signatures in our experiment and most of them canbe excluded by signature blacklisting. However, Autograph generates signatures from P2Ptraffic that are not easily suppressed with static signature blacklist entries.
3.5.2 P2P Application Traffic Properties
We examine P2P traffic in terms of content prevalence, address dispersion, and burstiness.If those properties are strongly similar to that of a worm, it is not impossible for Autographto generate many signatures from P2P traffic. We extracted P2P application traffic usingthe technique proposed by Karagiannis et al. [66] along with the list of well-known P2Papplications ports shown in Figure 3.9.
Content Prevalence.
Most popular P2P file sharing applications (i.e, eDonkey and FileGuri) in our traces tendto send similar messages to peers because of their protocol design, and thus, interfere withcontent prevalence measurement. To find how frequently P2P applications exchange similarpayloads, we extracted all 48-byte overlapping substrings from each packet and counted theoccurrence in 10 minute measurement interval. Because the number of substrings is huge,we randomly sampled them with a probability 1/64. Figure 3.10 shows the cumulative
37
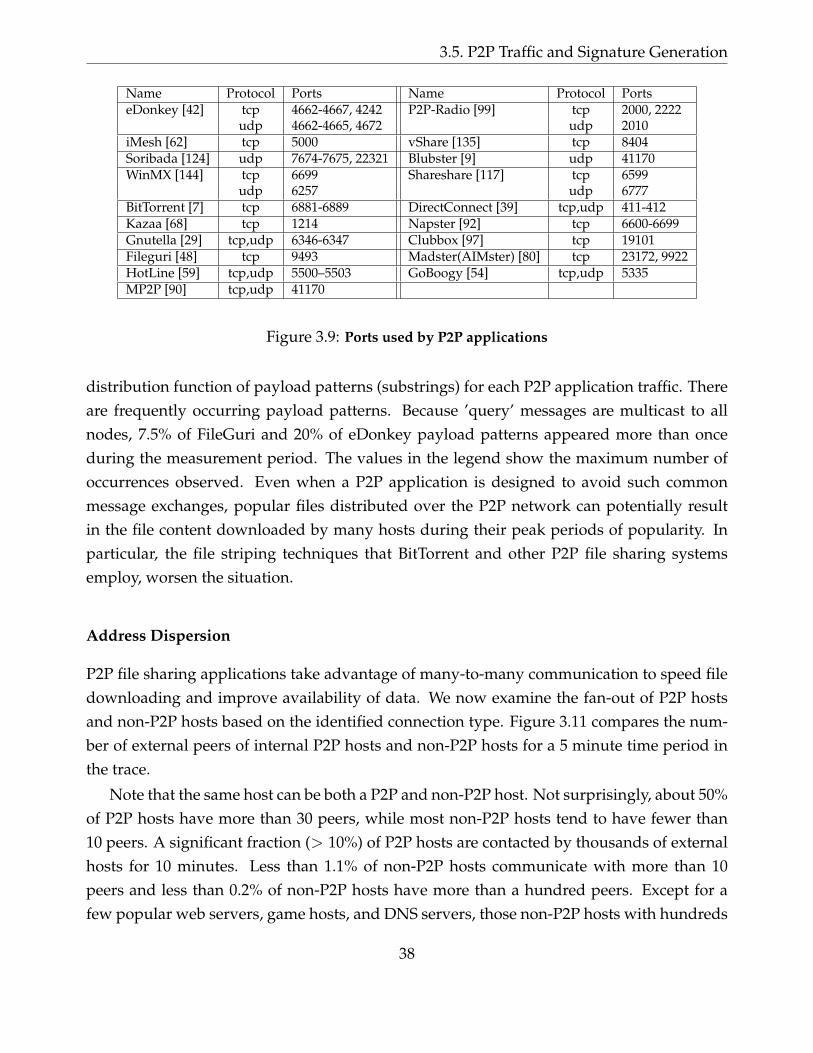
3.5. P2P Traffic and Signature Generation
Name Protocol Ports Name Protocol PortseDonkey [42] tcp 4662-4667, 4242 P2P-Radio [99] tcp 2000, 2222
udp 4662-4665, 4672 udp 2010iMesh [62] tcp 5000 vShare [135] tcp 8404Soribada [124] udp 7674-7675, 22321 Blubster [9] udp 41170WinMX [144] tcp 6699 Shareshare [117] tcp 6599
udp 6257 udp 6777BitTorrent [7] tcp 6881-6889 DirectConnect [39] tcp,udp 411-412Kazaa [68] tcp 1214 Napster [92] tcp 6600-6699Gnutella [29] tcp,udp 6346-6347 Clubbox [97] tcp 19101Fileguri [48] tcp 9493 Madster(AIMster) [80] tcp 23172, 9922HotLine [59] tcp,udp 5500–5503 GoBoogy [54] tcp,udp 5335MP2P [90] tcp,udp 41170
Figure 3.9: Ports used by P2P applications
distribution function of payload patterns (substrings) for each P2P application traffic. Thereare frequently occurring payload patterns. Because ’query’ messages are multicast to allnodes, 7.5% of FileGuri and 20% of eDonkey payload patterns appeared more than onceduring the measurement period. The values in the legend show the maximum number ofoccurrences observed. Even when a P2P application is designed to avoid such commonmessage exchanges, popular files distributed over the P2P network can potentially resultin the file content downloaded by many hosts during their peak periods of popularity. Inparticular, the file striping techniques that BitTorrent and other P2P file sharing systemsemploy, worsen the situation.
Address Dispersion
P2P file sharing applications take advantage of many-to-many communication to speed filedownloading and improve availability of data. We now examine the fan-out of P2P hostsand non-P2P hosts based on the identified connection type. Figure 3.11 compares the num-ber of external peers of internal P2P hosts and non-P2P hosts for a 5 minute time period inthe trace.
Note that the same host can be both a P2P and non-P2P host. Not surprisingly, about 50%of P2P hosts have more than 30 peers, while most non-P2P hosts tend to have fewer than10 peers. A significant fraction (> 10%) of P2P hosts are contacted by thousands of externalhosts for 10 minutes. Less than 1.1% of non-P2P hosts communicate with more than 10peers and less than 0.2% of non-P2P hosts have more than a hundred peers. Except for afew popular web servers, game hosts, and DNS servers, those non-P2P hosts with hundreds
38
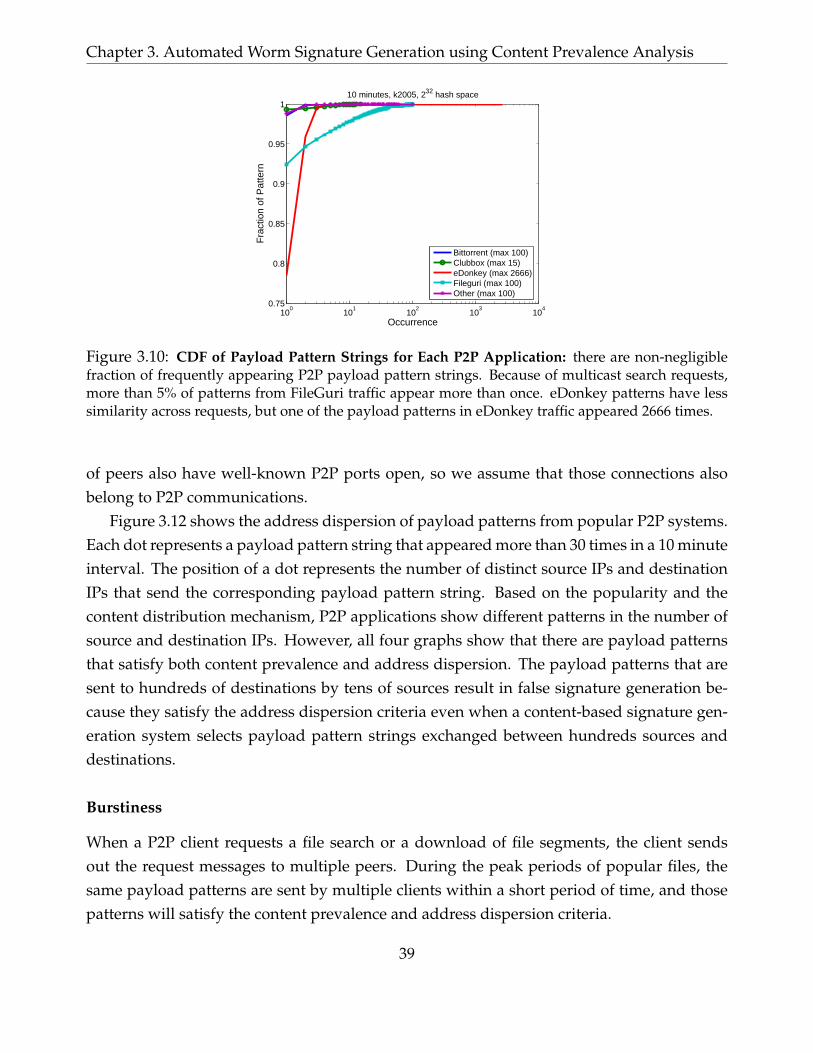
Chapter 3. Automated Worm Signature Generation using Content Prevalence Analysis
100
101
102
103
104
0.75
0.8
0.85
0.9
0.95
110 minutes, k2005, 232 hash space
Occurrence
Fra
ctio
n of
Pat
tern
Bittorrent (max 100)Clubbox (max 15)eDonkey (max 2666)Fileguri (max 100)Other (max 100)
Figure 3.10: CDF of Payload Pattern Strings for Each P2P Application: there are non-negligiblefraction of frequently appearing P2P payload pattern strings. Because of multicast search requests,more than 5% of patterns from FileGuri traffic appear more than once. eDonkey patterns have lesssimilarity across requests, but one of the payload patterns in eDonkey traffic appeared 2666 times.
of peers also have well-known P2P ports open, so we assume that those connections alsobelong to P2P communications.
Figure 3.12 shows the address dispersion of payload patterns from popular P2P systems.Each dot represents a payload pattern string that appeared more than 30 times in a 10 minuteinterval. The position of a dot represents the number of distinct source IPs and destinationIPs that send the corresponding payload pattern string. Based on the popularity and thecontent distribution mechanism, P2P applications show different patterns in the number ofsource and destination IPs. However, all four graphs show that there are payload patternsthat satisfy both content prevalence and address dispersion. The payload patterns that aresent to hundreds of destinations by tens of sources result in false signature generation be-cause they satisfy the address dispersion criteria even when a content-based signature gen-eration system selects payload pattern strings exchanged between hundreds sources anddestinations.
Burstiness
When a P2P client requests a file search or a download of file segments, the client sendsout the request messages to multiple peers. During the peak periods of popular files, thesame payload patterns are sent by multiple clients within a short period of time, and thosepatterns will satisfy the content prevalence and address dispersion criteria.
39
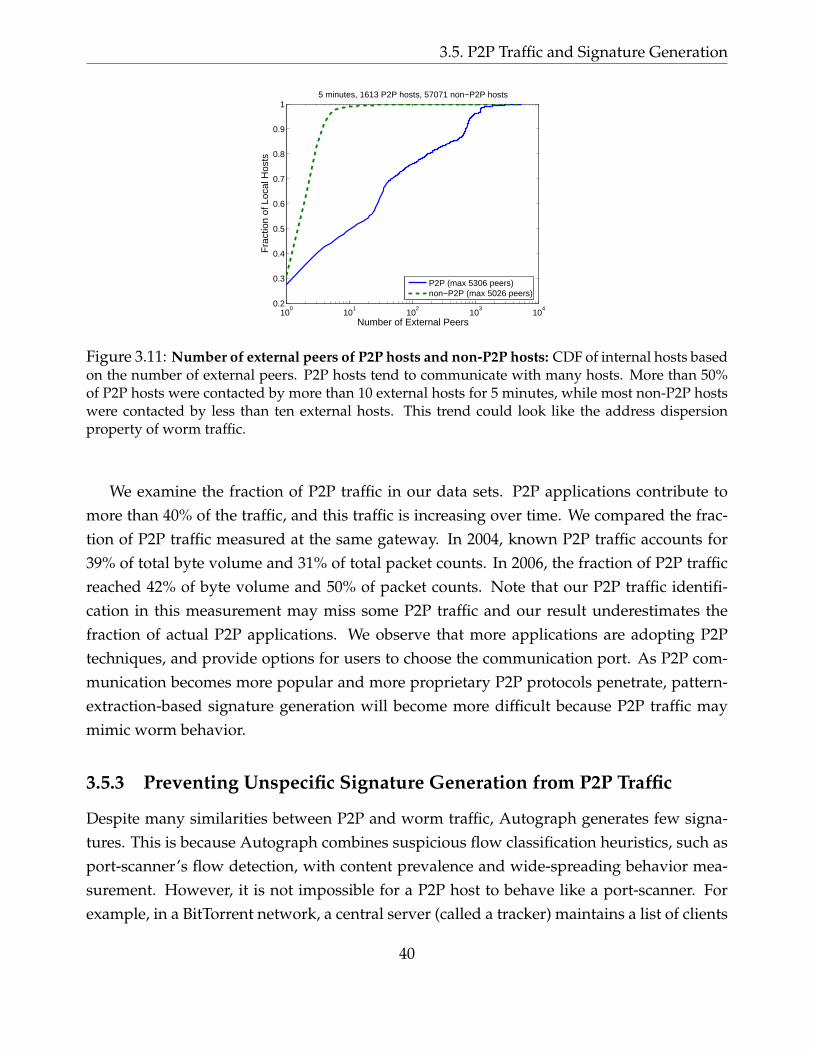
3.5. P2P Traffic and Signature Generation
100
101
102
103
104
0.2
0.3
0.4
0.5
0.6
0.7
0.8
0.9
1
Number of External Peers
Fra
ctio
n of
Loc
al H
osts
5 minutes, 1613 P2P hosts, 57071 non−P2P hosts
P2P (max 5306 peers)non−P2P (max 5026 peers)
Figure 3.11: Number of external peers of P2P hosts and non-P2P hosts: CDF of internal hosts basedon the number of external peers. P2P hosts tend to communicate with many hosts. More than 50%of P2P hosts were contacted by more than 10 external hosts for 5 minutes, while most non-P2P hostswere contacted by less than ten external hosts. This trend could look like the address dispersionproperty of worm traffic.
We examine the fraction of P2P traffic in our data sets. P2P applications contribute tomore than 40% of the traffic, and this traffic is increasing over time. We compared the frac-tion of P2P traffic measured at the same gateway. In 2004, known P2P traffic accounts for39% of total byte volume and 31% of total packet counts. In 2006, the fraction of P2P trafficreached 42% of byte volume and 50% of packet counts. Note that our P2P traffic identifi-cation in this measurement may miss some P2P traffic and our result underestimates thefraction of actual P2P applications. We observe that more applications are adopting P2Ptechniques, and provide options for users to choose the communication port. As P2P com-munication becomes more popular and more proprietary P2P protocols penetrate, pattern-extraction-based signature generation will become more difficult because P2P traffic maymimic worm behavior.
3.5.3 Preventing Unspecific Signature Generation from P2P Traffic
Despite many similarities between P2P and worm traffic, Autograph generates few signa-tures. This is because Autograph combines suspicious flow classification heuristics, such asport-scanner’s flow detection, with content prevalence and wide-spreading behavior mea-surement. However, it is not impossible for a P2P host to behave like a port-scanner. Forexample, in a BitTorrent network, a central server (called a tracker) maintains a list of clients
40
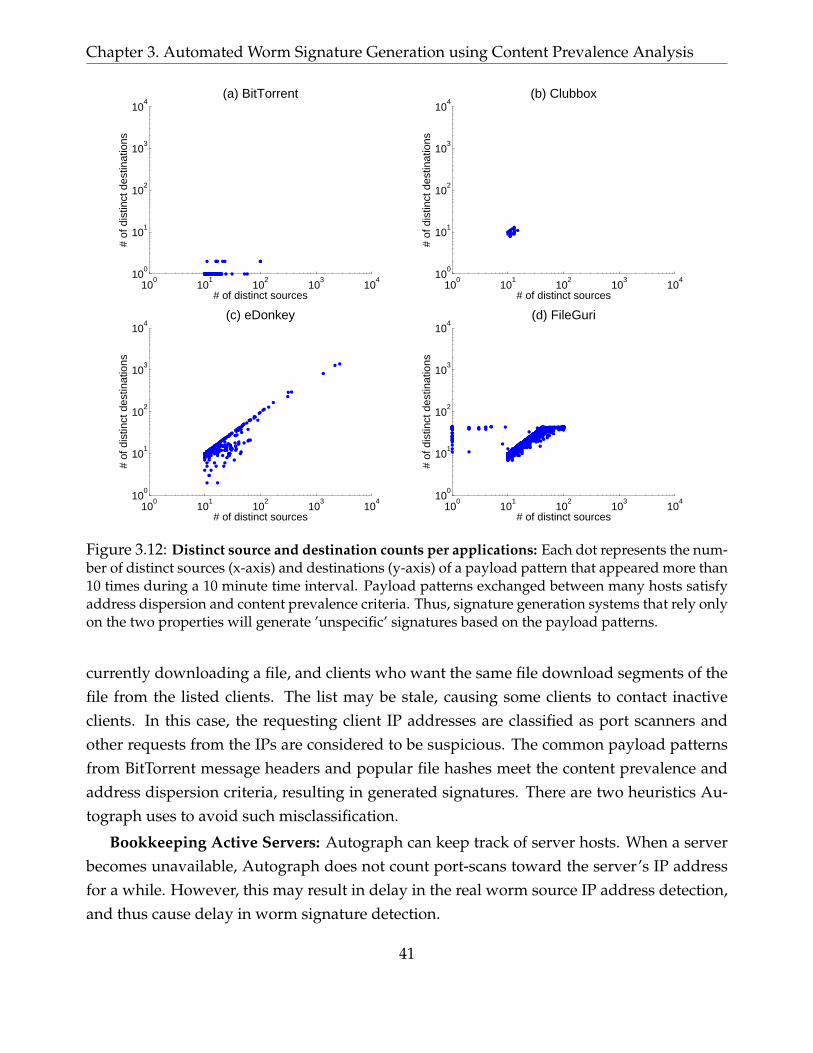
Chapter 3. Automated Worm Signature Generation using Content Prevalence Analysis
100
101
102
103
104
100
101
102
103
104
# of distinct sources
# of
dis
tinct
des
tinat
ions
(a) BitTorrent
100
101
102
103
104
100
101
102
103
104
# of
dis
tinct
des
tinat
ions
# of distinct sources
(b) Clubbox
100
101
102
103
104
100
101
102
103
104
# of
dis
tinct
des
tinat
ions
# of distinct sources
(c) eDonkey
100
101
102
103
104
100
101
102
103
104
# of
dis
tinct
des
tinat
ions
# of distinct sources
(d) FileGuri
Figure 3.12: Distinct source and destination counts per applications: Each dot represents the num-ber of distinct sources (x-axis) and destinations (y-axis) of a payload pattern that appeared more than10 times during a 10 minute time interval. Payload patterns exchanged between many hosts satisfyaddress dispersion and content prevalence criteria. Thus, signature generation systems that rely onlyon the two properties will generate ’unspecific’ signatures based on the payload patterns.
currently downloading a file, and clients who want the same file download segments of thefile from the listed clients. The list may be stale, causing some clients to contact inactiveclients. In this case, the requesting client IP addresses are classified as port scanners andother requests from the IPs are considered to be suspicious. The common payload patternsfrom BitTorrent message headers and popular file hashes meet the content prevalence andaddress dispersion criteria, resulting in generated signatures. There are two heuristics Au-tograph uses to avoid such misclassification.
Bookkeeping Active Servers: Autograph can keep track of server hosts. When a serverbecomes unavailable, Autograph does not count port-scans toward the server’s IP addressfor a while. However, this may result in delay in the real worm source IP address detection,and thus cause delay in worm signature detection.
41
3.6. Attacks and Limitations
Higher Port Scanner Detection Threshold for P2P Ports: Autograph can choose a higherthreshold s for P2P traffic monitoring. For example, when we use the scanner detectionthreshold s ∈ [3, 4] on the same trace, Autograph does not generate any signature from P2Ptraffic. Similarly, combining better worm flow selection heuristics with content prevalenceanalysis reduces the false positive rate. However, no heuristic is perfect; Heuristics canintroduce more false negatives. Thus, choosing heuristics must be done carefully.
3.6 Attacks and Limitations
We catalog a few attacks that one might mount against Autograph, and limitations of thecurrent system.
Overload. Autograph reassembles suspicious TCP flows. Flow reassembly is costly instate in comparison with processing packets individually, but defeats the subterfuge of frag-menting a worm’s payload across many small packets [102]. We note that the number ofinbound flows a monitor observes may be large, in particular after a worm spreads success-fully. If Autograph tries to reassemble every incoming suspicious flow, it may be susceptibleto DoS attack. We note that Autograph treats all destination ports separately, and thus paral-lelizes well across ports; a site could run multiple instances of Autograph on separate hard-ware, and thus increase its aggregate processing power, for flow reassembly and all otherprocessing. Autograph may also sample suspicious flows when the number of suspiciousflows to process exceeds some threshold; we intend to investigate this heuristic in future.
Source-address-spoofed port scans. Port scans from spoofed IP source addresses are aperil for most IDSes. The chief reason for monitoring port scans is to limit the damagetheir originators can inflict, most often by filtering packets that originate from known portscanners. Such filtering invites attackers to spoof port scans from the IP addresses of thosewhose traffic they would like to block [102, 64]. Source-spoofed port scans can be usedto mount a new type of Denial-of-Service (DoS) attacks. A source-spoofing attacker couldcause a remote source’s traffic to be included by Autograph in signature generation.
Fortunately, a simple mechanism holds promise for rendering both these attacks ineffec-tive. Autograph classifies an inbound SYN destined for an unpopulated IP address or portwith no listening process as a port scan. To identify TCP port scans from spoofed IP sourceaddresses, an Autograph monitor could respond to such inbound SYNs with a SYN/ACK,provided the router and/or firewall on the monitored network can be configured not to
42
Chapter 3. Automated Worm Signature Generation using Content Prevalence Analysis
respond with an ICMP host or port unreachable. If the originator of the connection re-sponds with an ACK with the appropriate sequence number, the source address on the SYNcould not have been spoofed. The monitor may thus safely view all source addresses thatsend proper ACK responses to SYN/ACKs as port scanners. Non-ACK responses to theseSYN/ACKs (RSTs or silence) can then be ignored; i.e., the source address of the SYN is notrecorded as a port scanner. Note that while a non-source-spoofing port scanner may choosenot to respond with an ACK, any source that hopes to complete a connection and success-fully transfer an infecting payload must respond with an ACK, and thus identify itself as aport scanner. Jung et al. independently propose this same technique in [64].
Worms with scanning suppression techniques. If a worm employes scanning suppressiontechniques, such as hit-list scanning (i.e a Warhol worm), permutation scanning (i.e. wormsthat use self-coordinating scanning), topological scanning (i.e. worms that harvest the nextvictims’ IP addresses from already infected victim), internal-sized hit list scanning (i.e. a flashworm) [127], rather than randomly scans IP addresses that may or may not correspond tolistening servers, Autograph’s port-scan-based suspicious flow classifier will fail utterly toinclude that worm’s payloads in signature generation. Malicious payload gathering meth-ods such as honeypots are similarly stymied by hit-list worm propagation. Nevertherless,any innovation in the detection of flows generated by hit-list based worms may be incorpo-rated into Autograph, to augment or replace the naive port-scan-based heuristic used in ourprototype. For example, we envision that Autograph captures all the flows in and out of thepotential bot hosts detected by the hit-list worm detection algorithm described in Collinsand Reiter’s work [31], and applies payload analysis against all the flows to find payload-based signatures of the worm.
3.7 Summary
We have presented Autograph, a system that automatically generates signatures for novelInternet worms that propagate using TCP transport and perform random scanning. Auto-graph generates signatures by analyzing the popularity of portions of flow payloads, with-out requiring knowledge of application protocols above the TCP layer. We evaluated theprototype of Autograph with a real DMZ trace and showed that Autograph can producesignatures that exhibit high sensitivity and high selectivity. P2P application traffic sharesmany similarities with worm traffic, which makes purely content-based signature genera-tion difficult to produce signatures specific to worms. Combination with suspicious flow
43

3.7. Summary
selection heuristics helps reduce false positives caused by P2P application, but the choice ofsuch heuristics may narrow the range of detectable worms, and must be made carefully.
44
Chapter 4
Distributed Signature Generation withPort-Scanner List Sharing
At the start of a worm’s propagation, the aggregate rate at which all infected hosts scan themonitored IP address space is quite low. Because Autograph relies on overhearing unsuc-cessful scans to identify suspicious source IP addresses, early in an epidemic an Autographmonitor will be slow to accumulate suspicious addresses, and in turn slow to accumulateworm payloads. In this chapter, we examine Autograph’s speed in detecting a signature fora new worm after the worm’s release and utilize distributed port-scanner detection to expe-dite Autograph’s signature detection. The main contributions of our work are summarizedas follows:
• We demonstrate that operating multiple, distributed instances of Autograph signifi-cantly speeds up this process, compared to running a single instance of Autographon a single edge network. We use a combination of simulation of a worm’s propa-gation and DMZ-trace-driven simulation to evaluate the system in the online setting;our sense of ethics restrains us from experimentally measuring Autograph’s speed atdetecting a novel worm in vivo.
• We propose the tattler mechanism that allows distributed Autograph monitors to tattleto one another about port scanners without overloading the network even when thenumber of port scanners increases due to the worm propagation.
Measuring how quickly Autograph detects and generates a signature for a newly re-leased worm is important because it has been shown in the literature that successfully con-taining a worm requires early intervention. Recall that Provos’ results [105] show that re-versing an epidemic such that fewer than 50% of vulnerable hosts ever become infected can
45
4.1. Single vs. Multiple Monitors
require intervening in the worm’s propagation before 5% of vulnerable hosts are infected.Two delays contribute to the total delay of signature generation:
• How long must an Autograph monitor wait until it accumulates enough worm pay-loads to generate a signature for that worm?
• Once an Autograph monitor receives sufficient worm payloads, how long will it taketo generate a signature for the worm, given the background “noise” (innocuous flowsmisclassified as suspicious) in the trace?
We first compare the signature detection speed when we rely on a single Autographmonitor and utilize multiple, distributed instances of Autograph monitors in Section 4.1.Motivated by the analysis, we propose, in Section 4.2, an extension of Autograph that allowsdistributed monitors to collaboratively identify suspicious addresses and speeds up suspi-cious address identification. We measure the performance of the distributed Autograph interms of its bandwidth consumption and worm payload accumulation speed in Section 4.3and Section 4.4, respectively. In Section 4.5, we evaluate the signature detection time whena Code-RedI-v2-like worm propagates. Our results elucidate the fundamental trade-off be-tween early generation of signatures for novel worms and the specificity of these generatedsignature. After discussing the value of distributed monitoring in a heterogeneous networkenvironment and the possible attacks against distributed Autograph in Section 4.6, we sum-marize our findings in Section 4.7.
4.1 Single vs. Multiple Monitors
The probability of observing probes from a worm-infected host is proportional to the sizeof monitored network, D, and the fraction of unoccupied IP addresses in the network, r.The probability is D·r
Ω when Ω is the size of the worm’s scanning space. For a random-ized scanning worm with the probe rate s, we can model the number of scans as a Poissonprocess. The probability that si scans hit the monitor during a time interval of length t isPsi(t) = e−αt·(αt)si
si!, α = s · Dr
Ω . Thus, the probability that the Autograph monitor receivesmore than or equal to s scans from a worm-infected source is 1−∑s−1
si=0 Psi(t).For example, let us assume that our Autograph monitor monitors a /16 IP address space,
90% of the IP addresse space is not occupied, and a worm-infected host scans the 232 IPaddress space with the scanning rate s = 600 probes/minute. Then the probability to catchat least 2 probes from a single host (s = 2) is only 0.44, even 3 hours after the host is infected.
46
Chapter 4. Distributed Signature Generation with Port-Scanner List Sharing
To understand the signature detection speed during a worm propagation, we simulate aCode-RedI-v2-like worm, which is after that of Moore et al. [89]. We simulate a vulnerablepopulation of 338,652 hosts, the number of infected source IPs observed in [85] that areuniquely assignable to a single Autonomous System (AS) in the BGP table data (obtainedfrom University of Oregon Route Views Project 1) of the 19th of July, 2001, the date of theCode-Red outbreak. There are 6378 ASes that contain at least one such vulnerable host inthe simulation. Unlike Moore et al., we do not simulate the reachability among ASes in thatBGP table; we make the simplifying assumption that all ASes may reach all other ASes. Thisassumption may cause the worm to spread somewhat faster in our simulation than in Mooreet al.’s.
We assign actual IP address ranges for real ASes from the BGP table snapshot to eachAS in the simulation, according to a truncated distribution of the per-AS IP address spacesizes from the entire BGP table snapshot. The distribution of address ranges we assign istruncated in that we avoid assigning any address blocks larger than /16s to any AS in thesimulation. We avoid large address blocks for two reasons: first, few such monitoring pointsexist, so it may be unreasonable to assume that Autograph will be deployed at one, andsecond, a worm programmer may trivially code a worm to avoid scanning addresses withina /8 known to harbor an Autograph monitor. Our avoidance of large address blocks onlylengthens the time it will take Autograph to generate a worm signature after a novel worm’srelease.
We assume 50% of the address space within the vulnerable ASes is populated with reach-able hosts, that 25% of these reachable hosts run web servers, and we fix the 338,652 vulner-able web servers uniformly at random among the total population of web servers in thesimulation.
Finally, the simulated worm propagates using random IP address scanning over the en-tire routable IPv4 address space, and a probe rate of 10 probes per second. We simulatenetwork and processing delays, randomly chosen in [0.5, 1.5] seconds, between a victim’sreceipt of an infecting connection and its initiation of outgoing infection attempts. We beginthe epidemic by infecting 25 vulnerable hosts at time zero. Figure 4.1 shows the growth ofthe epidemic within the vulnerable host population over time. After 135 minutes, the worminfects 10% of vulnerable hosts, and after 15 minutes from then, it infects 25% of vulnerablehosts.
In these first simulations, we place Autograph monitors at a randomly selected 1% ofthe ASes that include vulnerable hosts (63 monitors). Figure 4.2 shows the maximum and
1http://www.routeviews.org
47
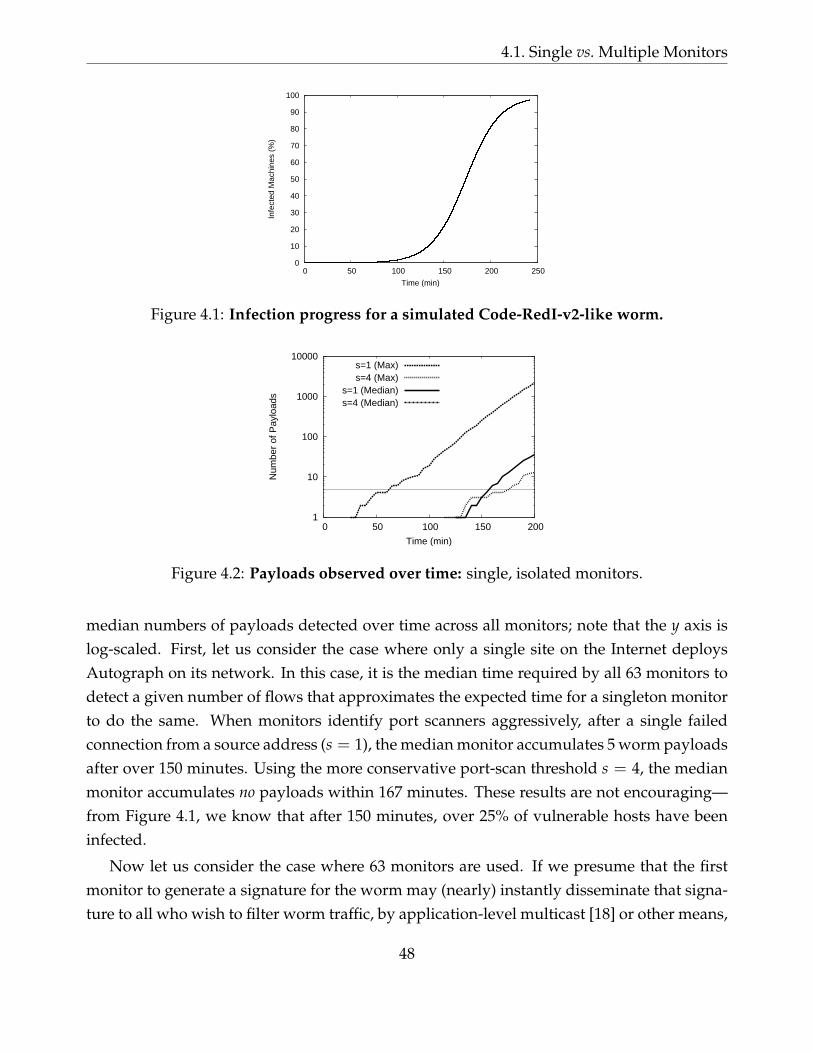
4.1. Single vs. Multiple Monitors
0
10
20
30
40
50
60
70
80
90
100
0 50 100 150 200 250In
fect
ed M
achi
nes
(%)
Time (min)
Figure 4.1: Infection progress for a simulated Code-RedI-v2-like worm.
1
10
100
1000
10000
0 50 100 150 200
Num
ber
of P
aylo
ads
Time (min)
s=1 (Max)s=4 (Max)
s=1 (Median)s=4 (Median)
Figure 4.2: Payloads observed over time: single, isolated monitors.
median numbers of payloads detected over time across all monitors; note that the y axis islog-scaled. First, let us consider the case where only a single site on the Internet deploysAutograph on its network. In this case, it is the median time required by all 63 monitors todetect a given number of flows that approximates the expected time for a singleton monitorto do the same. When monitors identify port scanners aggressively, after a single failedconnection from a source address (s = 1), the median monitor accumulates 5 worm payloadsafter over 150 minutes. Using the more conservative port-scan threshold s = 4, the medianmonitor accumulates no payloads within 167 minutes. These results are not encouraging—from Figure 4.1, we know that after 150 minutes, over 25% of vulnerable hosts have beeninfected.
Now let us consider the case where 63 monitors are used. If we presume that the firstmonitor to generate a signature for the worm may (nearly) instantly disseminate that signa-ture to all who wish to filter worm traffic, by application-level multicast [18] or other means,
48

Chapter 4. Distributed Signature Generation with Port-Scanner List Sharing
the earliest Autograph can possibly find the worm’s signature is governed by the “luckiest”monitor among the 63 monitors—the first one to accumulate the required number θ of wormpayloads. The “luckiest” monitor in this simulated distributed deployment detects 5 wormpayloads shortly before 66 minutes have elapsed. This result is far more encouraging—after66 minutes, fewer than 1% of vulnerable hosts have been infected. Thus, provided that allAutograph monitors disseminate the worm signatures they detect in a timely fashion, thereis immense benefit in the speed of detection of a signature for a novel worm when Auto-graph is deployed distributedly, even at as few as 1% of ASes that contain vulnerable hosts.
Using the more conservative port-scan threshold s = 4, the monitor in the distributedsystem to have accumulated the most worm payloads after 10000 seconds has still onlycollected 4. Here, again, we observe that targeting increased specificity (by identifying sus-picious flows more conservatively) comes at a cost of reduced sensitivity; in this case, sensi-tivity may be seen as the number of worm flows matched over time.
Running multiple independent Autograph monitors clearly pays a dividend in fasterworm signature detection. A natural question that follows is whether detection speed mightbe improved further if the Autograph monitors shared information with one another insome way.
4.2 tattler: Distributed Gathering of Suspect IP Addresses
We now introduce an extension to Autograph named tattler that, as its name suggests, sharessuspicious source addresses among all monitors, toward the goal of accelerating the accu-mulation of worm payloads.
We assume in the design of tattler that a multicast facility is available to all Autographmonitors, and that they all join a single multicast group. While IP multicast is not a broadlydeployed service on today’s Internet, there are many viable end-system-oriented multicastsystems that could provide this functionality, such as Scribe [18]. In brief, Autograph mon-itor instances could form a Pastry overlay, and use Scribe to multicast to the set of all mon-itors. We further assume that users are willing to publish the IP addresses that have beenport scanning them.2
The tattler protocol is essentially an application of the RTP Control Protocol (RTCP) [115],originally used to control multicast multimedia conferencing sessions, slightly extended foruse in the Autograph context. The chief goal of RTCP is to allow a set of senders who all sub-
2In cases where a source address owner complains that his address is advertised, the administrator of anAutograph monitor could configure Autograph not to report addresses from the uncooperative address block.
49

4.2. tattler: Distributed Gathering of Suspect IP Addresses
scribe to the same multicast group to share a capped quantity of bandwidth fairly. In Auto-graph, we seek to allow monitors to announce to others the (IP-addr, dst-port) pairsthey have observed port scanning themselves, to limit the total bandwidth of announce-ments sent to the multicast group within a pre-determined cap, and to allocate announce-ment bandwidth relatively fairly among monitors. We recount the salient features of RTCPbriefly:
• A population of senders all joins the same multicast group. Each is configured to re-spect the same total bandwidth limit, B, for the aggregate traffic sent to the group.
• Each sender maintains an interval value I it uses between its announcements. Trans-missions are jittered uniformly at random within [0.5, 1.5] times this timer value.
• Each sender stores a list of the unique source IP addresses from which it has receivedannouncement packets. By counting these, each sender learns an estimate of the totalnumber of senders, N. Entries in the list expire if their sources are not heard fromwithin a timeout interval.
• Each sender computes I = N/B. Senders keep a running average of the sizes of allannouncement packets received, and scale I according to the size of the announcementthey wish to send next.
• When too many senders join in a brief period, the aggregate sending rate may ex-ceed C. RTCP uses a reconsideration procedure to combat this effect, whereby senderslengthen I probabilistically.
• Senders which depart may optionally send a BYE packet in compliance with the Iinter-announcement interval, to speed other senders’ learning of the decrease in thetotal group membership.
• RTCP has been shown to scale to thousands of senders.
In the tattler protocol, each announcement a monitor makes contains between one and100 port-scanner reports of the form (src-IP, dst-port). Monitors only announcescanners they’ve heard themselves. Hearing a report from another monitor for a scannersuppresses announcement of that scanner for a refresh interval. After a timeout interval, amonitor expires a scanner entry if that scanner has not directly scanned it and no other mon-itor has announced that scanner. Announcement packets are sent in accordance with RTCP.
50
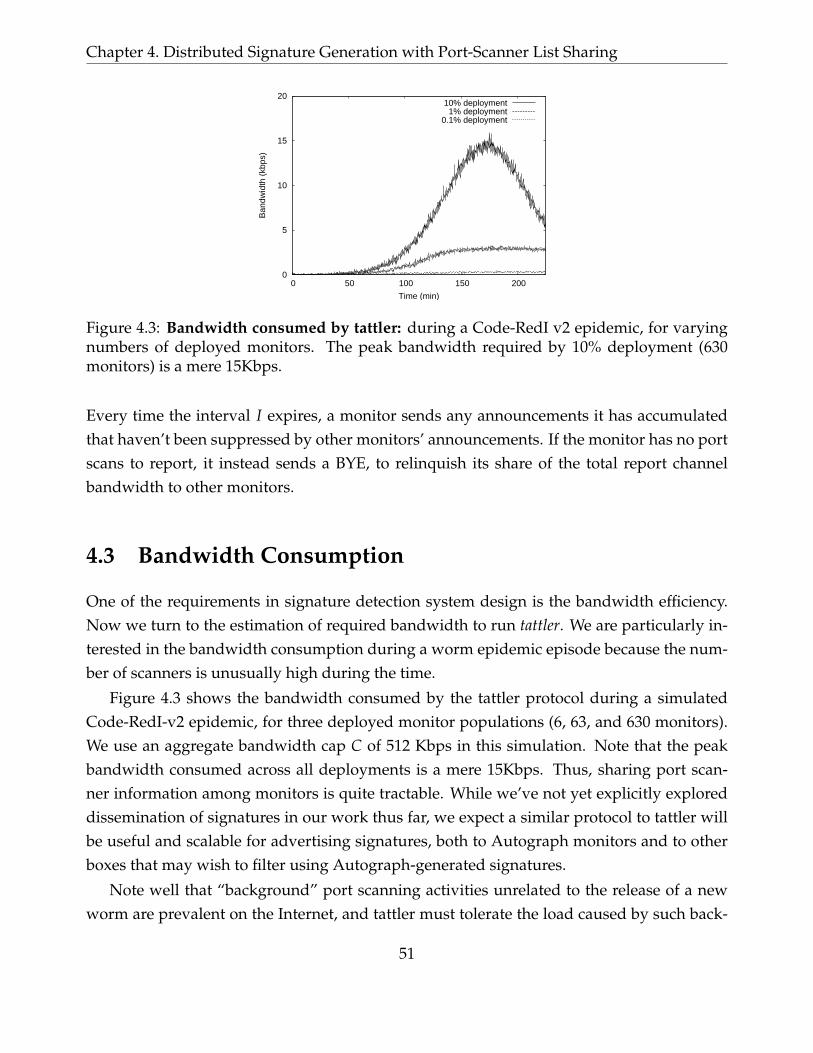
Chapter 4. Distributed Signature Generation with Port-Scanner List Sharing
0
5
10
15
20
0 50 100 150 200
Ban
dwid
th (
kbps
)
Time (min)
10% deployment1% deployment
0.1% deployment
Figure 4.3: Bandwidth consumed by tattler: during a Code-RedI v2 epidemic, for varyingnumbers of deployed monitors. The peak bandwidth required by 10% deployment (630monitors) is a mere 15Kbps.
Every time the interval I expires, a monitor sends any announcements it has accumulatedthat haven’t been suppressed by other monitors’ announcements. If the monitor has no portscans to report, it instead sends a BYE, to relinquish its share of the total report channelbandwidth to other monitors.
4.3 Bandwidth Consumption
One of the requirements in signature detection system design is the bandwidth efficiency.Now we turn to the estimation of required bandwidth to run tattler. We are particularly in-terested in the bandwidth consumption during a worm epidemic episode because the num-ber of scanners is unusually high during the time.
Figure 4.3 shows the bandwidth consumed by the tattler protocol during a simulatedCode-RedI-v2 epidemic, for three deployed monitor populations (6, 63, and 630 monitors).We use an aggregate bandwidth cap C of 512 Kbps in this simulation. Note that the peakbandwidth consumed across all deployments is a mere 15Kbps. Thus, sharing port scan-ner information among monitors is quite tractable. While we’ve not yet explicitly exploreddissemination of signatures in our work thus far, we expect a similar protocol to tattler willbe useful and scalable for advertising signatures, both to Autograph monitors and to otherboxes that may wish to filter using Autograph-generated signatures.
Note well that “background” port scanning activities unrelated to the release of a newworm are prevalent on the Internet, and tattler must tolerate the load caused by such back-
51
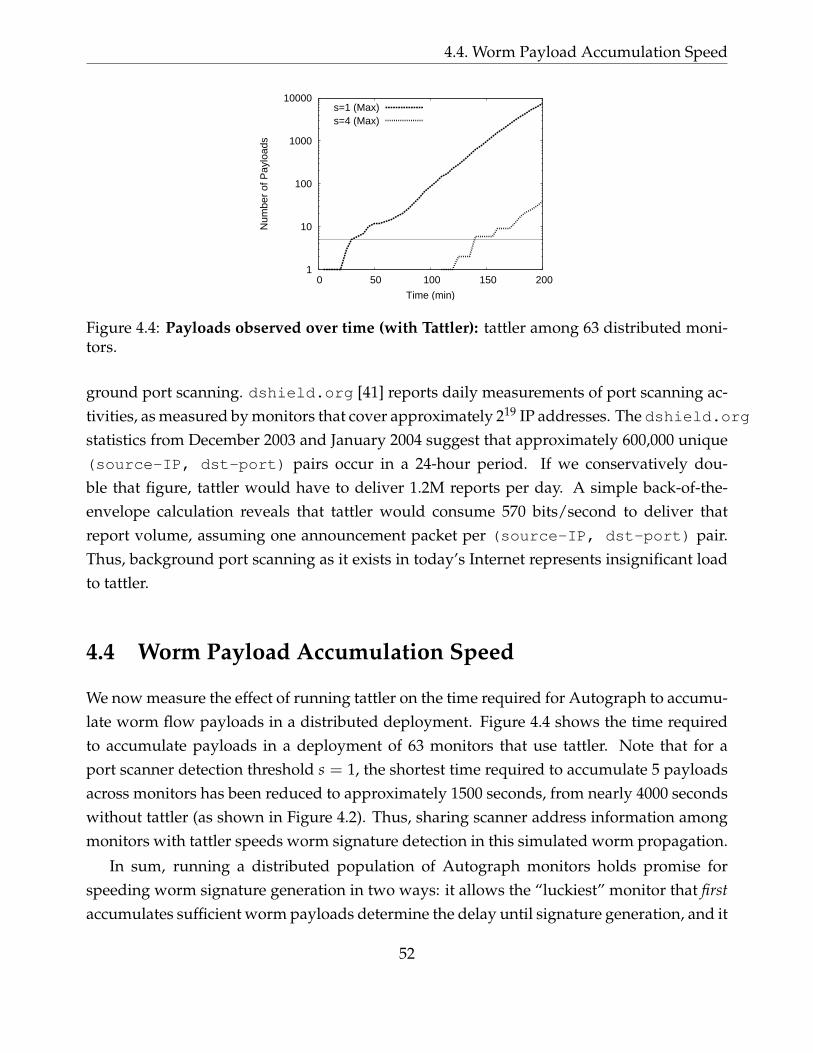
4.4. Worm Payload Accumulation Speed
1
10
100
1000
10000
0 50 100 150 200
Num
ber
of P
aylo
ads
Time (min)
s=1 (Max)s=4 (Max)
Figure 4.4: Payloads observed over time (with Tattler): tattler among 63 distributed moni-tors.
ground port scanning. dshield.org [41] reports daily measurements of port scanning ac-tivities, as measured by monitors that cover approximately 219 IP addresses. The dshield.orgstatistics from December 2003 and January 2004 suggest that approximately 600,000 unique(source-IP, dst-port) pairs occur in a 24-hour period. If we conservatively dou-ble that figure, tattler would have to deliver 1.2M reports per day. A simple back-of-the-envelope calculation reveals that tattler would consume 570 bits/second to deliver thatreport volume, assuming one announcement packet per (source-IP, dst-port) pair.Thus, background port scanning as it exists in today’s Internet represents insignificant loadto tattler.
4.4 Worm Payload Accumulation Speed
We now measure the effect of running tattler on the time required for Autograph to accumu-late worm flow payloads in a distributed deployment. Figure 4.4 shows the time requiredto accumulate payloads in a deployment of 63 monitors that use tattler. Note that for aport scanner detection threshold s = 1, the shortest time required to accumulate 5 payloadsacross monitors has been reduced to approximately 1500 seconds, from nearly 4000 secondswithout tattler (as shown in Figure 4.2). Thus, sharing scanner address information amongmonitors with tattler speeds worm signature detection in this simulated worm propagation.
In sum, running a distributed population of Autograph monitors holds promise forspeeding worm signature generation in two ways: it allows the “luckiest” monitor that firstaccumulates sufficient worm payloads determine the delay until signature generation, and it
52

Chapter 4. Distributed Signature Generation with Port-Scanner List Sharing
allows monitors to chatter about port-scanning source addresses, and thus all monitors clas-sify worm flows as suspicious earlier. Note, however, that the speed of the worm payloadaccumulation in each monitor is still bounded by the size and the location of each monitorednetwork. In Chapter 5, we investigate the upper bound of the payload accumulation speedin this distributed Autograph system and propose techniques to overcome the limitation.
4.5 Online, Distributed, DMZ-Trace-Driven Evaluation
The simulation results presented thus far have quantified the time required for Autograph toaccumulate worm payloads after a worm’s release. We now use DMZ-trace-driven simula-tion on the one-day ICSI trace (that contains inbound port 80 traffic as described in Table 3.2)to measure how long it takes Autograph to identify a newly released worm among the back-ground noise of flows that are not worms, but have been categorized by the flow classifier assuspicious after port scanning the monitor. We are particularly interested in the trade-offbetween early signature generation (sensitivity across time, in a sense) and specificity of thegenerated signatures. We measure the speed of signature generation by the fraction of vul-nerable hosts infected when Autograph first detects the worm’s signature, and the specificityof the generated signatures by counting the number of signatures generated that cause falsepositives. We introduce this latter metric for specificity because raw specificity is difficult tointerpret: if a signature based on non-worm-flow content (from a misclassified innocuousflow) is generated, the number of false positives it causes depends strongly on the trafficmix at that particular site. Furthermore, an unspecific signature may be relatively straight-forward to identify as such with “signature blacklists” (disallowed signatures that shouldnot be used for filtering traffic) provided by a system operator.
We simulate an online deployment of Autograph as follows. We run a single Autographmonitor on the ICSI trace. To initialize the list of suspicious IP addresses known to the mon-itor, we run Bro on the entire 24-hour trace using all known worm signatures, and excludeworm flows from the trace. We then scan the entire resulting worm-free 24-hour trace for portscan activity, and record the list of port scanners detected with thresholds of s ∈ 1, 2, 4. Toemulate the steady-state operation of Autograph, we populate the monitor’s suspicious IPaddress list with the full set of port scanners from one of these lists, so that all flows fromthese sources will be classified as suspicious. We can then generate a background noise trace,which consists of only non-worm flows from port scanners, as would be detected by a run-ning Autograph monitor for each of s ∈ 1, 2, 4. Figure 4.5 shows the quantity of non-wormnoise flows in Autograph’s suspicious traffic pool over the trace’s full 24 hours.
53
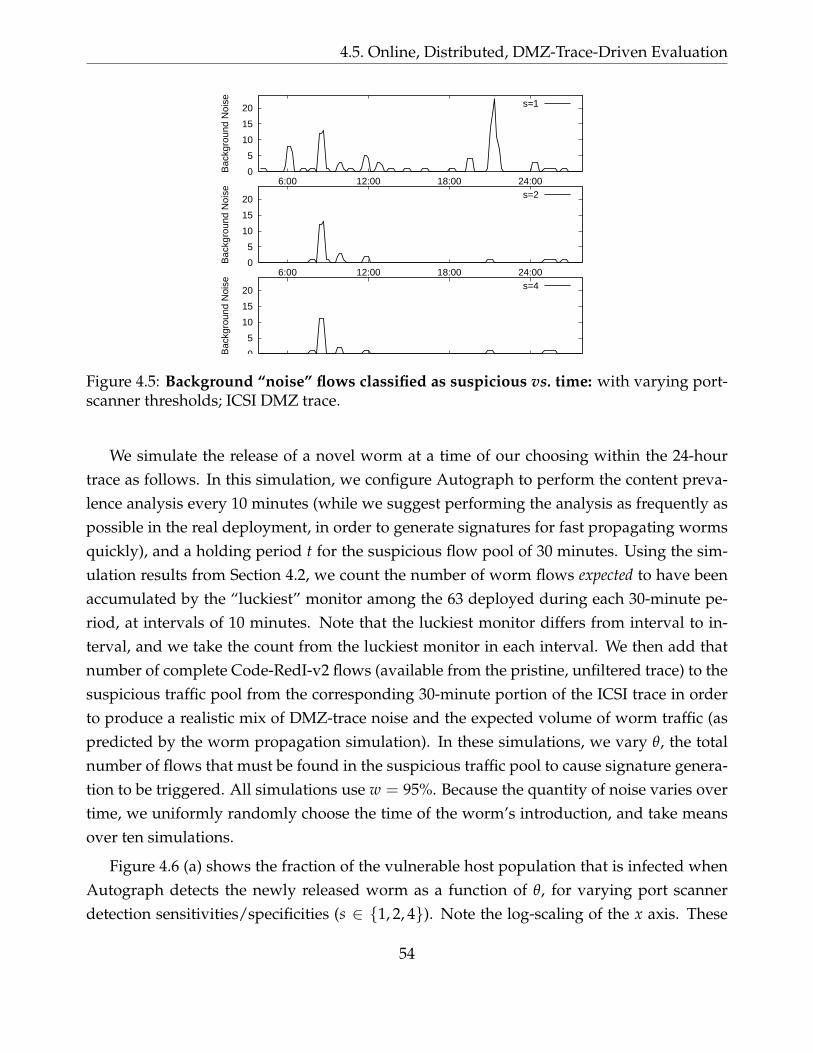
4.5. Online, Distributed, DMZ-Trace-Driven Evaluation
0
5
10
15
20
6:00 12:00 18:00 24:00
Bac
kgro
und
Noi
se s=1
0
5
10
15
20
6:00 12:00 18:00 24:00
Bac
kgro
und
Noi
se s=2
0
5
10
15
20
Bac
kgro
und
Noi
se s=4
Figure 4.5: Background “noise” flows classified as suspicious vs. time: with varying port-scanner thresholds; ICSI DMZ trace.
We simulate the release of a novel worm at a time of our choosing within the 24-hourtrace as follows. In this simulation, we configure Autograph to perform the content preva-lence analysis every 10 minutes (while we suggest performing the analysis as frequently aspossible in the real deployment, in order to generate signatures for fast propagating wormsquickly), and a holding period t for the suspicious flow pool of 30 minutes. Using the sim-ulation results from Section 4.2, we count the number of worm flows expected to have beenaccumulated by the “luckiest” monitor among the 63 deployed during each 30-minute pe-riod, at intervals of 10 minutes. Note that the luckiest monitor differs from interval to in-terval, and we take the count from the luckiest monitor in each interval. We then add thatnumber of complete Code-RedI-v2 flows (available from the pristine, unfiltered trace) to thesuspicious traffic pool from the corresponding 30-minute portion of the ICSI trace in orderto produce a realistic mix of DMZ-trace noise and the expected volume of worm traffic (aspredicted by the worm propagation simulation). In these simulations, we vary θ, the totalnumber of flows that must be found in the suspicious traffic pool to cause signature genera-tion to be triggered. All simulations use w = 95%. Because the quantity of noise varies overtime, we uniformly randomly choose the time of the worm’s introduction, and take meansover ten simulations.
Figure 4.6 (a) shows the fraction of the vulnerable host population that is infected whenAutograph detects the newly released worm as a function of θ, for varying port scannerdetection sensitivities/specificities (s ∈ 1, 2, 4). Note the log-scaling of the x axis. These
54
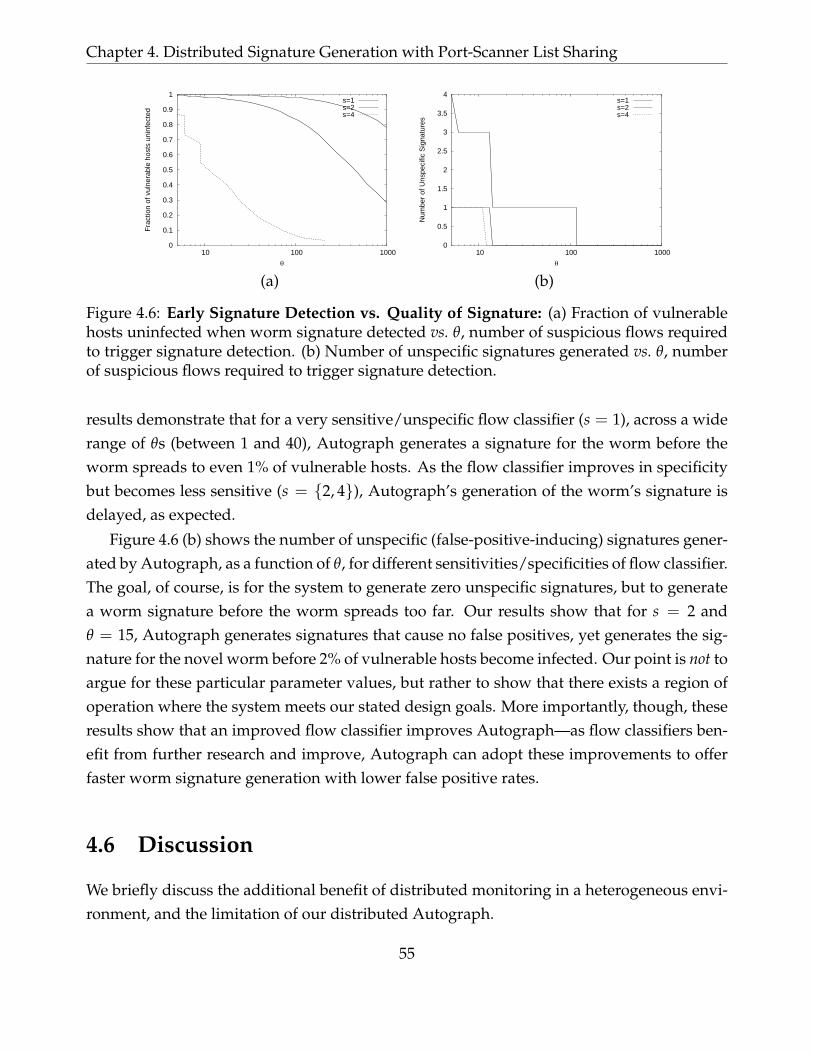
Chapter 4. Distributed Signature Generation with Port-Scanner List Sharing
0
0.1
0.2
0.3
0.4
0.5
0.6
0.7
0.8
0.9
1
10 100 1000
Fra
ctio
n of
vul
nera
ble
host
s un
infe
cted
θ
s=1s=2s=4
0
0.5
1
1.5
2
2.5
3
3.5
4
10 100 1000
Num
ber
of U
nspe
cific
Sig
natu
res
θ
s=1s=2s=4
(a) (b)
Figure 4.6: Early Signature Detection vs. Quality of Signature: (a) Fraction of vulnerablehosts uninfected when worm signature detected vs. θ, number of suspicious flows requiredto trigger signature detection. (b) Number of unspecific signatures generated vs. θ, numberof suspicious flows required to trigger signature detection.
results demonstrate that for a very sensitive/unspecific flow classifier (s = 1), across a widerange of θs (between 1 and 40), Autograph generates a signature for the worm before theworm spreads to even 1% of vulnerable hosts. As the flow classifier improves in specificitybut becomes less sensitive (s = 2, 4), Autograph’s generation of the worm’s signature isdelayed, as expected.
Figure 4.6 (b) shows the number of unspecific (false-positive-inducing) signatures gener-ated by Autograph, as a function of θ, for different sensitivities/specificities of flow classifier.The goal, of course, is for the system to generate zero unspecific signatures, but to generatea worm signature before the worm spreads too far. Our results show that for s = 2 andθ = 15, Autograph generates signatures that cause no false positives, yet generates the sig-nature for the novel worm before 2% of vulnerable hosts become infected. Our point is not toargue for these particular parameter values, but rather to show that there exists a region ofoperation where the system meets our stated design goals. More importantly, though, theseresults show that an improved flow classifier improves Autograph—as flow classifiers ben-efit from further research and improve, Autograph can adopt these improvements to offerfaster worm signature generation with lower false positive rates.
4.6 Discussion
We briefly discuss the additional benefit of distributed monitoring in a heterogeneous envi-ronment, and the limitation of our distributed Autograph.
55
4.6. Discussion
Distributed monitoring in a heterogeneous environment. In our evaluation, we haveassumed a homogeneous environment such that the vulnerable hosts are uniformly dis-tributed across the 6378 ASes, and the fraction of reachable hosts in a network is uniform.However, the IP address structure - the arrangement of active addresses in the address space- is highly non-uniform [71], so is the vulnerable host distribution during a worm propaga-tion [85, 87, 88]. If a network has a few reachable hosts, the Autograph monitor can identifya worm’s scanning activities quickly because most scanning attempts fall to unused IP ad-dresses. However, the monitor is slow in accumulating worm payloads crucial for signaturegeneration. For example, network telescopes [86, 101] – unallocated portions of the IP addressspace - provide powerful tools for gathering worm-infected host IP addresses and modelingworm propagation [85, 127, 87, 88]; they do not help acquire worm payload samples if aworm sends its exploit payloads only to existent servers. In contrast, if a network has manyreachable hosts, the monitor cannot easily identify suspicious addresses. Distributed portscanner detection allows Autograph to generate signatures even in such a heterogeneousenvironment. The Autograph monitors in the densely populated area can use the scannerlists discovered by the other monitors in sparsely populated networks.
Attacks. Fraudulent scanner IP address reports from unauthorized monitors cause a re-mote source’s traffic to be included by all the distributed Autograph in signature gener-ation. Only authorized Autograph monitors must be allowed to participate in the tattlermechanism to prevent it. There are a number of available secure group communication pro-tocols [1, 63, 109] and group signature schemes [123, 10, 11]. Even with those authorizationand group signature schemes, compromised Autotraph monitors can be used to mount thefraudulent report attack. Requiring multiple monitors to report the same scanner can makethe tattler more robust against such an attack, but will slow the suspicious address identi-fication. Similarly, requiring multiple monitors to generate payload signatures that matchthe same set of flows may prevent fraudulent signatures from being widely deployed, butwill slow the signature generation. In Part II, we present a couple of mechanisms that utilizemultiple monitors, which reduces the probability of generating fraudulent signatures whencompromised monitors are present. Source spoofed port scans can be used to mount anothertype of Denial-of-Service (DoS) attacks specific to Autograph: the tattler mechanism mustcarry report traffic proportional to the number of port scanners. An attacker could attemptto saturate tattler’s bandwidth limit with spoofed scanner source addresses, and thus ren-der tattler useless in disseminating addresses of true port scanners. We discussed a simplemechanism that addresses this attack in Section 3.6.
56
Chapter 4. Distributed Signature Generation with Port-Scanner List Sharing
Limitations. The distributed Autograph achieves early signature generation by improv-ing the performance of its suspicious flow selection stage. When a worm flow enters thenetwork, the Autograph can classify the flow to be suspicious if the source IP address is inthe list of identified scanners. However, if the monitored network is small or has only afew reachable hosts, the actual number of worm payloads that enter the network is low. Inour simulations of the distributed Autograph, we observed that the signature was generatedfrom one of the biggest networks. If such large networks (/16s) did not participate in ourAutograph network, that could prolong the time till the signature detection even in the pres-ence of tattler. There are a few ways to speed up the payload accumulation. One approachis to use honeypots [58, 125] and trick worm-infected hosts to send the exploit payloads.Another approach is to share the discovered suspicious flow payloads as well as the scannerlists. Even though the number of payloads that an individual monitor receives is small, theaggregated number across multiple monitors would be large enough for payload extraction.We discuss this approach in Part II.
4.7 Summary
In this chapter, we have extended Autograph to use distributed monitoring. Our simulationsof the propagation of a Code-RedI-v2-like worm demonstrate that by tattling to one anotherabout port scanners they overhear, distributed Autograph monitors can detect worms earlierthan isolated, individual Autograph monitors, and that the bandwidth required to achievethis sharing of state is minimal. DMZ-trace-driven simulations of the introduction of a novelworm show that a distributed deployment of 63 Autograph monitors, despite using a naiveflow classifier to identify suspicious traffic, can detect a newly released Code-RedI-v2-likeworm’s signature before 2% of the vulnerable host population becomes infected. Our col-lected results illuminate the inherent tension between early generation of a worm’s signatureand generation of specific signatures.
57

4.7. Summary
58

Part II
Privacy-Preserving Signature Generation
59

Chapter 5
Introduction
The signature generation process requires multiple samples of worm flows, and the speed ofworm payload accumulation is an important factor that determines the signature generationspeed. Worm payload accumulation speed of a single monitor is determined by the size andthe location of a monitored network. Like many other network security applications [146,27, 148], the collaboration of distributed monitors helps worm signature generation systemsto overcome the limitation of a single monitor.
In Chapter 4, we proposed a technique to expedite signature generation by sharing port-scanner address information among distributed monitors. In this part, we explore shar-ing information beyond port scanners’ source IP addresses. In particular, we address theproblem of sharing payload pattern strings found in distributed networks. Payload sharingacross distributed monitors introduces a new privacy issue to automated signature genera-tion systems. In this chapter, we discuss the benefit of distributed payload sharing, and therelated privacy issue.
5.1 Motivation for Distributed Payload Sharing
The tattler mechanism, presented in Section 4.2, helps each individual monitor to classifyinbound worm flows with high probability. However, the monitor cannot accumulate morethan the actual number of worm payloads crossing the boundary of the monitored network.
We first present the limitation of a single monitor by showing its worm payload accu-mulation speed. Our analysis shows that worm payload accumulation speed is linear tothe monitored network size, the number of IP addresses that would receive worm’s exploitpayloads, and the total number of vulnerable hosts in the Internet. For localized scanning
61
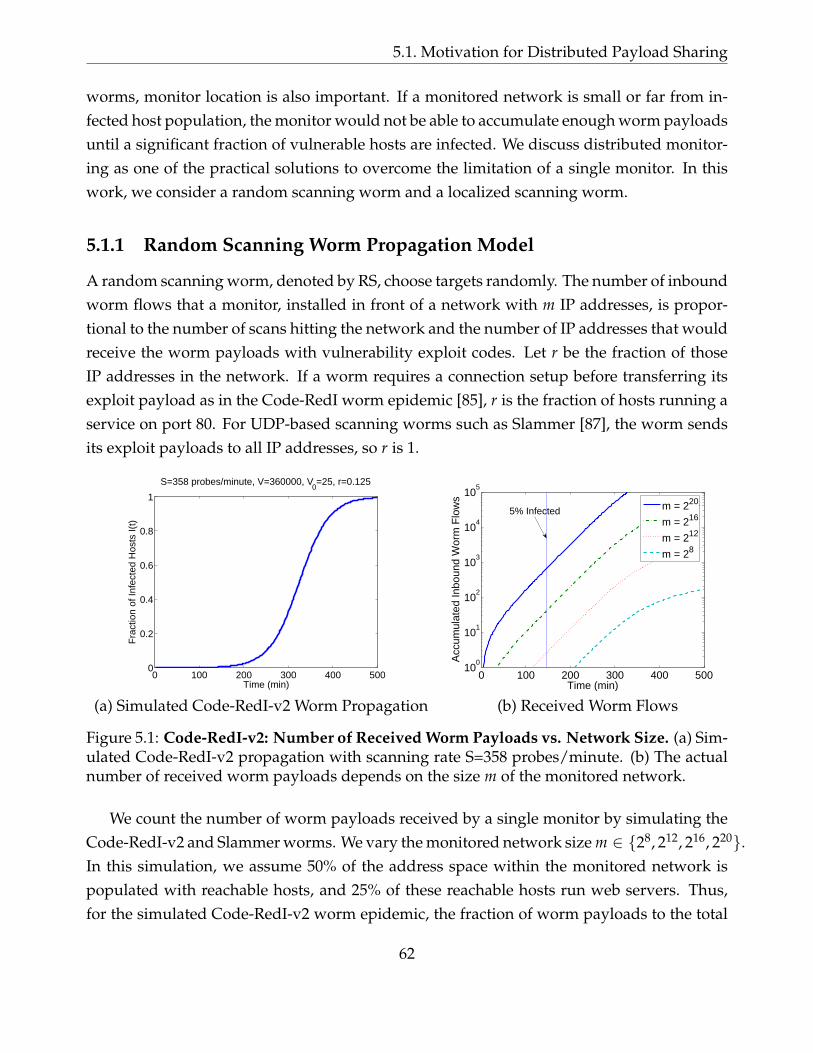
5.1. Motivation for Distributed Payload Sharing
worms, monitor location is also important. If a monitored network is small or far from in-fected host population, the monitor would not be able to accumulate enough worm payloadsuntil a significant fraction of vulnerable hosts are infected. We discuss distributed monitor-ing as one of the practical solutions to overcome the limitation of a single monitor. In thiswork, we consider a random scanning worm and a localized scanning worm.
5.1.1 Random Scanning Worm Propagation Model
A random scanning worm, denoted by RS, choose targets randomly. The number of inboundworm flows that a monitor, installed in front of a network with m IP addresses, is propor-tional to the number of scans hitting the network and the number of IP addresses that wouldreceive the worm payloads with vulnerability exploit codes. Let r be the fraction of thoseIP addresses in the network. If a worm requires a connection setup before transferring itsexploit payload as in the Code-RedI worm epidemic [85], r is the fraction of hosts running aservice on port 80. For UDP-based scanning worms such as Slammer [87], the worm sendsits exploit payloads to all IP addresses, so r is 1.
0 100 200 300 400 5000
0.2
0.4
0.6
0.8
1
Time (min)
Fra
ctio
n of
Infe
cted
Hos
ts I(
t)
S=358 probes/minute, V=360000, V0=25, r=0.125
0 100 200 300 400 50010
0
101
102
103
104
105
Time (min)
Acc
umul
ated
Inbo
und
Wor
m F
low
s
m = 220
m = 216
m = 212
m = 28
5% Infected
(a) Simulated Code-RedI-v2 Worm Propagation (b) Received Worm Flows
Figure 5.1: Code-RedI-v2: Number of Received Worm Payloads vs. Network Size. (a) Sim-ulated Code-RedI-v2 propagation with scanning rate S=358 probes/minute. (b) The actualnumber of received worm payloads depends on the size m of the monitored network.
We count the number of worm payloads received by a single monitor by simulating theCode-RedI-v2 and Slammer worms. We vary the monitored network size m ∈ 28, 212, 216, 220.In this simulation, we assume 50% of the address space within the monitored network ispopulated with reachable hosts, and 25% of these reachable hosts run web servers. Thus,for the simulated Code-RedI-v2 worm epidemic, the fraction of worm payloads to the total
62
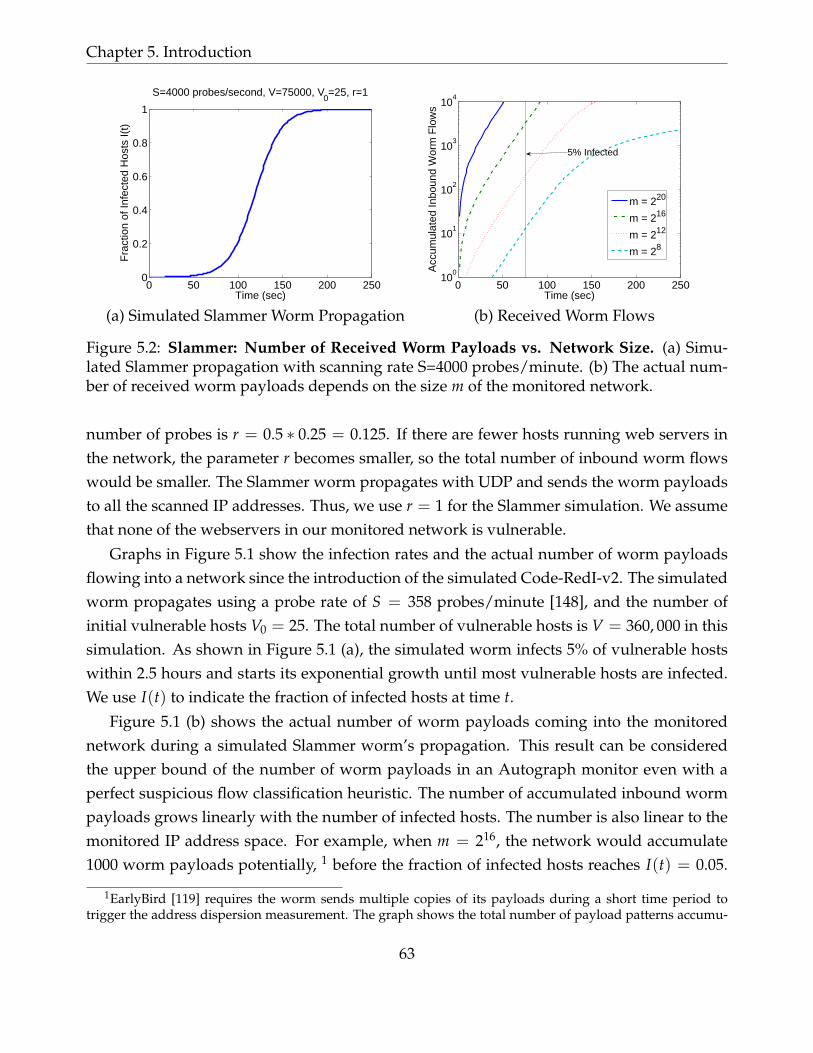
Chapter 5. Introduction
0 50 100 150 200 2500
0.2
0.4
0.6
0.8
1
Time (sec)
Fra
ctio
n of
Infe
cted
Hos
ts I(
t)
S=4000 probes/second, V=75000, V0=25, r=1
0 50 100 150 200 25010
0
101
102
103
104
Time (sec)
Acc
umul
ated
Inbo
und
Wor
m F
low
s
m = 220
m = 216
m = 212
m = 28
5% Infected
(a) Simulated Slammer Worm Propagation (b) Received Worm Flows
Figure 5.2: Slammer: Number of Received Worm Payloads vs. Network Size. (a) Simu-lated Slammer propagation with scanning rate S=4000 probes/minute. (b) The actual num-ber of received worm payloads depends on the size m of the monitored network.
number of probes is r = 0.5 ∗ 0.25 = 0.125. If there are fewer hosts running web servers inthe network, the parameter r becomes smaller, so the total number of inbound worm flowswould be smaller. The Slammer worm propagates with UDP and sends the worm payloadsto all the scanned IP addresses. Thus, we use r = 1 for the Slammer simulation. We assumethat none of the webservers in our monitored network is vulnerable.
Graphs in Figure 5.1 show the infection rates and the actual number of worm payloadsflowing into a network since the introduction of the simulated Code-RedI-v2. The simulatedworm propagates using a probe rate of S = 358 probes/minute [148], and the number ofinitial vulnerable hosts V0 = 25. The total number of vulnerable hosts is V = 360, 000 in thissimulation. As shown in Figure 5.1 (a), the simulated worm infects 5% of vulnerable hostswithin 2.5 hours and starts its exponential growth until most vulnerable hosts are infected.We use I(t) to indicate the fraction of infected hosts at time t.
Figure 5.1 (b) shows the actual number of worm payloads coming into the monitorednetwork during a simulated Slammer worm’s propagation. This result can be consideredthe upper bound of the number of worm payloads in an Autograph monitor even with aperfect suspicious flow classification heuristic. The number of accumulated inbound wormpayloads grows linearly with the number of infected hosts. The number is also linear to themonitored IP address space. For example, when m = 216, the network would accumulate1000 worm payloads potentially, 1 before the fraction of infected hosts reaches I(t) = 0.05.
1EarlyBird [119] requires the worm sends multiple copies of its payloads during a short time period totrigger the address dispersion measurement. The graph shows the total number of payload patterns accumu-
63
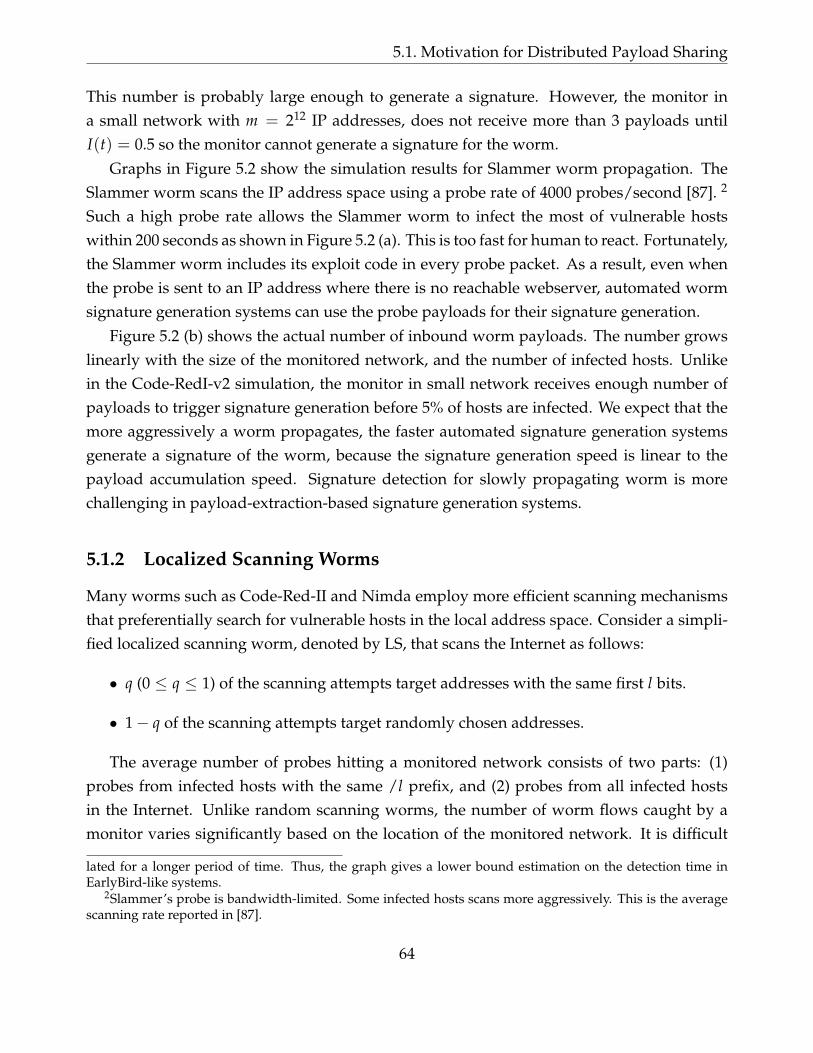
5.1. Motivation for Distributed Payload Sharing
This number is probably large enough to generate a signature. However, the monitor ina small network with m = 212 IP addresses, does not receive more than 3 payloads untilI(t) = 0.5 so the monitor cannot generate a signature for the worm.
Graphs in Figure 5.2 show the simulation results for Slammer worm propagation. TheSlammer worm scans the IP address space using a probe rate of 4000 probes/second [87]. 2
Such a high probe rate allows the Slammer worm to infect the most of vulnerable hostswithin 200 seconds as shown in Figure 5.2 (a). This is too fast for human to react. Fortunately,the Slammer worm includes its exploit code in every probe packet. As a result, even whenthe probe is sent to an IP address where there is no reachable webserver, automated wormsignature generation systems can use the probe payloads for their signature generation.
Figure 5.2 (b) shows the actual number of inbound worm payloads. The number growslinearly with the size of the monitored network, and the number of infected hosts. Unlikein the Code-RedI-v2 simulation, the monitor in small network receives enough number ofpayloads to trigger signature generation before 5% of hosts are infected. We expect that themore aggressively a worm propagates, the faster automated signature generation systemsgenerate a signature of the worm, because the signature generation speed is linear to thepayload accumulation speed. Signature detection for slowly propagating worm is morechallenging in payload-extraction-based signature generation systems.
5.1.2 Localized Scanning Worms
Many worms such as Code-Red-II and Nimda employ more efficient scanning mechanismsthat preferentially search for vulnerable hosts in the local address space. Consider a simpli-fied localized scanning worm, denoted by LS, that scans the Internet as follows:
• q (0 ≤ q ≤ 1) of the scanning attempts target addresses with the same first l bits.
• 1− q of the scanning attempts target randomly chosen addresses.
The average number of probes hitting a monitored network consists of two parts: (1)probes from infected hosts with the same /l prefix, and (2) probes from all infected hostsin the Internet. Unlike random scanning worms, the number of worm flows caught by amonitor varies significantly based on the location of the monitored network. It is difficult
lated for a longer period of time. Thus, the graph gives a lower bound estimation on the detection time inEarlyBird-like systems.
2Slammer’s probe is bandwidth-limited. Some infected hosts scans more aggressively. This is the averagescanning rate reported in [87].
64

Chapter 5. Introduction
100 101 102 103 104100
101
102
103
/16 networks sorted by the number of spam sources
# of
spa
m s
ourc
es
Figure 5.3: Spam source IP distribution: is highly non-uniform. Only 9387 /16 networks in-volved in the identified spam activities. This non-uniformity in vulnerable host distributionmakes localized scanning worms propagate faster than random scanning worms.
to analyze the number of worm flows without considering the vulnerability distribution inthe Internet. The IP address structure is non-uniform [71]; so is the vulnerable host distribu-tion [85, 87, 88]. In order to understand the effect of monitored network size on the numberof caught worm payloads, we simulate LS worm propagation using a list of e-mail spamsource IP addresses. These days spammers take advantage of compromised hosts to sendspam e-mails since many network service providers prevent spamming activities using theirservice. Thus, using spam sources as compromised hosts is not an unreasonable assumption.
We observed that 168, 191 IP addresses sent spam e-mails to a spam e-mail honeypot [110]during a week of January 2006. Figure 5.3 presents the number of spam sources in each /16prefix in a log-log plot. In log-log plots, relatively straight lines indicate that the distribu-tions of vulnerable hosts among prefixes are far from uniform. The highly non-uniformityof (vulnerable) Internet hosts makes localized scanning more effective for fast worm propa-gation.
Assuming that those 168, 191 IP addresses are vulnerable hosts’ addresses, we simulatedthe propagation of LS and RS works. Figure 5.4(a) shows the 95th percentile in the resultof 100 simulations of RS propagation with scanning rate S = 6000/minute. Figure 5.4(b)plots the results of 100 simulations of the propagation of LS with the same scanning rateand the local scanning preference q = 0.5. LS infects most of the vulnerable hosts within 30minutes while RS takes 50 minutes to infect 50% of vulnerable hosts. Since the variabilityin the infection rate is significant, we use the 95th percentile results in the remainder of this
65
5.1. Motivation for Distributed Payload Sharing
0 10 20 30 40 500
0.1
0.2
0.3
0.4
0.5
0.6
0.7
Time (min)
Frac
tion
of In
fect
ed H
osts
I(t)
RS, V=168191, S=6000/min
0 10 20 30 40 500
0.2
0.4
0.6
0.8
1
Time (min)
Frac
tion
of In
fect
ed H
osts
I(t)
LS q=0.5, V=168191, S=6000/min
95th percentileaverage5th percentile
(a) RS (S=6000/minute) (b) LS q=0.5 (S=6000/minute)
Figure 5.4: Scanning Strategies vs. Propagation Speed: the non-uniformity of vulnerablehost distribution makes LS more effective. With a high local scanning preference value q, LScan infect most of the vulnerable hosts in the same /l network immediately after a host isinfected.
work.
Assuming the vulnerable host distribution and the 95th percentile infection process ac-quired from the previous simulation of LS worm propagation, we count the number of wormpayloads by placing a monitor in a randomly chosen network varying the monitored net-work size m. As in our random worm simulations, we assume that there is no vulnerablehost in the monitored network but there could be vulnerable hosts with the same prefix lbits. We use r = 1, as in the Slammer worm propagation.
Figure 5.5 shows the actual number of worm payloads crossing the monitoring point un-til 5% of vulnerable hosts are infected. Notice the large variation in the number of receivedworm payloads. A monitor located close to a large population of infected hosts receives ahuge number of worm payloads due to the localized scanning. A network located far fromthe initially infected host population receives as few worm payloads as in random scanningworm propagation with a probe rate of 1000 ∗ (1− q) probes/minute. The dotted line rep-resents the number of payloads in the luckiest monitor case where our monitor is installedclose to the initially infected host population. As expected, if the monitored network size islarger than the worm’s local scanning space, the monitor cannot see local scanning activities,so the total number of payloads is small. The solid line represents the median case out of100 simulations. In this case, there is no infected host with the same /l prefix yet. Most ofthe payloads it collects are from external hosts. Thus, the location of monitors is important
66
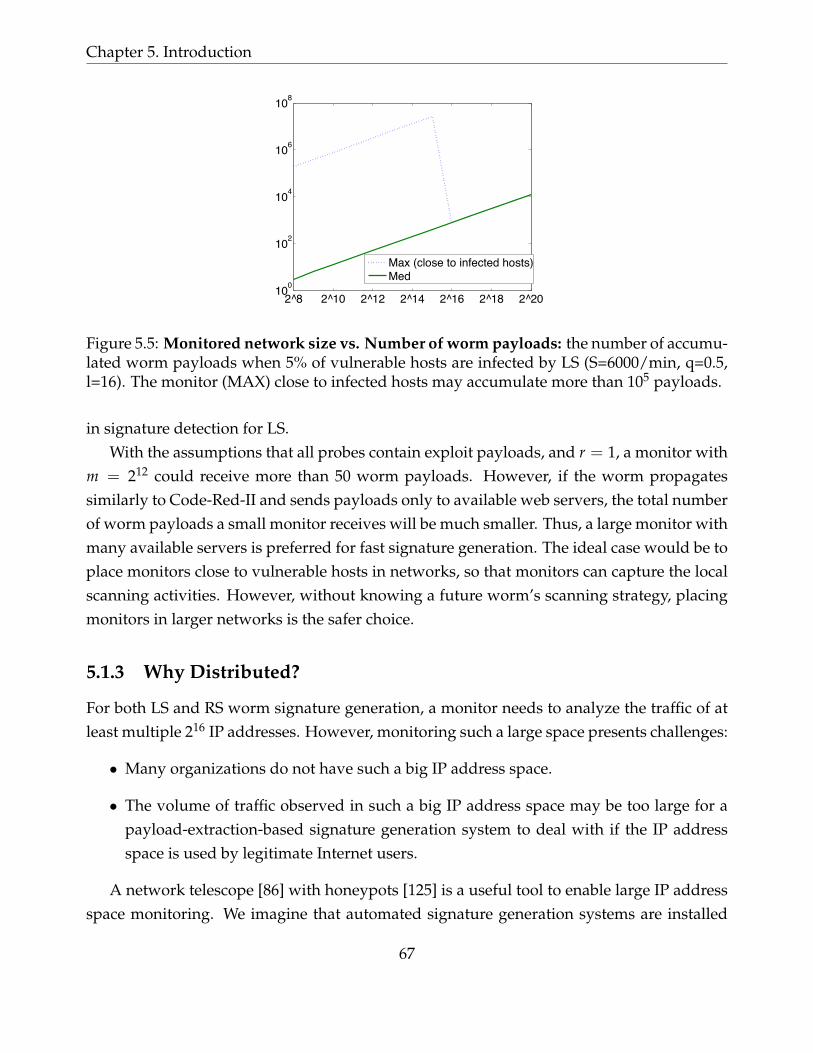
Chapter 5. Introduction
2^8 2^10 2^12 2^14 2^16 2^18 2^20100
102
104
106
108
Max (close to infected hosts)Med
Figure 5.5: Monitored network size vs. Number of worm payloads: the number of accumu-lated worm payloads when 5% of vulnerable hosts are infected by LS (S=6000/min, q=0.5,l=16). The monitor (MAX) close to infected hosts may accumulate more than 105 payloads.
in signature detection for LS.With the assumptions that all probes contain exploit payloads, and r = 1, a monitor with
m = 212 could receive more than 50 worm payloads. However, if the worm propagatessimilarly to Code-Red-II and sends payloads only to available web servers, the total numberof worm payloads a small monitor receives will be much smaller. Thus, a large monitor withmany available servers is preferred for fast signature generation. The ideal case would be toplace monitors close to vulnerable hosts in networks, so that monitors can capture the localscanning activities. However, without knowing a future worm’s scanning strategy, placingmonitors in larger networks is the safer choice.
5.1.3 Why Distributed?
For both LS and RS worm signature generation, a monitor needs to analyze the traffic of atleast multiple 216 IP addresses. However, monitoring such a large space presents challenges:
• Many organizations do not have such a big IP address space.
• The volume of traffic observed in such a big IP address space may be too large for apayload-extraction-based signature generation system to deal with if the IP addressspace is used by legitimate Internet users.
A network telescope [86] with honeypots [125] is a useful tool to enable large IP addressspace monitoring. We imagine that automated signature generation systems are installed
67
5.2. Privacy Consideration
in the network telescope for fast signature generation of random scanning worms. Becausethe network telescope is not used by legitimate Internet users, the volume of traffic may besignificantly smaller, which makes traffic analysis much easier. Even when such a large IPaddress space is monitored, however, if the network is not close to the initially infected hostpopulation, the chance of catching an LS worm payload may be small. If attackers know thelocation of a large telescope or, at least, know the space is not often by many Internet users,they can design a worm to avoid scanning the address space. Hence, having many monitorsin various locations is important to generate signatures for scanning worms early.
In this part, we propose a distributed signature generation system that enables collab-oration of many moderately-sized networks dispersed in the Internet. Once the monitorshave individually identified a possible attack or offender, each network monitor can gainconfidence in the maliciousness of the identified attacks through comparison of its findingswith the observations of other monitors. A worm signature that is flagged as being possiblymalicious by many monitors is more likely to be a truly malicious worm payload signature.This extra degree of confidence may also prevent unspecific signatures from being publishedor used to establish misguided network filtering.
5.2 Privacy Consideration
Care must be taken in the collaboration among distributed monitors. Pattern-extraction-based signature generation algorithms require the access to the network traffic payload thatmay contain private or proprietary information. If the private information in payloads areleaked in the payload sharing process, it can negate the benefits of improved network se-curity. We address this privacy problem assuming that the payload content that appears inmany distributed networks should not be private and can be shared as long as the source ofthe payload content is not disclosed.
Then our goal is to design a system that identifies and publishes a suspicious payloadflagged by more than λG monitors. For the convenience, we call this payload a hot item. Colditems, that are not related to global anomaly, so less than λG monitors report, must not bedisclosed because they are akin to be private or specific to a single monitor. In Chapter 7and 8, we introduce two different techniques to protect privacy in different security models.
In order to avoid attacks from the outside of the system, we require all the participat-ing monitors to be approved by a centralized authority and given credentials. By allowingonly approved monitors to participate, we maintain the friendly operational environmentresilient to attacks such as Sybil attacks [40] that use multiple fake identities, too.
68
Chapter 6
A Framework for Distributed PayloadSharing
Motivated by the analysis of payload accumulation speed in a single monitor, we proposea distributed payload sharing framework in this chapter. When a global worm starts itspropagation, the worm payloads will be observed in many distributed networks. In contrast,we expect most innocuous flows are private, so appear in a small number of networks. Thus,if a payload pattern string appears in many places, it is likely to belong to a global wormactivity.
We propose and analyze two different distributed signature detection frameworks: 1)GSD (Globally Suspicious payload pattern Detection), and 2) LSD (Locally Suspicious pay-load Detection). GSD is suitable when a worm scans monitored IP address space uniformlyand slowly. LSD is suitable when a worm scans monitored networks in a non-uniform wayas in LS.
6.1 Distributed Payload Sharing Framework
A distributed signature generation system finds wide-spreading suspicious payloads acrossmultiple monitors and generates signatures based on the payloads. The problem consists oftwo parts: (a) suspicious payload identification and (b) detected signature publication. Inthe suspicious payload identification step, the system determines a set of payload patternsthat appear in many monitoring points. In the signature publication step, local monitorsnotify other monitors of a new signature found locally or from the result of preceding sus-picious payload identification step.
69
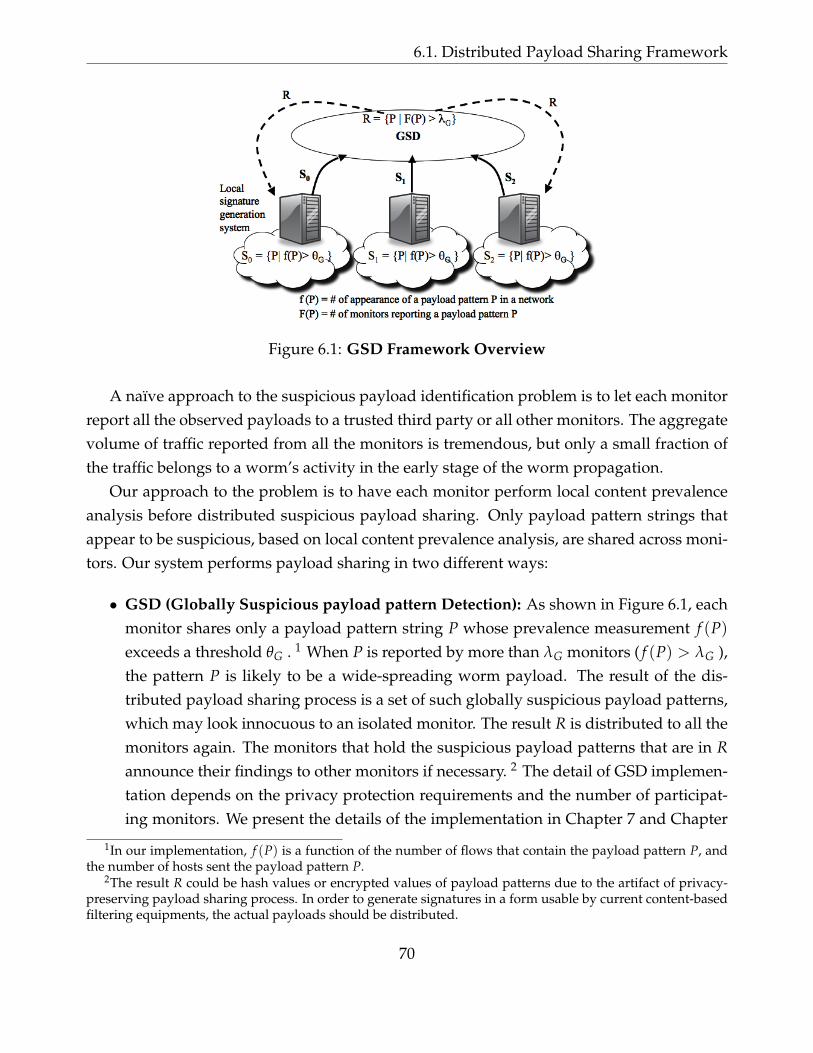
6.1. Distributed Payload Sharing Framework
Figure 6.1: GSD Framework Overview
A naıve approach to the suspicious payload identification problem is to let each monitorreport all the observed payloads to a trusted third party or all other monitors. The aggregatevolume of traffic reported from all the monitors is tremendous, but only a small fraction ofthe traffic belongs to a worm’s activity in the early stage of the worm propagation.
Our approach to the problem is to have each monitor perform local content prevalenceanalysis before distributed suspicious payload sharing. Only payload pattern strings thatappear to be suspicious, based on local content prevalence analysis, are shared across moni-tors. Our system performs payload sharing in two different ways:
• GSD (Globally Suspicious payload pattern Detection): As shown in Figure 6.1, eachmonitor shares only a payload pattern string P whose prevalence measurement f (P)exceeds a threshold θG . 1 When P is reported by more than λG monitors ( f (P) > λG ),the pattern P is likely to be a wide-spreading worm payload. The result of the dis-tributed payload sharing process is a set of such globally suspicious payload patterns,which may look innocuous to an isolated monitor. The result R is distributed to all themonitors again. The monitors that hold the suspicious payload patterns that are in Rannounce their findings to other monitors if necessary. 2 The detail of GSD implemen-tation depends on the privacy protection requirements and the number of participat-ing monitors. We present the details of the implementation in Chapter 7 and Chapter
1In our implementation, f (P) is a function of the number of flows that contain the payload pattern P, andthe number of hosts sent the payload pattern P.
2The result R could be hash values or encrypted values of payload patterns due to the artifact of privacy-preserving payload sharing process. In order to generate signatures in a form usable by current content-basedfiltering equipments, the actual payloads should be distributed.
70
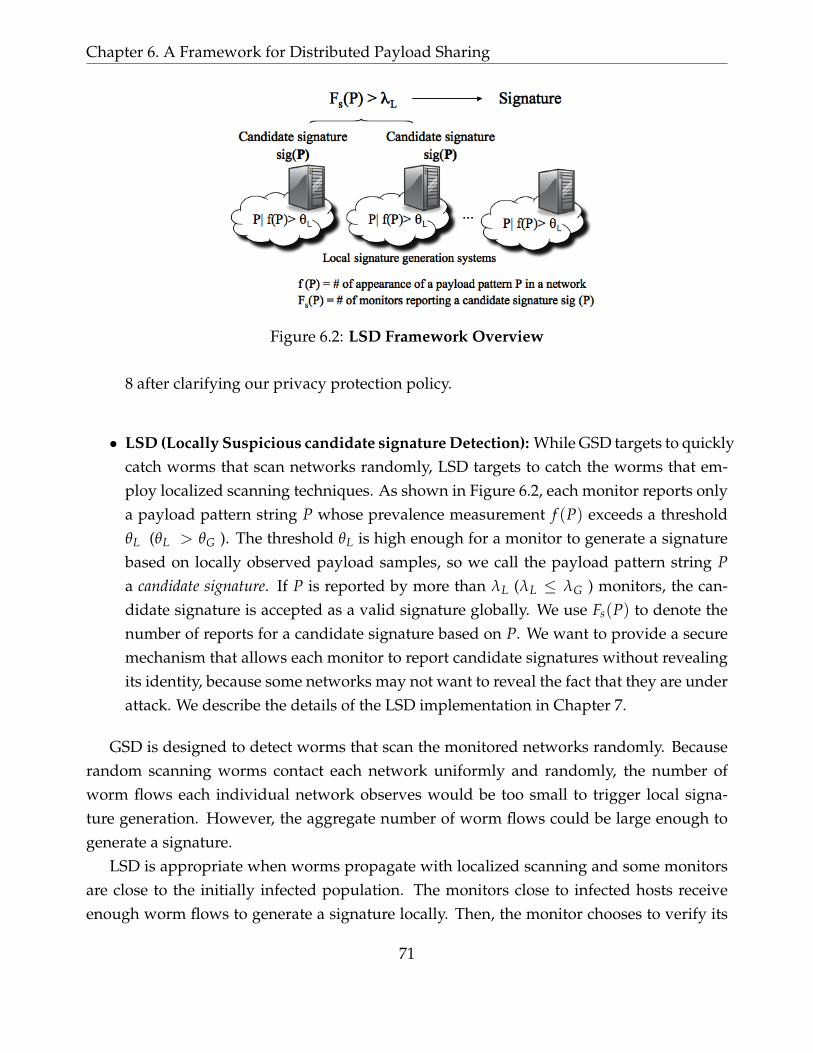
Chapter 6. A Framework for Distributed Payload Sharing
Figure 6.2: LSD Framework Overview
8 after clarifying our privacy protection policy.
• LSD (Locally Suspicious candidate signature Detection): While GSD targets to quicklycatch worms that scan networks randomly, LSD targets to catch the worms that em-ploy localized scanning techniques. As shown in Figure 6.2, each monitor reports onlya payload pattern string P whose prevalence measurement f (P) exceeds a thresholdθL (θL > θG ). The threshold θL is high enough for a monitor to generate a signaturebased on locally observed payload samples, so we call the payload pattern string Pa candidate signature. If P is reported by more than λL (λL ≤ λG ) monitors, the can-didate signature is accepted as a valid signature globally. We use Fs(P) to denote thenumber of reports for a candidate signature based on P. We want to provide a securemechanism that allows each monitor to report candidate signatures without revealingits identity, because some networks may not want to reveal the fact that they are underattack. We describe the details of the LSD implementation in Chapter 7.
GSD is designed to detect worms that scan the monitored networks randomly. Becauserandom scanning worms contact each network uniformly and randomly, the number ofworm flows each individual network observes would be too small to trigger local signa-ture generation. However, the aggregate number of worm flows could be large enough togenerate a signature.
LSD is appropriate when worms propagate with localized scanning and some monitorsare close to the initially infected population. The monitors close to infected hosts receiveenough worm flows to generate a signature locally. Then, the monitor chooses to verify its
71
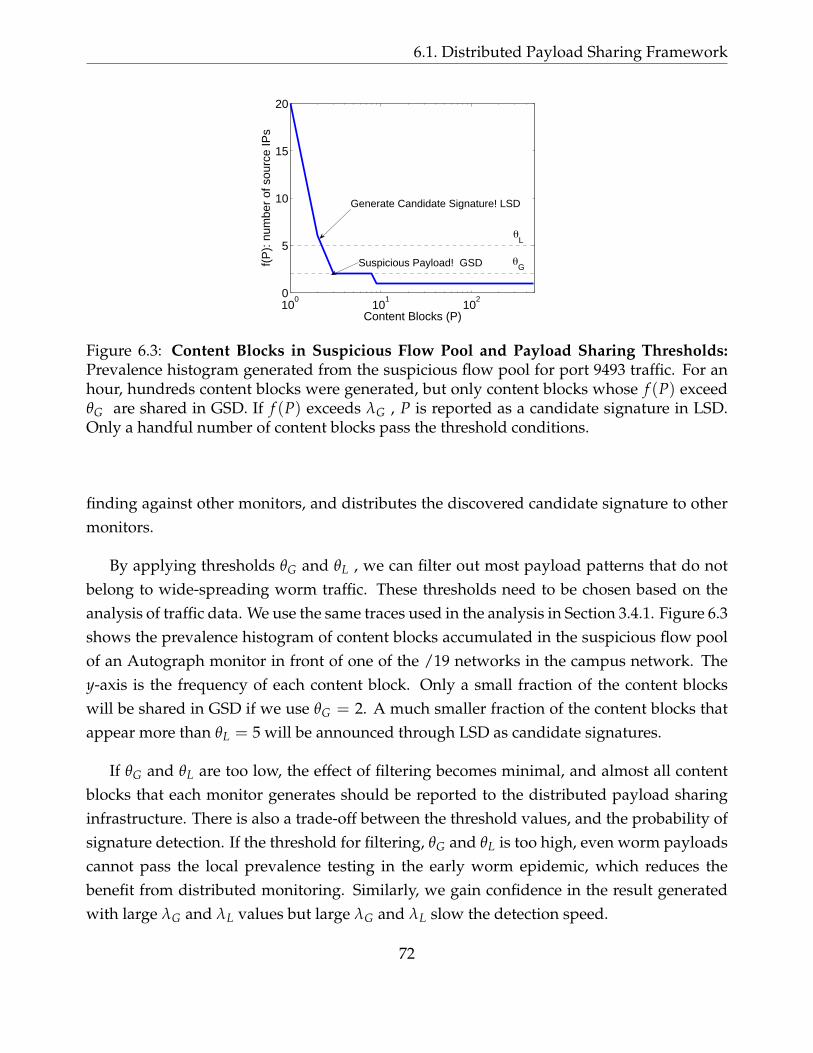
6.1. Distributed Payload Sharing Framework
100
101
102
0
5
10
15
20
Content Blocks (P)
f(P
): n
umbe
r of
sou
rce
IPs
Generate Candidate Signature! LSD
Suspicious Payload! GSD
θL
θG
Figure 6.3: Content Blocks in Suspicious Flow Pool and Payload Sharing Thresholds:Prevalence histogram generated from the suspicious flow pool for port 9493 traffic. For anhour, hundreds content blocks were generated, but only content blocks whose f (P) exceedθG are shared in GSD. If f (P) exceeds λG , P is reported as a candidate signature in LSD.Only a handful number of content blocks pass the threshold conditions.
finding against other monitors, and distributes the discovered candidate signature to othermonitors.
By applying thresholds θG and θL , we can filter out most payload patterns that do notbelong to wide-spreading worm traffic. These thresholds need to be chosen based on theanalysis of traffic data. We use the same traces used in the analysis in Section 3.4.1. Figure 6.3shows the prevalence histogram of content blocks accumulated in the suspicious flow poolof an Autograph monitor in front of one of the /19 networks in the campus network. They-axis is the frequency of each content block. Only a small fraction of the content blockswill be shared in GSD if we use θG = 2. A much smaller fraction of the content blocks thatappear more than θL = 5 will be announced through LSD as candidate signatures.
If θG and θL are too low, the effect of filtering becomes minimal, and almost all contentblocks that each monitor generates should be reported to the distributed payload sharinginfrastructure. There is also a trade-off between the threshold values, and the probability ofsignature detection. If the threshold for filtering, θG and θL is too high, even worm payloadscannot pass the local prevalence testing in the early worm epidemic, which reduces thebenefit from distributed monitoring. Similarly, we gain confidence in the result generatedwith large λG and λL values but large λG and λL slow the detection speed.
72
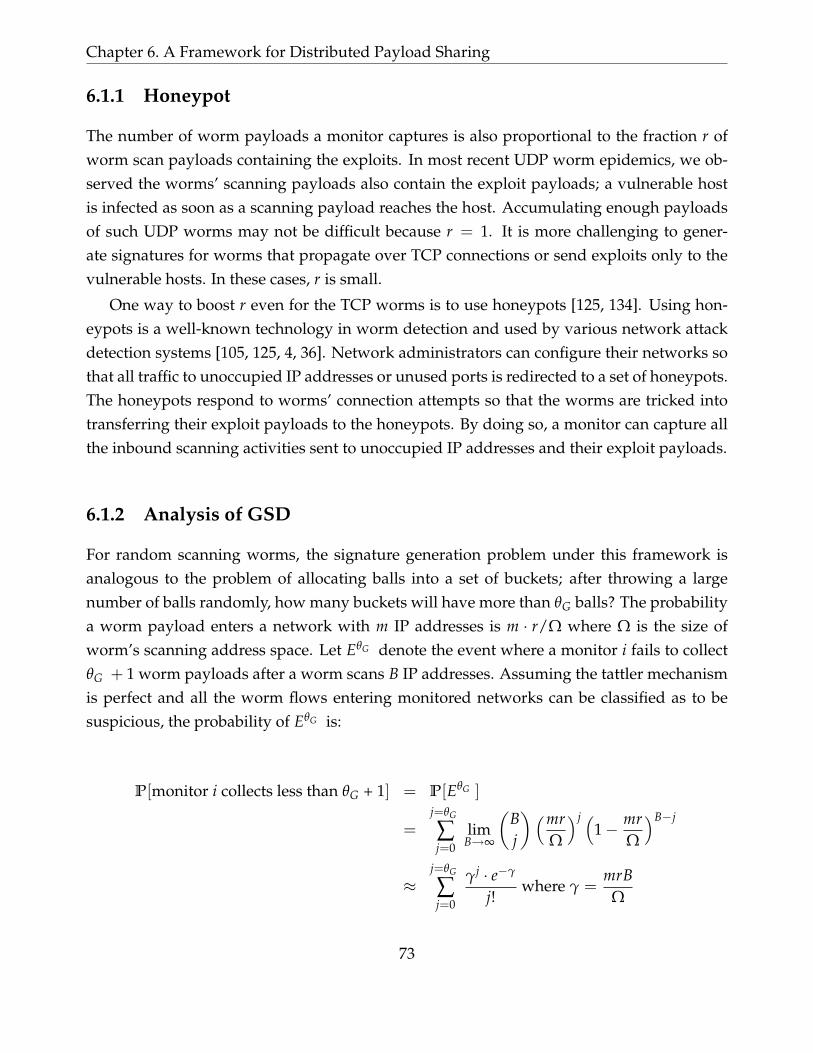
Chapter 6. A Framework for Distributed Payload Sharing
6.1.1 Honeypot
The number of worm payloads a monitor captures is also proportional to the fraction r ofworm scan payloads containing the exploits. In most recent UDP worm epidemics, we ob-served the worms’ scanning payloads also contain the exploit payloads; a vulnerable hostis infected as soon as a scanning payload reaches the host. Accumulating enough payloadsof such UDP worms may not be difficult because r = 1. It is more challenging to gener-ate signatures for worms that propagate over TCP connections or send exploits only to thevulnerable hosts. In these cases, r is small.
One way to boost r even for the TCP worms is to use honeypots [125, 134]. Using hon-eypots is a well-known technology in worm detection and used by various network attackdetection systems [105, 125, 4, 36]. Network administrators can configure their networks sothat all traffic to unoccupied IP addresses or unused ports is redirected to a set of honeypots.The honeypots respond to worms’ connection attempts so that the worms are tricked intotransferring their exploit payloads to the honeypots. By doing so, a monitor can capture allthe inbound scanning activities sent to unoccupied IP addresses and their exploit payloads.
6.1.2 Analysis of GSD
For random scanning worms, the signature generation problem under this framework isanalogous to the problem of allocating balls into a set of buckets; after throwing a largenumber of balls randomly, how many buckets will have more than θG balls? The probabilitya worm payload enters a network with m IP addresses is m · r/Ω where Ω is the size ofworm’s scanning address space. Let EθG denote the event where a monitor i fails to collectθG + 1 worm payloads after a worm scans B IP addresses. Assuming the tattler mechanismis perfect and all the worm flows entering monitored networks can be classified as to besuspicious, the probability of EθG is:
P[monitor i collects less than θG + 1] = P[EθG ]
=j=θG
∑j=0
limB→∞
(Bj
)(mrΩ
)j (1− mr
Ω
)B−j
≈j=θG
∑j=0
γj · e−γ
j!where γ =
mrBΩ
73
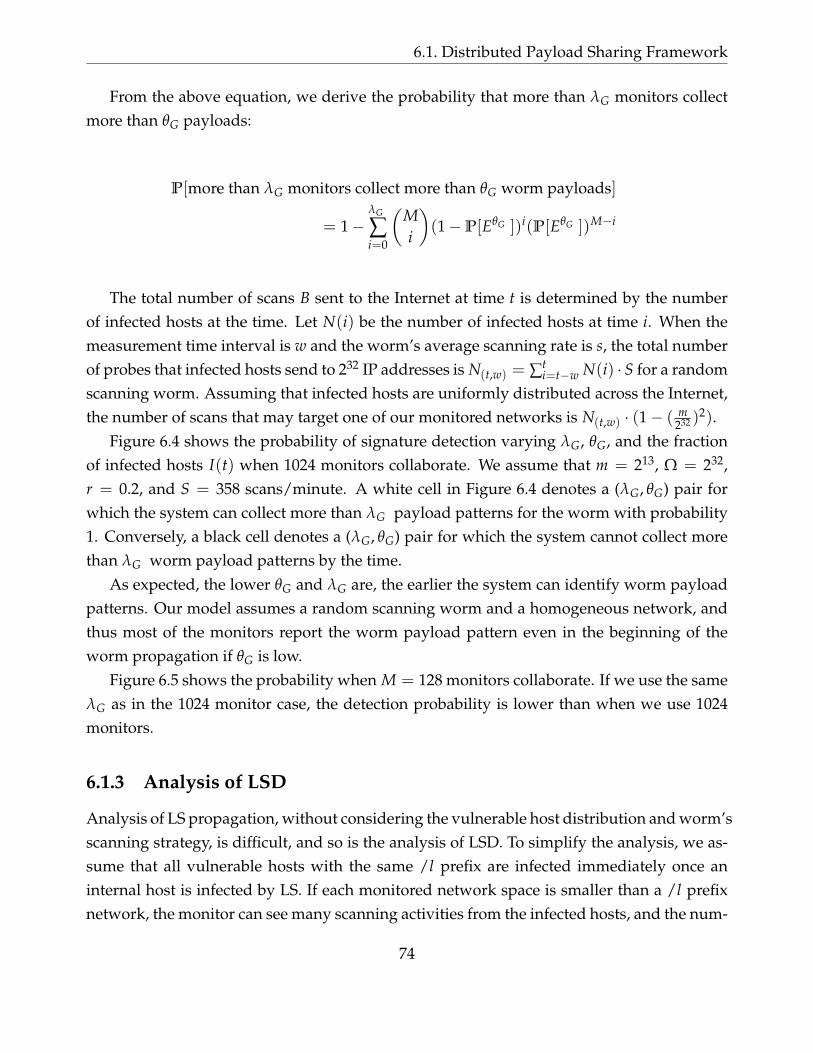
6.1. Distributed Payload Sharing Framework
From the above equation, we derive the probability that more than λG monitors collectmore than θG payloads:
P[more than λG monitors collect more than θG worm payloads]
= 1−λG
∑i=0
(Mi
)(1−P[EθG ])i(P[EθG ])M−i
The total number of scans B sent to the Internet at time t is determined by the numberof infected hosts at the time. Let N(i) be the number of infected hosts at time i. When themeasurement time interval is w and the worm’s average scanning rate is s, the total numberof probes that infected hosts send to 232 IP addresses is N(t,w) = ∑t
i=t−w N(i) · S for a randomscanning worm. Assuming that infected hosts are uniformly distributed across the Internet,the number of scans that may target one of our monitored networks is N(t,w) · (1− ( m
232 )2).Figure 6.4 shows the probability of signature detection varying λG, θG, and the fraction
of infected hosts I(t) when 1024 monitors collaborate. We assume that m = 213, Ω = 232,r = 0.2, and S = 358 scans/minute. A white cell in Figure 6.4 denotes a (λG, θG) pair forwhich the system can collect more than λG payload patterns for the worm with probability1. Conversely, a black cell denotes a (λG, θG) pair for which the system cannot collect morethan λG worm payload patterns by the time.
As expected, the lower θG and λG are, the earlier the system can identify worm payloadpatterns. Our model assumes a random scanning worm and a homogeneous network, andthus most of the monitors report the worm payload pattern even in the beginning of theworm propagation if θG is low.
Figure 6.5 shows the probability when M = 128 monitors collaborate. If we use the sameλG as in the 1024 monitor case, the detection probability is lower than when we use 1024monitors.
6.1.3 Analysis of LSD
Analysis of LS propagation, without considering the vulnerable host distribution and worm’sscanning strategy, is difficult, and so is the analysis of LSD. To simplify the analysis, we as-sume that all vulnerable hosts with the same /l prefix are infected immediately once aninternal host is infected by LS. If each monitored network space is smaller than a /l prefixnetwork, the monitor can see many scanning activities from the infected hosts, and the num-
74

Chapter 6. A Framework for Distributed Payload Sharing
20 40 60 80 100 120
5
10
15
20
25
30
λ
Pr[Signature is detected] when I(t) = 0.02θ g
0.1
0.2
0.3
0.4
0.5
0.6
0.7
0.8
0.9Cannot Detect
Detect
20 40 60 80 100 120
5
10
15
20
25
30
λ
Pr[Signature is detected] when I(t) = 0.05
θ g
0.1
0.2
0.3
0.4
0.5
0.6
0.7
0.8
0.9
Detect
Cannot Detect
Detect
I(t) = 0.02 I(t) = 0.05
Figure 6.4: 1024 GSD Monitors: Signature Detection Probability vs. θG, λG and infectionrate I(t). The white cells indicate that GSD finds a signature for our simulated Code-RedI-v2 worm with a probability of 1 when the combination of corresponding λG and θG is used.The signature detection probability is governed mostly by θG in random scanning wormsignature detection.
20 40 60 80 100 120
5
10
15
20
25
30
λ
Pr[Signature is detected] when I(t) = 0.02
θ g
0.1
0.2
0.3
0.4
0.5
0.6
0.7
0.8
0.9Cannot Detect
Detect
20 40 60 80 100 120
5
10
15
20
25
30
λ
Pr[Signature is detected] when I(t) = 0.05
θ g
0.1
0.2
0.3
0.4
0.5
0.6
0.7
0.8
0.9Cannot Detect
Detect
I(t) = 0.02 I(t) = 0.05
Figure 6.5: 128 GSD Monitors: Signature Detection Probability vs. θG, λG and infectionrate I(t). Since the total number of monitors is only 128, the global threshold λG should beselected accordingly. If we use a local threshold θG lower than 5 and a global threshold λGlower than 38, we can detect the signature of this example random worm before 2% of hostsare infected.
75

6.2. Simulation Results
ber of outbound scans easily exceeds θL . There are M monitors that monitor m IP addressspace each. Then, the total number of candidate signatures reported by LSD is the numberof infected /l prefix networks in the Internet. Thus, the distributed system can generate asignature when λL monitored networks are infected.
6.2 Simulation Results
In our experiments, we simulate the detection of RS and LS worms that have a vulnerablepopulation V = 168, 191, and a scanning rate S = 6000 scans/min. For vulnerable hosts, weuse the source IP addresses of spams, as in Section 5.1.2. We use the 95th percentile infectiondata from Section 5.1.2. The LS worm’s local scanning preference parameters are l = 16 andq = 0.5. We test two different strategies for using LSD and GSD, varying the number ofmonitors M. Throughout this work, we evaluate the signature generation speed in termsof the fraction of infected hosts when a signature for the worm is generated, and we call itsignature detection time.
• Strategy I (Only GSD): a signature is generated and deployed when more than λG
monitors report the worm payload P during a measurement interval τ = 1 hour.
• Strategy II (Only LSD): a signature is generated and deployed when more than λL
monitors report the worm payload P as a candidate signature.
Each monitor analyzes both inbound and outbound traffic of a 213 IP address space. Themonitor has a honeypot so that it can analyze all inbound traffic to unoccupied IP addressesor unused ports (r = 1). For outbound traffic, it is difficult to use the honeypot. Thus, themonitor analyzes the outbound traffic successfully transferred to external hosts. We assumethat a worm finds a host in the same /l network with a probability of 0.16; it finds a host inthe Internet with a probability of 0.02.
For comparison, we use two monitors installed in a randomly chosen 216 IP address net-work. One monitor analyzes all inbound traffic to the network, and 12.5% of the IP addresseshave the worm’s target port open. Another monitor has a honeypot that responds to all con-nection attempts to unused IP addresses or ports. Both monitors generate a worm signaturewhen they observe more than θ = 15 payloads. The parameters were chosen according tothe simulation results in Section 4.5. If multiple monitors collaborate, GSD needs some moretime for correlating reported suspicious payloads and distributing detected signatures, afterλG monitors report a worm payload. We call this delay lag and test the cases where the lag
76

Chapter 6. A Framework for Distributed Payload Sharing
is 0, 1, 5minutes. In LSD, each monitor maintains a counter for each candidate signature.A candidate signature is accepted when the λL + 1-th report is announced. We test threecases where the announcement delay is 0, 1, and 5 minutes respectively. Experiments witha single monitor do not require any distributed operation so the detection time is exactlywhen f (P) exceeds a threshold.
Strategy I: Only GSD. Figure 6.6 (a) and Figure 6.7 (a) show the detection time measuredin the fraction of infected hosts for a random scanning worm (RS) and a localized scanningworm (LS) respectively. A payload pattern string is accepted as a signature if more thanλG monitors report the same string. In this experiment, we set λG = 25. Based on theGSD analysis in Section 6.1.3, the system with this threshold should be able to generate theworm signature before 2% of vulnerable hosts are infected. The squared regions show thedetection time when we monitor a single 216 IP address space with the signature generationthreshold θ = 15.
When a worm scans randomly, worm payloads are evenly distributed across all the mon-itors. The detection time of GSD with 213 IP address space monitoring is much lower thanthat of the monitor installed in 216 IP address space. If a honeypot is also deployed in the 216
IP address space, the monitor can detect the signature much earlier. However, multiple dis-tributed monitors generate a signature even earlier due to the low local detection thresholdθG . For GSD, we use a small content prevalence threshold θG = 2. Because many monitorsreport the same content blocks, we can accept the payload pattern as a signature with highconfidence.
For a localized scanning worm, we also observe that the larger the number of partici-pating monitors, the faster the system can generate the worm signature. The benefit frommultiple monitors is more obvious in LS signature detection than in RS detection. This is be-cause, with a large number of monitors, we have a higher chance of having monitors close toinfected hosts. Even when there is a lag between signature generation and signature distri-bution, GSD with more than 256 monitors could detect the signature as early as the monitorwith a honeypot and a 216 IP address space.
Strategy II: Only LSD. Figure 6.6 (b) and Figure 6.7 (b) show the detection time whenwe use LSD for RS and LS, respectively. LSD with multiple monitors must wait until morethan 10 monitors report the same candidate signature. If there are fewer than 20 monitors,we require LSD to generate signatures when half the monitors report the same candidatesignature. The detection time is higher than the case of 216 IP address monitoring when thenumber of monitors is less than 32 and the worm performs localized scanning. However,if we have more than 128 monitors, the performance is similar to that of 216 IP address
77

6.3. Legitimate Traffic
8 16 32 64 128 256 512 102420480
1
2
3
4
5x 10
−3
Number of Monitors (M)
I(t)
whe
n a
Sig
natu
re is
Det
ecte
d
RS, r=1, m=213, θG
=2, λG
=25
lag: 0minlag: 1minlag: 5min
m = 213 , no honeypotθ =10
0.0095< I(t) <0.0178
m = 216, nohoneypotθ = 15
m = 216, honeypotθ = 15
8 16 32 64 128 256 512 102420480
1
2
3
4
5x 10
−3
Number of Monitors (M)
I(t)
whe
n a
Sig
natu
re is
Det
ecte
d
RS, r=1, m=213, θL=5, λ
L=10
lag: 0minlag: 1minlag: 5min
m = 213 , no honeypotθ =10
0.0095< I(t) <0.0178m = 216, nohoneypot
θ = 15m = 216, honeypot
θ = 15
(a) Strategy I: Only GSD (b) Strategy II: Only LSD
Figure 6.6: Random Scanning Worm Detection Time: Time is measured as the fraction ofinfected hosts when the detection system completes a signature identification. GSD with128 213 IP address spaces detects the signature when less than 0.1% of vulnerable hosts areinfected. LSD with 128 monitors detects the signature when less than 0.2% of hosts areinfected.
monitoring. This is because we could place some of our monitors close to infected hosts.
For random scanning worms, the signature detection time is higher than that of GSDbecause the number of payloads received is limited by the size of the monitored network.However, the LSD did detect the signature before 0.2% of hosts are infected.
In sum, GSD is good when a worm scans randomly, or the monitored networks are farfrom the initially infected population. LSD is good for localized scanning worm signaturedetection. This suggests that, by combining GSD and LSD, we can develop a system that issuitable both for both localized scanning worms and random scanning worms.
6.3 Legitimate Traffic
The distributed framework we are proposing utilizes the characteristics of wide-spreadingmalicious payloads. We assume the payload pattern belongs to worm traffic if it appears inmany locations. However, can the system avoid misclassifying legitimate traffic as wormtraffic? If it misclassifies legitimate traffic as worm traffic, will it be dangerous to publish theidentified payload patterns?
To answer these questions, we study real traffic traces. The traces contain full payloadsof smtp (port 25), http (port 80), p2p (port 9493) traffic collected at a border router of auniversity campus network on Aug 25, 2006 for an hour. The details of the trace are as de-
78
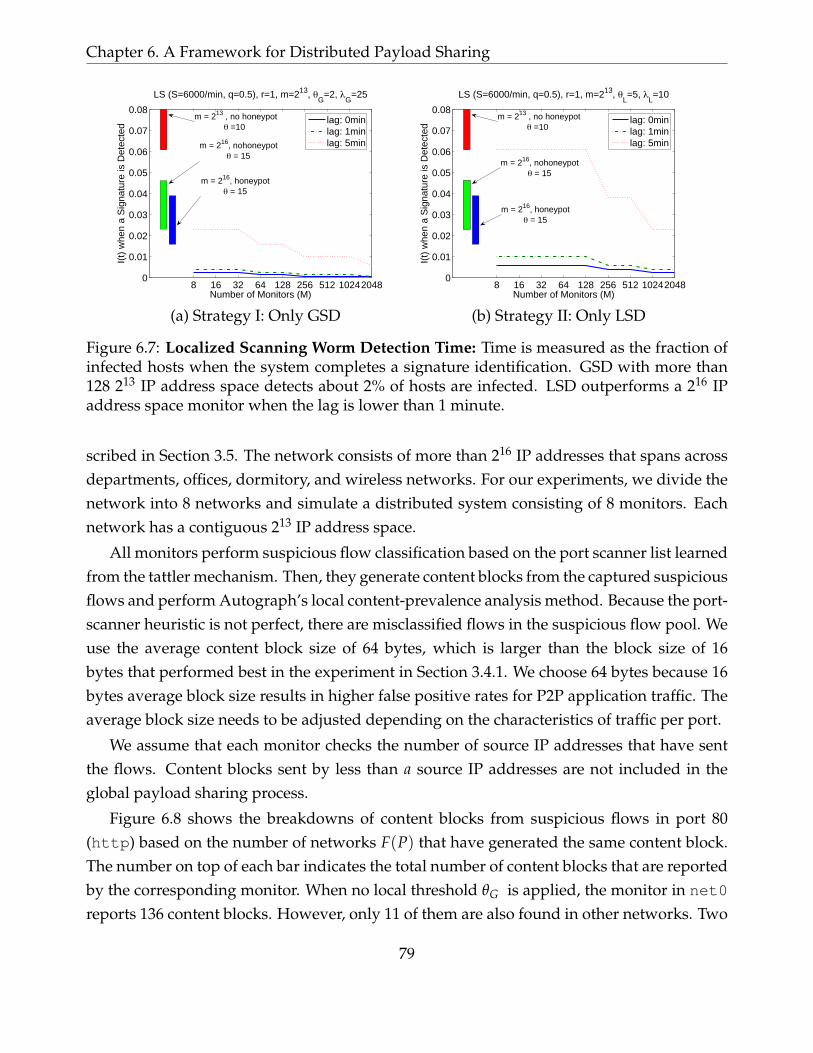
Chapter 6. A Framework for Distributed Payload Sharing
8 16 32 64 128 256 512 102420480
0.01
0.02
0.03
0.04
0.05
0.06
0.07
0.08
Number of Monitors (M)
I(t)
whe
n a
Sig
natu
re is
Det
ecte
d
LS (S=6000/min, q=0.5), r=1, m=213, θG
=2, λG
=25
lag: 0minlag: 1minlag: 5min
m = 213 , no honeypotθ =10
m = 216, nohoneypotθ = 15
m = 216, honeypotθ = 15
8 16 32 64 128 256 512 102420480
0.01
0.02
0.03
0.04
0.05
0.06
0.07
0.08
Number of Monitors (M)
I(t)
whe
n a
Sig
natu
re is
Det
ecte
d
LS (S=6000/min, q=0.5), r=1, m=213, θL=5, λ
L=10
lag: 0minlag: 1minlag: 5min
m = 213 , no honeypotθ =10
m = 216, nohoneypotθ = 15
m = 216, honeypotθ = 15
(a) Strategy I: Only GSD (b) Strategy II: Only LSD
Figure 6.7: Localized Scanning Worm Detection Time: Time is measured as the fraction ofinfected hosts when the system completes a signature identification. GSD with more than128 213 IP address space detects about 2% of hosts are infected. LSD outperforms a 216 IPaddress space monitor when the lag is lower than 1 minute.
scribed in Section 3.5. The network consists of more than 216 IP addresses that spans acrossdepartments, offices, dormitory, and wireless networks. For our experiments, we divide thenetwork into 8 networks and simulate a distributed system consisting of 8 monitors. Eachnetwork has a contiguous 213 IP address space.
All monitors perform suspicious flow classification based on the port scanner list learnedfrom the tattler mechanism. Then, they generate content blocks from the captured suspiciousflows and perform Autograph’s local content-prevalence analysis method. Because the port-scanner heuristic is not perfect, there are misclassified flows in the suspicious flow pool. Weuse the average content block size of 64 bytes, which is larger than the block size of 16bytes that performed best in the experiment in Section 3.4.1. We choose 64 bytes because 16bytes average block size results in higher false positive rates for P2P application traffic. Theaverage block size needs to be adjusted depending on the characteristics of traffic per port.
We assume that each monitor checks the number of source IP addresses that have sentthe flows. Content blocks sent by less than a source IP addresses are not included in theglobal payload sharing process.
Figure 6.8 shows the breakdowns of content blocks from suspicious flows in port 80(http) based on the number of networks F(P) that have generated the same content block.The number on top of each bar indicates the total number of content blocks that are reportedby the corresponding monitor. When no local threshold θG is applied, the monitor in net0
reports 136 content blocks. However, only 11 of them are also found in other networks. Two
79
6.3. Legitimate Traffic
content blocks are common across F(P) = 5 networks. When we apply a high θG (Fig-ure 6.8), we can filter most content blocks and reduce the required bandwidth for payloadsharing. For example, the monitor in net0 has only one content block that appears in othertwo monitors’ networks.
Figure 6.9 shows the breakdowns of content blocks from port 25 (smtp). Suspicious flowsfor port 25 can be long e-mail messages that contain files and many images. Thus, eachnetwork monitor could generate thousands content blocks easily. There are many contentblocks common across 6 networks. However, after filtering out the content blocks sent byonly one or two source IP addresses, all monitors but the one in net0 have an empty set ofcontent blocks to be reported. Those 80 content blocks are from spam e-mails sent by twohosts. The emails contain long MIME-encoded content and generate many content blocks.
Figure 6.10 shows a similar trend for port 9493 (p2p). The networks that have P2P clientsare contacted concurrently by a few mistakenly accused scanner IP addresses. All P2P filesearch requests through the IP addresses are captured in suspicious flow pools. So, whenwe use θG = 0, about half of the reported content blocks from each monitor are common.Also, the actual number of content blocks is large because many P2P search requests areforwarded through the IP addresses. If we apply θG = 1, each monitor needs to report onlyfewer than 16 content blocks. The local threshold θG reduces the number of content blockssignificantly.
We expect, however, that the number of shared payload patterns would become larger asmore networks participate in this distributed system. Higher threshold parameters wouldhelp reduce the probability of the false positives, but reduce the probability of catchingworms.
We examined the payload pattern substrings reported by multiple monitors. If they area part of private information, our distributed approach to signature generation is flawed.Fortunately, we could not find any patterns belonging to private information. We list whatcaused the frequent substrings to appear in many networks.
• HTTP: footers of HTTP messages that specify the browser types and the recognizableapplications; web crawler traffic; parts of HTML structures frequently used by popularweb message board software.
• SMTP: e-mail spams 3. Unfortunately there are a couple of prevalent substrings thatseem to belong to newsletters, sent from multiple source IP addresses. More study onthe right threshold for SMTP traffic is still needed.
3The large number of reports is due to a long spam e-mails sent from multiple senders.
80
Chapter 6. A Framework for Distributed Payload Sharing
• P2P (FileGuri): parts of control messages that specify the client software versionsand applications, and popular queries.
Since we examined traces only from a single site and only for three protocols, it is tooearly for us to draw a generalized conclusion about the commonality in suspicious flows. Weneed further investigation with traffic from other sites and for other ports. Note, however,smtp, http, and p2p protocol traffic is the most frequently captured in the suspicious flowpool, and the byte volume of web, e-mail, and p2p traffic accounts for the majority of thenetwork traffic in our experience with Autograph. The traffic for those ports contributesmost of false signature generation in our experience with Autograph.
Even though the content blocks commonly observed across the monitored networks arenot private, they are still problematic if we want to deploy the signatures generated by Au-tograph in automatic content-based filtering boxes. However, the set of such false signaturescan be avoided by using a signature blacklist, and a different set of parameters dependingon the traffic mix for each port. The blacklist contains the commonly used HTTP headersand footers, web crawlers’ signatures, and P2P application message headers. A handful ofblacklist entries would be sufficient to suppress the prevalent innocuous payload patternstrings found in our traffic trace.
6.4 Summary
The speed of pattern-extraction-based signature generation depends on how quickly a sys-tem can capture enough worm payload samples to trigger its content-prevalence analysis.We have proposed a distributed signature generation framework designed for moderately-sized networks to collaboratively generate signatures for both random scanning worms andlocalized scanning worms. By using distributed monitors, we can increase the chance ofplacing monitors close to vulnerable hosts, which is important for localized scanning wormsignature generation. Distributed monitors allows us to generate signatures for randomscanning worms earlier than one single monitor that monitors a large network (i.e., a 216
IP address space). A prerequisite assumption under our distributed monitoring frameworkis that wide-spreading worm payloads are observed from many locations; legitimate pri-vate traffic payloads are not observed from many locations. We examined this assumptionby studying a real traffic trace collected from a class-B IP network. From our study, we dofind that some payload patterns are commonly found from multiple monitoring points butthey are not private. More importantly, they could be suppressed with a short signature
81

6.4. Summary
blacklists.In the next chapters, we propose two payload sharing techniques that protect the privacy
of uncommon, possibly private payload patterns under our payload sharing frameworks.
82

Chapter 6. A Framework for Distributed Payload Sharing
(a) θG = 0 (b)θG = 2
Figure 6.8: Payload Pattern Sharing: HTTP port 80 traffic. Breakdown of content blocksbased on the number of networks reporting the same content block. Each number on top of abar shows the total number of content blocks that are reported by the monitor. With a higherlocal threshold (θG = 2), most content blocks are filtered out. For example, the monitor innet2 reported 3 content blocks in total but none of them appeared in other networks. Thosecontent blocks.
83

6.4. Summary
(a) θG = 0 (b) θG = 2
Figure 6.9: Payload Pattern Sharing: SMTP port 25 traffic.
84
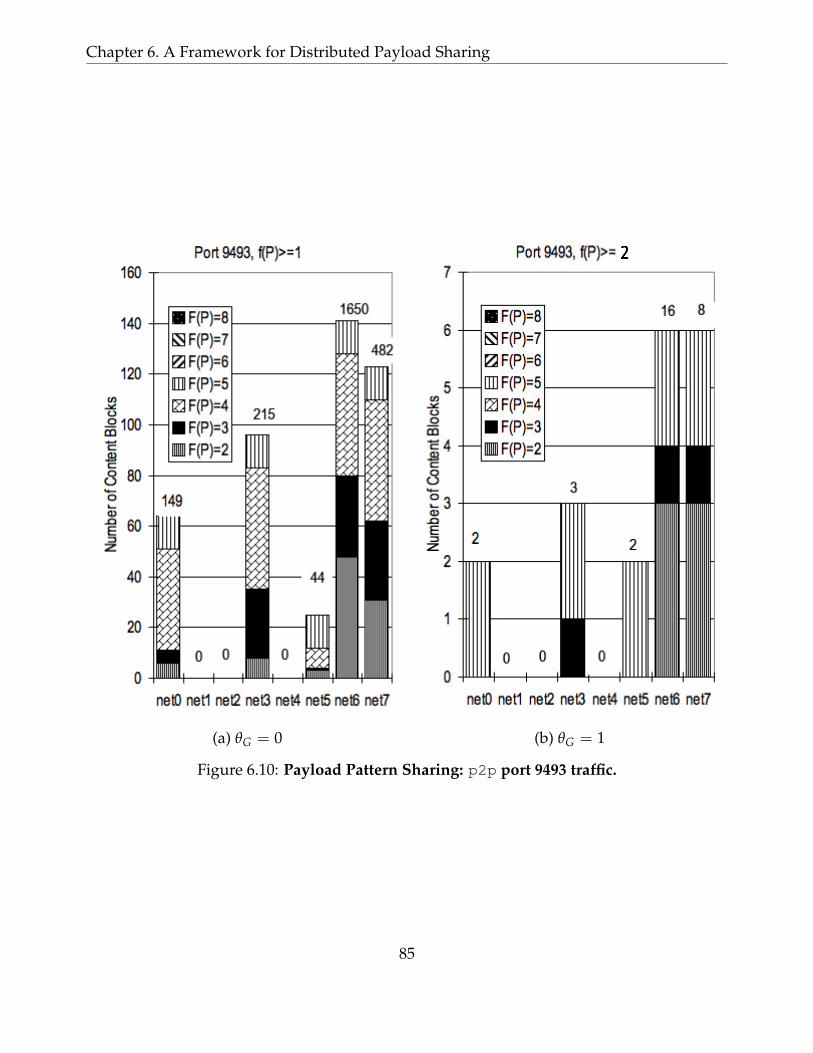
Chapter 6. A Framework for Distributed Payload Sharing
2
(a) θG = 0 (b) θG = 1
Figure 6.10: Payload Pattern Sharing: p2p port 9493 traffic.
85

6.4. Summary
86
Chapter 7
Preserving Privacy using HOTITEM-ID
Selecting a worm payload pattern out of a large volume of data while preserving the privacyof thousands of participating monitors is a difficult problem. In this chapter, we develop atechnique to perform privacy-preserving suspicious payload sharing across thousands ofdistributed monitors. The technique protects the owner and data privacy of participatingmonitors by hiding non-popular private items in a crowd of indistinguishable elements.An adversary cannot determine which honest network produced a content block (ownerprivacy) or what private information is in reported content blocks (data privacy). Falsepositives will generally be rare, and thus hidden in a large crowd.
The technique is an application of the HOTITEM-ID protocol proposed by Kissner etal. [69]. The protocols use approximate heavy-hitter detection technique, approximate dis-tinct counting technique, anonymous routing, and a novel cryptographic tool. Section 7.2briefly summarizes the HOTITEM-ID protocol. Section 7.3 presents the adoption of the pro-tocols for privacy-preserving distributed signature generation. Section 7.4 presents our ex-perimental results to show the efficiency of our technique. Detailed analysis of the privacyprotection can be found in the original paper [69].
7.1 Overview
In our problem setting, each monitor Mi (0 ≤ i < M) in the system holds a private dataset Si
of locally identified n content blocks. The monitors are connected by a peer-to-peer network.A λ-threshold hot content block is a content block P that appears in at least λ distinct monitors’private input datasets. Our goal is to find the content block P that appears in at least λ
distinct monitors’ private dataset. Rλ is the set of all λ-threshold hot items in the system. All
87
7.1. Overview
items not in Rλ are called cold items.
7.1.1 Adversary Model
The adversary can eavesdrop on all communication. We assume that a fraction c of the mon-itors may maliciously and arbitrarily misbehave, while the rest of the monitors are honest-but-curious.
Honest-but-curious Monitors. A honest-but-curious monitor will (1) follow the protocolas specified, and (2) not collude with other monitors to gain information, though she maytry to distill information from the messages she receives. For example, a honest-but-curiousmonitor casually browse all the reported content blocks and attempt to find user passwordstransferred in a clear text or interesting web content addresses.
Malicious Monitors. A malicious monitor might not follow the protocol; instead it mightbehave arbitrarily. For example, malicious monitors could collude such that if cM exceedsλ, they can make an arbitrary cold item hot by each reporting it as being in their privateinput set. However, this problem is out of the scope of this work. Because any monitorhas the freedom to choose its private input set, any protocol in this setting is vulnerable tothis manipulation. We focus on the secure payload sharing when at most cM monitors aremalicious.
A malicious monitor could mount attacks on the distributed hot item identification sys-tem claiming to have many copies of one item, and try to boost the frequency of a cold itemto be high enough to become a hot item; we call this the inflation attack. The HOTITEM-IDprotocol ensures that each monitor can only contribute to the frequency count of an item atmost once by using a novel cryptographic method called one-show tags (Section 7.2.2). Notethat the one-show tags can be applied to address our candidate signature publication problemin LSD. We discuss the detail in Section 7.3.1.
Moreover, malicious monitors could attempt to forge cryptographic signatures, send bo-gus reports, try to learn honest monitors’ private data, or fool other monitors. The HOTITEM-ID protocol defends against all of these attacks.
7.1.2 Correctness and Privacy Protection
The HOTITEM-ID protocol guarantees the correctness and privacy protection defined by thefollowings:
Correctness: Given the false positive rate δ+ and the false negative rate δ−:
88
Chapter 7. Preserving Privacy using HOTITEM-ID
• ∀P ∈ Si ∩ Rk, monitor Mi learns that P ∈ Rk with probability at least 1− δ−.
• ∀P ∈ Si ∩ Rk, monitor Mi learns that P 6∈ Rk with probability at least 1− δ+.
Owner Privacy: no coalition of at most cM malicious PPT (Probabilistic PolynomialTime) adversaries can gain more than a negligible advantage in associating an item P with ahonest monitor Mi (0 ≤ i < M) such that P ∈ Si, because all monitors simply are given theset of hot items Rk and their frequencies.
Data Privacy: The HOTITEM-ID protocol provides probabilistic privacy protection ratherthan strong privacy protection discussed in many cryptography papers [70]. The degree ofthe privacy of an item P describes the size of the ’crowd’ in which the content block is hid-den. We use the size of the crowd to measure the degree of privacy in this work. A contentblock P which appears in FP monitors’ private input sets has Φ(FP)-degree of data privacyif no coalition of at most cM malicious probabilistic polynomial-time (PPT) adversaries candistinguish the pattern P from an expected indistinguishable set of Φ(FP) content blocks. 1
Thus, for a cold item P, the larger Φ(FP) is the better protected it is in general. In otherwords, with a large Φ(FP), it is less likely that P is known to other participants that do notown P.
The HOTITEM-ID protocol is highly efficient in that it has constant per-monitor com-munication overhead. The efficiency is important for a large scale distributed privacy-preserving signature generation system because the system needs to generate signaturesbefore a fast worm widely spreads. Even when thousands of monitors participate in theprocess, the HOTITEM-ID achieves its efficiency by adopting a relaxed notion of privacyinstead of cryptographically guaranteed privacy. However, the relaxed notion of privacyprovides sufficient protection for our purpose.
7.2 HOTITEM-ID Protocol
In Figure 7.1, we show an overview of the components of the efficient privacy-preservinghot item identification protocol HOTITEM-ID . We first introduce the intuition behind eachcomponent. The full detail of each component is described in our paper [69]. In Section 7.2.6,we describe the full construction of HOTITEM-ID. Once all monitors learn the hot items intheir private datasets, they can distribute the signature using the mechanism described inSection 7.3.1.
1All elements in an indistinguishable set are not distinguishable from each other with every efficient algo-rithm.
89
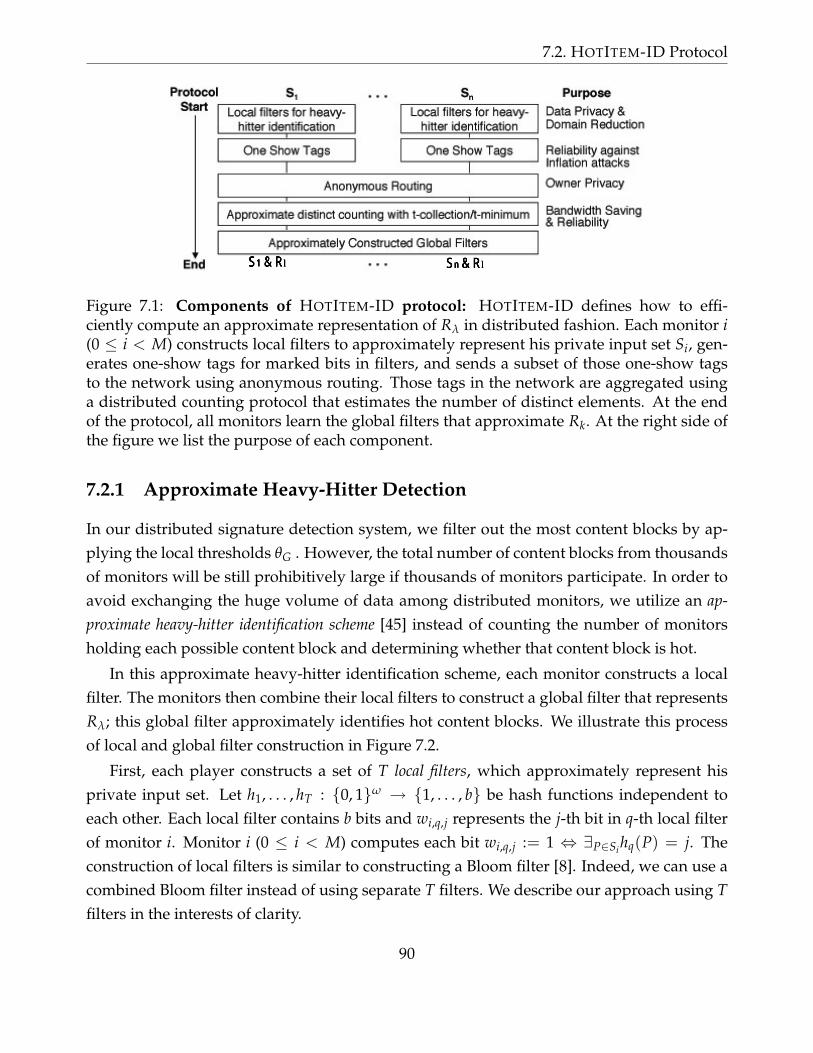
7.2. HOTITEM-ID Protocol
S1 & Rl Sn & Rl
Figure 7.1: Components of HOTITEM-ID protocol: HOTITEM-ID defines how to effi-ciently compute an approximate representation of Rλ in distributed fashion. Each monitor i(0 ≤ i < M) constructs local filters to approximately represent his private input set Si, gen-erates one-show tags for marked bits in filters, and sends a subset of those one-show tagsto the network using anonymous routing. Those tags in the network are aggregated usinga distributed counting protocol that estimates the number of distinct elements. At the endof the protocol, all monitors learn the global filters that approximate Rk. At the right side ofthe figure we list the purpose of each component.
7.2.1 Approximate Heavy-Hitter Detection
In our distributed signature detection system, we filter out the most content blocks by ap-plying the local thresholds θG . However, the total number of content blocks from thousandsof monitors will be still prohibitively large if thousands of monitors participate. In order toavoid exchanging the huge volume of data among distributed monitors, we utilize an ap-proximate heavy-hitter identification scheme [45] instead of counting the number of monitorsholding each possible content block and determining whether that content block is hot.
In this approximate heavy-hitter identification scheme, each monitor constructs a localfilter. The monitors then combine their local filters to construct a global filter that representsRλ; this global filter approximately identifies hot content blocks. We illustrate this processof local and global filter construction in Figure 7.2.
First, each player constructs a set of T local filters, which approximately represent hisprivate input set. Let h1, . . . , hT : 0, 1ω → 1, . . . , b be hash functions independent toeach other. Each local filter contains b bits and wi,q,j represents the j-th bit in q-th local filterof monitor i. Monitor i (0 ≤ i < M) computes each bit wi,q,j := 1 ⇔ ∃P∈Sihq(P) = j. Theconstruction of local filters is similar to constructing a Bloom filter [8]. Indeed, we can use acombined Bloom filter instead of using separate T filters. We describe our approach using Tfilters in the interests of clarity.
90

Chapter 7. Preserving Privacy using HOTITEM-ID
filter 1
filter 2
filter 3
Player 1's local filter Global FiltersPlayer 2's local filter Player 3's local filter
Figure 7.2: Approximate Heavy Hitter Detection: In our HOTITEM-ID protocol, each playeri constructs a set of local filters from his private input set Si (dark bits are ‘hit’). The playersthen construct global filters using an approximate counting scheme; if a bit was hit by atleast λ players, then it is ‘hit’ (dark) as well. If an element hashes to a dark bit in each of theglobal filters, then it is classified as hot.
The monitors then collaboratively combine their local filters into a set of global filters,using methods described below; global filters approximately represent the monitors’ com-bined private input sets. If at least λ players set bits j of filter q to be 1, then the bit j in theglobal filter q, xq,j := 1 (0 ≤ q < T, 0 ≤ j < b). Otherwise, let xq,j := 0. Given this globalfilter, P is hot with high probability if x1,h1(P) = 1, . . . , xT,hT(P) = 1.
7.2.2 One-Show Tags
In order to construct the global filters, we must count how many monitors set each bit in theirlocal filters. In order to prevent the inflation attack while preserving the owner privacy, theHOTITEM-ID protocol forces each monitor to ‘vote’ at most once with anonymous one-showtags.
If a monitor has set a bit, it constructs a tag for that bit; all monitors then count thenumber of valid tags for each bit to construct the global filters. We require that one-showtags posses the following properties: (a) no PPT adversary can construct more than onevalid tag for any bit with non-negligible probability; (b) any monitor can detect tags that areinvalid, or not associated with a particular bit, with overwhelming probability; (c) for everybit, the tags constructed by any two monitors are distinct, with overwhelming probability;(d) no PPT adversary can distinguish the monitor that constructed it, with probability non-negligibly different than 1
(1−c)M , where M is the number of honest monitors and c is thefraction of malicious monitors.
The anonymous one-show tags are constructed by extending any group signature scheme.A group signature scheme allows each member in a group to sign messages on behalf of the
91

7.2. HOTITEM-ID Protocol
group. Given these signatures, no player or coalition of members (except the trusted groupmanager) can distinguish the member that produced any signature, nor can they determineif two signatures were produced by the same group member. In our work, we extend thegroup signature scheme of Boneh and Shacham [11] to construct the one-show tags. Theone-show tag is lightweight, requiring 1539 bits.
In the Boneh and Shacham group signature scheme, the group public key is pk = g1, g2, w,where g1 ∈ G1, g2 ∈ G2, and w = gsk
2 for sk ← Z∗p. (p can be taken to be a 170-bit prime,and the elements of G1, G2 can be represented in 171 bits [11].) The trusted group managerholds the group secret key sk. Each user i (1 ≤ i ≤ n) has a private key si = Ai, xi, wherexi ∈ Z∗p, Ai ∈ G1. Using his private key, each player may sign a message, using a variant of
the Fiat-Shamir heuristic [47], by proving knowledge of a pair Ai, xi such that Axi+ski = g1.
We modify this group signature scheme to include provably correct one-show values,making each signature a one-show tag. Each monitor i (1 ≤ i ≤ n) constructs a one-showtag for bucket j of filter q (1 ≤ q ≤ T, 1 ≤ j ≤ b) by: (1) signing the message q||j essentially asin the original signature scheme; (2) computing two additional values to enable the recipientmonitor to compute the one-show value.
Each monitor generates gq,j ∈ G2 by an agreed-on scheme. We utilize the same bilinearmapping e as in the computation of the main signature, as well as the intermediate valuev, α, rα computed as intermediate values utilized in the main signature. Monitor i computesthese additional elements for a one-show tag:
T3 = e(rαv, gq,j)
T4 = e(αv, gq,j)
The sole change to the original signature scheme is that the challenge value c is computedas c = H(pk, q||j, r, T1, T2, T3, T4, R1, R2, R3). The recipient conducts all the validity checksspecified in the Boneh/Shacham signature scheme, as well as the following additional check,derived from a proof of discrete logarithm equality [23]:
e(sαv, gq,j) = Tc4 T3
We define the one-show value as e(Ai, gq,j); note that this value cannot be constructed byany player other than i and that player i can construct exactly one such value. To compute
92
Chapter 7. Preserving Privacy using HOTITEM-ID
this value, the signature recipient computes:
(e(−cT2sαv, gq,j)T3
) 1c
The additional zero-knowledge proof required for the one-show tag construction is ef-ficient, and thus our one-show tag construction and verification is nearly as efficient as theoriginal group signature scheme. Note that these one-show tags are unlinkable, anonymous,and can be verified by all players who hold the group public key.
The parameter gq,j, used to construct a one-show value associated with bucket j of filterT (1 ≤ q ≤ T, 1 ≤ j ≤ b), can be efficiently constructed in a variety of ways such that noplayer knows its discrete logarithm. In this section, we briefly describe one such approach.
Let PRNG be a pseudo-random number generator with range G2 [82]. Let the `th elementoutput from this PRNG on seed σ be denoted σ`. If σ2
(q−1)b+(j−1) is a generator of G2, then
gq,j := σ2(q−1)b+(j−1). If this is not the case, then if
(h(σ(q−1)b+(j−1))
)2is a generator of G2,
then gq,j :=(
h(σ(q−1)b+(j−1)))2
. If this is not the case, then repeat the process of hashingand testing until an element is found that is a generator of G2. As a large portion of G2 aregenerators, a low number of repetitions are generally needed.
Note that σ can be chosen anew each time the protocol is run to prevent reuse of one-show tags. For example, it might be generated from a common timestamp.
7.2.3 Approximate Distinct Element Counting
We can now securely identify hot items by utilizing global filters and anonymous one-showtags. However, exactly counting the number of valid, distinct one-show tags is inefficient.HOTITEM-ID performs the task of approximate counting of distinct tags through an efficientalgorithm for approximate distinct element counting [6]. The HOTITEM-ID protocol provideseven more efficiency by estimating directly, through a modified use of this approximation,whether there are more or fewer than λ tags for a bit; this is the task that must be performedto construct the global filters.
Let H : 0, 1∗ → 0, 1ω be a collision-resistant cryptographic hash function. Letv1, . . . , vt represent valid one-show tags that, when hashed withH, have the smallest valuesof any tags in the set. The monitors can perform this tag collection task often without evenexamining every tag. For example, any tag with value greater than t2ω
λ may be immedi-ately discarded without affecting the approximation. We call this approximate tag countingtechnique t-collection.
93

7.2. HOTITEM-ID Protocol
There may be a large gap between the frequency of worm content blocks and legitimatetraffic content blocks. Random scanning worms contact a large number of networks duringa measurement interval. Even the localized scanning worms attempt to contact a large num-ber of IP addresses in a local network. However, content blocks from legitimate traffic areshared among only a small number of IP addresses. Thus, to gain greater efficiency in de-tecting bits with at least λ one-show tags, we adjust the t-collection protocol such that eachmonitor attempts to collect t tags with hash values of at most (1 + γ) t2ω
λ . The γ is a constantbased on the size of the ‘gap’ between the frequency of worm content blocks and legitimatecontent blocks, and this gap needs to be determined based on the analysis of traffic. We gainefficiency by reducing t, while retaining accuracy.
7.2.4 Anonymous Communication
We now apply our tools to a network structure to complete the protocol. In order to disasso-ciate the anonymous one-show tags from their origins in the network, each monitor anony-mously routes its tags to ρ randomly chosen nodes. The constant ρ can be varied to achievegreater or lesser degrees of robustness; at least one participating monitor should receive eachmonitor’s tags. We require an anonymous routing scheme that allows any monitor to senda message to a uniformly randomly selected monitor, without revealing the source to anyintermediate routing node. Simple and lightweight schemes can be used, as HOTITEM-IDrequires only that each monitor send anonymous messages to a uniformly selected destina-tion node, without revealing who sent the message. Some previously proposed anonymousnetworking schemes include [24, 22, 111, 112, 84].
7.2.5 Distributed One-Show Tag Collection
Once all the monitors have anonymously received the initial set of one-show tags, they countthe number of tags associated with each bit of the filters. The HOTITEM-ID protocol requireseach monitor send messages to each of its neighbors, who form a connected graph. Forclarity of presentation, our protocols assume synchronous communication, but this can beeasily adapted to an asynchronous model.
Each monitor maintains a set of at most t valid tags which have hash values at most(1 + γ) t2ω
λ . Upon learning a new tag that will be added to the set, a monitor sends thenew tag to all of its neighbors. When a monitor has collected t tags with hash values ofat most (1 + γ) t2ω
λ , and sent each of these tags to its neighbors, it ends its participation
94
Chapter 7. Preserving Privacy using HOTITEM-ID
in the distributed t-collection protocol. If there do not exist t such small-hash-value tags,the protocol must continue until it converges. This t-collection process ends after at mostlogψ(M) steps if ψ is the average number of neighbors. Note that these protocols can beexecuted in parallel for each bit of the global filters.
7.2.6 Putting HOTITEM-ID to Work
Each monitor has a private key allowing it to construct one-show tags. These keys are dis-tributed by a trusted ‘group manager’.
1. Each monitor constructs T local heavy-hitter identification filters.
2. Each monitor constructs a one-show tag for each bit in the filters set to 1.
3. If the hash (H) of a tag is at most (1 + γ) t2ω
λ , the monitor anonymously sends the tagto ρ randomly chosen nodes.
4. All monitors perform the distributed t-collection protocol.
5. If monitors collect t valid, distinct tags for a bit of a filter, they conclude that the valueof corresponding bit in the global filter is 1.
6. Using the global filter, each monitor can determine if their own payload pattern stringsare hot. The suspicious payload identification completes.
7. Each monitor generates signatures based on the result and publishes.
7.2.7 Correctness Analysis of HOTITEM-ID
In this section, we show that, given certain choices of the parameters b and T, HOTITEM-IDidentifies hot items with high probability. In analyzing this protocol, we must consider bothfalse positives and false negatives. Errors may be caused by inaccurate approximate distinctelement counting, a badly constructed filter, or a combination of the two.
Error from Approximate Distinct-Element Counting. Bar-Yossef et al. [6] shows that ifh(v) is the tth smallest hash value in a set S, where h : 0, 1∗ → 0, 1κ, then the estimateof the set size |S| is t2κ
h(v) . By computing the median of O(
lg 1δ1
)such estimates, with compu-
tationally independent hash functions, we can obtain |S|, an (ε, δ1)-approximation of the setsize.
95
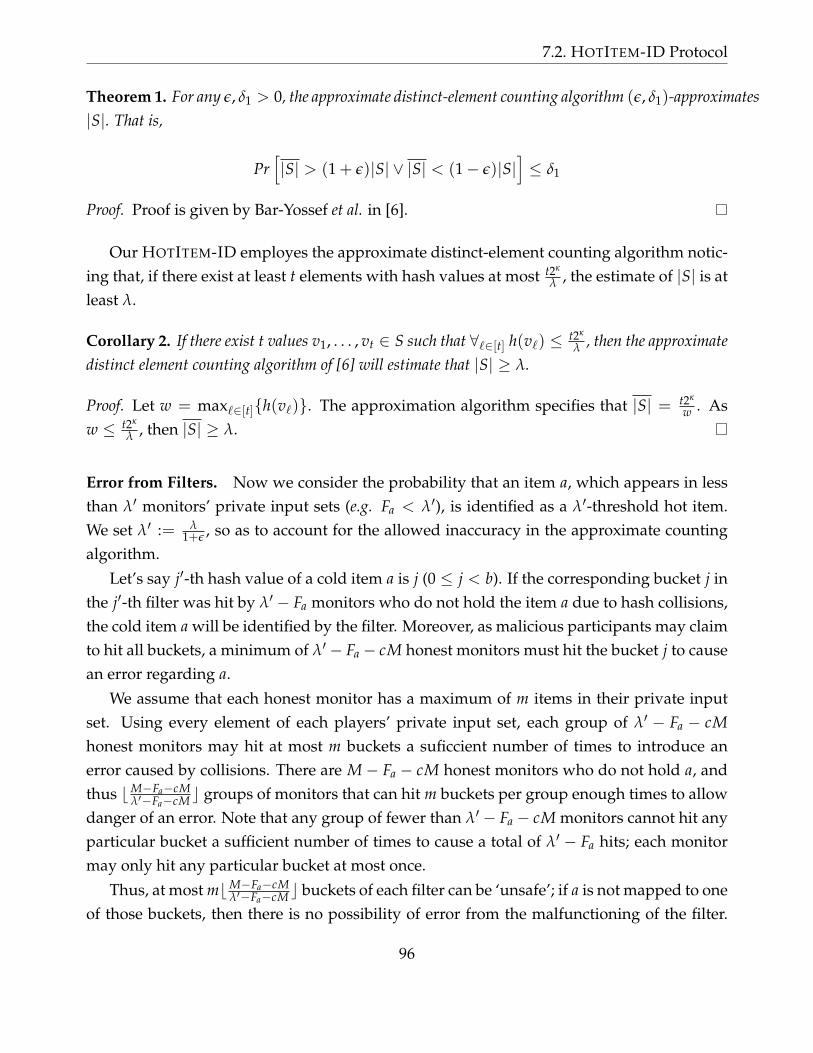
7.2. HOTITEM-ID Protocol
Theorem 1. For any ε, δ1 > 0, the approximate distinct-element counting algorithm (ε, δ1)-approximates|S|. That is,
Pr[|S| > (1 + ε)|S| ∨ |S| < (1− ε)|S|
]≤ δ1
Proof. Proof is given by Bar-Yossef et al. in [6].
Our HOTITEM-ID employes the approximate distinct-element counting algorithm notic-ing that, if there exist at least t elements with hash values at most t2κ
λ , the estimate of |S| is atleast λ.
Corollary 2. If there exist t values v1, . . . , vt ∈ S such that ∀`∈[t] h(v`) ≤ t2κ
λ , then the approximatedistinct element counting algorithm of [6] will estimate that |S| ≥ λ.
Proof. Let w = max`∈[t]h(v`). The approximation algorithm specifies that |S| = t2κ
w . Asw ≤ t2κ
λ , then |S| ≥ λ.
Error from Filters. Now we consider the probability that an item a, which appears in lessthan λ′ monitors’ private input sets (e.g. Fa < λ′), is identified as a λ′-threshold hot item.We set λ′ := λ
1+ε , so as to account for the allowed inaccuracy in the approximate countingalgorithm.
Let’s say j′-th hash value of a cold item a is j (0 ≤ j < b). If the corresponding bucket j inthe j′-th filter was hit by λ′ − Fa monitors who do not hold the item a due to hash collisions,the cold item a will be identified by the filter. Moreover, as malicious participants may claimto hit all buckets, a minimum of λ′− Fa− cM honest monitors must hit the bucket j to causean error regarding a.
We assume that each honest monitor has a maximum of m items in their private inputset. Using every element of each players’ private input set, each group of λ′ − Fa − cMhonest monitors may hit at most m buckets a suficcient number of times to introduce anerror caused by collisions. There are M− Fa − cM honest monitors who do not hold a, andthus bM−Fa−cM
λ′−Fa−cM c groups of monitors that can hit m buckets per group enough times to allowdanger of an error. Note that any group of fewer than λ′ − Fa − cM monitors cannot hit anyparticular bucket a sufficient number of times to cause a total of λ′ − Fa hits; each monitormay only hit any particular bucket at most once.
Thus, at most mbM−Fa−cMλ′−Fa−cM c buckets of each filter can be ‘unsafe’; if a is not mapped to one
of those buckets, then there is no possibility of error from the malfunctioning of the filter.
96
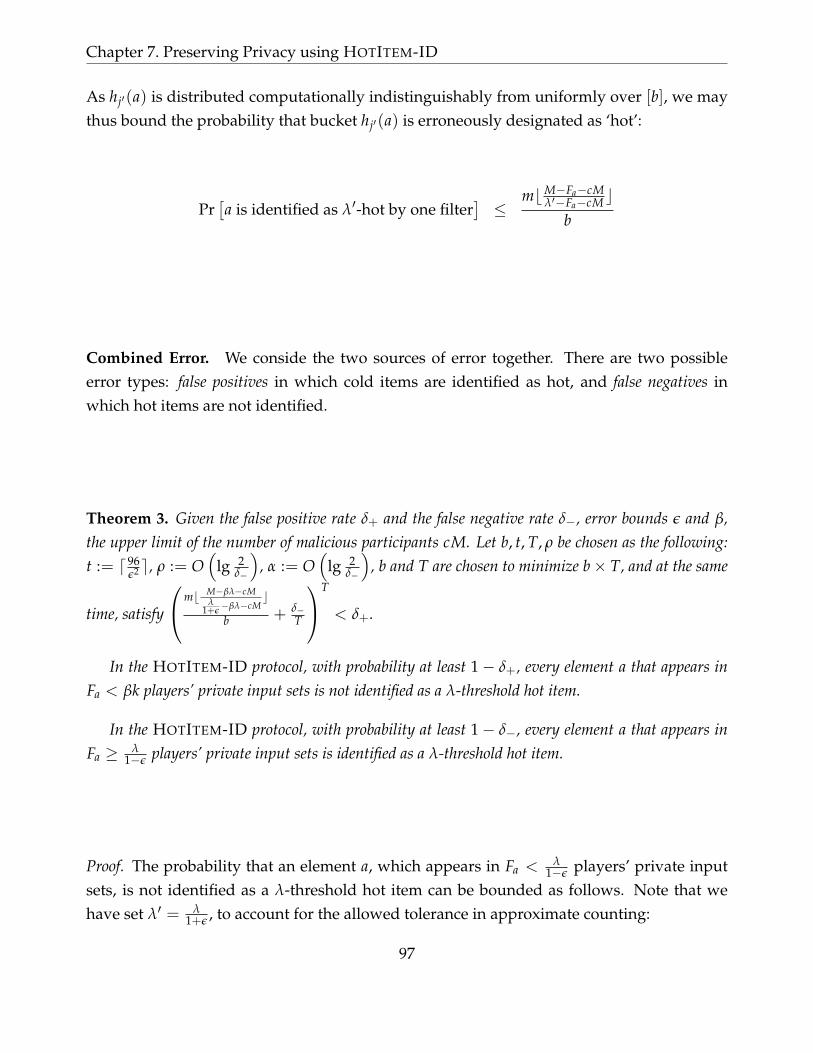
Chapter 7. Preserving Privacy using HOTITEM-ID
As hj′(a) is distributed computationally indistinguishably from uniformly over [b], we maythus bound the probability that bucket hj′(a) is erroneously designated as ‘hot’:
Pr[a is identified as λ′-hot by one filter
]≤
mbM−Fa−cMλ′−Fa−cM c
b
Combined Error. We conside the two sources of error together. There are two possibleerror types: false positives in which cold items are identified as hot, and false negatives inwhich hot items are not identified.
Theorem 3. Given the false positive rate δ+ and the false negative rate δ−, error bounds ε and β,the upper limit of the number of malicious participants cM. Let b, t, T, ρ be chosen as the following:t := d 96
ε2 e, ρ := O(
lg 2δ−
), α := O
(lg 2
δ−
), b and T are chosen to minimize b× T, and at the same
time, satisfy
mb M−βλ−cMλ
1+ε−βλ−cM
c
b + δ−T
T
< δ+.
In the HOTITEM-ID protocol, with probability at least 1− δ+, every element a that appears inFa < βk players’ private input sets is not identified as a λ-threshold hot item.
In the HOTITEM-ID protocol, with probability at least 1− δ−, every element a that appears inFa ≥ λ
1−ε players’ private input sets is identified as a λ-threshold hot item.
Proof. The probability that an element a, which appears in Fa < λ1−ε players’ private input
sets, is not identified as a λ-threshold hot item can be bounded as follows. Note that wehave set λ′ = λ
1+ε , to account for the allowed tolerance in approximate counting:
97

7.2. HOTITEM-ID Protocol
Pr [a is identified as λ-hot] ≤ Pr[in all filters, element a is identified as λ′-hot∨set of size < λ′ approximated as ≥ λ]
=T
∏j′=1
Pr[in filter j′, element a is identified as λ′-hot∨
set of size < λ′ =k
1 + εapproximated as ≥ λ]
≤T
∏j′=1
(mb n−Fa−cM
λ′−Fa−cMcb
+ δ1
)
=
(mb n−Fa−cM
λ′−Fa−cMcb
+ δ1
)T
=
mb n−Fa−cMλ
1+ε−Fa−cMc
b+ δ1
T
If an element a, which appears in Fa ≥ λ1−ε players’ private input sets, is not identified
as a λ-threshold hot item, it is due to error in the set-counting approximation. When thenumber of hits for every bucket in a filter is counted exactly, there can be no false negatives.Thus, we may bound the probability of a false negative as follows:
Pr [a is not identified as λ-hot]
= Pr[in at least one filter, a set of size ≥ λ
1−ε approximated as < λ]
≤ ∑Tj′=1 Pr
[in filter j′, a set of size ≥ λ
1−ε approximated as < λ]
≤ ∑Tj′=1 δ1
= δ1T
Choice of Constants. Given our analysis, we may outline how to choose the constantsδ1, t, b, T based on the parameters ε, δ−, c, M, m, δd, β.
• δ1. Recall that the probability of a false negative, for an element a which appears in atleast Fa ≥ λ
1−ε players’ private input sets, is required to be at most δ−. We may then
98
Chapter 7. Preserving Privacy using HOTITEM-ID
choose δ1 as follows:
Pr [a is not identified as λ-hot] = δ−
≤ δ1T
δ1 :=δ−T
• b, T. Given this assignment of δ1, we may simplify our bound on the probability of afalse positive on an element a, which appears in βλ < λ
1+ε players’ private input sets,as follows:
Pr [a is identified as λ-hot] ≤
mb M−Fa−cMλ
1+ε− fa−cMc
b+ δ1
T
≤
mb M−βλ−cMλ
1+ε−βλ−cMc
b+
δ−T
T
We choose b, T so as to minimize b× T, while satisfying the above constraint.
• t, α. In the approximate distinct element counting algorithm in [6], t := d 96ε2 e, α :=
O(
lg 2δ−
). In practice, one may safely choose to retain t < d 96
ε2 e smallest values perparallel execution, and run only one parallel execution, while retaining a confidencebound of δ1. We found that t := 25 was sufficient.
Note that, when running very small examples, or with very high accuracy require-ments, one may obtain an assignment for t that is ≥ λ. In this case, simply set t := λ,and note that ε, δ1 = 0; each player is now collecting a sufficient number of signaturesso as to determine, without error, whether any particular bucket was hit by at least λ
distinct players.
7.2.8 Privacy in HOTITEM-ID
Theorem 4. Assume that one-show tags are unlinkable and that the anonymous communicationsystem is secure such that no coalition of adversaries can distinguish which honest player sent anygiven anonymous message with probability more than negligibly different from a random guess. Inthe HOTITEM-ID protocol, for any payload P, no coalition of at most cM malicious players can gainmore than a negligible advantage in determining if P ∈ Si, for any given honest player i (0 ≤ i < M).
99
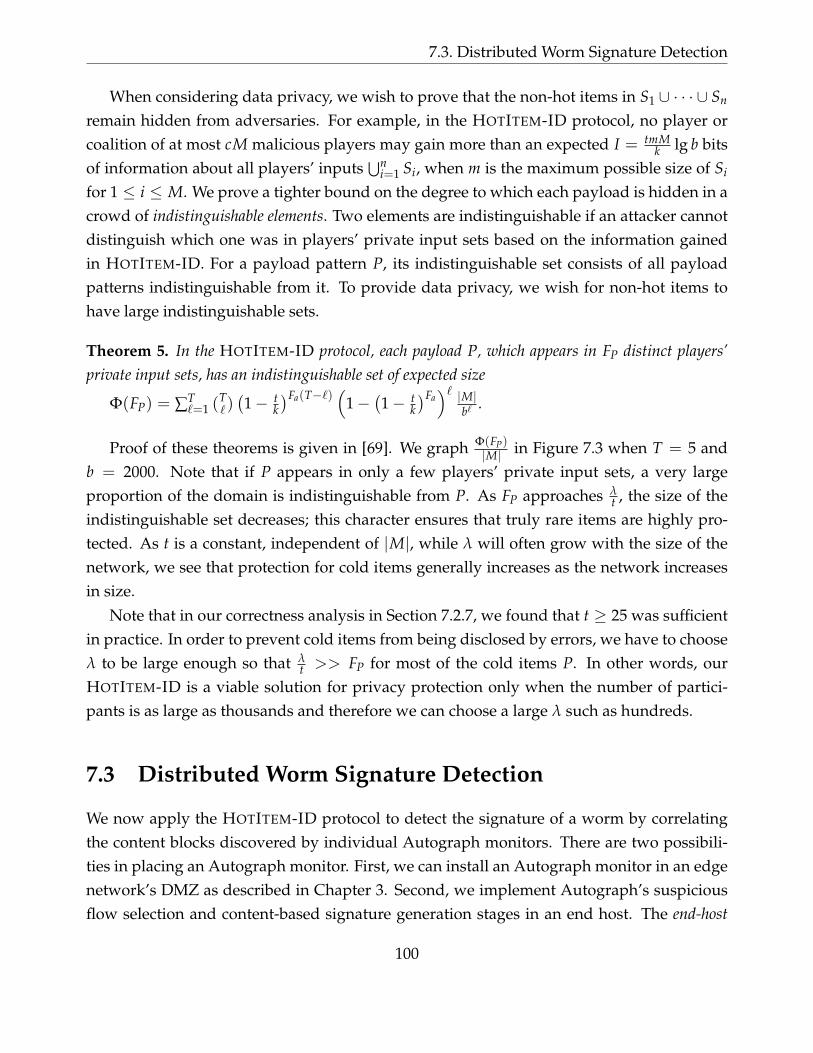
7.3. Distributed Worm Signature Detection
When considering data privacy, we wish to prove that the non-hot items in S1 ∪ · · · ∪ Sn
remain hidden from adversaries. For example, in the HOTITEM-ID protocol, no player orcoalition of at most cM malicious players may gain more than an expected I = tmM
k lg b bitsof information about all players’ inputs
⋃ni=1 Si, when m is the maximum possible size of Si
for 1 ≤ i ≤ M. We prove a tighter bound on the degree to which each payload is hidden in acrowd of indistinguishable elements. Two elements are indistinguishable if an attacker cannotdistinguish which one was in players’ private input sets based on the information gainedin HOTITEM-ID. For a payload pattern P, its indistinguishable set consists of all payloadpatterns indistinguishable from it. To provide data privacy, we wish for non-hot items tohave large indistinguishable sets.
Theorem 5. In the HOTITEM-ID protocol, each payload P, which appears in FP distinct players’private input sets, has an indistinguishable set of expected size
Φ(FP) = ∑T`=1 (T
`)(1− t
k)Fa(T−`)
(1−
(1− t
k)Fa)` |M|
b` .
Proof of these theorems is given in [69]. We graph Φ(FP)|M| in Figure 7.3 when T = 5 and
b = 2000. Note that if P appears in only a few players’ private input sets, a very largeproportion of the domain is indistinguishable from P. As FP approaches λ
t , the size of theindistinguishable set decreases; this character ensures that truly rare items are highly pro-tected. As t is a constant, independent of |M|, while λ will often grow with the size of thenetwork, we see that protection for cold items generally increases as the network increasesin size.
Note that in our correctness analysis in Section 7.2.7, we found that t ≥ 25 was sufficientin practice. In order to prevent cold items from being disclosed by errors, we have to chooseλ to be large enough so that λ
t >> FP for most of the cold items P. In other words, ourHOTITEM-ID is a viable solution for privacy protection only when the number of partici-pants is as large as thousands and therefore we can choose a large λ such as hundreds.
7.3 Distributed Worm Signature Detection
We now apply the HOTITEM-ID protocol to detect the signature of a worm by correlatingthe content blocks discovered by individual Autograph monitors. There are two possibili-ties in placing an Autograph monitor. First, we can install an Autograph monitor in an edgenetwork’s DMZ as described in Chapter 3. Second, we implement Autograph’s suspiciousflow selection and content-based signature generation stages in an end host. The end-host
100

Chapter 7. Preserving Privacy using HOTITEM-ID
0 20 40 60 80 1000
0.2
0.4
0.6
0.8
1
FP
Φ(F
P)
/ Mλ/t = 100λ/t = 30λ/t = 10λ/t = 4
100
101
102
10−20
10−15
10−10
10−5
100
FP
Φ(F
P)
/ M
λ/t = 100λ/t = 30 λ/t = 10λ/t = 4
(a) (b)
Figure 7.3: The degree of data privacy for an element with frequency FP is Φ(FP)|M| . We graph this
function in (a), showing the increase in protection for items that show up in few players’ inputs. Thesame function is graphed in (b) on a logarithmic scale, for increased detail. Note that rare items areindistinguishable from a large proportion of the domain, giving them a large degree of data-privacy.
Autograph is installed in a dedicated network processor [21] or in the kernel of an end host tominimize the risk of fraudulent reports from already-compromised applications. End-hostAutograph, thus, can perform flow reassembly similarly to the applications at the end host.Still, Autograph’s port scanner detection must be done at the boundary of the network andthe gateway of each subnet because port scanner detection needs to monitor each unsuc-cessful connection attempt to a non-existent host or service. This cannot be done at the endhosts. The list of port scanners is distributed to all end-host Autograph systems using thetattler mechanism.
The advantage of placing Autograph in an edge network’s DMZ is that the monitor canpossibly accumulate many suspicious flows and perform local content-prevalence analysisbased on locally found suspicious flows. If a single monitor accumulates enough suspiciousflows, the monitor generates a signature immediately. From a network administrator’s per-spective, this is easier to install and maintain than end-host Autograph.
An advantage of end-host Autograph is that we can perform the flow reassembly at theend host, and thus avoid attacks that exploit ambiguities in traffic stream as seen by theNIDS [106]. Exploitable ambiguities can arise in two different ways in Autograph’s trafficanalysis:
1. Without detailed knowledge of the end-host’s protocol implementation, Autograph inthe DMZ may be unable to determine how the end-host will treat a given sequence ofpackets if different implementations interpret the same stream of packets in different
101

7.3. Distributed Worm Signature Detection
ways. For example, when an end-host receives overlapping IP fragments that differ inthe purported data for the overlapping region, some end-hosts may favor the data firstreceived, others the portion of the overlapping fragment present in the lower fragment,and others the portion in the upper fragment.
2. Without detailed knowledge of the network topology between the DMZ and the end-host, Autograph in the DMZ may be unable to determine whether a given packet willeven be seen by the end-host. For example, a packet seen by Autograph in the DMZarea that has a low Time-To-Live (TTL) field may or may not have sufficient hop countremaining to make it all the way to the end-host. If the Autograph uses such packetsin its analysis, the analysis result may be incorrect.
Another advantage is that we can monitor worm activities inside a network. Many mod-ern worms employ localized scanning to infect hosts in the same subnet quickly, but a moni-toring system at the border of the network cannot detect such internal worm infection activi-ties. With scanner detection at each subnet boundary, end-host Autograph can collect wormflows even when the worm launches attacks from an internal host. Weaver et al. [141] andStaniford [128] also discuss the importance of worm activity monitoring inside enterprisenetworks.
The disadvantage of end-host Autograph is obvious. The probability of receiving mul-tiple attack flows is so low that content analysis and signature generation is difficult. Thus,collaboration among multiple end-host Autograph monitors is necessary in the signaturegeneration process.
In this work, we focus on the end-host Autograph case. Thousands of end-host Au-tograph monitors are connected with a P2P multicast network. They receive port-scannerinformation from monitors installed in their network’s DMZ, boundaries of each subnets,and network telescopes [86]. If a monitor receives a connection attempt from one of theblacklisted port-scanners, the monitor responds with the connection request, collects suspi-cious packets, and performs TCP flow reassembly. The resulting reassembled payloads arepartitioned into content blocks using Autograph’s COPP algorithm. The monitor’s privatedataset consists of those content blocks collected during the last τ minutes. Finally, all mon-itors collaboratively perform signature generation in our LSD and GSD frameworks withtheir private datasets.
102

Chapter 7. Preserving Privacy using HOTITEM-ID
7.3.1 Candidate Signature Advertisement (LSD)
If a content block appears more than θL times and more than one source IP addresses has sentthe content block, the monitor advertises the content block as a candidate signature. Using asecret key ski and a group public key distributed by a trusted group manager, each monitorMi constructs a one-show tag. The detail of one-show tag construction is described in [69].The one-show tag is unlinkable, anonymous, and can be verified by all other monitors whohold the group public key. The same one-show tag cannot be constructed by any monitorother than Mi who holds ski.
The candidate signature with a corresponding one-show tag is sent to ρ randomly chosenmonitors using an anonymous scheme such as AP3 [84] and Crowds [112]. The messagedelivery to a randomly chosen monitor is done as the followings:
1. When a monitor Mi wants to send a message to a randomly selected monitor Mj, Mi
chooses another node (say Mk) randomly, and sends the message to Mk.
2. Upon receiving the message, Mk performs a weighted coin toss to decide whetherto send the message to Mj, or to forward the message to another randomly chosennode. The decision to forward to another random node is made with probability p f
(0.5 ≤ p f < 1), the forwarding probability.
3. After 1(1−p f )
hops on average, the message is delivered to Mj.
The mechanism obscures the originator Mi’s identity from both the intended recipientMj and any malicious nodes hoping to expose the originator’s identity. Thus, the owner pri-vacy is protected. Unlike AP3, we do not need an anonymous bi-directional communicationchannel. Therefore, the implementation is simpler and more light-weight than the originalAP3 scheme.
Once one of the ρ monitors receives the message with a candidate signature, the mes-sage is multicasted to all other monitors. Upon receiving a multicast message, each monitorverifies the validity of the message using the group public key. Each monitor maintains acounter for each valid, advertised candidate signature. If a monitor receives more than λL
advertisements on the same candidate signature, it accepts the candidate signature as a validglobal signature for a currently active worm.
103
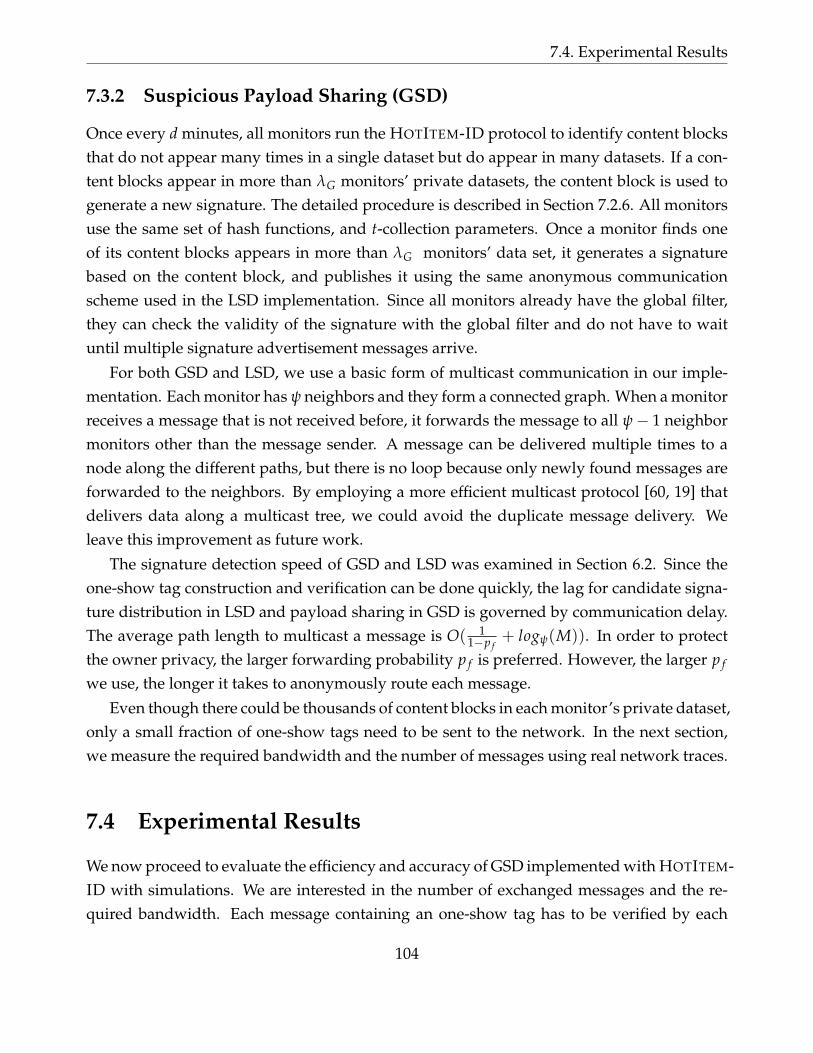
7.4. Experimental Results
7.3.2 Suspicious Payload Sharing (GSD)
Once every d minutes, all monitors run the HOTITEM-ID protocol to identify content blocksthat do not appear many times in a single dataset but do appear in many datasets. If a con-tent blocks appear in more than λG monitors’ private datasets, the content block is used togenerate a new signature. The detailed procedure is described in Section 7.2.6. All monitorsuse the same set of hash functions, and t-collection parameters. Once a monitor finds oneof its content blocks appears in more than λG monitors’ data set, it generates a signaturebased on the content block, and publishes it using the same anonymous communicationscheme used in the LSD implementation. Since all monitors already have the global filter,they can check the validity of the signature with the global filter and do not have to waituntil multiple signature advertisement messages arrive.
For both GSD and LSD, we use a basic form of multicast communication in our imple-mentation. Each monitor has ψ neighbors and they form a connected graph. When a monitorreceives a message that is not received before, it forwards the message to all ψ− 1 neighbormonitors other than the message sender. A message can be delivered multiple times to anode along the different paths, but there is no loop because only newly found messages areforwarded to the neighbors. By employing a more efficient multicast protocol [60, 19] thatdelivers data along a multicast tree, we could avoid the duplicate message delivery. Weleave this improvement as future work.
The signature detection speed of GSD and LSD was examined in Section 6.2. Since theone-show tag construction and verification can be done quickly, the lag for candidate signa-ture distribution in LSD and payload sharing in GSD is governed by communication delay.The average path length to multicast a message is O( 1
1−p f+ logψ(M)). In order to protect
the owner privacy, the larger forwarding probability p f is preferred. However, the larger p f
we use, the longer it takes to anonymously route each message.
Even though there could be thousands of content blocks in each monitor’s private dataset,only a small fraction of one-show tags need to be sent to the network. In the next section,we measure the required bandwidth and the number of messages using real network traces.
7.4 Experimental Results
We now proceed to evaluate the efficiency and accuracy of GSD implemented with HOTITEM-ID with simulations. We are interested in the number of exchanged messages and the re-quired bandwidth. Each message containing an one-show tag has to be verified by each
104

Chapter 7. Preserving Privacy using HOTITEM-ID
monitor. Even though the time to verify one message is small in our implementation, thetotal processing time would be prohibitively large if many messages need to be verified.The message size in HOTITEM-ID is large; each one-show tag requires 1, 368 bits (171 Bytes).Thus, the bandwidth consumed by HOTITEM-ID is another concern in building a scalablesystem. Our experimental results support the efficiency and accuracy of HOTITEM-ID .
7.4.1 Simulation Method
We measure the required bandwidth, the number of messages, and the false positive/negativerates by simulating signature generation during simulated worm propagation. We compareour protocol to a non-private naıve protocol, in which all content blocks are forwarded to allparticipating 1024 monitors. To save bandwidth and give a trivial measure of privacy againstcasual attacks [78], the naıve protocol hashes each content block with SHA-1 and exchangesonly the hash values. When a monitor receives more than λG messages for a hash value, themonitor knows that the corresponding content block is λG -hot. The naıve protocol uses thesame network topology and the same communication model as our HOTITEM-ID protocol.
In our experiments, we assume that 1024 end-host Autograph monitors inside a B-classnetwork collaboratively generate a signature by performing GSD with HOTITEM-ID . Themonitors receive port-scanner lists from monitors installed at the border of the network andeach subnet. The monitor at the gateway monitors ICMP host/port unreachable messagesand unanswered inbound SYN packets. If an external host has made unsuccessful connec-tion attempts to more than 2 internal IP addresses, the monitor advertises the IP address toall 1024 end-host Autograph monitors. Once a flow is identified as a suspicious flow by anend-host Autograph monitor, the flow is held in the monitor’s suspicious flow pool for τ = 1hour. Each end-host Autograph monitor constructs its private dataset by performing COPP.We use 64 bytes as the average content block size parameter.
Traces. In order to represent content blocks from misclassified, innocuous flows, we usenetwork traces captured at the gateway of a campus network in Feb 18, 2005. The networkhas a class-B IP address space. The gateway has three 1 Gbps interfaces and incoming trafficis evenly distributed to the interface using per-flow load balancing. Our traces are collectedby tapping one of the links. We split the traces based on the destination IP addresses andfeed end-host Autograph with the splitted traces and collect content blocks generated foran hour. Most content blocks are from port 80 (HTTP) and port 25 (SMTP) traffic. Here, wepresent our experimental results with traffic of only those ports. Table 7.1 summarizes thetraces used in our experiments. Misclassified SMTP flows tend to generate many content
105
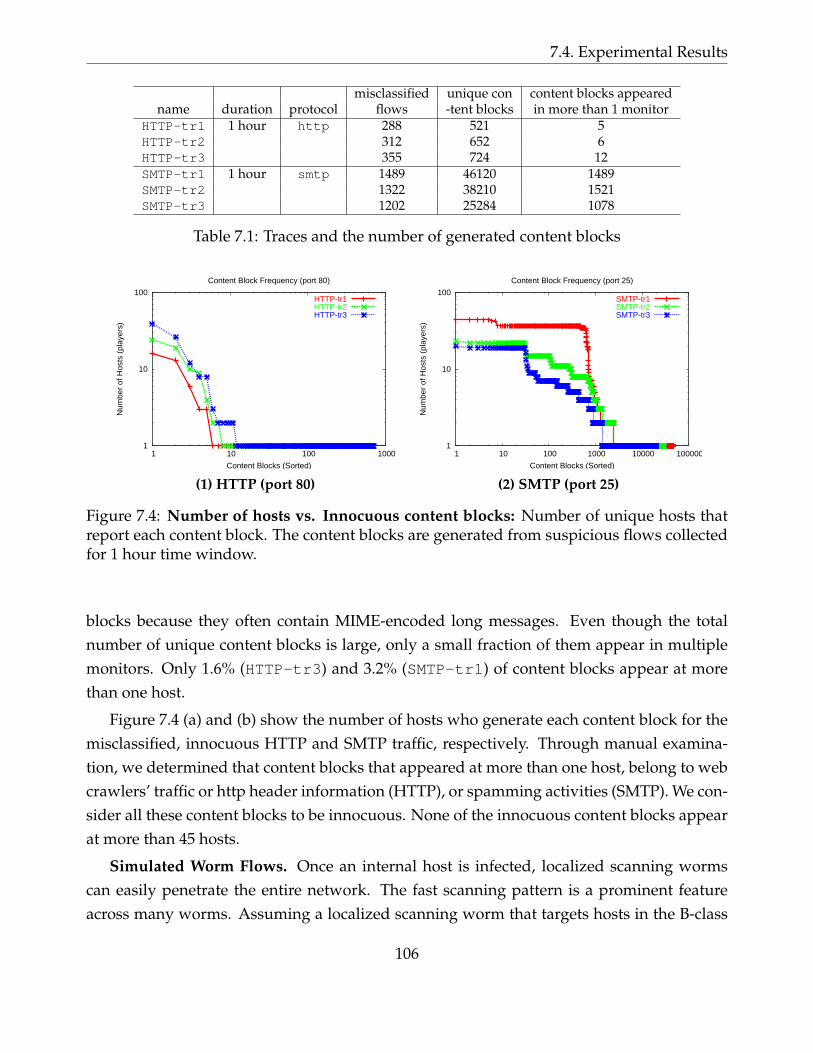
7.4. Experimental Results
misclassified unique con content blocks appearedname duration protocol flows -tent blocks in more than 1 monitor
HTTP-tr1 1 hour http 288 521 5HTTP-tr2 312 652 6HTTP-tr3 355 724 12SMTP-tr1 1 hour smtp 1489 46120 1489SMTP-tr2 1322 38210 1521SMTP-tr3 1202 25284 1078
Table 7.1: Traces and the number of generated content blocks
1
10
100
1 10 100 1000
Num
ber
of H
osts
(pl
ayer
s)
Content Blocks (Sorted)
Content Block Frequency (port 80)
HTTP-tr1HTTP-tr2HTTP-tr3
1
10
100
1 10 100 1000 10000 100000
Num
ber
of H
osts
(pl
ayer
s)
Content Blocks (Sorted)
Content Block Frequency (port 25)
SMTP-tr1SMTP-tr2SMTP-tr3
(1) HTTP (port 80) (2) SMTP (port 25)
Figure 7.4: Number of hosts vs. Innocuous content blocks: Number of unique hosts thatreport each content block. The content blocks are generated from suspicious flows collectedfor 1 hour time window.
blocks because they often contain MIME-encoded long messages. Even though the totalnumber of unique content blocks is large, only a small fraction of them appear in multiplemonitors. Only 1.6% (HTTP-tr3) and 3.2% (SMTP-tr1) of content blocks appear at morethan one host.
Figure 7.4 (a) and (b) show the number of hosts who generate each content block for themisclassified, innocuous HTTP and SMTP traffic, respectively. Through manual examina-tion, we determined that content blocks that appeared at more than one host, belong to webcrawlers’ traffic or http header information (HTTP), or spamming activities (SMTP). We con-sider all these content blocks to be innocuous. None of the innocuous content blocks appearat more than 45 hosts.
Simulated Worm Flows. Once an internal host is infected, localized scanning wormscan easily penetrate the entire network. The fast scanning pattern is a prominent featureacross many worms. Assuming a localized scanning worm that targets hosts in the B-class
106
Chapter 7. Preserving Privacy using HOTITEM-ID
IP address space, we inject simulated worm traffic into the suspicious flow pools of 200 end-host Autograph monitors. Those 200 monitors receive exactly one worm flow each, andgenerate 10 content blocks from the worm flow. All 10 content blocks are invariant acrossworm flows, and ideally, our system must find all those content blocks as hot content blocks.
Metrics. We evaluate the performance of our HOTITEM-ID -based GSD in terms of thenumber of received messages per monitor, and required bandwidth per monitor, whilevarying the t-collection parameters, t ∈ [3, 5, 10] (the number of tags to collect) and γ ∈[0, 0.2, 0.5] (the gap factor), and the average number of neighbors ψ ∈ [5, 10]. We count thenumber of received messages at each monitor and report the average. Since all messages aredelivered to every monitor, the variance in the number of messages is small. We measurethe false positives as the number of innocuous content blocks identified as to be hot. Thefalse negative rate is the fraction of worm content blocks that were not identified as to behot.
The number of filters T and the size of each filter b must be chosen based on the estimatedtotal number of content blocks in the system, which is measured by analyzing normal traffic.Too small b and T cause many hash collisions in approximate heavy-hitter detection, andthus incur many false positives. In our experiment, we utilized the parameters b := 606, T :=5 for HTTP traces, and b := 4545, T := 5 for SMTP traces according to the guidelines in [69].With the parameters, the false positive rate δ+ is lower than 0.01 if a content block appears inless than 50 monitors’ private datasets in the presence of 1% · 1024 malicious monitors. Thefalse negative rate δ− is lower than 0.01 if a content block appears in more than λG monitors’private datasets.
7.4.2 Bandwidth Consumption and Accuracy
We ran the HOTITEM-ID protocol to find content blocks that appear in at least 100 monitors’private dataset (λG = 100).
False positives. In our experiments, there was no false positives except for SMTP-tr1with the t-collection parameters, t ≤ 3 (the number of tags to be collected) and γ ≥ 0.5 (thegap factor). We observed two innocuous content blocks mistakenly categorized as λG-hotin the experiment using SMTP-tr1 with t ≤ 3 and γ ≥ 0.5. The false positives are due tocontent blocks generated from a spam e-mail. The e-mail was sent to 44 different hosts. Theγ parameter must be chosen based on the difference between the frequency of innocuouscontent blocks and the expected frequency of worm content blocks. In the SMTP-tr1 trace,hundreds of innocuous content blocks were observed by more than 30 monitors, and ten
107
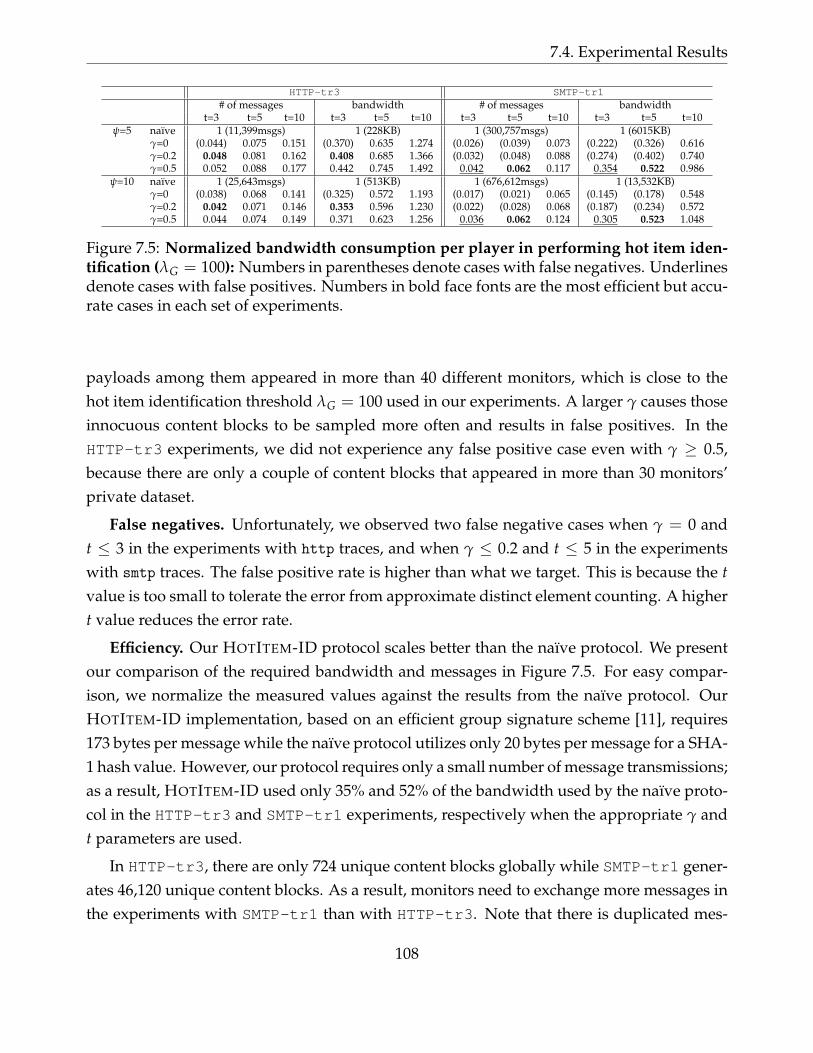
7.4. Experimental Results
HTTP-tr3 SMTP-tr1# of messages bandwidth # of messages bandwidth
t=3 t=5 t=10 t=3 t=5 t=10 t=3 t=5 t=10 t=3 t=5 t=10ψ=5 naıve 1 (11,399msgs) 1 (228KB) 1 (300,757msgs) 1 (6015KB)
γ=0 (0.044) 0.075 0.151 (0.370) 0.635 1.274 (0.026) (0.039) 0.073 (0.222) (0.326) 0.616γ=0.2 0.048 0.081 0.162 0.408 0.685 1.366 (0.032) (0.048) 0.088 (0.274) (0.402) 0.740γ=0.5 0.052 0.088 0.177 0.442 0.745 1.492 0.042 0.062 0.117 0.354 0.522 0.986
ψ=10 naıve 1 (25,643msgs) 1 (513KB) 1 (676,612msgs) 1 (13,532KB)γ=0 (0.038) 0.068 0.141 (0.325) 0.572 1.193 (0.017) (0.021) 0.065 (0.145) (0.178) 0.548γ=0.2 0.042 0.071 0.146 0.353 0.596 1.230 (0.022) (0.028) 0.068 (0.187) (0.234) 0.572γ=0.5 0.044 0.074 0.149 0.371 0.623 1.256 0.036 0.062 0.124 0.305 0.523 1.048
Figure 7.5: Normalized bandwidth consumption per player in performing hot item iden-tification (λG = 100): Numbers in parentheses denote cases with false negatives. Underlinesdenote cases with false positives. Numbers in bold face fonts are the most efficient but accu-rate cases in each set of experiments.
payloads among them appeared in more than 40 different monitors, which is close to thehot item identification threshold λG = 100 used in our experiments. A larger γ causes thoseinnocuous content blocks to be sampled more often and results in false positives. In theHTTP-tr3 experiments, we did not experience any false positive case even with γ ≥ 0.5,because there are only a couple of content blocks that appeared in more than 30 monitors’private dataset.
False negatives. Unfortunately, we observed two false negative cases when γ = 0 andt ≤ 3 in the experiments with http traces, and when γ ≤ 0.2 and t ≤ 5 in the experimentswith smtp traces. The false positive rate is higher than what we target. This is because the tvalue is too small to tolerate the error from approximate distinct element counting. A highert value reduces the error rate.
Efficiency. Our HOTITEM-ID protocol scales better than the naıve protocol. We presentour comparison of the required bandwidth and messages in Figure 7.5. For easy compar-ison, we normalize the measured values against the results from the naıve protocol. OurHOTITEM-ID implementation, based on an efficient group signature scheme [11], requires173 bytes per message while the naıve protocol utilizes only 20 bytes per message for a SHA-1 hash value. However, our protocol requires only a small number of message transmissions;as a result, HOTITEM-ID used only 35% and 52% of the bandwidth used by the naıve proto-col in the HTTP-tr3 and SMTP-tr1 experiments, respectively when the appropriate γ andt parameters are used.
In HTTP-tr3, there are only 724 unique content blocks globally while SMTP-tr1 gener-ates 46,120 unique content blocks. As a result, monitors need to exchange more messages inthe experiments with SMTP-tr1 than with HTTP-tr3. Note that there is duplicated mes-
108
Chapter 7. Preserving Privacy using HOTITEM-ID
sage delivery because we use a basic form of multicast that floods each message to all ψ
neighbors. Thus, the number of messages each node receives is larger than the actual num-ber of unique messages. A larger ψ supports fast message broadcast to all monitors, butresults in more duplicated messages in the basic multicast.
As expected, the number of messages increases as γ and t increase. However, there isa trade-off between efficiency and correctness. Numbers in parentheses in Figure 7.5 de-note cases with false negatives. Numbers with underlines denote cases with false positives.Smaller γ and t values reduce the communication cost but may result in false negatives.Our experiments show that to ensure correctness while retaining efficiency, we may setγ = 0.2, t = 3 (HTTP) and γ = 0.5, t = 5 (SMTP) for the traffic pattern in our traces.The numbers in the bold face font in Figure 7.5 represent the most efficient cases. Withoutanalyzing more traffic traces from other time periods and other sites, we are unable to claimthat the set of parameters is valid for traffic patterns of other protocols.
Our HOTITEM-ID protocol scales better than the naıve protocol; as problems increase insize, our protocol becomes more attractive. For example, when 10240 monitors participate inworm signature generation and we need only 10% of them to catch worm traffic (λ = 1000),our HOTITEM-ID protocol uses less than 6% of the bandwidth used by naıve protocol.
7.5 Summary
In this chapter, we use an efficient, secure, and robust privacy-preserving distributed hotitem identification protocol (HOTITEM-ID ) for suspicious payload identification across thou-sands of monitors. The HOTITEM-ID protocol protects owner- and data-privacy by utilizingan approximate heavy-hitter identification scheme, one-show tags, an approximate distinctitem counting scheme, and anonymous routing techniques. The protocol provides proba-bilistic privacy to support computation across thousands of distributed nodes. However,the probabilistic privacy is sufficient for our suspicious payload pattern identification prob-lem. We implemented the protocol and simulated distributed suspicious payload patternidentification process by injecting worm traffic to a real network trace. Our experimentalresults support that we can efficiently perform the distributed signature generation with theHOTITEM-ID protocol while preserving the privacy in the presence of thousands monitorsparticipating.
109

7.5. Summary
110
Chapter 8
Preserving Privacy usingPrivacy-Preserving Multiset Operations
The privacy-preserving payload sharing technique presented in the previous chapter, en-ables an efficient, secure, and robust privacy-preserving payload sharing. However, thetechnique uses probablistic approaches so the correctness and the privacy protection de-pends on a large number of participating monitors. Thus we expect that the techniqueproposed in the previous chapter is viable only when thousands of monitors participatein payload sharing (See Section 7.2.8). If the number of monitors is small, we cannot choosethe threshold large enough to protect the data privacy of ’cold’ content blocks while distin-guish ’hot’ and ’cold’ content blocks accurately. The system is not able to provide sufficientaccuracy or privacy protection for our new scenario.
This chapter introduces a privacy-preserving distributed signature generation systemthat works well with about a hundred of monitors. The system is based on the privacy-preserving multiset operation framework of Kissner and Song [70]. A semantically secure,threshold homomorphic cryptosystem allows collaboration without a trusted third-party,while preventing disclosure of rare, non-worm payload patterns. Unfortunately, the strongprivacy guarantee comes at the cost of expensive cryptographic operations and multiplemessage exchanges among participating monitors. We analyze the complexity of the ba-sic protocol that directly applies the privacy-preserving multiset operation framework, andthen propose extended privacy-preserving signature generation protocols that use approx-imate counting techniques to improve performance. The results of the experiment with aprototype implementation of the extended protocols show that the system that connects 128monitors can determine mutually observed payload patterns within 5 minutes even with
111
8.1. Problem Definition
the currently available computer hardware. Those payload patterns are used for payloadpattern based signature generation.
We formalize our signature detection problem in the next section. In Section 8.2, wesummarize the threshold homomorphic cryptosystem and the privacy-preserving multisetoperation framework that are basis of our implementation. In Section 8.3, we describe ouralgorithms used in our system, including the THRESHOLD-SET-UNION-HBC protocol devel-oped by Kissner and Song [70]. We present the implementation of our system in Section 8.4,and examine its performance and scalability in Section 8.5.
8.1 Problem Definition
In this chapter we design a distributed payload sharing system of M monitors following theGSD framework defined in Chapter 6. Each monitor shares a content block P with othermonitors only when its prevalence measure f (P) exceeds θG. Only the content blocks thatare shared by more than λG monitors are used as signatures.
In the system, there are at most c honest-but-curious monitors. Honest-but-curious mon-itors act according to their prescribed action in the protocols. However, they may attempt togain more information other than what can be deduced from the result of the protocol.
The system protects the privacy of exchanged data and its owner monitor against thosec honest-but-curious monitors. No monitor or coalition of c honest-but-curious monitorsgains more information about other monitors’ private datasets, other than 1) the set of λG-hot content blocks, and 2) the number of content blocks reported by each monitor.
The original protocol proposed by Kissner and Song [70] prevents honest-but-curiousadversaries even from inferring the number of items (content blocks) in the data set of eachplayer (monitor). The protocol protects the information by enforcing all players to reportthe same number of items. To avoid the case that a player has more than the predefinednumber of items, the protocol assumes a large value for the private dataset size. In practice,however, the performance of the protocol is greatly affected by the total number of contentblocks reported by monitors. Our system aims to find signatures of worms that propagatequickly. Thus, performance is as important as privacy protection. With the relaxed notion ofprivacy, we achieve the performance required for effective worm signature detection.
Kissner and Song [70] provide another protocol that protects privacy and correctnesswhen malicious adversaries are present. Malicious adversaries may behave arbitrarily, incontrast to hones-but-curious adversaries. The protocol provides such strong privacy by us-ing commitments on datasets before proceeding with the main protocol, and by attaching
112
Chapter 8. Preserving Privacy using Privacy-Preserving Multiset Operations
a zero-knowledge proof to every exchanged message. That requires additional communi-cation and computation. Unfortunately, this protocol is too expensive to be used for ourpurposes.
8.2 Preliminaries
The privacy-preserving set operation framework proposed by Kissner and Song [70] usesa semantically secure, additively homomorphic public-key cryptosystem. We describe thethreshold homomorphic cryptosystem and then briefly introduce the privacy-preserving setoperation framework in this section.
8.2.1 Threshold Homomorphic Cryptosystem
Let Epk(·) denote the encryption function with public key pk . The cryptosystem supportsthe following operations without knowledge of the private key sk:
1. Epk(m1 + m2) = Epk(m1) +h Epk(m2).
2. Epk(c×m1) = c ∗h Epk(m1).
The +h and ∗h represent the homomorphic addition and the homomorphic multiplica-tion operations, respectively. When such operations are performed, the resulting ciphertextsshould be re-randomized for security. In re-randomization, a ciphertext is transformed so asto form an encryption of the same plaintext, under a different random string than the oneoriginally used.
The privacy-preserving multiset operation framework also requires that the private keyin the cryptosystem is shared by more than (c + 1) nodes so that any coalition of at most cnodes cannot decrypt messages exchanged during the protocol execution. We employ thethreshold Paillier cryptosystem [50, 51] that extends the homomorphic Paillier cryptosys-tem [100].
In the (c + 1, M)-threshold Paillier cryptosystem, where M is the number of participatingmonitors in the system, and c is the maximum number of malicious monitors the system cantolerate, messages are encrypted using a public key pk, and the corresponding private keysk is shared by a group of M participants. At least c + 1 of these participants can efficientlydecrypt encrypted messages, while no coalition of less than c + 1 participants can learnuseful information from encrypted messages.
113
8.2. Preliminaries
Let ∆ = M!. The key generation, encryption, and decryption processes of the (c + 1, M)-threshold Paillier cryptosystem are performed as the follows:
• Key Generation: choose two safe primes 1 p = 2p′ + 1 and q = 2q′ + 1 where p′ andq′ are also large random prime. Set m = p′q′ and n = pq. Let g be a generator andβ ∈ Z∗n is a random element. The public key is pk = (n, g). The secret key sk = β×mis shared using the Shamir scheme [116] modulo mn.
• Encryption: For a message P, Epk(P) = gPxn mod n2.
• Re-randomization: To re-randomize a cipher text C, multiply it by a random encryp-tion of 0, i.e., compute Crn mod n2 for r ∈ Z∗n.
• Partial Decryption: For a cipher text C, the i-th share is computed by Ci = Decski(C) =C2∆ski mod n2.
• Recovery: Give a set of c + 1 valid shares, compute the plain text using the Lagrangeinterpolation on the exponents.
Note that, in the original scheme [50], ∆ was defined to be M! assuming (c + 1, M)-threshold decryption so that no modular root extraction is required in the Recovery operation.In order to avoid the prohibitively large computation overhead when many monitors are inthe system, we group all monitors into c + 1 groups, and all monitors in the same grouphold the same share of a secret key, ski, i.e., node j holds skj mod c+1. In this way, we canlimit ∆ to be (c + 1)! (c M) while still avoiding modular root extraction. Because thereare at most c malicious nodes, malicious nodes cannot acquire all c + 1 secret keys.
8.2.2 Privacy-Preserving Set Operations
Kissner and Song [70] showed that various privacy-preserving operations on multisets canbe performed using polynomial representations and employing the mathematical propertiesof polynomials.
Let Zn be a sufficiently large plaintext domain and h(·) denote a cryptographic hash func-tion that maps an element a into a domain Z ⊂ Zn. When a 6= a′, there is only a negligibleprobability that h(a) = h(a′). Given a multiset A = aj1≤j≤k, A can be represented witha polynomial f ∈ Zn[x] whose roots are collision-resistant hash values of elements in themultiset A [52, 70]:
1A safe prime is a prime number of the form 2p + 1, where p is also a prime. For example, 5, 7, and 11 aresafe primes.
114
Chapter 8. Preserving Privacy using Privacy-Preserving Multiset Operations
f (x) = ∏a∈A(x− h(a))
The polynomial representation of a multiset enables various operations on multisetswhere an element a can appear multiple times in a set and f reqA(a) denotes the multiplicityof a in the multiset A. We present an important lemma that is the basis of the THRESHOLD-SET-UNION-HBC protocol design. The proof is provided in [70].
Lemma 1. When f and g represent sets A and B, respectively, f (d) denotes d-th derivative of thepolynomial f , and, r ∈ Zn[x] and s ∈ Zn[x] are randomly chosen polynomials:
a ∈ A ⇔ (x− h(a)) | f
a ∈ A ∪ B ⇔ (x− h(a)) | f × g
a ∈ A ∩ B ⇔ (x− h(a)) | f × r + g× s
f reqA(a) > d ⇔ (x− h(a)) | f × r + ( f (1) + · · ·+ f (d))× s
f reqA(a) ≤ d ⇔ (x− a) - f × r + ( f (1) + · · ·+ f (d))× s
The lemma shows that we can perform the basic operations such as membership test,union, and intersection on the multisets represented by the polynomials. Moreover, thepolynomial representation allows to test whether the multiplicity of an element in the rep-resented multiset is larger than a certain number or not.
The encryption of polynomial f is computed by encrypting all the coefficients of f .
Epk( f ) is Epk( f [0]) ∗h xi +h · · ·+h Epk( f [deg( f )]) ∗h x0
where f [i] denotes the i-th coefficient of f .The framework supports the following operations on the encrypted polynomials f1 and
f2 without knowing the secret key, thank to the homomorphic property of Paillier’s cryp-tosystem. We use deg( f1) and deg( f2) to denote the degrees of f1 and f2, respectively.
• Sum of encrypted polynomials: given the encryptions of the polynomial f1 and f2, wecan efficiently compute the encryption of the polynomial g = f1 + f2, by calculatingEpk(g[i]) = Epk( f1[i]) +h Epk( f2[i]), (0 ≤ i ≤ max[deg( f1), deg( f2)]).
• Product of an unencrypted polynomial and an encrypted polynomial: given a poly-nomial f2 and the encryption of polynomial f1, we can efficiently compute the en-cryption of polynomial g = f1 × f2, by calculating the encryption of each coefficientEpk(g[i]) = ( f2[0] ∗h Epk( f1[i]))+h ( f2[1] ∗h Epk(() f1[i− 1]))+h · · ·+h ( f2[i] ∗h Epk( f1[0])),(0 ≤ i ≤ deg( f1) + deg( f2)).
115

8.3. Protocols
• Derivative of an encrypted polynomial: given the encryption of polynomial f1, wecan efficiently compute the encryption of polynomial g = d
dx f1, by calculating theencryption of each coefficient Epk(g[i]) = (i + 1) ∗h Epk( f1[i + 1]), (0 ≤ i ≤ deg( f1)− 1).
• Evaluation of an encrypted polynomial at an unencrypted point: given the encryp-tion of polynomial f1, we can efficiently compute the encryption of y = f1(x), by calcu-lating Epk(y) = (x0 ∗h Epk( f1[0]))+h (x1 ∗h Epk( f1[1]))+h · · ·+h (xdeg( f1) ∗h Epk( f1[deg( f1)])).
Utilizing the above operations on encrypted polynomials, we can securely compute re-sults according to the multiset operations described in Lemma 1 without the trusted thirdparty.
8.3 Protocols
We now describe protocols used for identifying content blocks that are reported by morethan λG distributed monitors. We first present the basic protocol, an adoption of THRESHOLD-SET-UNION-HBC protocol proposed by Kissner and Song [70]. Then, we extend the protocolfurther to deal with high computational overhead when the total number of reported con-tent blocks is large (Section 8.3.2). We use an approximate counting scheme to reduce theoverhead of the THRESHOLD-SET-UNION-HBC protocol further (Section 8.3.3).
8.3.1 Basic Protocol
Figure 8.1 describes the modified THRESHOLD-SET-UNION-HBC protocol. When a mon-itor publishes a content block P, we use anonymous routing [24, 22, 111, 112, 84] to hidethe origin of the content block. Assuming that the additively homomorphic threshold cryp-tosystem is semantically secure and re-randomization technique is used in the collectionphase, with overwhelming probability, any coalition of at most c probablistic polynomialtime-bounded (PPT) honest-but-curious adversaries cannot recover items that appear lessthan λG times. The detailed analysis of the privacy and the overhead of this protocol isprovided by Kissner and Song [70].
8.3.2 Extended Protocol for Reducing Computational Cost
The most expensive, but most frequently performed operation in the basic protocol is themultiplication of an encrypted polynomial and a plain polynomial. (See the Collection and
116
Chapter 8. Preserving Privacy using Privacy-Preserving Multiset Operations
the Collaborative Reduction Phases in Figure 8.1.) For two polynomials of degree d1 andd2, the multiplication operation results in O(d1 · d2) homomorphic multiplication, which isakin to modular exponentiation of big numbers. The degree of the final polynomial fromthe collection phase is linear to the total number of content blocks reported by all monitors.Then, we perform homomorphic multiplication operations multiple times on the polyno-mial. Thus, the computational cost of the protocol increases quadratically to the total num-ber of content blocks.
We reduce the overhead by using multiple low-degree polynomials rather than using ahigh-degree polynomial. All monitors agree on some hash function h′ that maps payloadpattern strings into B bins; generate a polynomial for each bin. Then, they run the basicprotocol with only the polynomial from the first bin, and repeat the procedure for each bin.After B runs of the basic protocol, the computation completes. Because every node uses thesame hash function, the correctness of the basic protocol still holds.
Assuming h′ uniformly distributes content blocks into B bins, this technique reduces thecomputational overhead by a factor of B. We can achieve better performance by executingthe B runs concurrently and utilizing the computational power of monitors that are idle.Only c + 1 nodes participate in the collaborative reduction phase and the first step of de-cryption phase. All other monitors are idle.
However, using a large B is undesirable. The use of B reduces the size of the originaldomain by a factor of B and gives adversaries more information about the values of contentblocks. For example, when the degree of a polynomial for the jth bin has increased by twoafter a monitor Mi multiplies its polynomial during the collection phase, an adversary caninfer that Mi has two content blocks that fall into jth bin.
Each node may add padding to hide the (non)existence of items whose hash values fallinto the bin. But this increases the degree of the polynomials, and cancels out the perfor-mance gain from our extended protocol. Thus, in our work, we avoid item padding, assum-ing that the privacy protection with the B-times smaller domain is still acceptable.
Choice of the hash function h′ is important for the effectiveness of this extended protocol.If the hash function fails to evenly distribute the content blocks, the performance benefitfrom the protocol is small. Much effort has been made to develop collision-resistant hashfunctions by using randomization [14, 12]. However, they are not directly applicable toour problem because, in our problem setting, all monitors must agree on the same hashfunction. The same content blocks must be hashed to the same value in order to accuratelycheck if the number of a content block exceeds the threshold λG . We expect that similarproblems would arise in many distributed systems. Developing hash functions suitable for
117
8.4. Implementation
this situation would be an interesting problem to be researched.
8.3.3 Approximate Payload Pattern Counting
When the frequency of a worm payload pattern across monitors is much larger than that ofnon-worm content blocks, we can take an approximate counting approach. Basically, eachmonitor selects a content block in its private set Si with a probability ρ and computes itspolynomial based on only those selected content blocks. This reduces the degree of the finalpolynomial by a factor of ρ−1 and the number of computations by a factor of ρ−2. The newfrequency threshold then becomes λG
′ = λG · ρ. The protocol computes the content blocksthat appear in more than λG
′ monitors sets. When the actual frequency F(P) of a content
block P is y, the probability of identifying P is 1−∑λ′Gx=0 (y
x)ρx(1− ρy−x).
8.4 Implementation
We now describe our prototype of the distributed signature generation system, which usesthe privacy-preserving THRESHOLD-SET-UNION-HBC protocol described in the previoussection. All monitors are connected with an overlay network that supports efficient multi-cast [26, 18]. With the multicast facility, a message can be delivered to all M monitors afterlog M hops in the overlay network. Autograph is extended to have a TSU (Threshold-Set-Union) module attached to the signature generation step.
Autograph: Autograph is responsible for selecting suspicious flows from monitored traf-fic, and performing the content-prevalence analysis to choose suspicious content blocks,whose prevalence measure f (P) exceeds a local threshold θG . Those content blocks arepassed to the TSU module. In this work, we use θG = 2 for a monitor in the network of a213 IP address space.
TSU module: This module takes the content blocks discovered by Autograph, and par-ticipates in the distributed THRESHOLD-SET-UNION-HBC protocol. The TSU module main-tains the private key sk and a public key pk, distributed by a trusted group manager. Weuse the threshold Paillier cryptosystem [50] and the THRESHOLD-SET-UNION-HBC protocolatop the cryptographic primitives included in the SFS toolkit [81].
For each measurement interval, TSU assigns each content block to one of B bins by ap-plying a hash function agreed on with the other monitors, samples payload pattern stringswith a probability ρ, and generates B polynomials each of which represents the payload
118
Chapter 8. Preserving Privacy using Privacy-Preserving Multiset Operations
pattern strings in each bin. A TSU module participates in B THRESHOLD-SET-UNION-HBCinstances concurrently.
Forcing all monitors to participate in the collection phase, computing the product of allthe polynomials along the ring of monitors, is not efficient. In practice, many monitorsmay not have content blocks to report. Their participation in the protocol does not affectthe final results but adds more overhead. In our implementation, a monitor Mi sends ashort PING message to the next monitor Mi+1 before sending the product of polynomials.If monitor Mi+1 has content blocks to share, it replies back with a PONG YES message, andthe monitor Mi sends the product of polynomials. If monitor Mi+1 responses with a PONGNO message, Mi contacts the next monitor Mi+2, and so on. This process continues untilthe monitor Mi finds a monitor with content blocks or contacts the monitor that initiated thecollection phase.
8.5 Experimental Results
We deployed a network of TSU modules over the Emulab [142] and measured the wall-clock time between receiving content blocks from Autograph and completing a round ofTHRESHOLD-SET-UNION-HBC computation. This time To is the ’lag’ due to distributedmonitoring, mentioned in Chapter 6. If the lag is too large, the system is not useful forworm signature detection. In the evaluation of worm signature detection time in Chapter 6,we assumed To ≤ 5 minutes. In this section, we examine if we can complete the computationwithin a reasonable time such as To ≤ 5 minutes.
TSU makes a heavy use of the threshold-homomorphic-cryptosytem operations. Ta-ble 8.1 shows the speed of threshold Paillier operations given as the mean over 100 runsacross different keys. We vary the threshold c of the cryptosystem. We measured the speedof operations both on computers running in 64-bit mode and 32-bit mode. The computerrunning in 64-bit mode has a 3.6GHz Xeon processor. All other benchmarks and experimentspresented in this section are performed on 3GHz Intel Pentium 4 processor-based comput-ers running in 32-bit mode. The homomorphic multiplication is expensive. The decryptionoperation includes the partial decryption and the recovery operations, so the speed of thedecryption operation is linear to the threshold c. Because the decryption operation is themost expensive operation, the extended protocol for reducing network delay (Appendix A),that requires decryption of polynomials several times in the middle of the protocol execu-tion, is not suitable for our problem setting. The use of 64-bit mode processors improves theoperation speed significantly. Considering the speed difference of each operation, we ex-
119

8.5. Experimental Results
3.6GHz Xeon in 64-bit modec=1 c=3 c=7 c=15 c=31 c=64
+h 0.014 0.015 0.014 0.015 0.015 0.015∗h 6.2 7.2 6.5 6.2 5.8 5.1
Epk(.) 19.9 20.4 20.1 21.2 22.1 24.3Dsk(.) 15.5 33.1 65.3 148.0 352.6 977.5
3.0GHz Pentium 4 in 32-bit modec=1 c=3 c=7 c=15 c=31 c=64
+h 0.038 0.036 0.038 0.038 0.038 0.038∗h 15.7 16.6 14.8 17.9 17.4 17.5
Epk(.) 55.9 55.4 56.5 60.1 62.4 69.3Dsk(.) 46.2 90.4 192.3 416.3 993.2 2754.6
Table 8.1: Speed (ms) of operations of 1024-bit threshold Paillier cryptosystem
pect that the use of 64-bit mode processors would reduce the To measured in the remainingexperiments by a factor of 4− 9.
We performed experiments on Emulab varying the number of monitors M, the numberof maximum attackers c, and the average number of payload pattern strings per monitorE [|Si|]. We use 1024 bit public keys. The average link latency between monitors is 49 msecthroughout the experiments.
Figure 8.2 (a) shows the protocol running time in seconds varying the number of mon-itors. We also vary the average number of content blocks reported by each monitor, E[Si].It turns out the running time is O((M · E [|Si|])2) and grows quadratically as the numberof monitors increases. However, the results also shows that it is feasible to finish the com-putation if we can manage to limit the average number of reported payload patterns to besmall. For example, 128 monitors can complete the computation within 5 minutes if the aver-age number of payloads reported in each THRESHOLD-SET-UNION-HBC protocol is smallerthan 1.
Figure 8.2 (b) shows the ’lag’ To varying the number of honest-but-curious attackers (c).The lag increases as the number of tolerable attackers increases. There is always a trade-offbetween privacy protection and efficiency.
We then use a traffic trace from a campus network to estimate the time to deal withcontent blocks generated from legitimate traffic. In our experiment, each content block ismapped to one of 10 polynomials and each monitor participates in 10 instances of THRESHOLD-SET-UNION-HBC computation process concurrently. With the traffic monitoring module’sthreshold θG = 2, the number of payload patterns each monitor generates from the traffictrace for an hour long time window varies between 0 and hundreds (smtp), but mostly be-low 10. With a sampling rate ρ = 0.3, the average number of payload patterns reported bya monitor is 0.3 which is reasonably small. When a worm propagates, most of the monitorswill observe the worm payload patterns. With ρ = 0.3, only 3 out of 10 monitors will report
120
Chapter 8. Preserving Privacy using Privacy-Preserving Multiset Operations
the payload patterns.From the experiments, we conclude that privacy-preserving payload sharing with the
extended THRESHOLD-SET-UNION-HBC protocol is feasible in a distributed signature gen-eration system with a hundred monitors.
8.6 Summary
In this chapter, we presented a privacy-preserving distributed signature generation systemthat is one of the first applications that apply the THRESHOLD-SET-UNION-HBC protocol.This system provides cryptographically provable privacy protection, but is computationallyexpensive and has limited scalability. The system presented in this chapter is suitable fordistributed signature generation where less than hundreds of participants collaborate. Forexample, signature generation monitors from different autonomous domains can choose toexchange locally discovered candidate signatures in order to gain reasonable confidence.
Our original protocol takes the polynomial representation of each private set, encryptseach coefficient of the polynomial with homomorphic encryption, and computes the prod-uct of the polynomial representations from participants. Differentiation of the polynomialcancels out the item that does not appear in more than λ participants. The original providesstrong privacy protection. However, the operations of homomorphic multiplications anddecryption are prohibitively expensive.
In Section 8.3, we extended the protocol to reduce the computational cost and combinean approximate counting approach to reduce the computational cost further. The extendedprotocol, however, provides weak privacy-preservation compared to the original protocol,and approximate counting may result false negatives. The experimental results with ournon-optimized implementation show that currently we can complete the global signaturegeneration process within 5 minutes if not more than hundreds monitors participate and anaggressive approximate counting is employed. However, note that with 64 bit mode pro-cessors, we could reduce the basic operation speeds significantly. The use of cryptographicaccelerators is also promising for reducing the time caused by many big number exponenti-ation operations. More interestingly, most of the computation involved in the protocol canbe easily parallelized; with the advance in multi-core processors [32], we expect our privacy-preserving signature generation system can scale to more than hundreds of monitors easily.
121
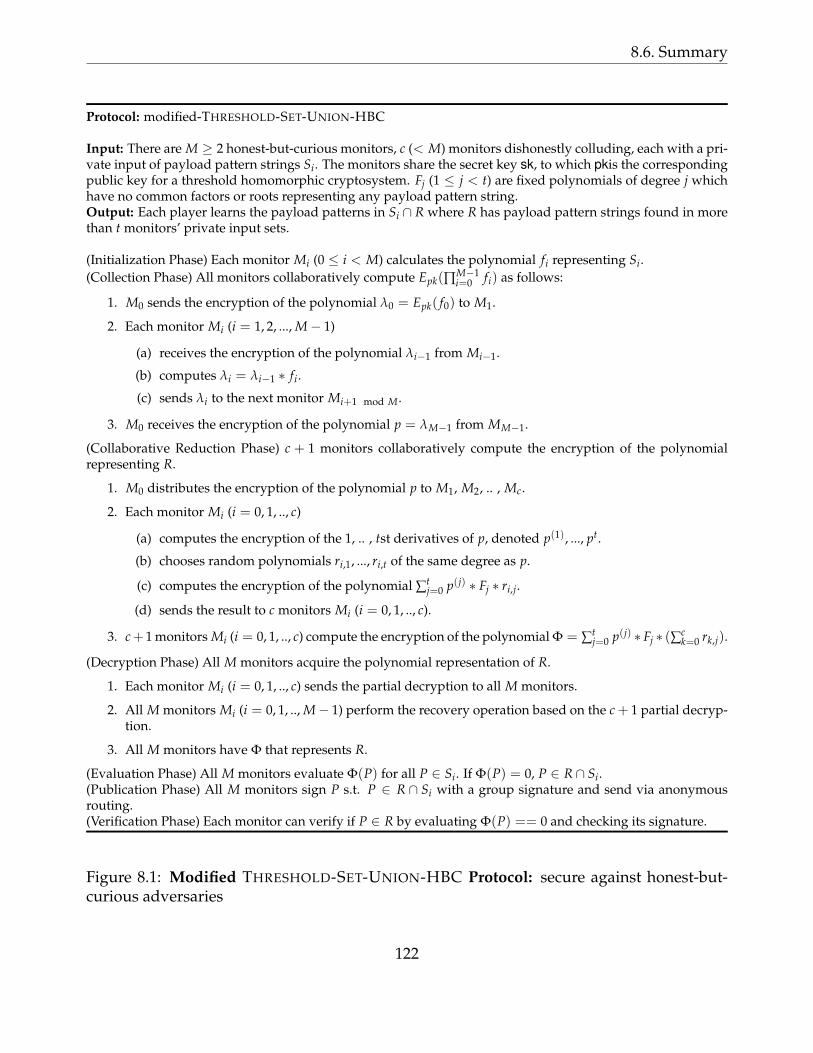
8.6. Summary
Protocol: modified-THRESHOLD-SET-UNION-HBC
Input: There are M ≥ 2 honest-but-curious monitors, c (< M) monitors dishonestly colluding, each with a pri-vate input of payload pattern strings Si. The monitors share the secret key sk, to which pkis the correspondingpublic key for a threshold homomorphic cryptosystem. Fj (1 ≤ j < t) are fixed polynomials of degree j whichhave no common factors or roots representing any payload pattern string.Output: Each player learns the payload patterns in Si ∩ R where R has payload pattern strings found in morethan t monitors’ private input sets.
(Initialization Phase) Each monitor Mi (0 ≤ i < M) calculates the polynomial fi representing Si.(Collection Phase) All monitors collaboratively compute Epk(∏M−1
i=0 fi) as follows:
1. M0 sends the encryption of the polynomial λ0 = Epk( f0) to M1.
2. Each monitor Mi (i = 1, 2, ..., M− 1)
(a) receives the encryption of the polynomial λi−1 from Mi−1.
(b) computes λi = λi−1 ∗ fi.
(c) sends λi to the next monitor Mi+1 mod M.
3. M0 receives the encryption of the polynomial p = λM−1 from MM−1.
(Collaborative Reduction Phase) c + 1 monitors collaboratively compute the encryption of the polynomialrepresenting R.
1. M0 distributes the encryption of the polynomial p to M1, M2, .. , Mc.
2. Each monitor Mi (i = 0, 1, .., c)
(a) computes the encryption of the 1, .. , tst derivatives of p, denoted p(1), ..., pt.
(b) chooses random polynomials ri,1, ..., ri,t of the same degree as p.
(c) computes the encryption of the polynomial ∑tj=0 p(j) ∗ Fj ∗ ri,j.
(d) sends the result to c monitors Mi (i = 0, 1, .., c).
3. c + 1 monitors Mi (i = 0, 1, .., c) compute the encryption of the polynomial Φ = ∑tj=0 p(j) ∗ Fj ∗ (∑c
k=0 rk,j).
(Decryption Phase) All M monitors acquire the polynomial representation of R.
1. Each monitor Mi (i = 0, 1, .., c) sends the partial decryption to all M monitors.
2. All M monitors Mi (i = 0, 1, .., M− 1) perform the recovery operation based on the c + 1 partial decryp-tion.
3. All M monitors have Φ that represents R.
(Evaluation Phase) All M monitors evaluate Φ(P) for all P ∈ Si. If Φ(P) = 0, P ∈ R ∩ Si.(Publication Phase) All M monitors sign P s.t. P ∈ R ∩ Si with a group signature and send via anonymousrouting.(Verification Phase) Each monitor can verify if P ∈ R by evaluating Φ(P) == 0 and checking its signature.
Figure 8.1: Modified THRESHOLD-SET-UNION-HBC Protocol: secure against honest-but-curious adversaries
122
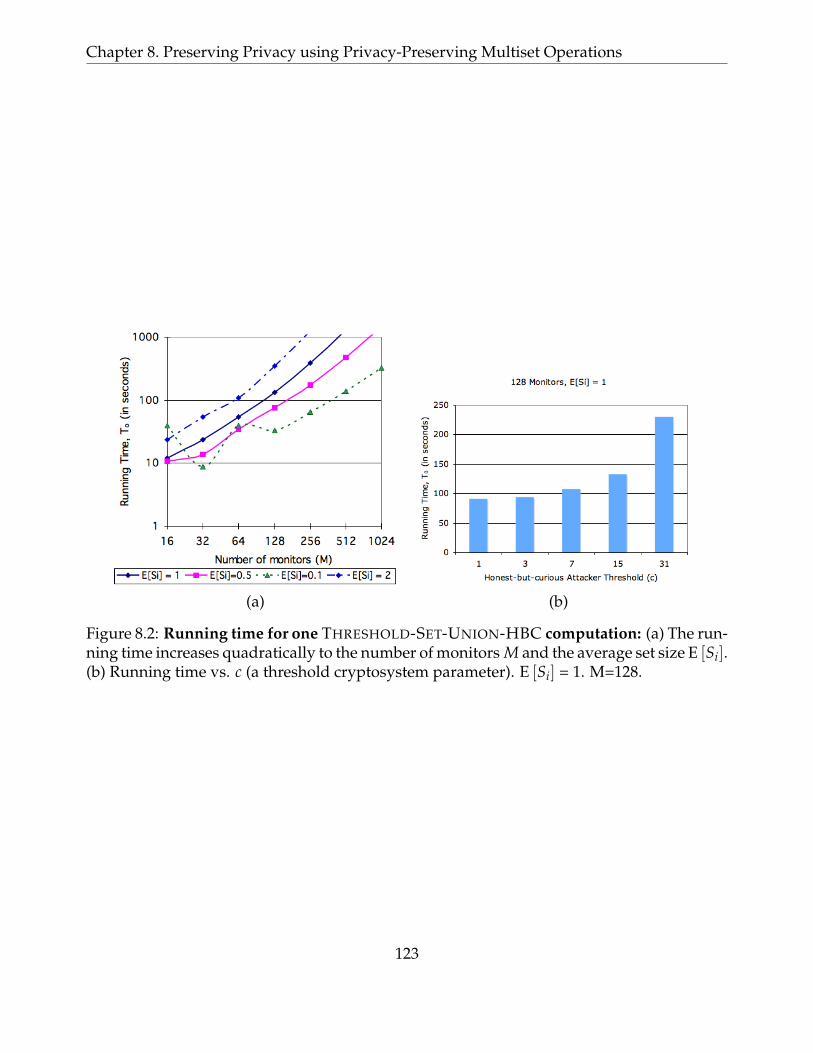
Chapter 8. Preserving Privacy using Privacy-Preserving Multiset Operations
(a) (b)
Figure 8.2: Running time for one THRESHOLD-SET-UNION-HBC computation: (a) The run-ning time increases quadratically to the number of monitors M and the average set size E [Si].(b) Running time vs. c (a threshold cryptosystem parameter). E [Si] = 1. M=128.
123

8.6. Summary
124

Chapter 9
Related Work
9.1 Automated Worm Signature Generation
Singh et al. [119] generate signatures for novel worms by measuring packet content preva-lence and address dispersion at a single monitoring point. Their system, EarlyBird, avoidsthe computational cost of flow reassembly, but is susceptible to attacks that spread worm-specific byte patterns over a sequence of short packets. Autograph instead incurs the ex-pense of flow reassembly, but mitigates that expense by first identifying suspicious flows,and thereafter performing flow reassembly and content analysis only on those flows. Early-Bird reverses these stages; it finds sub-packet content strings first, and applies techniques tofilter out innocuous content strings second. Autograph and EarlyBird both make use of Ra-bin fingerprints, though in different ways: Autograph’s COPP technique uses them as didLBFS, to break flow payloads into non-overlapping, variable-length chunks efficiently, basedon payload content. EarlyBird uses them to generate hashes of overlapping, fixed-lengthchunks at every byte offset in a packet efficiently. Singh et al. independently describe usinga white-list to disallow signatures that cause false positives (described herein as a blacklistfor signatures, rather than a white-list for traffic), and report examples of false positives thatare prevented with such a white-list [119].
Provos [105] observes the complementary nature of honeypots and content-based sig-nature generation; he suggests providing payloads gathered by honeyd to automated sig-nature generation systems such as Honeycomb [73]. DACODA [35] is one example thatforwards payload information captured from honeypot to a payload analyzer where thenetwork payload information is correlated with control flow hijacking activities. Autographwould similarly benefit from honeyd’s captured payloads. Furthermore, if honeyd partic-
125
9.1. Automated Worm Signature Generation
ipated in tattler, Autograph’s detection of suspicious IP addresses would be sped, with lesscommunication than that required to transfer complete captured payloads from instances ofhoneyd to instances of Autograph.
Kreibich and Crowcroft [73] describe Honeycomb, a system that gathers suspicious trafficusing a honeypot, and searches for least common substrings in that traffic to generate wormsignatures. Honeycomb relies on the inherent suspiciousness of traffic received by a hon-eypot to limit the traffic considered for signature generation to truly suspicious flows. Thisapproach to gathering suspicious traffic is complementary to that adopted in Autograph;we need investigate acquiring suspicious flows using honeypots for signature generationby Autograph in future. The evaluation of Honeycomb assumes all traffic received by ahoneypot is suspicious; that assumption may not always hold, in particular if attackers de-liberately submit innocuous traffic to the system. Autograph, Honeycomb, and EarlyBirdwill face that threat as knowledge of their deployment spreads. We combat the threat byvetting candidate signatures for false positives among many distributed monitors.
Our work is the first we know to evaluate the trade-off between earliness of detection ofa novel worm and generation of signatures that cause false positives in content-based sig-nature detection. Since Autograph, Honeycomb, and EarlyBird demonstrated their promis-ing results of automated signature generation, much research has been published exploringfaster and more robust automated worm signature generation.
Wang et al. [139] extended their prior work [138] on payload-based network intrusiondetection to generate Internet worm signatures. Their system, PAYL, detects anomalouspackets based on the model of normal payload bytes distribution and extract the invariantportion of packet content across similarly anomalous packets using the longest commonsubsequence algorithm. We expect their heuristic to detect anomalous packets can be used toimprove our suspicious flow classifier. Karamcheti et al. [67] proposed a malicious networktraffic detection algorithm by utilizing the payload content similarity of worm traffic. Theymodel the legitimate traffic with the inverse distributions of substrings in a packet, and anydeviation from the model indicates on-going worm activities. However, their work doesnot target to distinguish suspicious flows nor generate signature useful for current content-based filtering.
Cai et al. [16] proposed a collaborative worm detection system, WormShield. WormShieldaggregates the statistics of payload pattern fingerprint and address dispersion in an overlaynetwork; detects anomalous payload pattern fingerprints based on the aggregate statistics.Their results corroborate our analysis on the benefit of distributed monitoring. They protectprivacy by using SHA-1 hash instead of the actual payload substrings in the aggregation.
126

Chapter 9. Related Work
However, the privacy protection does not prevent dictionary attacks on private data.Autograph is not able to handle maximally-varying polymorphic worms, but Polygraph [93]
demonstrated that it is possible to generate accurate signatures for polymorphic worms, be-cause there are some features that must be present in worm infection attempts to successfullyexploit the target machine. Polygraph showed automatic signature-generation techniquesthat extract a set of small substrings from suspicious flow pool, taking a machine-learningapproach. Hamsa [76] is another learning based automated signature generation system forpolymorphic worms. By employing more efficient data structures and an improved modelin analyzing the invariant content among suspicious flows, Hamsa achieves significant im-provements in signature generation speed, accuracy, and attack resilience over Polygraph.Paragraph [94] demonstrated attacks against such learning-based signature generation sys-tems in an adversarial environment, so the pattern-extraction-based signature generationfor polymorphic worms is still a problem to be addressed.
Another approach to automate signature generation is based on application and exploitsemantic information collected from a host [95, 34, 77, 15]. This host-based approach canprovide more robust signature generation against polymorphic worms, and generate moreexpressive forms of signatures than network-based pattern matching signatures generatedby Autograph. However, the network-based pattern matching signature still holds its ownvalue: signature matching is fast so can be deployed in the network to stop worms beforereaching hosts.
9.2 Distributed Monitoring
Distributed monitoring is not a novel concept in network security. For the last decade, mucheffort has been made to take advantage of distributed monitoring to detect network intru-sions that are difficult to detect from a single monitoring point. DIDS [120] is an early ex-ample of distributed intrusion detection system that collects security-relevant event from anumber of monitors on hosts to track of users as they change account name moving aroundthe networks. Later, many systems such as EMERALD [104], AAFID [46], GrIDS [129], andArgus [65] present various techniques to aggregate observation from a large number of dis-tributed monitors in a more scalable and reliable fashion.
As more and more computers are connected to networks and the risk of wide-spread,large-scale attacks grows, distributed monitoring becomes one of the important compo-nents in Today’s intrusion detection systems. Snort [131] allows a multi-tier deploymentto provide scalability, security, and performance. The sensors interpret intrusion data gath-
127
9.3. Privacy-Preserving Hot Item Identification
ered from lower tier sensors distributed across an enterprise and forward interesting data tohigher tier sensors [72]. Bro [102] also offers the option to exchange state information withother Bro peers to detect distributed attacks [121, 74]. While the benefit of distributed mon-itoring is already widely accepted in network security, our contribution in this thesis is toadopt distributed monitoring in automated worm signature generation, which is challeng-ing because signature generation involves privacy-sensitive information exchanges acrossdifferent domains.
Yegneswaran et al. [146] corroborate the benefit of distributed monitoring, both in speed-ing the accurate accumulation of port scanners’ source IP addresses, and in speeding theaccurate determination of port scanning volume. Their DOMINO system detects port scan-ners using active-sinks (honeypots), both to generate source IP address blacklists for usein address-based traffic filtering, and to detect an increase in port scanning activity on aport with high confidence. The evaluation of DOMINO focuses on speed and accuracy indetermining port scan volume and port scanners’ IP addresses, whereas our evaluation ofAutograph focuses on speed and accuracy in generating worm signatures, as influenced bythe speed and accuracy of worm payload accumulation.
Nojiri et al. [96] describe models for peer-to-peer- based attack mitigation strategies andinvestigate the efficacy of those strategies in stopping large scale Internet worms. In theirpeer-to-peer based strategies, members share the observed attack reports with their coop-erating friend members. Each member can decide whether it uses the reports from friendmembers or shares with other friend members, based on its local policy. Their simulationresults show that, in general, a large number of cooperating members does better in sup-pressing worms but is much worse in dealing with false alarms. They also show that weneed different strategies based on the propagation behavior of worms. In our work, weproposed two different distributed payload sharing mechanisms for worms that propagateusing localized scanning strategies, and for worms that propagate using random scanningstrategies. Unlike the systems presented in their work that share only attack reports con-firmed locally, our payload sharing network requires information to be shared before it isnot locally confirmed as part of attacks. Thus, the focus of our work is how to protect theprivacy in the shared information while enabling information sharing.
9.3 Privacy-Preserving Hot Item Identification
We adopt privacy-preserving set operations [70] to find payload patterns that appear inmultiple monitors. The protocol based on privacy-preserving set operation is secure un-
128
Chapter 9. Related Work
der a very strict notion of privacy [55], but is slow if we apply it directly to the signaturegeneration problem. Thus, we combined it with approximate counting in our implementa-tion of the protocol. Our work is the first practical system that adopts the framework. TheHOTITEM-ID protocol [69] provides more efficient and flexible results by being designed toachieve more restricted notions of privacy.
Even though many security applications have adopted the distributed monitoring ap-proach to improve their attack detection performance, little effort has been made to addressthe privacy-related issues. Most work either assumed a trusted environment, or a trustedcentral server that aggregate reports from distributed monitors [41]. Lincoln et al. [78] de-scribe privacy-breaching attacks against distributed network monitoring node. Their ap-proach, however, still relies on a trusted central servers and avoids privacy-sensitive datasuch as payload information. Wormshield [17] attempts to protect the privacy of data byusing hash values instead of payload data. However, the approach does not prevent dictio-nary attacks. Our work that addresses the privacy issues in a distributed fashion with morerestricted notion of privacy.
Allman et al. [3] propose an architecture for using cross-organization information sharingto understand distributed, coordinated attacks. In their framework, a small number of ”de-tectives” systems such as honeypots leverage existing wide-scale generic traffic monitors as”witnesses” of malicious network events the detectives are investigating. They use a privatematching mechanism to allow for detectives to question witnesses without revealing thedetail of the attacks under investigation or witnesses’ private information unrelated to theattacks. While our work focuses on sharing payloads for faster signature generations anddoes not rely on the specialized monitors to initiate information sharing, our work sharesmuch similarity with their proposed system. For instance, both systems utilize intelligentintrusion detection systems such as honeypots (but in different ways), protect private infor-mation, and prevent cheating by relying on multiple monitors reporting mutually observednetwork events.
Privacy-preserving collection of statistics about computer configurations has also beenconsidered in previous work [137, 61]. Like the work in [78], they do not give a concretedefinition of security, but instead a technique for heuristically confusing attackers. Theirapproach also relies on chains of trust between friends and the collection of statistics is gath-ered by querying a subset of distributed nodes.
129

9.3. Privacy-Preserving Hot Item Identification
130
Chapter 10
Conclusions
In this dissertation, we developed an automated Internet worm signature generation systemand the techniques to speed its signature generation with information sharing among dis-tributed monitors while protecting privacy. In concluding this dissertation, this chapter firstrevisits the desired requirement of automated worm signature generation. Key contribu-tions are then discussed, after which important lessons learned about automated signaturegeneration will be presented.
10.1 Desired Requirements Revisited
The system and techniques presented in this dissertation are designed to meet the desiredrequirements of automated signature generation for signature-based worm traffic detection.
• Signature Quality: Autograph with COPP and content prevalence analysis generatesspecific and selective signatures for an Internet worm as long as there are unique bytesequences that can be used for worm’s payload signature. Signatures for polymor-phic or metamorphic worms are difficult to generate using the current Autograph.Polygraph [93] and many other techniques, proposed after Autograph, shed light onmore accurate automated signature generation even for polymorphic or metamorphicworms.
• Early Signature Generation: By making multiple monitors dispersed in the Internetcollaborate, our systems generate signatures for worms that propagate by scanningthe Internet address space before they spread wild. The collaboration happens in thethree different stages of our systems. First, the distributed monitors collaborate to
131
10.1. Desired Requirements Revisited
identify the sources of suspicious flows. Second, the distributed monitors collaborateto share the identified suspicious payload pattern strings. Third, the monitors sharegenerated signatures. This type of collaboration makes our system viable even when asigle monitor is not sufficient enough to collect enough samples required for signaturegeneration.
• Minimal Real-time Operator Intervention: Our systems allow all the signature gen-eration process to be performed without human intervention.
• Robust against Attacks: Distributed payload sharing and signature generation can beconsidered ‘voting’ among multiple monitors, we avoid generating false signaturesdue to attacks against a small number of monitors. We preserve the owner and dataprivacy of participating networks and shared data, so that any curious attackers cannotuse our distributed systems to gain private information about participating networks.
• Minimizing the Effect on Legitimate Internet Use: Our system relies on passive net-work monitoring. If the monitors are installed at the boundary of each monitored net-work, users in the monitored networks does not experience any additional overheador inconvenience such as installing software or changing the configuration of personalcomputers. Generating false signatures can disrupt legitimate traffic and thus must beavoided by all means. Our analysis with real network traces showed the false positiverate is low, and the system generates only a handful number of signatures. We stillneed more investigation with more data sets. However, considering that we observedlow false positive rates in the analysis with traces collected from multiple, independentplaces at different time period, the result is still promising.
• Preserving Privacy: We provide two privacy-preserving payload sharing techniques.
While the results of our analysis showed our proposed techniques have promise in theautomated worm signature generation, we stress that it is yet too early for us to concludethat our techniques are the perfect solution for the problem. Our experiments and analysisare based only on a few traces, and focused only on worms that propagate by scanning IPaddresses. Further investigation with more traffic traces from different networks against awider variety of Internet worms is still required. We believe, however, that the techniquesand the evaluation methodology discussed in this thesis shed new light on worm detectionand prevention technology, and raise the bar in future worm design.
132

Chapter 10. Conclusions
10.2 Contributions
We catalog the contribution of this work:
• Automated Signature Generation Method. We proposed and evaluated a techniquethat automates pattern-based signature generation by utilizing content prevalence anal-ysis. This technique is effective in detecting worms that possess the following prop-erties: 1) content invariance, 2) voluminous traffic, and 3) many-to-many communica-tion. With our Autograph system, we presented these properties are a good basis todistinguish such worm traffic from other legitimate traffic. Furthermore, the invari-ant portion of worm payloads can be extracted by a simple prevalence analysis andused as a signature for the worm. We provide the criteria to evaluate automated signa-ture generation systems. Inspired by our early work in Autograph development andcontemporaneous work such as Honeycomb [73] and EarlyBird [119], many differenttechniques for automated signature generation have been proposed from the securityresearch community since our work.
• Distributed Monitoring as a Mean of Fast Signature Generation. This work has pro-vided the basis for distributed monitoring for fast signature generation for worms thatpropagate in moderate speed, and thus the number of worm payload samples a sin-gle monitor can accumulate is limited 1 The tattler mechanism provides a bandwidth-efficient way to gossip scanners’ IP addresses and we showed the value of distributedscanner detection in terms of signature generation speed. We provided techniquesfor suspicious payload information useful in the early detection of worm signatures.We demonstrated the efficient ways to mine a useful piece of information out of hugeamount of traffic data. We also evaluated the benefit of payload sharing in automatedsignature generation qualitatively and quantitatively.
• Privacy-Preserving Information Sharing. Recognizing the privacy issues and attacksin the concept of payload sharing, this work provides the technique to share payloadwhile protecting the privacy of participating monitors. Most prior work in distributedmonitoring for network security has avoided the privacy issues or has employed atrusted, centralized system to aggregate information from distributed monitors. Thiswork showed that fully distributed, privacy-preserving information sharing is feasible
1When a worm propagates as fast as a Warhol worm or a flash worm [127, 140] and targets a large fractionof hosts in the Internet, we expect that a single monitor can capture enough payload samples to generate thesignatures and deploy them locally.
133
10.3. Lessons Learned
by applying probabilistic and cryptographically proved privacy-preserving techniquesto automated signature generation problem, which requires fast information exchange.
10.3 Lessons Learned
As touched on in the contributions above, the analysis of our signature generation tech-niques illuminated a number of important elements in automated signature generation sys-tem development.
• Quality of Autograph-generated Signatures. The suspicious flow pool constructedwith a simple port-scanner-based suspicious flow selection is dominated by presentscanning worm flows. The content blocks of worms’ invariant portions are toppedfor the prevalence histogram of content blocks from suspicious flows. (Section 3.2)Iterative selection of prevalent content blocks with carefully chosen parameters gener-ates a selective set of signatures that catch all present worms while generates no falsepositives. There is a trade-off between content block length and the number of gen-erated signatures, and between content block length and the specificity of signatures.(Section 3.4.1)
• Polymorphic Worm Signatures. Autograph is not successful in finding signatures ifthe invariant portion in the worm payloads is relatively short compared to the config-ured content block size as shown in Section 3.4.2 The extreme case is for a polymorphicor metamorphic worm. We expect that polymorphic worm signatures are not easily ex-pressed with a single payload pattern string even when generated by a human; moreexpressive forms of signatures [122, 93, 94, 147] are necessary to detect polymorphicworms.
• P2P Application and Worm Traffic. They are similar in their communication patterns,so it is hard to distinguish one from another if we rely only on content-prevalenceanalysis as shown in Section 3.5. Content-prevalence is a good measure to select wormtraffic out of other traffic, but combination with other worm detection heuristics isrecommended to avoid generating false positives from P2P application traffic.
• Distributed Port Scanner Detection. Tattler distributes a large number of port scan-ner IP addresses without requiring large bandwidth. It also speeds Autograph’s sus-picious flow selection, so does the signature generation. (Section 4.3 and 4.4)
134
Chapter 10. Conclusions
• Online Signature Generation. Our trace-driven simulation results in Section 4.5 showthat there is a trade-off between early signature generation and generated signaturequality. Combined with tattler and an aggressive port-scanner detection heuristic, thedistributed version of Autograph could generate the specific signature of a randomscanning worm before it infects 2% of vulnerable hosts.
• Worm Flow Accumulation Speed. The size and location of a monitored network is acritical factor that determines the worm flow accumulation speed, so does the signa-ture generation speed in pattern-extraction-based signature generation systems. (Sec-tion 5.1) Particularly, for fast detection of localized scanning worms, a monitor mustbe located close to the vulnerable host population.
• Distributed Payload Sharing Strategies. Distributed monitors that share suspiciousflows and generated signatures overcome the limitation from the network size andlocation of a single monitor. We expected the more monitors is the better for fast signa-ture detection but, in the random scanning worm detection experiments (Section 6.1.2),we did not see much speed-up by including more monitors. However, with manymonitors, we can accept the detected signature with more confidence even with a lowlocal threshold applied.
This is because random scanning worms probe all networks evenly. On the other hand,the localized scanning worm detection speed improved as more monitors participate.Considering the computational overhead that the privacy-preserving payload sharingintroduces in the system (Section 8.5), it is desirable to use a handful number of moni-tors for GSD, and use as many monitors as possible for LSD.
• Prevalent Innocuous Traffic Our measurements in Section 6.3 showed that some pay-load pattern strings from legitimate traffic appear common across many networks, butcan be filtered from signature generation with a signature blacklist. Moreover, we didfind none of these common payload pattern strings include private information.
• HOTITEM-ID Protocol. The HOTITEM-ID supports bandwidth efficient, privacy-preservingpayload sharing when thousand of monitors participate. From our experiments in Sec-tion 7.4, we confirmed its bandwidth efficiency and accuracy. The experiments showanother interesting way to deploy a Autograph system. By placing the suspicious TCPflow reassembly part close to the end hosts but enabling the collaborative content anal-ysis on the distributed suspicious flow pool, we can avoid the problem of TCP flowreassembly discussed by Handley et al. [57].
135

10.3. Lessons Learned
• Privacy-preserving Threshold Set Union. The original protocol is expensive (Sec-tion 8.5). The computational costs increases quadratically to the number of monitorsand the number of payload patterns to be shared. Thus, the number of payload pat-tern strings reported from a monitor must be kept small. Sampling and the extendedprotocol (Section 8.3.2) helped us make our system practical.
In this dissertation, we focused on Internet worms. However, there are many types ofattacks that share the properties of worms. E-mail spams and Blog spams are also wide-spreading and often contain invariant parts in their payload. Thus, we expect our techniquesof content prevalence testing and privacy-preserving distributed monitoring might be alsouseful against these wide-spreading malicious payload attacks.
136
Appendix A
Extended Protocol for Reducing NetworkDelay
In Section 8.3, we described a protocol that identifies content blocks that are reported bymore than λG distributed nodes. The key of the protocol is to represent the set of con-tent blocks each node holds as an encrypted polynomial, multiply all the polinomials fromparticipating nodes in Collection Phase, and then find λG -th derivative of the resulting poly-nomial. The collection phase of the protocol in Figure 8.1 presents a way to compute theproduct of all polynomials by visiting every node sequentially. This is problematic whenmany nodes (i.e. monitors) participate in the protocol and the average network delay be-tween nodes is high. The delay due to the communication in the collection phase is O(M× d)where d is the average delay between neighbors and M is the number of participating nodes.
We now discuss an improvement of THRESHOLD-SET-UNION-HBC in order to reducethe communication cost to O(c · d · log(M)). Note that this extension requires more homo-morphic multiplication and decryption operations, so increases the computational cost inpractice. However, this extension might be helpful in different types of applications.
We reduce the communication delay by modifying the collection phase. Multiplicationcan be done concurrently along a binary tree as shown in Figure A (a), instead of passingcomputed polynomials sequentially.
For convenience, we assume that the number of participating monitors, M, is a power oftwo. Mi (0 ≤ i < M) refers to i-th monitor in the system and fi is the encrypted polynomialthat represents the set of content blocks Mi has observed.
New Collection Phase: i-th monitor Mi where i mod 2 6= 0 initiates the collection phaseby sending the encryption of its polynomial, fi, to Mi−1. For example, M1 sends its en-
137
crypted polynomial to M0.Upon receiving the polynomial from the neighboring monitor Mi+1, Mi (i mod 2 = 0)
computes Epk( fi × fi+1) = fi ∗h Epk( fi+1). Then, if i mod 22 6= 0, Mi sends the encryptedpolynomial to Mi−21 as shown in Figure A.
Now nodei (i mod 22 = 0) has two encrypted polynomials, Epk( fle f t) and Epk( fright)from its left and right subtrees. Because the multiplication of two encrypted polynomials isnot possible, Mi first sends a polynomial, Epk( fle f t) to a member of a group of c + 1 arbitrarynodes. 1 Those c + 1 monitors compute additive shares of fle f t using ADDITIVE-SHARE-PROTOCOL presented in Figure A (b).
Let si be the share of the i-th node in the group. Then, ∑ci=0 si = fle f t. Mi sends Epk( fright)
to the node who holds s0. The c + 1 nodes can collaboratively compute fle f t ∗h Epk( fright) =s0 ∗h Epk( fright) +h · · ·+ hsc+1 ∗h Epk( fright). The resulting polynomial is sent to the request-ing node. Then, Mi sends the newly computed polynomial to Mi−22 if i mod 23 6= 0. Wekeep sharing out one subtree’s encrypted polynomial and multiplying another subtree’s en-crypted polynomial with the additive shares along the tree. After log M rounds, M0 cal-culates Epk(∏N−1
i=0 fi) and becomes ready to proceed for the collaborative reduction phasedescribed in the basic protocol.
No coalition of at most c PPT honest-but-curious adversaries can decrypt the polynomialshared with ADDITIVE-SHARE-PROTOCOL because at least c + 1 nodes are needed todecrypt messages.
This new extended protocol offers the same level of privacy protection as the basic pro-tocol. However, the communication cost reduction comes at the cost of more computations.When f (x) = f1(x) · f2(x), and d1 and d2 are the degrees of f1 and f2 respectively, the num-ber of multiplication operations to compute f (x) is O(d1 ∗ d2). The d1 ∗ d2 is maximizedwhen d1 = d2. In this protocol. the total number of homomorphic multiplication oper-ations is larger than in the original ring-based protocol. Moreover, ADDITIVE-SHARE-PROTOCOL requires each coefficient to be decrypted, so is expensive. Thus, this protocolis useful only when the size of each Si is small and the number of adversaries c is small.
1Note that the Mi itself could be a member of the group. The members of a group could be chosen basedon the computational capacity, current load, proximity, etc.
138
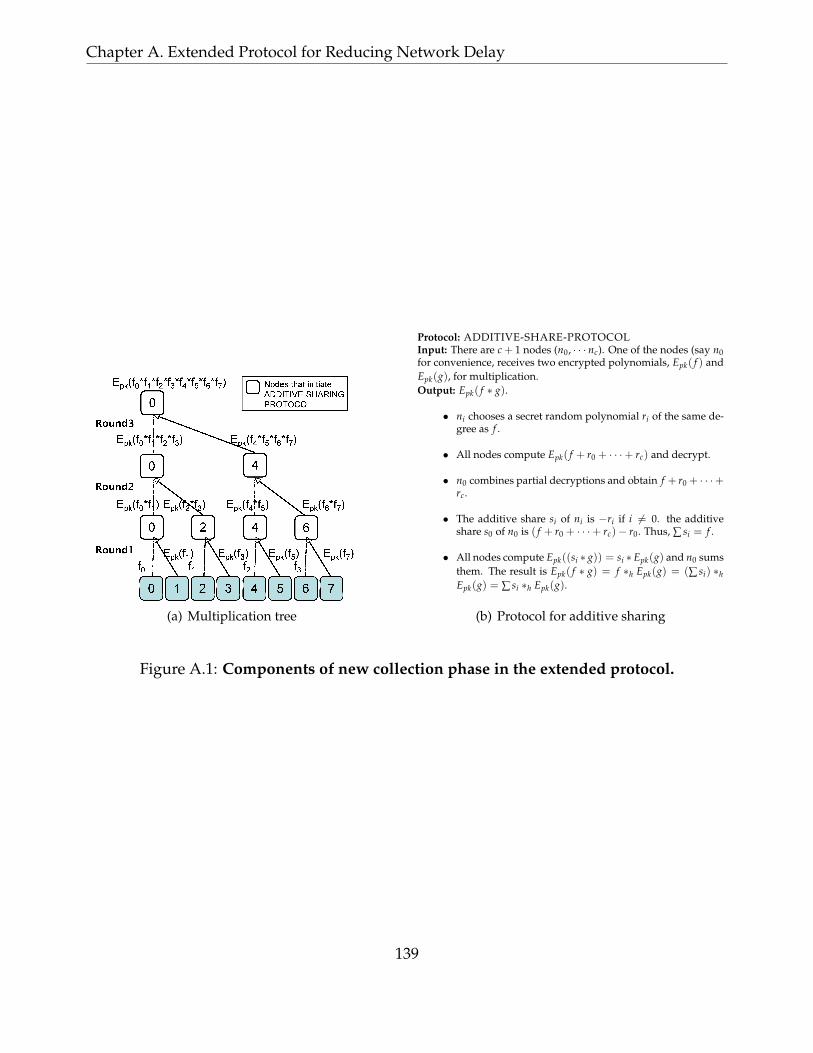
Chapter A. Extended Protocol for Reducing Network Delay
(a) Multiplication tree
Protocol: ADDITIVE-SHARE-PROTOCOLInput: There are c + 1 nodes (n0, · · · nc). One of the nodes (say n0for convenience, receives two encrypted polynomials, Epk( f ) andEpk(g), for multiplication.Output: Epk( f ∗ g).
• ni chooses a secret random polynomial ri of the same de-gree as f .
• All nodes compute Epk( f + r0 + · · ·+ rc) and decrypt.
• n0 combines partial decryptions and obtain f + r0 + · · ·+rc.
• The additive share si of ni is −ri if i 6= 0. the additiveshare s0 of n0 is ( f + r0 + · · ·+ rc)− r0. Thus, ∑ si = f .
• All nodes compute Epk((si ∗ g)) = si ∗ Epk(g) and n0 sumsthem. The result is Epk( f ∗ g) = f ∗h Epk(g) = (∑ si) ∗hEpk(g) = ∑ si ∗h Epk(g).
(b) Protocol for additive sharing
Figure A.1: Components of new collection phase in the extended protocol.
139

140
Bibliography
[1] K. Aguilera and R. Strom. Efficient atomic broadcast using deterministic merge. InProceedings of the 19th ACM PODC, 2000.
[2] Akismet. Stop comment spam and trackback spam. http://akismet.com, 2005.
[3] Mark Allman, Ethan Blanton, Vern Paxson, and Scott Shenker. Fighting coordinatedattackers with cross-organizational information sharing. In 5th Workshop on Hot Topicsin Networks (HotNets–V), November 2006.
[4] K. G. Anagnostakis, S. Sidiroglou, P. Akritidis, K. Xinidis, E. Markatos, and A. D.Keromytis. Detecting targeted attacks using shadow honeypots. In Proceedings of the14th USENIX Security Symposium, 2005.
[5] S. Antonatos, K. G. Anagnostakis, E. P. Markatos, and M. Polychronakis. Performanceanalysis of content matching intrusion detection systems. In Proceedings of the Inter-national Symposium on Applications and the Internet (SAINT’04), Tokyo, Japan, January2004.
[6] Ziv Bar-Yossef, T. S. Jayram, Ravi Kumar, D. Sivakumar, and Luca Trevisan. Countingdistinct elements in a data stream. In Proceedings of the 6th International Workshop onRandomization and Approximation Techniques, pages 1–10, London, UK, 2002. Springer-Verlag.
[7] Bittorrent. http://bitconjurer.org/BitTorrent/.
[8] Burton H. Bloom. Space/time trade-offs in hash coding with allowable errors. Com-munications of the ACM, 13(7):422–426, July 1970.
[9] Blubster. http://www.blubster.com.
141
Bibliography
[10] Dan Boneh, Xavier Boyen, and Hovav Shacham. Short group signatures. In Proceedingsof the 24th international conference on cryptology (CRYPTO), volume 3152, pages 41–55.Springer-Verlag, August 2004.
[11] Dan Boneh and Hovav Shacham. Group signatures with verifier-local revocation. InProceedings of the 11th ACM Conference on Computer and Communications Security, pages168–177, 2004.
[12] Flavio Bonomi, Michael Mitzenmacher, Rina Panigraphy, Sushil Singh, and GeorgeVarghese. Beyond bloom filters: From approximate membership checks to approxi-mate state machines. In Proceedings of ACM SIGCOMM Conference, September 2006.
[13] Sergey Brin and Lawrence Page. The anatomy of a large-scale hypertextual Web searchengine. Computer Networks and ISDN Systems, 30(1–7):107–117, 1998.
[14] Andrei Broder and Michael Mitzenmacher. Using multiple hash functions to improveIP lookups. In Proceedings of IEEE INFOCOM 2001, pages 1454–1463, 2001.
[15] David Brumeley, James Newsome, Dawn Song, Hao Wang, and Somesh Jha. Towardsautomatic generation of vulnerability-based signatures. In Proceedings of the IEEE Sym-posium on Security and Privacy, May 2006.
[16] M. Cai, K. Hwang, Y.-K. Kwok, S. Song, and Y. Chen. Collaborative internet wormcontainment. In Proceedings of IEEE Symposium on Security and Privacy, May/June 2005.
[17] M. Cai, R. Zhou, K. Hwang, C. Papadopoulos, and S. Song. Wormshield: Collabora-tive worm signature detection using distributed aggregation trees. Poster on the 2ndSymposium on Network System Design and Implementation (NSDI’05), May 2005.
[18] Miguel Castro, Peter Druschel, Anne-Marie Kermarrec, and Antony Rowstron. Scribe:A Large-scale and Decentralized Application-level Multicast Infrastructure. IEEE Jour-nal on Selected Areas in Communication (JSAC), 20(8), 2002.
[19] Miguel Castro, Michael B. Jones, Anne-Marie Kermarrec, Antony Rowstron, MarvinTheimer, Helen Wang, and Alec Wolman. An evaluation of scalable application-levelmulticast built using peer-to-peer overlays. In Proceedings of the Conference on ComputerCommunications (INFOCOM’03), 2003.
[20] CERT. CERT Advisory CA-2004-26 Nimda Worm. http://www.cert.org/
advisories/CA-2001-26.html, September 18, 2001.
142
Bibliography
[21] P. Chandra, Raj Yavatkar, and S. Lakshmanmurthy. Intel IXP2400 Network Processor,volume 1, chapter 13, pages 259–276. Morgan Kaufmann, October 2002.
[22] D. Chaum. The dining cryptographers problem: unconditional sender and recipientuntraceability. J. Cryptol., 1(1):65–75, 1988.
[23] D. Chaum, J.-H. Evertse, J. Graaf, and R. Peralta. Demonstrating possession of a dis-crete logarithm without revealing it. In Advances in Cryptology—CRYPTO ’86, pages200– 212. Springer-Verlag, 1987.
[24] David L. Chaum. Untraceable electronic mail, return addresses, and digitalpseudonyms. Commun. ACM, 24(2):84–90, 1981.
[25] Mihai Christodorescu and Somesh Jha. Static Analysis of Executables to Detect Mali-cious Patterns. In Proceedings of the 12th USENIX Security Symposium, 2003.
[26] Yang-Hua Chu, Sanjay G. Rao, and Hui Zhang. A case for end system multicast. InProceedings of the ACM International Conference on Measurement and Modeling of ComputerSystems (SIGMETRICS), pages 1–12, Santa Clara, CA, June 2000. ACM.
[27] B. Chun, J. Lee, and H. Weatherspoon. Netbait: a distributed worm detection service,2003.
[28] Cisco Systems. Network-Based Application Recognition. http://www.cisco.com/en/US/products/ps6616/products ios protocol group home.html.
[29] Clip2. The Gnutella Protocol Specification v.0.4, March 2001.
[30] C. Jason Coit, Stuart Staniford, and Joseph McAlerney. Towards faster string matchingfor intrusion detection or exceeding the speed of snort. In 2nd DARPA InformationSurvivability Conference and Exposition (DISCEX II’01), June 2001.
[31] M. Patrick Collins and Michael K. Reiter. Hit-List Worm Detection and Bot Identifica-tion in Large Networks Using Protocol Graphs. In Proceedings of the 10th InternationalSymposium on Recent Advances in Intrusion Detection, August 2007.
[32] Intel Corp. Intel’s tera-scale research prepares for tens, hundreds of cores. Technology-Intel Magazine, http://www.intel.com/technology/magazine/computing/tera-scale-0606.htm, 2006.
143
Bibliography
[33] Symantec Corporation. Symantec security response - w32.sasser.worm.http://securityresponse.symantec.com/avcenter/venc/data/w32.
sasser.worm.html, February 24, 2005.
[34] Manuel Costa, Jon Crowcroft, Miguel Castro, Antony Rowstron, Lidong Zhou, andLintao Zhang. Vigilante: End-to-end containment of internet worms. In Proceedings ofACM Symposium on Operating Systems Principles (SOSP), October 2005.
[35] Jedidiah R. Crandall, Zhendong Su, S. Felix Wu, and Frederic T. Chong. On deriv-ing unknown vulnerabilities from zero-day polymorphic and metamorphic worm ex-ploits. In Proceedings of the 12th ACM conference on Computer and communications secu-rity, pages 235–248, New York, NY, USA, 2005. ACM.
[36] D. Dagon, X. Qin, G. Gu, W. Lee, J. Grizzard, J. Levine, and H. Owen. HoneyStat: LocalWorm Detection Using Honeypots. In Proceedings of the 7th International Symposium onRecent Advances in Intrusion Detection (RAID), pages 39–58, October 2004.
[37] P. J. Denning, editor. Computers Under Attack: Intruders, Worms, and Viruses. ACMPress, Addison-Wesley, New York, 1990.
[38] Sarang Dharmapurikar, Praveen Krishnamurthy, Todd Sproull, and John Lockwood.Deep packet inspection using parallel bloom filters. In IEEE Micro, pages 44–51, 2003.
[39] Direct connect (file sharing). http://en.wikipedia.org/wiki/Direct
Connect (file sharing).
[40] John B. Douceur. The Sybil Attack. In Proceedings of the IPTPS, Boston, March 2002.
[41] DShield.org. DShield - Distributed Intrusion Detection System. http://dshield.org.
[42] edonkey2000. http://www.edonkey2000.com.
[43] Dan Ellis, Jack Aiken, Kira Attwood, and Scott Tenaglia. A Behavioral Approach toWorm Detection. In Proceedings of ACM Workshop on Rapid Malcode, Fairfax, VA USA,October 2004.
[44] Endace. http://www.endace.com, 2004.
144
Bibliography
[45] Cristian Estan and George Varghese. New directions in traffic measurement and ac-counting: Focusing on the elephants, ignoring the mice. ACM Transactions on ComputerSystems, August 2003.
[46] Diego Zamboni Eugene H. Spafford. Intrusion detection using autonomous agents.
[47] Amos Fiat and Adi Shamir. How to prove yourself: practical solutions to identificationand signature problems. In Proceedings on Advances in cryptology—CRYPTO ’86, pages186–194, London, UK, 1987. Springer-Verlag.
[48] Fileguri. http://fileguri.com.
[49] Mike Fisk and George Varghese. Fast content-based packet handling for intrusiondetection. Technical report, University of California at San Diego, La Jolla, CA, USA,2001.
[50] P. Fouque, G. Poupard, and J. Stern. Sharing decryption in the context of voting oflotteries. In Proceedings of Financial Cryptography, 2000.
[51] Pierre-Alain Fouque and David Pointcheval. Threshold cryptosystems secure againstchosen-ciphertext attacks. In Proc. of Asiacrypt 2001, pages 573–84, 2000.
[52] M. J. Freedman, K. Nissim, and B. Pinkas. Efficient private matching and set intersec-tion. In Advances in Cryptography: Proceedings of Eurocrypt, 2004.
[53] Sharon Gaudin. Storm worm botnet more powerful than top supercomput-ers. http://www.informationweek.com/news/internet/showArticle.
jhtml?articleID=201804528, September 2007.
[54] Goboogy. http://goboogy.com.
[55] Oded Goldreich. The Foundations of Cryptography - Volume 2. Cambridge UniversityPress, May 2004. http://www.wisdom.weizmann.ac.il/∼oded/foc-vol2.
html.
[56] Zoltan Gyongyi, Pavel Berkhin, Hector Garcia-Molina, and Jan Pedersen. Link spamdetection based on mass estimation. In Proceedings of the 32nd International Conferenceon Very Large Data Bases, Seoul, Korea, September 2006.
145
Bibliography
[57] Mark Handley, Christian Kreibich, and Vern Paxson. Network intrusion detection:Evasion, traffic normalization, and end-to-end protocol semantics. In Proceedings ofUSENIX Security Symposium, 2001.
[58] Honeynet Project. Know Your Enemy: Honeynets. http://project.honeynet.org/papers/honeynet/, May 2006.
[59] Hotline communications. http://en.wikipedia.org/wiki/Hotline
Connect.
[60] Yang hua Chu, Sanjay G. Rao, Srinivasan Seshan, and Hui Zhang. Enabling Con-ferencing Applications on the Internet using an Overlay Multicast Architecture. InProceedings of the ACM SIGCOMM Conference, San Diego, CA, USA, 2001.
[61] Qiang Huang, Helen Wang, and Nikita Borisov. Privacy-preserving friends trou-bleshooting network. In Proceedings of the Symposium on Network and Distributed Sys-tems Security, February 2005.
[62] imesh. http://www.imesh.com.
[63] P. Judge and M. Ammar. Gothic: A group access control architecture for secure multi-cast and anycast. In Proceedings of IEEE INFOCOM’02, 2002.
[64] Jaeyeon Jung, Vern Paxson, Arthur W. Berger, and Hari Balakrishnan. Fast PortscanDetection Using Sequential Hypothesis Testing. In Proceedings of the IEEE Symposiumon Security and Privacy, 2004.
[65] Srikanth Kandula, Sankalp Singh, and Dheeraj Sanghi. Argus – A Distributed Net-work Intrusion Detection System. In Proceedings of USENIX SANE, 2002.
[66] Thomas Karagiannis, Andre Broido, Michalis Faloutsos, and Kc claffy. Transport layeridentification of p2p traffic. In Proceedings of Internet Measurement Workshop (IMC’04),Oct 2004.
[67] Vijay Karamcheti, Davi Geiger, Zvi Kedem, and S. Muthukrishnan. Detecting mali-cious network traffic using inverse distributions of packet contents. In Proceedings ofACM SIGCOMM MineNet Workshop (MineNet’05), 2005.
[68] Kazaa. http://kazaa.com.
146
Bibliography
[69] Lea Kissner, Hyang-Ah Kim, Dawn Song, Oren Dobzinski, and Anat Talmy. Effi-cient, secure, and privacy-preserving hot item identification and publication. Tech-nical Report CMU-CS-05-159, Carnegie Mellon University, August 2005. http:
//www.cs.cmu.edu/∼leak/set-tech.pdf.
[70] Lea Kissner and Dawn Song. Privacy-preserving set operations. In Advances in Cryp-tology - CRYPTO 2005, Lecture Notes in Computer Science. Springer Verlag, August2005.
[71] Eddie Kohler, Jinyang Li, Vern Paxson, and Scott Shenker. Observed structure of ad-dresses in ip traffic. In Proceedings of the SIGCOMM Internet Measurement Workshop(IMW), 2002.
[72] Jack Koziol. Intrusion Detection With Snort. Sams Publishing, 2003.
[73] C. Kreibich and J. Crowcroft. Honeycomb—Creating Intrusion Detection SignaturesUsing Honeypots. In Proceedings of the 2nd Workshop on Hot Topics in Networks (HotNets-II), 2003.
[74] Christian Kreibich and Robin Sommer. Policy-controlled event management for dis-tributed intrusion detection. In 4th International Workshop on Distributed Event-BasedSystems, 2005.
[75] Robert Lemos. Counting the Cost of Slammer. CNET news.com. http://news.com.com/2100-1001-982955.html, 2003.
[76] Zhichun Li, Manan Sanghi, Yan Chen, Ming-Yang Kao, and Brian Chzvez. Hamsa: fastsignature generation for zero-day polymorphic worms with provable attack resilience.In Proceedings of IEEE Symposium on Security and Privacy, May 2006.
[77] Z. Liang and R. Sekar. Fast and automated generation of attack signatures: A basis forbuilding self-protecting servers. In Proceedings of the 12th ACM Conference on Computerand Communications Security, 2005.
[78] Patrick Lincoln, Phillip Porras, and Vitaly Shmatikov. Privacy-preserving sharing andcorrelation of security alerts. In Proceedings of the 13th USENIX Security Symposium,pages 239–254, August 2004.
[79] LinkSleeve. LinkSleeve: SLV : Spam Link Verification. http://www.linksleeve.org, 2006.
147

Bibliography
[80] Madster. http://en.wikipedia.org/wiki/Madster.
[81] D. Mazıeres. A toolkit for user-level file systems. In Proceedings of the USENIX AnnualTechnical Conference, Boston, MA, June 2001.
[82] Alfred J. Menezes, Paul C. van Oorschot, and Scott A. Vanstone. Handbook of AppliedCryptography. CRC Press, October 1996.
[83] Messaging Anti-Abuse Working Group (MAAWG). Email Metrics Program: The Net-work Operators’ Perspective. http://www.maawg.org/email metrics report,June 2006.
[84] Alan Mislove, Gaurav Oberoi, Ansley Post, Charles Reis, Peter Druschel, and Dan S.Wallach. AP3: Cooperative, decentralized anonymous communication. In 11th ACMSIGOPS European Workshop, September 2004.
[85] D. Moore and C. Shannon. Code-Red: A Case Study on the Spread and Victims ofan Internet Worm. In Proceedings of ACM SIGCOMM Internet Measurement Workshop(IMW’02), 2002.
[86] David Moore. Network telescope. Technical Report tr-2004-04, CAIDA, 2002.
[87] David Moore, Vern Paxson, Stefan Savage, Colleen Shannon, Stuart Staniford, andNicholas Weaver. Inside the Slammer worm. IEEE Security and Privacy, 1(4):33–39,July 2003.
[88] David Moore and Colleen Shannon. The spread of the witty worm. IEEE Security andPrivacy, 2(4), July/August 2004.
[89] David Moore, Colleen Shannon, Geoffrey M. Voelker, and Stefan Savage. InternetQuarantine: Requirements for Containing Self-Propagating Code. In Proceedings ofIEEE INFOCOM, 2003.
[90] Mp2p technologies. http://www.mp2p.net.
[91] Athicha Muthitacharoen, Benjie Chen, and David Mazieres. A Low-bandwidth Net-work File System. In Proceedings of the 18th ACM Symposium on Operating SystemsPrinciples (SOSP’01), 2001.
[92] Napster.
148
Bibliography
[93] James Newsome, Brad Karp, and Dawn Song. Polygraph: Automatic signature gener-ation for polymorphic worms. In Proceedings of IEEE Security and Privacy Symposium,Oakland, CA USA, May 2005.
[94] James Newsome, Brad Karp, and Dawn Song. Thwarting signature learning by train-ing maliciously. In Proceedings of the 9th International Symposium On Recent Advances InIntrusion Detection (RAID’06), September 2006.
[95] James Newsome and Dawn Song. Dynamic taint analysis: Automatic detection, analy-sis, and signature generation of exploit attacks on commodity software. In Proceedingsof Network and Distributed System Security Symposium (NDSS’05), February 2005.
[96] D. Nojiri, J. Rowe, and K. Levitt. Cooperative response strategies for large scale attackmitigation. In Proceedings of the 3rd DARPA Information Survivability Conference andExposition, April 2003.
[97] Nowcom. Clubbox. http://www.clubbox.co.kr.
[98] Nucleus Research, Inc. Spam: The Silent ROI Killer, nucleus research note d59. http://nucleusresearch.com/research/d59.pdf, 2003.
[99] P2pradio. http://p2p-radio.sourceforge.net/.
[100] Pascal Paillier. Public-key cryptosystems based on composite degree residuosityclasses. In Proc. of Asiacrypt 2000, pages 573–84, 2000.
[101] Ruoming Pang, Vinod Yegneswaran, Paul Barford, Vern Paxson, and Larry Petterson.Characteristics of internet background radiation. In Proceedings of ACM Internet Mea-surement Conference (IMC’04), October 2004.
[102] Vern Paxson. Bro: A System for Detecting Network Intruders in Real-Time. ComputerNetworks, 31(23-24), 1999.
[103] Sophos Plc. The growing scale of the threat problem, A Sophos white paper. http://www.sophos.com/security/whitepapers, February 2006.
[104] Phillip A. Porras and Peter G. Neumann. EMERALD: event monitoring enabling re-sponses to anomalous live disturbances. In 1997 National Information Systems SecurityConference, oct 1997.
149
Bibliography
[105] Niels Provos. A Virtual Honeypot Framework. In Proceedings of the 13th USENIXSecurity Symposium, August 2004.
[106] T. H. Ptacek and T. N. Newsham. Insertion, evasion and denial of service: Eluding net-work intrusion detection. Secure Networks, Inc., http://www.aciri.org/vern/Ptacek-Newsham-Evasion-98.ps, January 1988.
[107] Ramneek Puri. Bots & Botnet: An Overview. http://www.sans.org/rr/
whitepapers/malicious/1299.php, December 2003.
[108] Michael O. Rabin. Fingerprinting by Random Polynomials. Technical Report TR-15-81, Center for Research in Computing Technology, Harvard University, 1981.
[109] S. Rafaeli and D. Hutchison. A survey of key management for secure group commu-nication. Journal of the ACM Computing Surveys, 35(3), 2003.
[110] Anirudh Ramachandran and Nick Feamster. Understanding the network-level behav-ior of spammers. In Proceedings of the ACM SIGCOMM Conference, September 2006.
[111] M G. Reed, P. F. Syverson, and D. M. Goldschlag. Anonymous connections and onionrouting. IEEE Journal on Selected Areas in Communication, Special Issue on Copyright andPrivacy Protection, 1998.
[112] Michael K. Reiter and Aviel D. Rubin. Crowds: Anonymity for web transactions. ACMTransactions on Information and System Security, June 1998.
[113] J. Reynolds. RFC 1135 - Helminthiasis of the Internet, December 1989.
[114] Stuart E. Schechter and Michael D. Smith. Access for sale: A new class of worm. InProceedings of the 1st Workshop on Rapid Malcode (WORM’03), Washington, DC, USA,October 2003.
[115] H. Schulzrinne, S. Casner, R. Frederick, and V. Jacobson. RFC 1889 - RTP: A TransportProtocol for Real-Time Applications, 1996.
[116] Adi Shamir. How to share a secret. Communications of the ACM, 22(11):612–613, 1979.
[117] Shareshare. http://www.shareshare.com.
[118] John Shoch and Jon Hupp. The ”Worm” Programs - Early Experience with a Dis-tributed Computation. Communications of the ACM, 25(3):172–180, March 1982.
150
Bibliography
[119] Sumeet Singh, Cristian Estan, George Varghese, and Stegan Savage. Automated wormfingerprinting. In Proceedings of 6th Symposium on Operating Systems Design and Imple-mentation, San Francisco, CA USA, December 2004.
[120] Steven R. Snapp, James Brentano, Gihan V. Dias, Terrance L. Goan, L. Todd Heberlein,Che-Lin Ho, Karl N. Levitt, Biswanath Mukherjee, Stephen E. Smaha, Tim Grance,Daniel M. Teal, and Doug Mansur. DIDS (Distributed Intrusion Detection System) –Motivation, Architecture, and An Early Prototype. In 14th National Computer SecurityConference, pages 167–176, October 1991.
[121] Robin Sommer and Vern Paxon. Exploiting independent state for network intrusiondetection. In Proceedings of ACSAC, 2005.
[122] Robin Sommer and Vern Paxson. Enhancing byte-level network intrusion detectionsignatures with context. In Proceedings of the 10th ACM Conference on Computer andCommunications Security, October 2003.
[123] Dawn Song. Practical forward secure group signature schemes. In Proceedings of the8th ACM conference on Computer and Communication Security, November 2001.
[124] Soribada. http://www.soribada.com.
[125] Lance Spitzner. Honeypots - definitions and value of honeypots. http://www.
tracking-hackerts.com/papers/honeypots.html, May 2003.
[126] S. Staniford, J. A. Hoagland, and J. M. McAlerney. Practical Automated Detection ofStealthy Portscans. Journal of Computer Security, 10(1-2), 2002.
[127] S. Staniford, V. Paxson, and N. Weaver. How to 0wn the Internet in Your Spare Time.In Proceedings of the 11th USENIX Security Symposium, 2002.
[128] Stuart Staniford. Containment of scanning worms in enterprise networks. Journal ofComputer Security, 2005.
[129] S. Staniford-Chen, S. Cheung, R. Crawford, M. dilger, J. Frank, J. Hoagland, K. Levitt,C. Wee, R. Yip, and D. Zerkle. Grids - a graph-based intrusion detection system forlarge networks. In Proceedings of the 19th National Information Systems Security Confer-ence, October 1996.
151

Bibliography
[130] Tatter & Company. EAS - Eolin Antispam Service. http://antispam.eolin.com,2006.
[131] The Snort Project. Snort, The Open-Source Network Intrusion Detection System.http://www.snort.org/.
[132] Robert Vamosi. Botnets for sale. http://reviews.cnet.com/4520-3513
7-6719515-1.html?part=rss&subj=edfeat&tag=Botnets+for+sale,March 2007.
[133] Vipul Ved Prakash. Vipul’s Razor. http://razor.sourceforge.net, 1999.
[134] Michael Vrable, Justin Ma, Jay Chen, David Moore, Erik Vandekieft, Alex C. Snoeren,Geoffrey M. Voelker, and Stefan Savage. Scalability, fidelity, and containment in thepotemkin virtual honeyfarm. In Proceedings of the 20th ACM Symposium on OperatingSystems Principles, 2005.
[135] vshare. http://www.vshare.com.
[136] Helen J. Wang, Chuanxiong Guo, Daniel R. Simon, and Alf Zugenmaier. Shield:vulnerability-driven network filters for preventing known vulnerability exploits. InProceedings of ACM SIGCOMM Conference, Portland, OR, USA, August 2004.
[137] Helen J. Wang, Yih-Chun Hu, Chun Yuan, Zheng Zhang, and Yi-Min Wang. Friendstroubleshooting network: Towards privacy-preserving, automatic troubleshooting. InProceedings of IPTPS, February 2004.
[138] Ke Wang, Gabriela Cretu, and Salvatore J. Stolfo. Anomalous payload-based networkintrusion detection. In Proceedings of the 7th International Symposium on Recent Advancein Intrusion Detection, September 2004.
[139] Ke Wang, Gabriela Cretu, and Salvatore J. Stolfo. Anomalous payload-based wormdetection and signature generation. In Proceedings of the 8th International Symposium onRecent Advance in Intrusion Detection, September 2005.
[140] N. C. Weaver. Warhol Worms: The Potential for Very Fast Internet Plagues. http:
//www.cs.berkeley.edu/∼nweaver/warhol.html.
[141] Nicholas Weaver, Stuart Staniford, and Vern Paxson. Very fast containment of scan-ning worms. In Proceedings of the 13th Usenix Security Symposium (Security 2004), Au-gust 2004.
152

Bibliography
[142] Brian White, Jay Lepreau, Leigh Stoller, Robert Ricci, Shashi Guruprasad, Mac New-bold, Mike Hibler, Chad Barb, and Abhijeet Joglekar. An integrated experimentalenvironment for distributed systems and networks. In Proc. of the Fifth Symposium onOperating Systems Design and Implementation, pages 255–270, Boston, MA, December2002. USENIX Association.
[143] Davey Winder. Battle of the botnets. http://www.daniweb.com/blogs/
entry1464.html, May 2007.
[144] Winmx. http://www.winmx.com.
[145] J. Wu, S. Vangala, L. Gao, and K. Kwiat. An Effective Architecture and Algorithmfor Detecting Worms with Various Scan Techniques. In Proceedings of the Network andDistributed System Security Symposium (NDSS’04), 2004.
[146] Vinod Yegneswaran, Paul Barford, and Somesh Jha. Global Intrusion Detection in theDOMINO Overlay System. In Proceedings of Network and Distributed System SecuritySymposium (NDSS 2004), 2004.
[147] Vinod Yegneswaran, Jonathon T. Griffin, Paul Barford, and Somesh Jha. An archi-tecture for generating semantics-aware signatures. In Proceedings of USENIX SecuritySymposium (Security’06), 2006.
[148] C. Zou, L. Gao, W. Gong, and D. Towsley. Monitoring and early warning for inter-net worms. In Proceedings of the 10th ACM conference on Computer and CommunicationSecurity, pages 190–199, 2003.
153


![[reports-archive.adm.cs.cmu.edu] - Carnegie Mellon …reports-archive.adm.cs.cmu.edu/anon/anon/usr0/ftp/2004/CMU-CS-04... · Seeing-Is-Believing: Using Camera Phones for Human-Verifiable](https://static.fdocuments.in/doc/165x107/5b3626e67f8b9abc218e2b14/reports-carnegie-mellon-reports-seeing-is-believing-using-camera-phones.jpg)


