Reportins Services 2008R2 Nuevas Caracteristicas
93
Hands-On Lab Using the New Features of Reporting Services 2008 R2 Lab version: 1.0.0 Last updated: 7/11/2011
-
Upload
marco-a-acedo-canton -
Category
Documents
-
view
227 -
download
0
Transcript of Reportins Services 2008R2 Nuevas Caracteristicas
8/6/2019 Reportins Services 2008R2 Nuevas Caracteristicas
http://slidepdf.com/reader/full/reportins-services-2008r2-nuevas-caracteristicas 1/93
Hands-On Lab
Using the New Features of Reporting Services 2008 R2
Lab version: 1.0.0
Last updated: 7/11/2011
8/6/2019 Reportins Services 2008R2 Nuevas Caracteristicas
http://slidepdf.com/reader/full/reportins-services-2008r2-nuevas-caracteristicas 2/93
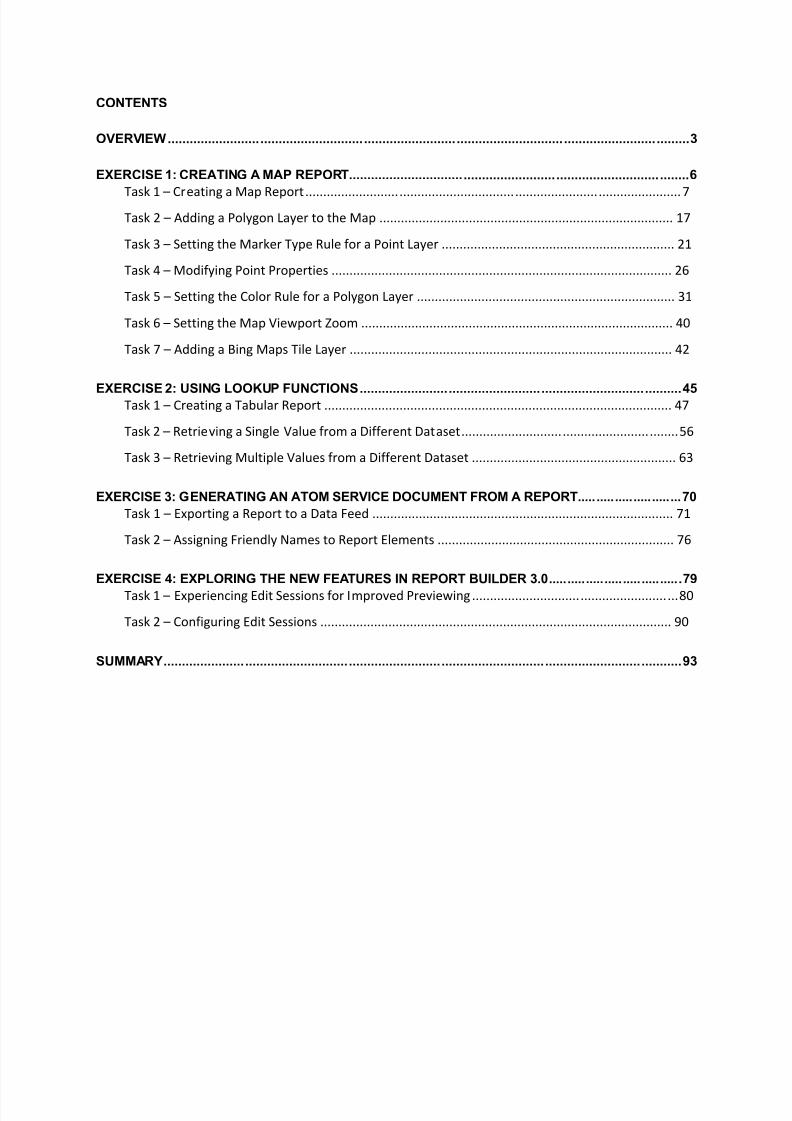
CONTENTS
OVERVIEW ............................................................................................................................................. 3
EXERCISE 1: CREATING A MAP REPORT............................................................................................ 6
Task 1 Creating a Map Report .......................... ................................ ....................... ....................... 7Task 2 Adding a Polygon Layer to the Map .................................................................................. 17
Task 3 Setting the Marker Type Rule for a Point Layer ................................................................. 21
Task 4 Modifying Point Properties ............................................................................................... 26
Task 5 Setting the Color Rule for a Polygon Layer ........................................................................ 31
Task 6 Setting the Map Viewport Zoom ....................................................................................... 40
Task 7 Adding a Bing Maps Tile Layer .......................................................................................... 42
EXERCISE 2: USING LOOKUP FUNCTIONS ....................................................................................... 45 Task 1 Creating a Tabular Report ................................................................................................. 47
Task 2 Retrieving a Single Value from a Different Dataset ............................ ........................ ........ 56
Task 3 Retrieving Multiple Values from a Different Dataset ......................................................... 63
EXERCISE 3: GENERATING AN ATOM SERVICE DOCUMENT FROM A REPORT ............................ 70
Task 1 Exporting a Report to a Data Feed .................................................................................... 71
Task 2 Assigning Friendly Names to Report Elements .................................................................. 76
EXERCISE 4: EXPLORING THE NEW FEATURES IN REPORT BUILDER 3.0 .................................... 79
Task 1 Experiencing Edit Sessions for Improved Previewing .............................. ........................ ... 80
Task 2 Configuring Edit Sessions .................................................................................................. 90
SUMMARY ............................................................................................................................................ 93
8/6/2019 Reportins Services 2008R2 Nuevas Caracteristicas
http://slidepdf.com/reader/full/reportins-services-2008r2-nuevas-caracteristicas 3/93
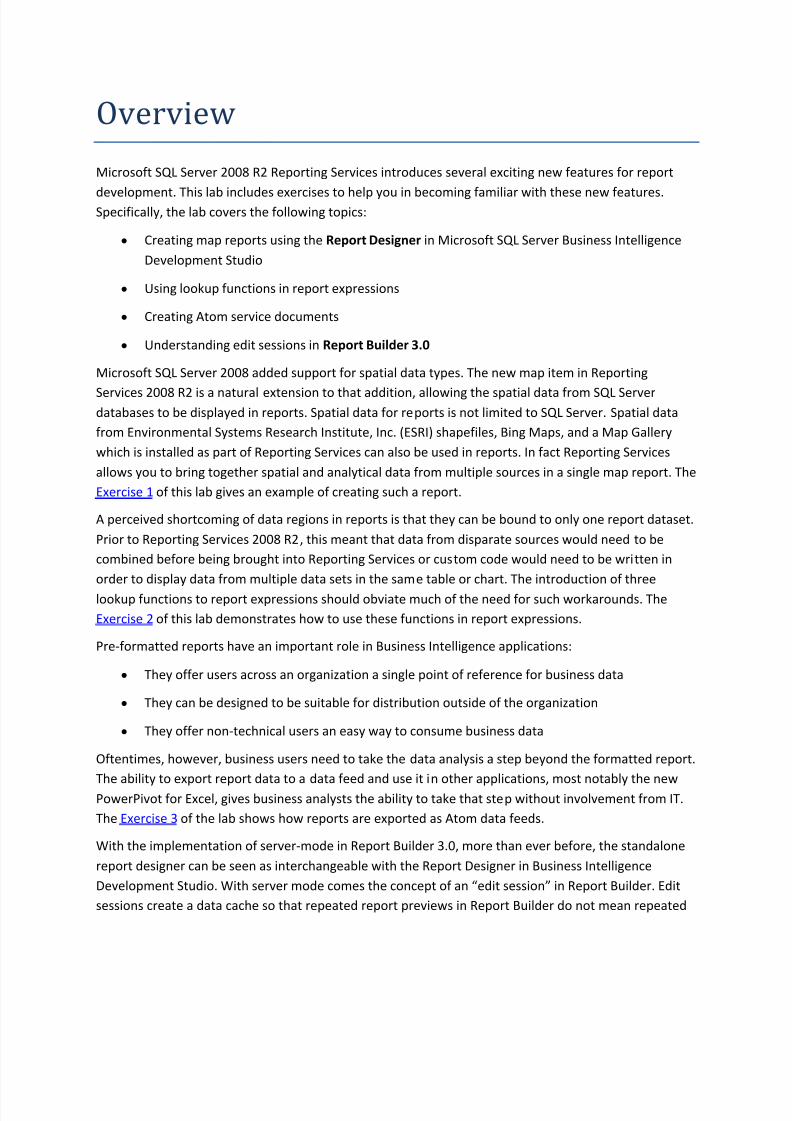
Overview
Microsoft SQL Server 2008 R2 Reporting Services introduces several exciting new features for report
development. This lab includes exercises to help you in becoming familiar with these new features.Specifically, the lab covers the following topics:
y Creating map reports using the Report Designer in Microsoft SQL Server Business Intelligence
Development Studio
y Using lookup functions in report expressions
y Creating Atom service documents
y Understanding edit sessions in Report Builder 3.0
Microsoft SQL Server 2008 added support for spatial data types. The new map item in Reporting
Services 2008 R2 is a natural extension to that addition, allowing the spatial data from SQL Serverdatabases to be displayed in reports. Spatial data for reports is not limited to SQL Server. Spatial data
from Environmental Systems Research Institute, Inc. (ESRI) shapefiles, Bing Maps, and a Map Gallery
which is installed as part of Reporting Services can also be used in reports. In fact Reporting Services
allows you to bring together spatial and analytical data from multiple sources in a single map report. The
Exercise 1 of this lab gives an example of creating such a report.
A perceived shortcoming of data regions in reports is that they can be bound to only one report dataset.
Prior to Reporting Services 2008 R2, this meant that data from disparate sources would need to be
combined before being brought into Reporting Services or custom code would need to be written in
order to display data from multiple data sets in the same table or chart. The introduction of three
lookup functions to report expressions should obviate much of the need for such workarounds. The
Exercise 2 of this lab demonstrates how to use these functions in report expressions.
Pre-formatted reports have an important role in Business Intelligence applications:
y They offer users across an organization a single point of reference for business data
y They can be designed to be suitable for distribution outside of the organization
y They offer non-technical users an easy way to consume business data
Oftentimes, however, business users need to take the data analysis a step beyond the formatted report.
The ability to export report data to a data feed and use it in other applications, most notably the new
PowerPivot for Excel, gives business analysts the ability to take that step without involvement from IT.
The Exercise 3 of the lab shows how reports are exported as Atom data feeds.
With the implementation of server-mode in Report Builder 3.0, more than ever before, the standalone
report designer can be seen as interchangeable with the Report Designer in Business Intelligence
Development Studio. With server mode comes the concept of an edit session in Report Builder. Edit
sessions create a data cache so that repeated report previews in Report Builder do not mean repeated
8/6/2019 Reportins Services 2008R2 Nuevas Caracteristicas
http://slidepdf.com/reader/full/reportins-services-2008r2-nuevas-caracteristicas 4/93
query executions against the data source. This is an important time saver for reports with long running
queries when during the design phase the reports are frequently previewed as the layout and
formatting are adjusted. The new features of Report Builder 3.0 are reviewed in the introduction to
Exercise 4, and the exercise demonstrates a case when the data cache is used for the preview, and when
the cache is refreshed.
Objectives
In this lab you will learn to:
y Create reports displaying geospatial data
y Show data from multiple datasets in a single data region
y Export report data as Atom data feeds
y Benefit from edit sessions in Report Builder 3.0
System Requirements
You must have the following items installed to complete this lab:
y Microsoft SQL Server 2008 R2
Database engine
Reporting Services installed in Native or SharePoint Integrated mode (required only for
Exercise 3)
y SQL Server AdventureWorksDW2008R2 and AdventureWorks2008R2 sample databases
y Microsoft SQL Server 2008 R2 Management Studio
y Microsoft SQL Server Business Intelligence Development Studio
y Microsoft SQL Server 2008 R2 Rerport Builder 3.0
y Microsoft SharePoint 2010 (required only for Exercise 3)
Note: To display Bing map tiles in a report, the report server must be configured to access the Web in
order to access Microsoft Bing Maps Web Services.
8/6/2019 Reportins Services 2008R2 Nuevas Caracteristicas
http://slidepdf.com/reader/full/reportins-services-2008r2-nuevas-caracteristicas 5/93
Setup
All the requisites for this lab are verified using the Configuration Wizard. To make sure that everything is
correctly configured, follow these steps.
Note: To perform the setup steps you need to run the scripts in a command window with
administrator privileges.
1. Launch the Configuration Wizard for this Lab by running the Setup.cmd script located under the
Setup folder in the Source folder of this lab. Install any pre-requisites that are missing
(rescanning if necessary) and complete the wizard.
Note: The Configuration Wizard also creates the 'SQLServerTrainingKitAlias' sever alias used in
this lab to establish a connection with the database server.
Exercises
The following exercises are included in this Hands-On Lab:
1. Creating a Map Report
2. Using Lookup Functions
3. Generating an Atom Service Document from a Report (requires Microsoft SharePoint 2010)
4. Exploring the New Features in Report Builder 3.0.
Note: Inside each exercise you will find an end folder with the resulting solution you should obtain
after completing the exercise. The resulting solution in each exercise can be used as the starting point
for the subsequent exercise. You can use the solutions as a guide if you need additional help working
through the exercises.
Estimated time to complete this lab: 60 minutes.
8/6/2019 Reportins Services 2008R2 Nuevas Caracteristicas
http://slidepdf.com/reader/full/reportins-services-2008r2-nuevas-caracteristicas 6/93
Exercise 1: Creating a Map Report
To create a map report you use the Map item, which is available both in the Report Designer in Business
Intelligence Development Studio and in Report Builder 3.0. Dragging a map item from the Toolbox ontothe Design Surface in Report Designer launches theNew Map Layer wizard which guides you through
the steps of adding a map to your report. The same wizard is launched when you choose the Map Item
from the Design Surface in Report Builder 3.0.
Reporting Services maps are comprised of layers. There are four types of layers, each corresponding to
the different types of spatial data that can be displayed in Reporting Services maps:
1. Polygon the polygon layer is used to show enclosed areas such as countries or states. A
polygon layer in a planar system could also be used to draw shapes such as the rectangles of a
heat map
2. Line the line layer is used for displaying paths or routes
3. Point the point layer is used to display specific locations on a map or a specific coordinate on a
plane
4. Tile tile layers are used to display Bing maps in reports
Each map has at least one layer. The Map Wizard guides users through the configuration of one map
layer. After the map is created, additional layers can be added using the Layer Wizard.
The first step of the Wizard is to specify the source of spatial data for the map. There are three possible
sources for spatial data:
1. Map Gallery The Map Gallery refers to a set of Reporting Services reports which contain
embedded spatial data. By selecting a map from the Map Gallery as the source of spatial data,
the spatial data from the map gallery report is in turn embedded in the report being created. By
default the Map Gallery for the Report Designer is installed in the folder
%ProgramFiles(x86)%\Microsoft Visual Studio
9.0\Common7\IDE\PrivateAssemblies\MapGallery. The Map Gallery for Report Builder is
installed, by default, in the folder%ProgramFiles(x86)%\Microsoft SQL Server\Report Builder
3.0\MapGallery.
2. ESRI Shapefile The Environmental Systems Research Institute, Inc. (ESRI) developed and
regulates a spatial data format for geographic data. According to the specification, the
geographic data is stored in a set of files. Reporting Services requires two files: a .SHP file and a
.DBF file. The ESRI specification includes additional files such as a .SHX file or .PRJ file which are
not required by Reporting Services. The data from an ESRI shapefile can be embedded in the
report or it can be retrieved dynamically at runtime if the .SHP and .DBF files are stored in an
accessible location. For a SharePoint integrated instance of Reporting Services this might be a
shared document library.
8/6/2019 Reportins Services 2008R2 Nuevas Caracteristicas
http://slidepdf.com/reader/full/reportins-services-2008r2-nuevas-caracteristicas 7/93
3. SQL Server Spatial Query Spatial data stored in SQLGeometry or SQLGeography columns of a
SQL Server relational database table can be used as the source data for maps.
In this exercise, you will use the Report Designer to create a map report sourced from both the Map
Gallery and a SQL Server spatial query. For this you will be using Business Intelligence Development
Studio. A solution has been created that contains the report project that would result from completing
this exercise.
Note: Although this exercise walks through the steps of creating the report using Business Intelligence
Development Studio, the map report can just as easily be created using Report Builder 3.0.
Task 1 Creating a Map Report
1. Start SQL Server Business Intelligence Development Studio from Start | All Programs |
Microsoft SQL Server 2008 R2.
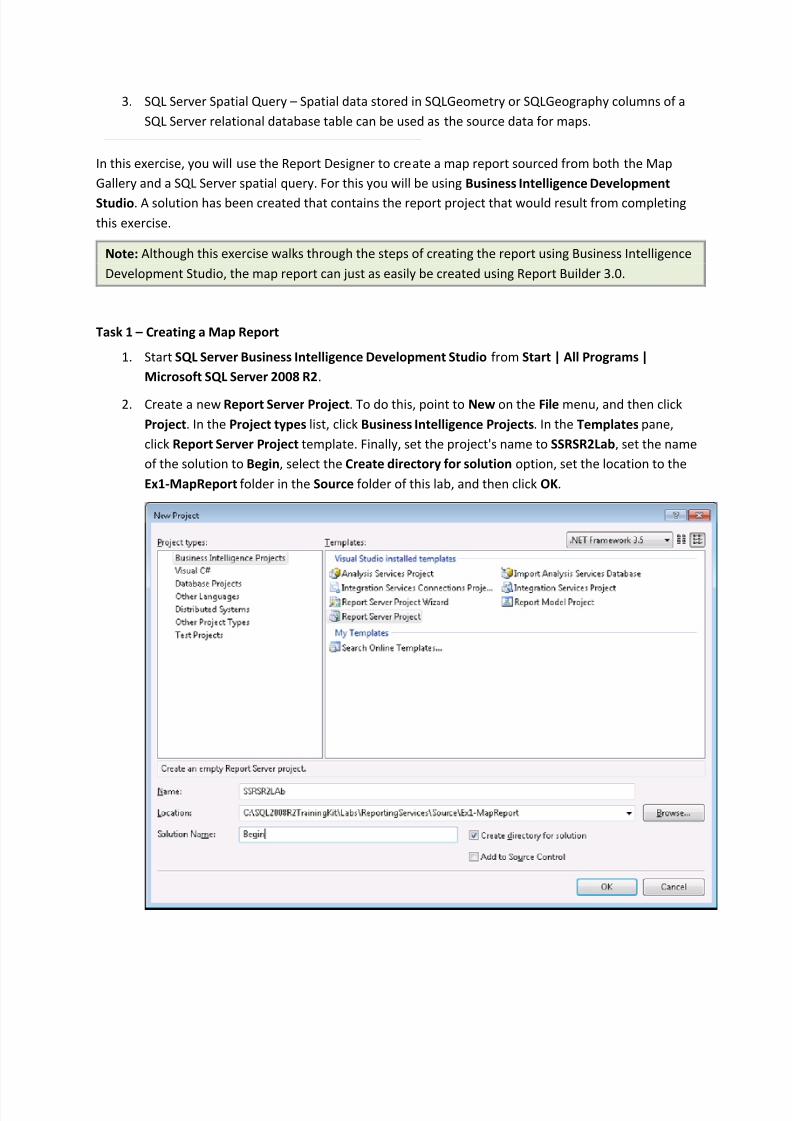
2. Create a new Report Server Project. To do this, point to New on the File menu, and then click
Project. In the Project types list, click Business Intelligence Projects. In the Templates pane,
click Report Server Project template. Finally, set the project's name to SSRSR2Lab, set the name
of the solution to Begin, select the Create directory for solution option, set the location to the
Ex1-MapReport folder in the Source folder of this lab, and then click OK.
8/6/2019 Reportins Services 2008R2 Nuevas Caracteristicas
http://slidepdf.com/reader/full/reportins-services-2008r2-nuevas-caracteristicas 8/93
Figure 1
Creating a new Report Server Project
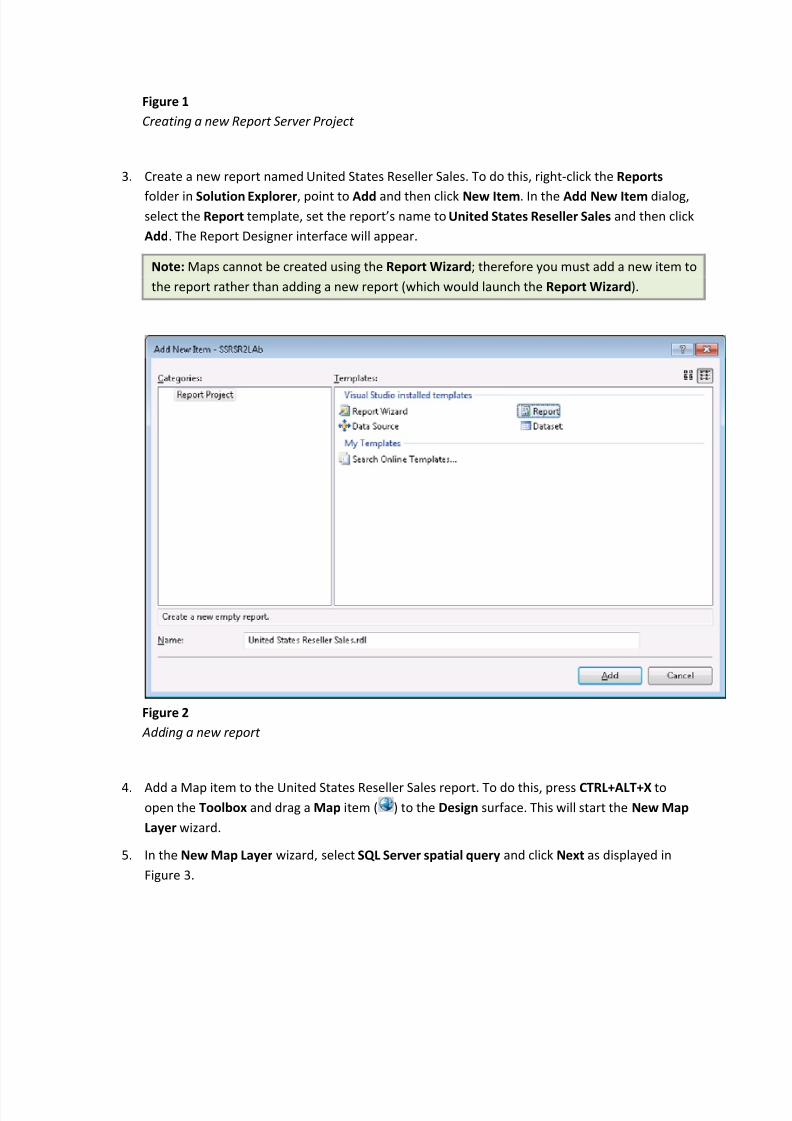
3. Create a new report namedUnited States Reseller Sales. To do this, right-click the Reports
folder in Solution Explorer, point to Add and then click New Item. In the Add New Item dialog,select the Report template, set the reports name to United States Reseller Sales and then click
Add. The Report Designer interface will appear.
Note: Maps cannot be created using the Report Wizard; therefore you must add a new item to
the report rather than adding a new report (which would launch the Report Wizard).
Figure 2
Add ing a new report
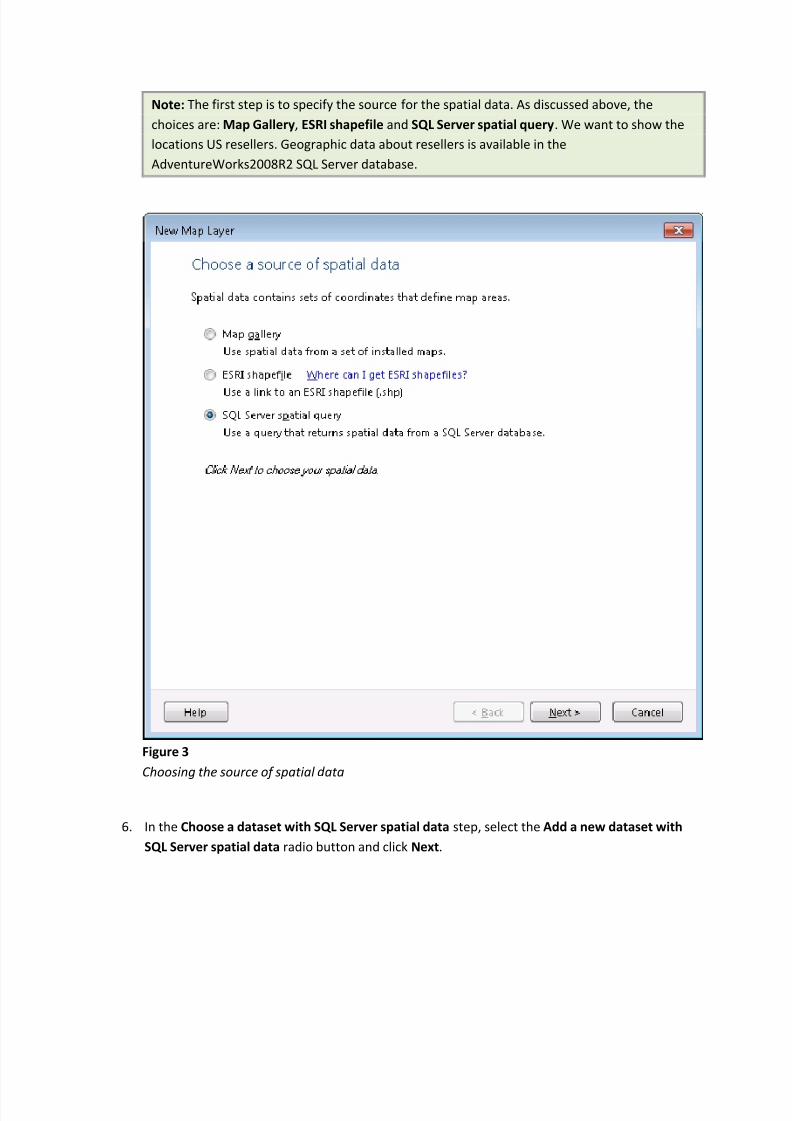
4. Add a Map item to the United States Reseller Sales report. To do this, press CTRL+ALT+X to
open the Toolbox and drag a Map item ( ) to the Design surface. This will start the New Map
Layer wizard.
5. In the New Map Layer wizard, select SQL Server spatial query and click Next as displayed in
Figure 3.
8/6/2019 Reportins Services 2008R2 Nuevas Caracteristicas
http://slidepdf.com/reader/full/reportins-services-2008r2-nuevas-caracteristicas 9/93
Note: The first step is to specify the source for the spatial data. As discussed above, the
choices are: Map Gallery, ESRI shapefile and SQL Server spatial query. We want to show the
locations US resellers. Geographic data about resellers is available in the
AdventureWorks2008R2 SQL Server database.
Figure 3
Choosing the source of spatial d ata
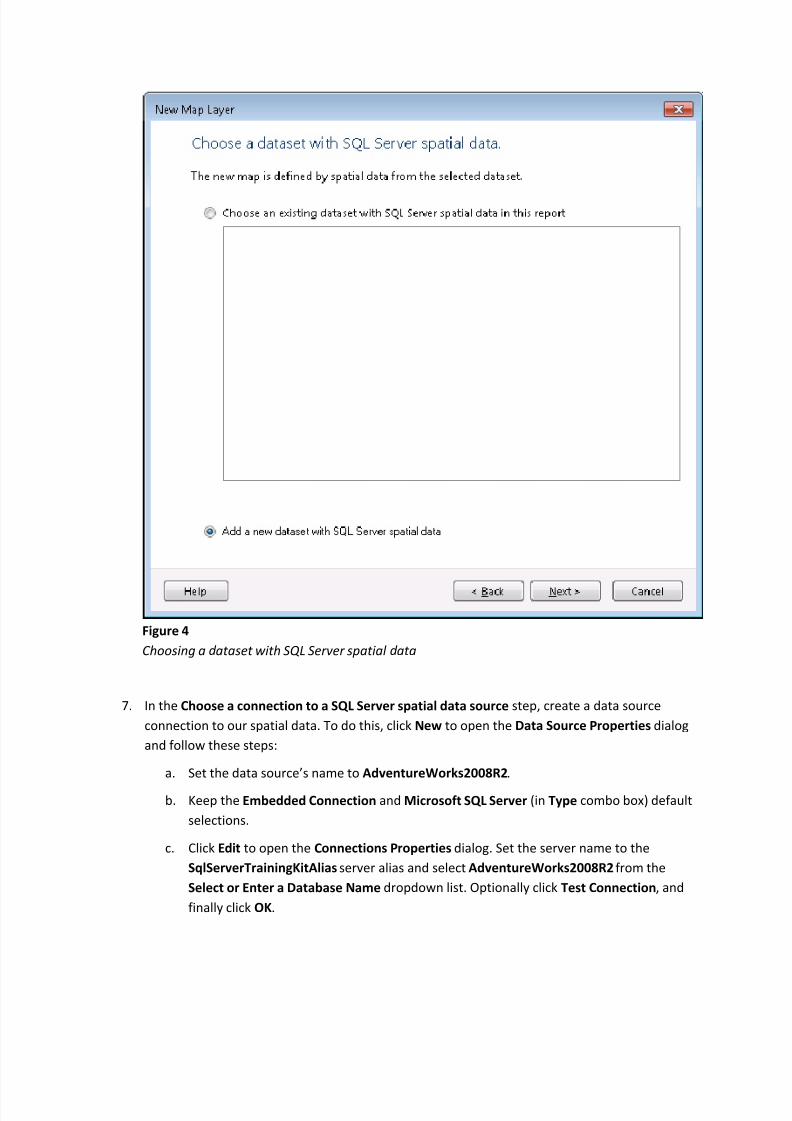
6. In the Choose a dataset with SQL Server spatial data step, select the Add a new dataset with
SQL Server spatial data radio button and click Next.
8/6/2019 Reportins Services 2008R2 Nuevas Caracteristicas
http://slidepdf.com/reader/full/reportins-services-2008r2-nuevas-caracteristicas 10/93
Figure 4
Choosing a d ataset with SQL Server spatial d ata
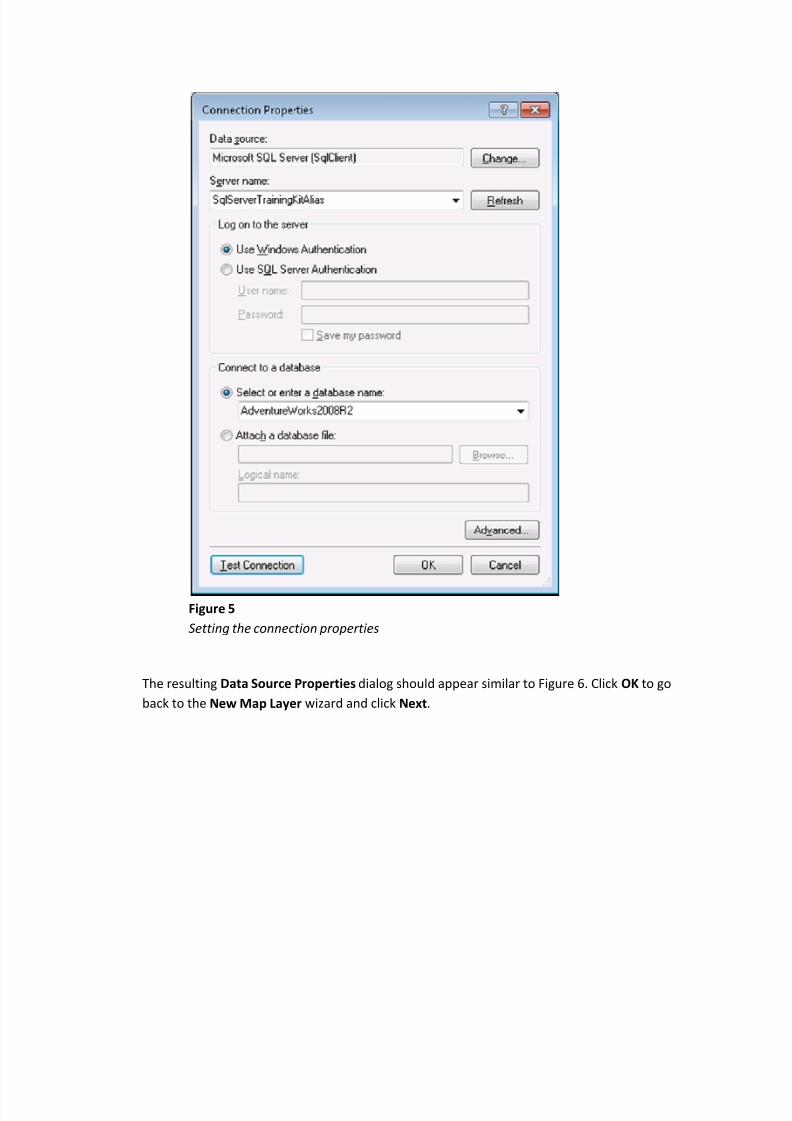
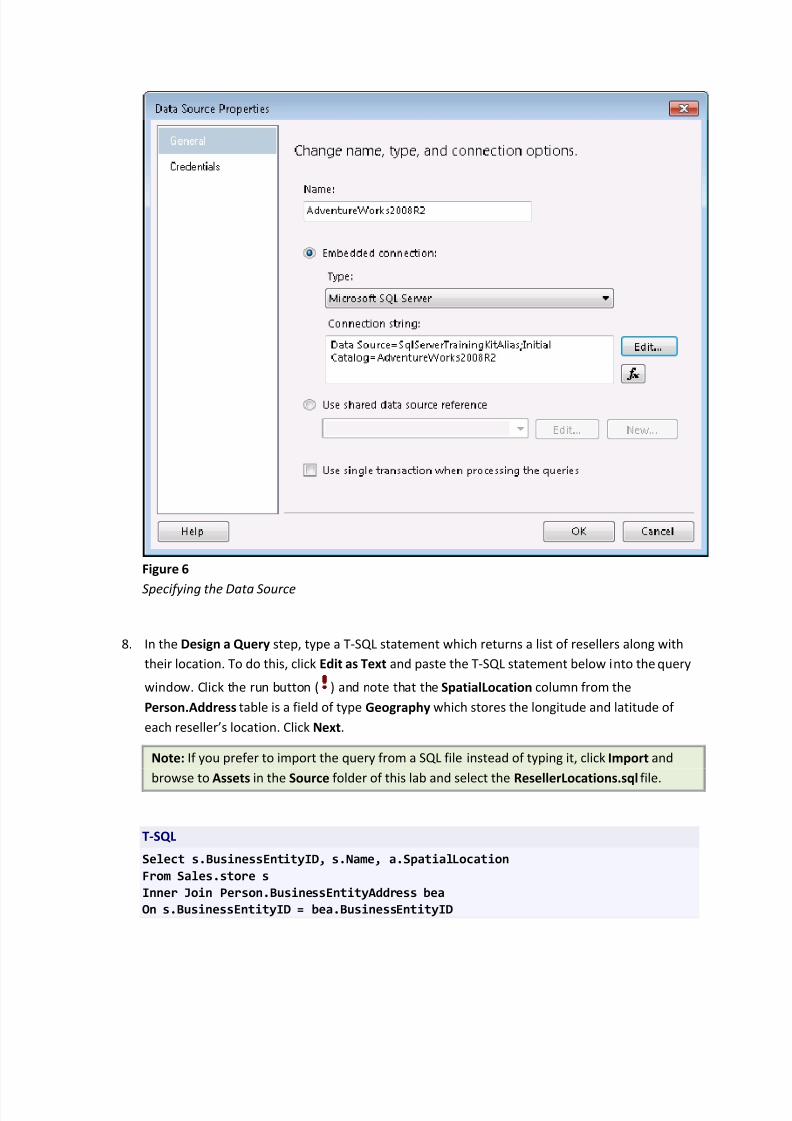
7. In the Choose a connection to a SQL Server spatial data source step, create a data source
connection to our spatial data. To do this, click New to open the Data Source Properties dialog
and follow these steps:
a. Set the data sources name to AdventureWorks2008R2.
b. Keep the Embedded Connection and Microsoft SQL Server (in Type combo box) default
selections.
c. Click Edit to open the Connections Properties dialog. Set the server name to the
SqlServerTrainingKitAlias server alias and select AdventureWorks2008R2 from the
Select or Enter a Database Name dropdown list. Optionally click Test Connection, and
finally click OK.
8/6/2019 Reportins Services 2008R2 Nuevas Caracteristicas
http://slidepdf.com/reader/full/reportins-services-2008r2-nuevas-caracteristicas 11/93
Figure 5
Setting the connection properties
The resulting Data Source Properties dialog should appear similar to Figure 6. Click OK to go
back to the New Map Layer wizard and click Next.
8/6/2019 Reportins Services 2008R2 Nuevas Caracteristicas
http://slidepdf.com/reader/full/reportins-services-2008r2-nuevas-caracteristicas 12/93
Figure 6
Specifying the Data Source
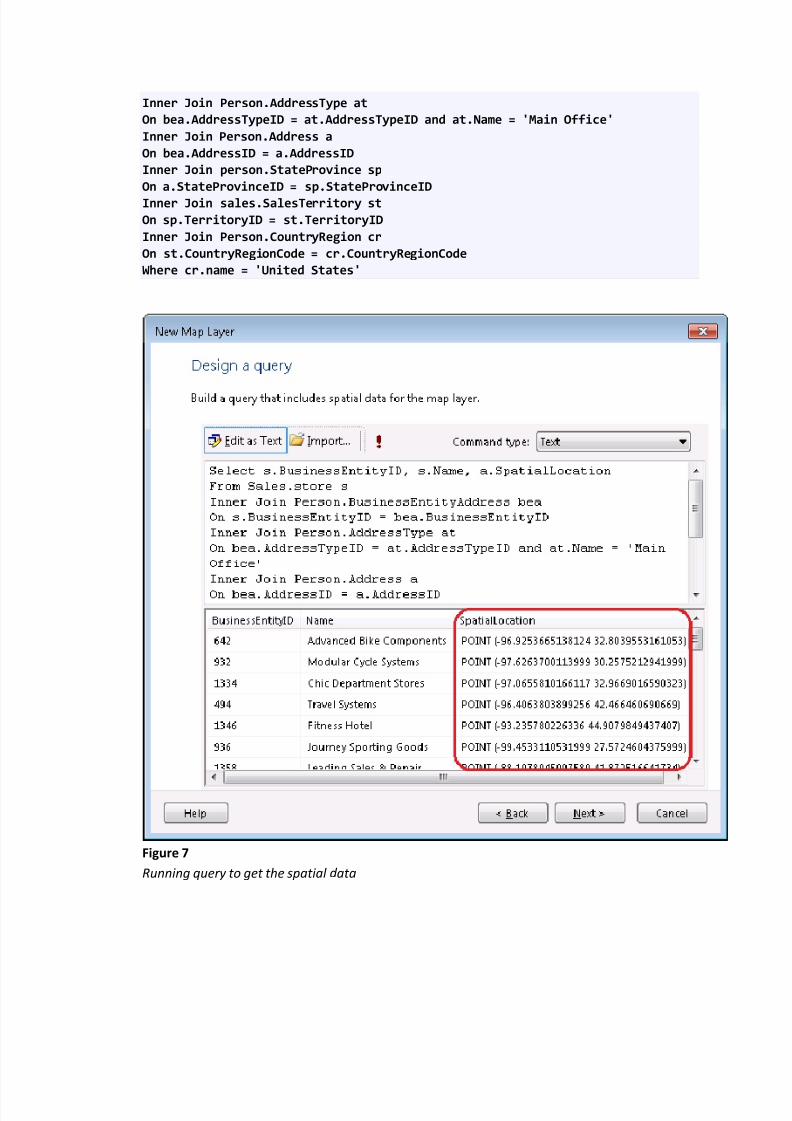
8. In the Design a Query step, type a T-SQL statement which returns a list of resellers along with
their location. To do this, click Edit as Text and paste the T-SQL statement below into thequery
window. Click the run button ( ) and note that the SpatialLocation column from the
Person.Address table is a field of type Geography which stores the longitude and latitude of
each resellers location. ClickNext.
Note: If you prefer to import the query from a SQL file instead of typing it, click Import and
browse to Assets in the Source folder of this lab and select the ResellerLocations.sql file.
T-SQL
Select s.BusinessEntityID, s.Name, a.SpatialLocation
From Sales.store s
Inner Join Person.BusinessEntityAddress bea
On s.BusinessEntityID = bea.BusinessEntityID
8/6/2019 Reportins Services 2008R2 Nuevas Caracteristicas
http://slidepdf.com/reader/full/reportins-services-2008r2-nuevas-caracteristicas 13/93
Inner Join Person.AddressType at
On bea.AddressTypeID = at.AddressTypeID and at.Name = 'Main Office'
Inner Join Person.Address a
On bea.AddressID = a.AddressID
Inner Join person.StateProvince sp
On a.StateProvinceID = sp.StateProvinceID
Inner Join sales.SalesTerritory st
On sp.TerritoryID = st.TerritoryID
Inner Join Person.CountryRegion cr
On st.CountryRegionCode = cr.CountryRegionCode
Where cr.name = 'United States'
Figure 7
Running query to get the spatial d ata
8/6/2019 Reportins Services 2008R2 Nuevas Caracteristicas
http://slidepdf.com/reader/full/reportins-services-2008r2-nuevas-caracteristicas 14/93
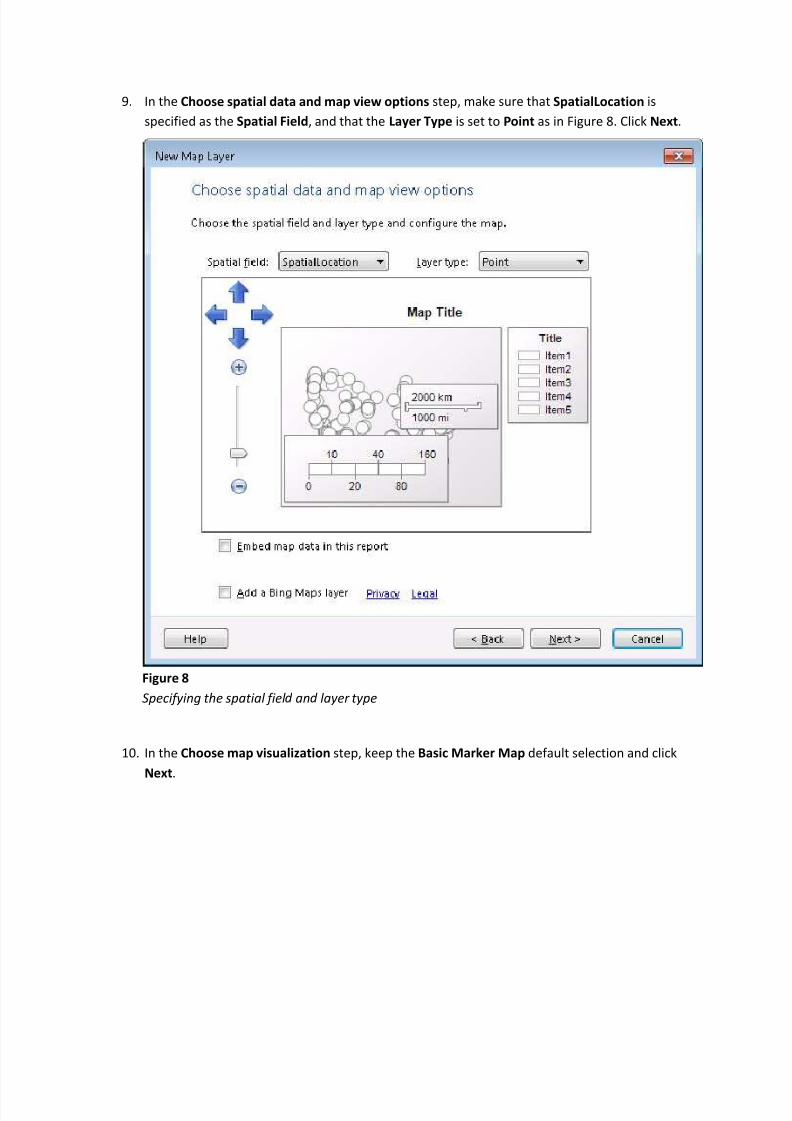
9. In the Choose spatial data and map view options step, make sure that SpatialLocation is
specified as the Spatial Field, and that the Layer Type is set to Point as in Figure 8. Click Next.
Figure 8
Specifying the spatial fiel d and layer type
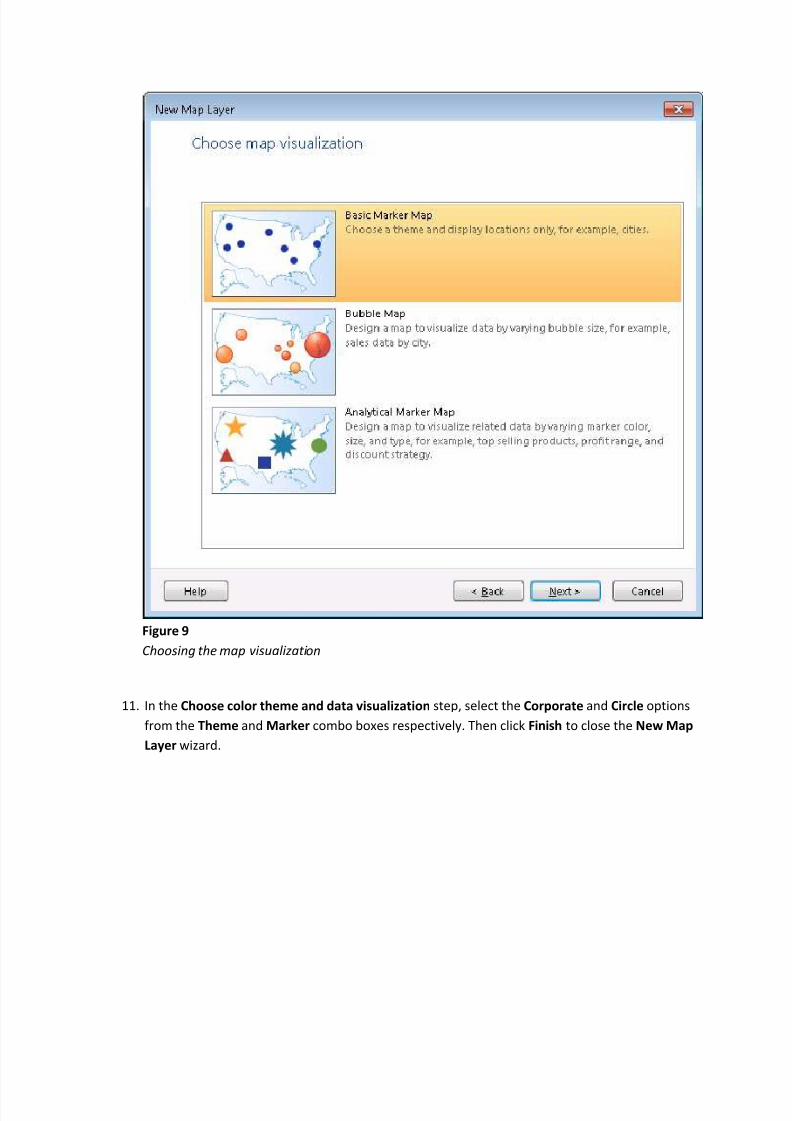
10. In the Choose map visualization step, keep the Basic Marker Map default selection and click
Next.
8/6/2019 Reportins Services 2008R2 Nuevas Caracteristicas
http://slidepdf.com/reader/full/reportins-services-2008r2-nuevas-caracteristicas 15/93
Figure 9
Choosing the map visualization
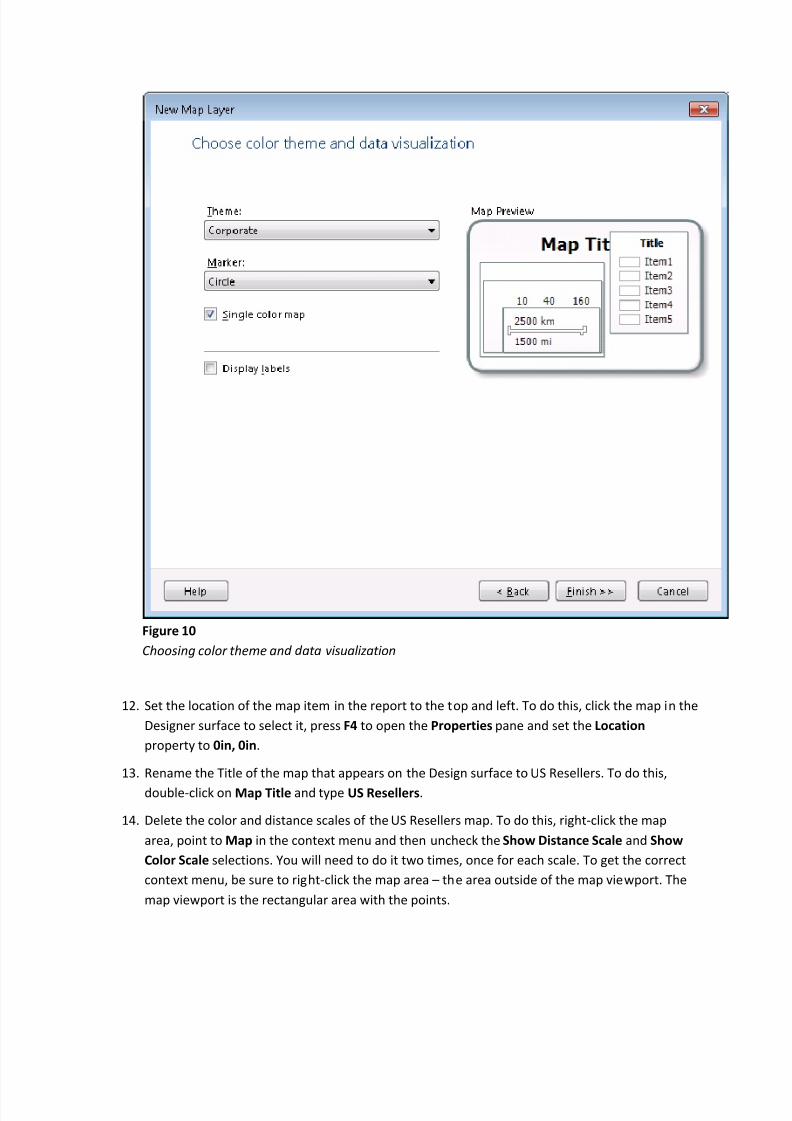
11. In the Choose color theme and data visualization step, select the Corporate and Circle options
from the Theme and Marker combo boxes respectively. Then click Finish to close the New Map
Layer wizard.
8/6/2019 Reportins Services 2008R2 Nuevas Caracteristicas
http://slidepdf.com/reader/full/reportins-services-2008r2-nuevas-caracteristicas 16/93
Figure 10
Choosing color theme and d ata visualization
12. Set the location of the map item in the report to the top and left. To do this, click the map in the
Designer surface to select it, press F4 to open the Properties pane and set the Location
property to 0in, 0in.
13. Rename the Title of the map that appears on the Design surface toUS Resellers. To do this,
double-click on Map Title and type US Resellers.
14. Delete the color and distance scales of theUS Resellers map. To do this, right-click the map
area, point to Map in the context menu and then uncheck the Show Distance Scale and Show
Color Scale selections. You will need to do it two times, once for each scale. To get the correct
context menu, be sure to right-click the map area the area outside of the map viewport. The
map viewport is the rectangular area with the points.
8/6/2019 Reportins Services 2008R2 Nuevas Caracteristicas
http://slidepdf.com/reader/full/reportins-services-2008r2-nuevas-caracteristicas 17/93
Note: You can also delete the scales by selecting each of them in turn and pressing theDELETE
key.
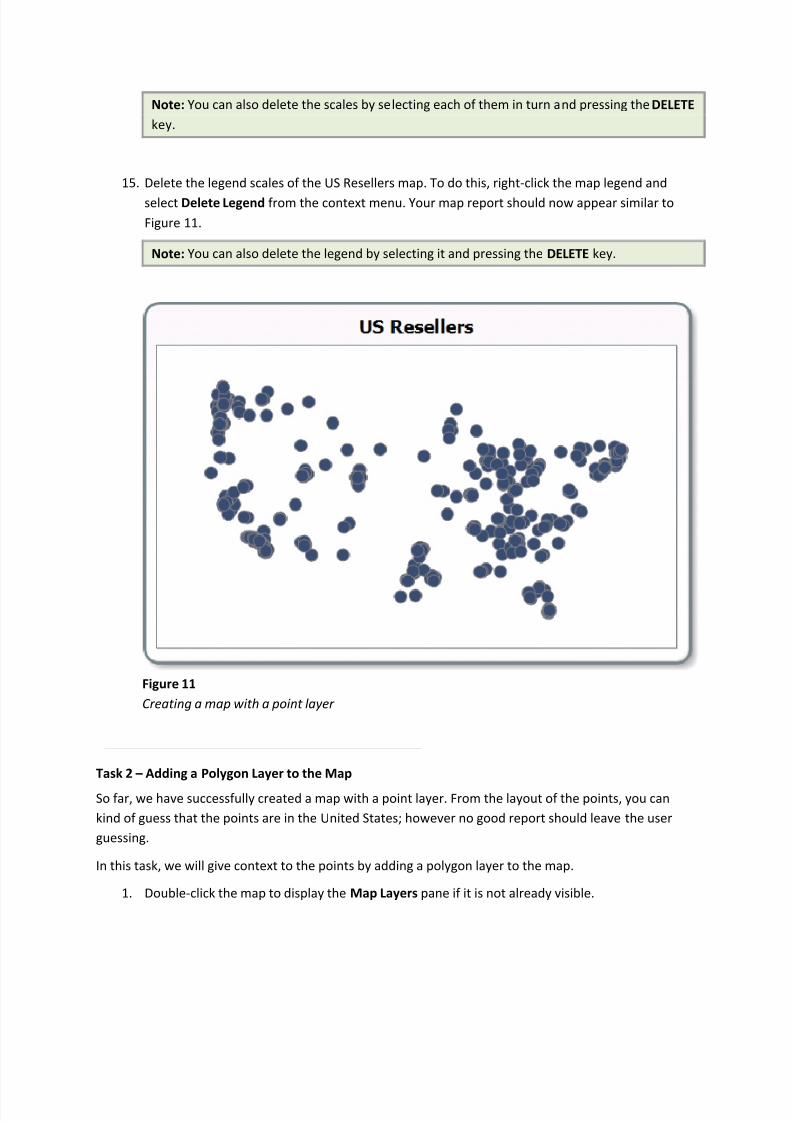
15. Delete the legend scales of theUS Resellers map. To do this, right-click the map legend and
select Delete Legend from the context menu. Your map report should now appear similar to
Figure 11.
Note: You can also delete the legend by selecting it and pressing the DELETE key.
Figure 11
Creating a map with a point layer
Task 2 Adding a Polygon Layer to the Map
So far, we have successfully created a map with a point layer. From the layout of the points, you can
kind of guess that the points are in the United States; however no good report should leave the user
guessing.
In this task, we will give context to the points by adding a polygon layer to the map.
1. Double-click the map to display the Map Layers pane if it is not already visible.

8/6/2019 Reportins Services 2008R2 Nuevas Caracteristicas
http://slidepdf.com/reader/full/reportins-services-2008r2-nuevas-caracteristicas 18/93
Figure 12
Showing the Map Layers pane
2. Click New layer wizard to open again the New Map Layer wizard this is the leftmost icon ( )
in the Map Layers zone.
3.
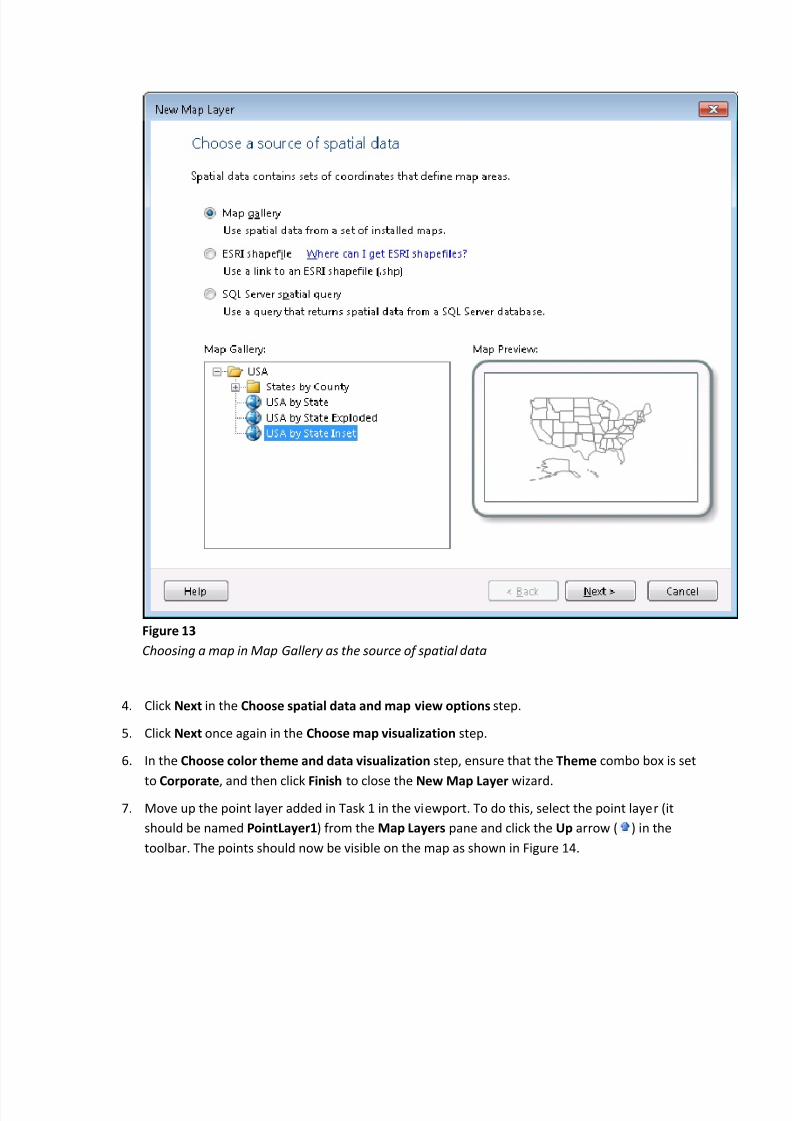
In theC
hoose a source of spatial data step, select Map Gallery as the source for our spatialdata. To do this, select the Map Gallery radio button (which should already selected by default),
select the USA by State Inset map in the Map Gallery navigation box and then click Next.
8/6/2019 Reportins Services 2008R2 Nuevas Caracteristicas
http://slidepdf.com/reader/full/reportins-services-2008r2-nuevas-caracteristicas 19/93
Figure 13
Choosing a map in Map Gallery as the source of spatial d ata
4. Click Next in the Choose spatial data and map view options step.
5. Click Next once again in the Choose map visualization step.
6. In the Choose color theme and data visualization step, ensure that the Theme combo box is set
to Corporate, and then click Finish to close the New Map Layer wizard.
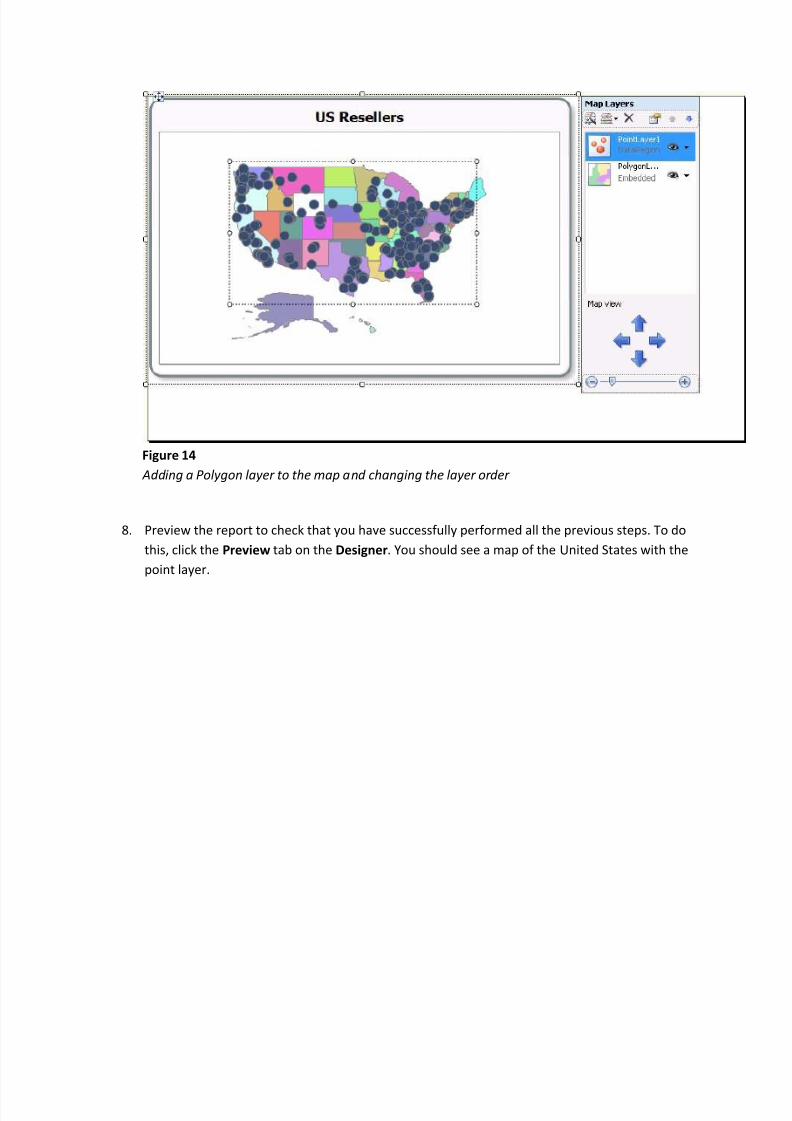
7. Move up the point layer added in Task 1 in the viewport. To do this, select the point layer (it
should be named PointLayer1) from the Map Layers pane and click the Up arrow ( ) in the
toolbar. The points should now be visible on the map as shown in Figure 14.
8/6/2019 Reportins Services 2008R2 Nuevas Caracteristicas
http://slidepdf.com/reader/full/reportins-services-2008r2-nuevas-caracteristicas 20/93
Figure 14
Add ing a Polygon layer to the map and changing the layer or d er
8. Preview the report to check that you have successfully performed all the previous steps. To do
this, click the Preview tab on the Designer. You should see a map of the United States with the
point layer.
8/6/2019 Reportins Services 2008R2 Nuevas Caracteristicas
http://slidepdf.com/reader/full/reportins-services-2008r2-nuevas-caracteristicas 21/93
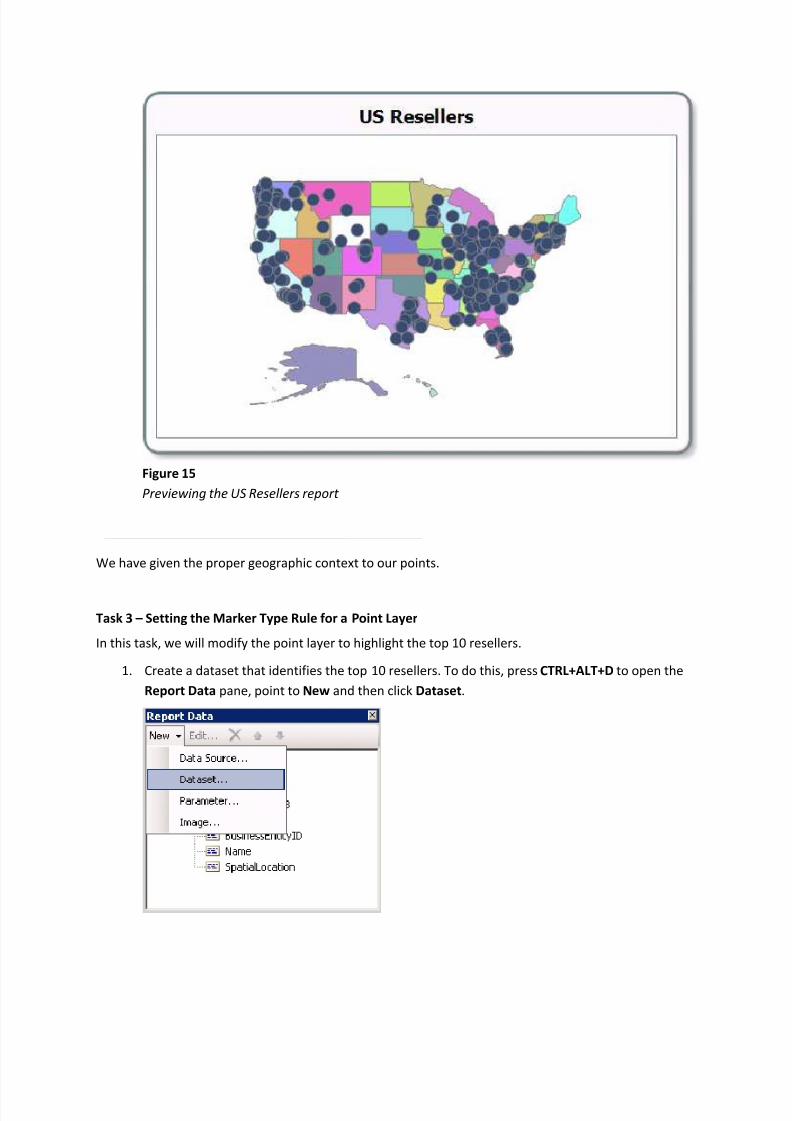
Figure 15
Previewing the US Resellers report
We have given the proper geographic context to our points.
Task 3 Setting the Marker Type Rule for a Point Layer
In this task, we will modify the point layer to highlight the top 10 resellers.
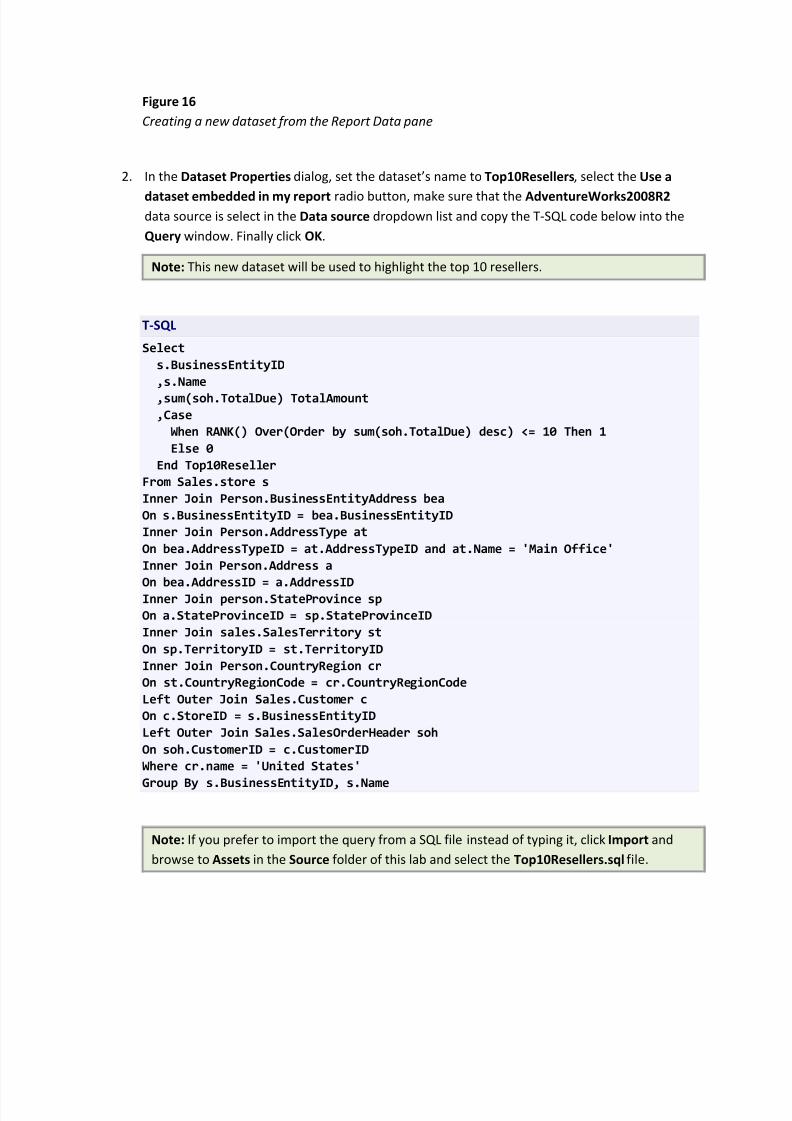
1. Create a dataset that identifies the top 10 resellers. To do this, pressCTRL+ALT+D to open the
Report Data pane, point toNew and then click Dataset.
8/6/2019 Reportins Services 2008R2 Nuevas Caracteristicas
http://slidepdf.com/reader/full/reportins-services-2008r2-nuevas-caracteristicas 22/93
Figure 16
Creating a new d ataset from the Report Data pane
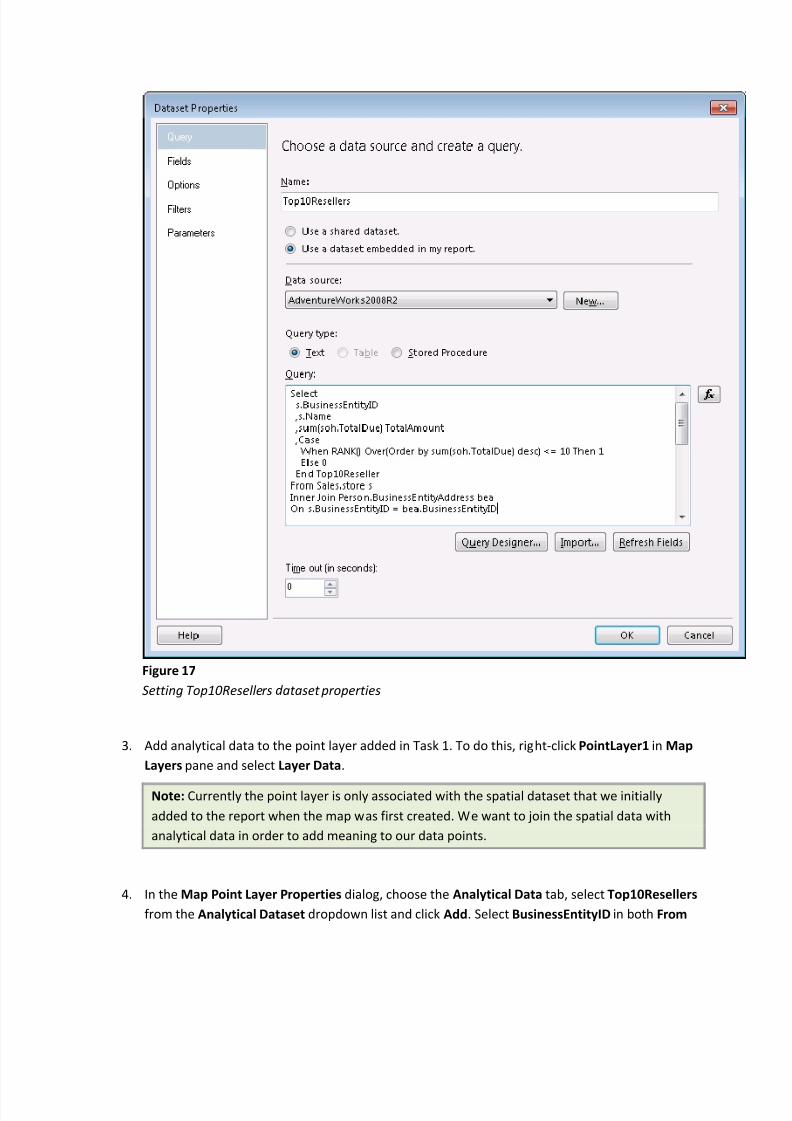
2. In the Dataset Properties dialog, set the datasets name to Top10Resellers, select the Use a
dataset embedded in my report radio button, make sure that the AdventureWorks2008R2 data source is select in the Data source dropdown list and copy the T-SQL code below into the
Query window. Finally click OK.
Note: This new dataset will be used to highlight the top 10 resellers.
T-SQL
Select
s.BusinessEntityID
,s.Name
,sum(soh.TotalDue) TotalAmount
,Case
When RANK() Over(Order by sum(soh.TotalDue) desc) <= 10 Then 1
Else 0
End Top10Reseller
From Sales.store s
Inner Join Person.BusinessEntityAddress bea
On s.BusinessEntityID = bea.BusinessEntityID
Inner Join Person.AddressType at
On bea.AddressTypeID = at.AddressTypeID and at.Name = 'Main Office'
Inner Join Person.Address a
On bea.AddressID = a.AddressID
Inner Join person.StateProvince sp
On a.StateProvinceID = sp.StateProvinceID
Inner Join sales.SalesTerritory st
On sp.TerritoryID = st.TerritoryID
Inner Join Person.CountryRegion cr
On st.CountryRegionCode = cr.CountryRegionCode
Left Outer Join Sales.Customer c
On c.StoreID = s.BusinessEntityID
Left Outer Join Sales.SalesOrderHeader soh
On soh.CustomerID = c.CustomerID
Where cr.name = 'United States'
Group By s.BusinessEntityID, s.Name
Note: If you prefer to import the query from a SQL file instead of typing it, click Import and
browse to Assets in the Source folder of this lab and select the Top10Resellers.sql file.
8/6/2019 Reportins Services 2008R2 Nuevas Caracteristicas
http://slidepdf.com/reader/full/reportins-services-2008r2-nuevas-caracteristicas 23/93
Figure 17
Setting Top10Resellers d ataset properties
3. Add analytical data to the point layer added in Task 1. To do this, right-click PointLayer1 in Map
Layers pane and select Layer Data.
Note: Currently the point layer is only associated with the spatial dataset that we initially
added to the report when the map was first created. We want to join the spatial data with
analytical data in order to add meaning to our data points.
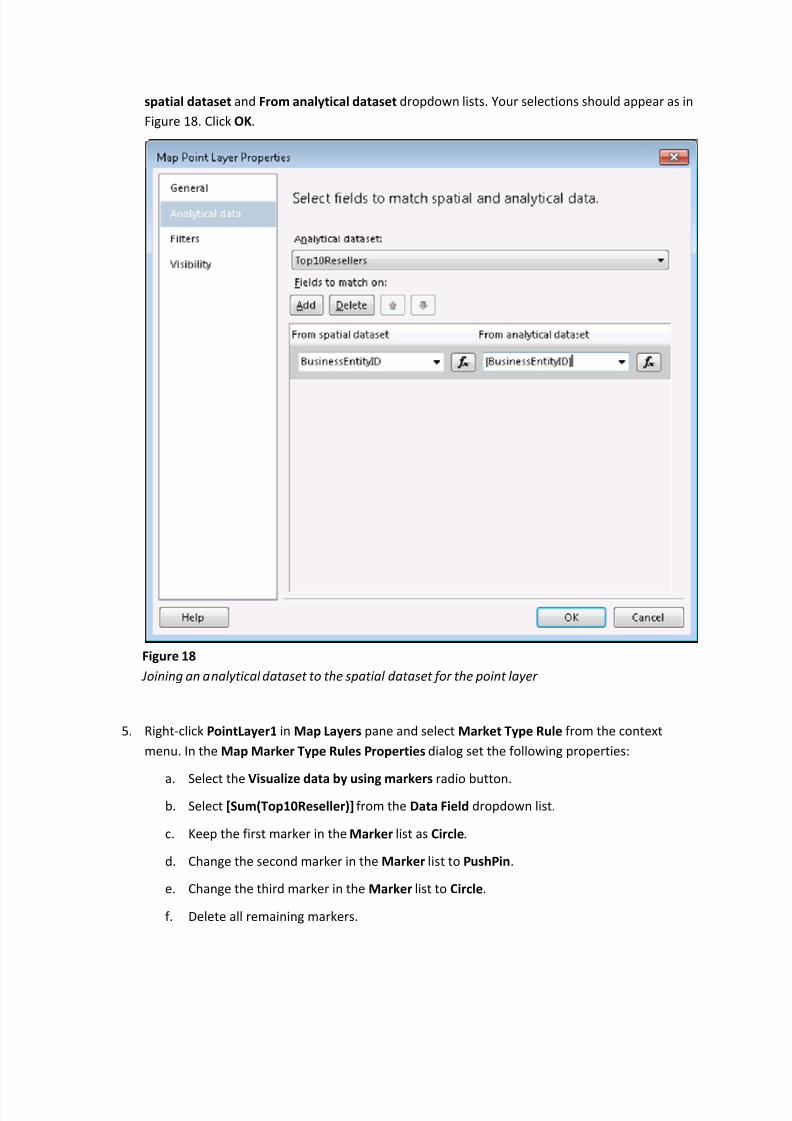
4. In the Map Point Layer Properties dialog, choose the Analytical Data tab, select Top10Resellers
from the Analytical Dataset dropdown list and click Add. Select BusinessEntityID in both From
8/6/2019 Reportins Services 2008R2 Nuevas Caracteristicas
http://slidepdf.com/reader/full/reportins-services-2008r2-nuevas-caracteristicas 24/93
spatial dataset and From analytical dataset dropdown lists. Your selections should appear as in
Figure 18. Click OK.
Figure 18
Joining an analytical d ataset to the spatial d ataset for the point layer
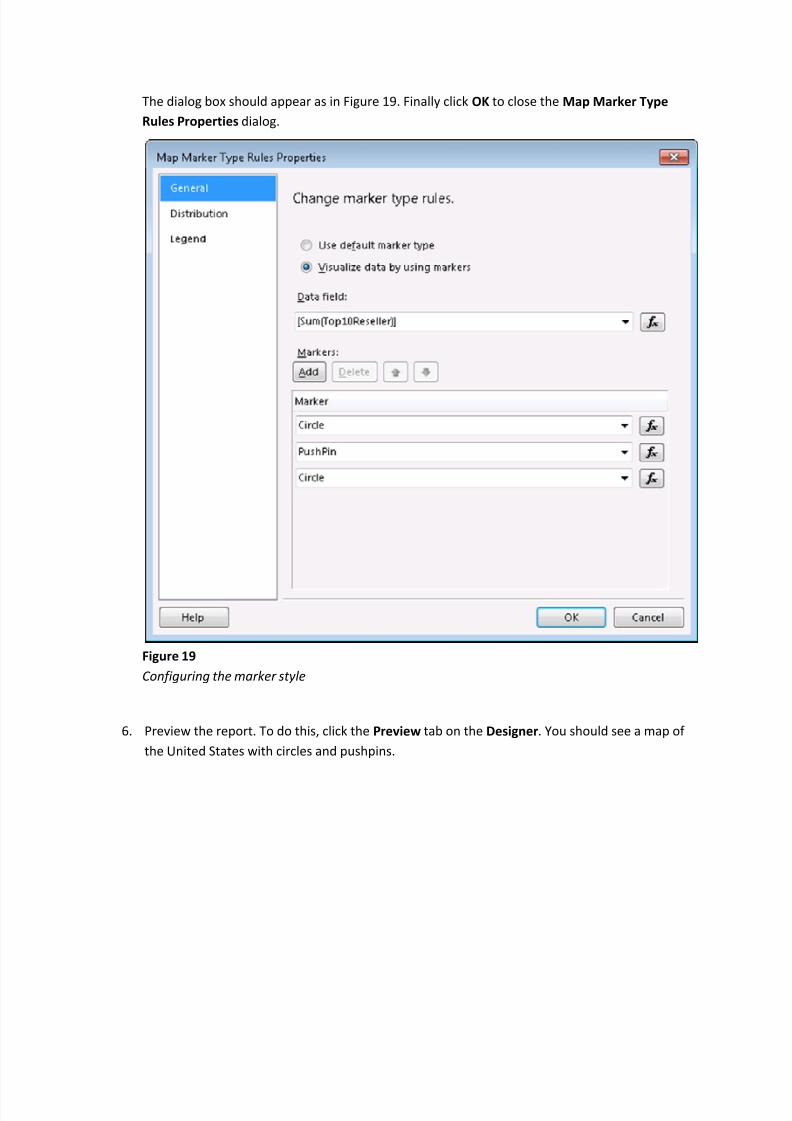
5. Right-click PointLayer1 in Map Layers pane and select Market Type Rule from the context
menu. In the Map Marker Type Rules Properties dialog set the following properties:
a. Select the Visualize data by using markers radio button.
b. Select [Sum(Top10Reseller)] from the Data Field dropdown list.
c. Keep the first marker in the Marker list as Circle.
d. Change the second marker in the Marker list to PushPin.
e. Change the third marker in the Marker list to Circle.
f. Delete all remaining markers.
8/6/2019 Reportins Services 2008R2 Nuevas Caracteristicas
http://slidepdf.com/reader/full/reportins-services-2008r2-nuevas-caracteristicas 25/93
The dialog box should appear as in Figure 19. Finally click OK to close the Map Marker Type
Rules Properties dialog.
Figure 19
Configuring the marker style
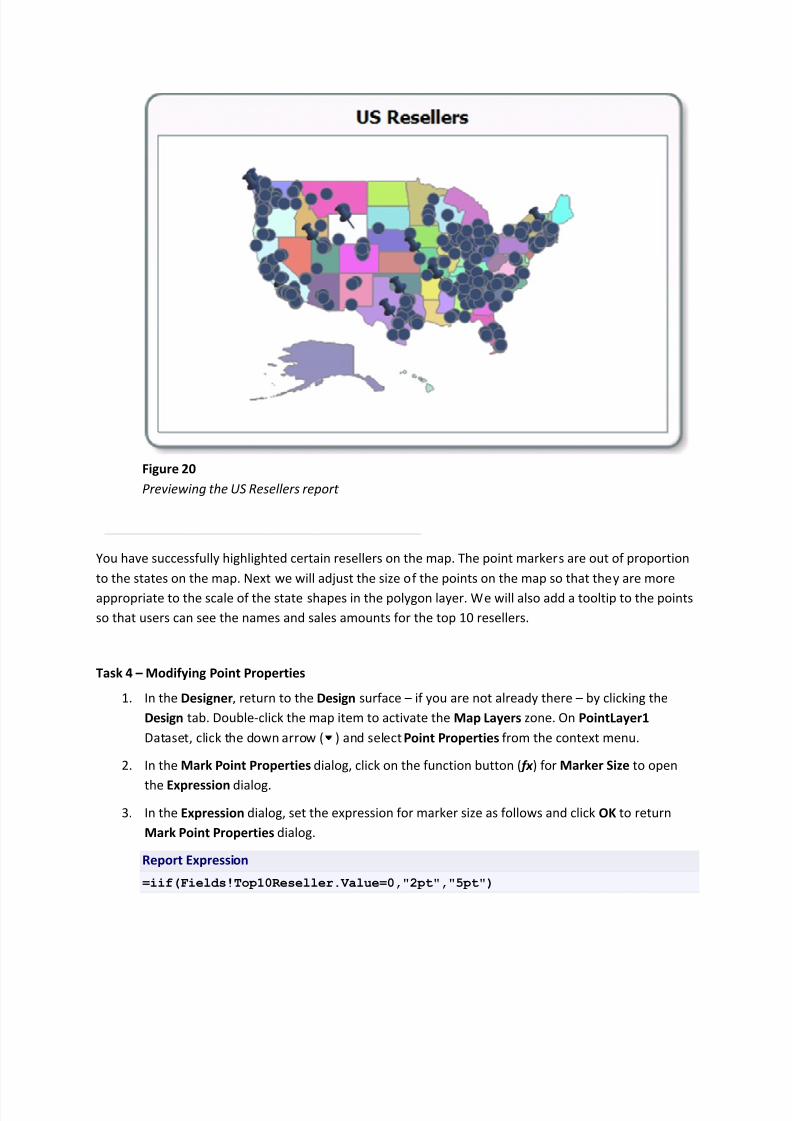
6. Preview the report. To do this, click the Preview tab on the Designer. You should see a map of
the United States with circles and pushpins.
8/6/2019 Reportins Services 2008R2 Nuevas Caracteristicas
http://slidepdf.com/reader/full/reportins-services-2008r2-nuevas-caracteristicas 26/93
Figure 20
Previewing the US Resellers report
You have successfully highlighted certain resellers on the map. The point markers are out of proportion
to the states on the map. Next we will adjust the size of the points on the map so that they are more
appropriate to the scale of the state shapes in the polygon layer. We will also add a tooltip to the points
so that users can see the names and sales amounts for the top 10 resellers.
Task 4 Modifying Point Properties
1. In the Designer, return to the Design surface if you are not already there by clicking the
Design tab. Double-click the map item to activate the Map Layers zone. On PointLayer1
Dataset, click the down arrow ( ) and selectPoint Properties from the context menu.
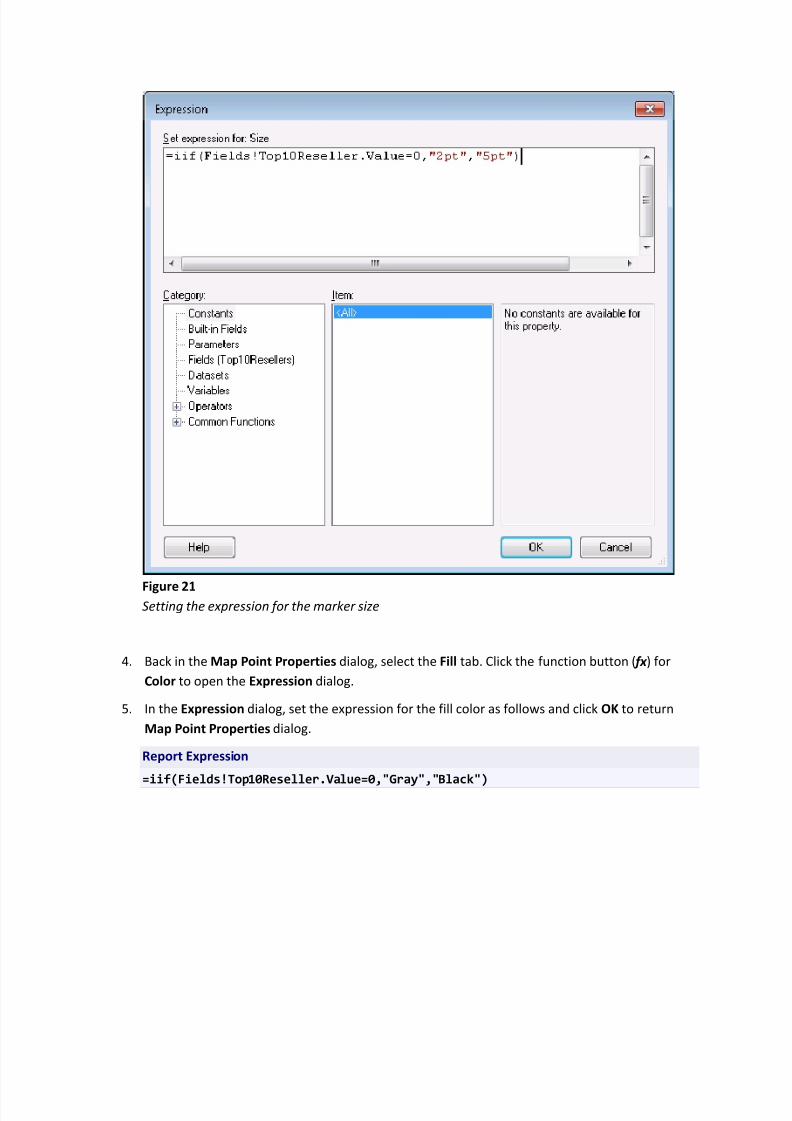
2. In the Mark Point Properties dialog, click on the function button ( fx ) for Marker Size to open
the Expression dialog.
3. In the Expression dialog, set the expression for marker size as follows and click OK to return
Mark Point Properties dialog.
Report Expression
=iif(Fields!Top10Reseller.Value=0,"2pt","5pt")
8/6/2019 Reportins Services 2008R2 Nuevas Caracteristicas
http://slidepdf.com/reader/full/reportins-services-2008r2-nuevas-caracteristicas 27/93
Figure 21Setting the expression for the marker size
4. Back in the Map Point Properties dialog, select the Fill tab. Click the function button ( fx ) for
Color to open the Expression dialog.
5. In the Expression dialog, set the expression for the fill color as follows and click OK to return
Map Point Properties dialog.
Report Expression
=iif(Fields!Top10Reseller.Value=0,"Gray","Black")

8/6/2019 Reportins Services 2008R2 Nuevas Caracteristicas
http://slidepdf.com/reader/full/reportins-services-2008r2-nuevas-caracteristicas 28/93
Figure 22Setting the expression for the background color
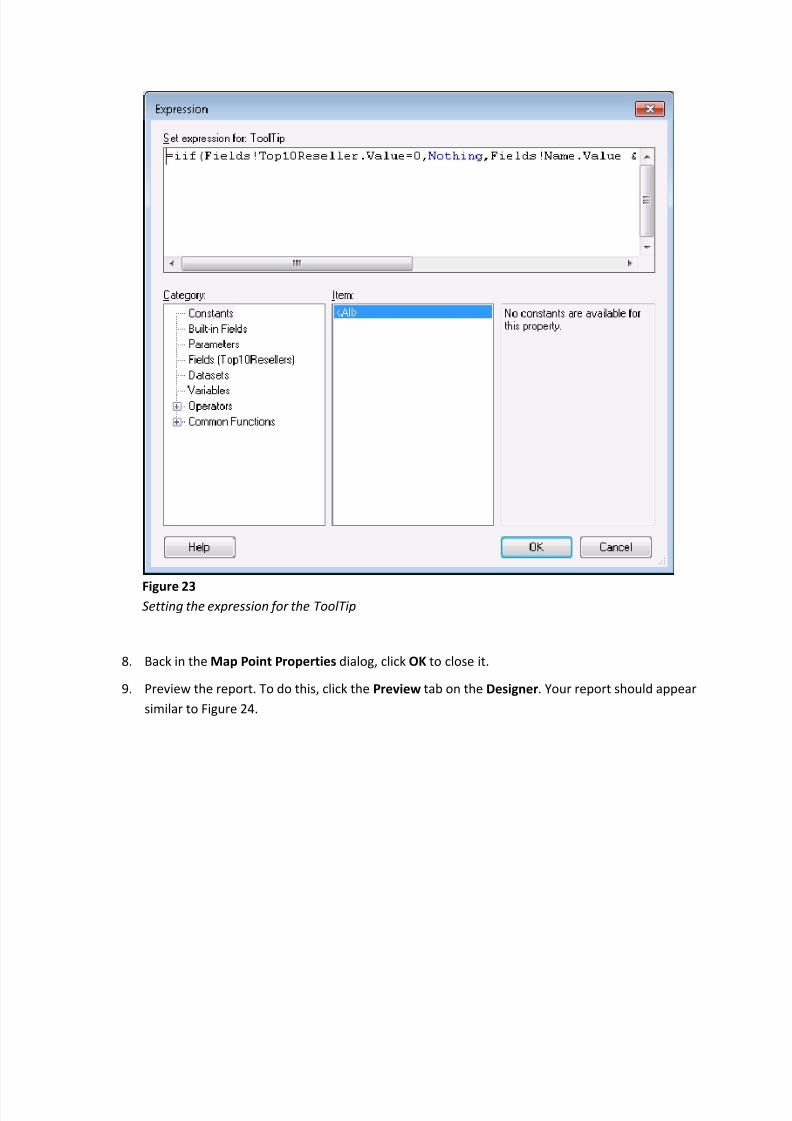
6. Back in the Map Point Properties dialog, select the General tab. Click the function button ( fx )
for the Tooltip to open the Expression dialog.
7. In the Expression dialog, set the expression for the tooltip as follows and click OK to return Map
Point Properties dialog:
Report Expression
=iif(Fields!Top10Reseller.Value=0,Nothing,Fields!Name.Value & ": " & Format(Fields!TotalAmount.Value,"C0"))
8/6/2019 Reportins Services 2008R2 Nuevas Caracteristicas
http://slidepdf.com/reader/full/reportins-services-2008r2-nuevas-caracteristicas 29/93
Figure 23Setting the expression for the ToolTip
8. Back in the Map Point Properties dialog, click OK to close it.
9. Preview the report. To do this, click the Preview tab on the Designer. Your report should appear
similar to Figure 24.
8/6/2019 Reportins Services 2008R2 Nuevas Caracteristicas
http://slidepdf.com/reader/full/reportins-services-2008r2-nuevas-caracteristicas 30/93
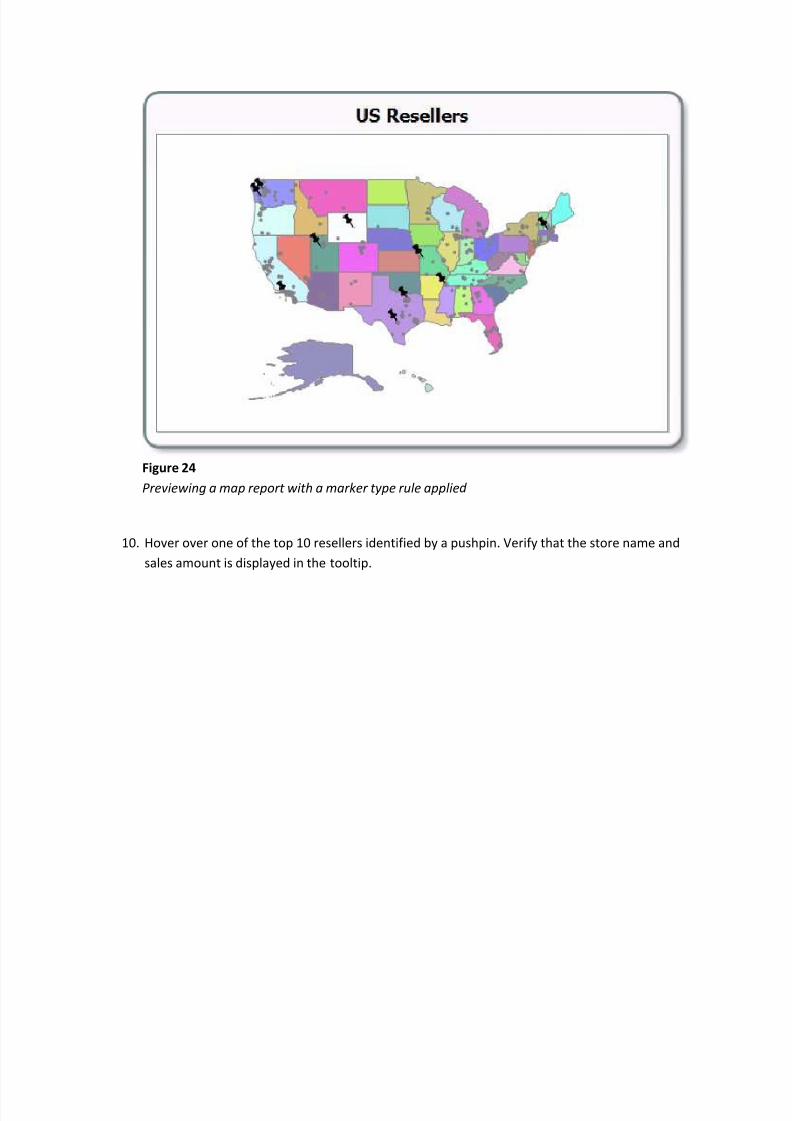
Figure 24
Previewing a map report with a marker type rule applied
10. Hover over one of the top 10 resellers identified by a pushpin. Verify that the store name and
sales amount is displayed in the tooltip.
8/6/2019 Reportins Services 2008R2 Nuevas Caracteristicas
http://slidepdf.com/reader/full/reportins-services-2008r2-nuevas-caracteristicas 31/93
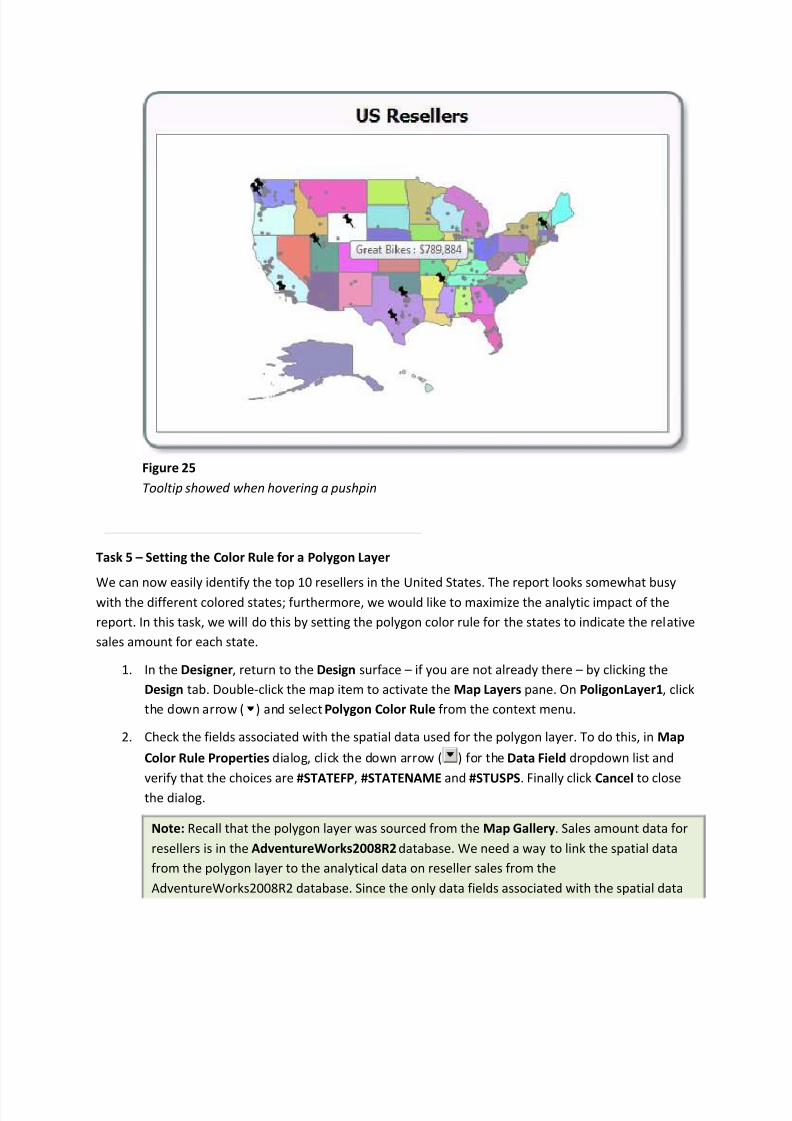
Figure 25
Tooltip showed when hovering a pushpin
Task 5 Setting the Color Rule for a Polygon Layer
We can now easily identify the top 10 resellers in theU
nited States. The report looks somewhat busy
with the different colored states; furthermore, we would like to maximize the analytic impact of the
report. In this task, we will do this by setting the polygon color rule for the states to indicate the relative
sales amount for each state.
1. In the Designer, return to the Design surface if you are not already there by clicking the
Design tab. Double-click the map item to activate the Map Layers pane. On PoligonLayer1, click
the down arrow ( ) and selectPolygon Color Rule from the context menu.
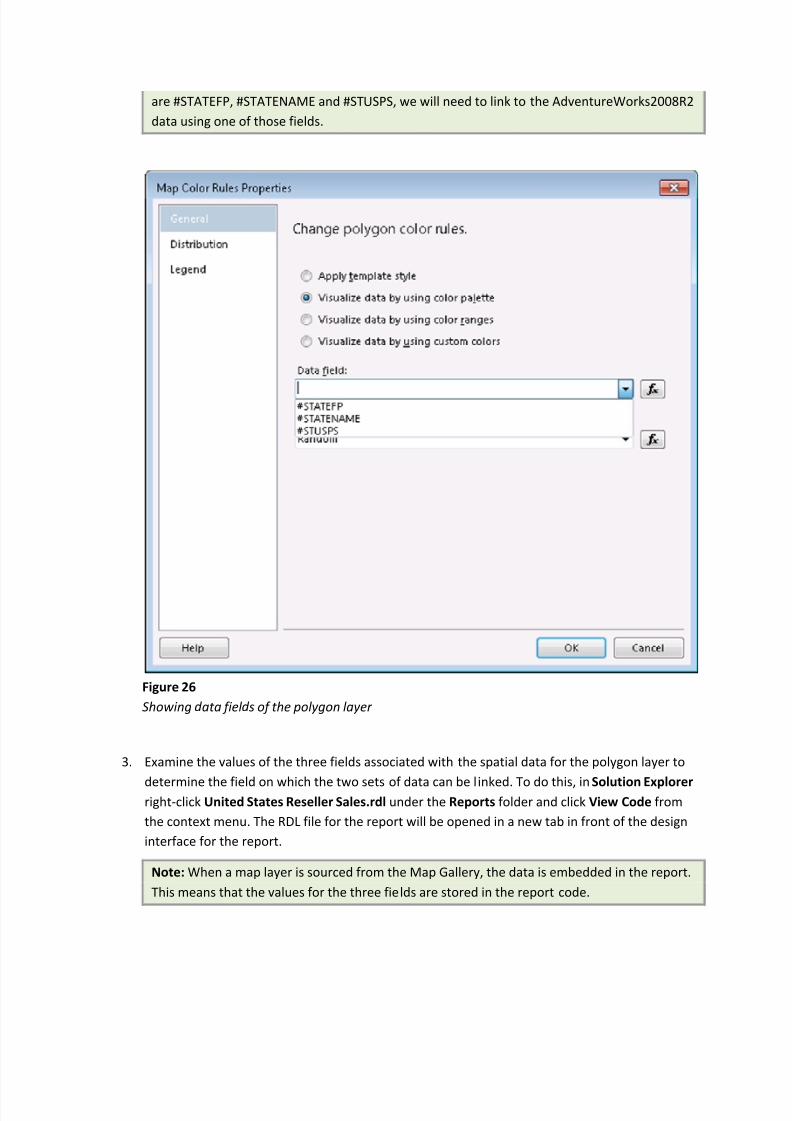
2. Check the fields associated with the spatial data used for the polygon layer. To do this, in Map
Color Rule Properties dialog, click the down arrow ( ) for the Data Field dropdown list and
verify that the choices are #STATEFP, #STATENAME and #STUSPS. Finally click Cancel to close
the dialog.
Note: Recall that the polygon layer was sourced from the Map Gallery. Sales amount data for
resellers is in the AdventureWorks2008R2 database. We need a way to link the spatial data
from the polygon layer to the analytical data on reseller sales from the
AdventureWorks2008R2 database. Since the only data fields associated with the spatial data
8/6/2019 Reportins Services 2008R2 Nuevas Caracteristicas
http://slidepdf.com/reader/full/reportins-services-2008r2-nuevas-caracteristicas 32/93
are #STATEFP, #STATENAME and #STUSPS, we will need to link to the AdventureWorks2008R2
data using one of those fields.
Figure 26
Showing d ata fiel d s of the polygon layer
3. Examine the values of the three fields associated with the spatial data for the polygon layer to
determine the field on which the two sets of data can be l inked. To do this, inSolution Explorer right-click United States Reseller Sales.rdl under the Reports folder and click View Code from
the context menu. The RDL file for the report will be opened in a new tab in front of the design
interface for the report.
Note: When a map layer is sourced from the Map Gallery, the data is embedded in the report.
This means that the values for the three fields are stored in the report code.
8/6/2019 Reportins Services 2008R2 Nuevas Caracteristicas
http://slidepdf.com/reader/full/reportins-services-2008r2-nuevas-caracteristicas 33/93
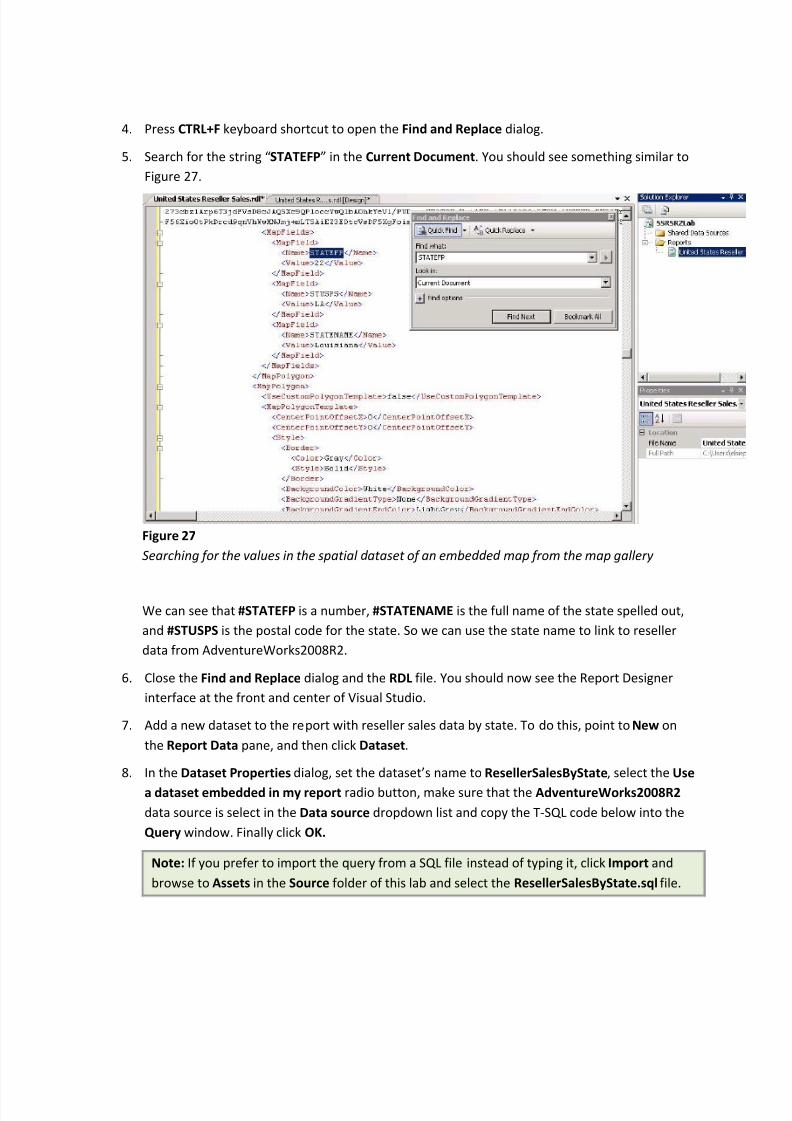
4. Press CTRL+F keyboard shortcut to open the Find and Replace dialog.
5. Search for the string STATEFP in the Current Document. You should see something similar to
Figure 27.
Figure 27
Searching for the values in the spatial d ataset of an embedd ed map from the map gallery
We can see that #STATEFP is a number, #STATENAME is the full name of the state spelled out,
and #STUSPS is the postal code for the state. So we can use the state name to link to reseller
data from AdventureWorks2008R2.
6. Close the Find and Replace dialog and the RDL file. You should now see the Report Designer
interface at the front and center of Visual Studio.
7. Add a new dataset to the report with reseller sales data by state. To do this, point toNew on
the Report Data pane, and then click Dataset.
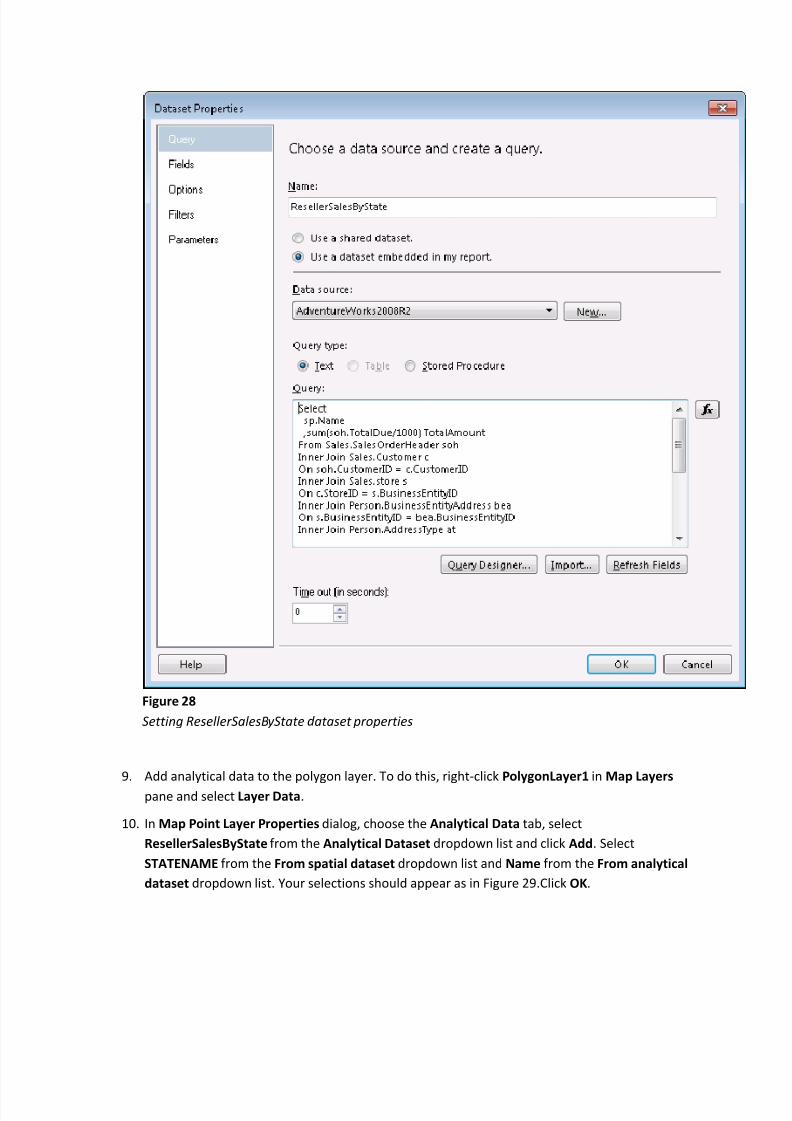
8. In the Dataset Properties dialog, set the datasets name to ResellerSalesByState, select the Use
a dataset embedded in my report radio button, make sure that the AdventureWorks2008R2
data source is select in the Data source dropdown list and copy the T-SQL code below into the
Query window. Finally click OK.
Note: If you prefer to import the query from a SQL file instead of typing it, click Import and
browse to Assets in the Source folder of this lab and select the ResellerSalesByState.sql file.
8/6/2019 Reportins Services 2008R2 Nuevas Caracteristicas
http://slidepdf.com/reader/full/reportins-services-2008r2-nuevas-caracteristicas 34/93
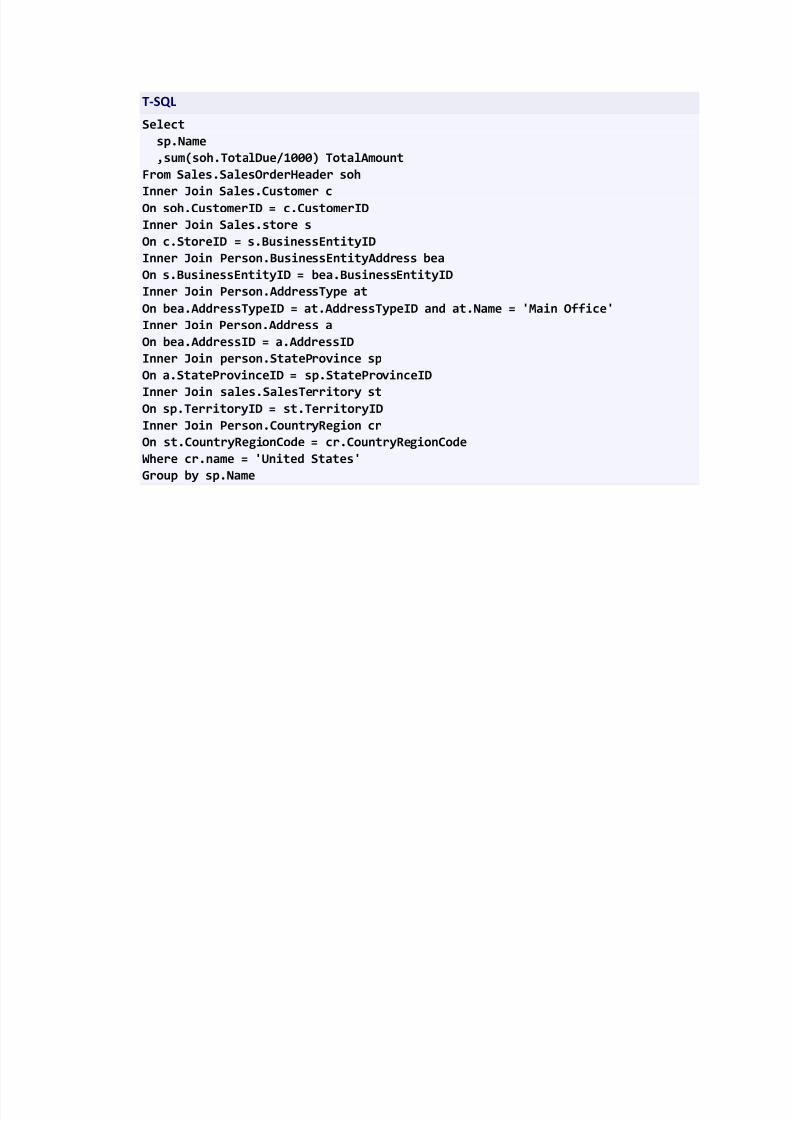
T-SQL
Select
sp.Name
,sum(soh.TotalDue/1000) TotalAmount
From Sales.SalesOrderHeader soh
Inner Join Sales.Customer cOn soh.CustomerID = c.CustomerID
Inner Join Sales.store s
On c.StoreID = s.BusinessEntityID
Inner Join Person.BusinessEntityAddress bea
On s.BusinessEntityID = bea.BusinessEntityID
Inner Join Person.AddressType at
On bea.AddressTypeID = at.AddressTypeID and at.Name = 'Main Office'
Inner Join Person.Address a
On bea.AddressID = a.AddressID
Inner Join person.StateProvince sp
On a.StateProvinceID = sp.StateProvinceID
Inner Join sales.SalesTerritory stOn sp.TerritoryID = st.TerritoryID
Inner Join Person.CountryRegion cr
On st.CountryRegionCode = cr.CountryRegionCode
Where cr.name = 'United States'
Group by sp.Name
8/6/2019 Reportins Services 2008R2 Nuevas Caracteristicas
http://slidepdf.com/reader/full/reportins-services-2008r2-nuevas-caracteristicas 35/93
Figure 28
Setting ResellerSalesByState d ataset properties
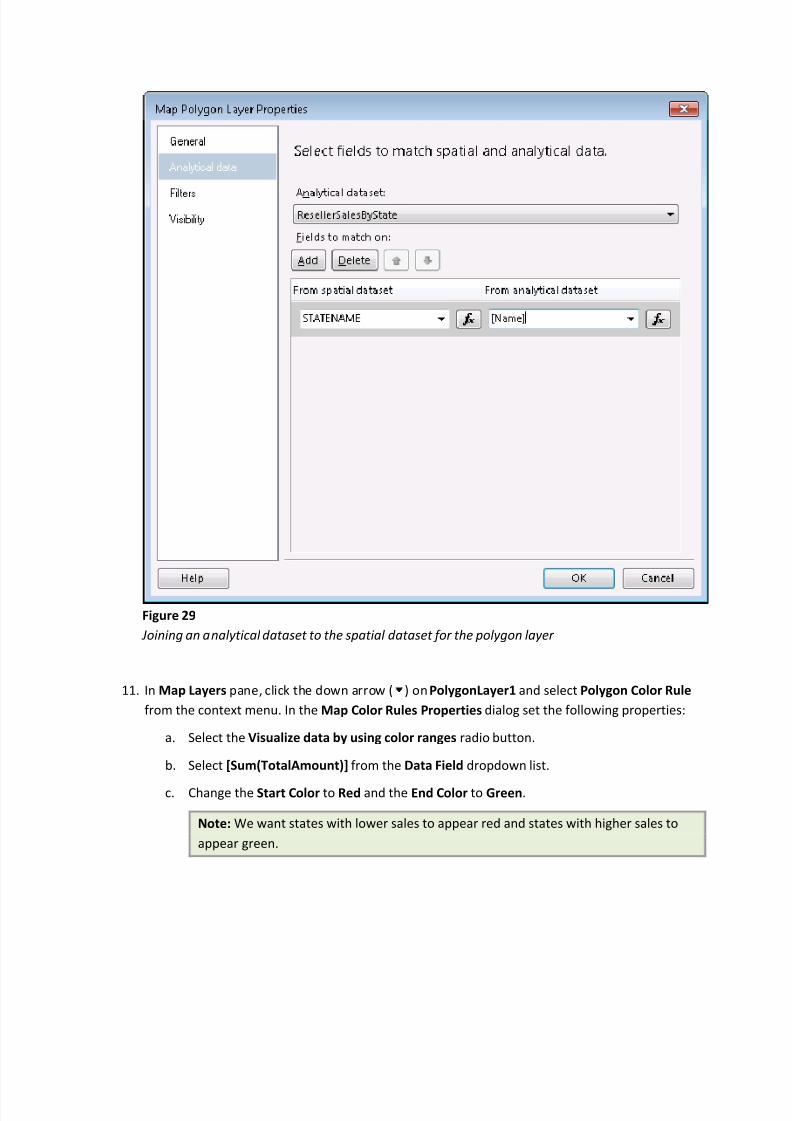
9. Add analytical data to the polygon layer. To do this, right-click PolygonLayer1 in Map Layers
pane and select Layer Data.
10. In Map Point Layer Properties dialog, choose the Analytical Data tab, select
ResellerSalesByState from the Analytical Dataset dropdown list and click Add. Select
STATENAME from the From spatial dataset dropdown list and Name from the From analytical
dataset dropdown list. Your selections should appear as in Figure 29.Click OK.
8/6/2019 Reportins Services 2008R2 Nuevas Caracteristicas
http://slidepdf.com/reader/full/reportins-services-2008r2-nuevas-caracteristicas 36/93
Figure 29
Joining an analytical d ataset to the spatial d ataset for the polygon layer
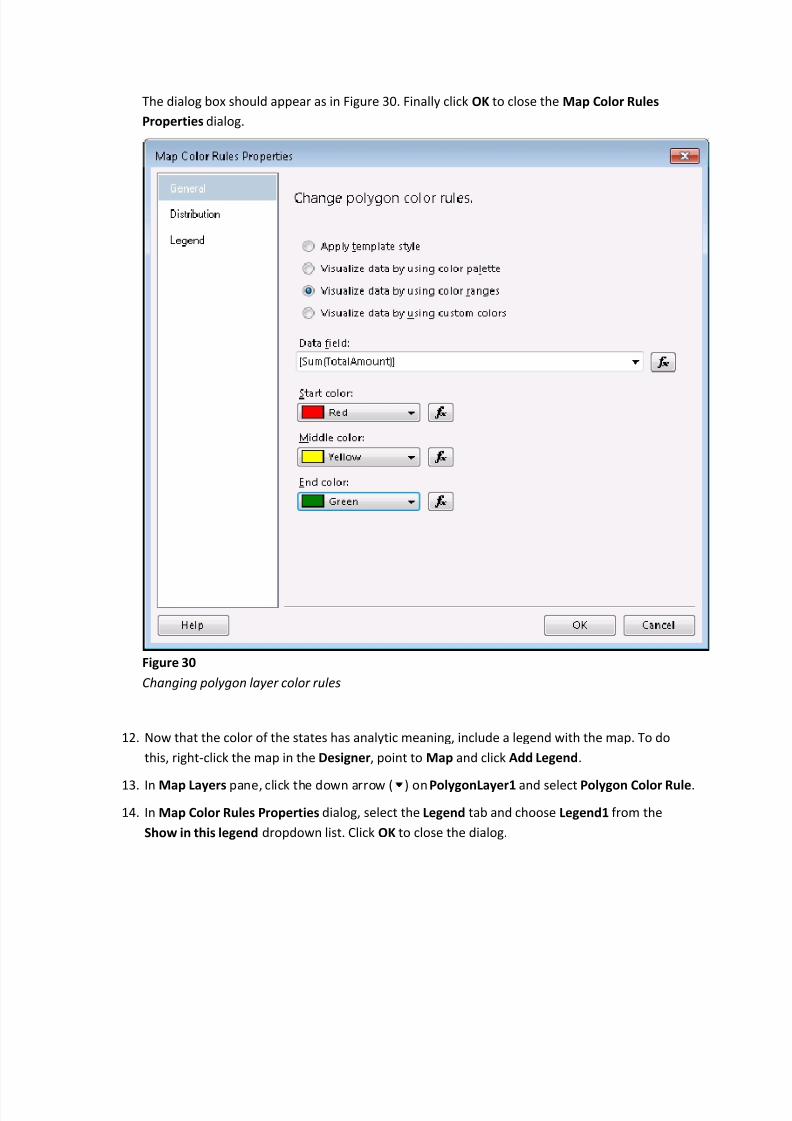
11. In Map Layers pane, click the down arrow ( ) onPolygonLayer1 and select Polygon Color Rule
from the context menu. In the Map Color Rules Properties dialog set the following properties:
a. Select the Visualize data by using color ranges radio button.
b. Select [Sum(TotalAmount)] from the Data Field dropdown list.
c. Change the Start Color to Red and the End Color to Green.
Note: We want states with lower sales to appear red and states with higher sales to
appear green.
8/6/2019 Reportins Services 2008R2 Nuevas Caracteristicas
http://slidepdf.com/reader/full/reportins-services-2008r2-nuevas-caracteristicas 37/93
The dialog box should appear as in Figure 30. Finally click OK to close the Map Color Rules
Properties dialog.
Figure 30
Changing polygon layer color rules
12. Now that the color of the states has analytic meaning, include a legend with the map. To do
this, right-click the map in the Designer, point to Map and click Add Legend.
13. In Map Layers pane, click the down arrow ( ) onPolygonLayer1 and select Polygon Color Rule.
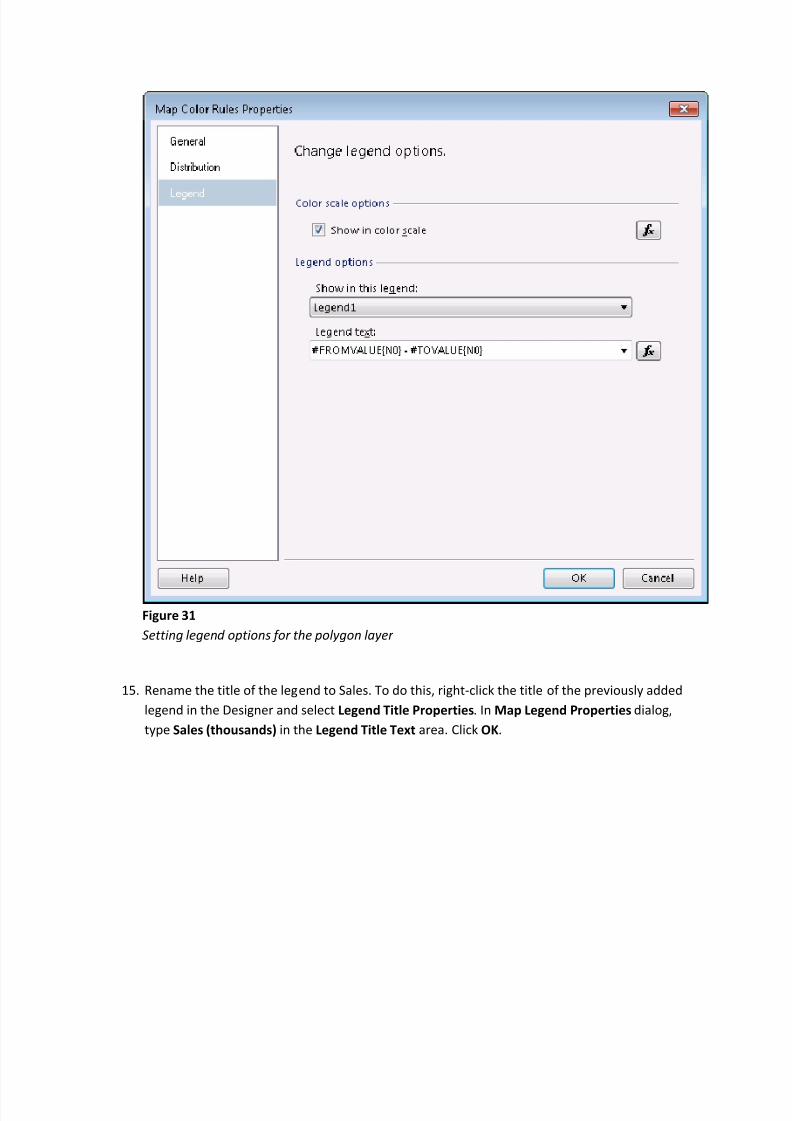
14. In Map Color Rules Properties dialog, select the Legend tab and choose Legend1 from the
Show in this legend dropdown list. Click OK to close the dialog.
8/6/2019 Reportins Services 2008R2 Nuevas Caracteristicas
http://slidepdf.com/reader/full/reportins-services-2008r2-nuevas-caracteristicas 38/93
Figure 31
Setting legend options for the polygon layer
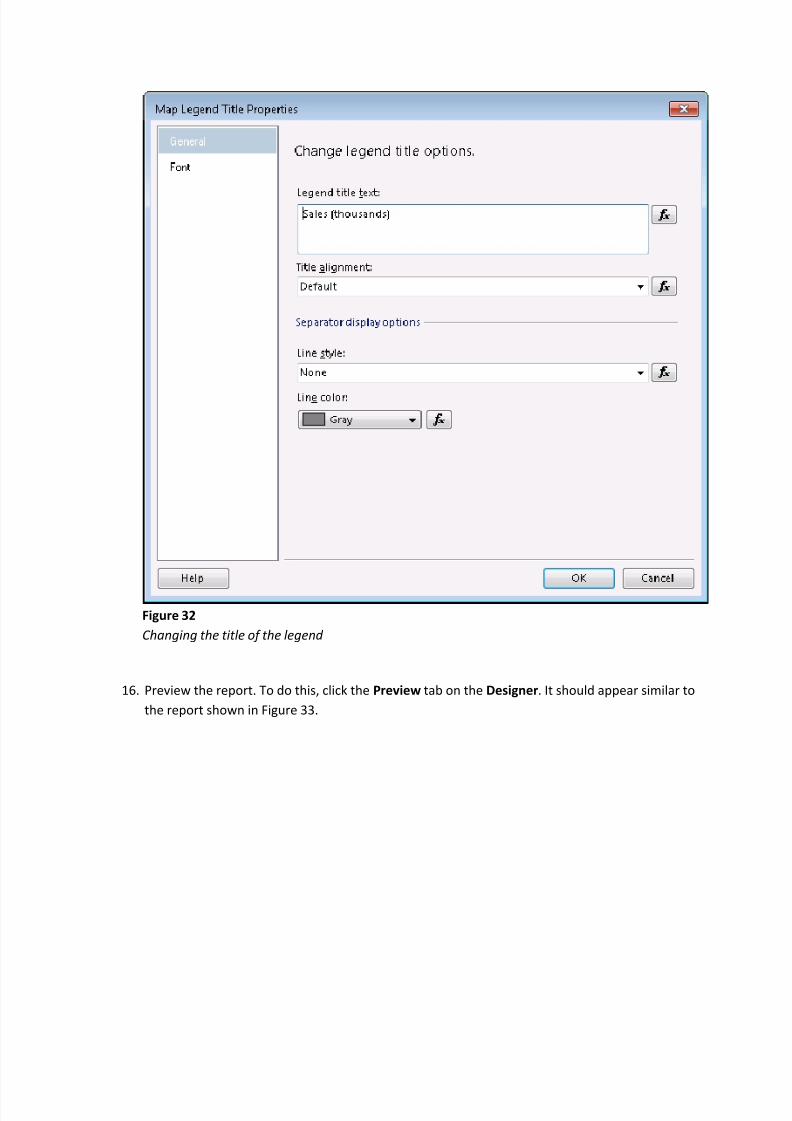
15. Rename the title of the legend to Sales. To do this, right-click the title of the previously added
legend in the Designer and select Legend Title Properties. In Map Legend Properties dialog,
type Sales (thousands) in the Legend Title Text area. Click OK.
8/6/2019 Reportins Services 2008R2 Nuevas Caracteristicas
http://slidepdf.com/reader/full/reportins-services-2008r2-nuevas-caracteristicas 39/93
Figure 32
Changing the title of the legend
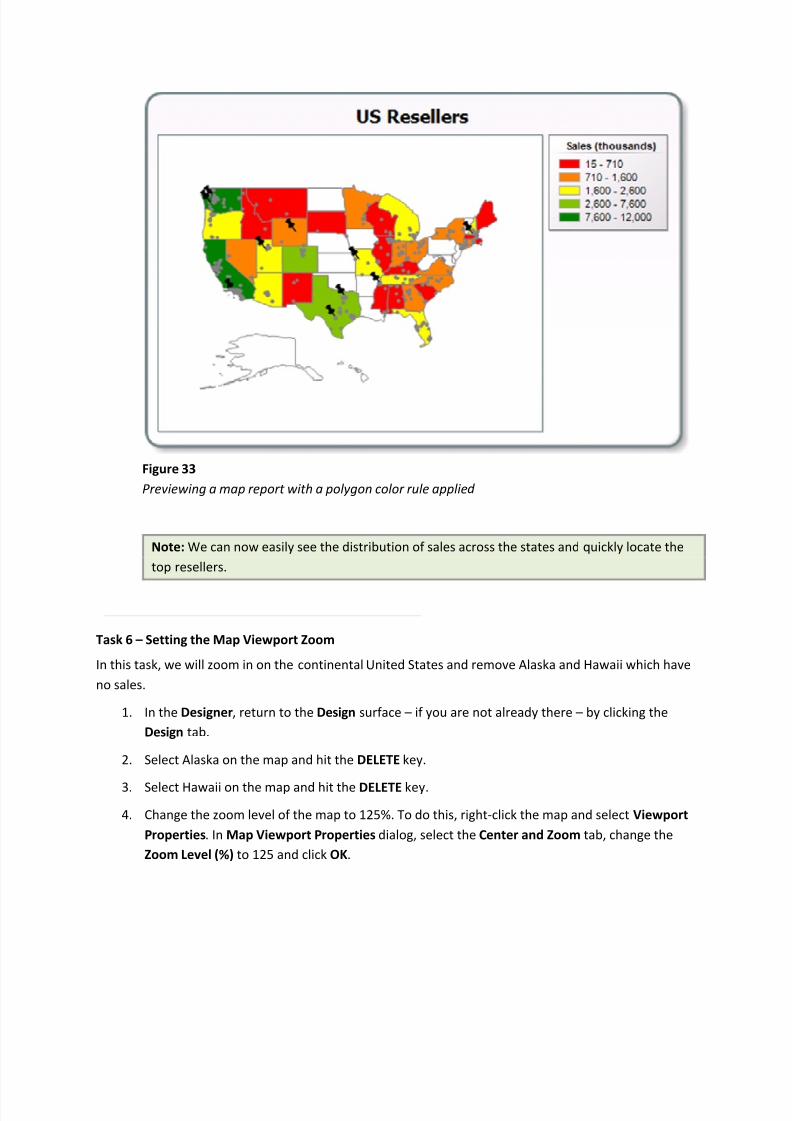
16. Preview the report. To do this, click the Preview tab on the Designer. It should appear similar to
the report shown in Figure 33.
8/6/2019 Reportins Services 2008R2 Nuevas Caracteristicas
http://slidepdf.com/reader/full/reportins-services-2008r2-nuevas-caracteristicas 40/93
Figure 33
Previewing a map report with a polygon color rule applied
Note: We can now easily see the distribution of sales across the states and quickly locate the
top resellers.
Task 6 Setting the Map Viewport Zoom
In this task, we will zoom in on the continentalUnited States and remove Alaska and Hawaii which have
no sales.
1. In the Designer, return to the Design surface if you are not already there by clicking the
Design tab.
2. Select Alaska on the map and hit the DELETE key.
3. Select Hawaii on the map and hit the DELETE key.
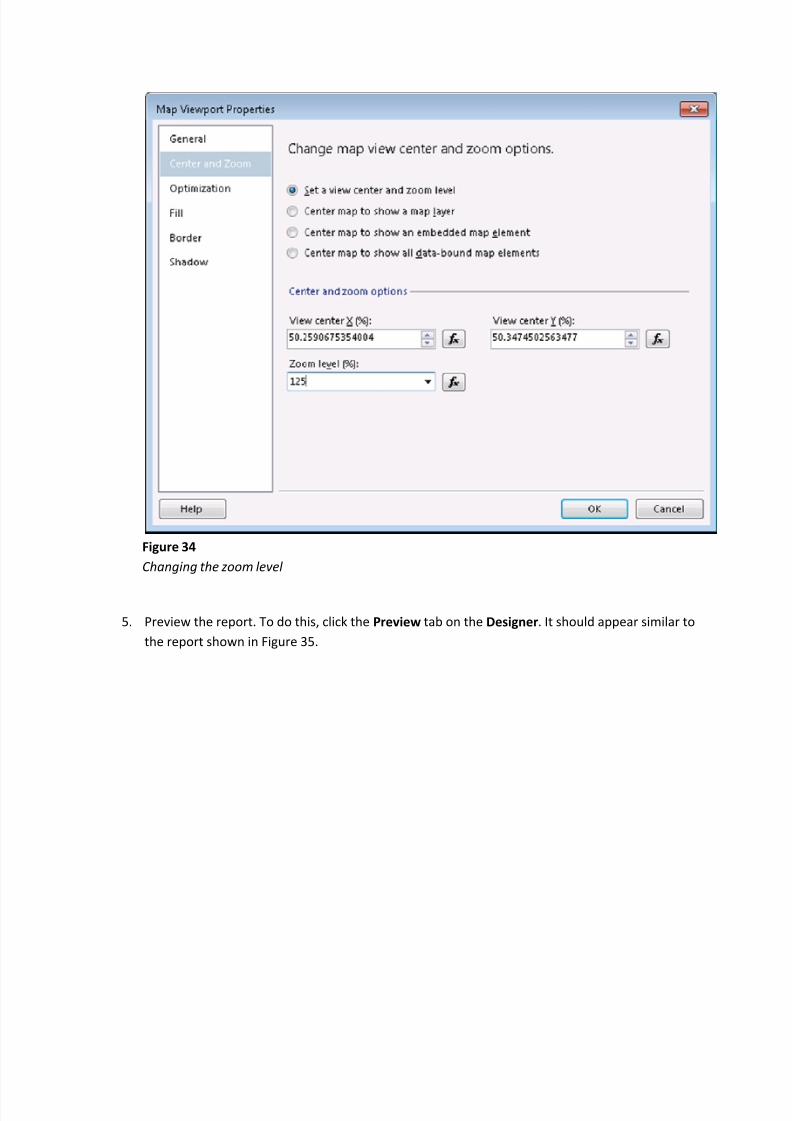
4. Change the zoom level of the map to 125%. To do this, right-click the map and select Viewport
Properties. In Map Viewport Properties dialog, select the Center and Zoom tab, change the
Zoom Level (%) to 125 and click OK.
8/6/2019 Reportins Services 2008R2 Nuevas Caracteristicas
http://slidepdf.com/reader/full/reportins-services-2008r2-nuevas-caracteristicas 41/93
Figure 34
Changing the zoom level
5. Preview the report. To do this, click the Preview tab on the Designer. It should appear similar to
the report shown in Figure 35.
8/6/2019 Reportins Services 2008R2 Nuevas Caracteristicas
http://slidepdf.com/reader/full/reportins-services-2008r2-nuevas-caracteristicas 42/93
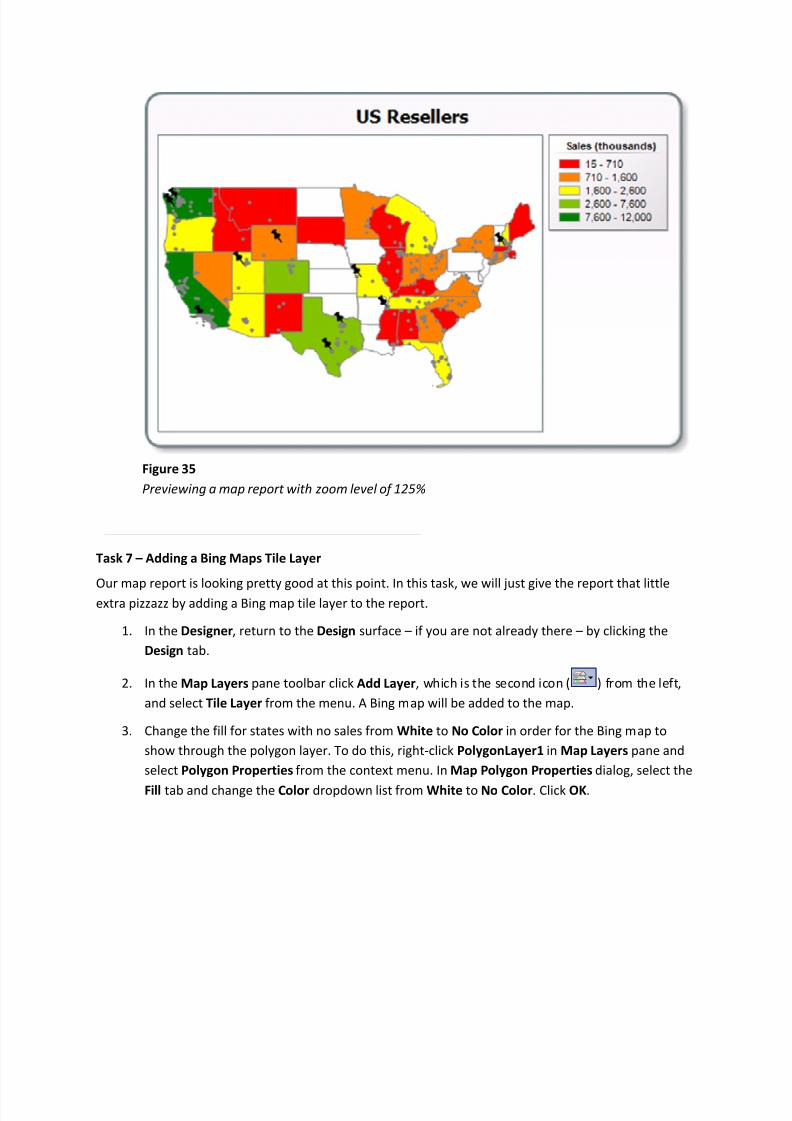
Figure 35
Previewing a map report with zoom level of 125%
Task 7 Adding a Bing Maps Tile Layer
Our map report is looking pretty good at this point. In this task, we will just give the report that littleextra pizzazz by adding a Bing map tile layer to the report.
1. In the Designer, return to the Design surface if you are not already there by clicking the
Design tab.
2. In the Map Layers pane toolbar click Add Layer, which is the second icon ( ) from the left,
and select Tile Layer from the menu. A Bing map will be added to the map.
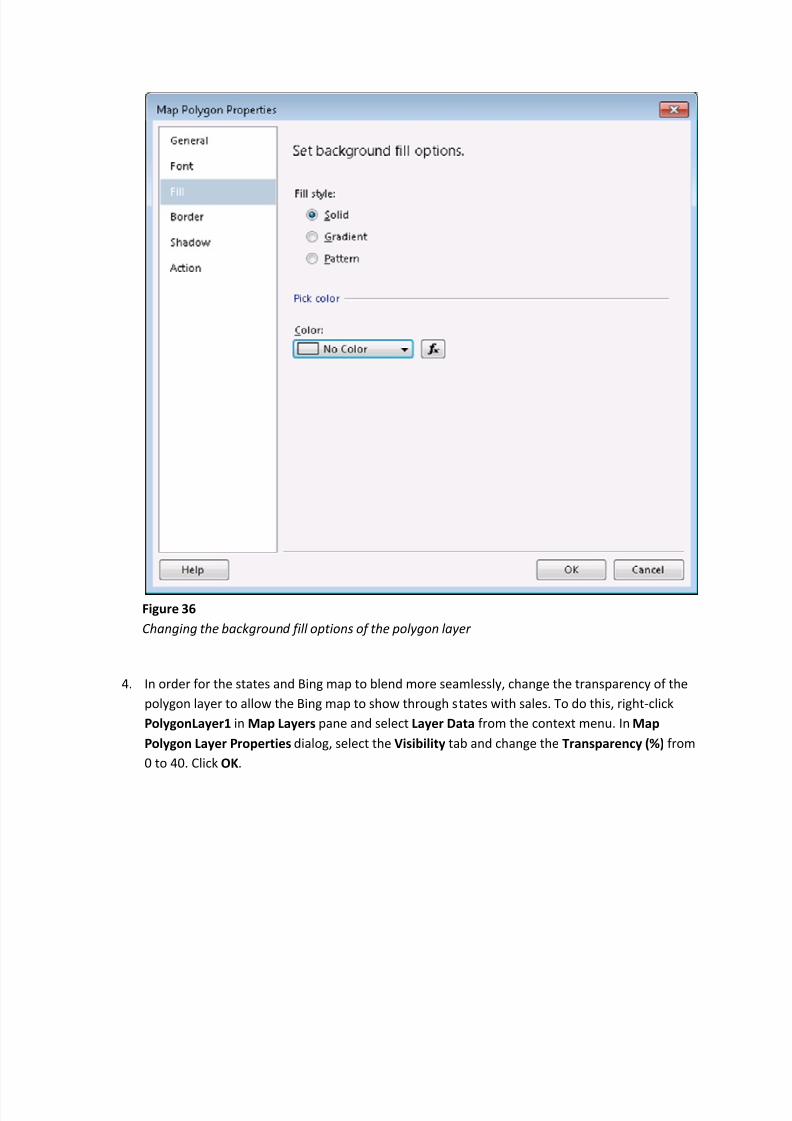
3. Change the fill for states with no sales from White to No Color in order for the Bing map to
show through the polygon layer. To do this, right-click PolygonLayer1 in Map Layers pane and
select Polygon Properties from the context menu. In Map Polygon Properties dialog, select the
Fill tab and change the Color dropdown list from White to No Color. Click OK.
8/6/2019 Reportins Services 2008R2 Nuevas Caracteristicas
http://slidepdf.com/reader/full/reportins-services-2008r2-nuevas-caracteristicas 43/93
Figure 36
Changing the background fill options of the polygon layer
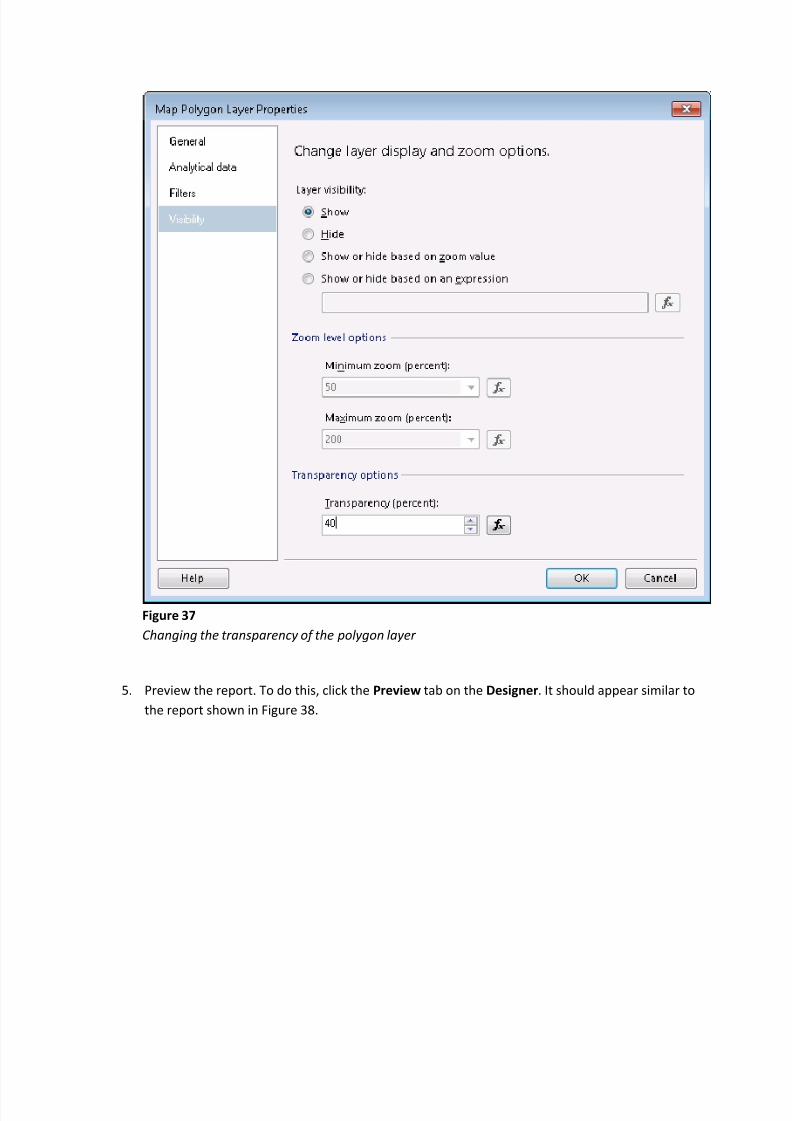
4. In order for the states and Bing map to blend more seamlessly, change the transparency of the
polygon layer to allow the Bing map to show through states with sales. To do this, right-click
PolygonLayer1 in Map Layers pane and select Layer Data from the context menu. In Map
Polygon Layer Properties dialog, select the Visibility tab and change the Transparency (%) from
0 to 40. Click OK.
8/6/2019 Reportins Services 2008R2 Nuevas Caracteristicas
http://slidepdf.com/reader/full/reportins-services-2008r2-nuevas-caracteristicas 44/93
Figure 37
Changing the transparency of the polygon layer
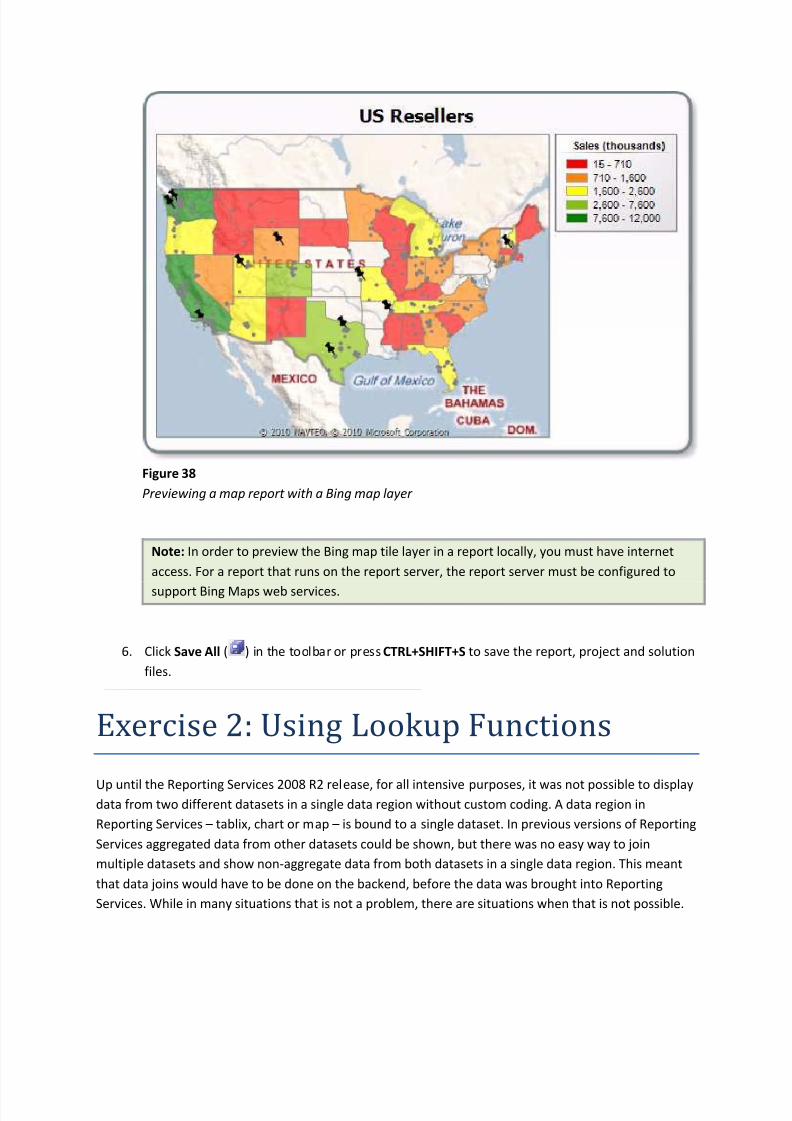
5. Preview the report. To do this, click the Preview tab on the Designer. It should appear similar to
the report shown in Figure 38.
8/6/2019 Reportins Services 2008R2 Nuevas Caracteristicas
http://slidepdf.com/reader/full/reportins-services-2008r2-nuevas-caracteristicas 45/93
Figure 38
Previewing a map report with a Bing map layer
Note: In order to preview the Bing map tile layer in a report locally, you must have internet
access. For a report that runs on the report server, the report server must be configured to
support Bing Maps web services.
6. Click Save All ( ) in the toolbar or pressCTRL+SHIFT+S to save the report, project and solution
files.
Exercise 2: Using Lookup Functions
Up until the Reporting Services 2008 R2 release, for all intensive purposes, it was not possible to displaydata from two different datasets in a single data region without custom coding. A data region in
Reporting Services tablix, chart or map is bound to a single dataset. In previous versions of Reporting
Services aggregated data from other datasets could be shown, but there was no easy way to join
multiple datasets and show non-aggregate data from both datasets in a single data region. This meant
that data joins would have to be done on the backend, before the data was brought into Reporting
Services. While in many situations that is not a problem, there are situations when that is not possible.
8/6/2019 Reportins Services 2008R2 Nuevas Caracteristicas
http://slidepdf.com/reader/full/reportins-services-2008r2-nuevas-caracteristicas 46/93
In those situations, the data from the two sources would need to be retrieved into two different
Reporting Services datasets, and displayed using two different data regions. This shortcoming has been
addressed to some extent with the introduction of three new lookup functions to Report Expressions.
The three lookup functions introduced to Report Expressions allow, in a sense, the joining of data from
different datasets for display in a single data region. A join in the formal sense is not done: a new report
dataset does not result from using the lookup functions. Rather the lookup functions allow you to
lookup the value of a field in the second dataset based on a field that the two datasets have in common.
Lookup functions cannot be used in calculated fields. Lookup functions are intended to be used in cells
of data regions to retrieve values from a dataset other than the one to which the data region is bound.
The dataset to which the data region is bound is referred to as the source dataset. The dataset from
which it is desired to retrieve data is referred to as the destination dataset. Each of the functions
requires the following four parameters:
1. source_expression report expression evaluated in the context of the dataset to which the data
region is bound. Specifies the value to be searched for in the destination dataset.
2. destination_expression expression evaluated in the context of the dataset from which data
should be retrieved. Specifies the expression to which the source_expression should be
matched.
3. result_expression expression to be retrieved from the destination dataset.
4. dataset this is the name of the destination dataset the dataset from which data should be
retrieved
Which function you use depends on whether you need to do a one-to-one lookup, a one-to-many
lookup, or whether you want to do a one-to-one look up for an array of values.
1. Lookup() used to look up an expression from a single row of the destination dataset. The one-
to-one nature of the relationship between the datasets is not enforced. If the destination
dataset has more than one record match, no error results the result_expression from the first
match is retrieved. The source, destination and result expressions are all variants.
2. LookupSet() used to look up multiple values from the destination dataset. The source and
destination expressions are variants; however in this case the result expression is a variant
array. To display the result in a textbox, the array must be either be flattened using the Join()
function or an element of the array must be specified for display.
3. MultiLookup() used to look up multiple values from the source dataset. The source,
destination and result expressions are variant arrays of the same size. Only one match is
expected in the destination dataset for each element in the source expression array.
In this exercise you will create a report with a table bound to data from the AdventureWorksDW2008R2
database. This is the sample star schema data warehouse for SQL Server 2008. You will then use the
8/6/2019 Reportins Services 2008R2 Nuevas Caracteristicas
http://slidepdf.com/reader/full/reportins-services-2008r2-nuevas-caracteristicas 47/93
Lookup and LookupSet functions to display data from the sample OLTP database,
AdventureWorks2008R2, in the same report table.
Task 1 Creating a Tabular Report
1. In the File menu, choose Open and then Project/Solution. In the Open Project dialog, browse
to Ex2-LookupFunctions\Begin in the Source folder of this lab, select Begin.sln and click Open.Alternatively, you may continue working with the solution obtained after completing the
previous exercise.
2. In Solution Explorer, right-click the Reports folder and select Add New Report from the context
menu. This will launch the Report Wizard.
3. Click Next at the Welcome screen.
4. In the Select the Data Source step, set the following properties:
a. Check the Make this a shared data source checkbox
b. Select theNew Data Source radio button
c. Type AdventureWorksDW2008R2 in the Name textbox.
d. Ensure that Microsoft SQL Server is selected in the Type dropdown list.
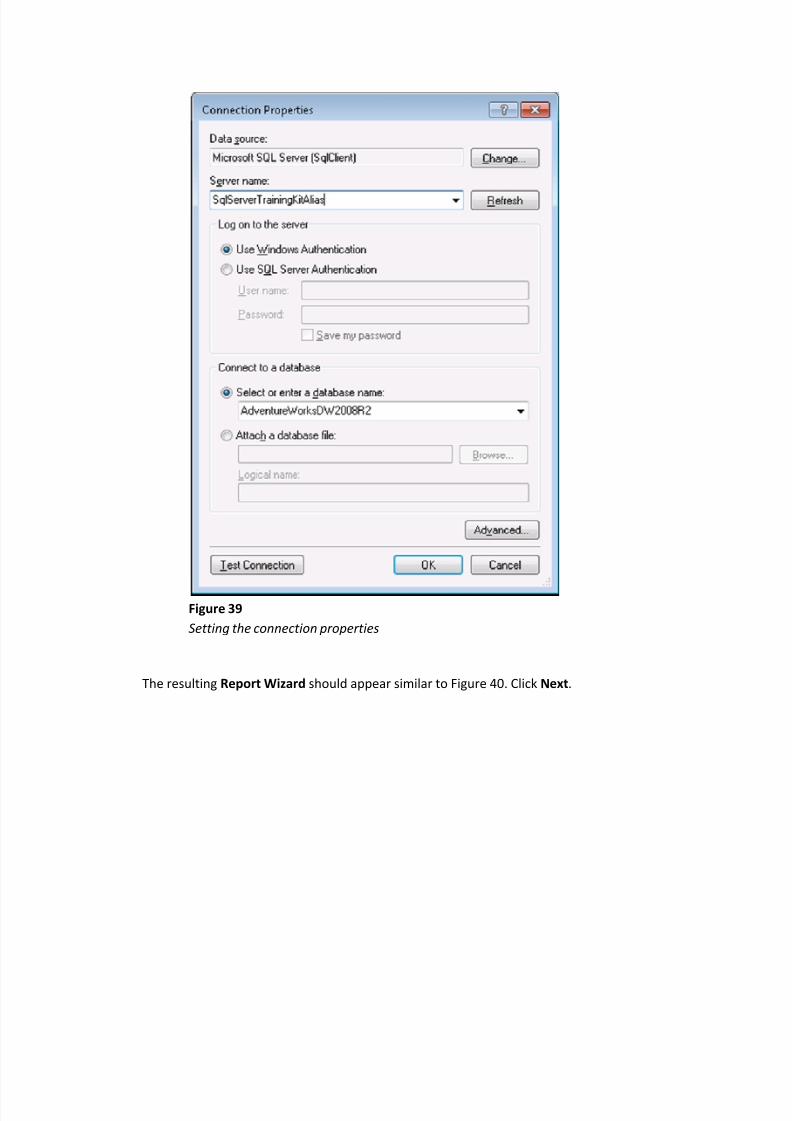
e. Click Edit to open the Connections Properties dialog. Set the server name to the
SQLServerTrainingKitAlias alias and select AdventureWorksDW2008R2 from the Select
or Enter a Database Name dropdown list. Optionally click Test Connection, and finally
click OK.
8/6/2019 Reportins Services 2008R2 Nuevas Caracteristicas
http://slidepdf.com/reader/full/reportins-services-2008r2-nuevas-caracteristicas 48/93
Figure 39
Setting the connection properties
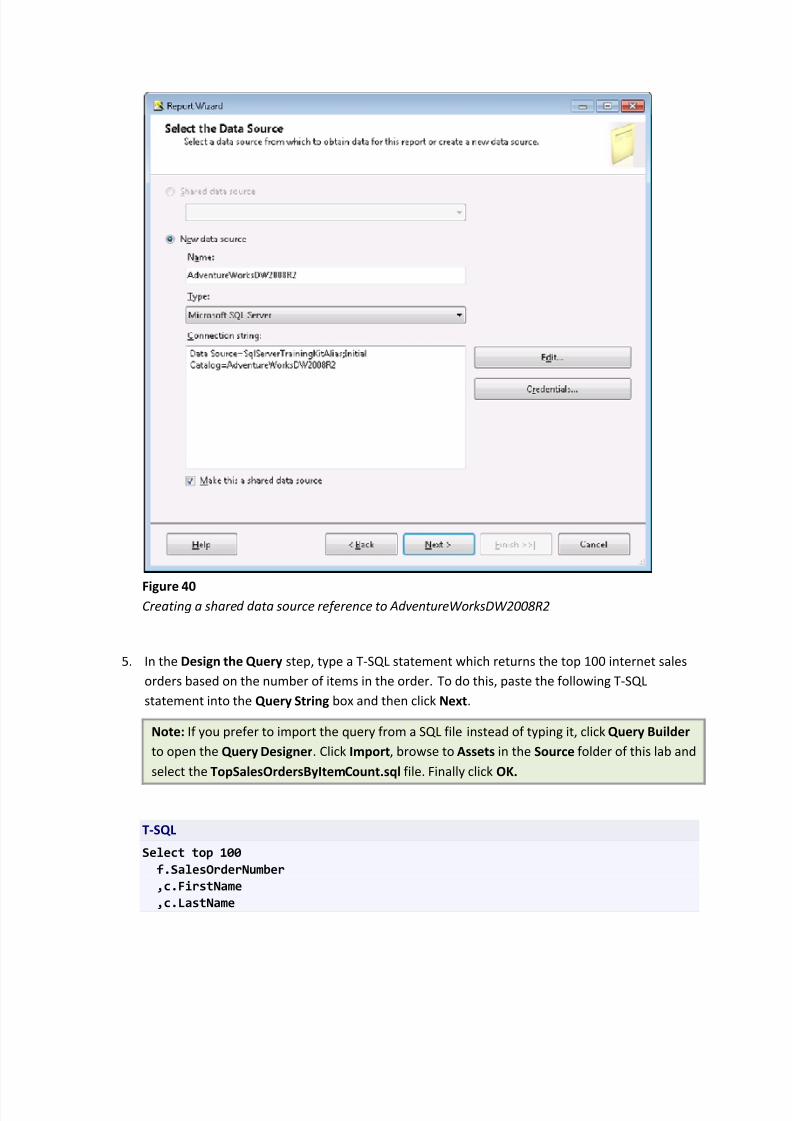
The resulting Report Wizard should appear similar to Figure 40. Click Next.
8/6/2019 Reportins Services 2008R2 Nuevas Caracteristicas
http://slidepdf.com/reader/full/reportins-services-2008r2-nuevas-caracteristicas 49/93
Figure 40Creating a shared d ata source reference to Ad ventureWorksDW2008R2
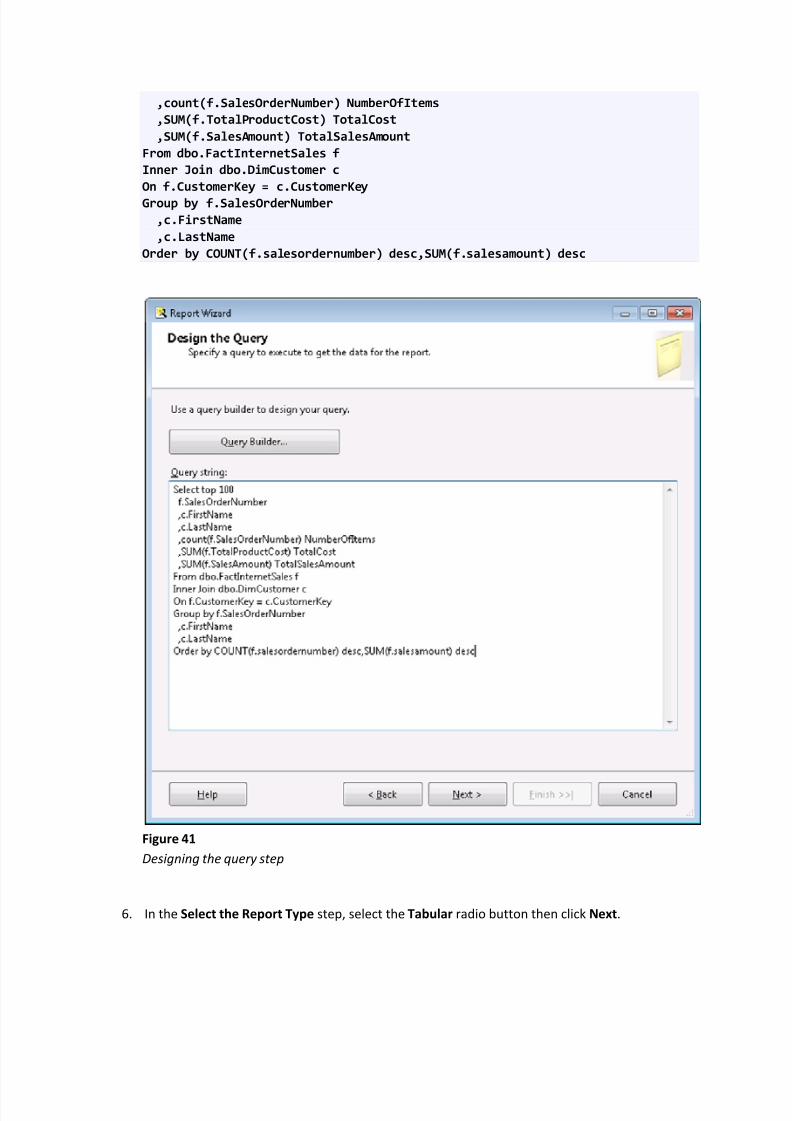
5. In the Design the Query step, type a T-SQL statement which returns the top 100 internet sales
orders based on the number of items in the order. To do this, paste the following T-SQL
statement into the Query String box and then click Next.
Note: If you prefer to import the query from a SQL file instead of typing it, click Query Builder
to open the Query Designer. Click Import, browse to Assets in the Source folder of this lab and
select the TopSalesOrdersByItemCount.sql file. Finally click OK.
T-SQL
Select top 100
f.SalesOrderNumber
,c.FirstName
,c.LastName
8/6/2019 Reportins Services 2008R2 Nuevas Caracteristicas
http://slidepdf.com/reader/full/reportins-services-2008r2-nuevas-caracteristicas 50/93
,count(f.SalesOrderNumber) NumberOfItems
,SUM(f.TotalProductCost) TotalCost
,SUM(f.SalesAmount) TotalSalesAmount
From dbo.FactInternetSales f
Inner Join dbo.DimCustomer c
On f.CustomerKey = c.CustomerKey
Group by f.SalesOrderNumber
,c.FirstName
,c.LastName
Order by COUNT(f.salesordernumber) desc,SUM(f.salesamount) desc
Figure 41
Designing the query step
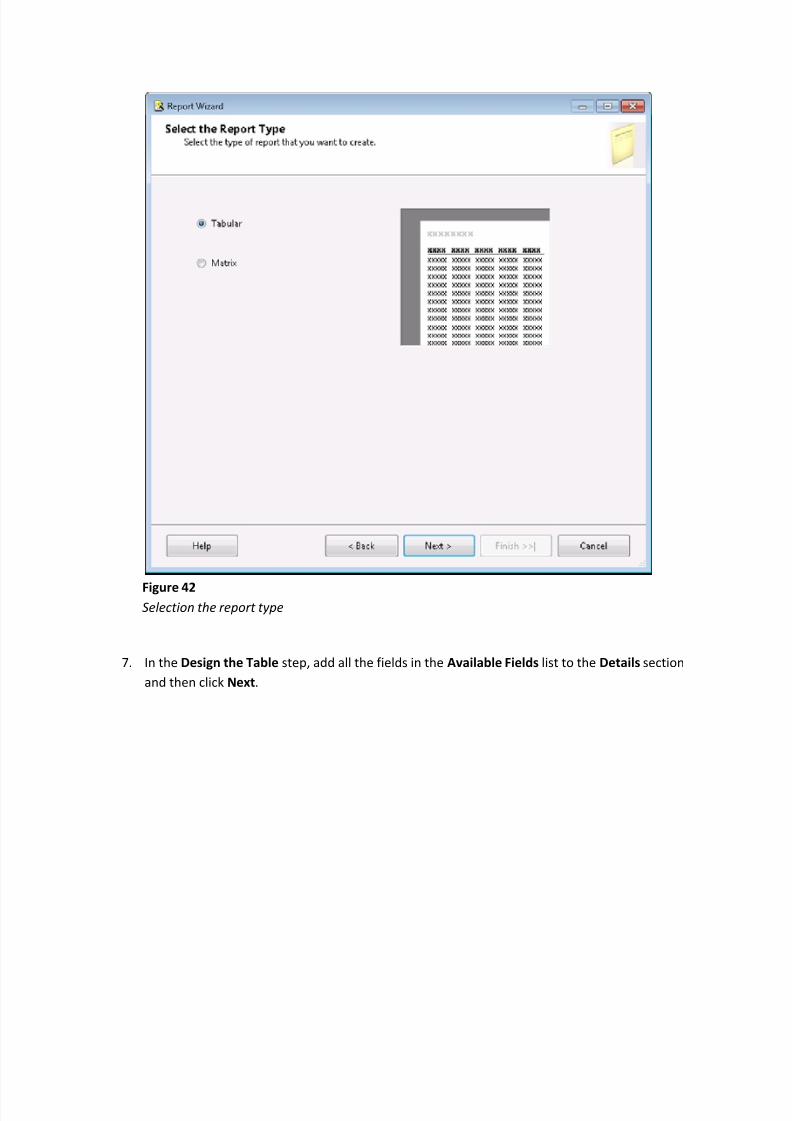
6. In the Select the Report Type step, select the Tabular radio button then click Next.
8/6/2019 Reportins Services 2008R2 Nuevas Caracteristicas
http://slidepdf.com/reader/full/reportins-services-2008r2-nuevas-caracteristicas 51/93
Figure 42Selection the report type
7. In the Design the Table step, add all the fields in the Available Fields list to the Details section
and then click Next.

8/6/2019 Reportins Services 2008R2 Nuevas Caracteristicas
http://slidepdf.com/reader/full/reportins-services-2008r2-nuevas-caracteristicas 52/93
Figure 43Choosing how to group the d ata in the table
8. In the Choose the Table Style step, select the Corporate table style then click Next.

8/6/2019 Reportins Services 2008R2 Nuevas Caracteristicas
http://slidepdf.com/reader/full/reportins-services-2008r2-nuevas-caracteristicas 53/93
Figure 44Choosing the table style
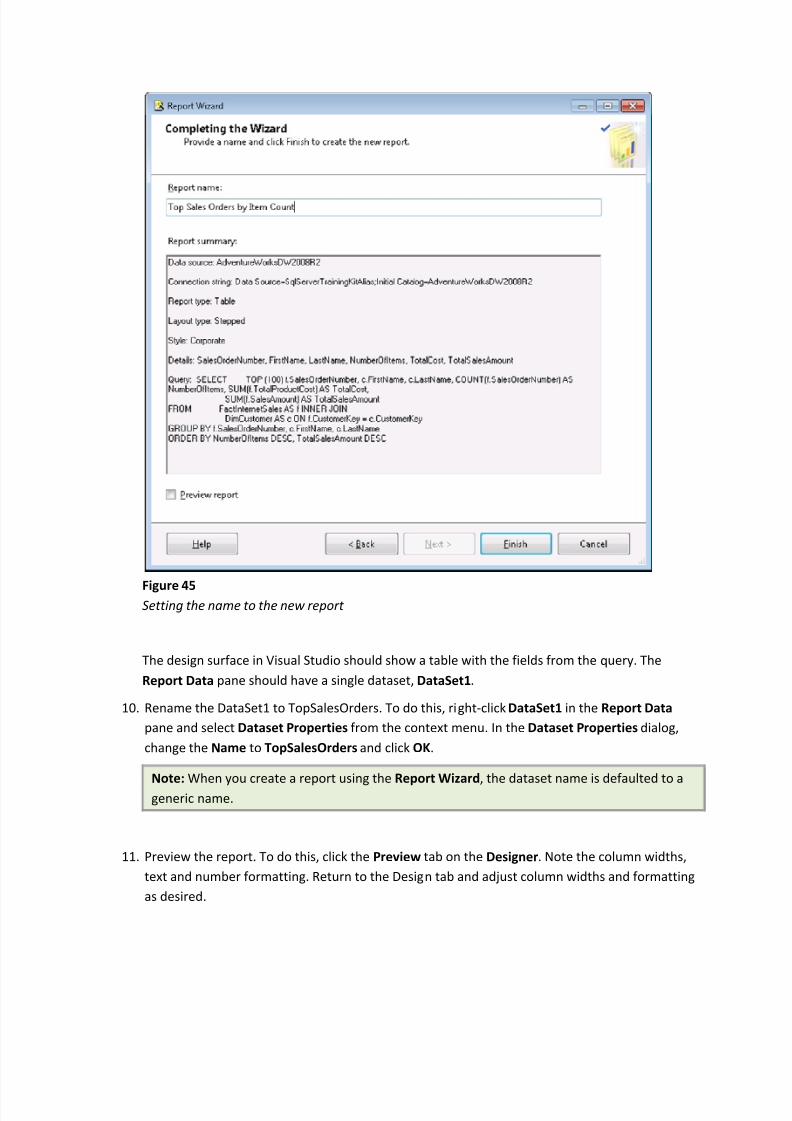
9. In the Completing the Wizard step, set the reports name as Top Sales Orders by Item Count
and then click Finish.
8/6/2019 Reportins Services 2008R2 Nuevas Caracteristicas
http://slidepdf.com/reader/full/reportins-services-2008r2-nuevas-caracteristicas 54/93
Figure 45Setting the name to the new report
The design surface in Visual Studio should show a table with the fields from the query. The
Report Data pane should have a single dataset, DataSet1.
10. Rename the DataSet1 to TopSalesOrders. To do this, right-click DataSet1 in the Report Data
pane and select Dataset Properties from the context menu. In the Dataset Properties dialog,
change the Name to TopSalesOrders and click OK.
Note: When you create a report using the Report Wizard, the dataset name is defaulted to a
generic name.
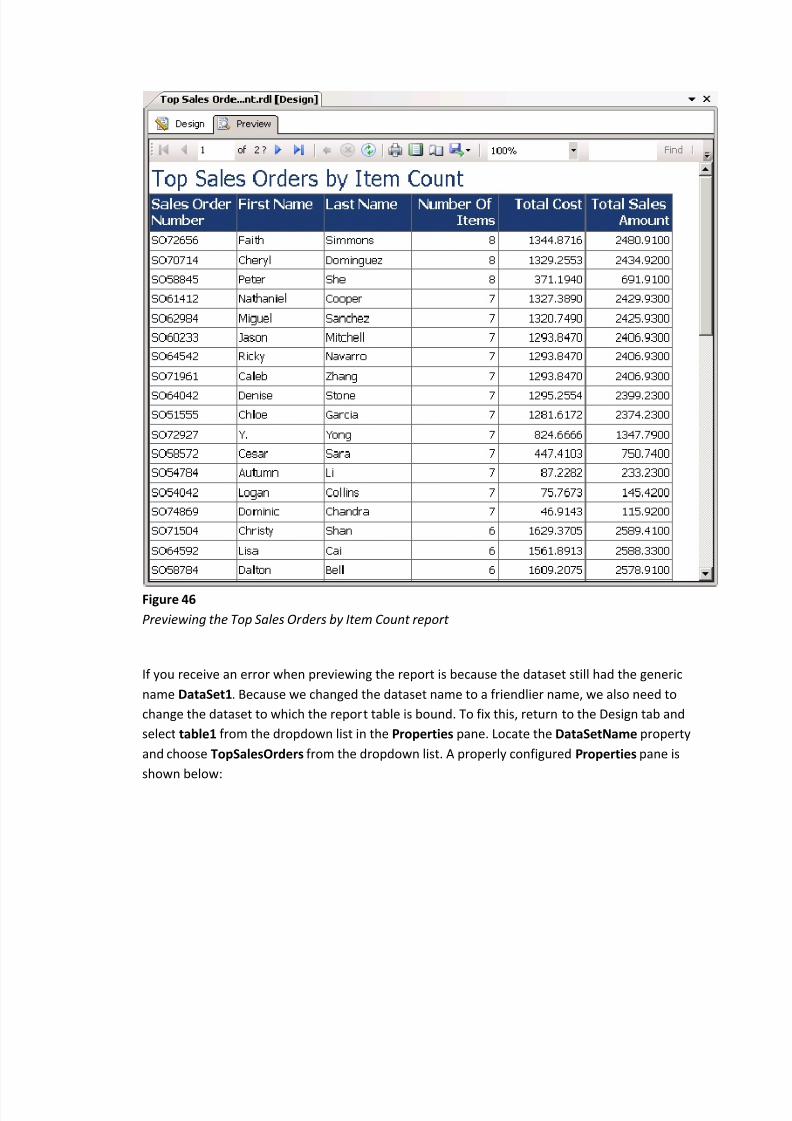
11. Preview the report. To do this, click the Preview tab on the Designer. Note the column widths,
text and number formatting. Return to the Design tab and adjust column widths and formatting
as desired.
8/6/2019 Reportins Services 2008R2 Nuevas Caracteristicas
http://slidepdf.com/reader/full/reportins-services-2008r2-nuevas-caracteristicas 55/93
Figure 46
Previewing the Top Sales Or d ers by Item Count report
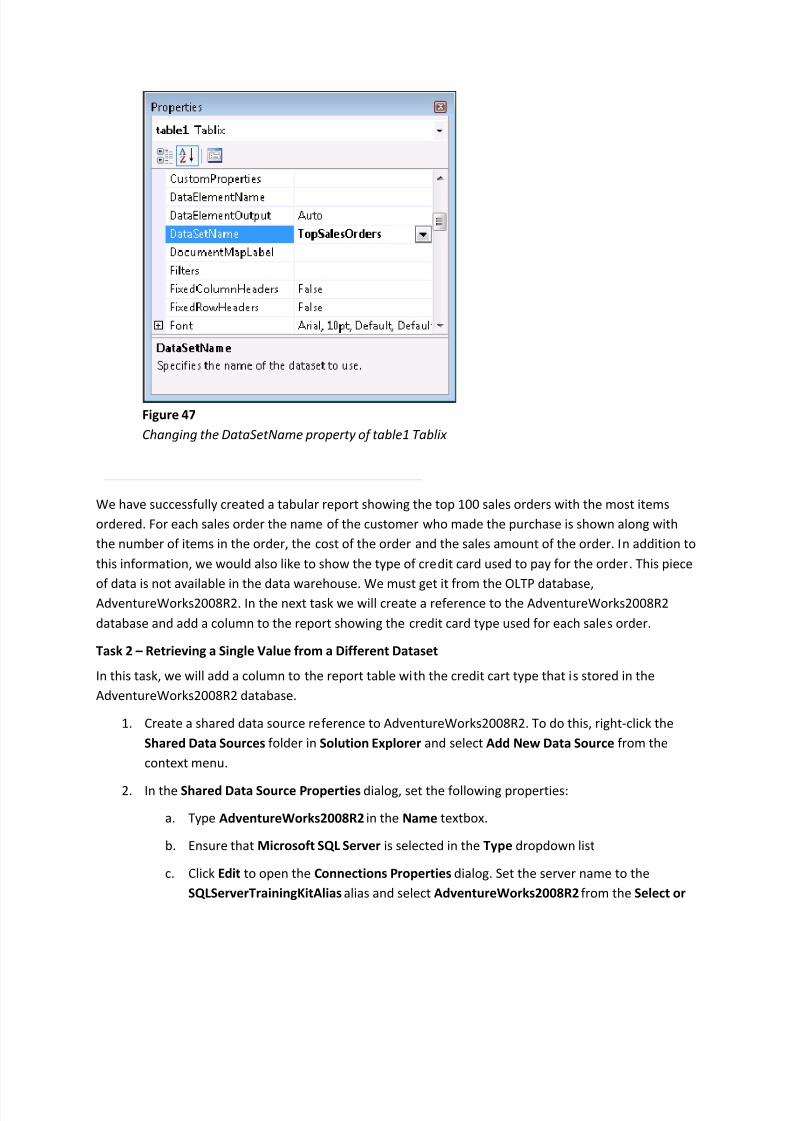
If you receive an error when previewing the report is because the dataset still had the generic
name DataSet1. Because we changed the dataset name to a friendlier name, we also need to
change the dataset to which the report table is bound. To fix this, return to the Design tab and
select table1 from the dropdown list in the Properties pane. Locate the DataSetName property
and choose TopSalesOrders from the dropdown list. A properly configured Properties pane is
shown below:
8/6/2019 Reportins Services 2008R2 Nuevas Caracteristicas
http://slidepdf.com/reader/full/reportins-services-2008r2-nuevas-caracteristicas 56/93
Figure 47
Changing the DataSetName property of table1 Tablix
We have successfully created a tabular report showing the top 100 sales orders with the most items
ordered. For each sales order the name of the customer who made the purchase is shown along with
the number of items in the order, the cost of the order and the sales amount of the order. In addition to
this information, we would also like to show the type of credit card used to pay for the order. This piece
of data is not available in the data warehouse. We must get it from the OLTP database,AdventureWorks2008R2. In the next task we will create a reference to the AdventureWorks2008R2
database and add a column to the report showing the credit card type used for each sales order.
Task 2 Retrieving a Single Value from a Different Dataset
In this task, we will add a column to the report table with the credit cart type that is stored in the
AdventureWorks2008R2 database.
1. Create a shared data source reference to AdventureWorks2008R2. To do this, right-click the
Shared Data Sources folder in Solution Explorer and select Add New Data Source from the
context menu.
2. In the Shared Data Source Properties dialog, set the following properties:
a. Type AdventureWorks2008R2 in the Name textbox.
b. Ensure that Microsoft SQL Server is selected in the Type dropdown list
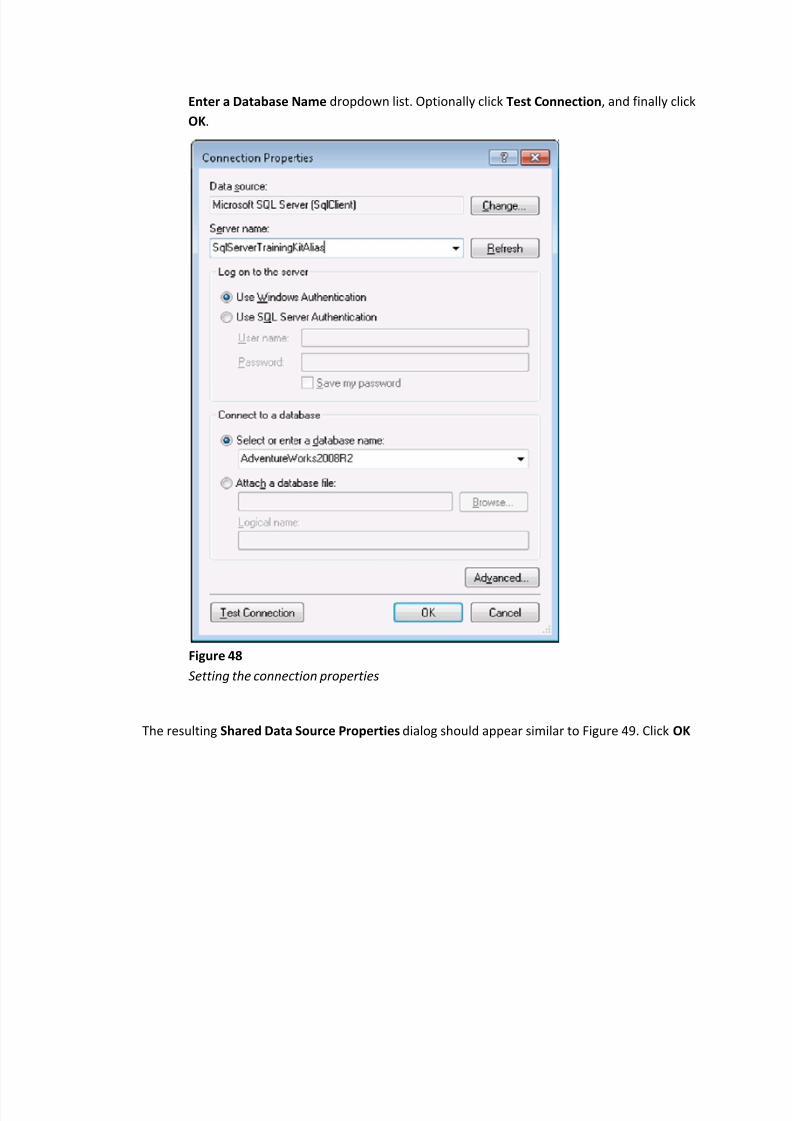
c. Click Edit to open the Connections Properties dialog. Set the server name to the
SQLServerTrainingKitAlias alias and select AdventureWorks2008R2 from the Select or
8/6/2019 Reportins Services 2008R2 Nuevas Caracteristicas
http://slidepdf.com/reader/full/reportins-services-2008r2-nuevas-caracteristicas 57/93
Enter a Database Name dropdown list. Optionally click Test Connection, and finally click
OK.
Figure 48
Setting the connection properties
The resulting Shared Data Source Properties dialog should appear similar to Figure 49. Click OK
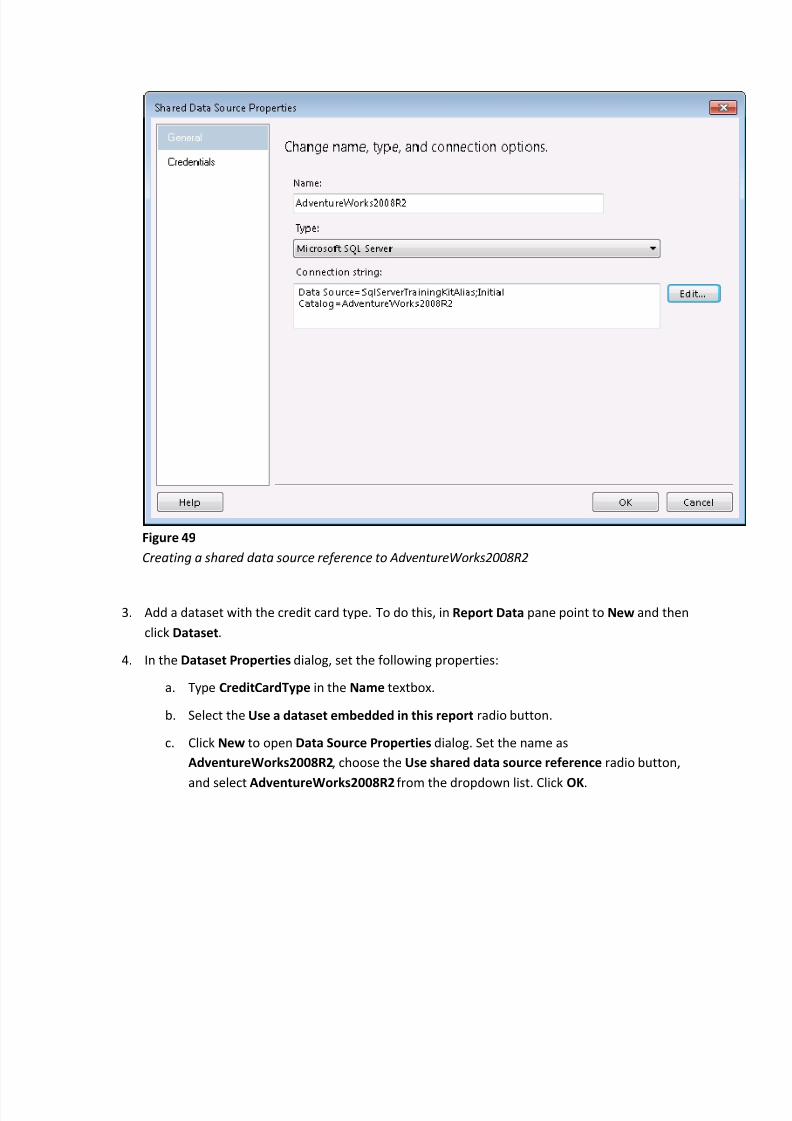
8/6/2019 Reportins Services 2008R2 Nuevas Caracteristicas
http://slidepdf.com/reader/full/reportins-services-2008r2-nuevas-caracteristicas 58/93
Figure 49
Creating a shared d ata source reference to Ad ventureWorks2008R2
3. Add a dataset with the credit card type. To do this, in Report Data pane point to New and then
click Dataset.
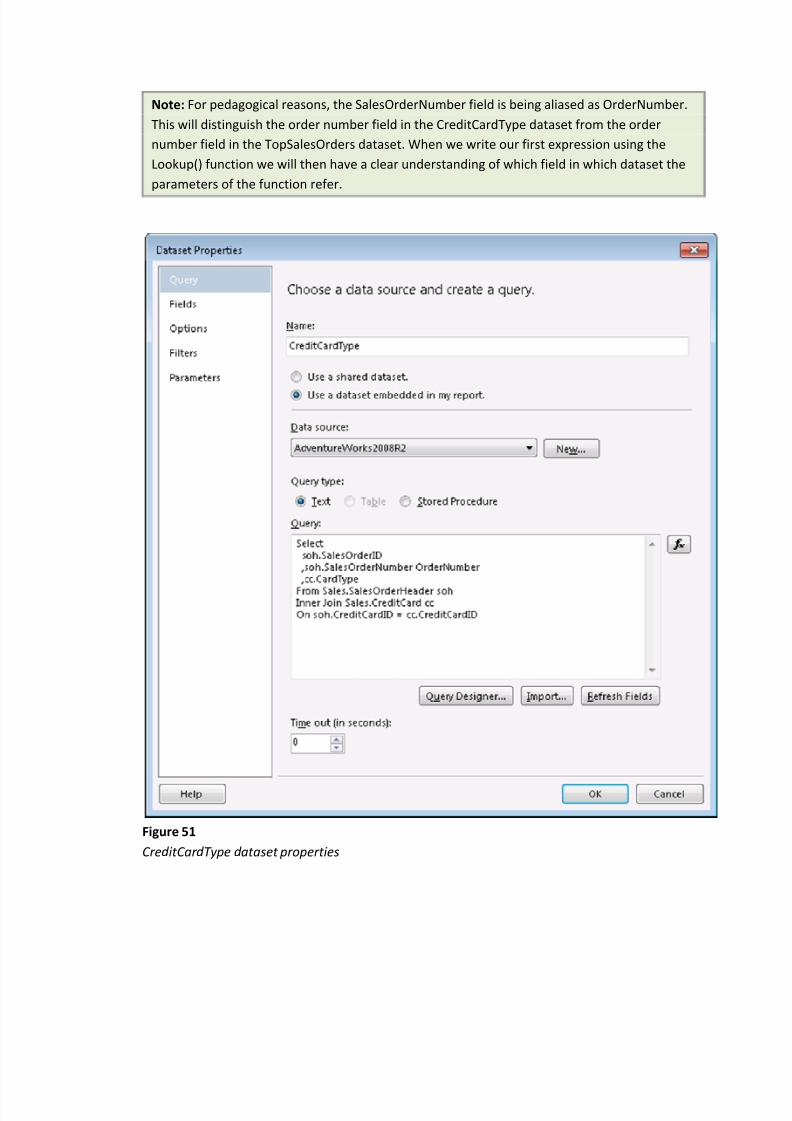
4. In the Dataset Properties dialog, set the following properties:
a. Type CreditCardType in the Name textbox.
b. Select the Use a dataset embedded in this report radio button.
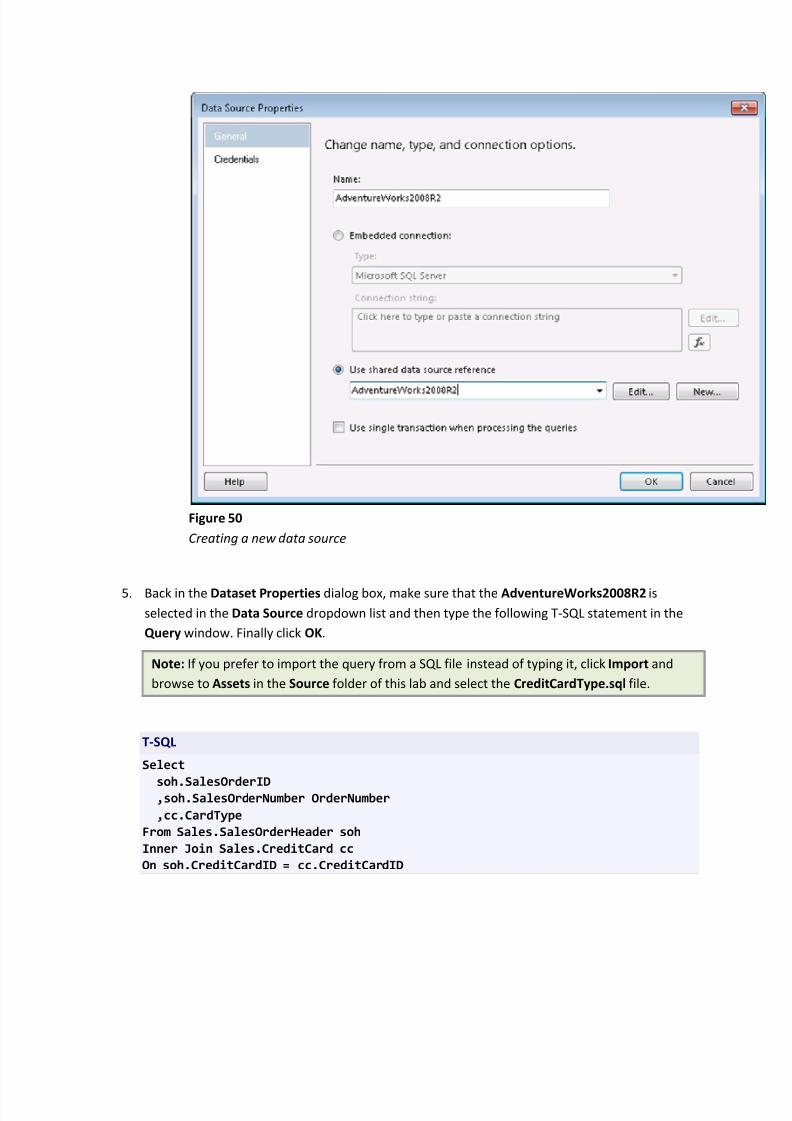
c. Click New to open Data Source Properties dialog. Set the name as
AdventureWorks2008R2, choose the Use shared data source reference radio button,
and select AdventureWorks2008R2 from the dropdown list. Click OK.
8/6/2019 Reportins Services 2008R2 Nuevas Caracteristicas
http://slidepdf.com/reader/full/reportins-services-2008r2-nuevas-caracteristicas 59/93
Figure 50
Creating a new d ata source
5. Back in the Dataset Properties dialog box, make sure that the AdventureWorks2008R2 is
selected in the Data Source dropdown list and then type the following T-SQL statement in the
Query window. Finally click OK.
Note: If you prefer to import the query from a SQL file instead of typing it, click Import and
browse to Assets in the Source folder of this lab and select the CreditCardType.sql file.
T-SQL
Select
soh.SalesOrderID,soh.SalesOrderNumber OrderNumber
,cc.CardType
From Sales.SalesOrderHeader soh
Inner Join Sales.CreditCard cc
On soh.CreditCardID = cc.CreditCardID
8/6/2019 Reportins Services 2008R2 Nuevas Caracteristicas
http://slidepdf.com/reader/full/reportins-services-2008r2-nuevas-caracteristicas 60/93
Note: For pedagogical reasons, the SalesOrderNumber field is being aliased as OrderNumber.
This will distinguish the order number field in the CreditCardType dataset from the order
number field in the TopSalesOrders dataset. When we write our first expression using the
Lookup() function we will then have a clear understanding of which field in which dataset the
parameters of the function refer.
Figure 51
Cred itCar d Type d ataset properties
8/6/2019 Reportins Services 2008R2 Nuevas Caracteristicas
http://slidepdf.com/reader/full/reportins-services-2008r2-nuevas-caracteristicas 61/93
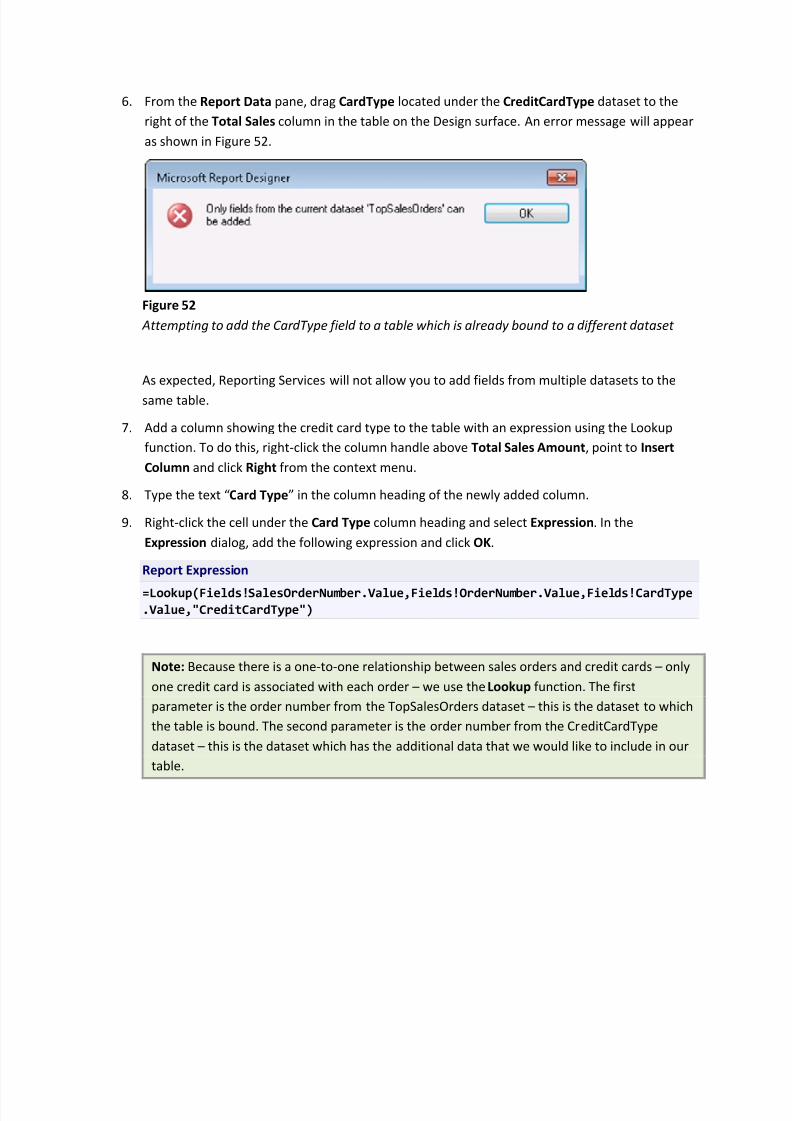
6. From the Report Data pane, drag CardType located under the CreditCardType dataset to the
right of the Total Sales column in the table on the Design surface. An error message will appear
as shown in Figure 52.
Figure 52
Attempting to add the Car d Type fiel d to a table which is alread y bound to a d ifferent d ataset
As expected, Reporting Services will not allow you to add fields from multiple datasets to the
same table.
7. Add a column showing the credit card type to the table with an expression using the Lookup
function. To do this, right-click the column handle above Total Sales Amount, point to Insert
Column and click Right from the context menu.
8. Type the text Card Type in the column heading of the newly added column.
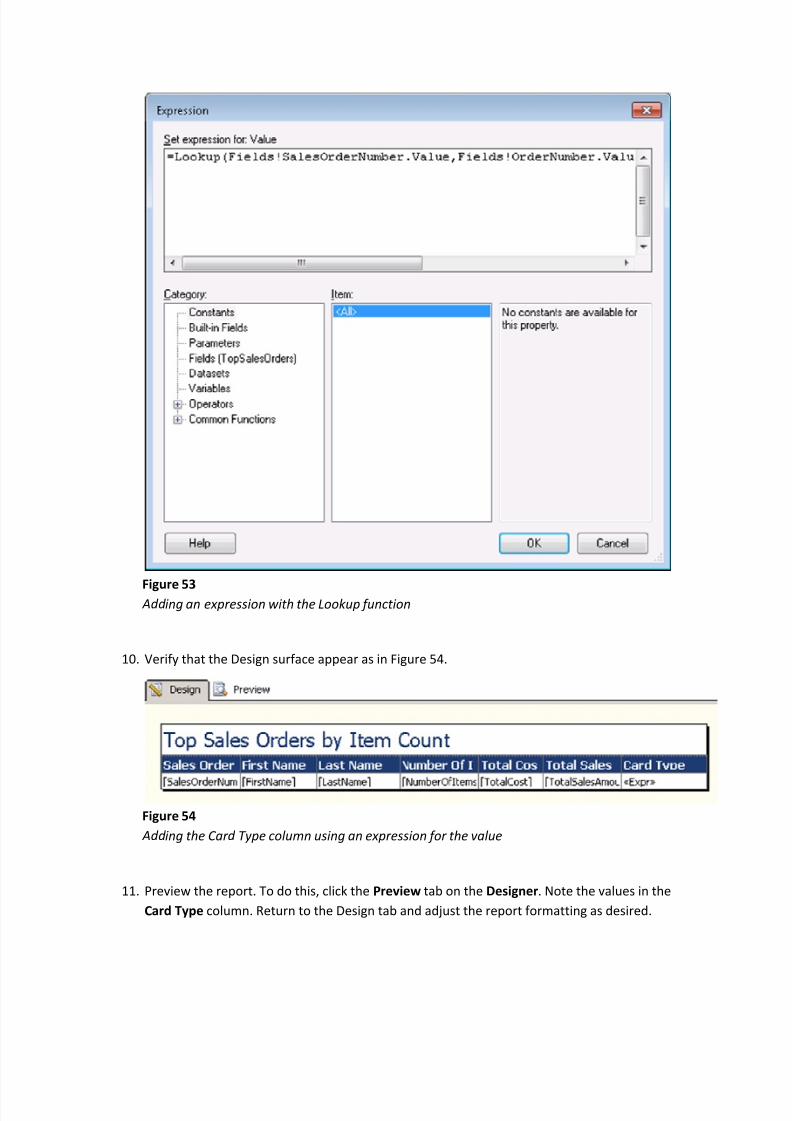
9. Right-click the cell under the Card Type column heading and select Expression. In the
Expression dialog, add the following expression and click OK.
Report Expression
=Lookup(Fields!SalesOrderNumber.Value,Fields!OrderNumber.Value,Fields!CardType.Value,"CreditCardType")
Note: Because there is a one-to-one relationship between sales orders and credit cards only
one credit card is associated with each order we use the Lookup function. The first
parameter is the order number from the TopSalesOrders dataset this is the dataset to which
the table is bound. The second parameter is the order number from the CreditCardType
dataset this is the dataset which has the additional data that we would like to include in our
table.
8/6/2019 Reportins Services 2008R2 Nuevas Caracteristicas
http://slidepdf.com/reader/full/reportins-services-2008r2-nuevas-caracteristicas 62/93
Figure 53 Add ing an expression with the Lookup function
10. Verify that the Design surface appear as in Figure 54.
Figure 54
Add ing the Car d Type column using an expression for the value
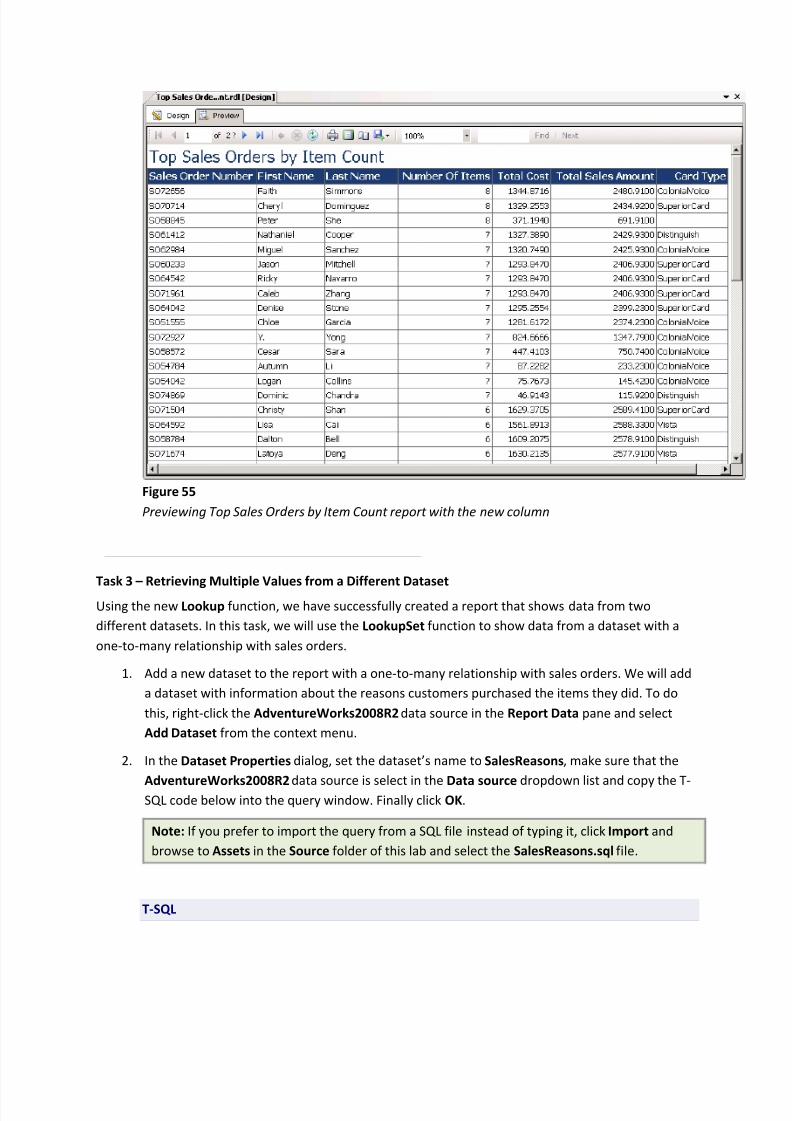
11. Preview the report. To do this, click the Preview tab on the Designer. Note the values in the
Card Type column. Return to the Design tab and adjust the report formatting as desired.
8/6/2019 Reportins Services 2008R2 Nuevas Caracteristicas
http://slidepdf.com/reader/full/reportins-services-2008r2-nuevas-caracteristicas 63/93
Figure 55
Previewing Top Sales Or d ers by Item Count report with the new column
Task 3 Retrieving Multiple Values from a Different Dataset
Using the new Lookup function, we have successfully created a report that shows data from two
different datasets. In this task, we will use the LookupSet function to show data from a dataset with a
one-to-many relationship with sales orders.
1. Add a new dataset to the report with a one-to-many relationship with sales orders. We will add
a dataset with information about the reasons customers purchased the items they did. To do
this, right-click the AdventureWorks2008R2 data source in the Report Data pane and select
Add Dataset from the context menu.
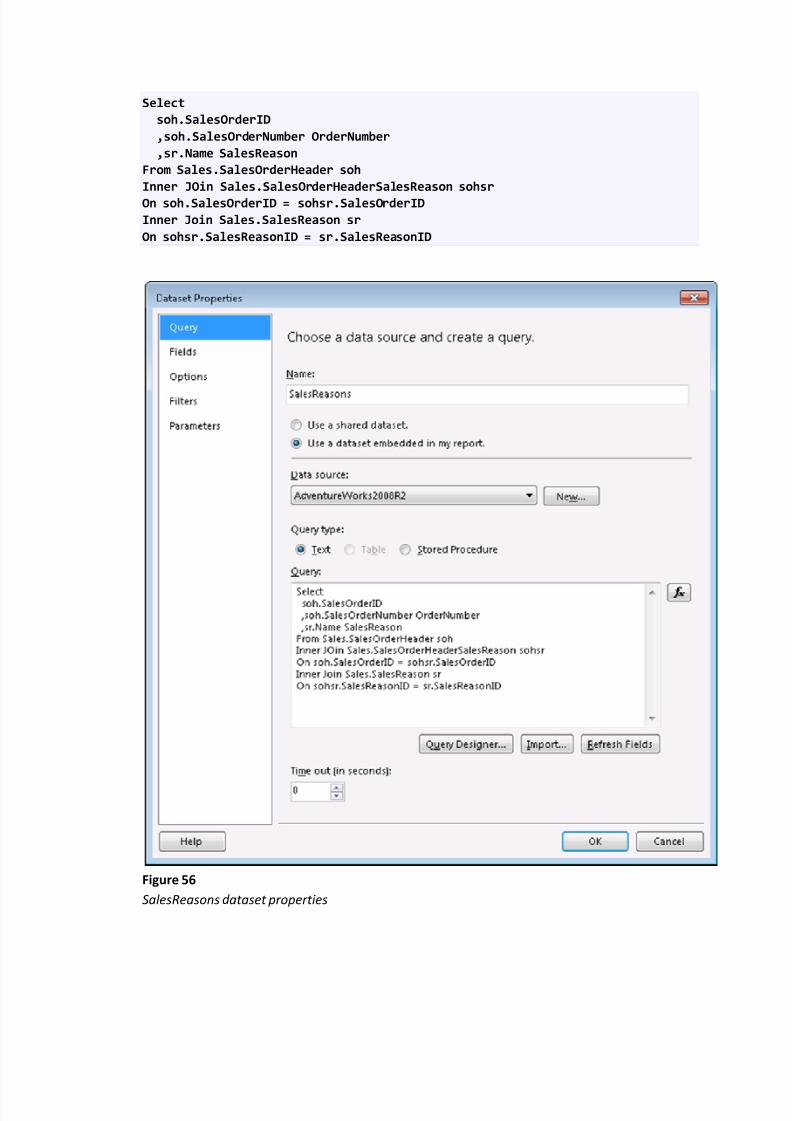
2. In the Dataset Properties dialog, set the datasets name to SalesReasons, make sure that the
AdventureWorks2008R2 data source is select in the Data source dropdown list and copy the T-SQL code below into the query window. Finally click OK.
Note: If you prefer to import the query from a SQL file instead of typing it, click Import and
browse to Assets in the Source folder of this lab and select the SalesReasons.sql file.
T-SQL
8/6/2019 Reportins Services 2008R2 Nuevas Caracteristicas
http://slidepdf.com/reader/full/reportins-services-2008r2-nuevas-caracteristicas 64/93
Select
soh.SalesOrderID
,soh.SalesOrderNumber OrderNumber
,sr.Name SalesReason
From Sales.SalesOrderHeader soh
Inner JOin Sales.SalesOrderHeaderSalesReason sohsr
On soh.SalesOrderID = sohsr.SalesOrderID
Inner Join Sales.SalesReason sr
On sohsr.SalesReasonID = sr.SalesReasonID
Figure 56
SalesReasons d ataset properties
8/6/2019 Reportins Services 2008R2 Nuevas Caracteristicas
http://slidepdf.com/reader/full/reportins-services-2008r2-nuevas-caracteristicas 65/93
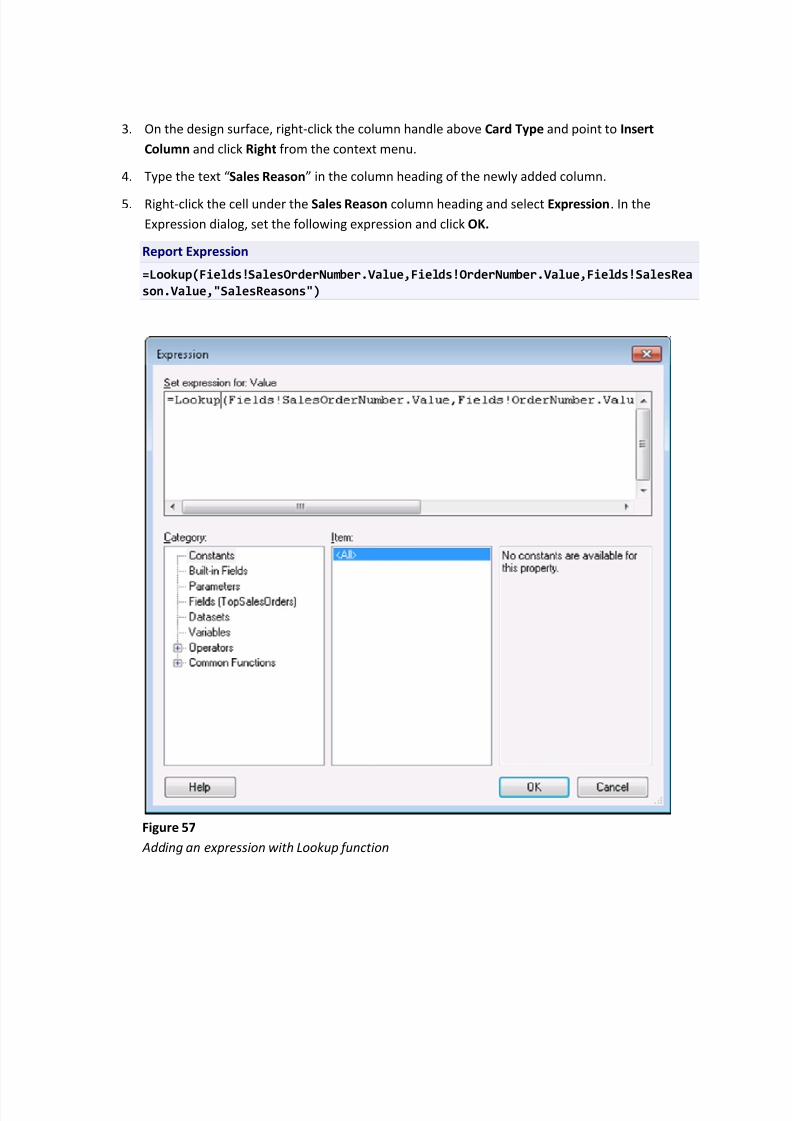
3. On the design surface, right-click the column handle above Card Type and point to Insert
Column and click Right from the context menu.
4. Type the text Sales Reason in the column heading of the newly added column.
5. Right-click the cell under the Sales Reason column heading and select Expression. In the
Expression dialog, set the following expression and click OK.
Report Expression
=Lookup(Fields!SalesOrderNumber.Value,Fields!OrderNumber.Value,Fields!SalesRea
son.Value,"SalesReasons")
Figure 57
Add ing an expression with Lookup function
8/6/2019 Reportins Services 2008R2 Nuevas Caracteristicas
http://slidepdf.com/reader/full/reportins-services-2008r2-nuevas-caracteristicas 66/93
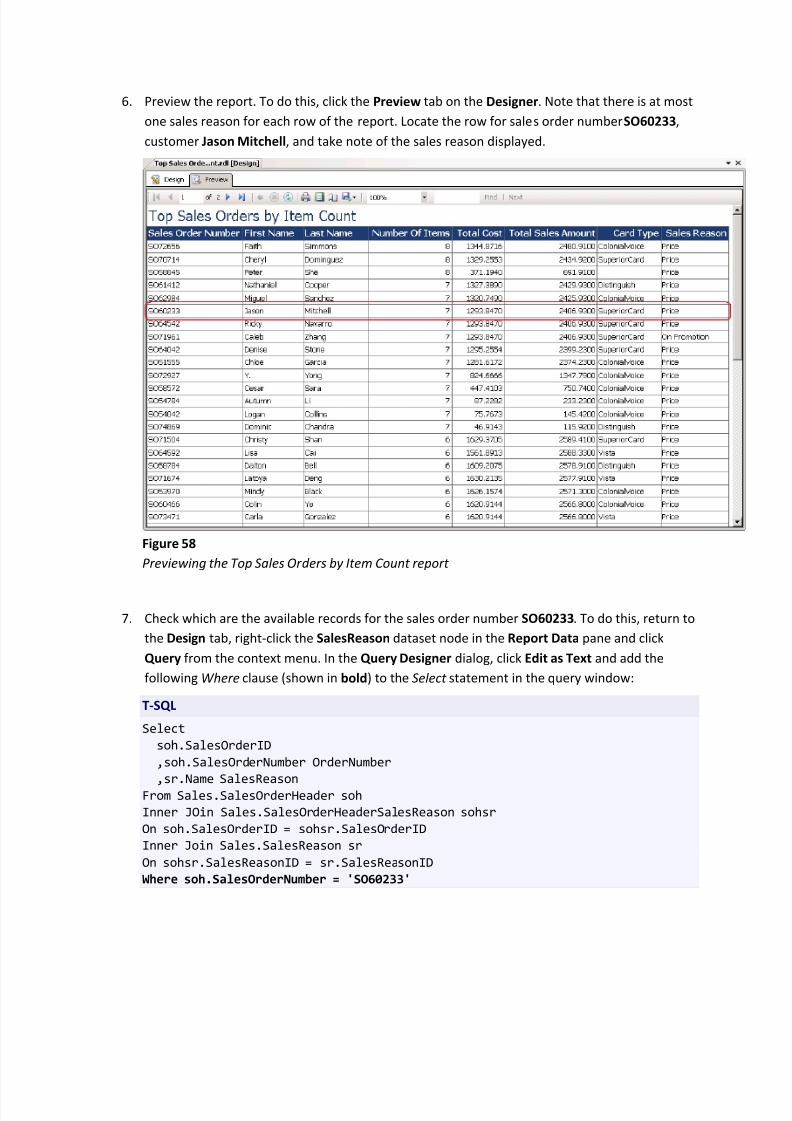
6. Preview the report. To do this, click the Preview tab on the Designer. Note that there is at most
one sales reason for each row of the report. Locate the row for sales order numberSO60233,
customer Jason Mitchell, and take note of the sales reason displayed.
Figure 58
Previewing the Top Sales Or d ers by Item Count report
7. Check which are the available records for the sales order number SO60233. To do this, return to
the Design tab, right-click the SalesReason dataset node in the Report Data pane and click
Query from the context menu. In the Query Designer dialog, click Edit as Text and add the
following Where clause (shown in bold) to the Select statement in the query window:
T-SQL
Select
soh.SalesOrderID
,soh.SalesOrderNumber OrderNumber
,sr.Name SalesReason
From Sales.SalesOrderHeader soh
Inner JOin Sales.SalesOrderHeaderSalesReason sohsr
On soh.SalesOrderID = sohsr.SalesOrderID
Inner Join Sales.SalesReason sr
On sohsr.SalesReasonID = sr.SalesReasonID
Where soh.SalesOrderNumber = 'SO60233'
8/6/2019 Reportins Services 2008R2 Nuevas Caracteristicas
http://slidepdf.com/reader/full/reportins-services-2008r2-nuevas-caracteristicas 67/93
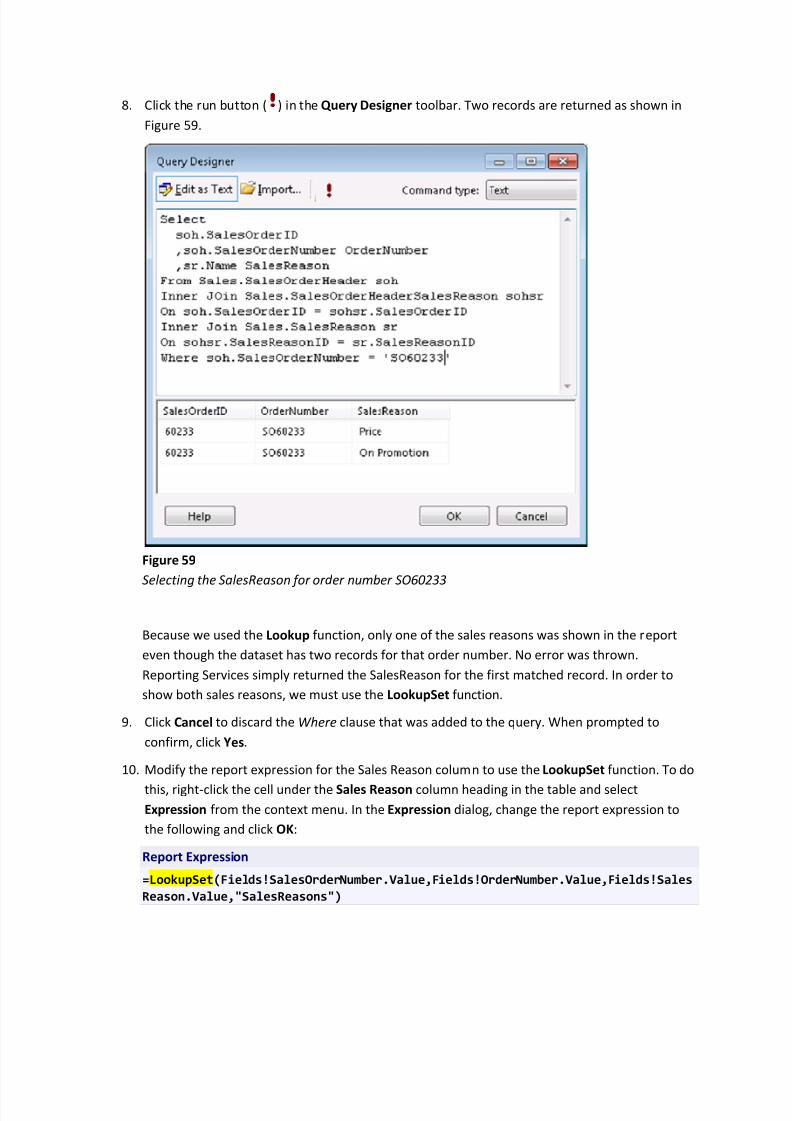
8. Click the run button ( ) in the Query Designer toolbar. Two records are returned as shown in
Figure 59.
Figure 59
Selecting the SalesReason for or d er number SO60233
Because we used the Lookup function, only one of the sales reasons was shown in the report
even though the dataset has two records for that order number. No error was thrown.
Reporting Services simply returned the SalesReason for the first matched record. In order to
show both sales reasons, we must use the LookupSet function.
9. Click Cancel to discard the Where clause that was added to the query. When prompted to
confirm, click Yes.
10. Modify the report expression for the Sales Reason column to use the LookupSet function. To do
this, right-click the cell under the Sales Reason column heading in the table and select
Expression from the context menu. In the Expression dialog, change the report expression to
the following and click OK:
Report Expression
=LookupSet(Fields!SalesOrderNumber.Value,Fields!OrderNumber.Value,Fields!Sales
Reason.Value,"SalesReasons")
8/6/2019 Reportins Services 2008R2 Nuevas Caracteristicas
http://slidepdf.com/reader/full/reportins-services-2008r2-nuevas-caracteristicas 68/93
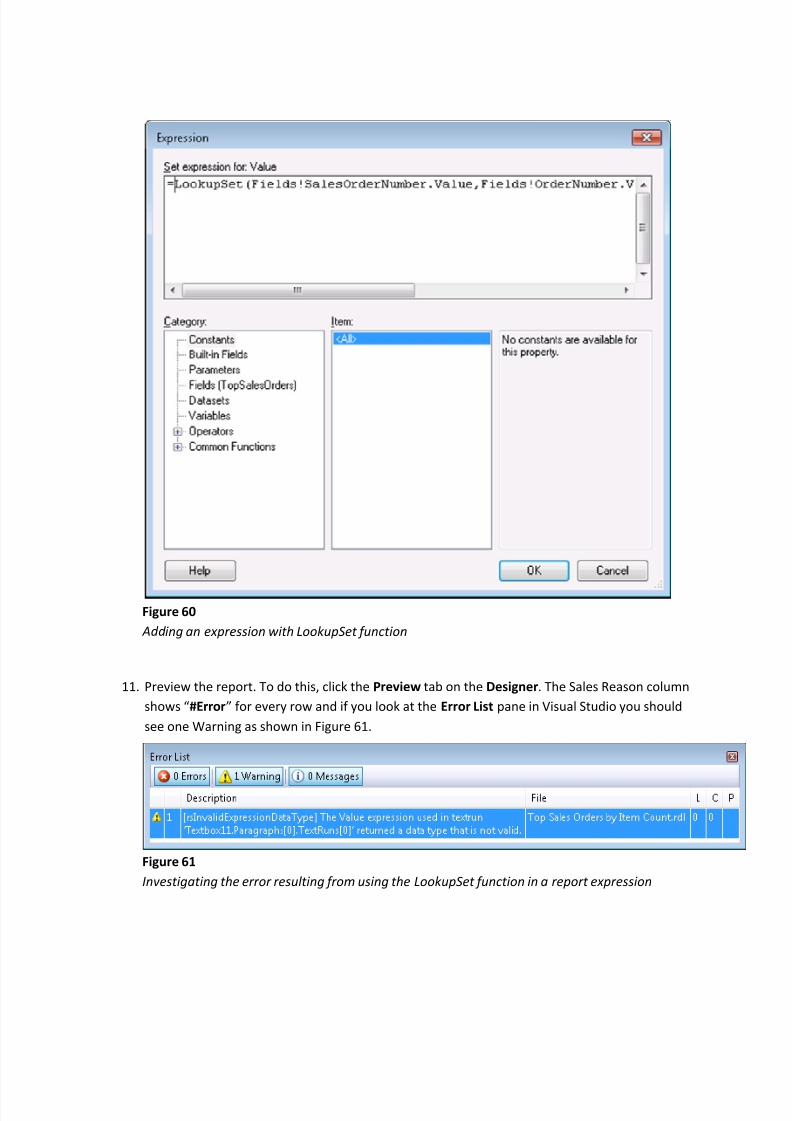
Figure 60
Add ing an expression with LookupSet function
11. Preview the report. To do this, click the Preview tab on the Designer. The Sales Reason column
shows #Error for every row and if you look at the Error List pane in Visual Studio you should
see one Warning as shown in Figure 61.
Figure 61
Investigating the error resulting from using the LookupSet function in a report expression

8/6/2019 Reportins Services 2008R2 Nuevas Caracteristicas
http://slidepdf.com/reader/full/reportins-services-2008r2-nuevas-caracteristicas 69/93
Note: Recall from the introduction to the exercise that the LookupSet function returns an
array. An array cannot be displayed in a text box; therefore this warning is raised and the
report displays errors rather than the expected sales reasons.
12. In order to display the sales reasons without error in the table, flatten the values from the array
by wrapping the result from LookupSet in a Join function. To do this, return to the Design tab,
right-click the cell below the Sales Reason column heading and select Expression from the
context menu. In the Expression dialog, change the report expression to the following and click
OK:
Report Expression
=Join(LookupSet(Fields!SalesOrderNumber.Value,Fields!OrderNumber.Value,Fields!
SalesReason.Value,"SalesReasons"),", ")
Figure 62
Wrapping the result from LookupSet in a Join function
8/6/2019 Reportins Services 2008R2 Nuevas Caracteristicas
http://slidepdf.com/reader/full/reportins-services-2008r2-nuevas-caracteristicas 70/93
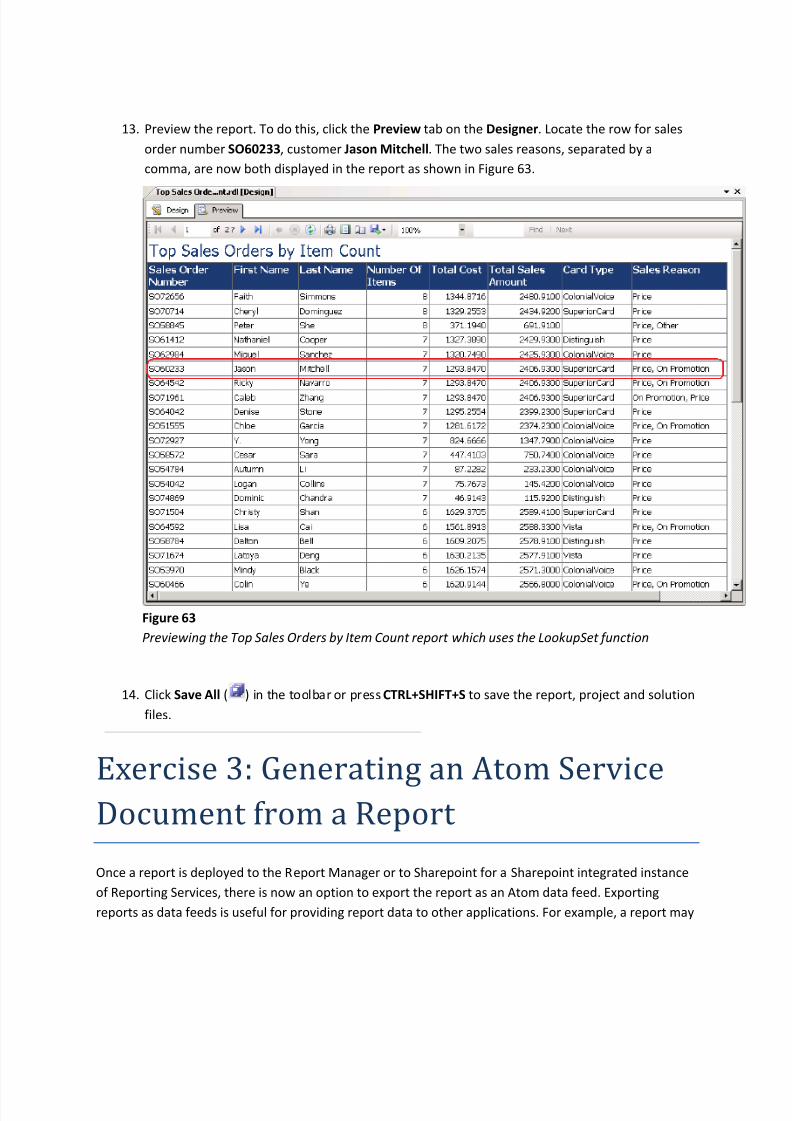
13. Preview the report. To do this, click the Preview tab on the Designer. Locate the row for sales
order number SO60233, customer Jason Mitchell. The two sales reasons, separated by a
comma, are now both displayed in the report as shown in Figure 63.
Figure 63
Previewing the Top Sales Or d ers by Item Count report which uses the LookupSet function
14. Click Save All ( ) in the toolbar or pressCTRL+SHIFT+S to save the report, project and solution
files.
Ex
ercise 3: Generating an Atom ServiceDocument from a Report
Once a report is deployed to the Report Manager or to Sharepoint for a Sharepoint integrated instance
of Reporting Services, there is now an option to export the report as an Atom data feed. Exporting
reports as data feeds is useful for providing report data to other applications. For example, a report may
8/6/2019 Reportins Services 2008R2 Nuevas Caracteristicas
http://slidepdf.com/reader/full/reportins-services-2008r2-nuevas-caracteristicas 71/93
pull together data from many different sources that are not readily available to the application; or there
may be business logic embedded in the report that would be difficult to replicate in the application.
Atom data feeds can also be imported by the new Microsoft SQL Server PowerPivot for Excel 2010. This
would allow business users to import report data which they know well and work with it in Excel without
requiring them to understand the complexities of connecting to and querying the source data behind
the report.
In this exercise, we will export the Top Sales Orders by Item Count report that was created inExercise 2
as an Atom data feed. When a report is exported as an Atom data feed, Reporting Services creates an
Atom service document. The service document lists the data feeds available for the report. One or more
data feeds are generated for each data region in a report. As a general rule, one data feed is generated
for tables and gauges; one or more data feeds may be generated for matrices, tablixes, lists and charts.
Note: This exercise requires Microsoft SharePoint 2010. If you are not willing to install and configure
SharePoint in your environment, you can skip this exercise.
Task 1 Exporting a Report to a Data Feed
1. In the File menu, choose Open and then Project/Solution. In the Open Project dialog, browse
to Ex3-AtomDataFeed\Begin in the Source folder of this lab, select Begin.sln and click Open.
Alternatively, you may continue working with the solution obtained after completing the
previous exercise.
2. Set the package deployment configuration to deploy the report. To do this, right-click the
SSRSR2Lab package node in Solution Explorer and select Properties from the context menu.
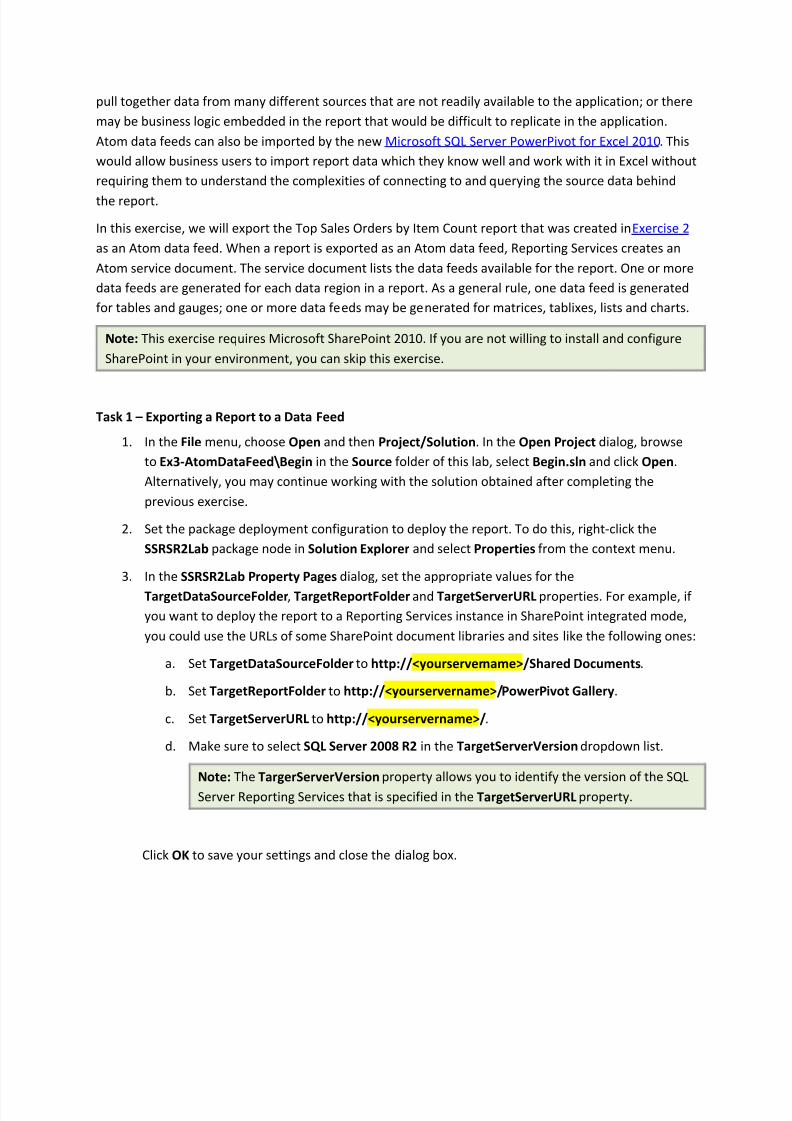
3. In the SSRSR2Lab Property Pages dialog, set the appropriate values for the
TargetDataSourceFolder, TargetReportFolder and TargetServerURL properties. For example, if
you want to deploy the report to a Reporting Services instance in SharePoint integrated mode,
you could use the URLs of some SharePoint document libraries and sites like the following ones:
a. Set TargetDataSourceFolder to http://<yourservername>/Shared Documents.
b. Set TargetReportFolder to http://<yourservername>/PowerPivot Gallery.
c. Set TargetServerURL to http://<yourservername>/.
d. Make sure to select SQL Server 2008 R2 in the TargetServerVersion dropdown list.
Note: The TargerServerVersion property allows you to identify the version of the SQL
Server Reporting Services that is specified in the TargetServerURL property.
Click OK to save your settings and close the dialog box.
8/6/2019 Reportins Services 2008R2 Nuevas Caracteristicas
http://slidepdf.com/reader/full/reportins-services-2008r2-nuevas-caracteristicas 72/93
Figure 64
Setting the d eployment properties for the report project
4. Deploy the Top Sales Orders by Item Count report and both data sources
(AdventureWorksDW2008R2 and AdventureWorks2008R2). To do this, perform these steps:
a. Right-click AdventureWorksDW2008R2.rdsunder Shared Data Sources folder in
Solution Explorer and select Deploy from the context menu.
b. Right-click AdventureWorks2008R2.rdsunder Shared Data Sources folder in Solution
Explorer and select Deploy from the context menu.
c. Right-click Top Sales Orders by Item Count.rdl under the Reports folder in Solution
Explorer and select Deploy from the context menu.
5. Open an instance of Internet Explorer and navigate to your Report Manager or to the
SharePoint document library to which the report was deployed. For example,
http://<yourservername>/PowerPivot Gallery.
6.
Run the Top Sales by Item Count report. To do this, double-click over the Top Sales by ItemCount item in the gallery. You should see something similar to Figure 65.
8/6/2019 Reportins Services 2008R2 Nuevas Caracteristicas
http://slidepdf.com/reader/full/reportins-services-2008r2-nuevas-caracteristicas 73/93
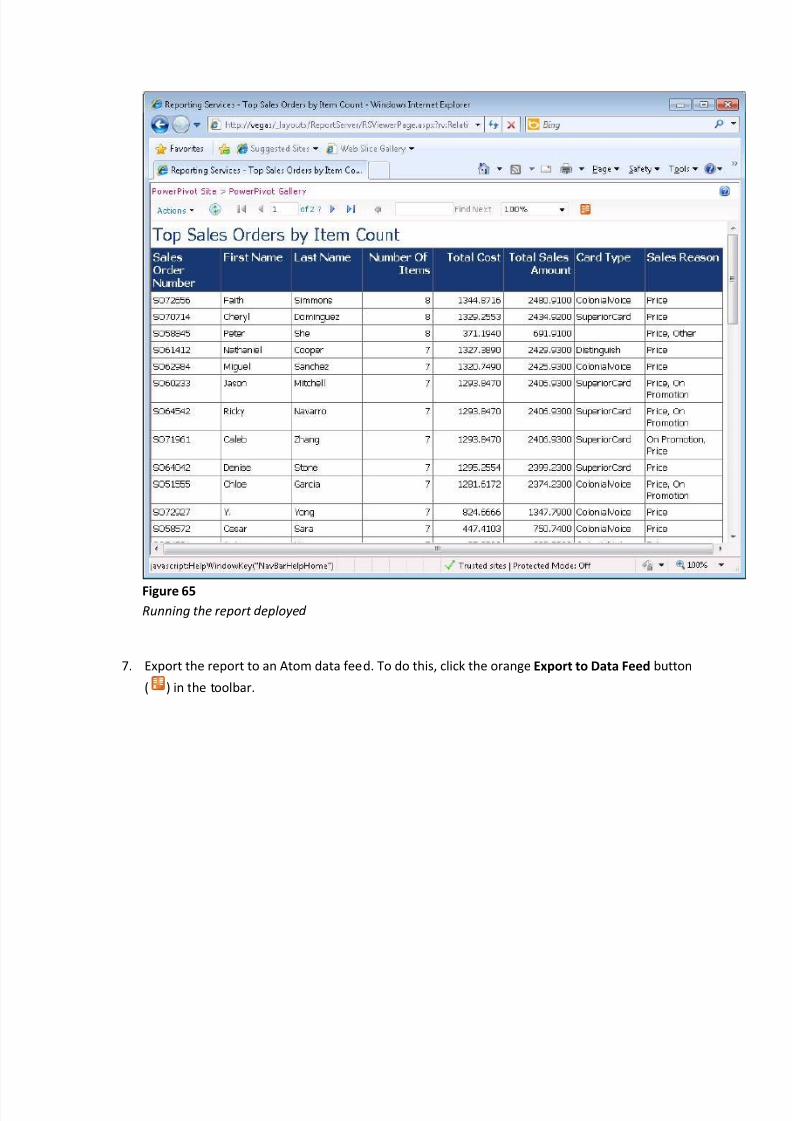
Figure 65Running the report d eployed
7. Export the report to an Atom data feed. To do this, click the orange Export to Data Feed button
( ) in the toolbar.
8/6/2019 Reportins Services 2008R2 Nuevas Caracteristicas
http://slidepdf.com/reader/full/reportins-services-2008r2-nuevas-caracteristicas 74/93
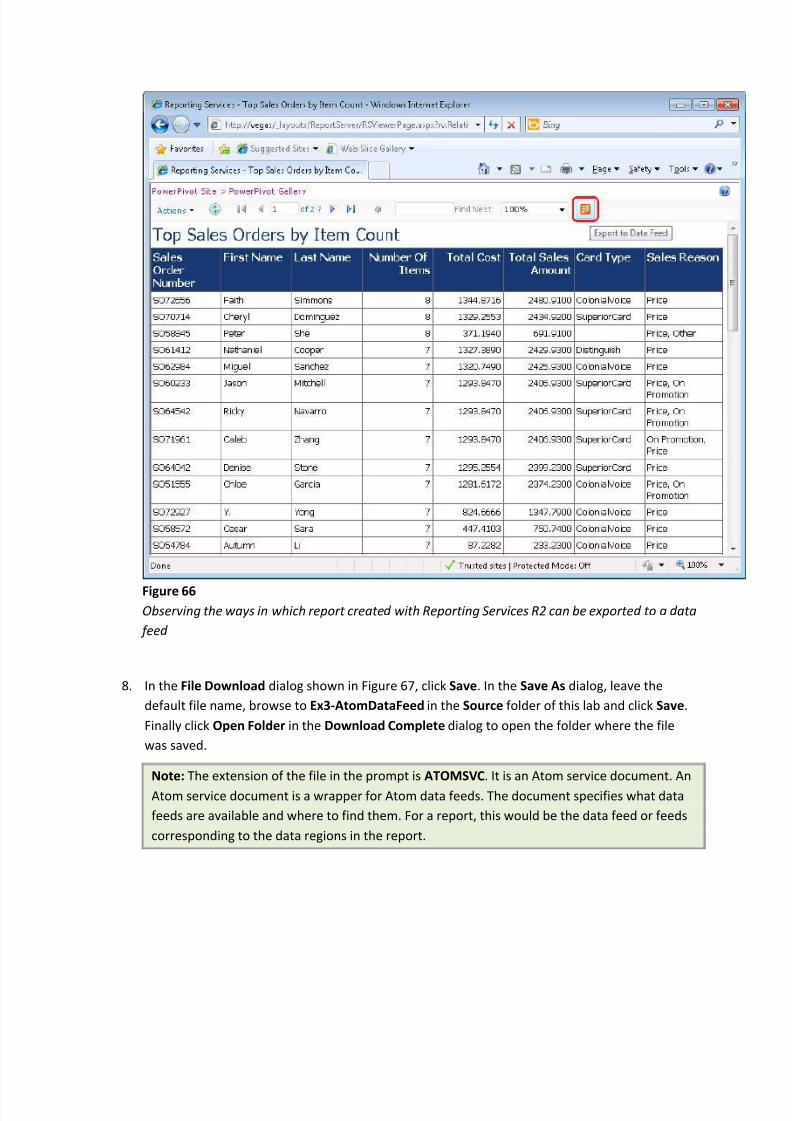
Figure 66Observing the ways in which report created with Reporting Services R2 can be exported to a d ata
feed
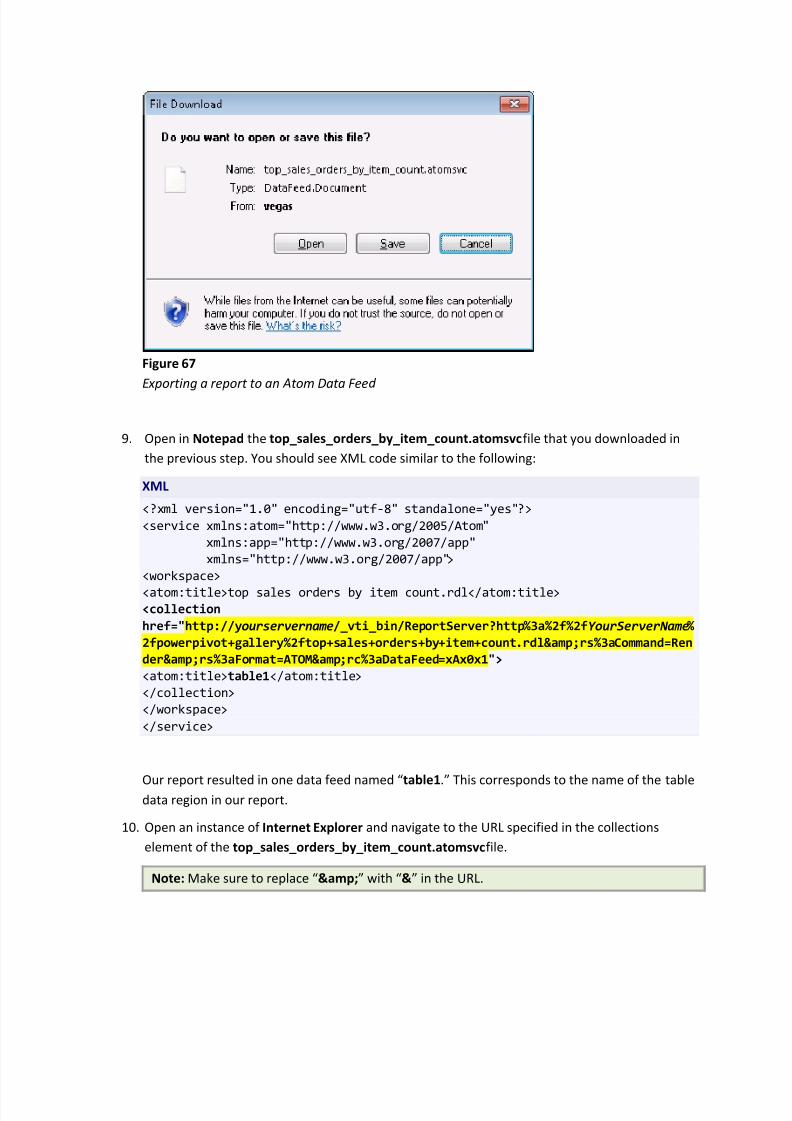
8. In the File Download dialog shown in Figure 67, click Save. In the Save As dialog, leave the
default file name, browse to Ex3-AtomDataFeed in the Source folder of this lab and click Save.
Finally click Open Folder in the Download Complete dialog to open the folder where the file
was saved.
Note: The extension of the file in the prompt is ATOMSVC. It is an Atom service document. An
Atom service document is a wrapper for Atom data feeds. The document specifies what data
feeds are available and where to find them. For a report, this would be the data feed or feeds
corresponding to the data regions in the report.
8/6/2019 Reportins Services 2008R2 Nuevas Caracteristicas
http://slidepdf.com/reader/full/reportins-services-2008r2-nuevas-caracteristicas 75/93
Figure 67
E xporting a report to an Atom Data Feed
9. Open in Notepad the top_sales_orders_by_item_count.atomsvcfile that you downloaded in
the previous step. You should see XML code similar to the following:
XML
<?xml version="1.0" encoding="utf-8" standalone="yes"?>
<service xmlns:atom="http://www.w3.org/2005/Atom"
xmlns:app="http://www.w3.org/2007/app"
xmlns="http://www.w3.org/2007/app">
<workspace>
<atom:title>top sales orders by item count.rdl</atom:title> <collection
href="http://yourservername/_vti_bin/ReportServer?http%3a%2f%2fYourServerName%
2fpowerpivot+gallery%2ftop+sales+orders+by+item+count.rdl&rs%3aCommand=Ren
der&rs%3aFormat=ATOM&rc%3aDataFeed=xAx0x1">
<atom:title>table1</atom:title>
</collection>
</workspace>
</service>
Our report resulted in one data feed named table1. This corresponds to the name of the tabledata region in our report.
10. Open an instance of Internet Explorer and navigate to the URL specified in the collections
element of the top_sales_orders_by_item_count.atomsvcfile.
Note: Make sure to replace & with & in the URL.
8/6/2019 Reportins Services 2008R2 Nuevas Caracteristicas
http://slidepdf.com/reader/full/reportins-services-2008r2-nuevas-caracteristicas 76/93
11. In the File Download dialog, click Save. In the Save As dialog, leave the default file name,
browse to Ex3-AtomDataFeed in the Setup folder of this lab and click Save. Finally click Open
Folder in the Download Complete dialog to open the folder where the file was saved.
Note: The file has an ATOM extension. It is an Atom data feed file.
12. Open the top_sales_orders_by_item_count.rdl.atom file in Notepad, and search for the word
entry in the file. You should find a XML fragment similar to the following one:
XML
<?xml version="1.0" encoding="utf-8" standalone="yes"?>
<feed>
...
<entry>
<id>uuid:65963d6f-13eb-4fc2-9c3f-31fbff1226b4;id=305</id>
<title type="text"></title>
<updated>2009-10-09T15:36:21Z</updated>
<author />
<content type="application/xml">
<m:properties>
<d:SalesOrderNumber>SO72656</d:SalesOrderNumber>
<d:FirstName>Faith</d:FirstName>
<d:LastName>Simmons</d:LastName>
<d:NumberOfItems m:type="Edm.Int32">8</d:NumberOfItems>
<d:TotalCost m:type="Edm.Decimal">1344.8716</d:TotalCost>
<d:TotalSalesAmount
m:type="Edm.Decimal">2480.9100</d:TotalSalesAmount>
<d:Textbox11>ColonialVoice</d:Textbox11> <d:Textbox13>Price</d:Textbox13>
</m:properties>
</content>
</entry>
...
</feed>
Note: Each entry fragment corresponds to a row from the table of the report. We see the
columns from the table including the two fields that we retrieved from other datasets.
Task 2 Assigning Friendly Names to Report Elements
So far, we have successfully generated an Atom service document for a report. However, the data feed
is not particularly user friendly in its current state. The data feed itself has the generic name table1.
Furthermore, the two columns of data retrieved by using lookup functions against other datasets have
8/6/2019 Reportins Services 2008R2 Nuevas Caracteristicas
http://slidepdf.com/reader/full/reportins-services-2008r2-nuevas-caracteristicas 77/93
the generic names of Textbox11 and Textbox13 (the numbers of your textboxes may differ). In this
task, we will modify the report to give these items more meaningful names for exporting it to data
feeds.
1. Back in Visual Studio, in the File menu choose Open and then Project/Solution. In the Open
Project dialog, browse to Ex3-AtomDataFeed\Begin in the Source folder of this lab, select
Begin.sln and click Open. Alternatively, you may continue working with the solution obtained
after completing the previous exercise.
2. Select the Design tab for the Top Sales Orders by Item Count report.
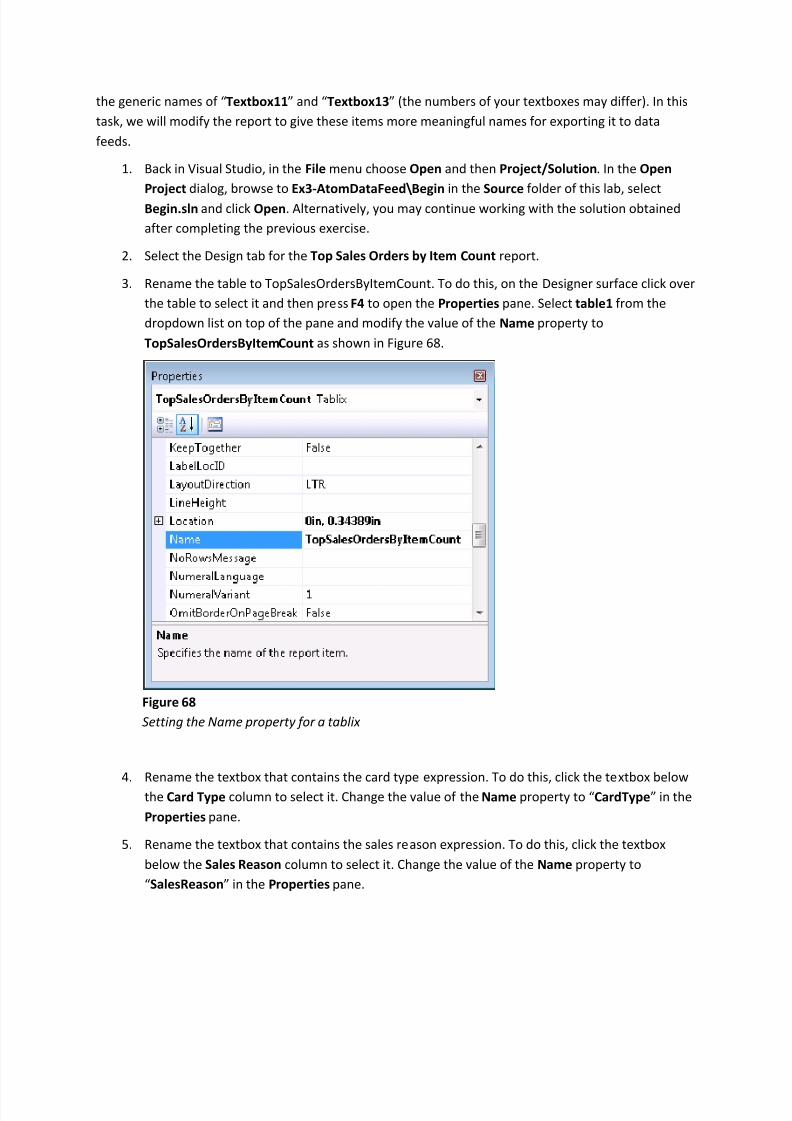
3. Rename the table to TopSalesOrdersByItemCount. To do this, on the Designer surface click over
the table to select it and then press F4 to open the Properties pane. Select table1 from the
dropdown list on top of the pane and modify the value of the Name property to
TopSalesOrdersByItemCount as shown in Figure 68.
Figure 68
Setting the Name property for a tablix
4. Rename the textbox that contains the card type expression. To do this, click the textbox below
the Card Type column to select it. Change the value of theName property to CardType in the
Properties pane.
5. Rename the textbox that contains the sales reason expression. To do this, click the textbox
below the Sales Reason column to select it. Change the value of the Name property to
SalesReason in the Properties pane.
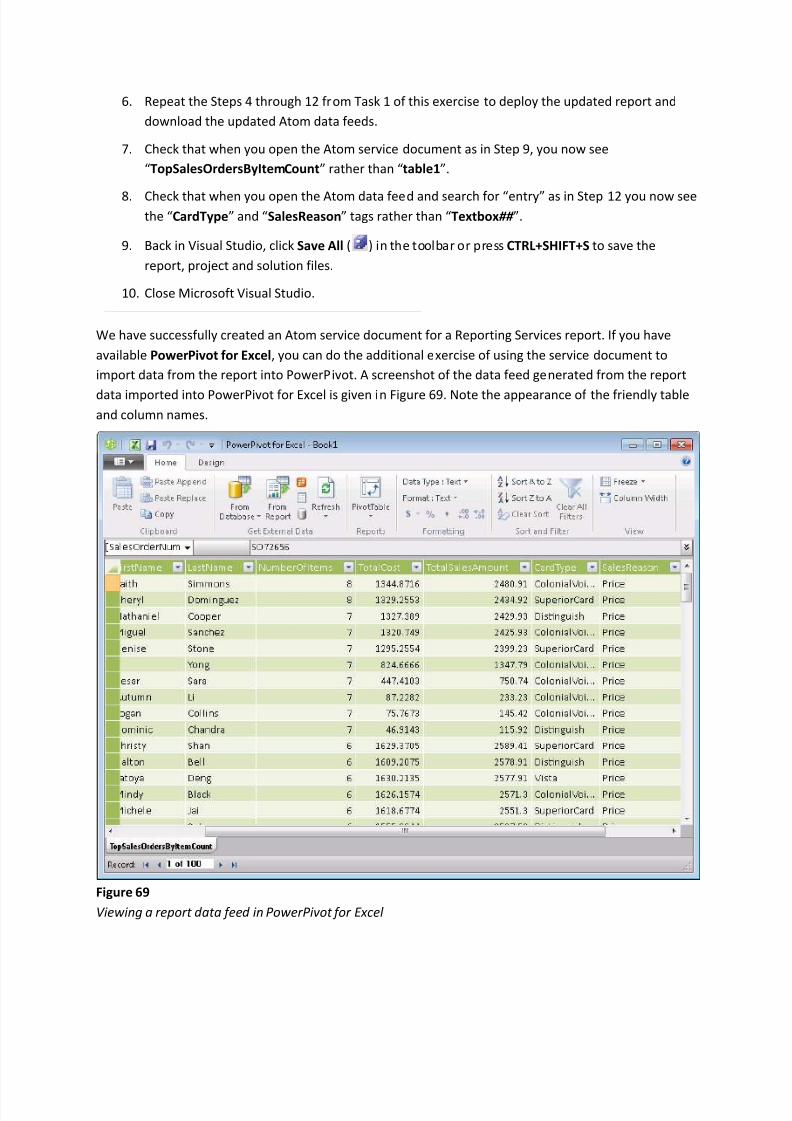
8/6/2019 Reportins Services 2008R2 Nuevas Caracteristicas
http://slidepdf.com/reader/full/reportins-services-2008r2-nuevas-caracteristicas 78/93
6. Repeat the Steps 4 through 12 from Task 1 of this exercise to deploy the updated report and
download the updated Atom data feeds.
7. Check that when you open the Atom service document as in Step 9, you now see
TopSalesOrdersByItemCount rather than table1.
8. Check that when you open the Atom data feed and search for entry as in Step 12 you now seethe CardType and SalesReason tags rather than Textbox## .
9. Back in Visual Studio, click Save All ( ) in the toolbar or press CTRL+SHIFT+S to save the
report, project and solution files.
10. Close Microsoft Visual Studio.
We have successfully created an Atom service document for a Reporting Services report. If you have
available PowerPivot for Excel, you can do the additional exercise of using the service document to
import data from the report into PowerPivot. A screenshot of the data feed generated from the report
data imported into PowerPivot for Excel is given in Figure 69. Note the appearance of the friendly table
and column names.
Figure 69
V iewing a report d ata feed in PowerPivot for E xcel

8/6/2019 Reportins Services 2008R2 Nuevas Caracteristicas
http://slidepdf.com/reader/full/reportins-services-2008r2-nuevas-caracteristicas 79/93
Note: For more information on how to use PowerPivot for Excel please refer to thePowerPivot in SQL
Server 2008 R2 hands-on lab.
Exercise 4: Exploring the New Features
in Report Builder 3.0
In keeping with the notion that reports can now be designed without the use of Microsoft Visual Studio,
many of the new features in Report Builder 3.0 are the new features in Reporting Services 2008 R2.
Specifically:
1. The Map item is available as a choice alongside Table or Matrix and Chart when you launchReport Builder as shown in Figure 70.
Figure 70
Report Buil d er 3.0 d esign surface

8/6/2019 Reportins Services 2008R2 Nuevas Caracteristicas
http://slidepdf.com/reader/full/reportins-services-2008r2-nuevas-caracteristicas 80/93
2. Report expressions can use any of the three new lookup functions described inExercise 2.
3. User interface to specify credentials for connecting to a data source when designing a report
and the shared data source is configured to prompt for credentials or uses stored credentials
and the password is not retrieved from the server. When Report Builder is unable to connect tothe data source, the Enter Data Source Credentials dialog as shown in Figure 71 will open.
Figure 71
Specifying cred entials when d esigning a report in Report Buil d er 3.0
4. Report preview experience is improved in Report Builder 3.0 with the introduction of edit
sessions whereby report data is cached. The start of an edit session is automatic and does not
require any action on the part of the user.
Using the New Map Layer wizard, exporting reports as Atom data feeds and writing lookup functions are
largely similar in Report Builder 3.0 as in the Report Designer of Business Intelligence Development
Studio. This exercise will demonstrate the benefit of edit sessions when previewing a report.
Task 1 Experiencing Edit Sessions for Improved Previewing
1. Launch Report Builder 3.0 from Start | All Programs | Microsoft SQL Server 2008 R2 Report
Builder 3.0.
2. In the New report or dataset dialog, click Table or Matrix. This will launch the New Table or
Matrix wizard.

8/6/2019 Reportins Services 2008R2 Nuevas Caracteristicas
http://slidepdf.com/reader/full/reportins-services-2008r2-nuevas-caracteristicas 81/93
Figure 72
Creating a new report using the Table or Matrix Wizar d
3. In the Choose a dataset step, make sure to select Create a dataset and then click Next.
4. In the Choose a connection to a data source step click Browse and navigate to the
http://<yourservername>/Shared Documents folder (this should be the folder chosen when
you configured the package deployment during the Exercise 3 Task 1 Step 3). Select the
AdventureWorksDW2008R2 shared data source which was created in Exercise 2 and
deployed in Exercise 3. Optionally click Test Connection and then click Next.
Note: If the AdventureWorksDW2008R2 data source does not appear in the Data Source
Connections list, click Browse and navigate to the folder you chose when you configured the
package deployment (Exercise 3 - Task 1 - Step 3). For example,
http://<yourservername>/Shared Documents.

8/6/2019 Reportins Services 2008R2 Nuevas Caracteristicas
http://slidepdf.com/reader/full/reportins-services-2008r2-nuevas-caracteristicas 82/93
Figure 73
Choosing the Ad ventureWorksDW2008R2 d ata source
5. In the Design a query step, click Edit as Text and type the following T-SQL statement. ClickNext.
Note: If you prefer to import the query from a SQL file instead of typing it, click Import and
browse to Assets in the Source folder of this lab and select the SelectEmployees.sql file.
T-SQL
Select EmployeeKey, FirstName, LastName, MaritalStatus
From dbo.DimEmployee
Order by LastName, FirstName
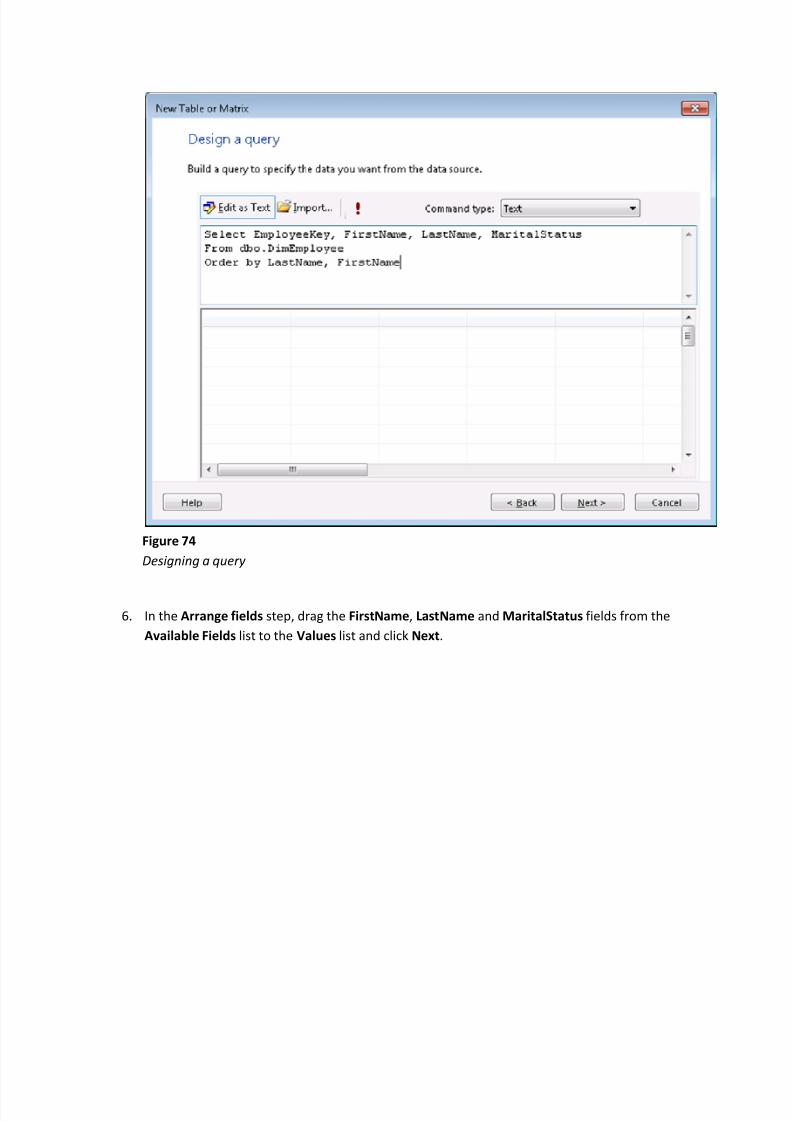
8/6/2019 Reportins Services 2008R2 Nuevas Caracteristicas
http://slidepdf.com/reader/full/reportins-services-2008r2-nuevas-caracteristicas 83/93
Figure 74
Designing a query
6. In the Arrange fields step, drag the FirstName, LastName and MaritalStatus fields from the
Available Fields list to the Values list and click Next.
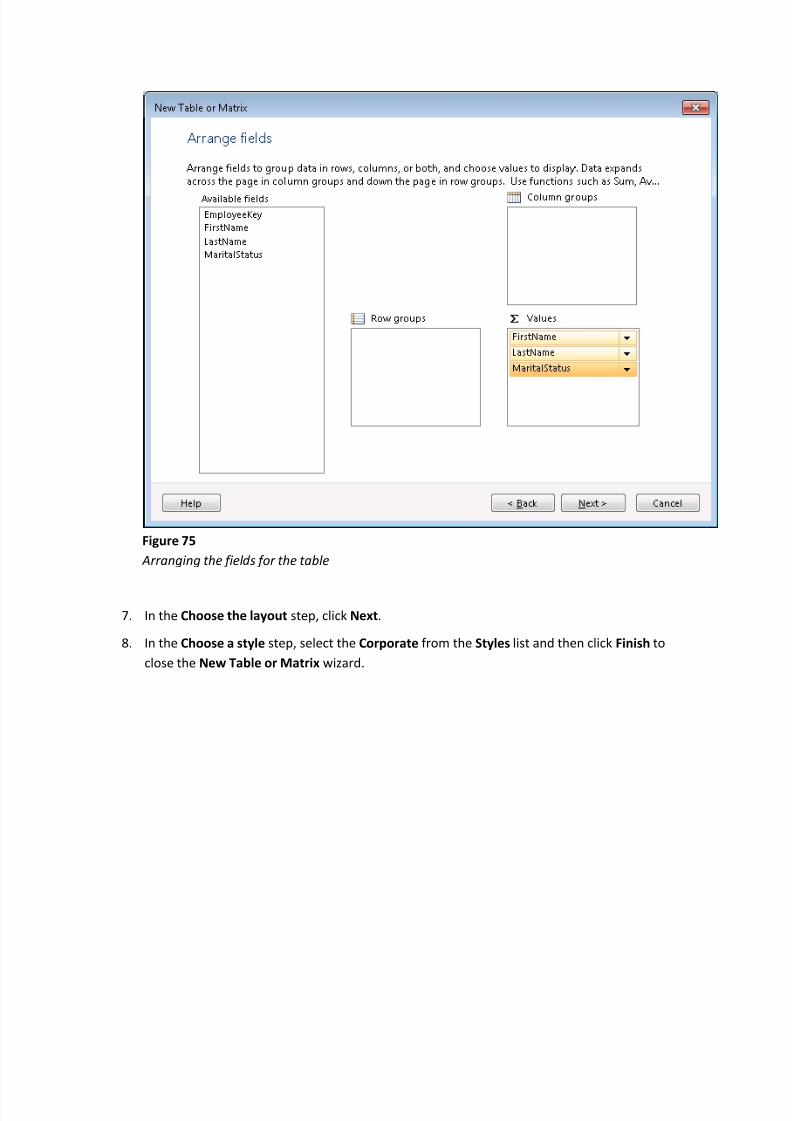
8/6/2019 Reportins Services 2008R2 Nuevas Caracteristicas
http://slidepdf.com/reader/full/reportins-services-2008r2-nuevas-caracteristicas 84/93
Figure 75
Arranging the fiel d s for the table
7. In the Choose the layout step, click Next.
8. In the Choose a style step, select the Corporate from the Styles list and then click Finish to
close the New Table or Matrix wizard.
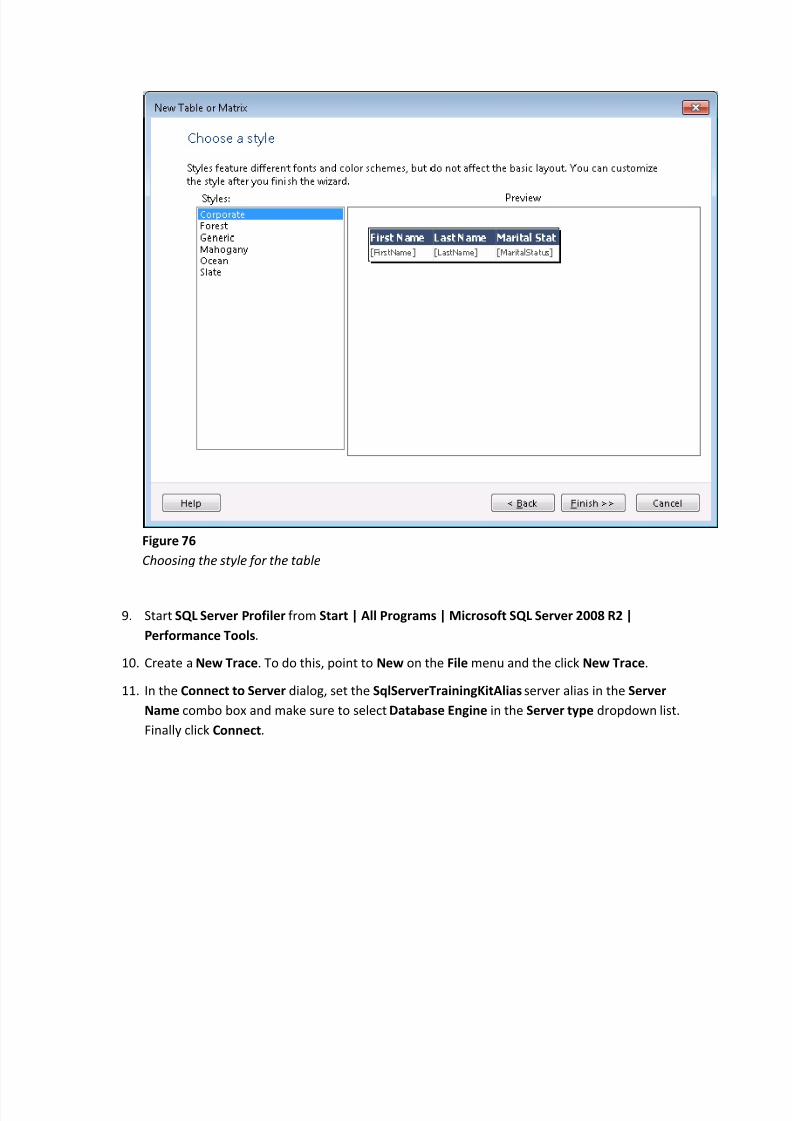
8/6/2019 Reportins Services 2008R2 Nuevas Caracteristicas
http://slidepdf.com/reader/full/reportins-services-2008r2-nuevas-caracteristicas 85/93
Figure 76
Choosing the style for the table
9. Start SQL Server Profiler from Start | All Programs | Microsoft SQL Server 2008 R2 |
Performance Tools.
10. Create aNew Trace. To do this, point to New on the File menu and the click New Trace.
11. In the Connect to Server dialog, set the SqlServerTrainingKitAlias server alias in the Server
Name combo box and make sure to select Database Engine in the Server type dropdown list.
Finally click Connect.
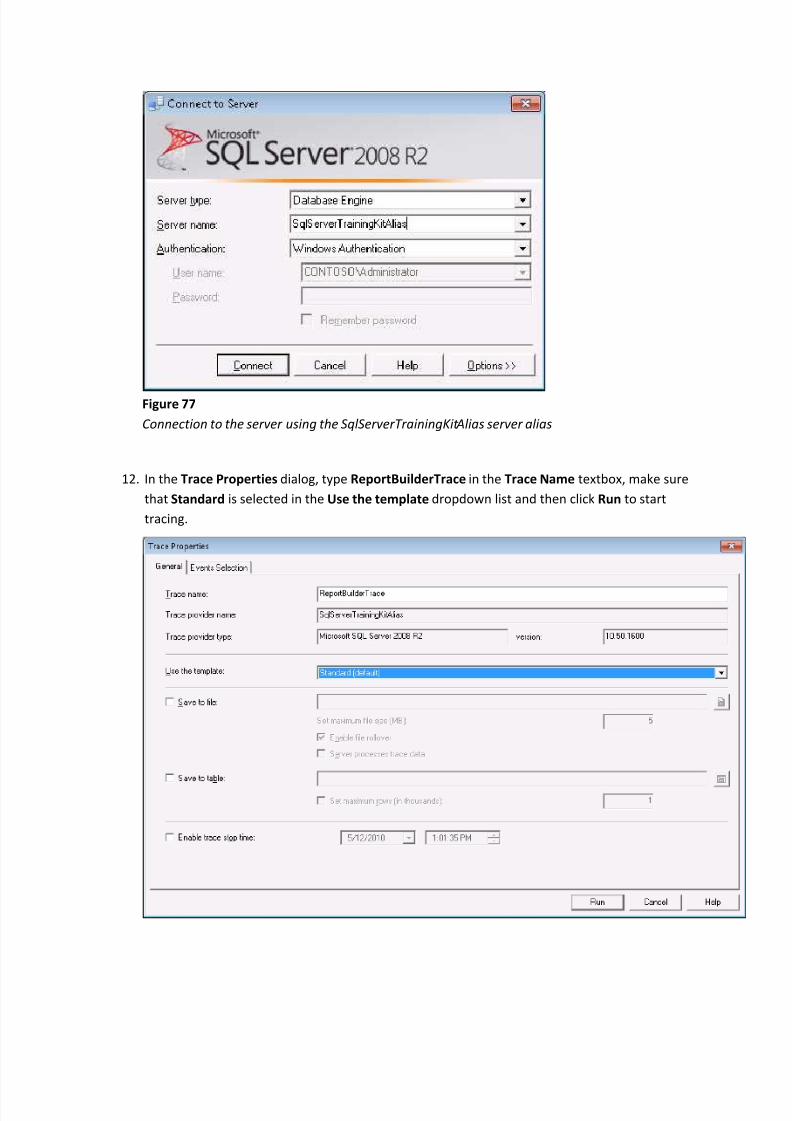
8/6/2019 Reportins Services 2008R2 Nuevas Caracteristicas
http://slidepdf.com/reader/full/reportins-services-2008r2-nuevas-caracteristicas 86/93
Figure 77
Connection to the server using the SqlServerTrainingKit Alias server alias
12. In the Trace Properties dialog, type ReportBuilderTrace in the Trace Name textbox, make sure
that Standard is selected in the Use the template dropdown list and then click Run to start
tracing.
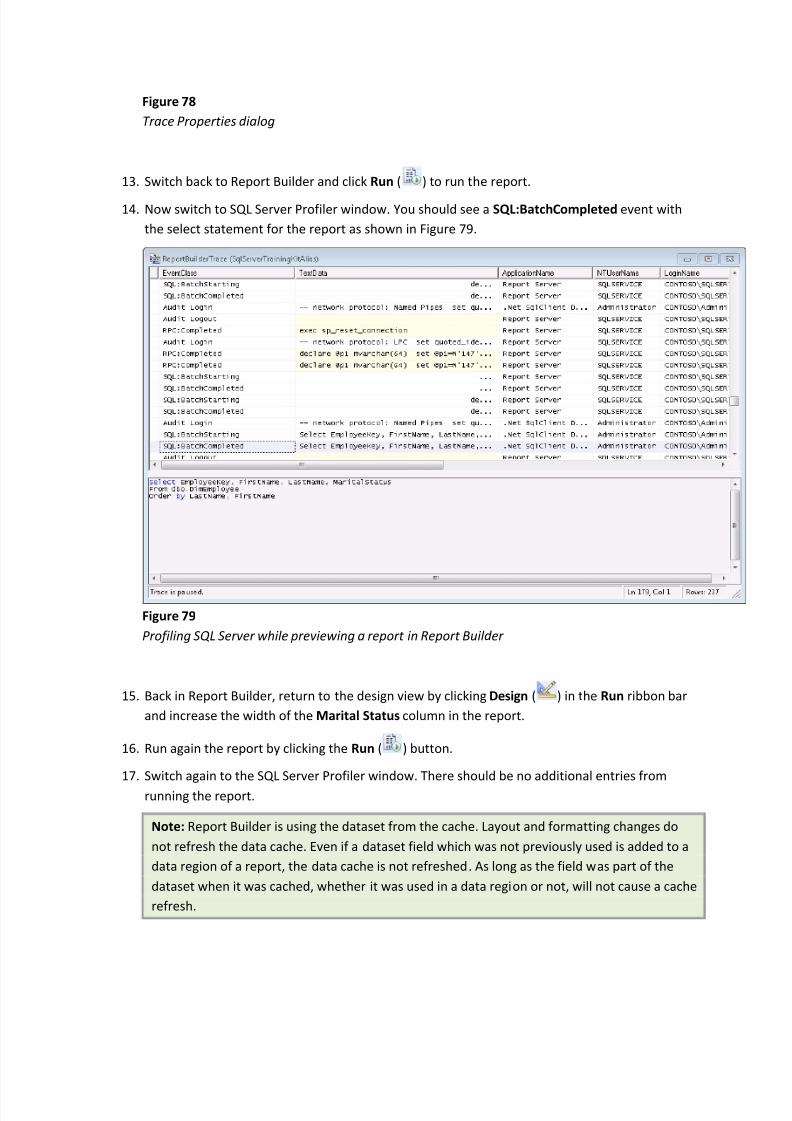
8/6/2019 Reportins Services 2008R2 Nuevas Caracteristicas
http://slidepdf.com/reader/full/reportins-services-2008r2-nuevas-caracteristicas 87/93
Figure 78
Trace Properties d ialog
13. Switch back to Report Builder and click Run ( ) to run the report.
14. Now switch to SQL Server Profiler window. You should see a SQL:BatchCompleted event with
the select statement for the report as shown in Figure 79.
Figure 79
Profiling SQL Server while previewing a report in Report Buil d er
15. Back in Report Builder, return to the design view by clicking Design ( ) in the Run ribbon bar
and increase the width of the Marital Status column in the report.
16. Run again the report by clicking the Run ( ) button.
17. Switch again to the SQL Server Profiler window. There should be no additional entries from
running the report.
Note: Report Builder is using the dataset from the cache. Layout and formatting changes do
not refresh the data cache. Even if a dataset field which was not previously used is added to a
data region of a report, the data cache is not refreshed. As long as the field was part of the
dataset when it was cached, whether it was used in a data region or not, will not cause a cache
refresh.
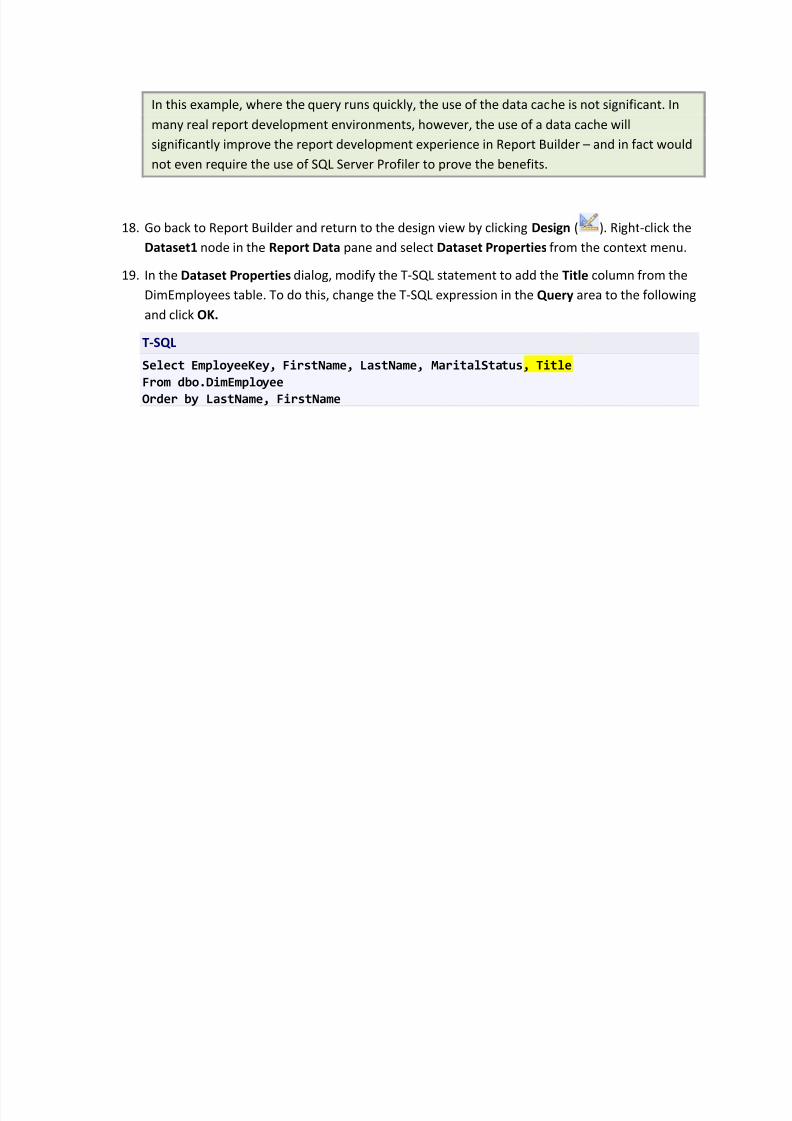
8/6/2019 Reportins Services 2008R2 Nuevas Caracteristicas
http://slidepdf.com/reader/full/reportins-services-2008r2-nuevas-caracteristicas 88/93
In this example, where the query runs quickly, the use of the data cache is not significant. In
many real report development environments, however, the use of a data cache will
significantly improve the report development experience in Report Builder and in fact would
not even require the use of SQL Server Profiler to prove the benefits.
18. Go back to Report Builder and return to the design view by clicking Design ( ). Right-click the
Dataset1 node in the Report Data pane and select Dataset Properties from the context menu.
19. In the Dataset Properties dialog, modify the T-SQL statement to add the Title column from the
DimEmployees table. To do this, change the T-SQL expression in the Query area to the following
and click OK.
T-SQL
Select EmployeeKey, FirstName, LastName, MaritalStatus, Title
From dbo.DimEmployee
Order by LastName, FirstName

8/6/2019 Reportins Services 2008R2 Nuevas Caracteristicas
http://slidepdf.com/reader/full/reportins-services-2008r2-nuevas-caracteristicas 89/93
Figure 80
Changing the T-SQL query for the d ataset
20. Run one more time the report by clicking the Run ( ) button.
21. Switch to the SQL Server Profiler window. Note the additional entries from running the report:
even though the new field was not used in the design of the report, because the dataset was
modified to retrieve the additional field, the cache was refreshed.
Note: Any change to a report dataset, including adding or deleting fields from the dataset and
changing the name of the dataset, will cause the data cache to refresh. When the cache is
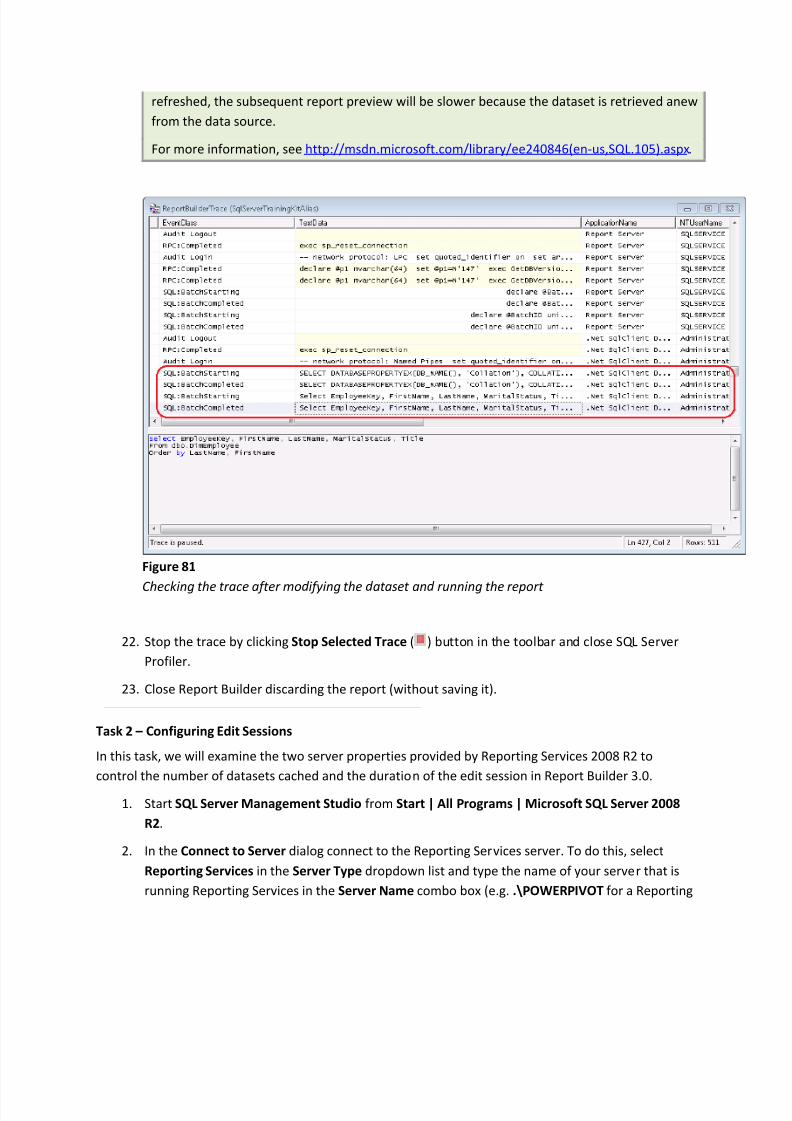
8/6/2019 Reportins Services 2008R2 Nuevas Caracteristicas
http://slidepdf.com/reader/full/reportins-services-2008r2-nuevas-caracteristicas 90/93
refreshed, the subsequent report preview will be slower because the dataset is retrieved anew
from the data source.
For more information, see http://msdn.microsoft.com/library/ee240846(en-us,SQL.105).aspx.
Figure 81
Checking the trace after mod ifying the d ataset and running the report
22. Stop the trace by clicking Stop Selected Trace ( ) button in the toolbar and close SQL Server
Profiler.
23. Close Report Builder discarding the report (without saving it).
Task 2 Configuring Edit Sessions
In this task, we will examine the two server properties provided by Reporting Services 2008 R2 to
control the number of datasets cached and the duration of the edit session in Report Builder 3.0.
1. Start SQL Server Management Studio from Start | All Programs | Microsoft SQL Server 2008
R2.
2. In the Connect to Server dialog connect to the Reporting Services server. To do this, select
Reporting Services in the Server Type dropdown list and type the name of your server that is
running Reporting Services in the ServerName combo box (e.g. .\POWERPIVOT for a Reporting
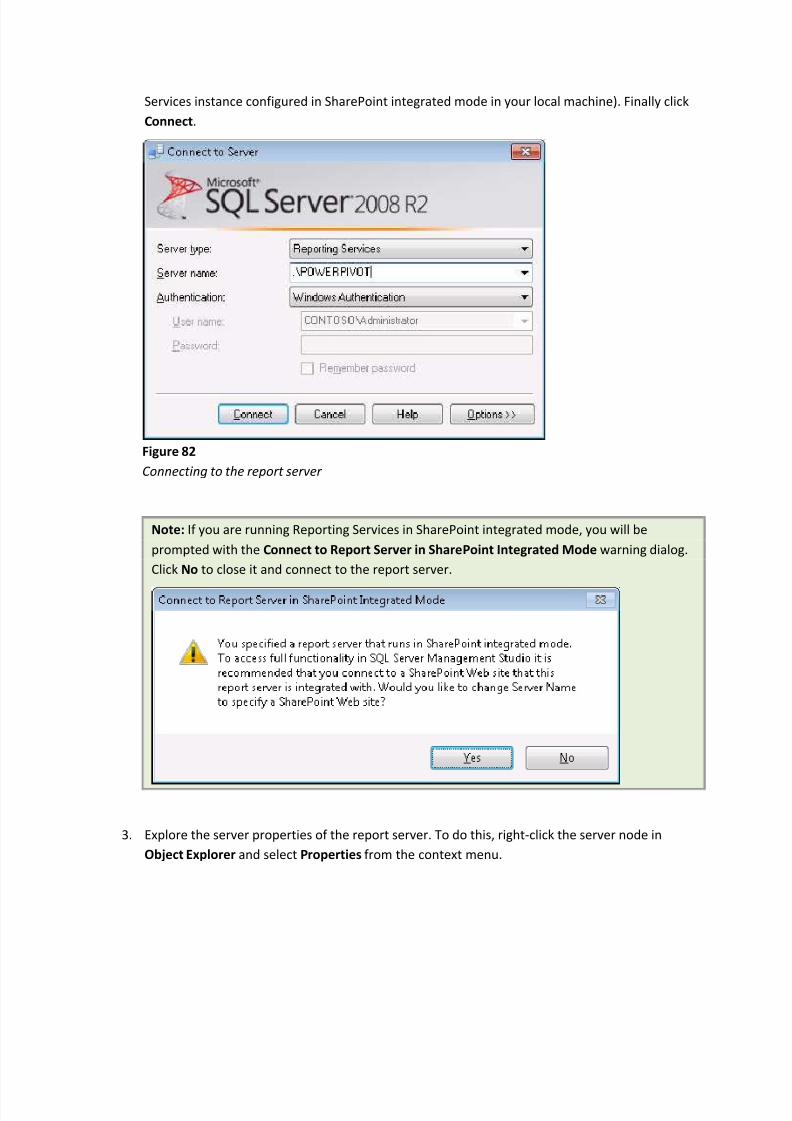
8/6/2019 Reportins Services 2008R2 Nuevas Caracteristicas
http://slidepdf.com/reader/full/reportins-services-2008r2-nuevas-caracteristicas 91/93
Services instance configured in SharePoint integrated mode in your local machine). Finally click
Connect.
Figure 82
Connecting to the report server
Note: If you are running Reporting Services in SharePoint integrated mode, you will be
prompted with the Connect to Report Server in SharePoint Integrated Mode warning dialog.
Click No to close it and connect to the report server.
3. Explore the server properties of the report server. To do this, right-click the server node in
Object Explorer and select Properties from the context menu.
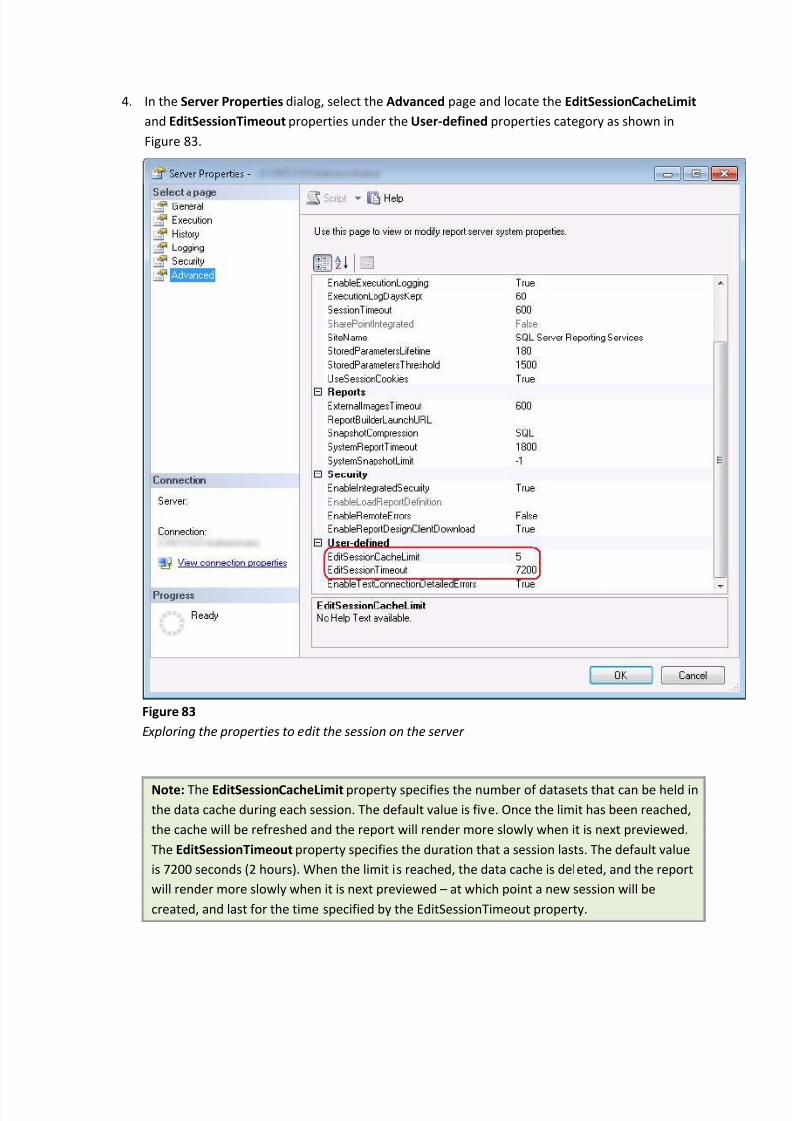
8/6/2019 Reportins Services 2008R2 Nuevas Caracteristicas
http://slidepdf.com/reader/full/reportins-services-2008r2-nuevas-caracteristicas 92/93
4. In the Server Properties dialog, select the Advanced page and locate the EditSessionCacheLimit
and EditSessionTimeout properties under the User-defined properties category as shown in
Figure 83.
Figure 83
E xploring the properties to ed it the session on the server
Note: The EditSessionCacheLimit property specifies the number of datasets that can be held in
the data cache during each session. The default value is five. Once the limit has been reached,
the cache will be refreshed and the report will render more slowly when it is next previewed.
The EditSessionTimeout property specifies the duration that a session lasts. The default value
is 7200 seconds (2 hours). When the limit is reached, the data cache is deleted, and the report
will render more slowly when it is next previewed at which point a new session will be
created, and last for the time specified by the EditSessionTimeout property.

8/6/2019 Reportins Services 2008R2 Nuevas Caracteristicas
http://slidepdf.com/reader/full/reportins-services-2008r2-nuevas-caracteristicas 93/93
5. Click Cancel to close the dialog box and close Microsoft SQL Server Management Studio.
SummaryBy completing this Hands-on Lab you have learned about the new features included in the Reporting
Services 2008 R2 release. Specifically you have learned how to use the Map Wizard to display geospatial
data, use lookup functions in report expressions so that data from multiple datasets can be shown in a
single data region and export report data to an Atom data feed. You have also gained some familiarity
with the new features in Report Builder 3.0.