REPORTING OF THE GRADUATE SURVEY · Did not reply 73% 73% Appendix 1 shows a summary of the...
48
REPORTING OF THE GRADUATE SURVEY Food Science and Technology
Transcript of REPORTING OF THE GRADUATE SURVEY · Did not reply 73% 73% Appendix 1 shows a summary of the...
REPORTING OF THE GRADUATE SURVEY Food Science and Technology

1
Table of contents Introduction .................................................................................................................................................... 2
Data .............................................................................................................................................................. 3
Background data from the study administrative system STADS .......................................................................... 4
Reading guide .............................................................................................................................................. 5
Current job situation of Master’s Candidatus/Professional Bachelor’s graduates ....................................................... 7
Employed Master’s Candidatus/Professional Bachelor’s graduates ....................................................................... 7
Self-employed (including freelance) .............................................................................................................. 15
Unemployed, including maternity leave without being under employment contract .............................................. 19
Full-time education ..................................................................................................................................... 21
Correlation between Master’s Candidatus/Professional Bachelor’s education programmes and the job market ........... 23
Academic correlation between studies and job ................................................................................................ 23
The ability of the study programme to prepare the graduates for working life ..................................................... 23
Master’s Candidatus/Professional Bachelor’s graduates routes to their first job ...................................................... 26
Master’s Candidatus/Professional Bachelor’s graduates first job ........................................................................ 26
The significance of student jobs, internships, study abroad, etc. for the first job ................................................. 29
Voluntary internship or project in private or public organisations ...................................................................... 31
Study abroad ............................................................................................................................................. 33
Activities during the programme of study such as student politics ..................................................................... 35
Master's Candidatus/Professional bachelor's assessment of the program compared with their own expectations ........ 37
The Master Candidatus graduates assessment of the study programme ................................................................ 38
The level of teaching in relation to the entry requirements ............................................................................... 38
Specifics about the Master's Candidatus program ............................................................................................ 39
The graduates assessment of the opportunities for study abroad, internship etc. without extensions ..................... 40
The teacher's professional and educational expertise ....................................................................................... 41
Appendix 1: Questions used in the report ......................................................................................................... 42
Appendix 2: Background data in STADS ........................................................................................................... 43
Appendix 3: List of work places and job titles .................................................................................................... 44
Appendix 5: List of examples of elements of the study programme that did not contribute to the collective goals of the teaching offer divided on Masters Candidatus and Professional Bachelors ............................................................. 45
Appendix 6: Response distribution on question 1.18 for Masters Candidatus and Professional Bachelors ................... 46
2
Introduction The University of Copenhagen conducts graduate surveys for all professional Bachelor’s, Academic Bachelor’s, Master’s Candidatus and Master’s degrees, as well as Diploma and Academy Profession (AP) programmes according to a shared concept of data collection developed across the faculties. The graduate surveys gather information about what the graduates are doing after their graduation, and how conditions during their studies have been influential in their later employment situation. Among other things, the graduates assess to what degree the skills achieved from their education have been relevant and sought after in the jobs they get after completing their education. Moreover, the graduates evaluate whether their education has been structured to ensure that the study programme can be completed without delay, and whether there is anything in the programme that could be improved to better prepare them for the job market. Education Services at the University of Copenhagen is responsible for the graduate survey itself. Rambøll handles the acquisition of data and prepares a report based on the data from the questionnaires. The reporting of the graduate survey takes place on three levels: university, faculty and educational programme. This report is for Food Science and Technology. Compared to previous reports in connection with the institution accreditation, the 2016 reports also include small, built-in analyses by cross-referencing information. The background for this is the fact that the results of the questionnaire had been adapted and reworked by the individual institutes. Therefore, Education Services has in collaboration with Rambøll worked on improving the report template so that the complete report can, as far as possible, cover the common needs that the institutions have. The institution accreditation comprises an assessment of many educational programmes, all of which receive a report like this one. Therefore, it has been necessary to standardise the text so that it can be included generically in the reports for all types of educational programme. Throughout the report, there are guidance and notes on the individual sections and graphs. All faculties have received the complete data material for the faculty’s educational programmes, which are included in this graduate survey. Thus, this report provides an overview of the survey’s results, which can be further investigated by looking into the data.

3
Data After the completion of their education programme, all graduates from the University of Copenhagen were invited to take part in the graduate survey. The University of Copenhagen offers the following types of education programmes: • Academic Bachelor’s degree • Professional Bachelor’s degree • Master’s Candidatus degree • Master’s degree • Diploma programmes • Academy Profession (AP) programmes (from 2016) From 2015 all the faculties at the University of Copenhagen will use the same questionnaire for the collection of data in connection with graduate surveys in order to provide the opportunity to compare the results across educational programmes and faculties.
Table: Summary of collected data Master Candidatus Total
Invited 129 129
Completed 21% 21%
Partially completed 5% 5%
Number of replies 26% 26%
Did not wish to participate 1% 1%
Did not reply 73% 73% Appendix 1 shows a summary of the questions from the questionnaire used in this report.

4
Background data from the study administrative system STADS The individual graduates in the survey have been linked to the variables from the study administrative system STADS described in Appendix 2. The Table shows how representative the data is for Food Science and Technology when the entire graduates who were asked to reply to the questionnaire were compared to the graduates who chose to participate by responding to the questionnaire based on the background variables. Among the background variables, the following variables from STADS are considered significant when it comes to studying how representative the graduate survey is: • Gender • Average age at study start/average age at graduation • Completion time of Bachelor’s and Master’s Candidatus studies • Grades for thesis/Bachelor’s paper • Graduates who are foreign citizens • Quota 1/2
Table: Facts about the respondents, broken down into graduate status Master Candidatus total Master Candidatus participated
Number 129 34
Percentage women 69% 76%
Foreign citizens 58% 47%
Average age upon graduation 27.8 28.5
- youngest 22.7 24
- eldest 47 47
Completion time (average years) 2.2 2.2
- shortest completion time 0.8 1.1
- longest completion time 10.3 3.6
Quota 2 at BA-entrance 0% 0%
Years from qualifying exam to commencement of study (average)
4.7 4.5
- shortest time from qualifying exam to commencement of study (average)
0 1
- longest time from qualifying exam to commencement of study (average)
17.9 10
Bachelor's programme as first priority 33% 50%
Grading of Bachelor's paper/Master's thesis (average)
9.3 9.7
- lowest grade 2 2
- highest grade 12 12 For future analyses of data from graduate surveys it can be relevant to examine, aside from being representative, whether the data can be biased. Respondents could, for example, be biased in the assessment of their education, if they are unsuccessful on the job market.

5
Reading guide In order to make the report more readable and to live up to various ethical principles, this section explains in brief how the data is presented in this report. The report has been made for many educational programmes; in addition, there are joint reports on faculty level and for the University of Copenhagen as a whole. As described in the introduction, it has thus been necessary to work with a standardised report structure, partly on financial grounds, both in terms of the content of the tables, graphs and the text itself. The following text is thus intended to help the reader in reading the report. For the Food Science and Technology educational programme, a report template has been used that comprises Professional Bachelor’s degrees, Academic Bachelor’s degrees and Master’s Candidatus degrees. For the University of Copenhagen as a whole, it makes sense to look at Master’s Candidatus and Professional Bachelor’s degrees in the same section, as these are programmes where the graduates complete their education at the university. The reader might though have a report for a specific education at hand that does not comprise a Professional Bachelor’s degree programme. At time of writing, the University of Copenhagen offers Professional Bachelor’s degrees in dentistry under the Faculty of Health and Medical Sciences and the Bachelor’s degree in Forest and Landscape Engineering at SCIENCE. The reader is therefore asked to consider that it has been necessary to standardise the text so that it also reads Professional Bachelor’s degree, even though this may not be relevant to the education written in the actual report.
Q.1.1. What is your current job situation? Master Candidatus
I am employed (including leave of absence, maternity leave, job with wage subsidies, part-time hirings, etc.)
76% (26)
I am self-employed (including freelance) 3% (1)
I am unemployed (including on maternity leave without being under contract of employment)
12% (4)
I am in full-time education (e.g. Candidatus programme) 0% (0)
I am on a Ph.D programme 9% (3)
Other 0% (0)
Number of replies 34 Figures in this table can be included in the text in the individual sections. If there is a figure for candidates in this table, they could also be included in the following section on candidates, for example. The table here provides a complete summary of the types of figures included in this report. For Q.1.1 in the table, the respondents have just one possible answer. If a respondent has a part-time job with supplementary benefit, the respondent should select the category, “I am in work”. In some cases, the individual questions in the questionnaire have just one possible answer; in other cases, multiple answers are permitted. With a single answer option, a percentage breakdown of the respondents according to answer will add up to 100 per cent as in a relative breakdown, and otherwise the sum of the percentages will be higher than 100 per cent. The graphs in the report thus provide a clear indication of whether there is a single answer option or multiple answers. In general, the total “n” for the graphs and tables, as well as what it covers, is made clear in the text. In some situations, “n” is the total number of respondents in the graduate study while in other situations, “n” can be conditional on the respondents who are in work, for example. Based on the graph it is then possible to estimate how many respondents there are in the individual categories.

6
The graduate survey invites all graduates in a given population to answer the questionnaire, where the response rate can be small. The collected data does not therefore represent a complete survey, but rather a random sample. To ensure anonymity, when the number of respondents is small, the results on the following questions: What is your monthly salary? Do you supplement the income earned from your primary occupation? Do you receive unemployment benefit or social assistance benefits in connection with your unemployed status? Why do you think you do not have a job at the moment? Be aware that few respondents can increase the statistical uncertainty significantly, and the percentage indications can fluctuate a lot if one respondent is added or removed.
7
Current job situation of Master’s Candidatus/Professional Bachelor’s graduates This chapter describes the job situation of Master’s Candidatus/Professional Bachelor’s graduates in their current position. The chapter includes sections on whether the graduates are in work, self-employed, unemployed or in full-time education.
Employed Master’s Candidatus/Professional Bachelor’s graduates Employed Masters Candidatus/Professional Bachelors covers graduates in work, self-employed, unemployed or in full-time education.
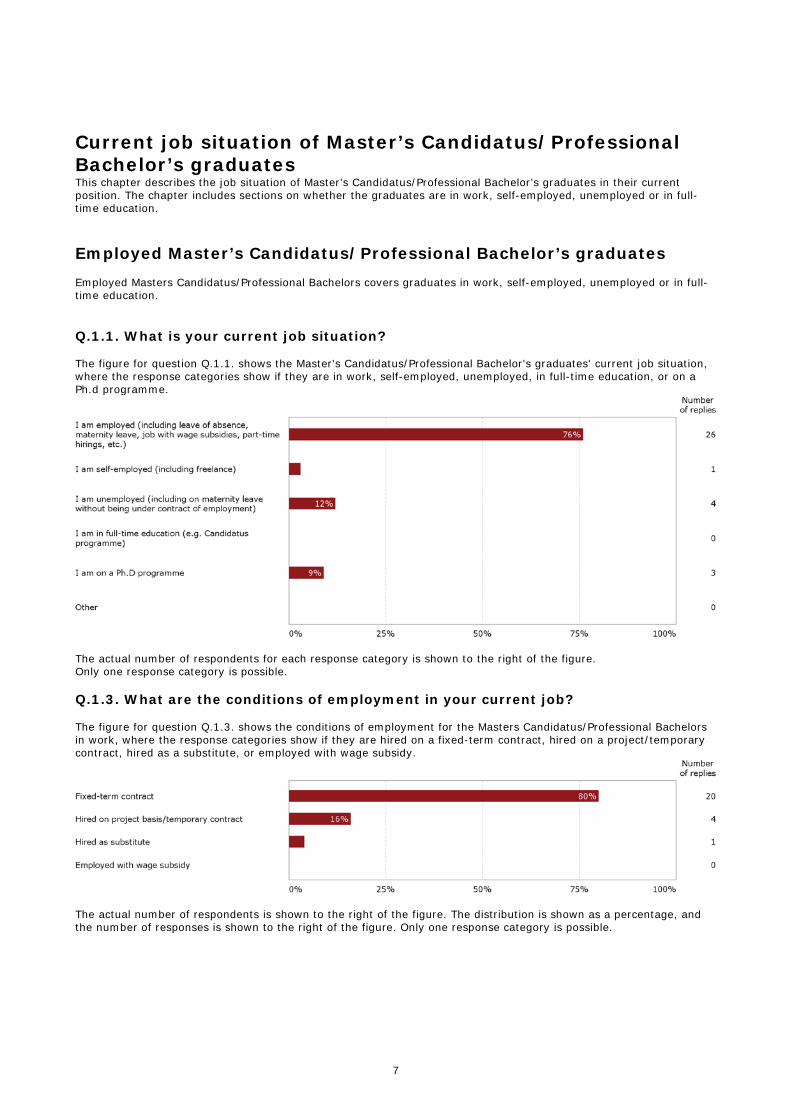
Q.1.1. What is your current job situation? The figure for question Q.1.1. shows the Master's Candidatus/Professional Bachelor's graduates' current job situation, where the response categories show if they are in work, self-employed, unemployed, in full-time education, or on a Ph.d programme.
The actual number of respondents for each response category is shown to the right of the figure. Only one response category is possible.
Q.1.3. What are the conditions of employment in your current job? The figure for question Q.1.3. shows the conditions of employment for the Masters Candidatus/Professional Bachelors in work, where the response categories show if they are hired on a fixed-term contract, hired on a project/temporary contract, hired as a substitute, or employed with wage subsidy.
The actual number of respondents is shown to the right of the figure. The distribution is shown as a percentage, and the number of responses is shown to the right of the figure. Only one response category is possible.

8
Q.1.2. How many jobs have you had (since completing your studies), before you started in your current employment? Figure Q.1.2. shows the number of jobs Master's Candidatus/Professional Bachelor's graduates in employment have had before starting their current job.
There is only one response category, given the fact that they have had zero, one, two, three, four or more jobs. The total number of respondents is shown to the right of the figure.
Q.1.8. Within which sector is your place of work? The figure for question Q.1.8. shows which sectors the Masters Candidatus/Professional Bachelors are employed in. The response categories show if they are employed in the private sector, the state, a region or a non-governmental organisation/interest organisation.
The actual number of respondents for each response category is shown to the right of the figure. Only one response category is possible.

9
Q.1.9./Q.1.8. Which industry does your place of work belong to? by sector The table for question Q.1.9. shows which industry the Masters Candidatus/Professional Bachelors are employed in. For each industry, the table shows the distribution of the Masters Candidatus/Professional Bachelors among the various sectors in question Q.1.8. Private State Region Municipa
lity Non-
governmental
organisation/inter
est organisat
ion
Total % Total n
Agriculture, hunting, forestry and fishing (e.g. plant nursery)
0% 0% 0% 0% 0% 0% 0
Raw material extraction (e.g. extraction of oil and gas)
0% 0% 0% 0% 0% 0% 0
Manufacturing firm (e.g. industry, food processing)
84% 40% 0% 0% 0% 75% 18
The supply of electricity, gas or heating 0% 0% 0% 0% 0% 0% 0
Water supply, sewerage, waste management, etc.
0% 0% 0% 0% 0% 0% 0
Construction company 0% 0% 0% 0% 0% 0% 0
Wholesale and retail trade 5% 0% 0% 0% 0% 4% 1
Freight transport and cargo handling (e.g. mail)
0% 0% 0% 0% 0% 0% 0
Lodging and restaurant business 0% 0% 0% 0% 0% 0% 0
Information and communication (e.g. publishing, film production, radio + TV)
0% 0% 0% 0% 0% 0% 0
Financial institute or financial company, etc. (e.g. insurance company, pension fund)
0% 0% 0% 0% 0% 0% 0
Real estate (leasing administrator, property agent)
0% 0% 0% 0% 0% 0% 0
Liberal profession, scientific and technical services (e.g. research assistant at a university, legal advice, complaints agency, town planning)
0% 40% 0% 0% 0% 8% 2
Public administration and defence; social security (e.g. public administration and social sector)
0% 0% 0% 0% 0% 0% 0
Teaching (e.g. upper secondary schools and adult education)
0% 20% 0% 0% 0% 4% 1
Health and social services (e.g. hospitals and drug or alcohol counselling)
5% 0% 0% 0% 0% 4% 1
Culture, entertainments and sport (e.g. theatre, libraries and museums)
0% 0% 0% 0% 0% 0% 0
Other services (e.g. business organisations and consumer organisations)
0% 0% 0% 0% 0% 0% 0
Extraterritorial organisations and bodies (e.g. FN and EU)
5% 0% 0% 0% 0% 4% 1
Number of replies 19 5 0 0 0 24 24 The column to the right of the table shows the total number of respondents within each industry and the next-to-last column shows the percentage of respondents within each industry.

10
Q.1.10./Q.1.8. Where is your place of work located geographically? by sector The table shows the geographical location for the Masters' Candidatus/Professional Bachelors' place of work from question Q.1.10. distributed among the various sectors from question Q.1.8. Private State Region Municipa
lity Non-
governmental
organisation/inter
est organisat
ion
Total % Total n
Capital Region of Denmark 47% 60% 0% 0% 0% 50% 12
Region Zealand 16% 20% 0% 0% 0% 17% 4
Region of Southern Denmark 11% 0% 0% 0% 0% 8% 2
Central Denmark Region 0% 0% 0% 0% 0% 0% 0
North Denmark Region 5% 0% 0% 0% 0% 4% 1
All of Denmark 0% 0% 0% 0% 0% 0% 0
Nordic region (incl. Faroe Islands and Greenland)
0% 0% 0% 0% 0% 0% 0
Europe (not Nordic region) 21% 20% 0% 0% 0% 21% 5
North America 0% 0% 0% 0% 0% 0% 0
South America 0% 0% 0% 0% 0% 0% 0
Asia 0% 0% 0% 0% 0% 0% 0
Africa 0% 0% 0% 0% 0% 0% 0
Australia/Oceania 0% 0% 0% 0% 0% 0% 0
Number of replies 19 5 0 0 0 24 24 To the right of the table is a total-column with the total percentage of each geographical location.
Q.1.14. Is your job covered by an academic collective agreement /occupational category? Figure Q.1.14. shows the Master's Candidatus distribution across academic collective agreement/non-academic collective agreement.
There is only one response category as they are either on an academic collective agreement or not. The total number of respondents is shown to the right of the figure.

11
Q.1.11. What is your monthly salary? The figure for question Q.1.11. shows the Master's Candidatus/Professional Bachelor's monthly salary. The levels of salary are shown for graduates on a non-academic collective agreement, graduates on an academic collective agreement, Professional Bachelors as well as a total.
The numbers state the percentages and sum up to 100 within the specific categories. To the right of the figure, the total numbers of responses that provide the basis for the percentage rates are shown.
Q.1.16. Are you in charge of other employees? Figure Q.1.16. shows the distribution of Masters Candidatus/Professional Bachelors that are/aren't in charge of other employees.
The distribution is shown in percentages. The total number of respondents is shown to the right of the figure.

12
Q.1.16./Q.1.11. Are you in charge of other employees? by monthly salary The figure for question Q.1.16. crossed with question Q.1.11. shows the distribution of Masters Candidatus/Professional Bachelors that are/aren't in charge of employees within each of the salary brackets.
Results are only displayed for the relevant salary brackets. The distribution is shown in percentages and sums up to 100 within each salary bracket. The total number of respondents for each salary bracket is shown to the right of the figure.
Q.1.17./Q.1.11. How many employees are you in charge of? by monthly salary The figure for question Q.1.17. shows how many employees the Masters Candidatus/Professional Bachelors are in charge of within each of the salary brackets. The response categories show if the number of employees they are in charge of is either 1-5, 6-10, 11-25, 26-50, 51-100 or more than 100 employees. The results are shown for each of the salary brackets within which the graduates are in charge of employees.
The distribution is shown in percentages and sums up to 100 within each salary bracket. The total number of respondents is shown to the right of the figure.

13
Q.1.18. Breakdown of your job functions. Top 10 over how much time the respondent spends on these job functions The figure for question Q.1.18. shows which job functions the respondents spend time on as well as how much time they spend on the specific categories. Below is shown the ten job functions the Masters Candidatus/Professional Bachelors spend the most time on.
The figure shows an average on a scale from 1 to 4, where 1 corresponds to 'Not at all', 2 corresponds to 'Occasionally', 3 corresponds to 'Sometimes' and 4 corresponds to 'A lot of the time'. From this scale the average time consumption is shown for each specific bar. The response distribution on the specific questions is shown in appendix 6.

14
Q.1.19. How did you find your current job? The figure for question Q.1.19. shows how the Masters Candidatus/Professional Bachelors found their current job.
The figure shows the percentage of Masters Candidatus/Professional Bachelors that have chosen the specific category. The categories do not sum to 100, as it was possible for the respondents to check more than one option.
15
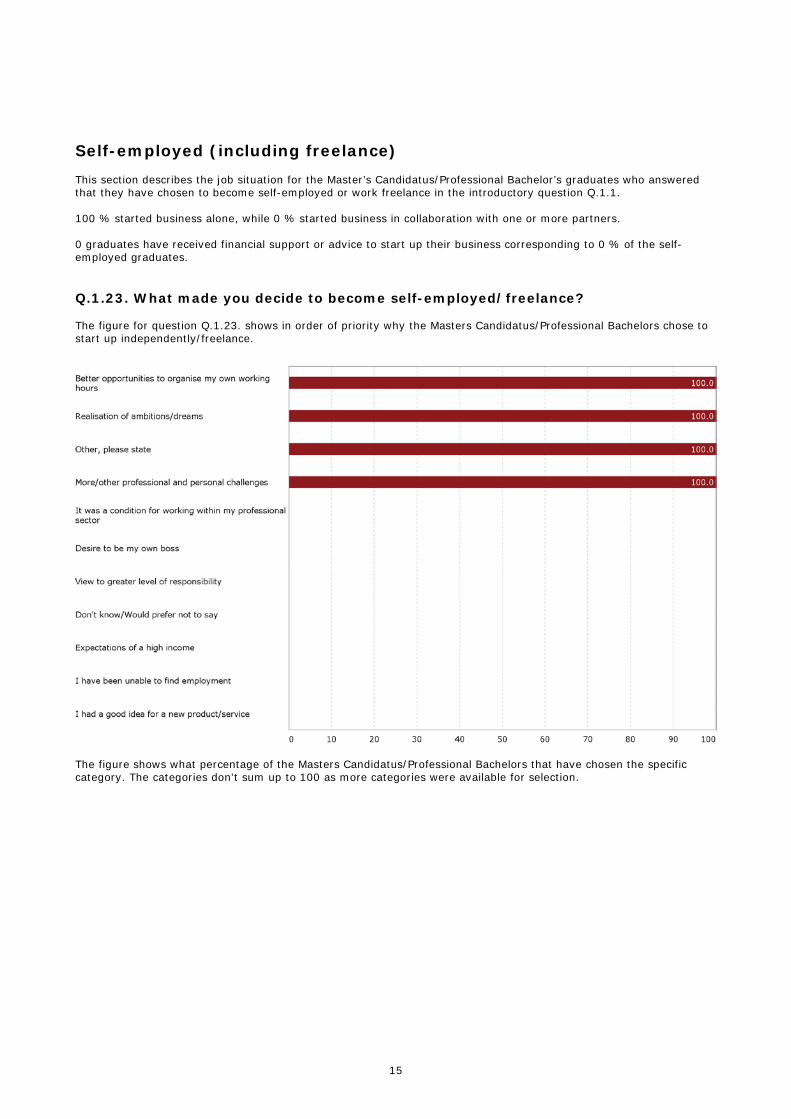
Self-employed (including freelance) This section describes the job situation for the Master’s Candidatus/Professional Bachelor’s graduates who answered that they have chosen to become self-employed or work freelance in the introductory question Q.1.1. 100 % started business alone, while 0 % started business in collaboration with one or more partners. 0 graduates have received financial support or advice to start up their business corresponding to 0 % of the self-employed graduates.
Q.1.23. What made you decide to become self-employed/freelance? The figure for question Q.1.23. shows in order of priority why the Masters Candidatus/Professional Bachelors chose to start up independently/freelance.
The figure shows what percentage of the Masters Candidatus/Professional Bachelors that have chosen the specific category. The categories don't sum up to 100 as more categories were available for selection.

16
Q.1.26./Q.1.27. How would you describe the correlation between your studies and your own business? The figure for question Q.1.26./Q.1.27. shows how the Masters Candidatus/Professional Bachelors assess the correlation between their studies and their business.
It is only possible for them to choose one of the categories. The distribution is shown in percentages and sums up to 100. The total number of respondents for each response category is shown to the right of the figure.

17
Q.1.28. How did you get the idea for your business? The figure for question Q.1.28. shows how the Masters Candidatus/Professional Bachelors got the idea for their business. More options were available.
The figure shows the percentage of the Masters Candidatus/Professional Bachelors that have chosen the specific category. The categories do not sum up to 100, as more categories were available for selection. The total number of respondents for each response category is shown to the right of the figure.
18
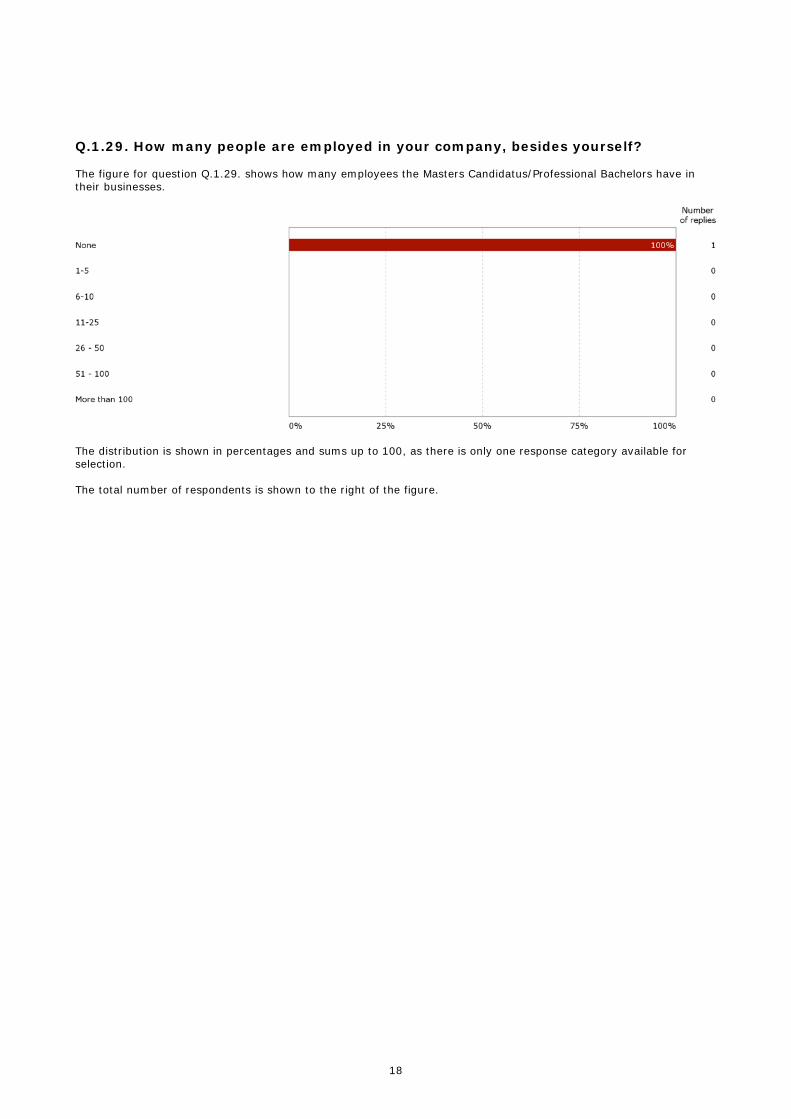
Q.1.29. How many people are employed in your company, besides yourself? The figure for question Q.1.29. shows how many employees the Masters Candidatus/Professional Bachelors have in their businesses.
The distribution is shown in percentages and sums up to 100, as there is only one response category available for selection. The total number of respondents is shown to the right of the figure.
19
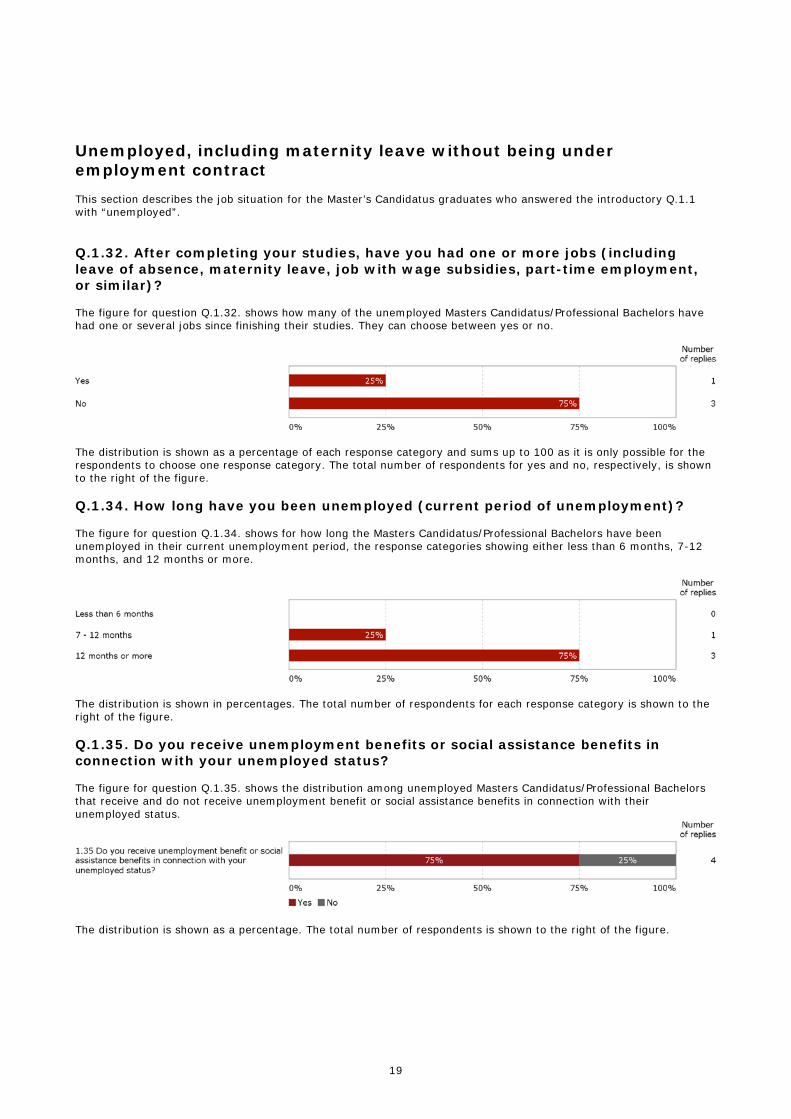
Unemployed, including maternity leave without being under employment contract This section describes the job situation for the Master’s Candidatus graduates who answered the introductory Q.1.1 with “unemployed”.
Q.1.32. After completing your studies, have you had one or more jobs (including leave of absence, maternity leave, job with wage subsidies, part-time employment, or similar)? The figure for question Q.1.32. shows how many of the unemployed Masters Candidatus/Professional Bachelors have had one or several jobs since finishing their studies. They can choose between yes or no.
The distribution is shown as a percentage of each response category and sums up to 100 as it is only possible for the respondents to choose one response category. The total number of respondents for yes and no, respectively, is shown to the right of the figure.
Q.1.34. How long have you been unemployed (current period of unemployment)? The figure for question Q.1.34. shows for how long the Masters Candidatus/Professional Bachelors have been unemployed in their current unemployment period, the response categories showing either less than 6 months, 7-12 months, and 12 months or more.
The distribution is shown in percentages. The total number of respondents for each response category is shown to the right of the figure.
Q.1.35. Do you receive unemployment benefits or social assistance benefits in connection with your unemployed status? The figure for question Q.1.35. shows the distribution among unemployed Masters Candidatus/Professional Bachelors that receive and do not receive unemployment benefit or social assistance benefits in connection with their unemployed status.
The distribution is shown as a percentage. The total number of respondents is shown to the right of the figure.
20
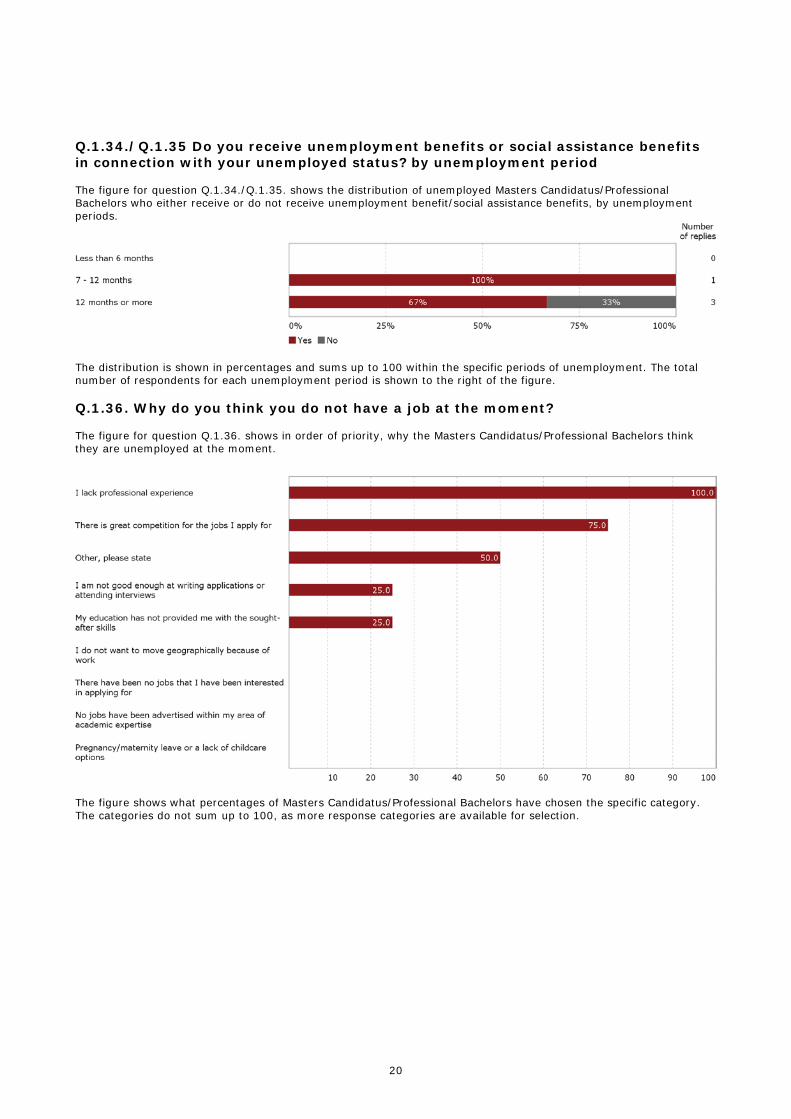
Q.1.34./Q.1.35 Do you receive unemployment benefits or social assistance benefits in connection with your unemployed status? by unemployment period The figure for question Q.1.34./Q.1.35. shows the distribution of unemployed Masters Candidatus/Professional Bachelors who either receive or do not receive unemployment benefit/social assistance benefits, by unemployment periods.
The distribution is shown in percentages and sums up to 100 within the specific periods of unemployment. The total number of respondents for each unemployment period is shown to the right of the figure.
Q.1.36. Why do you think you do not have a job at the moment? The figure for question Q.1.36. shows in order of priority, why the Masters Candidatus/Professional Bachelors think they are unemployed at the moment.
The figure shows what percentages of Masters Candidatus/Professional Bachelors have chosen the specific category. The categories do not sum up to 100, as more response categories are available for selection.

21
Full-time education
Q.1.39./Q.1.40. What education institution are you registered with? The table for question Q.1.39./Q.1.40. shows which education institutions the Masters Candidatus/Professional Bachelors in a full-time education are registered with. ph.d. Master's
(Candidatus)
programme
(Academic)
Bachelor's degree
Professional
bachelor degree
Professionsbachel
or
Anden uddannel
se
Total %
Aalborg University 0% 0% 0% 0% 0% 0% 0%
Aarhus University 0% 0% 0% 0% 0% 0% 0%
Copenhagen Business School 0% 0% 0% 0% 0% 0% 0%
Technical University of Denmark (DTU) 0% 0% 0% 0% 0% 0% 0%
IT University of Copenhagen 0% 0% 0% 0% 0% 0% 0%
University of Copenhagen 100% 0% 0% 0% 0% 0% 0%
Roskilde University (RUC) 0% 0% 0% 0% 0% 0% 0%
University of Southern Denmark 0% 0% 0% 0% 0% 0% 0%
Danish School of Media and Journalism 0% 0% 0% 0% 0% 0% 0%
University College 0% 0% 0% 0% 0% 0% 0%
A university in another country than Denmark, please state
0% 0% 0% 0% 0% 0% 0%
Other, please state 0% 0% 0% 0% 0% 0% 0%
Number of replies 3 0 0 0 0 0 0 The table shows the percentage within each specific education. The total number of respondents for each education is shown in the bottom row.

22
Q.1.42. How would you describe the correlation between your previous programme of study and your Ph.D? The figure for question Q.1.42. shows how the Masters Candidatus/Professional Bachelors registered on a PhD programme assess the correlation between their previous programme of study and their PhD.
The distribution is shown as a percentage. The total number of respondents for each response category is shown to the right of the figure.
23
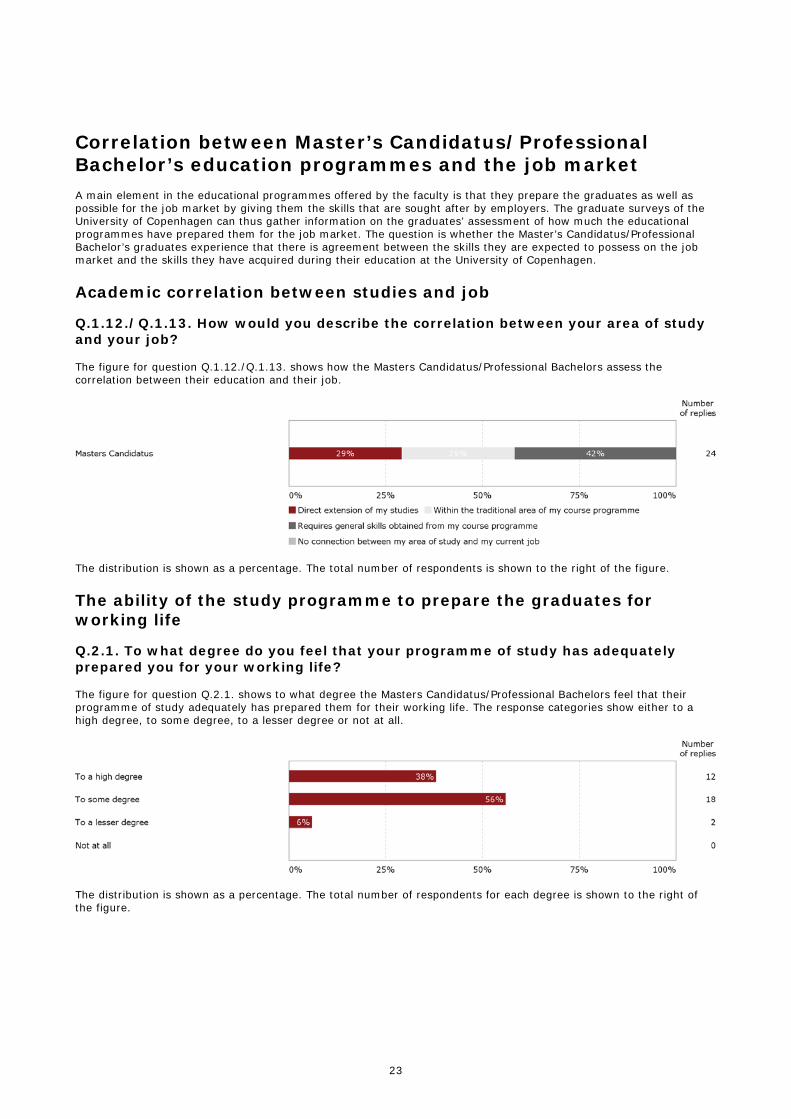
Correlation between Master’s Candidatus/Professional Bachelor’s education programmes and the job market A main element in the educational programmes offered by the faculty is that they prepare the graduates as well as possible for the job market by giving them the skills that are sought after by employers. The graduate surveys of the University of Copenhagen can thus gather information on the graduates’ assessment of how much the educational programmes have prepared them for the job market. The question is whether the Master’s Candidatus/Professional Bachelor’s graduates experience that there is agreement between the skills they are expected to possess on the job market and the skills they have acquired during their education at the University of Copenhagen.
Academic correlation between studies and job
Q.1.12./Q.1.13. How would you describe the correlation between your area of study and your job? The figure for question Q.1.12./Q.1.13. shows how the Masters Candidatus/Professional Bachelors assess the correlation between their education and their job.
The distribution is shown as a percentage. The total number of respondents is shown to the right of the figure.
The ability of the study programme to prepare the graduates for working life
Q.2.1. To what degree do you feel that your programme of study has adequately prepared you for your working life? The figure for question Q.2.1. shows to what degree the Masters Candidatus/Professional Bachelors feel that their programme of study adequately has prepared them for their working life. The response categories show either to a high degree, to some degree, to a lesser degree or not at all.
The distribution is shown as a percentage. The total number of respondents for each degree is shown to the right of the figure.

24
Q.2.4. How do you think the University of Copenhagen could improve upon how it prepares graduates for the demands of the labour market? The figure for question Q.2.4. shows in order of priority, what areas the Masters Candidatus/Professional Bachelors think the university could improve upon to prepare the graduates for the demands of the labour market.
The figure shows what percentage of the Masters Candidatus/Professional Bachelors that have chosen the specific category. The categories do not sum up to 100 as several categories are available for selection.
25
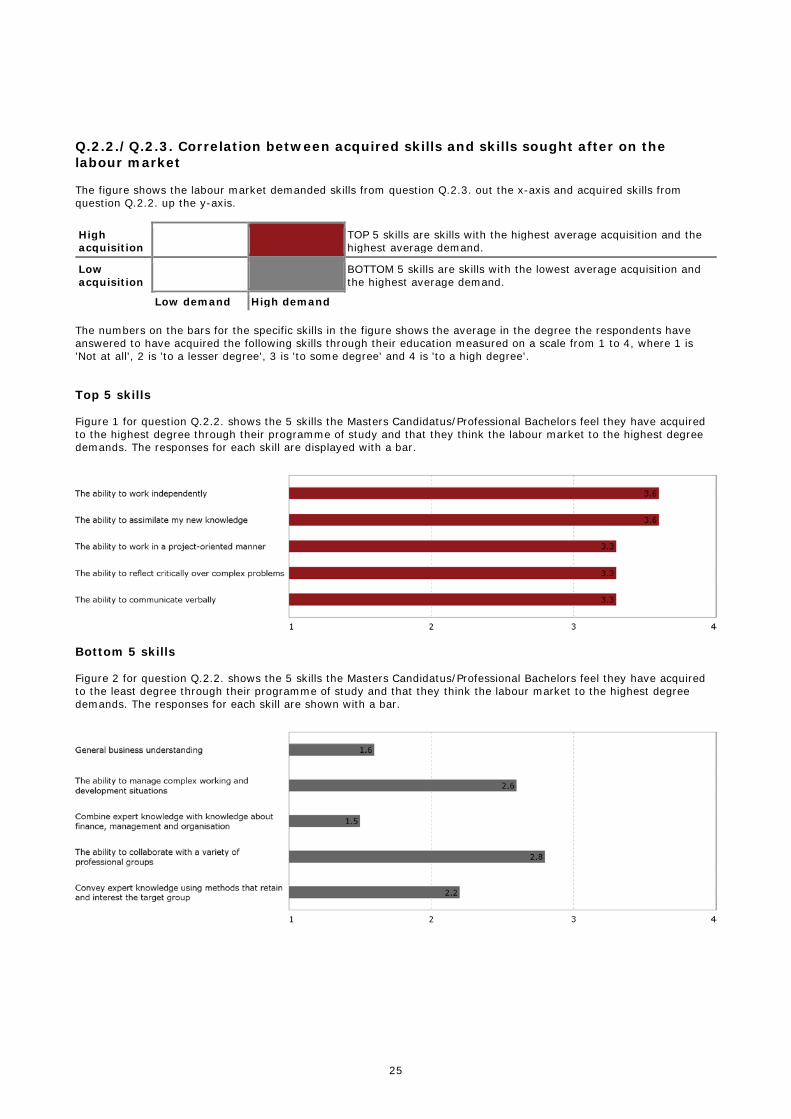
Q.2.2./Q.2.3. Correlation between acquired skills and skills sought after on the labour market The figure shows the labour market demanded skills from question Q.2.3. out the x-axis and acquired skills from question Q.2.2. up the y-axis.
High acquisition
TOP 5 skills are skills with the highest average acquisition and the highest average demand.
Low acquisition
BOTTOM 5 skills are skills with the lowest average acquisition and the highest average demand.
Low demand High demand The numbers on the bars for the specific skills in the figure shows the average in the degree the respondents have answered to have acquired the following skills through their education measured on a scale from 1 to 4, where 1 is 'Not at all', 2 is 'to a lesser degree', 3 is 'to some degree' and 4 is 'to a high degree'.
Top 5 skills Figure 1 for question Q.2.2. shows the 5 skills the Masters Candidatus/Professional Bachelors feel they have acquired to the highest degree through their programme of study and that they think the labour market to the highest degree demands. The responses for each skill are displayed with a bar.
Bottom 5 skills Figure 2 for question Q.2.2. shows the 5 skills the Masters Candidatus/Professional Bachelors feel they have acquired to the least degree through their programme of study and that they think the labour market to the highest degree demands. The responses for each skill are shown with a bar.

26
Master’s Candidatus/Professional Bachelor’s graduates routes to their first job This section deals with the Master’s Candidatus/Professional Bachelor’s graduates’ first job. There are several interesting questions in this regard, such as: How long did it take them to get a job? When did they start actively looking for jobs? What factors are relevant to getting a job as a recent graduate?
Master’s Candidatus/Professional Bachelor’s graduates first job
Q.3.1. How long time did you have to wait between graduating and obtaining your first job (incl. job with wage subsidies)? The table for question Q.3.1. shows how long time the Masters Candidatus/Professional Bachelors had to wait to obtain their first job. Masters Candidatus
I got the job before completing my studies 23%
0 - 3 months 27%
4 - 6 months 27%
7 - 12 months 19%
More than 12 months 4%
Number of replies 26 The table shows the percentages of each time interval.
Q.3.19. When did you start actively looking for a job? The table for question Q.3.19. shows when the Masters Candidatus/Professional Bachelors actively started looking for a job. Masters Candidatus
Before starting your Master's (Candidatus) thesis/final project or exam
21%
Before delivering your Master's (Candidatus) thesis/final project or exam
28%
After delivering your Master's (Candidatus) thesis/final project 21%
After passing your Master's (Candidatus) thesis/final project or exam
31%
Number of replies 29 The table shows the percentage share of each group.
27
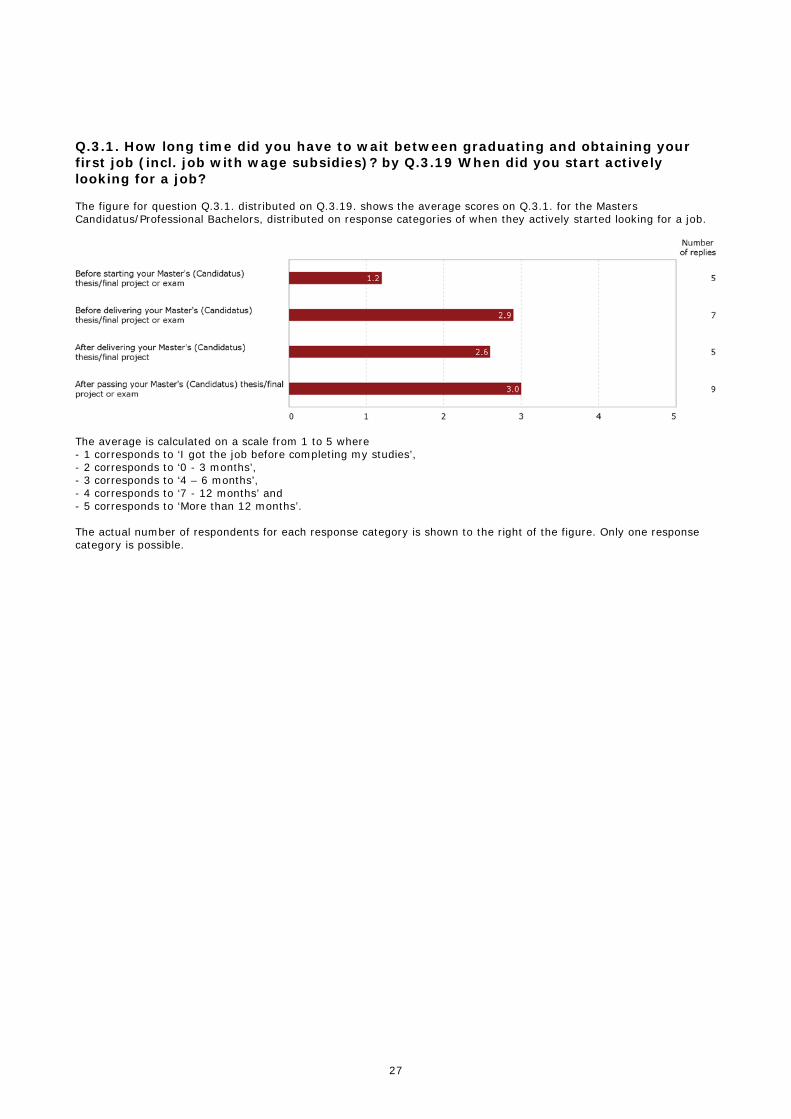
Q.3.1. How long time did you have to wait between graduating and obtaining your first job (incl. job with wage subsidies)? by Q.3.19 When did you start actively looking for a job? The figure for question Q.3.1. distributed on Q.3.19. shows the average scores on Q.3.1. for the Masters Candidatus/Professional Bachelors, distributed on response categories of when they actively started looking for a job.
The average is calculated on a scale from 1 to 5 where - 1 corresponds to ‘I got the job before completing my studies’, - 2 corresponds to ‘0 - 3 months’, - 3 corresponds to ‘4 – 6 months’, - 4 corresponds to ‘7 - 12 months’ and - 5 corresponds to ‘More than 12 months’. The actual number of respondents for each response category is shown to the right of the figure. Only one response category is possible.
28
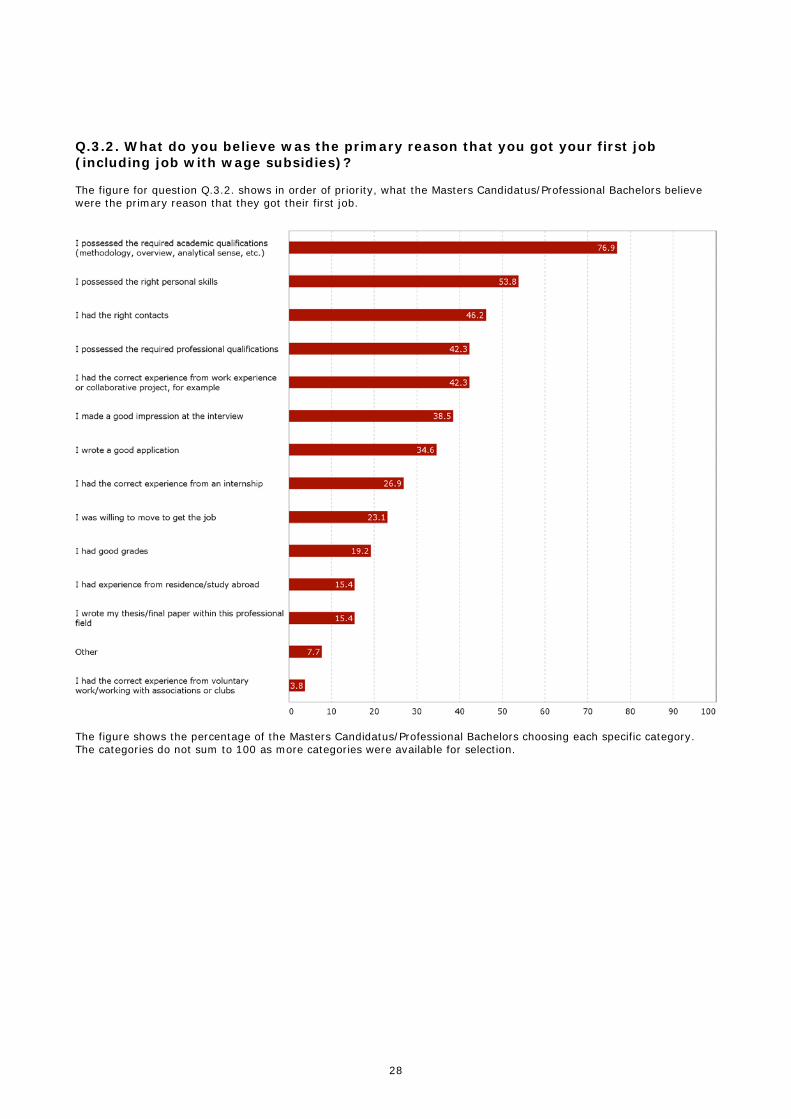
Q.3.2. What do you believe was the primary reason that you got your first job (including job with wage subsidies)? The figure for question Q.3.2. shows in order of priority, what the Masters Candidatus/Professional Bachelors believe were the primary reason that they got their first job.
The figure shows the percentage of the Masters Candidatus/Professional Bachelors choosing each specific category. The categories do not sum to 100 as more categories were available for selection.

29
The significance of student jobs, internships, study abroad, etc. for the first job
Q.3.3. Did you have a student job alongside your programme of studies? The table for question Q.3.3. shows the percentage of Masters Candidatus/Professional Bachelors having a student job alongside their programme of study. Masters Candidatus
Yes 72%
No 28%
Number of replies 29 The number divided between the two response categories of yes and no is shown in percentage.
Q.3.5. Have you subsequently been employed at a company/organisation where you did an internship? The table for question Q.3.5. shows the percentage of Masters Candidatus/Professional Bachelors who have had a student job alongside their programme of study, and who have subsequently been employed in the company/organisation where they worked as a student. Masters Candidatus
Yes 30%
No 70%
Number of replies 20 The number divided between the two response categories of yes and no is shown in percentage.
30
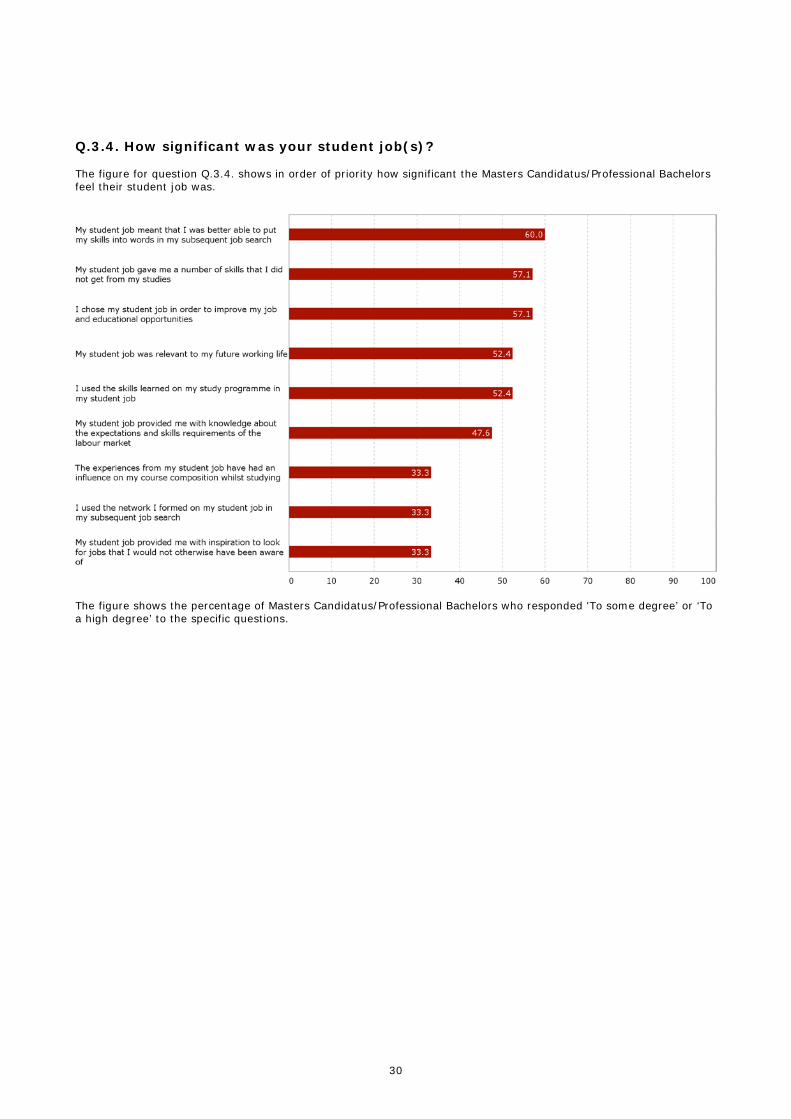
Q.3.4. How significant was your student job(s)? The figure for question Q.3.4. shows in order of priority how significant the Masters Candidatus/Professional Bachelors feel their student job was.
The figure shows the percentage of Masters Candidatus/Professional Bachelors who responded 'To some degree’ or ‘To a high degree’ to the specific questions.
31
Voluntary internship or project in private or public organisations
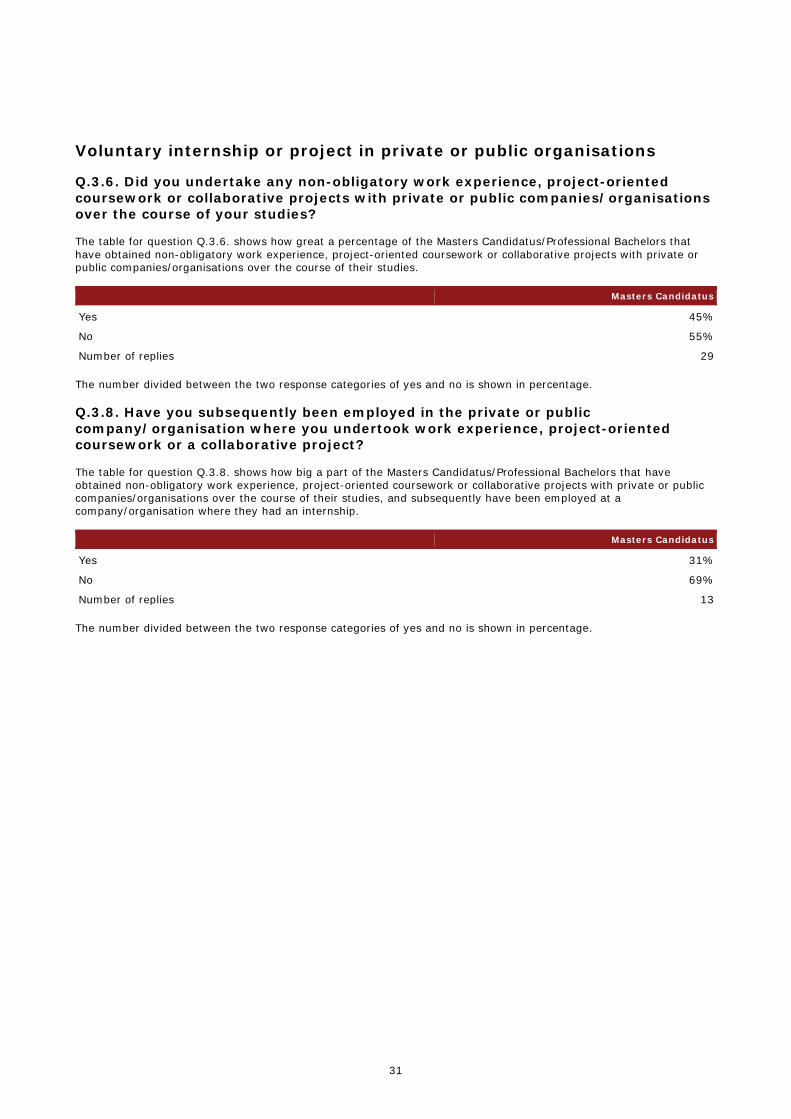
Q.3.6. Did you undertake any non-obligatory work experience, project-oriented coursework or collaborative projects with private or public companies/organisations over the course of your studies? The table for question Q.3.6. shows how great a percentage of the Masters Candidatus/Professional Bachelors that have obtained non-obligatory work experience, project-oriented coursework or collaborative projects with private or public companies/organisations over the course of their studies. Masters Candidatus
Yes 45%
No 55%
Number of replies 29 The number divided between the two response categories of yes and no is shown in percentage.
Q.3.8. Have you subsequently been employed in the private or public company/organisation where you undertook work experience, project-oriented coursework or a collaborative project? The table for question Q.3.8. shows how big a part of the Masters Candidatus/Professional Bachelors that have obtained non-obligatory work experience, project-oriented coursework or collaborative projects with private or public companies/organisations over the course of their studies, and subsequently have been employed at a company/organisation where they had an internship. Masters Candidatus
Yes 31%
No 69%
Number of replies 13 The number divided between the two response categories of yes and no is shown in percentage.
32
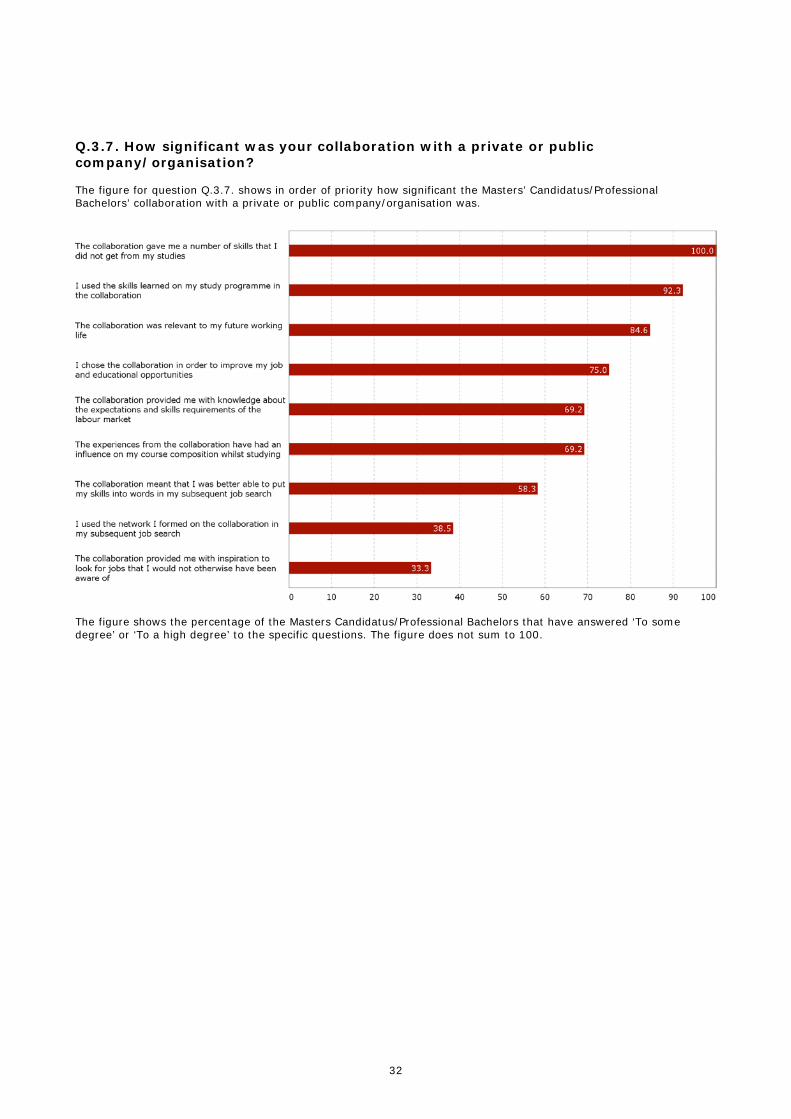
Q.3.7. How significant was your collaboration with a private or public company/organisation? The figure for question Q.3.7. shows in order of priority how significant the Masters’ Candidatus/Professional Bachelors’ collaboration with a private or public company/organisation was.
The figure shows the percentage of the Masters Candidatus/Professional Bachelors that have answered ‘To some degree’ or ‘To a high degree’ to the specific questions. The figure does not sum to 100.
33
Study abroad
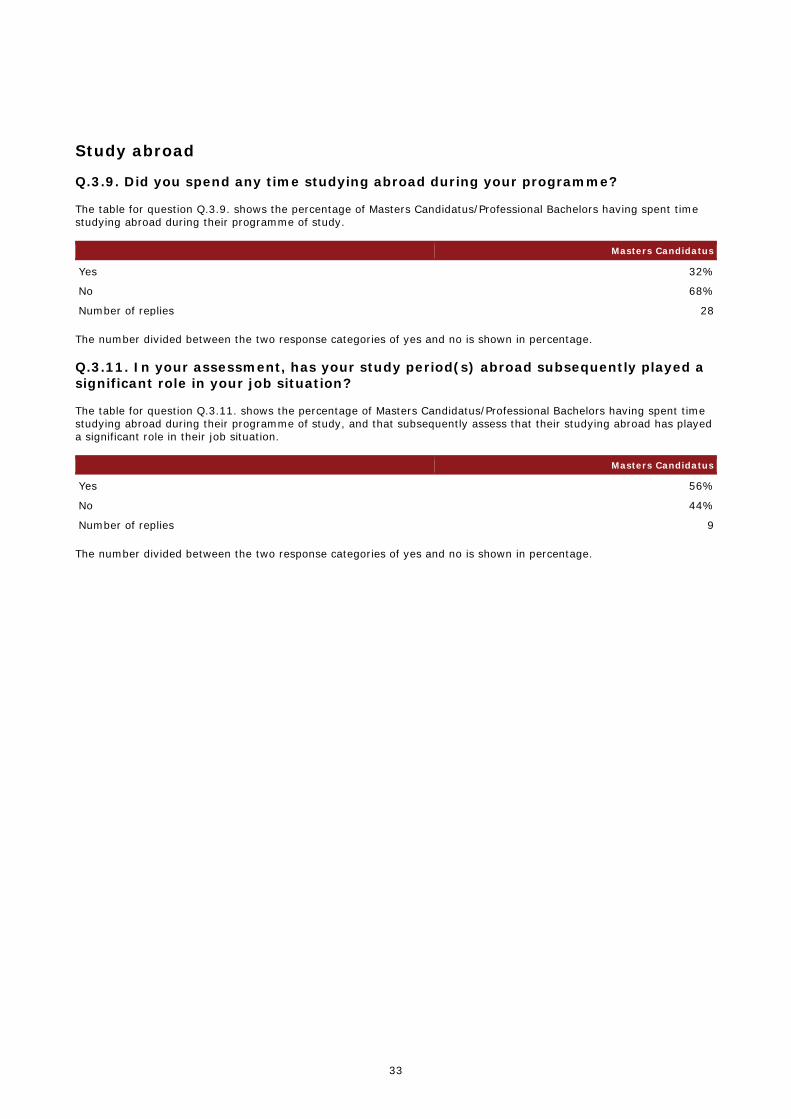
Q.3.9. Did you spend any time studying abroad during your programme? The table for question Q.3.9. shows the percentage of Masters Candidatus/Professional Bachelors having spent time studying abroad during their programme of study. Masters Candidatus
Yes 32%
No 68%
Number of replies 28 The number divided between the two response categories of yes and no is shown in percentage.
Q.3.11. In your assessment, has your study period(s) abroad subsequently played a significant role in your job situation? The table for question Q.3.11. shows the percentage of Masters Candidatus/Professional Bachelors having spent time studying abroad during their programme of study, and that subsequently assess that their studying abroad has played a significant role in their job situation. Masters Candidatus
Yes 56%
No 44%
Number of replies 9 The number divided between the two response categories of yes and no is shown in percentage.
34
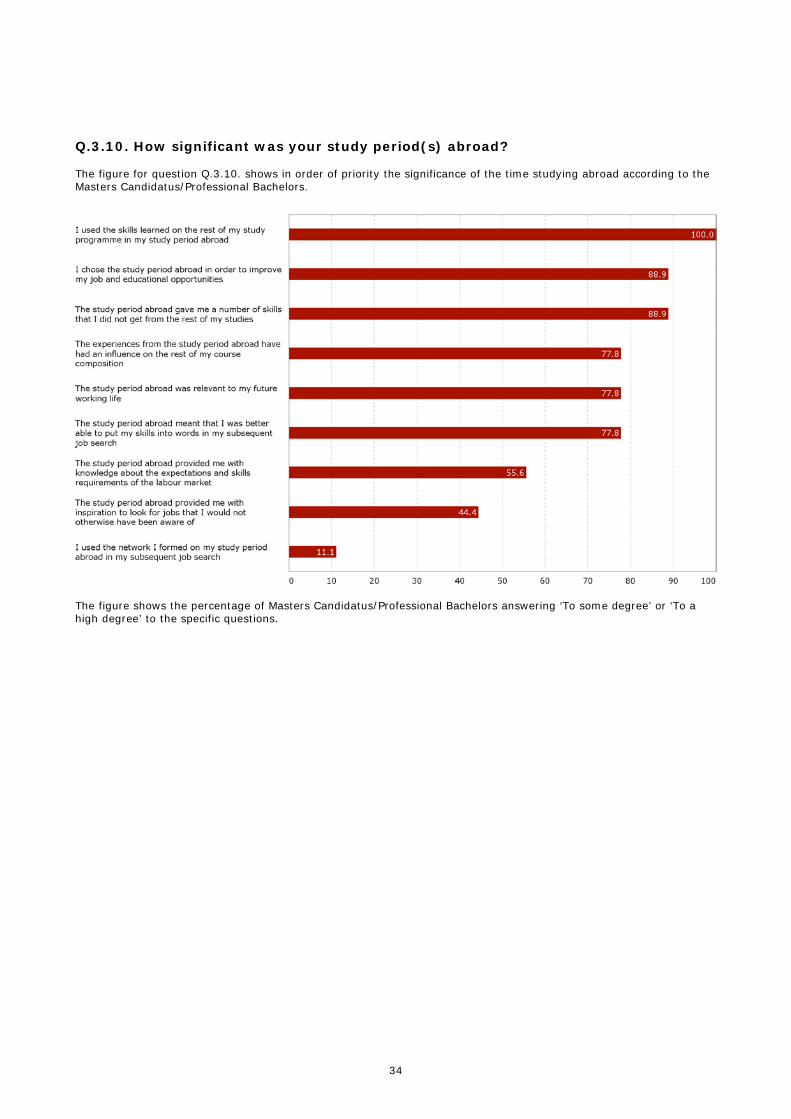
Q.3.10. How significant was your study period(s) abroad? The figure for question Q.3.10. shows in order of priority the significance of the time studying abroad according to the Masters Candidatus/Professional Bachelors.
The figure shows the percentage of Masters Candidatus/Professional Bachelors answering ‘To some degree’ or ‘To a high degree’ to the specific questions.

35
Activities during the programme of study such as student politics
Q.3.12. Have you taken part in voluntary activities such as student politics, alumni associations or for example acted as arranger of social activities during your programme of study? The table for question Q.3.12. shows the percentage of Masters Candidatus/Professional Bachelors having participated in voluntary activities such as student politics, alumni associations or for example acted as arranger of social activities during their programme of study. Masters Candidatus
Yes 25%
No 75%
Number of replies 28 The number divided between the two response categories of yes and no is shown in percentage.
Q.3.14. In your assessment, have the activities you took part in whilst studying subsequently played a significant role in your job situation? The table for question Q.3.14. shows how great a percentage of the Masters Candidatus/Professional Bachelors having participated in voluntary activities such as student politics, alumni associations or for example acted as arranger of social activities during their programme of study, and that simultaneously assess that this has played a significant role in their job situation. Masters Candidatus
Yes 43%
No 57%
Number of replies 7 The number divided between the two response categories of yes and no is shown in percentage.

36
Q.3.13. What impact has your voluntary work had on your programme of study? The figure for question Q.3.13. shows in order of priority for the Masters Candidatus/Professional Bachelors what significance the voluntary activities such as student politics, alumni associations or for example arranger of social activities during their programme of study have had.
The figure shows the percentage of Masters Candidatus/Professional Bachelors that have answered ‘To some degree’ or ‘To a high degree’ to the specific questions.

37
Master's Candidatus/Professional bachelor's assessment of the program compared with their own expectations Q.3.15. To what degree does your current occupation live up to the career expectations that you had whilst studying? The figure for question Q.3.15. shows to what degree Masters’ Candidatus/Professional Bachelors’ current occupation live up to the career expectations that they had whilst studying.
The distribution is shown as a percentage. The total number of respondents for each response category is shown to the right of the figure.
Q.3.16./3.16.X. When and to what degree did you consider to what kind of job your Master Candidatus/Professional Bachelor programme would lead? The figure for question Q.3.16./Q.3.16.X. shows when and to what degree the Masters Candidatus/Professional Bachelors considered what job their programme of study would lead to.
The distribution is shown as a percentage. The total number of respondents for each question is shown to the right of the figure.
Q.3.17. Did your job goals change during your programme of study? The table for question Q.3.7. shows if the Masters Candidatus/Professional Bachelors changed job goals once of more during their programme of study. Masters Candidatus
Yes, once 5%
Yes, several times 64%
No 32%
Number of replies 22 The distribution is shown as a percentage, and the total number of respondents is shown at the bottom of the table. Only one response category has been available for selection.
38
The Master Candidatus graduates assessment of the study programme
The level of teaching in relation to the entry requirements
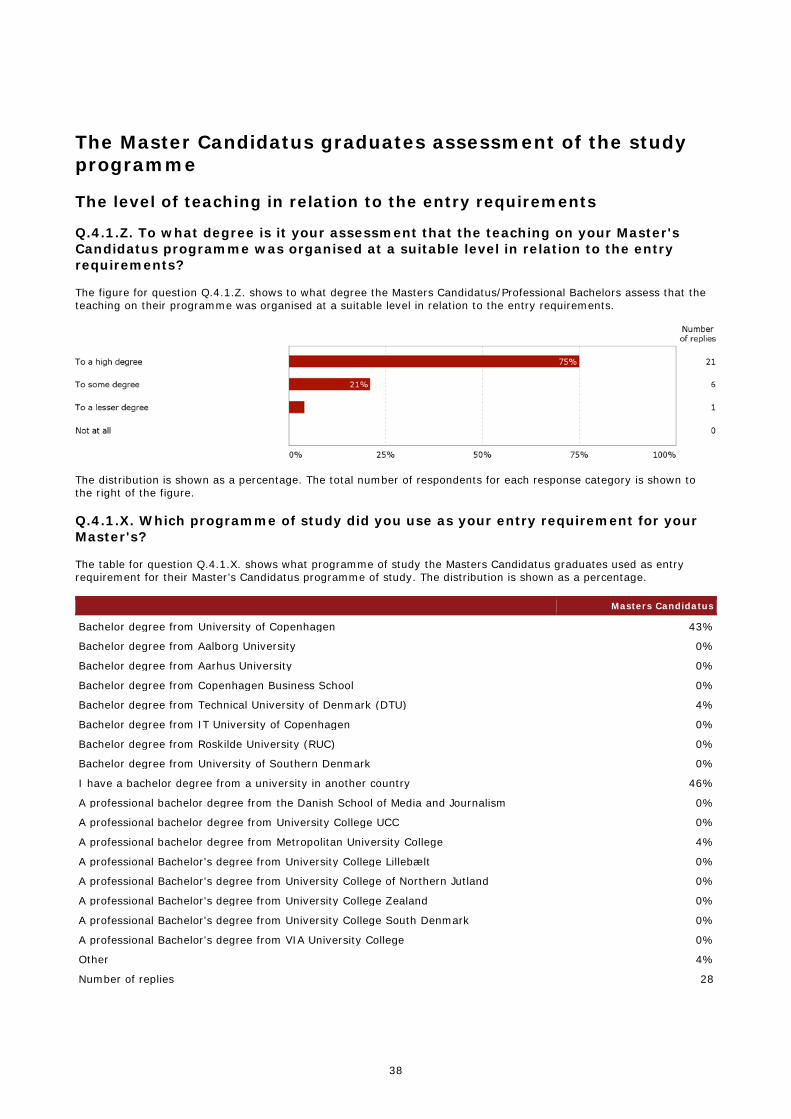
Q.4.1.Z. To what degree is it your assessment that the teaching on your Master's Candidatus programme was organised at a suitable level in relation to the entry requirements? The figure for question Q.4.1.Z. shows to what degree the Masters Candidatus/Professional Bachelors assess that the teaching on their programme was organised at a suitable level in relation to the entry requirements.
The distribution is shown as a percentage. The total number of respondents for each response category is shown to the right of the figure.
Q.4.1.X. Which programme of study did you use as your entry requirement for your Master's? The table for question Q.4.1.X. shows what programme of study the Masters Candidatus graduates used as entry requirement for their Master’s Candidatus programme of study. The distribution is shown as a percentage. Masters Candidatus
Bachelor degree from University of Copenhagen 43%
Bachelor degree from Aalborg University 0%
Bachelor degree from Aarhus University 0%
Bachelor degree from Copenhagen Business School 0%
Bachelor degree from Technical University of Denmark (DTU) 4%
Bachelor degree from IT University of Copenhagen 0%
Bachelor degree from Roskilde University (RUC) 0%
Bachelor degree from University of Southern Denmark 0%
I have a bachelor degree from a university in another country 46%
A professional bachelor degree from the Danish School of Media and Journalism 0%
A professional bachelor degree from University College UCC 0%
A professional bachelor degree from Metropolitan University College 4%
A professional Bachelor's degree from University College Lillebælt 0%
A professional Bachelor's degree from University College of Northern Jutland 0%
A professional Bachelor's degree from University College Zealand 0%
A professional Bachelor's degree from University College South Denmark 0%
A professional Bachelor's degree from VIA University College 0%
Other 4%
Number of replies 28

39
A list of the Master Candidatus students' qualifying bachelor exams from University of Copenhagen is shown in appendix 7. % n
Food and nutrition/food science and technology/foodstuff studies 83% 10
Number of replies 12
Q.4.7.X. To what degree do you feel that all the elements of the Master's programme have contributed to the collective goals of the teaching offer? The figure for question Q.4.7.X. shows to what degree the Masters Candidatus graduates assess that the elements of the Bachelor/ professional Bachelor programme have contributed to the collective goals of the teaching.
The distribution is shown as a percentage. The total number of respondents for each response category is shown to the right of the figure.
Specifics about the Master's Candidatus program The figure for questions Q.4.2.X., Q.4.3.X., Q.4.6.X., Q.4.4.X., Q.4.5.X. shows how the Masters Candidatus graduates assess different conditions in their programme of study. To what degree...
The distribution is shown as a percentage. The total number of respondents for each question is shown to the right of the figure.
40
The graduates assessment of the opportunities for study abroad, internship etc. without extensions
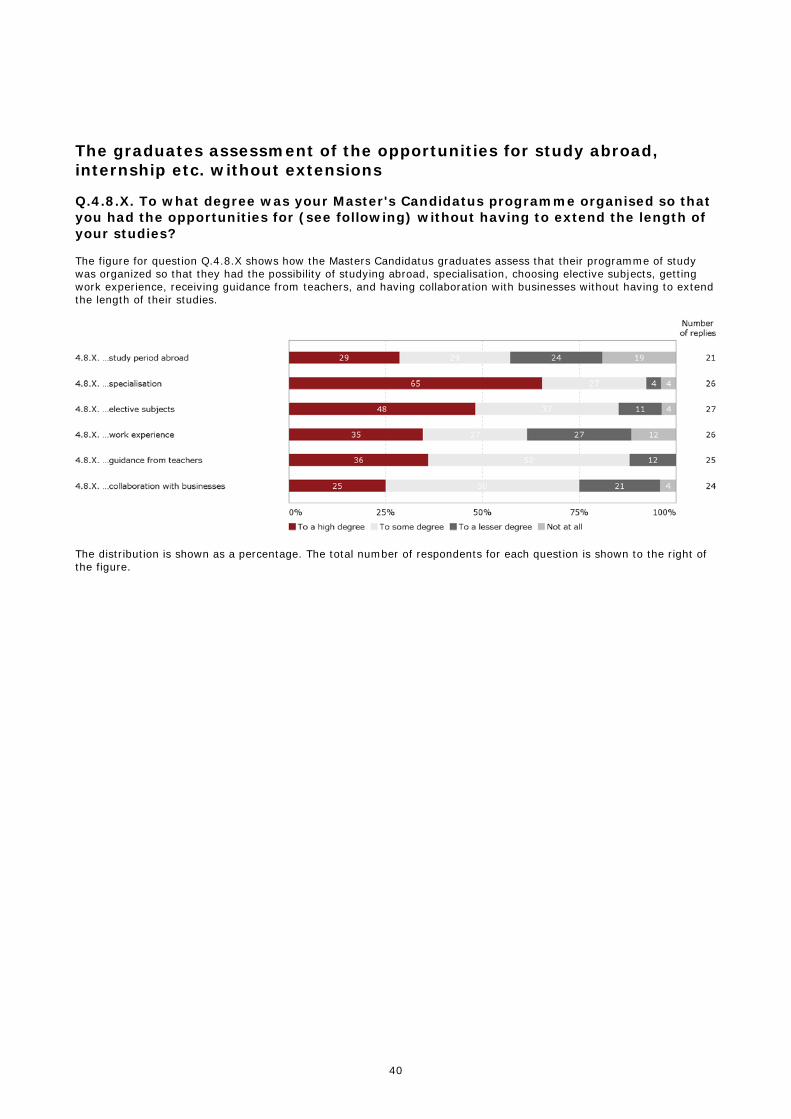
Q.4.8.X. To what degree was your Master's Candidatus programme organised so that you had the opportunities for (see following) without having to extend the length of your studies? The figure for question Q.4.8.X shows how the Masters Candidatus graduates assess that their programme of study was organized so that they had the possibility of studying abroad, specialisation, choosing elective subjects, getting work experience, receiving guidance from teachers, and having collaboration with businesses without having to extend the length of their studies.
The distribution is shown as a percentage. The total number of respondents for each question is shown to the right of the figure.

41
The teacher's professional and educational expertise The figure for question Q.4.9.X. shows how the Masters Candidatus graduates assess the teachers’ professional and educational expertise.
Q.4.9.X. Educational expertise
Q.4.9.X. Professional expertise
The distribution is shown as a percentage. The total number of respondents for each response category is shown to the right of the figure.

42
Appendix 1: Questions used in the report Employment Relevance and correlation
between area of study and the labour market
Transition from study programme to labour market
Quality of programme of study
Q.1.1. Q.2.1. Q.3.1. Q.4.1.
Q.1.2. Q.2.2. Q.3.2. Q.4.1.X.
Q.1.3. Q.2.3. Q.3.3. Q.4.1.Z.
Q.1.7. Q.2.4. Q.3.4. Q.4.2.
Q.1.8. Q.3.5. Q.4.2.X.
Q.1.9. Q.3.6. Q.4.3.
Q.1.10. Q.3.7. Q.4.3.X.
Q.1.11. Q.3.8. Q.4.4.
Q.1.12. Q.3.9. Q.4.4.X.
Q.1.13. Q.3.10. Q.4.5.
Q.1.14. Q.3.11. Q.4.5.X.
Q.1.15. Q.3.12. Q.4.6.
Q.1.16. Q.3.13. Q.4.7.
Q.1.17 Q.3.14 Q.4.6.X.
Q.1.18.1. Q.3.15. Q.4.7.X.
Q.1.19. Q.3.16. Q.4.8.
Q.1.21. Q.3.16.X. Q.4.8.X.
Q.1.23. Q.3.17. Q.4.9.
Q.1.26. Q.3.19. Q.4.9.X.
Q.1.27
Q.1.28.
Q.1.29.
Q.1.30.
Q.1.31.
Q.1.32.
Q.1.34.
Q.1.35.
Q.1.36.
Q.1.38.
Q.1.39.
Q.1.40.
Q.1.42.
43
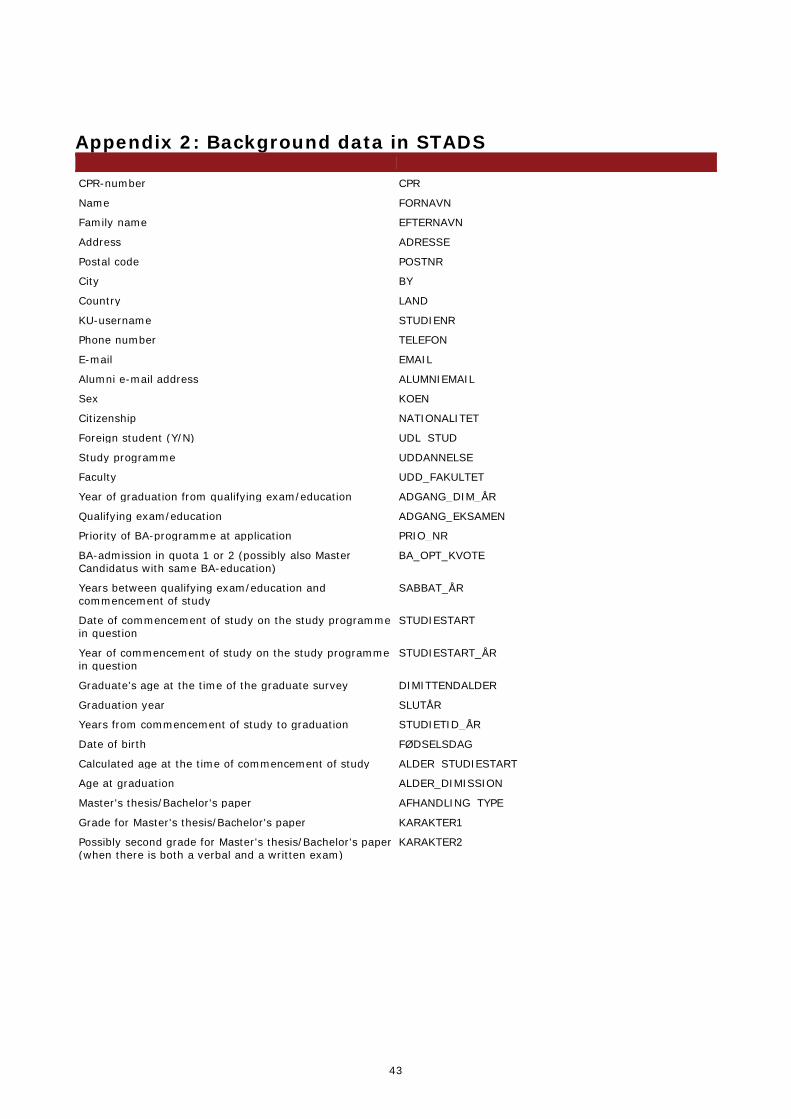
Appendix 2: Background data in STADS
CPR-number CPR
Name FORNAVN
Family name EFTERNAVN
Address ADRESSE
Postal code POSTNR
City BY
Country LAND
KU-username STUDIENR
Phone number TELEFON
E-mail EMAIL
Alumni e-mail address ALUMNIEMAIL
Sex KOEN
Citizenship NATIONALITET
Foreign student (Y/N) UDL_STUD
Study programme UDDANNELSE
Faculty UDD_FAKULTET
Year of graduation from qualifying exam/education ADGANG_DIM_ÅR
Qualifying exam/education ADGANG_EKSAMEN
Priority of BA-programme at application PRIO_NR
BA-admission in quota 1 or 2 (possibly also Master Candidatus with same BA-education)
BA_OPT_KVOTE
Years between qualifying exam/education and commencement of study
SABBAT_ÅR
Date of commencement of study on the study programme in question
STUDIESTART
Year of commencement of study on the study programme in question
STUDIESTART_ÅR
Graduate's age at the time of the graduate survey DIMITTENDALDER
Graduation year SLUTÅR
Years from commencement of study to graduation STUDIETID_ÅR
Date of birth FØDSELSDAG
Calculated age at the time of commencement of study ALDER_STUDIESTART
Age at graduation ALDER_DIMISSION
Master's thesis/Bachelor's paper AFHANDLING_TYPE
Grade for Master's thesis/Bachelor's paper KARAKTER1
Possibly second grade for Master's thesis/Bachelor's paper (when there is both a verbal and a written exam)
KARAKTER2

44
Appendix 3: List of work places and job titles
• Brewmaster • Chemist • Chemometrician • Filling Professional • GMP-ingeniør • Kemiker • Kvalitetsassistent • Kvalitetskoordinator • Lead Auditor - GMP/ISO/GDP • Produktions kemiker • Produktionsleder • QC kemiker • Quality Assurance Coordinator • Quality and Safety Assistant • Teacher • Technology and Process Transfer • Videnskabelig assistent • akademiker • brygmester
• ALK abello • Albani bryggeriet - Royal Unibrew A/S • FOSS • Herslev Bryghus • Institute for Vocational Education • JJ Food Service Limited, London • KU SCIENCE • Nestle Spain Headquarters Office (Barcelona) • Novo Nordisk • Novo Nordisk • Novo Nordisk • Novo Nordisk • Novo Nordisk A/S • Novo Nordisk A/S • Pharmaceutical industry • Statens Serum Institut • Statens serum institut • Tulip • bryggeriet skands

45
Appendix 5: List of examples of elements of the study programme that did not contribute to the collective goals of the teaching offer divided on Masters Candidatus and Professional Bachelors
• Kandidat: Det er lang tid siden jeg blev færdig, men generelt syntes jeg at der manglede noget struktur fra forlæsers side af/klarlæggelse af den fulde arbejds byrde samt bedre planlægning i forhold til læsning af pensum. Oplevelsen var også at hvis man havde læst pensum, kom nogle forlæsere med nogle slides der ikke fortalte mere end det man havde læst. Hvorfor skal man så gå til forlæsning?
46
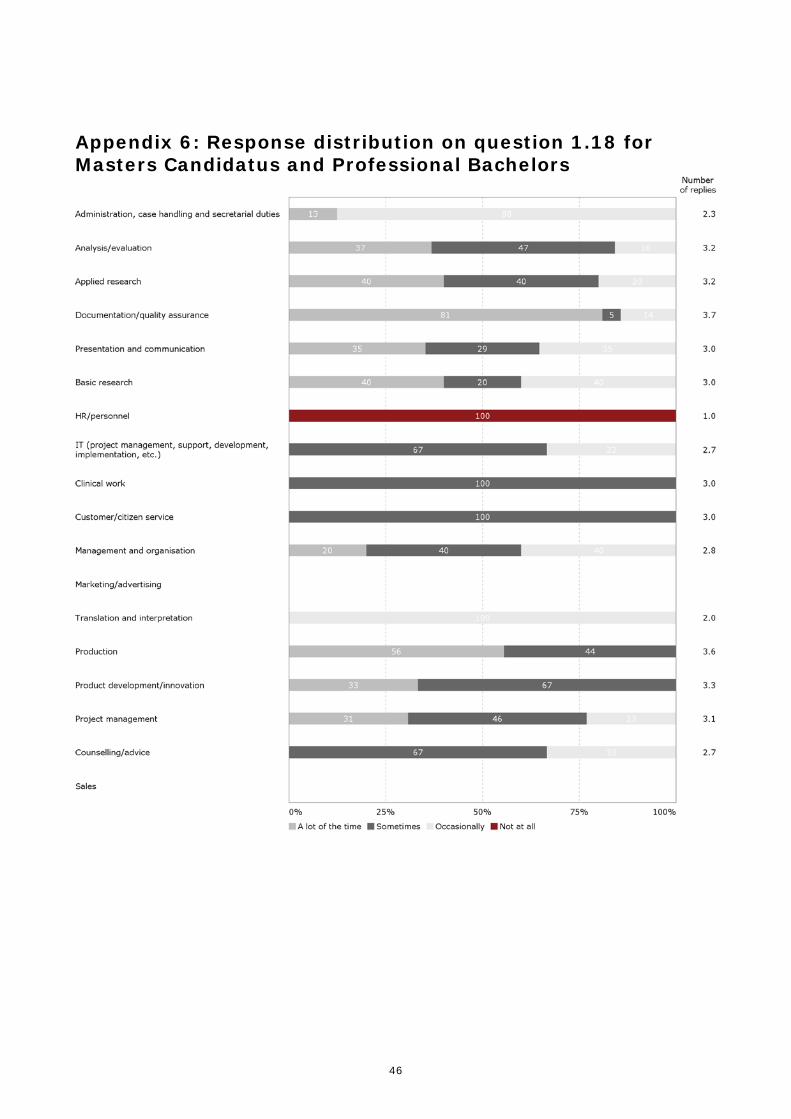
Appendix 6: Response distribution on question 1.18 for Masters Candidatus and Professional Bachelors

47