REPORT - World Health...
86
PRIORITIES IN THE ASSESSMENT OF V ITAMIN A AND I RON S TATUS IN POPULATIONS PANAMA CITY, PANAMA 15–17 SEPTEMBER 2010 REPORT
-
Upload
phungthuan -
Category
Documents
-
view
214 -
download
0
Transcript of REPORT - World Health...
Priorities in the Assessment of VitAmin A And iron stAtus in PoPulAtionsPANAMA CITY, PANAMA 15–17 SEPTEMBER 2010
REPORT
© World Health Organization 2012
All rights reserved. Publications of the World Health Organization are available on the WHO web site (www.who.int) or can be purchased from WHO Press, World Health Organization, 20 Avenue Appia, 1211 Geneva 27, Switzerland (tel.: +41 22 791 3264; fax: +41 22 791 4857; e-mail: [email protected]). Requests for permission to reproduce or translate WHO publications – whether for sale or for noncommercial distribution – should be addressed to WHO Press through the WHO web site (http://www.who.int/about/licensing/copyright_form/en/index.html).
The designations employed and the presentation of the material in this publication do not imply the expression of any opinion whatsoever on the part of the World Health Organization concerning the legal status of any country, territory, city or area or of its authorities, or concerning the delimitation of its frontiers or boundaries. Dotted lines on maps represent approximate border lines for which there may not yet be full agreement.
The mention of specific companies or of certain manufacturers’ products does not imply that they are endorsed or recom-mended by the World Health Organization in preference to others of a similar nature that are not mentioned. Errors and omissions excepted, the names of proprietary products are distinguished by initial capital letters.
All reasonable precautions have been taken by the World Health Organization to verify the information contained in this publication. However, the published material is being distributed without warranty of any kind, either expressed or implied. The responsibility for the interpretation and use of the material lies with the reader. In no event shall the World Health Organization be liable for damages arising from its use.
The authors (Douglas Taren, Sherry A. Tanumihardjo, Sean Lynch, David I. Thurnham and George P. McCabe) of the background papers included in the annexes alone are responsible for the views expressed in the papers, which do not nec-essarily represent the decisions, policy or views of the World Health Organization.
Design by minimum graphics
Suggested citation
WHO. Report: Priorities in the assessment of vitamin A and iron status in populations, Panama City, Panama, 15–17 Sep-tember 2010. Geneva, World Health Organization, 2012.
WHO Library Cataloguing-in-Publication Data
Report: priorities in the assessment of vitamin A and iron status and in populations, Panama City, Panama, 15–17 September 2010.
1.Vitamin A – administration and dosage. 2.Vitamin A deficiency – prevention and control. 3.Iron, Dietary. 4.Nutritional status. 5.Nutrition assessment. 6.Guidelines as topic. I.World Health Organization.
ISBN 978 92 4 150422 5 (NLM classification: WD 105)
iii
CONTENTS
Contents
Acknowledgements iv
Financial support iv
Introduction 1
Management of conflicts of interest 2
Summaries of meeting presentations 3
WHO guideline development process 3
Nutrition guidelines in WHO: priority setting for the Monitoring and Evaluation Subgroup 4
Scoping of the guidelines on the assessment of vitamin A and iron status in populations 5
Use of systematic reviews on biomarkers of micronutrient status: EURRECA example 7
Overview of current WHO guidelines on assessing the iron status of populations and 2004 analysis of data from iron intervention studies 9
The Grading of Recommendations Assessment, Development and Evaluation (GRADE) methodology for assessing the quality of the evidence and establishing the strength of the recommendations 10
Historical and practical uses of assessing night blindness as an indicator for vitamin A status 12
Biomarkers of vitamin A status: what do they mean? 12
The rationale for selecting and standardizing iron status indicators 13
The effect of subclinical infection on serum ferritin and serum retinol: two meta-analyses 13
Overview of current WHO guidelines on indicators for assessing vitamin A deficiency and their application in monitoring and evaluating intervention programmes 14
Group discussion: Review of priority questions on indicators of vitamin A and iron status 16
References 21
Annex 1. List of participants 23
Annex 2. Background papers 27
A2.1: Historical and practical uses of assessing night blindness as an indicator for vitamin A deficiency 29
A2.2: Biomarkers of vitamin A status: what do they mean? 44
A2.3: The rationale for selecting and standardizing iron status indicators 55
A2.4: Influence of infection and inflammation on biomarkers of nutritional status with an emphasis on vitamin A and iron 63
iv
ACknowledgements
This meeting report was prepared by Dr Lisa M. Rogers. The meeting was convened by the Department of Nutrition for Health and Development of the World Health Organization (WHO), in collaboration with the International Micronutrient Malnutrition Prevention and Control (IMMPaCt) programme, Centers for Disease Control and Prevention (CDC). We would like to thank Dr Luz Maria De-Regil, Dr Zuguo Mei and Dr Juan Pablo Peña-Rosas for their technical input. We would also like to thank the Pan American Health Organization (PAHO) regional and country staff, in particular Dr Rubén Grajeda, Dr Joaquin Molina Leza, Dr Chessa Lutter and Dr Manuel Peña, for their support in hosting this meeting in Panama. Ms Grace Rob and Mrs Paule Pillard from the Department of Nutrition for Health and Devel-opment provided logistic support.
WHO gratefully acknowledges the technical input of the participants attending the meet-ing, especially the chair Dr Lindsay Allen and the authors of the background papers which were prepared for this meeting.
Financial support
WHO thanks the Government of Luxembourg and the International Micronutrient Malnu-trition Prevention and Control (IMMPaCt) programme of the Centers for Disease Control and Prevention (CDC) for providing financial support for this meeting and publication of this report.
WHO TECHNICAL CONSULTATION ON VITAMIN A IN NEWBORN HEALTH: MECHANISTIC STUDIES
1
introduCtion
INTRODUCTION
At the forty-fifth World Health Assembly, held in 1992, in resolution WHA45.33 Member States were urged “to establish, as part of the health and nutrition monitoring system, a micronutrient monitoring and evaluation system capable of assessing the magnitude and distribution of vita-min A and iron deficiency disorders, and monitor the implementation and impact of control programmes” (1). Additionally, in 2010, the sixty-third World Health Assembly approved the first organization-wide strategy on research. The strategy – Research for health – defines a com-mon framework for how research is approached in the World Health Organization (WHO) and the role WHO is taking in global health research (2). Research for health has been defined to cover five areas of activity, two of which include the measurement of the magnitude and distri-bution of a health problem and the evaluation of the impact of solutions or interventions on the level and distribution of a health problem. WHO guidance on the use of indicators for assess-ing a population’s vitamin and mineral status and the application of indicators for monitoring and evaluating intervention programmes aims to assist Member States and their partners in establishing a micronutrient monitoring and evaluation system.
WHO has also recognized the need to use more rigorous processes to ensure that health-care recommendations are informed by the best available research evidence. The WHO Guidelines Review Committee was established in 2007 with the purpose of developing and implementing procedures to ensure that WHO guidelines are developed in ways consistent with best practice, emphasizing the appropriate use of evidence.
In 2009, the Department of Nutrition for Health and Development, in partnership with the Department of Research Policy and Cooperation and other internal partners, established the WHO Nutrition Guidance Expert Advisory Group. Their work involved advising WHO in the development of evidence-informed guidelines for measuring the magnitude and distribution of malnutrition and evaluating the impact of solutions recommended through policies and programmes, while also understanding the level and distribution of the problem.
A Monitoring and Evaluation subgroup was established for the biennium 2010–2011 to advise WHO on the scope of the guidelines, the choice of important outcomes for decision-making and the interpretation of the evidence for developing recommendations in nutrition surveillance. Membership of this subgroup included experts from various WHO expert advi-sory panels and those identified through open calls for specialists, taking into consideration a balanced gender mix, multiple disciplinary areas of expertise and representation from all WHO regions.
On 15–17 September 2010, WHO convened a meeting in Panama City, Panama, to discuss and initiate the work of updating WHO guidelines on indicators for the assessment of vitamin A and iron status. In preparation for this meeting, four background papers were commis-sioned on historical and practical uses of assessing night blindness as an indicator for vitamin A deficiency, biomarkers of vitamin A status, the rationale for selecting and standardizing iron status indicators, and the influence of infection and inflammation on biomarkers of nutritional status, with an emphasis on vitamin A and iron. The background papers, in addition to the scoping document prepared by technical staff at the Department of Nutrition for Health and Development, were presented and discussed during the consultation. This report summarizes the discussions and presents the background papers (see Annex 2).
2
WHO TECHNICAL CONSULTATION ON VITAMIN A IN NEWBORN HEALTH: MECHANISTIC STUDIES
mAnAgement of ConfliCts of interest
According to the rules in the WHO Basic documents (3), all experts participating in WHO meetings must declare any interest relevant to the meeting prior to their participation. The conflicts of interest statements of all the participants were reviewed by the responsible techni-cal officer and the relevant departments before the meeting. The procedures for management of conflicts of interest strictly followed the WHO Guidelines for declaration of interests (WHO experts) (4). The potential conflicts of interest declared by the participants attending the meet-ing are summarized below.
n Dr Jonathan Gorstein declared being a senior adviser to the Global Alliance for Improved Nutrition (GAIN) in regard to the biological impact of interventions. He is also a consult-ant to the Program for Appropriate Technology in Health (PATH) to help identify tools for the assessment of vitamin and mineral deficiencies in low-resource settings. Although the nature of the work at PATH is related to the topic of interest (tools for the assessment of status), it is an international non-profit organization and it was agreed that this should be reported in the proceedings and Dr Gorstein would participate fully in the meeting and discussions.
n Dr Ronald Kupka declared receiving a research grant from Harvard University in the amount of US$15 000 to examine indicators of iron status in a cohort of children in Tanza-nia. It was agreed that this should be reported in the proceedings and that Dr Kupka would participate fully in the meeting and discussions.
All other participants declared no conflicts of interest. External resource persons were invited to the meeting as observers and to provide technical input, but they did not participate in the decision-making processes.
3
summAry of meeting PresentAtions n WHO guideline development process
(Presented by Cynthia Souza)
In 2007, it was reported that WHO guidelines were not transparent or evidence-based (5). Systematic reviews were rarely used for developing recommendations and there was little transparency about judgements made. Instead, processes usually relied on expert opinion, and global guidelines were not being adapted to the needs of the end users. In response to these concerns, and following up on recommendations of the Advisory Committee on Health Research (ACHR) and resolution EB120.R15 of the 120th Session of the Executive Board, the Guidelines Review Committee was established. The purpose of this committee is to develop and implement standards and procedures for guideline development that ensure that WHO guidelines are consistent with internationally accepted best practice, including appropriate use of evidence. The Guidelines Review Committee members are appointed by the Director-General and include members of staff from WHO headquarters and the regional offices as well as external experts.
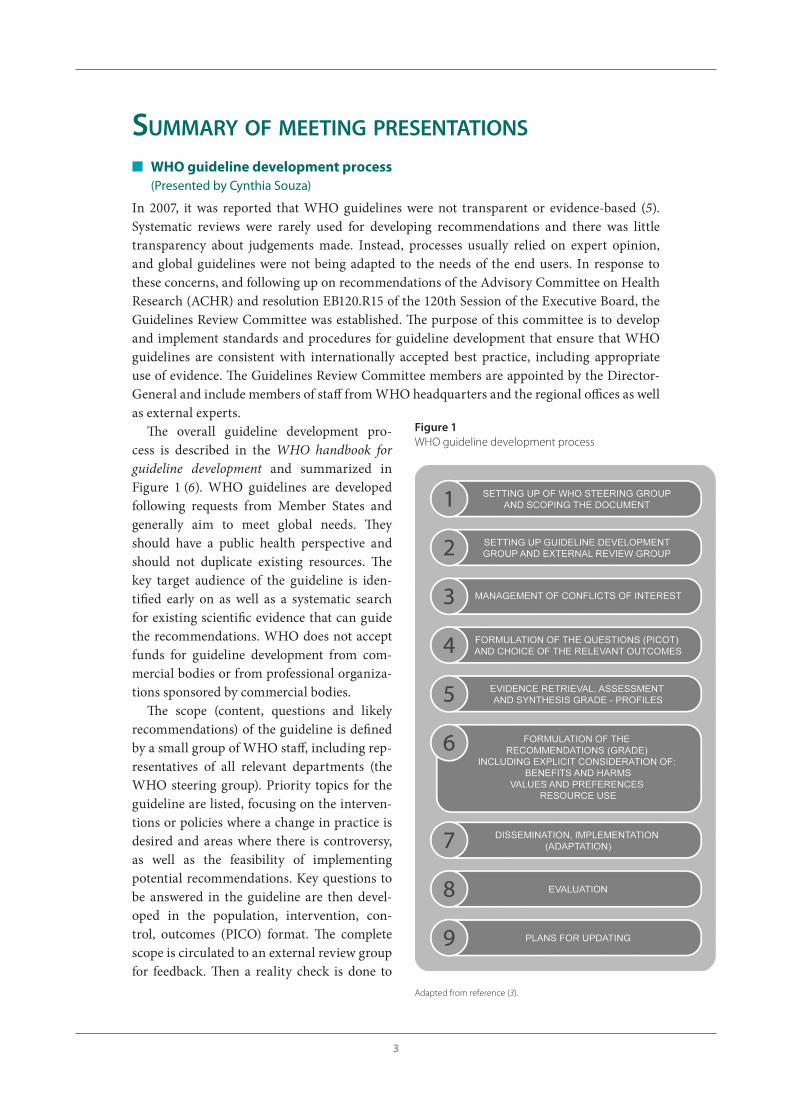
The overall guideline development pro-cess is described in the WHO handbook for guideline development and summarized in Figure 1 (6). WHO guidelines are developed following requests from Member States and generally aim to meet global needs. They should have a public health perspective and should not duplicate existing resources. The key target audience of the guideline is iden-tified early on as well as a systematic search for existing scientific evidence that can guide the recommendations. WHO does not accept funds for guideline development from com-mercial bodies or from professional organiza-tions sponsored by commercial bodies.
The scope (content, questions and likely recommendations) of the guideline is defined by a small group of WHO staff, including rep-resentatives of all relevant departments (the WHO steering group). Priority topics for the guideline are listed, focusing on the interven-tions or policies where a change in practice is desired and areas where there is controversy, as well as the feasibility of implementing potential recommendations. Key questions to be answered in the guideline are then devel-oped in the population, intervention, con-trol, outcomes (PICO) format. The complete scope is circulated to an external review group for feedback. Then a reality check is done to
SUMMARY OF MEETING PRESENTATIONS
Adapted from reference (3).
Figure 1WHO guideline development process
4
WHO REPORT: PRIORITIES IN THE ASSESSMENT OF VITAMIN A AND IRON STATUS IN POPULATIONS
ensure that the processes in the scope are feasible and can be carried out within the timeframe and budget available.
A specially convened, multidisciplinary guideline development group is then set up, which includes content experts from the specialties involved, methodologists (experts in assessing evidence and developing guidelines, health economists, statisticians as appropriate), represent-atives of potential stakeholders (e.g. managers and other health professionals involved in the health-care process), and patients and consumers. Representation of all regions likely to use the guideline and a balanced gender mix are considered in the selection of group members. The group advises on: the priority questions and scope of the guideline; the choice of impor-tant outcomes for decision-making; and the interpretation of the evidence for informing the guideline, with explicit consideration of the overall balance of risks and benefits. It also assists in formulating recommendations, taking into account diverse values and preferences.
All experts participating in WHO meetings must declare any interest relevant to the meeting prior to their participation by completing a Declaration of Interests form, which includes per-sonal and non-personal (family) financial interests, academic interests, and public statements and other activities that may be relevant to the subject of the meeting or guideline. Examples of interests that are clearly a conflict, and that should preclude participation in developing recom-mendations are: owning shares in a company that manufactures a product or technology that may be recommended for use in the guideline; holding a patent on a product or technology that may be recommended for use in the guideline; a family member working for a company that manufactures a product or technology that may be recommended for use in the guideline; current or past involvement in a major academic programme of work that concerns a product or technology likely to be considered in a recommendation, including conducting trials or sys-tematic reviews that recommend a particular product or technology; receiving funding from, being or having recently been employed by, consulting for, or acting as an adviser, paid speaker or opinion leader for a company or organization with an interest in a specific product related to the guideline (e.g. receiving any support for travel, professional training or similar).
The conflicts of interest statements are initially reviewed by the relevant WHO department, and, if necessary, the WHO’s Legal Counsel. Legal Counsel may advise that (1) the conflict of interest is such that the individual must be excluded from participation; (2) the conflict of interest is significant but related to only some areas of the guideline development group’s work – in this case the participant cannot participate when the group considers these areas and will not have access to the relevant documents, therefore having only partial participation; or (3) the conflict of interest is considered insignificant and the individual can have full participation.
Guidance is available from the Guidelines Review Committee Secretariat throughout the guideline development process and the Guidelines Review Committee has also produced the WHO handbook for guideline development (6).
n Nutrition guidelines in WHO: priority setting for the Monitoring and Evaluation Subgroup (Presented by Juan Pablo Peña-Rosas)
The WHO nutrition guideline development process involves three advisory groups:
1. A steering committee for guidelines: this includes representatives from all WHO depart-ments with an interest in the provision of scientific advice in nutrition and provides overall supervision of the nutrition guidelines development process. A WHO Nutrition Guidance Steering Committee was established by the Department of Nutrition for Health and Devel-opment in 2009.
5
SUMMARY OF MEETING PRESENTATIONS
2. A guideline advisory group that includes experts from various WHO expert advisory pan-els and those identified through larger rosters, taking into consideration a balanced gen-der mix, multiple disciplinary areas of expertise and representation from all WHO regions. A guideline development group advises WHO on the scope of the guidelines and priority questions for which systematic reviews of evidence are then commissioned, the choice of important outcomes for decision-making, interpretation of the evidence with explicit con-sideration of the overall balance of risks and benefits, and drafting recommendations, tak-ing into account existing evidence as well as diverse values and preferences. The guideline development group for nutrition was established as the WHO Nutrition Guidance Expert Advisory Group (NUGAG) for the biennium 2010–2011. This includes several subgroups: (1) micronutrients, (2) diet and health, (3) nutrition in life course and undernutrition, and (4) monitoring and evaluation. These groups were established for this period to implement the biennial programme of work in these nutrition areas.
3. External experts and stakeholders are involved throughout the process. They are identified through public calls for comments through the WHO Micronutrients and United Nations Standing Committee of Nutrition (SCN) mailing lists, and through the WHO nutrition web site. The panel is consulted on the scope of the guideline, the questions to be addressed and the choice of important outcomes for decision-making, as well as for reviewing preliminary versions of the guidelines.
The Department of Nutrition for Health and Development establishes priorities for each bien-nium by consulting with other international agencies, academia and by direct requests from Member States via the World Health Assembly. Initial approval for updating guidelines on the assessment of vitamin A and iron status in populations was received from the Guidelines Review Committee in August 2010, after which an open call was issued for comments on the present work on vitamin A and iron indicators. Responses were received from 28 external experts and stakeholders, including representatives from ministries of health and government agencies, interests groups, civil society, nongovernmental organizations, the private sector and individual practitioners.
n Scoping of the guidelines on the assessment of vitamin A and iron status in populations (Presented by Lisa M. Rogers)
The aim of updating guidelines on the assessment of vitamin A and iron status in populations is to provide practical guidance and clear recommendations to Member States and their part-ners for decision-making on which indicators to use and when. The steps followed to develop the proposed scope of this work on indicators of vitamin A and iron status were:
1. defining the key purposes for which indicators are needed;2. defining the indicators to be considered in the update; 3. determining known relevant test features of each indicator;4. setting priorities;5. defining relevant population groups for each indicator and key purpose;6. finalizing the questions for evidence assessment.
The two key purposes that have been identified for which indicators of vitamin A and iron status are being used and recommendations are needed are:
1. assessment of status as part of the nutritional surveillance system: indicators are needed for determining the status of a population, in particular to define the extent and severity of
6
WHO REPORT: PRIORITIES IN THE ASSESSMENT OF VITAMIN A AND IRON STATUS IN POPULATIONS
deficiency/insufficiency/excess. These indicators are important for identifying the high-risk areas and/or populations where an intervention programme is needed, and to initiate the right type of programme. The assessment of a population’s status also includes interpreta-tion in terms of whether and to what degree the deficiency constitutes a “public health prob-lem” in a population (mild, moderate, severe);
2. monitoring and evaluation of public health intervention programmes (supplementation, point-of-use fortification and food fortification): biological indicators are used to evaluate the impact of interventions, in particular to assess improvement, if any, in nutritional status by measuring the indicators pre- and post-intervention. The indicators must capture both the desired effect and any adverse effects associated with an intervention.
The indicators included in the update are usually drawn from recommended indicators that are currently being widely used. Any new data available should also be reviewed, along with any “new” indicators with potential use at the population level.
Various test features are also considered when deciding whether or not an indicator should be used in a specific setting. When selecting indicators, consideration is given to: (1) accept-ability for the population and the field staff, including feasibility of conducting in the field, ease of data or sample collection, sample storage and transport requirements, transportability and durability of field equipment, availability of specialized personnel to obtain and analyse speci-mens, and the availability of equipment, spare parts and maintenance personnel; (2) costs/financial feasibility; and (3) performance of the test, including sensitivity, specificity and reli-ability, and the need for a reference standard. For all indicators, these test features are consid-ered as potentially important outcomes undergoing a thorough assessment of evidence. Any additional factors that contribute to the value of an indicator would be discussed and consid-ered when making recommendations on the indicators.
Population groups requiring separate recommendations and specific cut-off values for each indicator should be specified as early as possible, for example, those vulnerable to deficiency and in which the assessment of status is feasible and acceptable. Additional settings to consider include low- and high-resource settings, regions with a high prevalence of infection/inflamma-tion and areas with a high prevalence of human immunodeficiency virus (HIV).
The selection of questions (and the components of the questions) is a critical starting point for formulating recommendations, and driving the direction (inclusion and exclusion of data) and type of information that is searched for and assessed. To address the scope of the guide-line it is essential to first define the following criteria: the population (P) group; the specific characteristics of the population of interest; the intervention (I); the comparison (C) group; the critical outcomes (O); and timeframe (T) within which these outcomes are examined. The research questions for the proposed indicators can help decide whether an indicator should be recommended and can be applied to the questions on indicators for status assessment. How-ever, questions regarding the choice of prevalence cut-offs for defining a public health problem and the use of indicators for monitoring and evaluating interventions do not readily fit into this framework.
The most appropriate reference standard that would most validly define the true status of the population, and therefore the accuracy of an indicator, should be clearly established. For most micronutrients there are no generally accepted reference standards. In the absence of a clear gold standard or accepted indicator that reflects status in a specific and sensitive way, the degree to which the indicator measures what it is supposed to be measuring, namely micro-nutrient status, must be validated. Validation of indicators using dose response, repletion-depletion studies carried out under carefully controlled conditions over a long enough period to allow for adaptation can be considered. However, metabolic studies of this kind are rarely
7
conducted. Another option is to establish important principles underlying the relations between micronutrient status and health – so as to include the best available evidence on the effects of changes in micronutrient supply on the indicator status.
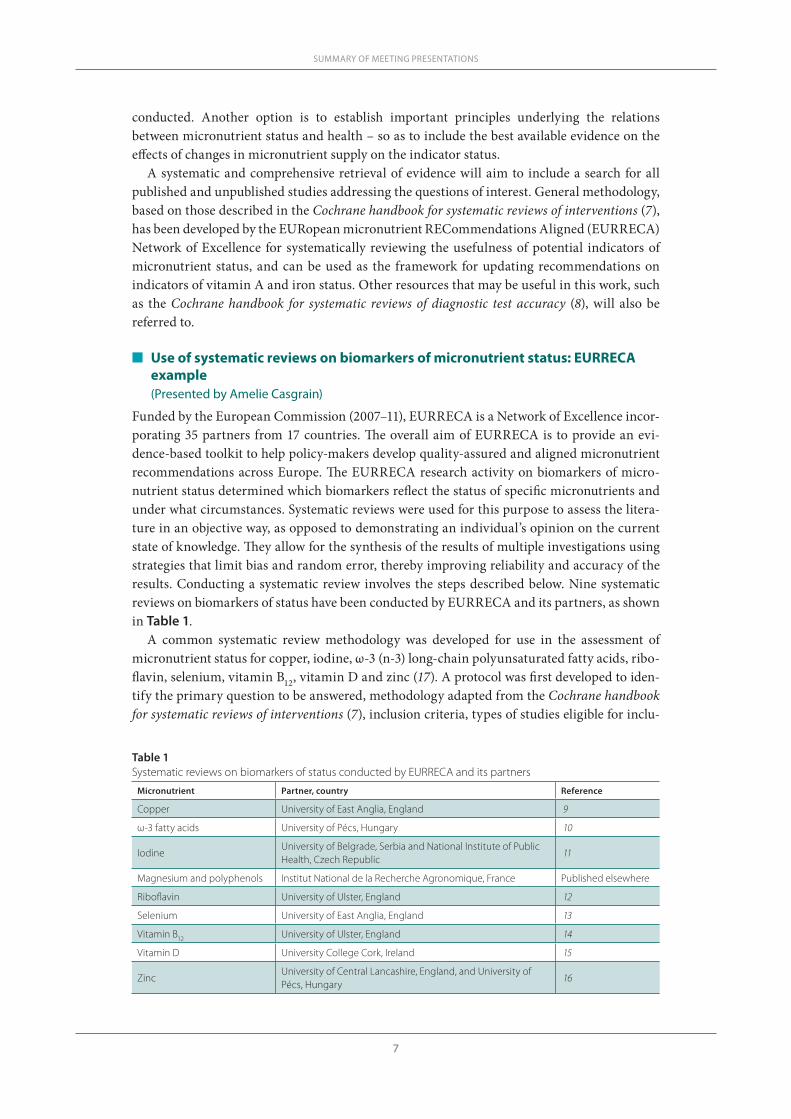
A systematic and comprehensive retrieval of evidence will aim to include a search for all published and unpublished studies addressing the questions of interest. General methodology, based on those described in the Cochrane handbook for systematic reviews of interventions (7), has been developed by the EURopean micronutrient RECommendations Aligned (EURRECA) Network of Excellence for systematically reviewing the usefulness of potential indicators of micronutrient status, and can be used as the framework for updating recommendations on indicators of vitamin A and iron status. Other resources that may be useful in this work, such as the Cochrane handbook for systematic reviews of diagnostic test accuracy (8), will also be referred to.
n Use of systematic reviews on biomarkers of micronutrient status: EURRECA example (Presented by Amelie Casgrain)
Funded by the European Commission (2007–11), EURRECA is a Network of Excellence incor-porating 35 partners from 17 countries. The overall aim of EURRECA is to provide an evi-dence-based toolkit to help policy-makers develop quality-assured and aligned micronutrient recommendations across Europe. The EURRECA research activity on biomarkers of micro-nutrient status determined which biomarkers reflect the status of specific micronutrients and under what circumstances. Systematic reviews were used for this purpose to assess the litera-ture in an objective way, as opposed to demonstrating an individual’s opinion on the current state of knowledge. They allow for the synthesis of the results of multiple investigations using strategies that limit bias and random error, thereby improving reliability and accuracy of the results. Conducting a systematic review involves the steps described below. Nine systematic reviews on biomarkers of status have been conducted by EURRECA and its partners, as shown in Table 1.
A common systematic review methodology was developed for use in the assessment of micronutrient status for copper, iodine, ω-3 (n-3) long-chain polyunsaturated fatty acids, ribo-flavin, selenium, vitamin B12, vitamin D and zinc (17). A protocol was first developed to iden-tify the primary question to be answered, methodology adapted from the Cochrane handbook for systematic reviews of interventions (7), inclusion criteria, types of studies eligible for inclu-
SUMMARY OF MEETING PRESENTATIONS
Table 1Systematic reviews on biomarkers of status conducted by EURRECA and its partners
Micronutrient Partner, country Reference
Copper University of East Anglia, England 9
ω-3 fatty acids University of Pécs, Hungary 10
IodineUniversity of Belgrade, Serbia and National Institute of Public Health, Czech Republic
11
Magnesium and polyphenols Institut National de la Recherche Agronomique, France Published elsewhere
Riboflavin University of Ulster, England 12
Selenium University of East Anglia, England 13
Vitamin B12 University of Ulster, England 14
Vitamin D University College Cork, Ireland 15
ZincUniversity of Central Lancashire, England, and University of Pécs, Hungary
16
8
WHO REPORT: PRIORITIES IN THE ASSESSMENT OF VITAMIN A AND IRON STATUS IN POPULATIONS
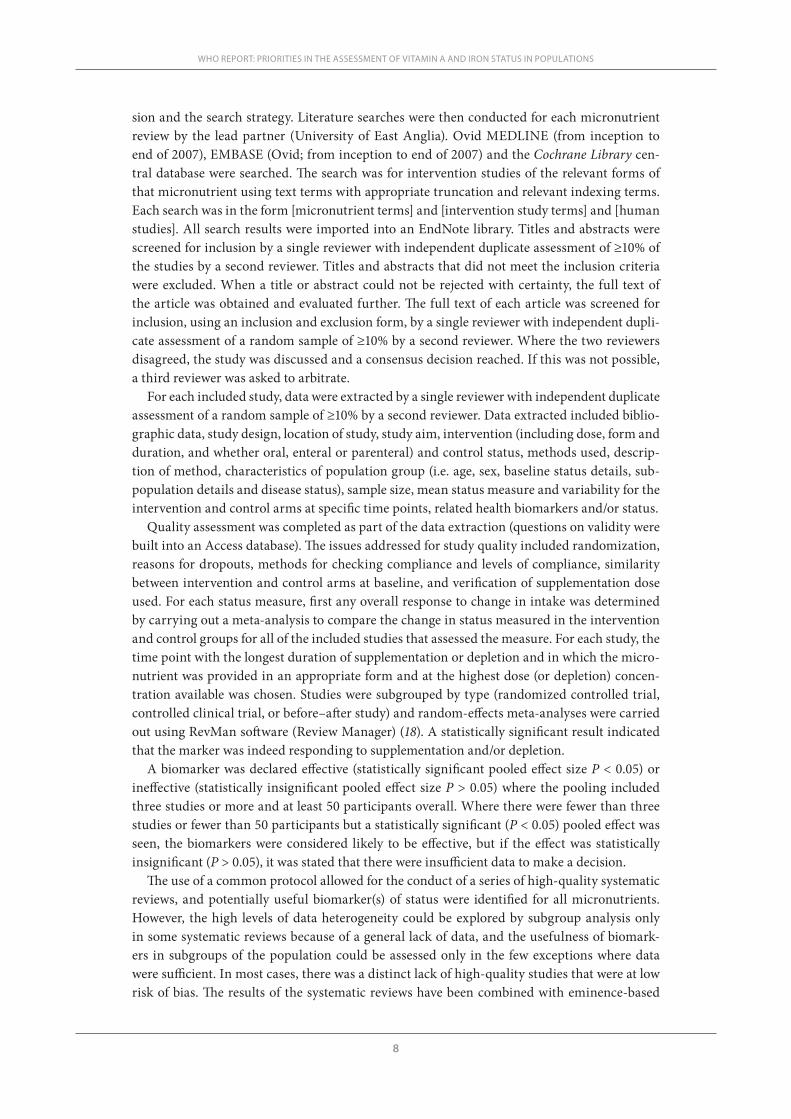
sion and the search strategy. Literature searches were then conducted for each micronutrient review by the lead partner (University of East Anglia). Ovid MEDLINE (from inception to end of 2007), EMBASE (Ovid; from inception to end of 2007) and the Cochrane Library cen-tral database were searched. The search was for intervention studies of the relevant forms of that micronutrient using text terms with appropriate truncation and relevant indexing terms. Each search was in the form [micronutrient terms] and [intervention study terms] and [human studies]. All search results were imported into an EndNote library. Titles and abstracts were screened for inclusion by a single reviewer with independent duplicate assessment of ≥10% of the studies by a second reviewer. Titles and abstracts that did not meet the inclusion criteria were excluded. When a title or abstract could not be rejected with certainty, the full text of the article was obtained and evaluated further. The full text of each article was screened for inclusion, using an inclusion and exclusion form, by a single reviewer with independent dupli-cate assessment of a random sample of ≥10% by a second reviewer. Where the two reviewers disagreed, the study was discussed and a consensus decision reached. If this was not possible, a third reviewer was asked to arbitrate.
For each included study, data were extracted by a single reviewer with independent duplicate assessment of a random sample of ≥10% by a second reviewer. Data extracted included biblio-graphic data, study design, location of study, study aim, intervention (including dose, form and duration, and whether oral, enteral or parenteral) and control status, methods used, descrip-tion of method, characteristics of population group (i.e. age, sex, baseline status details, sub-population details and disease status), sample size, mean status measure and variability for the intervention and control arms at specific time points, related health biomarkers and/or status.
Quality assessment was completed as part of the data extraction (questions on validity were built into an Access database). The issues addressed for study quality included randomization, reasons for dropouts, methods for checking compliance and levels of compliance, similarity between intervention and control arms at baseline, and verification of supplementation dose used. For each status measure, first any overall response to change in intake was determined by carrying out a meta-analysis to compare the change in status measured in the intervention and control groups for all of the included studies that assessed the measure. For each study, the time point with the longest duration of supplementation or depletion and in which the micro-nutrient was provided in an appropriate form and at the highest dose (or depletion) concen-tration available was chosen. Studies were subgrouped by type (randomized controlled trial, controlled clinical trial, or before–after study) and random-effects meta-analyses were carried out using RevMan software (Review Manager) (18). A statistically significant result indicated that the marker was indeed responding to supplementation and/or depletion.
A biomarker was declared effective (statistically significant pooled effect size P < 0.05) or ineffective (statistically insignificant pooled effect size P > 0.05) where the pooling included three studies or more and at least 50 participants overall. Where there were fewer than three studies or fewer than 50 participants but a statistically significant (P < 0.05) pooled effect was seen, the biomarkers were considered likely to be effective, but if the effect was statistically insignificant (P > 0.05), it was stated that there were insufficient data to make a decision.
The use of a common protocol allowed for the conduct of a series of high-quality systematic reviews, and potentially useful biomarker(s) of status were identified for all micronutrients. However, the high levels of data heterogeneity could be explored by subgroup analysis only in some systematic reviews because of a general lack of data, and the usefulness of biomark-ers in subgroups of the population could be assessed only in the few exceptions where data were sufficient. In most cases, there was a distinct lack of high-quality studies that were at low risk of bias. The results of the systematic reviews have been combined with eminence-based
9
reviews into best practice guidelines for biomarkers of status, which are descriptive guidelines on the use of biomarkers of status and exposure and are designed for a non-expert audience (i.e. industry).
n Overview of current WHO guidelines on assessing the iron status of populations and 2004 analysis of data from iron intervention studies (Presented by Zuguo Mei)
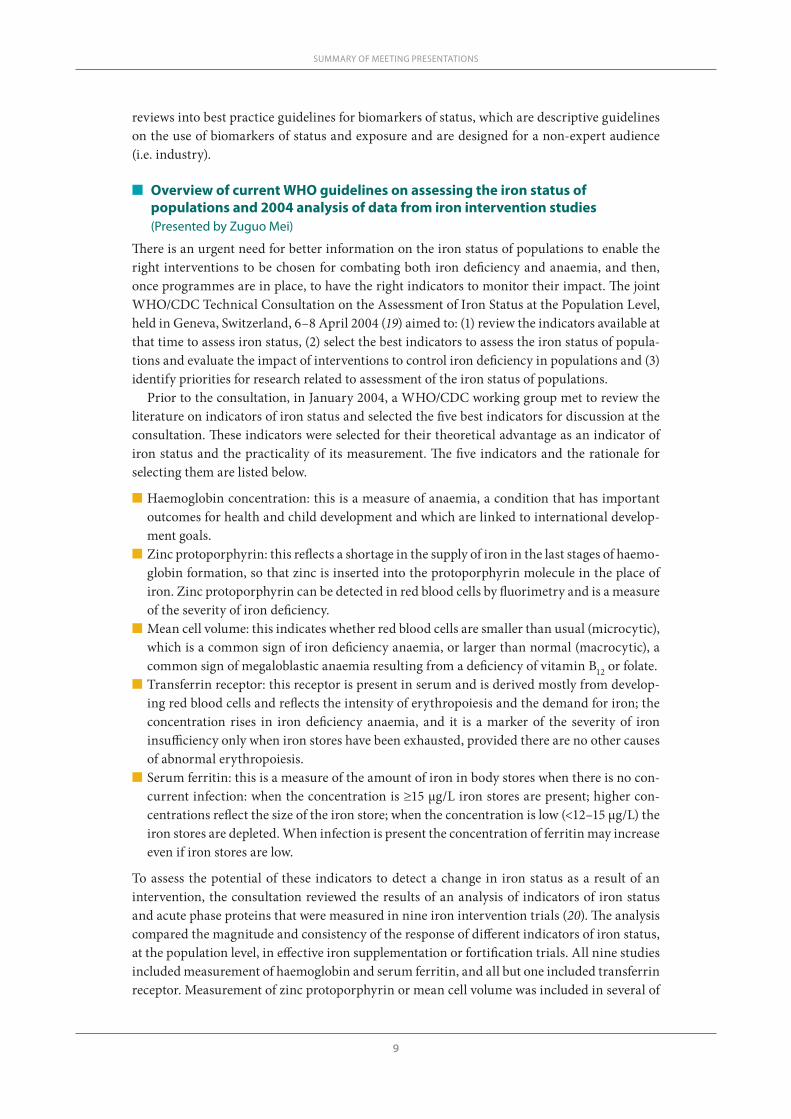
There is an urgent need for better information on the iron status of populations to enable the right interventions to be chosen for combating both iron deficiency and anaemia, and then, once programmes are in place, to have the right indicators to monitor their impact. The joint WHO/CDC Technical Consultation on the Assessment of Iron Status at the Population Level, held in Geneva, Switzerland, 6–8 April 2004 (19) aimed to: (1) review the indicators available at that time to assess iron status, (2) select the best indicators to assess the iron status of popula-tions and evaluate the impact of interventions to control iron deficiency in populations and (3) identify priorities for research related to assessment of the iron status of populations.
Prior to the consultation, in January 2004, a WHO/CDC working group met to review the literature on indicators of iron status and selected the five best indicators for discussion at the consultation. These indicators were selected for their theoretical advantage as an indicator of iron status and the practicality of its measurement. The five indicators and the rationale for selecting them are listed below.
n Haemoglobin concentration: this is a measure of anaemia, a condition that has important outcomes for health and child development and which are linked to international develop-ment goals.
n Zinc protoporphyrin: this reflects a shortage in the supply of iron in the last stages of haemo-globin formation, so that zinc is inserted into the protoporphyrin molecule in the place of iron. Zinc protoporphyrin can be detected in red blood cells by fluorimetry and is a measure of the severity of iron deficiency.
n Mean cell volume: this indicates whether red blood cells are smaller than usual (microcytic), which is a common sign of iron deficiency anaemia, or larger than normal (macrocytic), a common sign of megaloblastic anaemia resulting from a deficiency of vitamin B12 or folate.
n Transferrin receptor: this receptor is present in serum and is derived mostly from develop-ing red blood cells and reflects the intensity of erythropoiesis and the demand for iron; the concentration rises in iron deficiency anaemia, and it is a marker of the severity of iron insufficiency only when iron stores have been exhausted, provided there are no other causes of abnormal erythropoiesis.
n Serum ferritin: this is a measure of the amount of iron in body stores when there is no con-current infection: when the concentration is ≥15 µg/L iron stores are present; higher con-centrations reflect the size of the iron store; when the concentration is low (<12–15 μg/L) the iron stores are depleted. When infection is present the concentration of ferritin may increase even if iron stores are low.
To assess the potential of these indicators to detect a change in iron status as a result of an intervention, the consultation reviewed the results of an analysis of indicators of iron status and acute phase proteins that were measured in nine iron intervention trials (20). The analysis compared the magnitude and consistency of the response of different indicators of iron status, at the population level, in effective iron supplementation or fortification trials. All nine studies included measurement of haemoglobin and serum ferritin, and all but one included transferrin receptor. Measurement of zinc protoporphyrin or mean cell volume was included in several of
SUMMARY OF MEETING PRESENTATIONS
10
WHO REPORT: PRIORITIES IN THE ASSESSMENT OF VITAMIN A AND IRON STATUS IN POPULATIONS
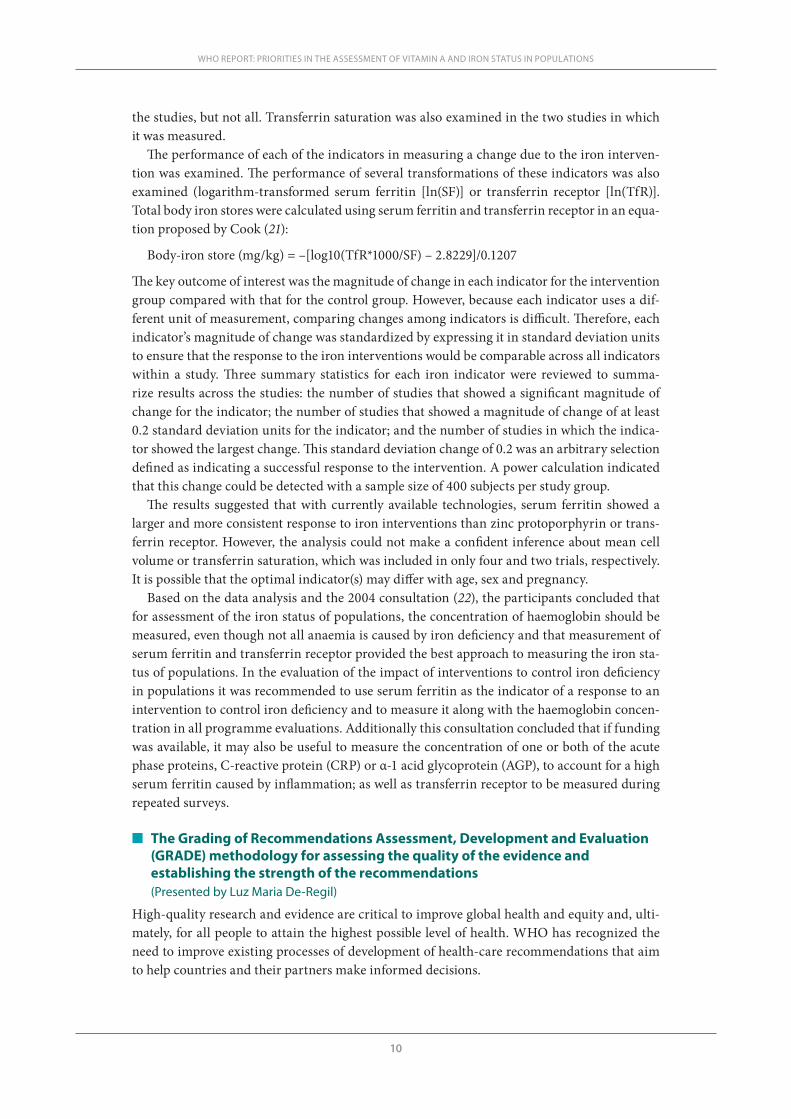
the studies, but not all. Transferrin saturation was also examined in the two studies in which it was measured.
The performance of each of the indicators in measuring a change due to the iron interven-tion was examined. The performance of several transformations of these indicators was also examined (logarithm-transformed serum ferritin [ln(SF)] or transferrin receptor [ln(TfR)]. Total body iron stores were calculated using serum ferritin and transferrin receptor in an equa-tion proposed by Cook (21):
Body-iron store (mg/kg) = –[log10(TfR*1000/SF) – 2.8229]/0.1207
The key outcome of interest was the magnitude of change in each indicator for the intervention group compared with that for the control group. However, because each indicator uses a dif-ferent unit of measurement, comparing changes among indicators is difficult. Therefore, each indicator’s magnitude of change was standardized by expressing it in standard deviation units to ensure that the response to the iron interventions would be comparable across all indicators within a study. Three summary statistics for each iron indicator were reviewed to summa-rize results across the studies: the number of studies that showed a significant magnitude of change for the indicator; the number of studies that showed a magnitude of change of at least 0.2 standard deviation units for the indicator; and the number of studies in which the indica-tor showed the largest change. This standard deviation change of 0.2 was an arbitrary selection defined as indicating a successful response to the intervention. A power calculation indicated that this change could be detected with a sample size of 400 subjects per study group.
The results suggested that with currently available technologies, serum ferritin showed a larger and more consistent response to iron interventions than zinc protoporphyrin or trans-ferrin receptor. However, the analysis could not make a confident inference about mean cell volume or transferrin saturation, which was included in only four and two trials, respectively. It is possible that the optimal indicator(s) may differ with age, sex and pregnancy.
Based on the data analysis and the 2004 consultation (22), the participants concluded that for assessment of the iron status of populations, the concentration of haemoglobin should be measured, even though not all anaemia is caused by iron deficiency and that measurement of serum ferritin and transferrin receptor provided the best approach to measuring the iron sta-tus of populations. In the evaluation of the impact of interventions to control iron deficiency in populations it was recommended to use serum ferritin as the indicator of a response to an intervention to control iron deficiency and to measure it along with the haemoglobin concen-tration in all programme evaluations. Additionally this consultation concluded that if funding was available, it may also be useful to measure the concentration of one or both of the acute phase proteins, C-reactive protein (CRP) or α-1 acid glycoprotein (AGP), to account for a high serum ferritin caused by inflammation; as well as transferrin receptor to be measured during repeated surveys.
n The Grading of Recommendations Assessment, Development and Evaluation (GRADE) methodology for assessing the quality of the evidence and establishing the strength of the recommendations (Presented by Luz Maria De-Regil)
High-quality research and evidence are critical to improve global health and equity and, ulti-mately, for all people to attain the highest possible level of health. WHO has recognized the need to improve existing processes of development of health-care recommendations that aim to help countries and their partners make informed decisions.
11
Sources of evidence range from small laboratory studies or case reports to well-designed, large randomized clinical studies that have minimized bias to a great extent, and observational studies and programme evaluations. A systematic and transparent approach to making judge-ments about quality of evidence and the strength of the recommendations can help prevent errors, resolve disagreements, facilitate critical appraisal and communicate appropriate infor-mation.
Various systems have been used to grade the quality of evidence and the strength of the recommendations. Some of them are too simplistic and are based on study design alone. Oth-er systems are too complex with unclear lines between study design, quality of evidence and strength of recommendations. The Grading of Recommendations Assessment, Development and Evaluation (GRADE) working group began as an informal collaboration in the year 2000, with the aim of developing a sensible approach to grading quality of evidence and the strength of a recommendation that could be widely adopted (23). More than 25 organizations, including WHO, have now adopted the GRADE approach.
The GRADE system builds on existing, up-to-date systematic reviews and considers five fac-tors in the assessment of the quality of evidence for each outcome: (1) study limitations (risk of bias) in the selection of participants or the conduct of the study; (2) consistency (similarity of estimates of effects across studies); (3) directness of evidence (the extent of similarity to those of interest); (4) precision; and (5) publication and reporting bias. Randomized controlled trials are considered to be of higher quality than observational studies (e.g. cohort or case–control designs) based on their lower potential of risk of bias but the confidence in the evidence based on a randomized trial may diminish after assessing the above mentioned criteria. Conversely, confidence in the evidence from observation studies may increase when there is a clear dose-response relation or effect of the intervention (24).
The GRADE system combines all the above information into a single assessment and classi-fies the overall quality of evidence for each outcome in one of four levels (24):
1. high: further research is very unlikely to change our confidence in the estimate of the effect;2. moderate: further research is likely to have an important impact on our confidence in the
estimate of the effect and may change the estimate;3. low: further research is very likely to have an important impact on our confidence in the
estimate of the effect and is likely to change the estimate;4. very low: any estimate of the effect is very uncertain.
In addition to the quality of evidence, several other factors need to be considered when devel-oping recommendations, including the balance between desirable and undesirable effects (health benefits, burden, cost), values and preferences, and costs (resource allocation). Recom-mendations to use or not to use an indicator for assessing nutritional status should be based on the trade-offs between benefits and risks, feasibility of use in the field, and associated costs.
The GRADE system offers two grades of recommendations: “strong” and “weak or condi-tional”. A strong recommendation is one for which there is confidence that the desirable effects of adherence outweigh the undesirable effects. The recommendation can be either in favour of or against an intervention. Implications of a strong recommendation for patients are that most people in their situation would desire the recommended course of action and only a small proportion would not. For clinicians the implications are that most patients should receive the recommended course of action and that adherence to this recommendation is a reason-able measure of good-quality care. With regard to policy-makers, a strong recommendation means that it can be adapted as a policy in most situations. For quality monitors, adherence to a strong recommendation according to the guideline could be used as a quality criterion or
SUMMARY OF MEETING PRESENTATIONS
12
WHO REPORT: PRIORITIES IN THE ASSESSMENT OF VITAMIN A AND IRON STATUS IN POPULATIONS
performance indicator. Finally, for funding agencies, a strong recommendation implies that the intervention likely represents an appropriate allocation of resources (i.e. the net benefits may be large relative to an alternative allocation of resources).
When the trade-offs are less certain – either because of low-quality evidence or because evidence suggests that desirable and undesirable effects are closely balanced – weak (or con-ditional) recommendations are generally made. Implications of a weak recommendation for patients are that the majority of people in their situation would want the recommended course of action, but many would not. For clinicians the implications are that they need to be pre-pared to help patients make a decision that is consistent with their own values. With regard to policy-makers, a weak recommendation means that there is a need for substantial debate and involvement of stakeholders.
n Historical and practical uses of assessing night blindness as an indicator for vitamin A status(Presented by Douglas Taren)
The assessment of vitamin A status is critical for the planning, implementation, monitoring and evaluation of vitamin A deficiency prevention and treatment programmes. Determina-tion of night blindness is one of the traditional methods of assessing vitamin A deficiency. A variety of subjective and objective methods have been used, however, reported night blindness, the most common method to assess poor dark adaptation, does not correlate strongly with biochemical indicators of vitamin A deficiency. Recently, more standardized field-based meth-ods that utilize a standard stimulus to the eye have been developed, specifically the pupillary response test and the night vision threshold test. These low-cost, non-invasive methods have the potential to provide rapid assessment to determine whether the prevalence of vitamin A deficiency within a population is of public health significance or changes with an intervention.
For more information, see Background paper A2.1 (Historical and practical uses of assessing night blindness as an indicator for vitamin A deficiency by Dr Douglas Taren).
n Biomarkers of vitamin A status: what do they mean? (Presented by Sherry A. Tanumihardjo)
Vitamin A is essential for growth, reproduction and immunity. Biomarkers of vitamin A status are diverse, in part, due to its functions. Liver reserves of vitamin A are considered the gold standard but this measure is not feasible for population evaluation. Biomarkers of status can be grouped into two categories: (1) biological, functional and histological indicators; and (2) biochemical indicators. Historically, signs of xerophthalmia were used to determine vitamin A deficiency. Before overt clinical damage to the eye, individuals with vitamin A deficiency are plagued by night blindness and longer vision restoration times. Surrogate biochemical meas-ures of vitamin A status, as defined by liver reserves, have been developed. Serum retinol con-centration is a common method used to evaluate vitamin A deficiency, but it is homeostatically controlled until liver reserves become dangerously low. Therefore, other biochemical meth-ods that respond to liver reserves in the marginal category have been developed, such as dose response tests and isotope dilution assays. Dose response tests work on the principle that as liver reserves become depleted, apo-retinol-binding protein builds up in the liver. A challenge dose of vitamin A binds to this protein and serum concentrations increase within a few hours if liver vitamin A is low. Isotope dilution assays use stable isotopes to trace total body reserves of vitamin A. Different biomarkers have utility across a range of liver values.
For more information, see Background paper A2.2 (Biomarkers of vitamin A status: what do they mean? by Dr Sherry A. Tanumihardjo).
13
n The rationale for selecting and standardizing iron status indicators(Presented by Sean Lynch)
Both iron deficiency and iron excess have significant health consequences. A diet insufficient in bioavailable iron and blood loss are the major causes of iron deficiency worldwide. An improved intake of bioavailable iron can prevent the long-term consequences of nutritional iron deficiency. Iron indicators are needed to identify population groups at risk for nutritional iron deficiency and to monitor the impact of intervention strategies. Currently available iron indicators permit a specific diagnosis of iron deficiency and iron deficiency anaemia in the clinical setting where other patient-related information is available, but are more difficult to interpret in populations in developing countries because anaemia is multifactorial. Progress towards reducing the prevalence of nutritional anaemia worldwide will depend on improved selection and standardization of iron indicators in these settings. The predictive value of these indicators for significant functional outcomes may provide the basis for selection and stand-ardization.
For more information, see Background paper A2.3 (The rationale for selecting and standardizing iron status indicators by Dr Sean Lynch).
n The effect of subclinical infection on serum ferritin and serum retinol: two meta-analyses(Presented by George P. McCabe)
Many plasma nutrients are influenced by infection or tissue damage. These effects may be pas-sive and the result of changes in blood volume and capillary permeability. They may also be the direct effect of metabolic alterations that depress or increase the concentration of a nutrient or metabolite in the plasma. Where the nutrient or metabolite is a nutritional biomarker as in the case of plasma retinol, a depression in retinol concentrations can result in an overestimate of vitamin A deficiency. In contrast, where the biomarker is increased due to infection as in the case of plasma ferritin concentrations, inflammation can result in an underestimate of iron deficiency. Infection and tissue damage can be recognized by their clinical effects on the body but, unfortunately, subclinical infection or inflammation can only be recognized by measur-ing inflammation biomarkers in the blood. It is therefore important to measure biomarkers of inflammation as well as of nutrition in prevalence surveys of nutritional status in apparently healthy people. The most commonly used biomarkers of inflammation are the cytokines and acute phase proteins. Cytokines have very short half-lives but the acute phase proteins remain longer in the blood, and their lifespans can be matched with the changes in plasma retinol and ferritin concentrations. Using meta-analyses to determine the mean effect of inflammation on retinol and ferritin in different stages of the infection cycle, it was possible to determine cor-rection factors that are proposed by the authors to be used either to modify raw data to remove the effects of inflammation or to modify cut-off values of nutritional risk to use when inflam-mation is detected in a blood sample.
For more information, see Background paper A2.4 (Influence of infection and inflammation on biomarkers of nutritional status with an emphasis on vitamin A and iron by Dr David I. Thurn-ham and Dr George P. McCabe).
SUMMARY OF MEETING PRESENTATIONS
14
WHO REPORT: PRIORITIES IN THE ASSESSMENT OF VITAMIN A AND IRON STATUS IN POPULATIONS
n Overview of current WHO guidelines on indicators for assessing vitamin A deficiency and their application in monitoring and evaluating intervention programmes(Presented by Lisa M. Rogers)
Current WHO guidelines on the use of vitamin A indicators can be found in Indicators for assessing vitamin A deficiency and their application in monitoring and evaluating interven-tion programmes (25), which was published in 1996 following a technical consultation held in Geneva, Switzerland, on 9–11 November 1992. The objectives of the 1992 consultation were: to identify indicators and establish cut-off points for assessing subclinical vitamin A deficiency in populations; to determine which indicator, or combinations of indicators, may be useful in populations with vitamin A deficiency at levels that pose an important public health problem; to discuss, according to age and/or sex, which groups are most appropriate for assessment using different indicators; and to consider the characteristics of the indicators and their usefulness, given different surveillance objectives (25). Clinical indicators of vitamin A deficiency were included but were not reviewed in detail as part of this consultation. These were last reviewed in 1982 (26).
In 1992, indicators of subclinical vitamin A status were evaluated based on their feasibil-ity, in terms of cultural acceptability, ability to be obtained under field conditions, cost, and sensitivity and specificity for reliably assessing the magnitude and severity of the problem (25). It was noted that cut-off points and prevalence values for the identification of deficient popula-tions were needed to establish when a public health problem exists and at what level of concern (mild, moderate, severe). The selection of the optimal population group for assessing vitamin A status depends on factors such as vulnerability to vitamin A deficiency, representativeness of those in the same age/sex group in the community and of those in other vulnerable groups in the community, and accessibility. Therefore surveillance in neonates and infants <6 months of age was not considered useful in settings where breastfeeding predominates for at least 4–6 months, since vitamin A stores are minimal and blood levels are low at birth and then rise in breastfed infants of well-nourished mothers. Infants 6–71 months of age were considered to be the most useful for surveillance as they are highly vulnerable to vitamin A deficiency; how-ever, accessibility may be a problem. School-age children (6 years of age or older) were gener-ally considered more accessible (in schools) but less vulnerable to severe deficiency. Pregnant women were also considered to be accessible (in clinics) but pregnancy increases a woman’s vulnerability only slightly as the additional daily needs of the fetus are small. It was suggested that surveillance in pregnant women could best be achieved through taking a history of night blindness or using one the of the dose response tests: relative dose response (RDR) or modi-fied dose response (MRDR) since serum retinol may be misleading due to haemodilution in the later stages of pregnancy. Lactating women were also considered vulnerable to vitamin A deficiency as their needs increase due to daily losses of vitamin A in breast milk. It was recom-mended that their status be measured within 4–6 weeks (or at most 8 weeks) after delivery and at their postpartum visit or their infant’s BCG/oral polio vaccination contact.
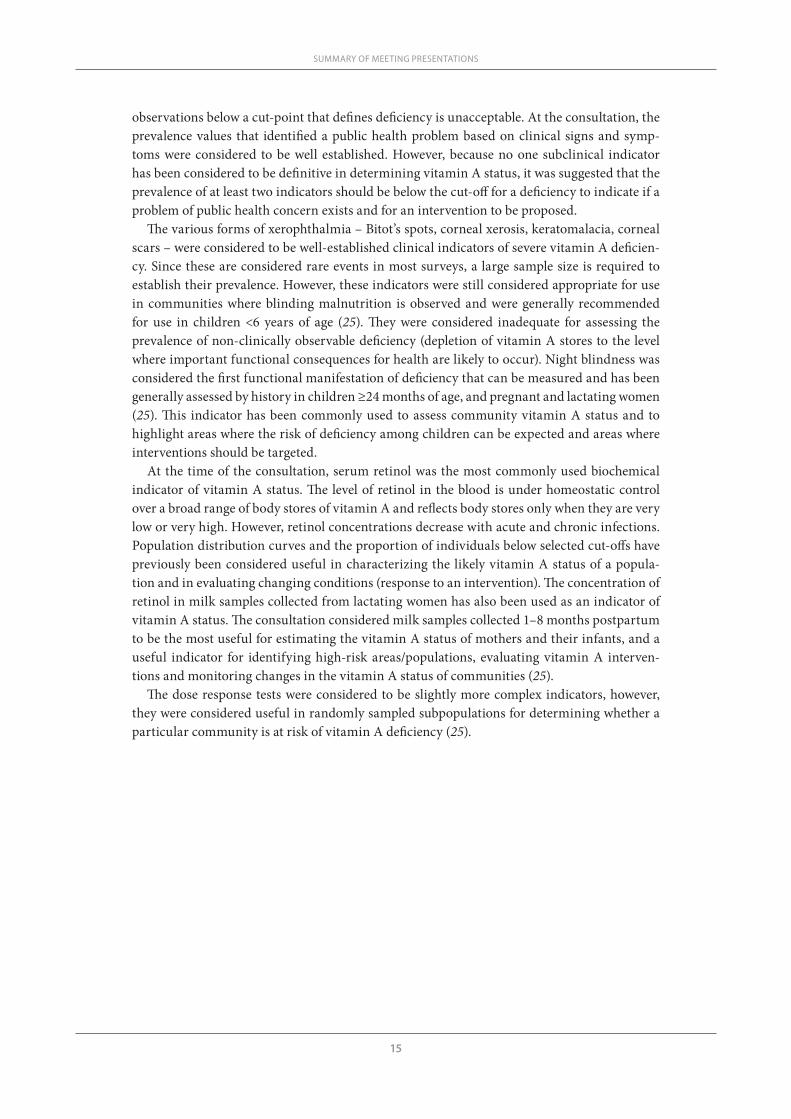
The choice of indicators for measuring the impact of an intervention on vitamin A status (outcome indicators) and the interpretation of results were also discussed at the 1992 consulta-tion. The proportion of individuals with values below one or several cut-off points is commonly used to express the magnitude of the problem at different levels of risk. For example, the distri-bution of serum retinol below 0.35 µmol/L has previously been used to indicate more extreme cases of deficiency, while higher cut-off points (e.g. 1.05 µmol/L) have been used to identify populations possibly at risk of inadequate vitamin A status, even if not severely deficient (25). Vitamin A deficiency of public health concern is considered to exist when the prevalence of
15
observations below a cut-point that defines deficiency is unacceptable. At the consultation, the prevalence values that identified a public health problem based on clinical signs and symp-toms were considered to be well established. However, because no one subclinical indicator has been considered to be definitive in determining vitamin A status, it was suggested that the prevalence of at least two indicators should be below the cut-off for a deficiency to indicate if a problem of public health concern exists and for an intervention to be proposed.
The various forms of xerophthalmia – Bitot’s spots, corneal xerosis, keratomalacia, corneal scars – were considered to be well-established clinical indicators of severe vitamin A deficien-cy. Since these are considered rare events in most surveys, a large sample size is required to establish their prevalence. However, these indicators were still considered appropriate for use in communities where blinding malnutrition is observed and were generally recommended for use in children <6 years of age (25). They were considered inadequate for assessing the prevalence of non-clinically observable deficiency (depletion of vitamin A stores to the level where important functional consequences for health are likely to occur). Night blindness was considered the first functional manifestation of deficiency that can be measured and has been generally assessed by history in children ≥24 months of age, and pregnant and lactating women (25). This indicator has been commonly used to assess community vitamin A status and to highlight areas where the risk of deficiency among children can be expected and areas where interventions should be targeted.
At the time of the consultation, serum retinol was the most commonly used biochemical indicator of vitamin A status. The level of retinol in the blood is under homeostatic control over a broad range of body stores of vitamin A and reflects body stores only when they are very low or very high. However, retinol concentrations decrease with acute and chronic infections. Population distribution curves and the proportion of individuals below selected cut-offs have previously been considered useful in characterizing the likely vitamin A status of a popula-tion and in evaluating changing conditions (response to an intervention). The concentration of retinol in milk samples collected from lactating women has also been used as an indicator of vitamin A status. The consultation considered milk samples collected 1–8 months postpartum to be the most useful for estimating the vitamin A status of mothers and their infants, and a useful indicator for identifying high-risk areas/populations, evaluating vitamin A interven-tions and monitoring changes in the vitamin A status of communities (25).
The dose response tests were considered to be slightly more complex indicators, however, they were considered useful in randomly sampled subpopulations for determining whether a particular community is at risk of vitamin A deficiency (25).
SUMMARY OF MEETING PRESENTATIONS
16
WHO TECHNICAL CONSULTATION ON VITAMIN A IN NEWBORN HEALTH: MECHANISTIC STUDIES
grouP disCussion: reView of Priority questions on indiCAtors of VitAmin A And iron stAtus
Vitamin A indicators
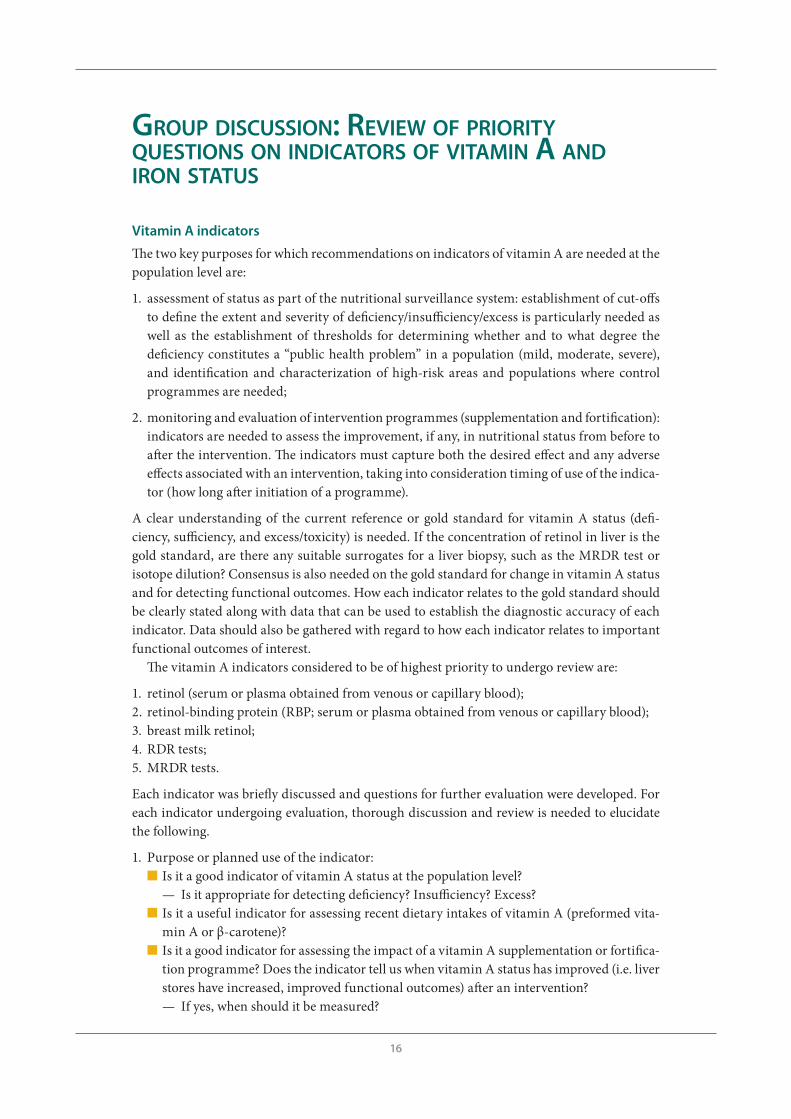
The two key purposes for which recommendations on indicators of vitamin A are needed at the population level are:
1. assessment of status as part of the nutritional surveillance system: establishment of cut-offs to define the extent and severity of deficiency/insufficiency/excess is particularly needed as well as the establishment of thresholds for determining whether and to what degree the deficiency constitutes a “public health problem” in a population (mild, moderate, severe), and identification and characterization of high-risk areas and populations where control programmes are needed;
2. monitoring and evaluation of intervention programmes (supplementation and fortification): indicators are needed to assess the improvement, if any, in nutritional status from before to after the intervention. The indicators must capture both the desired effect and any adverse effects associated with an intervention, taking into consideration timing of use of the indica-tor (how long after initiation of a programme).
A clear understanding of the current reference or gold standard for vitamin A status (defi-ciency, sufficiency, and excess/toxicity) is needed. If the concentration of retinol in liver is the gold standard, are there any suitable surrogates for a liver biopsy, such as the MRDR test or isotope dilution? Consensus is also needed on the gold standard for change in vitamin A status and for detecting functional outcomes. How each indicator relates to the gold standard should be clearly stated along with data that can be used to establish the diagnostic accuracy of each indicator. Data should also be gathered with regard to how each indicator relates to important functional outcomes of interest.
The vitamin A indicators considered to be of highest priority to undergo review are:
1. retinol (serum or plasma obtained from venous or capillary blood); 2. retinol-binding protein (RBP; serum or plasma obtained from venous or capillary blood);3. breast milk retinol;4. RDR tests;5. MRDR tests.
Each indicator was briefly discussed and questions for further evaluation were developed. For each indicator undergoing evaluation, thorough discussion and review is needed to elucidate the following.
1. Purpose or planned use of the indicator:n Is it a good indicator of vitamin A status at the population level?
— Is it appropriate for detecting deficiency? Insufficiency? Excess?n Is it a useful indicator for assessing recent dietary intakes of vitamin A (preformed vita-
min A or β-carotene)? n Is it a good indicator for assessing the impact of a vitamin A supplementation or fortifica-
tion programme? Does the indicator tell us when vitamin A status has improved (i.e. liver stores have increased, improved functional outcomes) after an intervention?— If yes, when should it be measured?
17
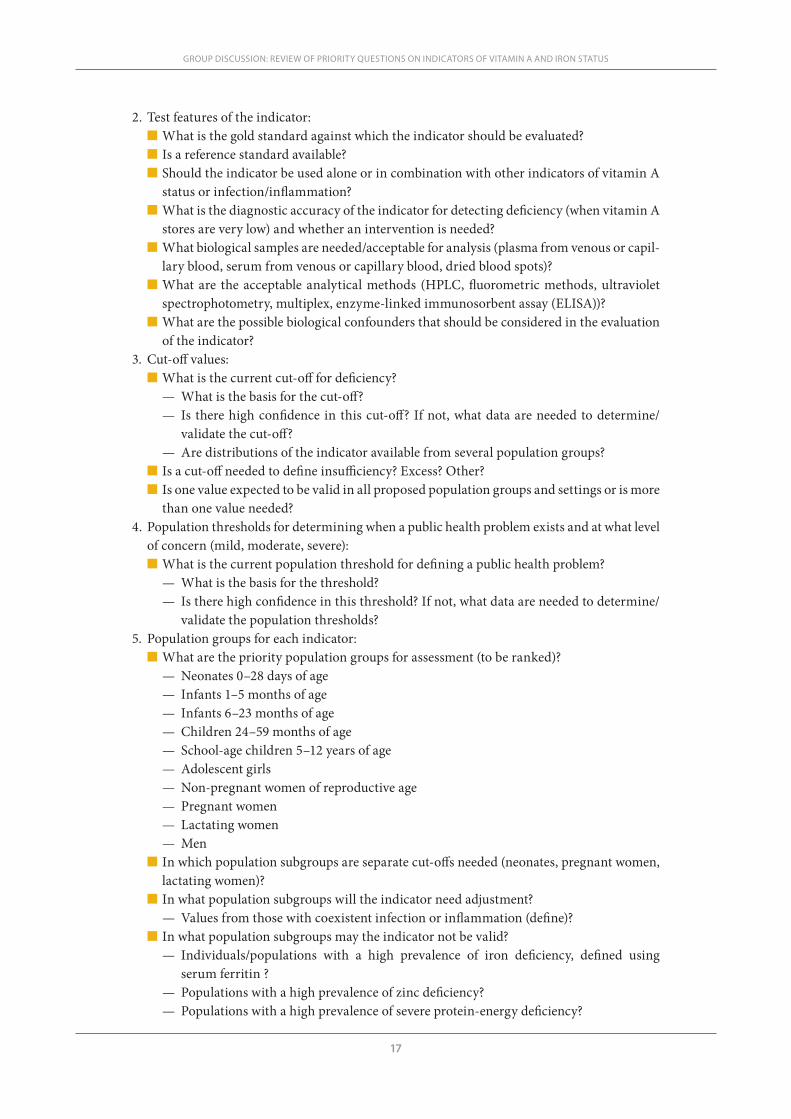
2. Test features of the indicator:n What is the gold standard against which the indicator should be evaluated?n Is a reference standard available?n Should the indicator be used alone or in combination with other indicators of vitamin A
status or infection/inflammation?n What is the diagnostic accuracy of the indicator for detecting deficiency (when vitamin A
stores are very low) and whether an intervention is needed?n What biological samples are needed/acceptable for analysis (plasma from venous or capil-
lary blood, serum from venous or capillary blood, dried blood spots)?n What are the acceptable analytical methods (HPLC, fluorometric methods, ultraviolet
spectrophotometry, multiplex, enzyme-linked immunosorbent assay (ELISA))?n What are the possible biological confounders that should be considered in the evaluation
of the indicator?3. Cut-off values:
n What is the current cut-off for deficiency?— What is the basis for the cut-off?— Is there high confidence in this cut-off? If not, what data are needed to determine/
validate the cut-off?— Are distributions of the indicator available from several population groups?
n Is a cut-off needed to define insufficiency? Excess? Other?n Is one value expected to be valid in all proposed population groups and settings or is more
than one value needed?4. Population thresholds for determining when a public health problem exists and at what level
of concern (mild, moderate, severe):n What is the current population threshold for defining a public health problem?
— What is the basis for the threshold?— Is there high confidence in this threshold? If not, what data are needed to determine/
validate the population thresholds?5. Population groups for each indicator:
n What are the priority population groups for assessment (to be ranked)?— Neonates 0–28 days of age — Infants 1–5 months of age— Infants 6–23 months of age— Children 24–59 months of age— School-age children 5–12 years of age — Adolescent girls— Non-pregnant women of reproductive age— Pregnant women— Lactating women— Men
n In which population subgroups are separate cut-offs needed (neonates, pregnant women, lactating women)?
n In what population subgroups will the indicator need adjustment? — Values from those with coexistent infection or inflammation (define)?
n In what population subgroups may the indicator not be valid?— Individuals/populations with a high prevalence of iron deficiency, defined using
serum ferritin ?— Populations with a high prevalence of zinc deficiency?— Populations with a high prevalence of severe protein-energy deficiency?
GROUP DISCUSSION: REVIEW OF PRIORITY QUESTIONS ON INDICATORS OF VITAMIN A AND IRON STATUS
18
WHO REPORT: PRIORITIES IN THE ASSESSMENT OF VITAMIN A AND IRON STATUS IN POPULATIONS
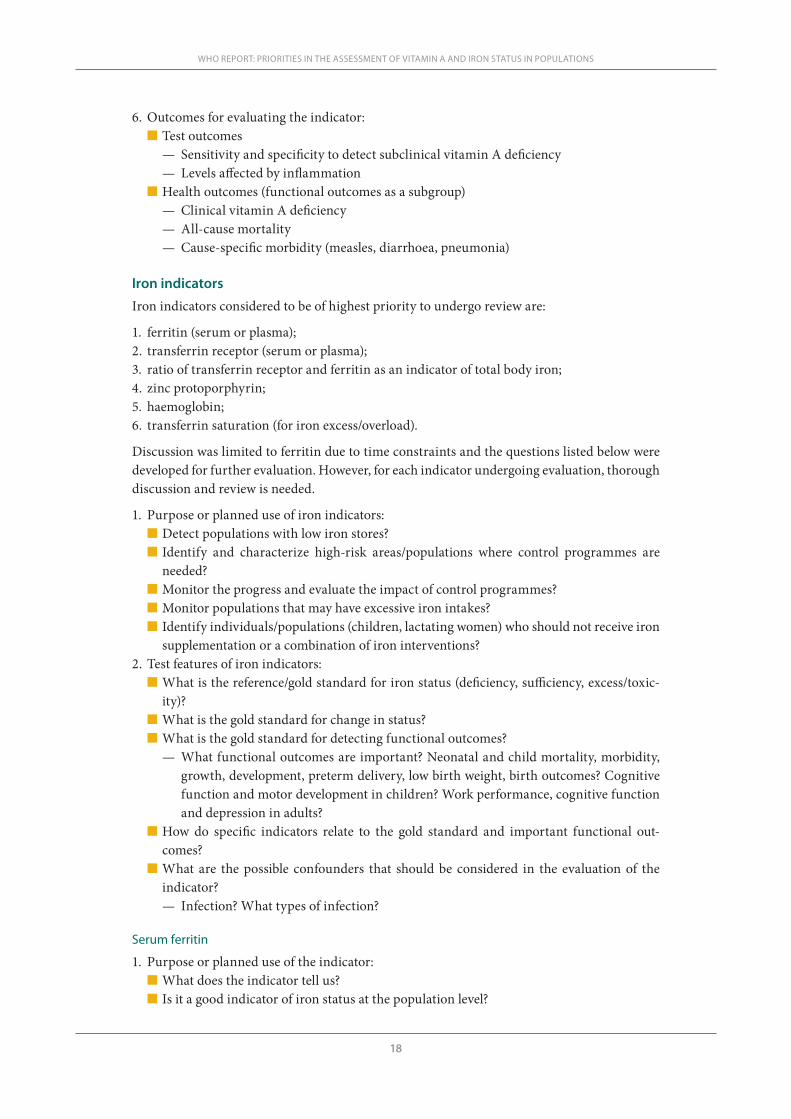
6. Outcomes for evaluating the indicator:n Test outcomes
— Sensitivity and specificity to detect subclinical vitamin A deficiency— Levels affected by inflammation
n Health outcomes (functional outcomes as a subgroup)— Clinical vitamin A deficiency— All-cause mortality— Cause-specific morbidity (measles, diarrhoea, pneumonia)
Iron indicators
Iron indicators considered to be of highest priority to undergo review are:
1. ferritin (serum or plasma); 2. transferrin receptor (serum or plasma); 3. ratio of transferrin receptor and ferritin as an indicator of total body iron; 4. zinc protoporphyrin; 5. haemoglobin; 6. transferrin saturation (for iron excess/overload).
Discussion was limited to ferritin due to time constraints and the questions listed below were developed for further evaluation. However, for each indicator undergoing evaluation, thorough discussion and review is needed.
1. Purpose or planned use of iron indicators:n Detect populations with low iron stores?n Identify and characterize high-risk areas/populations where control programmes are
needed?n Monitor the progress and evaluate the impact of control programmes?n Monitor populations that may have excessive iron intakes?n Identify individuals/populations (children, lactating women) who should not receive iron
supplementation or a combination of iron interventions?2. Test features of iron indicators:
n What is the reference/gold standard for iron status (deficiency, sufficiency, excess/toxic-ity)?
n What is the gold standard for change in status?n What is the gold standard for detecting functional outcomes?
— What functional outcomes are important? Neonatal and child mortality, morbidity, growth, development, preterm delivery, low birth weight, birth outcomes? Cognitive function and motor development in children? Work performance, cognitive function and depression in adults?
n How do specific indicators relate to the gold standard and important functional out-comes?
n What are the possible confounders that should be considered in the evaluation of the indicator?— Infection? What types of infection?
Serum ferritin
1. Purpose or planned use of the indicator:n What does the indicator tell us?n Is it a good indicator of iron status at the population level?

19
— Is it appropriate for detecting deficiency? Insufficiency? Excess?n Is it a good indicator for assessing the impact of an iron supplementation or fortification
programme?— If yes, when should it be measured?
2. Test features of the indicator:n What is the gold standard against which the indicator should be evaluated?n Is a reference standard available?n Should serum ferritin be used alone or in combination with other indicators of iron status
(transferrin receptor or ratios, multiple indicator model) or infection/inflammation? n What is the diagnostic accuracy of the indicator (compared with the gold standard)?n What biological samples are needed/acceptable for analysis (plasma from venous or capil-
lary blood, serum from venous or capillary blood, dried blood spots)?n What are the acceptable analytical methods (immunoassays: ELISA, immunoturbido-
metry, immunoradiometric assay; chemiluminescence, multiplex)?3. Cut-off values:
n What is the current cut-off for deficiency?— What is the basis for the cut-off?— Is there high confidence in this cut-off? If not, what data are needed to determine/
validate the cut-off?— Are distributions of the indicator available from several population groups?
n What is the current cut-off to define depleted iron stores? Is this needed?— If yes, is there high confidence in this cut-off? If not, what data are needed to deter-
mine/validate the cut-off?n Is the current cut-off to screen for excessive iron intakes correct?
— Is a separate cut-off needed for pregnant women? For young children receiving multi-ple micronutrient powders and fortified complementary foods?
4. Population thresholds for determining when a public health problem exists and at what level of concern (mild, moderate, severe):n What is the current population threshold for defining a public health problem?
— What is the basis for the threshold?— Is there high confidences in this threshold? If not, what data are needed to determine/
validate the population thresholds?5. Population groups for each indicator:
n What are the priority population groups for assessment (to be ranked)?— Low-birth-weight infants 2–5 months of age— Infants 6–11 months of age— Infants and children 12–23 months of age— Children 24–59 months of age— Children 5–12 years of age— Adolescents 13–18 years of age— Women of reproductive age— Pregnant women— Lactating women— Men — Elderly people
n In what population subgroups will the indicator need adjustment? — Values from those with coexistent infection or inflammation (define), including over-
weight or obese individuals who have a raised inflammatory status?
GROUP DISCUSSION: REVIEW OF PRIORITY QUESTIONS ON INDICATORS OF VITAMIN A AND IRON STATUS
20
WHO REPORT: PRIORITIES IN THE ASSESSMENT OF VITAMIN A AND IRON STATUS IN POPULATIONS
n In what population subgroups may the indicator not be valid?— HIV-positive individuals — Populations with a high prevalence of HIV— Elderly people— Individuals infected with parasites
6. Outcomes for evaluating the indicator:n Test outcomes
— Sensitivity and specificity in detecting iron deficiency in the absence of infection/inflammation and/or iron overload
n Health outcomes (functional outcomes as a subgroup)— Mortality— All-cause morbidity— Physical performance— Cognitive function— Cognitive development and school performance in infants— Birth weight— Gestational age at delivery/prevalence of premature infants in pregnant women
The above questions will need to be answered through a process of systematic review and eval-uation. When retrieving the evidence for review, data from both published and unpublished studies in humans should be sought. All randomized controlled trials, controlled clinical trials and before–after studies should be considered for inclusion. The formulations of the supple-ments or fortificants used in the studies, along with the dose, frequency and duration should be clearly indicated.
21
referenCes
REFERENCES
1. Resolution WHA45.33. National strategies for prevention and control of micronutrient malnutrition. In: Forty-fifth World Health Assembly, Geneva, 4–14 May 1992. Resolutions and decisions. Geneva, World Health Organization, 1992.
2. Resolution WHA63.21. WHO’s role and responsibilities in health research. In: Sixty-third World Health Assembly, Geneva, 17–21 May 2010. Resolutions and decisions, and annexes. Geneva, World Health Or-ganization, 2010 (WHA63/2010/REC/1).
3. Basic documents, 47th ed. Geneva, World Health Organization, 2009 (http://apps.who.int/gb/bd/, ac-cessed 19 May 2011).
4. Guidelines for declaration of interests (WHO experts). Geneva, World Health Organization, 2010. 5. Oxman AD, Lavis JN, Fretheim A. Use of evidence in WHO recommendations. Lancet, 2007, 369:1883–
1889.6. WHO handbook for guideline development. Guidelines Review Committee. Draft March 2010. Geneva,
World Health Organization, 2010.7. Higgins JPT, Green S. Cochrane handbook for systematic reviews of interventions 4.2.6 (updated Septem-
ber 2006). The Cochrane Library, Issue 4. Chichester, UK, John Wiley & Sons, 2006.8. Deeks JJ, Bossuyt PM, Gatsonis C, eds. Cochrane handbook for systematic reviews of diagnostic test ac-
curacy, version 1.0. Birmingham, UK, The Cochrane Collaboration, 2010 (http://srdta.cochrane.org, ac-cessed 25 April 2012).
9. Harvey LJ et al. Methods of assessment of copper status in humans: a systematic review. American Jour-nal of Clinical Nutrition, 2009, 89:2009S–2024S.
10. Fekete K et al. Methods of assessment of n-3 long-chain polyunsaturated fatty acid status in humans: a systematic review. American Journal of Clinical Nutrition, 2009, 89:2070S–2084S.
11. Ristic-Medic D et al. Methods of assessment of iodine status in humans: a systematic review. American Journal of Clinical Nutrition, 2009, 89:2052S–2069S.
12. Hoey L, McNulty H, Strain JJ. Studies of biomarker responses to intervention with riboflavin: a system-atic review. American Journal of Clinical Nutrition, 2009, 89:1960S–1980S.
13. Ashton K et al. Methods of assessment of selenium status in humans: a systematic review. American Journal of Clinical Nutrition, 2009, 89:2025S–2039S.
14. Hoey L, Strain JJ, McNulty H. Studies of biomarker responses to intervention with vitamin B-12: a sys-tematic review of randomized controlled trials. American Journal of Clinical Nutrition, 2009, 89:1981S–1996S.
15. Seamans KM, Cashman KD. Existing and potentially novel functional markers of vitamin D status: a systematic review. American Journal of Clinical Nutrition, 2009, 89:1997S–2008S.
16. Lowe NM, Fekete K, Decsi T. Methods of assessment of zinc status in humans: a systematic review. American Journal of Clinical Nutrition, 2009, 89:2040S–2051S.
17. Hooper L et al. Assessing potential biomarkers of micronutrient status by using a systematic review methodology: methods. American Journal of Clinical Nutrition, 2009, 89:1953S–1959S.
18. Review Manager (RevMan) [computer program]. Version 5.1. Copenhagen, The Nordic Cochrane Cen-tre, The Cochrane Collaboration, 2011.
19. WHO, CDC. Assessing the iron status of populations. Report of a joint World Health Organization/Cent-ers for Disease Control and Prevention technical consultation on the assessment of iron status at the popu-lation level, Geneva, Switzerland, 6–8 April 2004. Geneva, World Health Organization, 2004.
20. Mei Z et al. Hemoglobin and ferritin are currently the most efficient indicators of population response to iron interventions: an analysis of nine randomized controlled trials. Journal of Nutrition, 2005, 135:1974–1980.
21. Cook JD, Flowers CH, Skikne BS. The quantitative assessment of body iron. Blood, 2003, 101:3359–3364.22. WHO, CDC. Assessing the iron status of populations, including literature reviews. Report of a joint World
Health Organization/Centers for Disease Control and Prevention technical consultation on the assessment of iron status at the population level, Geneva, Switzerland, 6–8 April 2004, 2nd ed. Geneva, World Health Organization, 2007.

22
WHO REPORT: PRIORITIES IN THE ASSESSMENT OF VITAMIN A AND IRON STATUS IN POPULATIONS
23. GRADE Working Group. Grading quality of evidence and strength of recommendations. British Medi-cal Journal, 2004, 328:1490–1497.
24. Guyatt GH et al. Rating quality of evidence and strength of recommendations GRADE: an emerging consensus on rating quality of evidence and strength of recommendations. British Medical Journal, 2008, 336:924–926.
25. Indicators for assessing vitamin A deficiency and their application in monitoring and evaluating inter-vention programmes. Geneva, World Health Organization, 1996 (WHO/NUT/96.10; http://www.who.int/nutrition/publications/micronutrients/vitamin_a_deficiency/WHO_NUT_96.10/en/index.html, accessed 7 June 2011).
26. Control of vitamin A deficiency and xerophthalmia. Report of a Joint WHO/UNICEF/USAID/Helen Keller International/IVACG meeting. Geneva, World Health Organization, 1982 (WHO Technical Re-port Series, No. 672; http://www.who.int/nutrition/publications/micronutrients/vitamin_a_deficieny/WHO_TRS_672/en/index.html, accessed 7 June 2011).

Annex 1List of participants

25
A. Experts
LIST OF PARTICIPANTS
Dr Lindsay H. AllenUSDA Western Human Nutrition Research
CenterDavis, United States of America
Dr France BeginUNICEF Regional Office for East Asia and
PacificBangkok, Thailand
Ms Amelie CasgrainUniversity of East AngliaNorwich, England
Dr Jonathan GorsteinUniversity of WashingtonSeattle, United States of America
Dr Roland KupkaUNICEF Regional Office for West and
Central AfricaDakar-Yoff, Senegal
Professor Sean LynchEastern Virginia Medical SchoolNorfolk, United States of America
Professor George P. McCabePurdue UniversityWest Lafayette, United States of America
Dr Zuguo MeiInternational Micronutrient Malnutrition
Prevention and Control Program (IMMPaCt)
Centers for Disease Control and Prevention (CDC)
Atlanta, United States of America
Dr Christine PfeifferCenters for Disease Control and Prevention
(CDC)Atlanta, United States of America
Dr Rob J.P.M. ScholtenDutch Cochrane CenterAmsterdam, the Netherlands
Dr. Sherry A. TanumihardjoUniversity of Wisconsin-MadisonMadison, United States of America
Dr Douglas TarenUniversity of ArizonaTucson, United States of America
Dr Ismaël Ngnié TétaMicronutrient InitiativeOttawa, Canada
Dr Keith P. West, JrJohns Hopkins Bloomberg School of Public
HealthBaltimore, United States of America
B. WHO Secretariat
Dr Luz Maria De-RegilEpidemiologistEvidence and Programme Guidance UnitDepartment of Nutrition for Health and
Development
Dr Juan Pablo Peña-RosasCoordinatorEvidence and Programme Guidance UnitDepartment of Nutrition for Health and
Development
Dr Lisa M. RogersTechnical OfficerEvidence and Programme Guidance UnitDepartment of Nutrition for Health and
Development
Dr Cynthia SouzaTechnical OfficerGuideline Review Committee – SecretariatDepartment of Research Policy and
Cooperation
C. WHO regional and country offices
Ms Ana AtencioNutritionistWHO/Pan American Health Organization
Panama Country OfficePanama City, Panama
Dr Rubén GrajedaTechnical OfficerMicronutrientsWHO Regional Office for the Americas/Pan
American Health OrganizationWashington, United States of America
26
WHO REPORT: PRIORITIES IN THE ASSESSMENT OF VITAMIN A AND IRON STATUS IN POPULATIONS
Dr Chessa LutterRegional Adviser Unit on Child and Adolescent HealthWHO Regional Office for the Americas/Pan
American Health OrganizationWashington, United States of America
Dr Joaquin Molina LezaPan American Health Organization
(PAHO)/WHO RepresentativeWHO/PAHO Country OfficePanama City, Panama
Dr Manuel PeñaNutritionistWHO/Pan American Health Organization
Panama Country OfficePanama City, Panama

Annex 2Background papers

29
A2.1 Historical and practical uses of assessing night blindness as an indicator for vitamin A deficiencyDouglas Taren
Mel and Enid Zuckerman College of Public Health, University of Arizona, Tucson, Arizona, United States of America
Corresponding author: Douglas Taren; [email protected]
Suggested citation: Taren D. Historical and practical uses of assessing night blindness as an indicator for vitamin A deficiency. In: World Health Organization. Report: Priorities in the assessment of vitamin A and iron status in populations, Panama City, Panama, 15–17 September 2010. Geneva, World Health Organization, 2012.
Abstract
n The assessment of vitamin A status is critical for the planning, implementation, monitoring and evaluation of vitamin A deficiency prevention and treatment programmes. Determina-tion of night blindness is one of the traditional methods of assessing vitamin A deficiency. A variety of subjective and objective methods have been used, however, reported night blindness, the most common method to assess poor dark adaptation, does not correlate strongly with biochemical indicators of vitamin A deficiency. Recently, more standardized field-based meth-ods that utilize a standard stimulus to the eye have been developed, specifically the pupillary response test and the night vision threshold test. These low-cost, non-invasive methods have the potential to provide rapid assessment to determine whether the prevalence of vitamin A deficiency within a population is of public health significance or changes with an intervention.
A2.1 ASSESSING NIGHT BLINDNESS AS AN INDICATOR FOR VITAMIN A DEFICIENCY
30
WHO REPORT: PRIORITIES IN THE ASSESSMENT OF VITAMIN A AND IRON STATUS IN POPULATIONS
Introduction
Vitamin A deficiency is of major public health significance in many parts of the world where poverty is extensive and resources are limited. The association between vitamin A deficiency and an increase in childhood prevalence and severity of infectious diseases, blindness and mortality has been well documented. Vitamin A deficiency in pregnant and breastfeeding women is also associated with poor maternal and infant outcomes. Much work has already been conducted to determine the social determinants that lead to vitamin A deficiency, includ-ing indicators of poverty, low education and social discrimination (1–3).
A number of methods have been used over the past century to assess vitamin A status, including dietary patterns, biomarkers, clinical examinations and histopathology (4). All these methods have their advantages and limitations for assessing vitamin A status both at the indi-vidual and at the community level. This review focuses on night blindness as a method for assessing vitamin A status. In the most restrictive sense, the measurement of night blindness is the ability to see at night, or synonymously in darkness or when light is of low intensity. A variety of methods have been developed to measure factors that relate to the biochemical, physiological and functional ability to see in darkness. However, the methods used to meas-ure retinal physiology and the functional ability to see at night are fundamentally different, and although they provide mostly congruent findings, at times the results can be incongruent within an individual. One can measure objectively deterioration in the response of the eye to see in darkness, but a person may still be able to see and function at night. Night blindness is when a person is having trouble seeing in darkness and this takes into account the physiologi-cal responses to dark adaptation and either a cognitive recognition of the deficit or an objective measure of the functional deficit.
This paper reviews the most common measures of night blindness and their association with vitamin A status at the individual and at the community level as part of population-based assessments, and for monitoring and evaluation of vitamin A interventions. A brief background is provided on the physiological factors that bring together the role of vitamin A and measures of night blindness. Determining the presence of night blindness in the context of vitamin A deficiency addresses the logistical and practical aspects of conducting large-scale public health evaluations in resource-poor regions and countries of the world. Not all coun-tries and programmes have the financial or laboratory resources to analyse serum vitamin A, to conduct elaborate retinol dose response measures, and to measure biochemical indica-tors of inflammation, poor protein status and/or other nutrients that affect serum vitamin A concentration. Assessment of night blindness avoids having to obtain blood from women and children. The costs associated with laboratory testing are lower and the results are available much more quickly than with laboratory analyses. It is also possible to repeat measurements in the field to improve accuracy. Often fewer people need to be trained to conduct night blindness testing, there are less consumable costs for such items as chemical reagents and for transporta-tion of samples, and there is also less need for numerous personnel such as phlebotomists and laboratory technicians, and for laboratory supervision.
Night blindness and vitamin A
The physiological mechanisms that lead to night blindness have been elucidated from stud-ies on genetic abnormalities related to the retina, as a result of diseases that interfere with fat absorption, liver metabolism and genetic mutations. These causes of night blindness are not comprehensively addressed in this paper since several reviews are already available (5–7).
Modern understanding about the role of vitamin A in vision was much enhanced by the work of Dowling and Wald (8, 9) on the capacity for sight under variable levels of light. Their
31
studies elucidated the mechanism for night vision as a function of three integrative parts of the eye: the pupil, the rods and cones, and rhodopsin in the rods. The pupil acts as a filter that contracts and expands depending on the amount of light exposure. While the cone cells in the retina perceive colour in bright light, the rod cells perceive black and white images and work best in low light. Rhodopsin, a visual purple photopigment, is located in the rod cells in the outer periphery of the eye and is the key to night vision. When exposed to light, molecules of rhodopsin absorb photons and then split into the two chemicals, retinal and opsin. This allows the eye to perceive black and white images in a light environment but inhibits night vision. When exposed to darkness, retinal and opsin recombine to form rhodopsin once again, the chemical that promotes the capacity for night vision. These photoreceptors (cones and rods), are in the posterior of the retina next to the pigment epithelial cells while the nerve cells lie on the anterior surface of the retina.
Multiple nutrients are involved in the regeneration of rhodopsin, including protein, miner-als, especially zinc, and vitamins that influence vitamin A metabolism and neuron transmis-sion. Night blindness due to vitamin A deficiency is mostly associated with metabolic changes related to the regeneration of rhodopsin; the delay in recovery may also be due to anatomical changes in the rods, which take time to recover. Studies on rats have indicated that it might take 3–5 months for recovery in severe cases (8). At the point where all rod function is lost, rho-dopsin levels remain at about two-thirds of normal and when deficiency continues, the cones are also affected (10). Anatomical changes on fundus examination have also been reported in humans with vitamin A deficiency, including the presence of yellow and white retinal spots (11, 12). It is not known if the same anatomical relation exists with rhodopsin depletion in humans, but follow-up studies indicate that fundus anatomy fully recovers within 2–3 months (11).
Night blindness due to vitamin A deficiency also occurs secondary to medical interventions that lead to a decrease in fat absorption, such as bariatric surgery, and to other medical condi-tions leading to impaired liver function, such as in alcoholism and biliary cirrhosis (13–15). Additional knowledge about vitamin A and night blindness has been acquired from studying Sorsby’s fundus dystrophy, a rare genetic defect that is characterized by a thickening of Bruch’s membrane barrier between the photoreceptor and blood supply (choroid) due to abnormal lipid-containing deposits. Studies have suggested that the inhibition of blood flow with conse-quent vitamin A deficiency may be related to the night blindness in the early stages of devel-opment. In a small group of four family-related patients given 50 000 IU/day for 1 month, improvement occurred by the ninth day of treatment as measured by a shorter duration of the rod–cone break (16).
Current recommendations for using night blindness as a method to determine whether the prevalence of vitamin A deficiency is of public health significance
Several agencies and organizations have published recommendations regarding use of night blindness assessment to determine the public health significance of vitamin A deficiency in populations. Vitamin A deficiency has been defined as being of public health significance when it is present in ≥1.0% of children 24–71 months of age and is of severe significance when the prevalence is ≥5.0% (4, 17). However, even in young children, prevalence of night blindness within the preschool years increases with age (18–22). The prevalence of night blindness may be greater among boys compared with girls within this age range and thus population stud-ies must ensure that their sample contains a representative proportion of boys and girls. More recently, maternal night blindness has been suggested for assessing the vitamin A status at community level. This is determined as the proportion of women with a history of night blind-ness in a previous pregnancy that ended in a live birth in the past 3 years, and when possible using a local term for describing night blindness (23). Finally, a previous report by the World
A2.1 ASSESSING NIGHT BLINDNESS AS AN INDICATOR FOR VITAMIN A DEFICIENCY
32
WHO REPORT: PRIORITIES IN THE ASSESSMENT OF VITAMIN A AND IRON STATUS IN POPULATIONS
Health Organization (WHO) has indicated that night blindness can be used for risk assess-ment, targeting programmes and evaluating effectiveness of vitamin A interventions (4).
Description of methods used to assess night blindness
Numerous tests and variations of standardized tests have been used to determine the presence of night blindness. This review focuses on the four tests that have been used most consistently in conjunction with other measures of vitamin A status. The most common tests involve having a person report about their current or past night blindness status and are based on dark adapta-tion (time it takes to respond to darkness) or the scoptic response to various light stimuli after dark adaptation. The other methods reviewed are: dark adaptometry, the papillary response test and the night vision threshold test. Other tests of night blindness include variations of the candle test, electroretinography and electro-oculography, but these tests either have not been standardized (candle test) or are very expensive for community-based programmes (electro-retinography and electro-oculography).
Although there are several methods to measure night blindness, their association with vita-min A status may differ based on the measure of night blindness used, including the cut-points reported (24), the population under study and the season the assessments are conducted in. Night blindness is reported more frequently in older children, starting at 2 years of age, pos-sibly due to post weaning, increases in exposure to other infectious diseases and illnesses, and easier reporting and observation by parents (25). Boys are affected more than girls in resource-poor areas probably due to more rapid growth and greater demand for vitamin A, and it may also occur more often when there is a local term for night blindness, but not always (25). In specific regard to pregnancy, night blindness is associated with gestation, age and parity (26).
Reported night blindness
Having someone report night blindness is the most common method to determine whether a child or an adult has night blindness. In countries where night blindness is common and severe there is often a local name for it: in Bangladesh the local names include rat kana, alo andhari and krikana (27), in the Terai (plains) region of Nepal ratauni, ratundho and rataunji (28) and in Indonesia buta ayan and kotokeun (29). Multiple terms are used for night blindness in Mali: in Dogon, gire nama, in Peul, pinku and in Bambara surofinye (30).
When a recall method is used for night blindness (either currently having night blindness or having had it in the past), a standardized sequence of questions is used. The questions need to distinguish between poor vision during the day and when there is less light, such as in the evening. In children it is advisable to find out whether the night vision is different from other children. Some studies have added questions about the functionality of a person when it is dark, such as their ability to perform certain tasks at night. In terms of identifying night blind-ness in young children, it is the mother who usually reports this condition and it will always require recall and/or observation of a child having problems functioning in the evening or hav-ing the child verbally tell the mother he or she cannot see. Table A2.1.1 provides an example of a sequence of questions used to assess night vision.
Reported night blindness is considered the least invasive method to assess vitamin A defi-ciency. WHO has stated that a ≥5% prevalence rate of night blindness in children 24–71 months of age signifies that the vitamin A deficiency is of severe public health significance (4). How-ever, the association between reported night blindness and biochemical indicators of vitamin A status has been inconsistent with regards to prevalence of low vitamin A status. Table A2.1.2 presents the outcomes of 21 reports that include 33 matched data on the percentage of people with low serum vitamin A concentrations (<0.70 μmol/L) and the proportion of subjects who
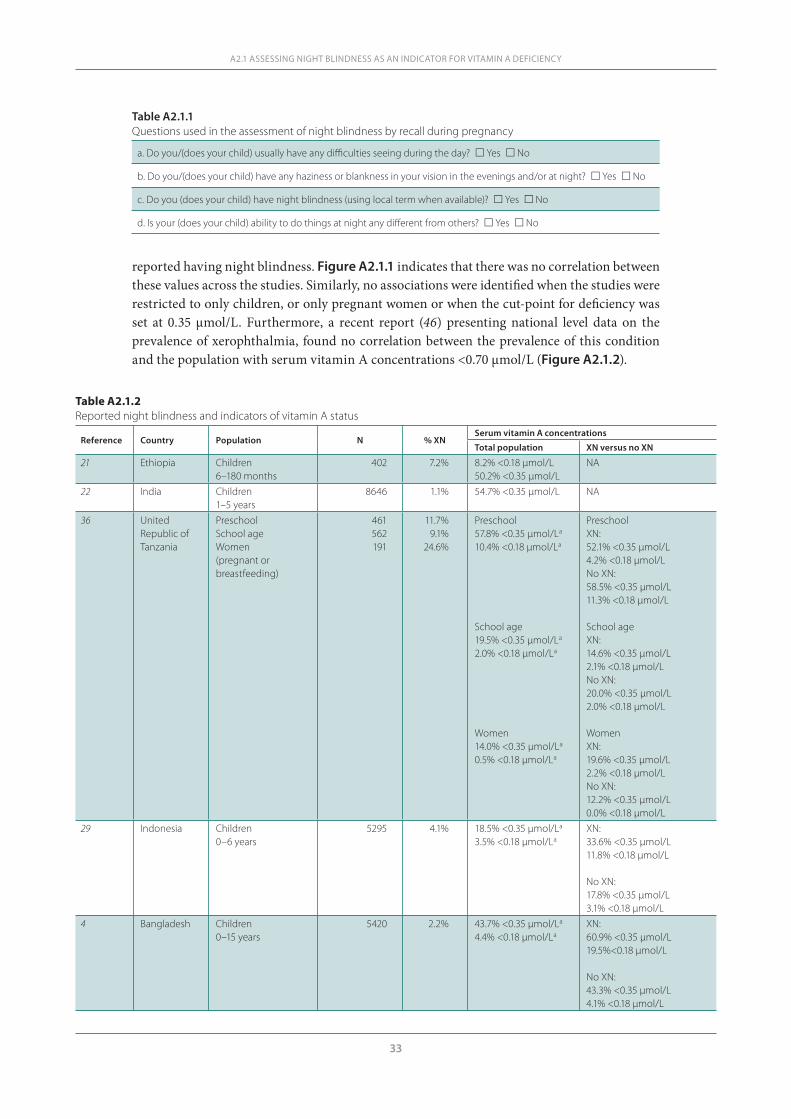
33
reported having night blindness. Figure A2.1.1 indicates that there was no correlation between these values across the studies. Similarly, no associations were identified when the studies were restricted to only children, or only pregnant women or when the cut-point for deficiency was set at 0.35 μmol/L. Furthermore, a recent report (46) presenting national level data on the prevalence of xerophthalmia, found no correlation between the prevalence of this condition and the population with serum vitamin A concentrations <0.70 μmol/L (Figure A2.1.2).
A2.1 ASSESSING NIGHT BLINDNESS AS AN INDICATOR FOR VITAMIN A DEFICIENCY
Table A2.1.1Questions used in the assessment of night blindness by recall during pregnancy
a. Do you/(does your child) usually have any difficulties seeing during the day? Yes No
b. Do you/(does your child) have any haziness or blankness in your vision in the evenings and/or at night? Yes No
c. Do you (does your child) have night blindness (using local term when available)? Yes No
d. Is your (does your child) ability to do things at night any different from others? Yes No
Table A2.1.2Reported night blindness and indicators of vitamin A status
Reference Country Population N % XN Serum vitamin A concentrations
Total population XN versus no XN
21 Ethiopia Children6–180 months
402 7.2% 8.2% <0.18 μmol/L50.2% <0.35 μmol/L
NA
22 India Children1–5 years
8646 1.1% 54.7% <0.35 μmol/L NA
36 United Republic of Tanzania
Preschool School age Women(pregnant or breastfeeding)
461562191
11.7%9.1%
24.6%
Preschool57.8% <0.35 μmol/La
10.4% <0.18 μmol/La
School age19.5% <0.35 μmol/La
2.0% <0.18 μmol/La
Women14.0% <0.35 μmol/La
0.5% <0.18 μmol/La
PreschoolXN:52.1% <0.35 μmol/L4.2% <0.18 μmol/LNo XN:58.5% <0.35 μmol/L11.3% <0.18 μmol/L
School ageXN:14.6% <0.35 μmol/L2.1% <0.18 μmol/LNo XN:20.0% <0.35 μmol/L2.0% <0.18 μmol/L
WomenXN:19.6% <0.35 μmol/L2.2% <0.18 μmol/LNo XN:12.2% <0.35 μmol/L0.0% <0.18 μmol/L
29 Indonesia Children0–6 years
5295 4.1% 18.5% <0.35 μmol/La
3.5% <0.18 μmol/LaXN:33.6% <0.35 μmol/L11.8% <0.18 μmol/L
No XN:17.8% <0.35 μmol/L3.1% <0.18 μmol/L
4 Bangladesh Children0–15 years
5420 2.2% 43.7% <0.35 μmol/La
4.4% <0.18 μmol/LaXN:60.9% <0.35 μmol/L19.5%<0.18 μmol/L
No XN:43.3% <0.35 μmol/L4.1% <0.18 μmol/L
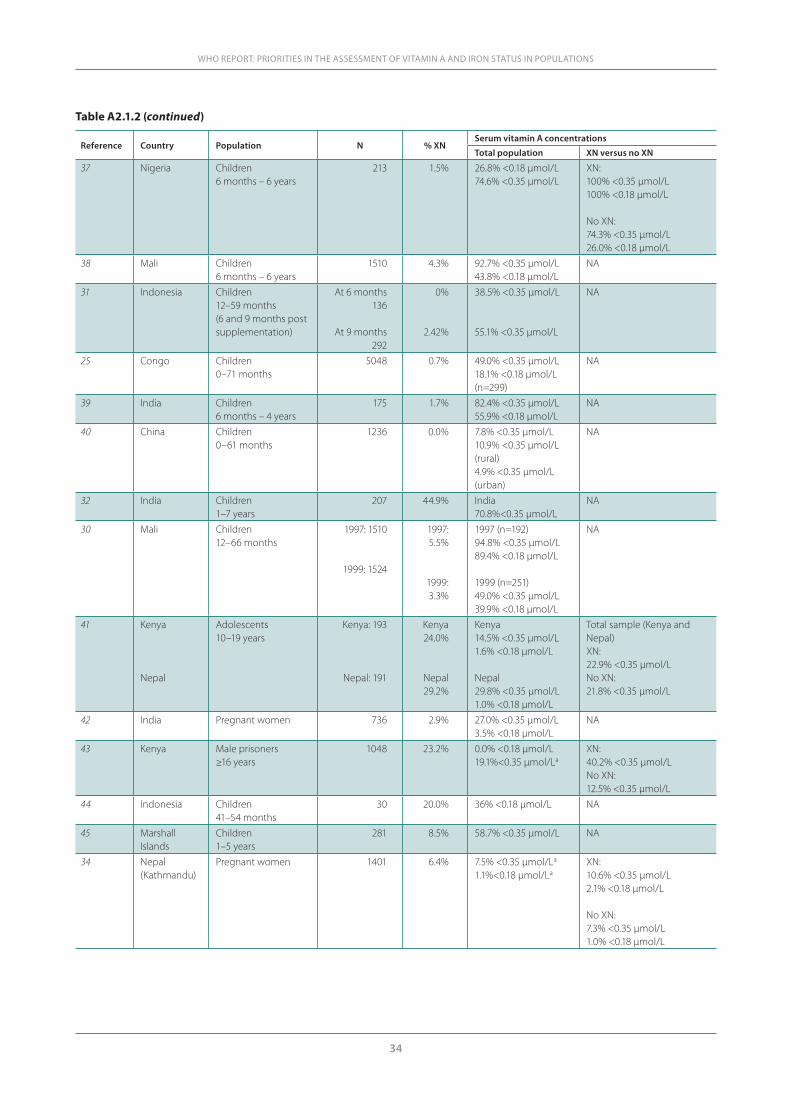
34
WHO REPORT: PRIORITIES IN THE ASSESSMENT OF VITAMIN A AND IRON STATUS IN POPULATIONS
Reference Country Population N % XN Serum vitamin A concentrations
Total population XN versus no XN
37 Nigeria Children6 months – 6 years
213 1.5% 26.8% <0.18 μmol/L74.6% <0.35 μmol/L
XN:100% <0.35 μmol/L100% <0.18 μmol/L
No XN:74.3% <0.35 μmol/L26.0% <0.18 μmol/L
38 Mali Children6 months – 6 years
1510 4.3% 92.7% <0.35 μmol/L43.8% <0.18 μmol/L
NA
31 Indonesia Children12–59 months(6 and 9 months post supplementation)
At 6 months 136
At 9 months292
0%
2.42%
38.5% <0.35 μmol/L
55.1% <0.35 μmol/L
NA
25 Congo Children0–71 months
5048 0.7% 49.0% <0.35 μmol/L18.1% <0.18 μmol/L(n=299)
NA
39 India Children6 months – 4 years
175 1.7% 82.4% <0.35 μmol/L55.9% <0.18 μmol/L
NA
40 China Children0–61 months
1236 0.0% 7.8% <0.35 μmol/L10.9% <0.35 μmol/L(rural)4.9% <0.35 μmol/L (urban)
NA
32 India Children1–7 years
207 44.9% India 70.8%<0.35 μmol/L
NA
30 Mali Children12–66 months
1997: 1510
1999: 1524
1997: 5.5%
1999: 3.3%
1997 (n=192)94.8% <0.35 μmol/L89.4% <0.18 μmol/L
1999 (n=251)49.0% <0.35 μmol/L39.9% <0.18 μmol/L
NA
41 Kenya
Nepal
Adolescents10–19 years
Kenya: 193
Nepal: 191
Kenya 24.0%
Nepal29.2%
Kenya14.5% <0.35 μmol/L1.6% <0.18 μmol/L
Nepal29.8% <0.35 μmol/L1.0% <0.18 μmol/L
Total sample (Kenya and Nepal)XN: 22.9% <0.35 μmol/LNo XN: 21.8% <0.35 μmol/L
42 India Pregnant women 736 2.9% 27.0% <0.35 μmol/L3.5% <0.18 μmol/L
NA
43 Kenya Male prisoners≥16 years
1048 23.2% 0.0% <0.18 μmol/L19.1%<0.35 μmol/La
XN:40.2% <0.35 μmol/LNo XN:12.5% <0.35 μmol/L
44 Indonesia Children41–54 months
30 20.0% 36% <0.18 μmol/L NA
45 Marshall Islands
Children1–5 years
281 8.5% 58.7% <0.35 μmol/L NA
34 Nepal(Kathmandu)
Pregnant women 1401 6.4% 7.5% <0.35 μmol/La
1.1%<0.18 μmol/LaXN: 10.6% <0.35 μmol/L2.1% <0.18 μmol/L
No XN:7.3% <0.35 μmol/L1.0% <0.18 μmol/L
Table A2.1.2 (continued)
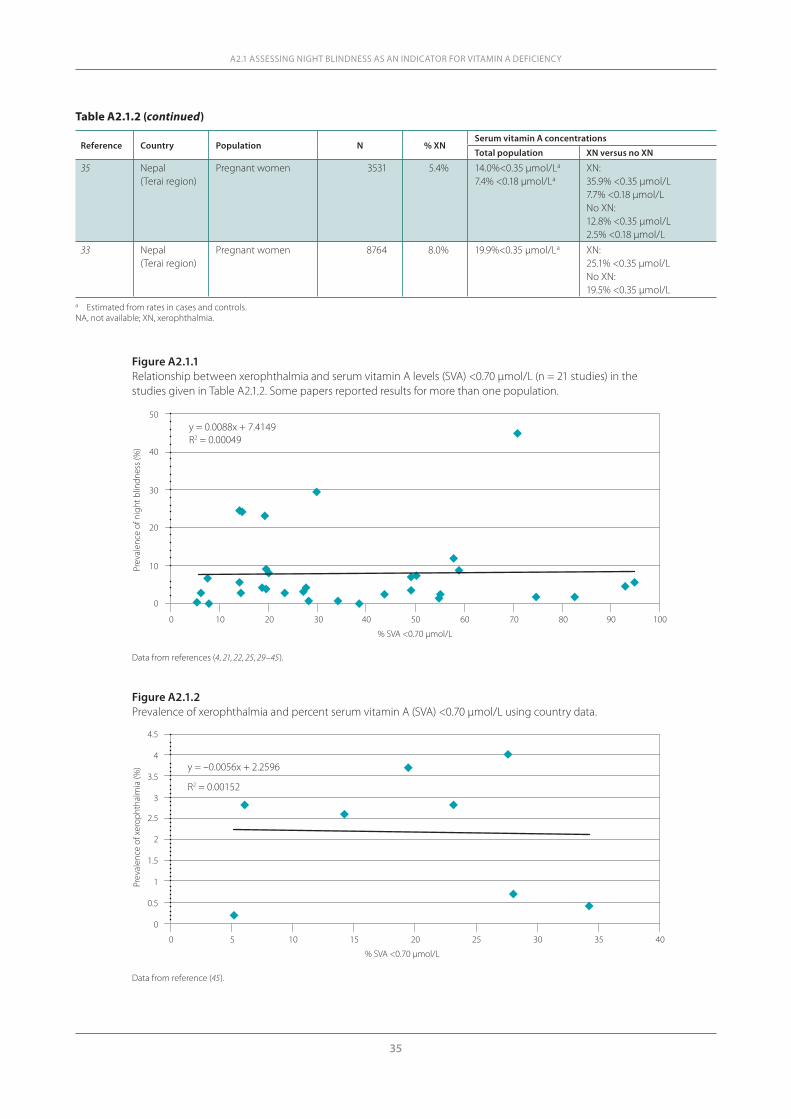
35
A2.1 ASSESSING NIGHT BLINDNESS AS AN INDICATOR FOR VITAMIN A DEFICIENCY
Reference Country Population N % XN Serum vitamin A concentrations
Total population XN versus no XN
35 Nepal (Terai region)
Pregnant women 3531 5.4% 14.0%<0.35 μmol/La
7.4% <0.18 μmol/LaXN:35.9% <0.35 μmol/L7.7% <0.18 μmol/LNo XN: 12.8% <0.35 μmol/L2.5% <0.18 μmol/L
33 Nepal(Terai region)
Pregnant women 8764 8.0% 19.9%<0.35 μmol/La XN: 25.1% <0.35 μmol/LNo XN:19.5% <0.35 μmol/L
a Estimated from rates in cases and controls.NA, not available; XN, xerophthalmia.
Table A2.1.2 (continued)
Figure A2.1.1Relationship between xerophthalmia and serum vitamin A levels (SVA) <0.70 μmol/L (n = 21 studies) in the studies given in Table A2.1.2. Some papers reported results for more than one population.
50
0
10
20
30
40
0 10 20 30 40 50 60 70 80 90 100
Prev
alen
ce o
f nig
ht b
lindn
ess (
%)
% SVA <0.70 µmol/L
y = 0.0088x + 7.4149R2 = 0.00049
Figure A2.1.2Prevalence of xerophthalmia and percent serum vitamin A (SVA) <0.70 μmol/L using country data.
% SVA <0.70 µmol/L
0 5 10 15 20 25 30 35 40
0
0.5
1
1.5
2
2.5
3
3.5
4
4.5
Prev
alen
ce o
f xer
opht
halm
ia (%
) y = –0.0056x + 2.2596
R2 = 0.00152
Data from references (4, 21, 22, 25, 29–45).
Data from reference (45).
36
WHO REPORT: PRIORITIES IN THE ASSESSMENT OF VITAMIN A AND IRON STATUS IN POPULATIONS
Objective measures of night blindness
Several methods have been developed in the attempt to have an objective measure of night blindness. All of these methods are based on the scoptic response and thus have some simi-larities with regards to the environment in which measurements are taken, for example, all require dark adaptation. The most common time period is 10 minutes in a completely darken room. Training is required for taking measurements to decrease variability and intra- and inter-observer bias. Each method requires subject cooperation. Differences have been found within measurements made with the same method or different methods. Some researchers have bleached the eye (flashing a standardized light) to add uniformity to the measures. Other methods have looked at how quickly a person adapts to darkness whereas some methods deter-mine the level of light that can be seen after dark adaptation. Some methods require dexterity and others a verbal response. The intensity of light that is used to stimulate the eye also varies between methods. This section reviews the most common methods that have been used to objectively measure night blindness.
The candle testThe candle test was one of the first objective measures of night blindness, and it requires only low-cost consumable materials. However, it has not been consistently used for evaluating vita-min A deficiency. The most common protocol for the candle test is to have the person dark-adapted, light a candle and determine whether the person can identify objects near the candle. The problem with the candle test is that all candles are not the same and thus the amount of stimulus provided to the rods is not known and this cannot be standardized. Often the stand-ard has been the tester and if the tester can see the objects and the subject cannot, this leads to the diagnosis of night blindness (47). Furthermore, now that new technology is available, there is no advantage with this test compared with other assessment methods that can be standard-ized and have greater reproducibility for comparisons within and between populations.
ElectroretinographyThe electrophysiology of vision can be used for overall health assessment of the retina (48). Using a full field electroretinogram allows one to differentiate the rod and cone response to various levels of light stimuli against multiple intensities of background light. Historically, electroretinography have been used to measure scoptic response to brief light stimulus in patients with various ophthalmological conditions, including those that result in night blind-ness. Electroretinography has not been used in large-scale studies due to the associated costs and logistics. In order to conduct electroretinography, patients need to have their eyes dilated (e.g. using a combination of tropicamide 1.0% and phenylephrine hydrochloride 2.5%) prior to dark adaptation for 30 minutes. The eyes are then anaesthetized (tetracaine hydrochloride 0.5%) before placing contact lens electrodes, and children may need to be sedated. After dark adaptation, the scoptic response is elicited using a full field dome (e.g. Ganzfeld) by a dim flash of light and the amplitude and implicit times are recorded. A negative reaction to the dim flash supports poor rod response and later the combined rod–cone response can be measured using a bright flash. Calibration of the Ganzfeld dome is required and of the measures of the strength of the flashes, use of repeated flashes, background luminance and the electronic hardware and software that is used to measure amplitude and the implicit times.
Another method related to electroretinography is electro-oculography, which differs from the former in that it measures the continuous resting electrical potential of the retina com-pared with the transitory response measured by electroretinography. The equipment costs for these tests can exceed US$40 000 and the other costs for consumables and training of staff also make this test expensive and not suitable for large-scale community assessment, and monitor-
37
ing and evaluating of interventions in low-income countries. Studies in the past few decades have utilized electroretinography to identify night blindness in specific clinical cases that have resulted from vitamin A deficiency due to diseases interfering with fat absorption or iatrogenic outcomes following bariatric surgery (49).
Rapid dark adaptation testThe rapid dark adaptation test is based on the Purkinje shift, that is, the sensitivity of the retina to shift from the red to the blue end of the visual spectrum (50, 51). The classical approach uses a Goldman-Weekers adaptometer. The eyes are first dilated to 7–8 mm with 1.0% tropicamide and then subjected to a consistent diffuse light of 3.13 log millilamberts luminance for 10 min-utes followed immediately by the dark adaptation measurements while the subject is fixated on a 2 mm red light. The subject is then exposed to light flashes in ascending (first saw the test light) and descending order (ceased to see the test light), based on their responses, for 35–40 minutes until a plateau is reached. The logarithm of the light-perception threshold is then plot-ted as a function of time in darkness (52). The plot shifts upwards with increasing levels of night blindness, indicting a greater luminance level at the time the final plateau is reached. This method has been adapted using munsell coloured red (605 μm) and blue (475 μm) chips that were emitted at 6.8 × 10³ candelas/m2 after bleaching of the eye for 1 minute (53, 54). The time taken by a subject to recognize and sort various coloured objects after bleaching is then used as a measure of the dark adaptation response. Studies have correlated night blindness with vitamin A status, but no standard cut-point has been recognized within any of the various applications to consider them useful in large-scale studies.
The pupillary response Resurgence in creating a standardized objective measure of night blindness that could be imple-mented in low-income countries occurred with the development of the pupillary response test (31, 32, 55). The pupillary response is measured using an AC rechargeable battery-powered illuminator that emits light to one eye. There are 11 settings on the illuminator, separated by 0.4 log intervals. A subject places one eye fully over the illuminator while the other eye is focused at a space 2 m in distance while being exposed to a red light. The illuminator emits light in one eye while the pupillary response (contraction) in the opposite eye is monitored using a loupe with 2.5× magnification. A threshold used for impaired dark adaptation is a response to light greater than –1.11 log cd/m2. This pupillary response test has been used in children and women. However, compliance with completing the pupillary response test is very low in children younger than 4 years of age (31). The pupillary response test has shown that the dark-adaptation threshold significantly improves after vitamin A supplementation in pregnant women, but not in postpartum women (55). Pregnant women who reported night blindness were very likely to fail the pupillary response test (80%); however, more importantly, 14.8% of women who did not report having night blindness failed the pupillary response test, suggesting that this test may be identifying earlier stages of night blindness that are not being recognized by the women themselves (33).
The night vision threshold test The night vision threshold test (NVTT) instrument is a small, handheld, portable, battery-powered instrument that projects light of varying intensity onto a standardized matte projec-tion screen that has a goniophotometer reflectance of 1.1. The list is 30 cm in diameter when the NVTT is 3.3 m from the screen (34, 56, 57). The amount of projected light is varied by changing the electrical current provided to a light-emitting diode (LED) through a series of switches. The NVTT instrument uses 6 V of energy for correct operation and is set up with six 1.5 V AA bat-teries (9 V). A low battery indicator light is activated when the battery power decreases to <7 V.
A2.1 ASSESSING NIGHT BLINDNESS AS AN INDICATOR FOR VITAMIN A DEFICIENCY
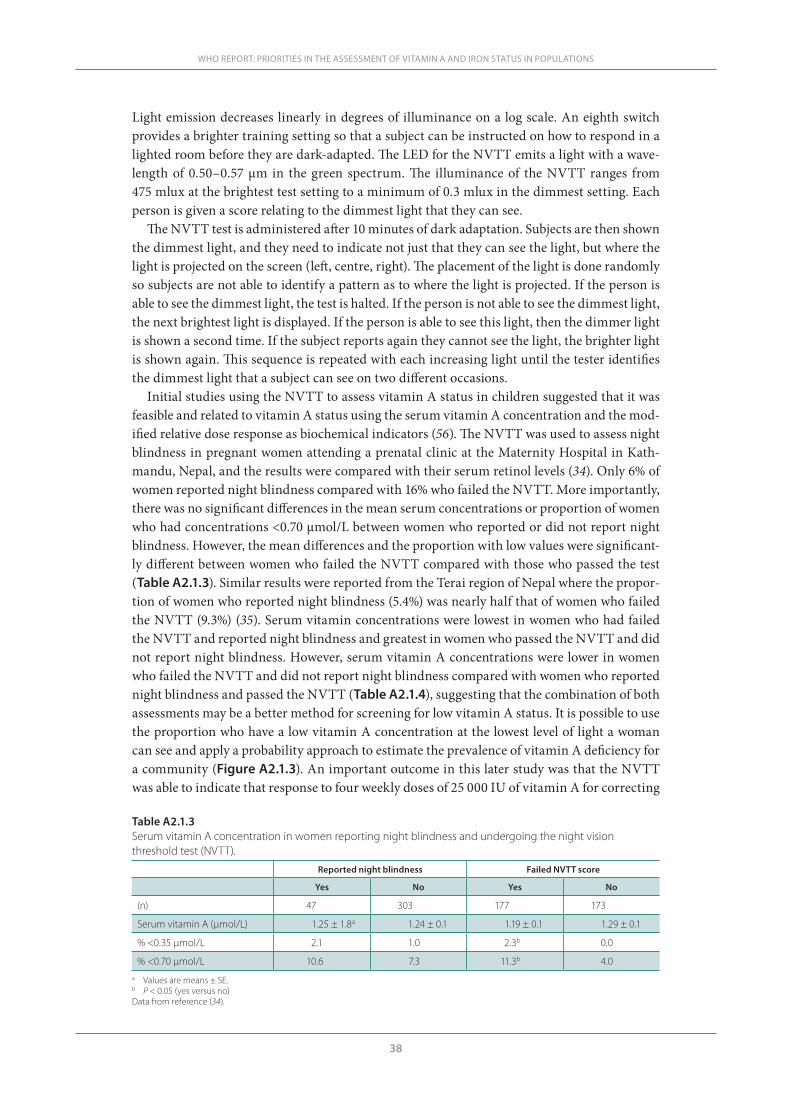
38
WHO REPORT: PRIORITIES IN THE ASSESSMENT OF VITAMIN A AND IRON STATUS IN POPULATIONS
Light emission decreases linearly in degrees of illuminance on a log scale. An eighth switch provides a brighter training setting so that a subject can be instructed on how to respond in a lighted room before they are dark-adapted. The LED for the NVTT emits a light with a wave-length of 0.50–0.57 μm in the green spectrum. The illuminance of the NVTT ranges from 475 mlux at the brightest test setting to a minimum of 0.3 mlux in the dimmest setting. Each person is given a score relating to the dimmest light that they can see.
The NVTT test is administered after 10 minutes of dark adaptation. Subjects are then shown the dimmest light, and they need to indicate not just that they can see the light, but where the light is projected on the screen (left, centre, right). The placement of the light is done randomly so subjects are not able to identify a pattern as to where the light is projected. If the person is able to see the dimmest light, the test is halted. If the person is not able to see the dimmest light, the next brightest light is displayed. If the person is able to see this light, then the dimmer light is shown a second time. If the subject reports again they cannot see the light, the brighter light is shown again. This sequence is repeated with each increasing light until the tester identifies the dimmest light that a subject can see on two different occasions.
Initial studies using the NVTT to assess vitamin A status in children suggested that it was feasible and related to vitamin A status using the serum vitamin A concentration and the mod-ified relative dose response as biochemical indicators (56). The NVTT was used to assess night blindness in pregnant women attending a prenatal clinic at the Maternity Hospital in Kath-mandu, Nepal, and the results were compared with their serum retinol levels (34). Only 6% of women reported night blindness compared with 16% who failed the NVTT. More importantly, there was no significant differences in the mean serum concentrations or proportion of women who had concentrations <0.70 μmol/L between women who reported or did not report night blindness. However, the mean differences and the proportion with low values were significant-ly different between women who failed the NVTT compared with those who passed the test (Table A2.1.3). Similar results were reported from the Terai region of Nepal where the propor-tion of women who reported night blindness (5.4%) was nearly half that of women who failed the NVTT (9.3%) (35). Serum vitamin concentrations were lowest in women who had failed the NVTT and reported night blindness and greatest in women who passed the NVTT and did not report night blindness. However, serum vitamin A concentrations were lower in women who failed the NVTT and did not report night blindness compared with women who reported night blindness and passed the NVTT (Table A2.1.4), suggesting that the combination of both assessments may be a better method for screening for low vitamin A status. It is possible to use the proportion who have a low vitamin A concentration at the lowest level of light a woman can see and apply a probability approach to estimate the prevalence of vitamin A deficiency for a community (Figure A2.1.3). An important outcome in this later study was that the NVTT was able to indicate that response to four weekly doses of 25 000 IU of vitamin A for correcting
Table A2.1.3Serum vitamin A concentration in women reporting night blindness and undergoing the night vision threshold test (NVTT).
Reported night blindness Failed NVTT score
Yes No Yes No
(n) 47 303 177 173
Serum vitamin A (µmol/L) 1.25 ± 1.8a 1.24 ± 0.1 1.19 ± 0.1 1.29 ± 0.1
% <0.35 μmol/L 2.1 1.0 2.3b 0.0
% <0.70 μmol/L 10.6 7.3 11.3b 4.0a Values are means ± SE.b P < 0.05 (yes versus no)Data from reference (34).
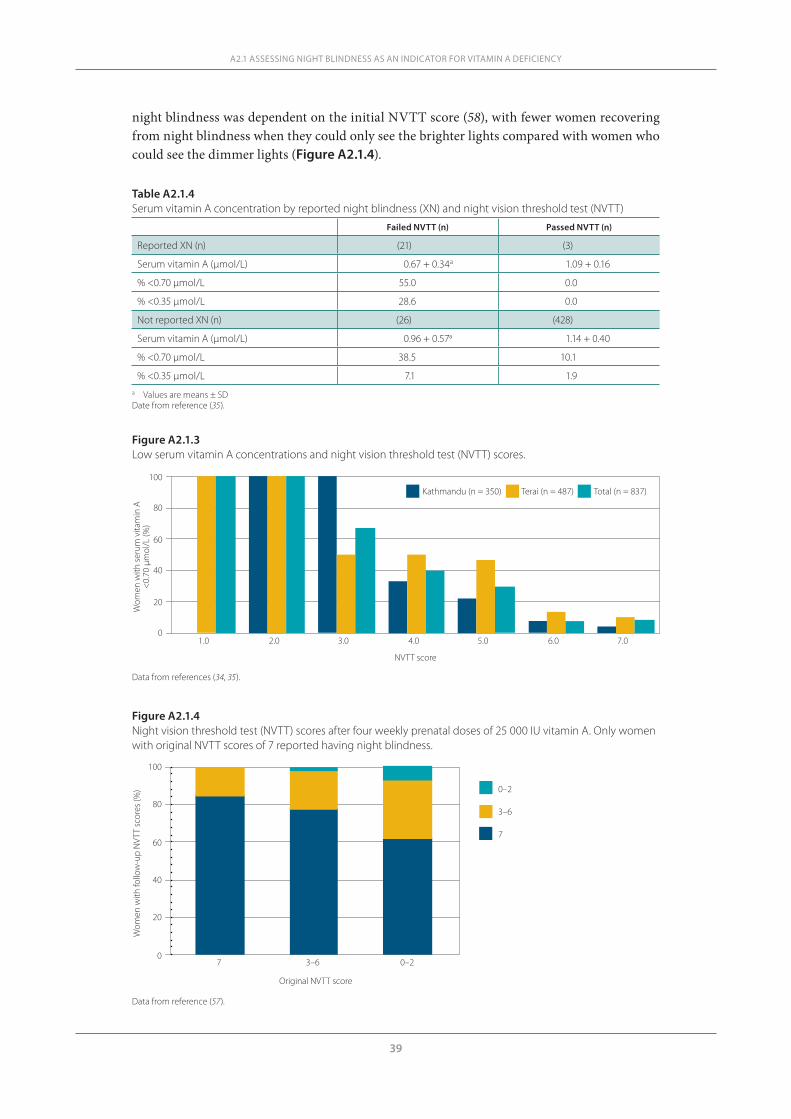
39
night blindness was dependent on the initial NVTT score (58), with fewer women recovering from night blindness when they could only see the brighter lights compared with women who could see the dimmer lights (Figure A2.1.4).
A2.1 ASSESSING NIGHT BLINDNESS AS AN INDICATOR FOR VITAMIN A DEFICIENCY
Table A2.1.4Serum vitamin A concentration by reported night blindness (XN) and night vision threshold test (NVTT)
Failed NVTT (n) Passed NVTT (n)
Reported XN (n) (21) (3)
Serum vitamin A (µmol/L) 0.67 + 0.34a 1.09 + 0.16
% <0.70 μmol/L 55.0 0.0
% <0.35 μmol/L 28.6 0.0
Not reported XN (n) (26) (428)
Serum vitamin A (µmol/L) 0.96 + 0.57a 1.14 + 0.40
% <0.70 μmol/L 38.5 10.1
% <0.35 μmol/L 7.1 1.9a Values are means ± SDDate from reference (35).
Figure A2.1.3Low serum vitamin A concentrations and night vision threshold test (NVTT) scores.
Figure A2.1.4Night vision threshold test (NVTT) scores after four weekly prenatal doses of 25 000 IU vitamin A. Only women with original NVTT scores of 7 reported having night blindness.
0
20
40
60
80
100
Wom
en w
ith fo
llow
-up
NVT
T sc
ores
(%)
7 3–6 0–2
Original NVTT score
0–2
3–6
7
0
20
40
60
80
100
Wom
en w
ith se
rum
vita
min
A<
0.70
µm
ol/L
(%)
1.0 2.0 3.0 4.0 5.0 6.0 7.0
NVTT score
Kathmandu (n = 350) Terai (n = 487) Total (n = 837)
Data from references (34, 35).
Data from reference (57).
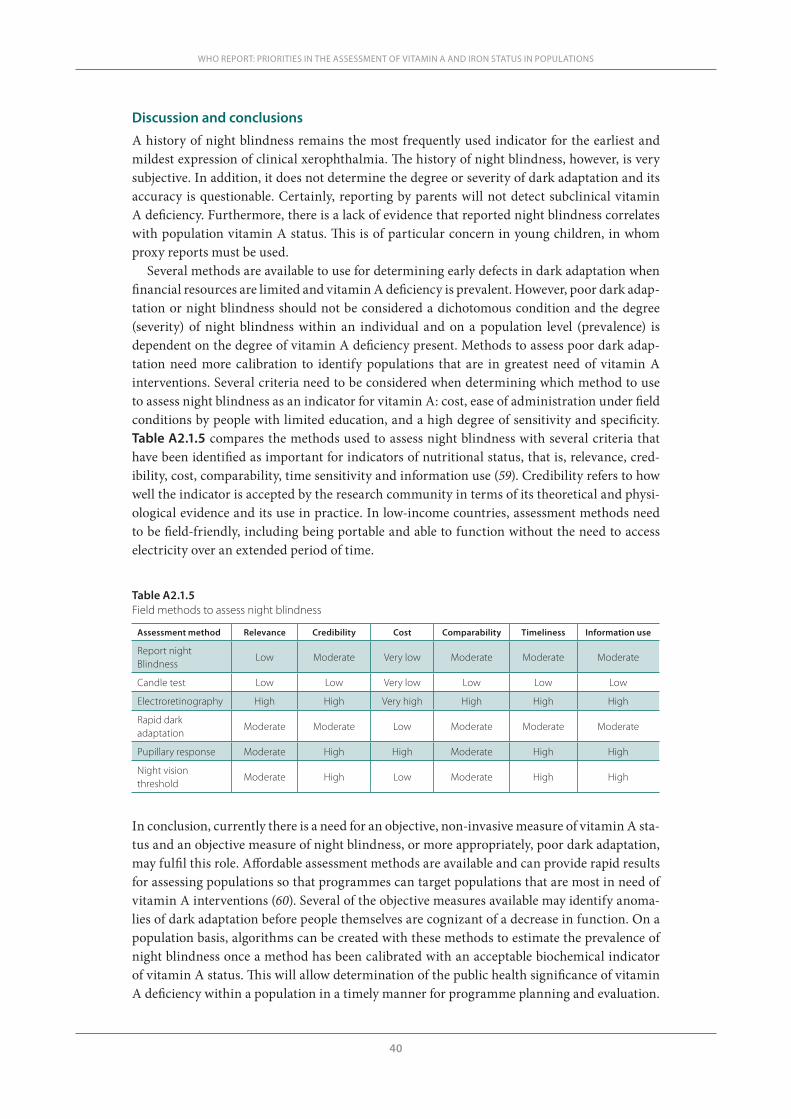
40
WHO REPORT: PRIORITIES IN THE ASSESSMENT OF VITAMIN A AND IRON STATUS IN POPULATIONS
Discussion and conclusions
A history of night blindness remains the most frequently used indicator for the earliest and mildest expression of clinical xerophthalmia. The history of night blindness, however, is very subjective. In addition, it does not determine the degree or severity of dark adaptation and its accuracy is questionable. Certainly, reporting by parents will not detect subclinical vitamin A deficiency. Furthermore, there is a lack of evidence that reported night blindness correlates with population vitamin A status. This is of particular concern in young children, in whom proxy reports must be used.
Several methods are available to use for determining early defects in dark adaptation when financial resources are limited and vitamin A deficiency is prevalent. However, poor dark adap-tation or night blindness should not be considered a dichotomous condition and the degree (severity) of night blindness within an individual and on a population level (prevalence) is dependent on the degree of vitamin A deficiency present. Methods to assess poor dark adap-tation need more calibration to identify populations that are in greatest need of vitamin A interventions. Several criteria need to be considered when determining which method to use to assess night blindness as an indicator for vitamin A: cost, ease of administration under field conditions by people with limited education, and a high degree of sensitivity and specificity. Table A2.1.5 compares the methods used to assess night blindness with several criteria that have been identified as important for indicators of nutritional status, that is, relevance, cred-ibility, cost, comparability, time sensitivity and information use (59). Credibility refers to how well the indicator is accepted by the research community in terms of its theoretical and physi-ological evidence and its use in practice. In low-income countries, assessment methods need to be field-friendly, including being portable and able to function without the need to access electricity over an extended period of time.
Table A2.1.5Field methods to assess night blindness
Assessment method Relevance Credibility Cost Comparability Timeliness Information use
Report night Blindness
Low Moderate Very low Moderate Moderate Moderate
Candle test Low Low Very low Low Low Low
Electroretinography High High Very high High High High
Rapid dark adaptation
Moderate Moderate Low Moderate Moderate Moderate
Pupillary response Moderate High High Moderate High High
Night vision threshold
Moderate High Low Moderate High High
In conclusion, currently there is a need for an objective, non-invasive measure of vitamin A sta-tus and an objective measure of night blindness, or more appropriately, poor dark adaptation, may fulfil this role. Affordable assessment methods are available and can provide rapid results for assessing populations so that programmes can target populations that are most in need of vitamin A interventions (60). Several of the objective measures available may identify anoma-lies of dark adaptation before people themselves are cognizant of a decrease in function. On a population basis, algorithms can be created with these methods to estimate the prevalence of night blindness once a method has been calibrated with an acceptable biochemical indicator of vitamin A status. This will allow determination of the public health significance of vitamin A deficiency within a population in a timely manner for programme planning and evaluation.
41
References1. Campbell AA et al. Indonesian women of childbearing age are at greater risk of clinical vitamin A de-
ficiency in families that spend more on rice and less on fruit and vegetables and animal-based foods. Nutrition Research, 2009, 29:75–81.
2. Tielsch JM et al. Maternal night blindness during pregnancy is associated with low birthweight, morbid-ity, and poor growth in south India. Journal of Nutrition, 2008, 138:787–792.
3. Katz J et al. Risk factors for maternal night blindness in rural south India. Ophthalmic Epidemiology, 2009, 16:163–197.
4. Indicators for assessing vitamin A deficiency and their application in monitoring and evaluating interven-tion programmes. Geneva, World Health Organization, 1996.
5. Carr RE. The night-blindness disorders. International Ophthalmology Clinics, 1969, 9:971–1003.6. Ripps H. Night blindness and the retinal mechanism of visual adaptation. Annals of the Royal College of
Surgeons of England, 1975, 58:222–232.7. Ripss H. Night blindness revisited: from man to molecules. Investigations in Ophthalmology and Vision
Science, 1982, 23:588–609.8. Dowling JE, Wald G. Vitamin A deficiency and night blindness. Biochemistry, 1958, 44:648–661.9. Wald G. The molecular basis of visual excitation. Science, 1968, 162:230–239.10. Kemp CM, Jacobson SG, Faulkner DJ. Visual function and rhodopsin levels in humans with vitamin A
deficiency. Experimental Eye Research, 1988, 46:185–197. 11. Apushkin MA, Fishman GA. Improvement in visual function and fundus findings for a patient with
vitamin A-deficient retinopathy. Retina, The Journal of Retinal and Vitreous Diseases, 2005, 25:652.12. Fells P, Bors F. Ocular complications of self-induced vitamin A deficiency. Transactions of the Ophthal-
mogical Societies of the United Kingdom, 1970, 89:221–228.13. Weschler HL. Vitamin A deficiency following small-bowel bypass surgery for obesity. Archives of Der-
matology, 1979, 115:73–75.14. Halsted CH. Nutrition and alcoholic liver disease. Seminars in Liver Disease, 2004, 24:289–304.15. Roncone DP. Xerophthalmia secondary to alcohol-induced malnutrition. Optometry, 2006, 77:124–133.16. Jacobson SG et al. Night blindness in Sorsby’s fundus dystrophy reversed by vitamin A. Nature Genetics,
1995, 11:27–32.17. Wasantwisut E. Recommendations for monitoring and evaluating vitamin A programs: outcome indi-
cators. Journal of Nutrition, 2002, 132:2940S–2942S.18. Stoll BJ et al. Nightblindness and vitamin A deficiency in children attending a diarrheal disease hospital
in Bangladesh. Journal of Tropical Pediatrics, 1985, 31:36–39.19. Upadhyay MP et al. Xerophthalmia among Nepalese children. American Journal of Epidemiology, 1985,
121:71–77.20. Cohen N et al. Impact of massive doses of vitamin A on nutritional blindness in Bangladesh. American
Journal of Clinical Nutrition, 1987, 45:970–976.21. Asrat YT, Omwega AM, Muita JWG. Prevalence of vitamin A deficiency among pre-school and school-
age children in Arssi zone, Ethiopia. East African Medical Journal, 2002, 7:355–359.22. Arlappa N et al. Clinical and sub-clinical vitamin A deficiency among rural pre-school children in Ma-
harashtra, India. Annals of Human Biology, 2008, 35:606–614.23. Christian P. Recommendations for indicators: night blindness during pregnancy – a simple tool to as-
sess vitamin A deficiency in a population. Journal of Nutrition, 2002, 132:2884s–2888s.24. Singh V, West KP. Vitamin A deficiency and xerophthalmia among school-aged children in southeast-
ern Asia. European Journal of Clinical Nutrition, 1983, 58:1342–1349.25. Samba C et al. Prevalence of infant vitamin A deficiency and undernutrition in the Republic of Congo.
Acta Tropica, 2006, 97:270–283.26. Katz J et al. Night blindness is prevalent during pregnancy and lactation in rural Nepal. Journal of Nutri-
tion, 1995, 125:2122–2127.27. Hussain A, Kvåle G, Odland M. Diagnosis of night blindness and serum vitamin A level: a population-
based study. Bulletin of the World Health Organization, 1995, 73:469–476.28. Christian P et al. An ethnographic study of night blindness “ratauni” among women in the Terai of
Nepal. Social Science and Medicine, 1998, 46:879–889.29. Sommer A et al. History of night blindness: a simple tool for xerophthalmia screening. American Journal
of Clinical Nutrition, 1980, 33:887–891.
A2.1 ASSESSING NIGHT BLINDNESS AS AN INDICATOR FOR VITAMIN A DEFICIENCY
42
WHO REPORT: PRIORITIES IN THE ASSESSMENT OF VITAMIN A AND IRON STATUS IN POPULATIONS
30. Schémann JF et al. National immunisation days and vitamin A distribution in Mali: has the vitamin A status of pre-school children improved? American College of Nutrition, 2002, 6:233–240.
31. Congdon N et al. Pupillary and visual thresholds in young children as an index of population vitamin A status. American Journal of Clinical Nutrition, 1995, 61:1076–1082.
32. Sanchez AM et al. Pupillary threshold as an index of population vitamin A status among children in India. American Journal of Clinical Nutrition, 1997, 65:61–66.
33. Haskell MJ et al. Recovery from impaired dark adaptation in nightblind pregnant Nepali women who receive small daily doses of vitamin A as amaranth leaves, carrots, goat liver, vitamin A-fortified rice or retinyl palmitate. American Journal of Clinical Nutrition, 2005, 81:467–471.
34. Taren DL et al. The Night Vision Threshold Test is a better predictor of low serum vitamin A concentra-tions than self-reported night blindness in urban Nepalese pregnant women. Journal of Nutrition, 2004, 134:2573–2578.
35. Taren DL et al. Utility and validity of the Night Vision Threshold Test (NVTT) in rural Nepalese health posts to screen pregnant women for night blindness. In: Proceedings of the Micronutrient Forum: Con-sequences and Control of Micronutrient Deficiencies. Science Policies and Programs. Defining the Issues. 16–18 April 2007, Istanbul, Turkey. Washington, DC, US Agency for International Development, 2007.
36. Wedner SH et al. Validation of night blindness reports among children and women in a vitamin A defi-cient population in rural Tanzania. European Journal of Clinical Nutrition, 2004, 58:409–419.
37. Oso OO et al. Vitamin A status and nutritional intake of carotenoids of preschool children in Ijaye Orile community in Nigeria. Journal of Tropical Pediatrics, 2003, 49:42–47.
38. Schémann JF et al. Prevalence of undernutrition and vitamin A deficiency in the Dogon region, Mali. Journal of the American College of Nutrition, 2002, 5:381–387.
39. Pereira SM, Begum A, Dumm ME. Vitamin A deficiency and kwashiorkor. American Journal of Clinical Nutrition, 1966, 19:182–186.
40. Jiang J-X et al. Vitamin A deficiency and child feeding in Beijing and Guizhou, China. World Journal of Pediatrics, 2008, 4:20–25.
41. Woodruff BA et al. Anaemia, iron status and vitamin A deficiency among adolescent refugees in Kenya and Nepal. Public Health Nutrition, 2006, 9:26–34.
42. Radhika MS et al. Effects of vitamin A deficiency during pregnancy and on maternal and child health. International Journal of Obstetrics and Gynecology, 2002, 109:689–693.
43. Mathenge W et al. Vitamin A deficiency in a Kenyan prison. Tropical Medicine and International Health, 2007, 12:269–273.
44. Bergen HR et al. Vitamin A and vitamin E status of rural preschool children in West Java, Indonesia, and their response to oral doses of vitamin A and of vitamin E. American Journal of Clinical Nutrition, 1988, 48:279–285.
45. Maqsood M et al. Vitamin A deficiency and inflammatory markers among preschool children in the Republic of the Marshall Islands. Nutrition Journal, 2004, 3:21.
46. West KP, Mehra S. Vitamin A intake and status in populations facing economic stress. Journal of Nutri-tion, 2010, 140:201S–207S.
47. Harman NP. Shamming night-blindness. In: William CHM, ed. Manual of the diseases of the eye. New York, NY, Wood and Company, 1905.
48. Lam BL, ed. Electrophysiology of vision. Clinical testing and applications. Boca Raton, FL, Taylor and Francis, 2005.
49. Wachtmeister L et al. Attempts to define the minimal serum level of vitamin A required for normal vi-sion function in a patient with severe malabsorption. Acta Opthalmologica, 1988, 66:341–348.
50. Barber C et al. Dark adaptation compared with electrooculography in primary biliary cirrhosis. Docu-menta Ophthalmologica, 1989, 71:397–402.
51. Patel P, Gopaldas T, Pant I. A simple field test for identification of night blindness. Indian Journal of Pediatrics, 1989, 56:201–206.
52. Russell RM et al. Dark-adaptation testing for diagnosis of subclinical vitamin A deficiency and evalua-tion of therapy. Lancet, 1973, 2:1161–1164.
53. Thornton SP. A rapid test for dark adaptation. Annals of Ophthalmology, 1981, 9:731–734.54. Solomons NWRRM, Vinton EGAM, Mejia L. Application of a rapid dark adaptation test in children.
Journal of Pediatric Gastroenterology and Nutrition, 1982, 4:571–574.55. Congdon NG et al. Responsiveness of dark-adaptation threshold to vitamin A and β-carotene supple-
mentation in pregnant and lactating women in Nepal. American Journal of Clinical Nutrition, 2000, 72:1004–1009.
43
56. Duncan B et al. The Night Vision Threshold Test (NVTT): a simple instrument for testing dark adapta-tion in young children. Journal of Tropical Pediatrics, 2000, 46:30–35.
57. Shrestha AK et al. A new, simple, inexpensive means of testing functional vitamin A status: the night vi-sion threshold test (NVTT). A preliminary field-test report. Journal of Tropical Pediatrics, 2000, 46:352–356.
58. Taren DL et al. Initial severity of night blindness modifies response to four weekly doses of 25,000 IU of vitamin A in bight blind pregnant women. In: Proceedings of the Micronutrient Forum: Consequences and Control of Micronutrient Deficiencies. Science Policies and Programs. Defining the Issues. 16–18 April 2007, Istanbul, Turkey. Washington, DC, US Agency for International Development, 2007.
59. Rely F et al. Food security indicators and framework for use in the monitoring and evaluation of food aid programs. Washington, DC, Academy for Educational Development, 1999.
60. Latham M. The great vitamin A fiasco. World Nutrition, 2010, 1:12–43.
A2.1 ASSESSING NIGHT BLINDNESS AS AN INDICATOR FOR VITAMIN A DEFICIENCY
44
WHO REPORT: PRIORITIES IN THE ASSESSMENT OF VITAMIN A AND IRON STATUS IN POPULATIONS
A2.2 Biomarkers of vitamin A status: what do they mean?Sherry A. Tanumihardjo
University of Wisconsin-Madison, Department of Nutritional Sciences, Madison, Wisconsin, United States of America
Corresponding author: Sherry A. Tanumihardjo; [email protected]
Suggested citation: Tanumihardjo SA. Biomarkers of vitamin A status: what do they mean? In: World Health Organization. Report: Priorities in the assessment of vitamin A and iron status in populations, Panama City, Panama, 15–17 September 2010. Geneva, World Health Organization, 2012.
Abstract
n Vitamin A is essential for growth, reproduction and immunity. Biomarkers of vitamin A status are diverse, in part, due to its functions. Liver reserves of vitamin A are considered the gold standard but this measure is not feasible for population evaluation. Biomarkers of status can be grouped into two categories: (1) biological, functional and histological indicators; and (2) biochemical indicators. Historically, signs of xerophthalmia were used to determine vita-min A deficiency. Before overt clinical damage to the eye, individuals with vitamin A deficien-cy are plagued by night blindness and longer vision restoration times. Surrogate biochemical measures of vitamin A status, as defined by liver reserves, have been developed. Serum retinol concentration is a common method used to evaluate vitamin A deficiency, but it is homeo-statically controlled until liver reserves become dangerously low. Therefore, other biochemical methods that respond to liver reserves in the marginal category have been developed, such as dose response tests and isotope dilution assays. Dose response tests work on the principle that as liver reserves become depleted, apo-retinol-binding protein builds up in the liver. A chal-lenge dose of vitamin A binds to this protein and serum concentrations increase within a few hours if liver vitamin A is low. Isotope dilution assays use stable isotopes to trace total body reserves of vitamin A. Different biomarkers have utility across a range of liver values.
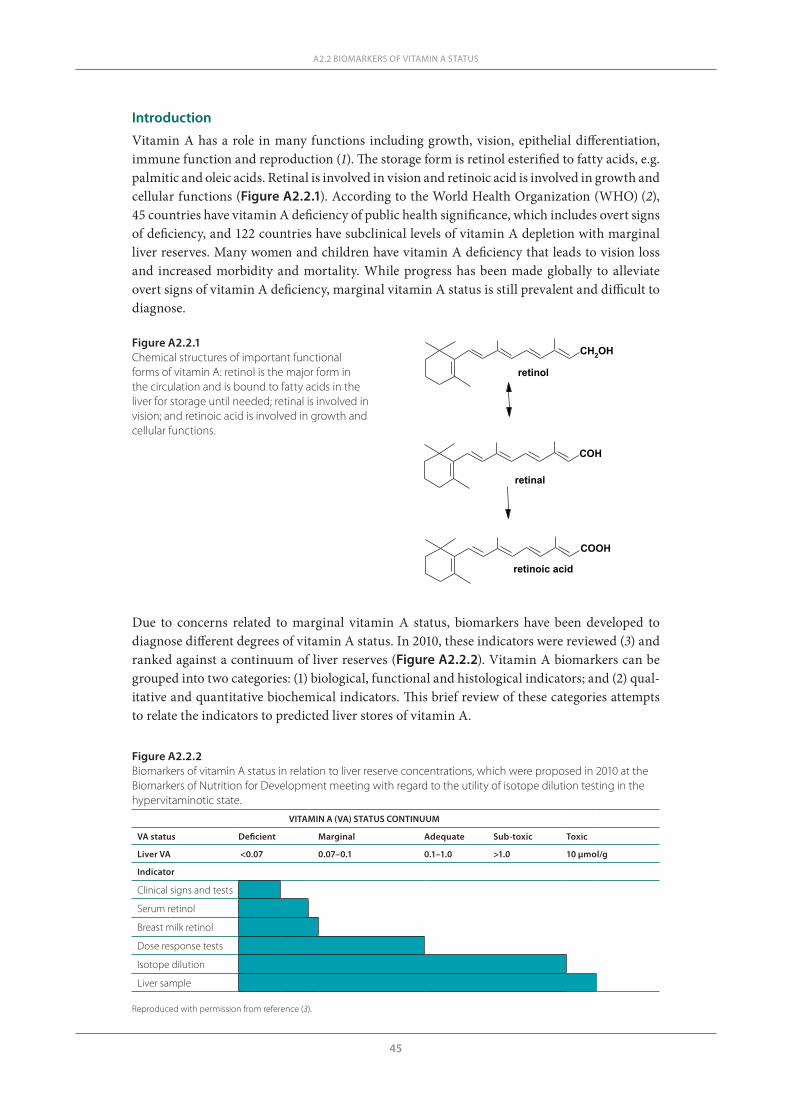
45
A2.2 BIOMARKERS OF VITAMIN A STATUS
Introduction
Vitamin A has a role in many functions including growth, vision, epithelial differentiation, immune function and reproduction (1). The storage form is retinol esterified to fatty acids, e.g. palmitic and oleic acids. Retinal is involved in vision and retinoic acid is involved in growth and cellular functions (Figure A2.2.1). According to the World Health Organization (WHO) (2), 45 countries have vitamin A deficiency of public health significance, which includes overt signs of deficiency, and 122 countries have subclinical levels of vitamin A depletion with marginal liver reserves. Many women and children have vitamin A deficiency that leads to vision loss and increased morbidity and mortality. While progress has been made globally to alleviate overt signs of vitamin A deficiency, marginal vitamin A status is still prevalent and difficult to diagnose.
CH2OH
COH
COOH
retinol
retinal
retinoic acid
Figure A2.2.1Chemical structures of important functional forms of vitamin A: retinol is the major form in the circulation and is bound to fatty acids in the liver for storage until needed; retinal is involved in vision; and retinoic acid is involved in growth and cellular functions.
Due to concerns related to marginal vitamin A status, biomarkers have been developed to diagnose different degrees of vitamin A status. In 2010, these indicators were reviewed (3) and ranked against a continuum of liver reserves (Figure A2.2.2). Vitamin A biomarkers can be grouped into two categories: (1) biological, functional and histological indicators; and (2) qual-itative and quantitative biochemical indicators. This brief review of these categories attempts to relate the indicators to predicted liver stores of vitamin A.
Figure A2.2.2Biomarkers of vitamin A status in relation to liver reserve concentrations, which were proposed in 2010 at the Biomarkers of Nutrition for Development meeting with regard to the utility of isotope dilution testing in the hypervitaminotic state.
VITAMIN A (VA) STATUS CONTINUUM
VA status Deficient Marginal Adequate Sub-toxic Toxic
Liver VA <0.07 0.07–0.1 0.1–1.0 >1.0 10 μmol/g
Indicator
Clinical signs and tests
Serum retinol
Breast milk retinol
Dose response tests
Isotope dilution
Liver sample
Reproduced with permission from reference (3).
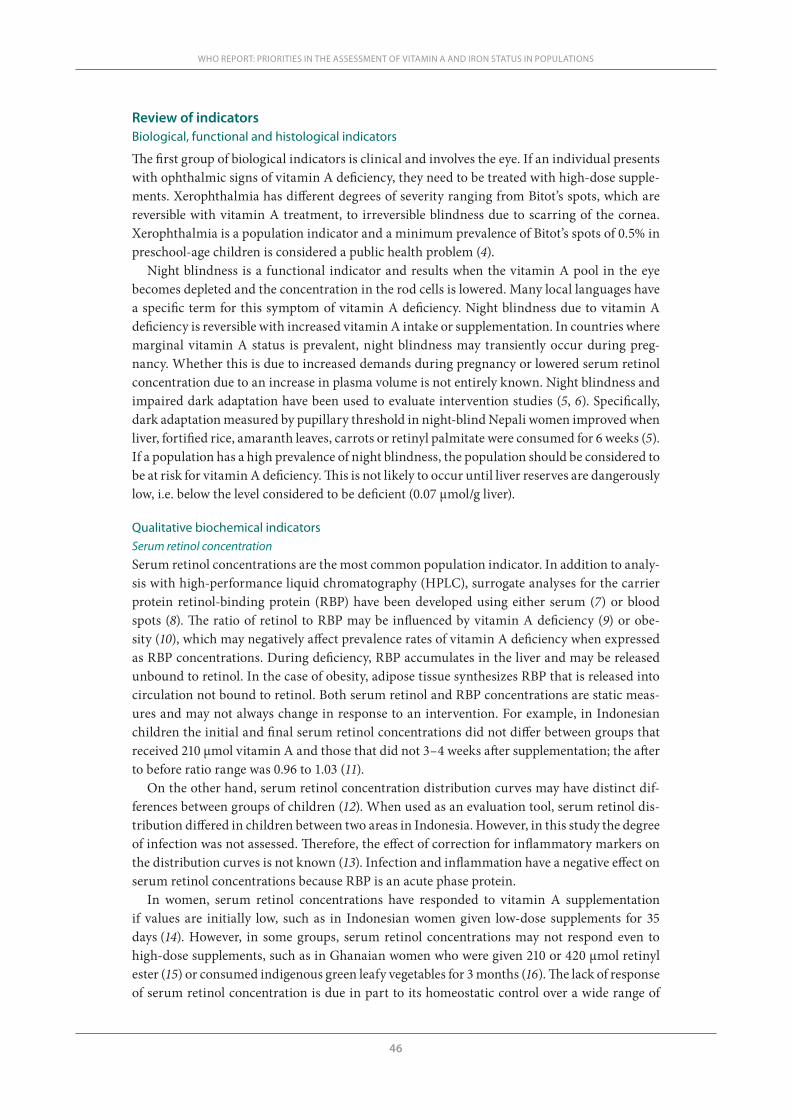
46
WHO REPORT: PRIORITIES IN THE ASSESSMENT OF VITAMIN A AND IRON STATUS IN POPULATIONS
Review of indicatorsBiological, functional and histological indicators
The first group of biological indicators is clinical and involves the eye. If an individual presents with ophthalmic signs of vitamin A deficiency, they need to be treated with high-dose supple-ments. Xerophthalmia has different degrees of severity ranging from Bitot’s spots, which are reversible with vitamin A treatment, to irreversible blindness due to scarring of the cornea. Xerophthalmia is a population indicator and a minimum prevalence of Bitot’s spots of 0.5% in preschool-age children is considered a public health problem (4).
Night blindness is a functional indicator and results when the vitamin A pool in the eye becomes depleted and the concentration in the rod cells is lowered. Many local languages have a specific term for this symptom of vitamin A deficiency. Night blindness due to vitamin A deficiency is reversible with increased vitamin A intake or supplementation. In countries where marginal vitamin A status is prevalent, night blindness may transiently occur during preg-nancy. Whether this is due to increased demands during pregnancy or lowered serum retinol concentration due to an increase in plasma volume is not entirely known. Night blindness and impaired dark adaptation have been used to evaluate intervention studies (5, 6). Specifically, dark adaptation measured by pupillary threshold in night-blind Nepali women improved when liver, fortified rice, amaranth leaves, carrots or retinyl palmitate were consumed for 6 weeks (5). If a population has a high prevalence of night blindness, the population should be considered to be at risk for vitamin A deficiency. This is not likely to occur until liver reserves are dangerously low, i.e. below the level considered to be deficient (0.07 µmol/g liver).
Qualitative biochemical indicatorsSerum retinol concentration Serum retinol concentrations are the most common population indicator. In addition to analy-sis with high-performance liquid chromatography (HPLC), surrogate analyses for the carrier protein retinol-binding protein (RBP) have been developed using either serum (7) or blood spots (8). The ratio of retinol to RBP may be influenced by vitamin A deficiency (9) or obe-sity (10), which may negatively affect prevalence rates of vitamin A deficiency when expressed as RBP concentrations. During deficiency, RBP accumulates in the liver and may be released unbound to retinol. In the case of obesity, adipose tissue synthesizes RBP that is released into circulation not bound to retinol. Both serum retinol and RBP concentrations are static meas-ures and may not always change in response to an intervention. For example, in Indonesian children the initial and final serum retinol concentrations did not differ between groups that received 210 μmol vitamin A and those that did not 3–4 weeks after supplementation; the after to before ratio range was 0.96 to 1.03 (11).
On the other hand, serum retinol concentration distribution curves may have distinct dif-ferences between groups of children (12). When used as an evaluation tool, serum retinol dis-tribution differed in children between two areas in Indonesia. However, in this study the degree of infection was not assessed. Therefore, the effect of correction for inflammatory markers on the distribution curves is not known (13). Infection and inflammation have a negative effect on serum retinol concentrations because RBP is an acute phase protein.
In women, serum retinol concentrations have responded to vitamin A supplementation if values are initially low, such as in Indonesian women given low-dose supplements for 35 days (14). However, in some groups, serum retinol concentrations may not respond even to high-dose supplements, such as in Ghanaian women who were given 210 or 420 μmol retinyl ester (15) or consumed indigenous green leafy vegetables for 3 months (16). The lack of response of serum retinol concentration is due in part to its homeostatic control over a wide range of
47
liver reserves. For example, in rats given three different levels of daily vitamin A supplements, serum retinol concentrations did not differ despite a sixfold difference in liver reserves of vita-min A (17).
Serum retinol is not a reflection of the vitamin A liver stores because it is homeostatically controlled and it does not drop until liver reserves are very low. The cut-off value for defini-tion of deficiency has been discussed. In children certainly values <0.35 μmol/L and in women 0.70 μmol/L may indicate deficiency. However, if no infection is present in the population under study, 0.70 and 1.05 μmol/L for children and women, respectively, may be more descriptive of the actual status. If the population has access to a source of preformed vitamin A, serum retinol concentrations will be higher but not necessarily reflective of status. For example, in rats given a small daily dose of preformed retinol, serum retinol was normal at 1.37 ± 0.21 μmol/L even though liver reserves were extremely low at 0.005 μmol/g liver (18). The current widely accepted cut-off for deficient liver reserves is <0.07 μmol/g liver and a recent evaluation of animal data suggests that this should be raised to 0.1 μmol/g liver (discussed below).
As a population assessment tool, markers of inflammation should be used to adjust the serum retinol concentration. An analysis using sandwich enzyme-linked immunosorbent assays was able to quantify ferritin, transferrin receptor, RBP and C-reactive protein in a 30 μL serum sample (19). Considering the limitations of serum retinol as a reflector of status, an inexpensive assay for RBP linked with inflammation markers may be more practical even if it overestimates values because of the circulating unbound plasma RBP in individuals who are deficient.
Breast milk retinol concentrationBreast milk retinol concentration is a unique indicator in lactating women (20) with potential extrapolation to the nursing infant. Breast milk retinol concentrations can be used as an evalu-ation tool in groups of lactating women, although the response to supplementation was found to be modest in a sample of Kenyan mothers (21). As a biomarker, breast milk retinol concen-trations may reflect recent dietary intake and not necessarily be a reflection of vitamin A status, as shown in rats (22) and swine (23). A comparison between vitamin A indicators suggests that casual breast milk retinol may perform better when corrected for fat content (24). Breast milk fat content and the fact that most retinol is esterified to fatty acids necessitate the use of saponification for analysis before HPLC. This requires special analytical considerations (20).
Quantitative biochemical indicators
Indirect semi-quantitative and quantitative methods include dose response and isotope dilu-tion tests. Dose response tests have utility from deficiency through to the adequate range of vitamin A liver reserves. However, they probably do not quantitatively reflect status above the adequate range. Isotope dilution tests give a quantitative estimate of liver reserves from defi-ciency through to toxic vitamin A status (Figure A2.2.2).
Dose response testsDose response tests work on the principle that as vitamin A liver reserves become low, RBP accumulates. In rats fed a vitamin A-deficient diet, apo-RBP accumulated in the liver before serum retinol concentrations decreased and the liver was depleted (25). Thus, when a challenge dose of retinyl or 3, 4-didehydroretinyl ester is administered, the retinol or 3,4-didehydroreti-nol binds to this accumulated RBP and is rapidly released into the serum. The recommended dose for the relative dose response (RDR) test is 1 mg of retinyl ester dissolved in oil (12). Two blood samples are collected, i.e. the first one at baseline and another one 5 hours after dosing.
A2.2 BIOMARKERS OF VITAMIN A STATUS
48
WHO REPORT: PRIORITIES IN THE ASSESSMENT OF VITAMIN A AND IRON STATUS IN POPULATIONS
The RDR value, which is expressed in per cent, is calculated as follows:
[(A5 – A0)/A5]*100
Where: A5 is the serum retinol concentration at 5 hours post-dosing A0 is the serum retinol concentration at baseline
If the per cent difference is >20%, the individual probably has deficient liver reserves <0.07 μmol/g liver.
While the RDR test is more descriptive than serum retinol concentrations alone, the test is somewhat invasive because it requires two blood samples from the same individual within a 5-hour interval. Furthermore, an accurate RDR value is dependent on correct analysis and consistent retinol recovery from both serum samples. Therefore, the modified relative dose response (MRDR) test was developed by Tanumihardjo et al. (26–28) and applied to humans (28–30). The test was refined by establishing standard doses of the test dose dependent on the age group and suggesting a range of response times to obtain the blood sample (31). The test works on the same principle as the RDR test, but because the 3, 4-didehydroretinol analogue is administered instead of retinol, a single blood sample can be taken. HPLC easily separates 3, 4-didehydroretinol from retinol in the same sample. Endogenous concentrations of 3, 4- didehydroretinol are low in humans and therefore a baseline blood sample is not needed. A distinguishing response between depleted and sufficient liver reserves can be measured in as little as 4 hours and has been validated in animals against liver vitamin A reserves (26–28, 32). After the serum sample has been analysed, the 3, 4-didehydroretinol to retinol molar ratio is calculated, sometimes referred to as the MRDR value. A cut-off of 3, 4-didehydroretinol to retinol >0.060 usually suggests low liver reserves of retinol that can be corrected with vitamin A supplementation (11, 33).
The MRDR test has been applied in several countries in order to evaluate population status, response to interventions and prevalence of low liver reserves in surveys. One of the first com-parisons was done in two groups of Indonesian preschool-age children (12). In one group, the distribution of values approached a normal distribution, while the MRDR values were quite disparate with a value of 0.83 in one female subject. The application of the MRDR test in a study of combined treatment with vitamin A and albendazole for deworming children infected with Ascaris lumbricoides showed significant improvement in the mean 3, 4-didehydroretinol to retinol ratio of 0.055 ± 0.042 before supplementation to a ratio of 0.033 ± 0.017 after supple-mentation (P < 0.0001) (11). This magnitude of difference was not seen with serum retinol con-centrations. In another evaluative study of children with helminthic infections, the MRDR test correctly identified children who had received a vitamin A supplement from the local health post (33). The MRDR values were 0.021 ± 0.012 and 0.054 ± 0.038 in the children who did and did not receive the supplement, respectively. Serum retinol concentrations did not differ between those who had received the supplement and those who had not, and nor did the serum retinol concentrations respond to treatment.
The MRDR test gives more information than serum retinol concentrations alone. For exam-ple, in a group of rural lactating women in Ghana, baseline serum retinol concentrations and MRDR values were 1.4 ± 0.5 μmol/L and 0.048 ± 0.037, respectively (15). After treatment with either 210 or 420 μmol retinyl ester, a significant improvement in vitamin A status occurred as assessed by the MRDR test (P < 0.0001), but serum retinol concentrations did not differ (P = 0.87). Furthermore, in an urban group of Ghanaian lactating women, the baseline serum retinol concentration was 1.5 ± 0.6 μmol/L and the MRDR value was 0.09 ± 0.05 (16), indicating a much poorer vitamin A status in these women compared with the rural women even though the serum retinol concentrations were identical. After use of an intervention with indigenous African green leaves, serum retinol concentrations did not change or differ during the study
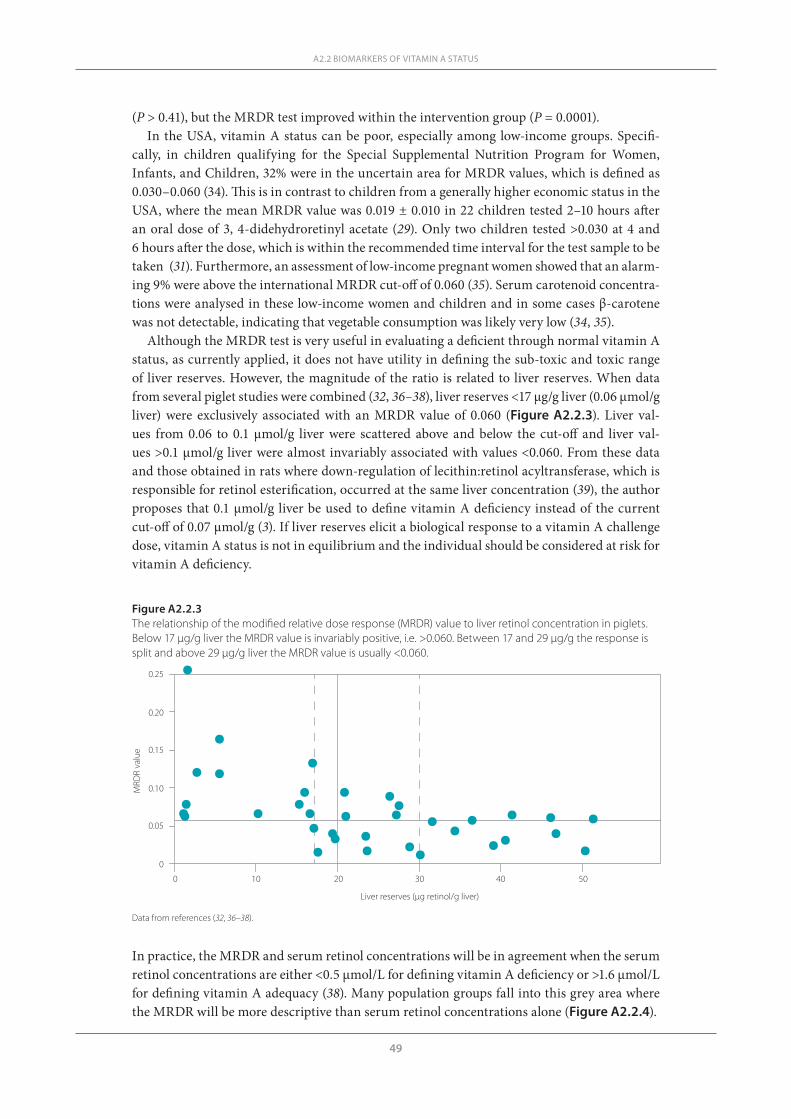
49
(P > 0.41), but the MRDR test improved within the intervention group (P = 0.0001). In the USA, vitamin A status can be poor, especially among low-income groups. Specifi-
cally, in children qualifying for the Special Supplemental Nutrition Program for Women, Infants, and Children, 32% were in the uncertain area for MRDR values, which is defined as 0.030–0.060 (34). This is in contrast to children from a generally higher economic status in the USA, where the mean MRDR value was 0.019 ± 0.010 in 22 children tested 2–10 hours after an oral dose of 3, 4-didehydroretinyl acetate (29). Only two children tested >0.030 at 4 and 6 hours after the dose, which is within the recommended time interval for the test sample to be taken (31). Furthermore, an assessment of low-income pregnant women showed that an alarm-ing 9% were above the international MRDR cut-off of 0.060 (35). Serum carotenoid concentra-tions were analysed in these low-income women and children and in some cases β-carotene was not detectable, indicating that vegetable consumption was likely very low (34, 35).
Although the MRDR test is very useful in evaluating a deficient through normal vitamin A status, as currently applied, it does not have utility in defining the sub-toxic and toxic range of liver reserves. However, the magnitude of the ratio is related to liver reserves. When data from several piglet studies were combined (32, 36–38), liver reserves <17 μg/g liver (0.06 μmol/g liver) were exclusively associated with an MRDR value of 0.060 (Figure A2.2.3). Liver val-ues from 0.06 to 0.1 μmol/g liver were scattered above and below the cut-off and liver val-ues >0.1 μmol/g liver were almost invariably associated with values <0.060. From these data and those obtained in rats where down-regulation of lecithin:retinol acyltransferase, which is responsible for retinol esterification, occurred at the same liver concentration (39), the author proposes that 0.1 μmol/g liver be used to define vitamin A deficiency instead of the current cut-off of 0.07 μmol/g (3). If liver reserves elicit a biological response to a vitamin A challenge dose, vitamin A status is not in equilibrium and the individual should be considered at risk for vitamin A deficiency.
A2.2 BIOMARKERS OF VITAMIN A STATUS
Figure A2.2.3The relationship of the modified relative dose response (MRDR) value to liver retinol concentration in piglets. Below 17 μg/g liver the MRDR value is invariably positive, i.e. >0.060. Between 17 and 29 μg/g the response is split and above 29 μg/g liver the MRDR value is usually <0.060.
Liver reserves (µg retinol/g liver)
0
0.05
0.10
0.15
0.20
0.25
MRD
R va
lue
0 10 20 30 40 50
In practice, the MRDR and serum retinol concentrations will be in agreement when the serum retinol concentrations are either <0.5 μmol/L for defining vitamin A deficiency or >1.6 μmol/L for defining vitamin A adequacy (38). Many population groups fall into this grey area where the MRDR will be more descriptive than serum retinol concentrations alone (Figure A2.2.4).
Data from references (32, 36–38).
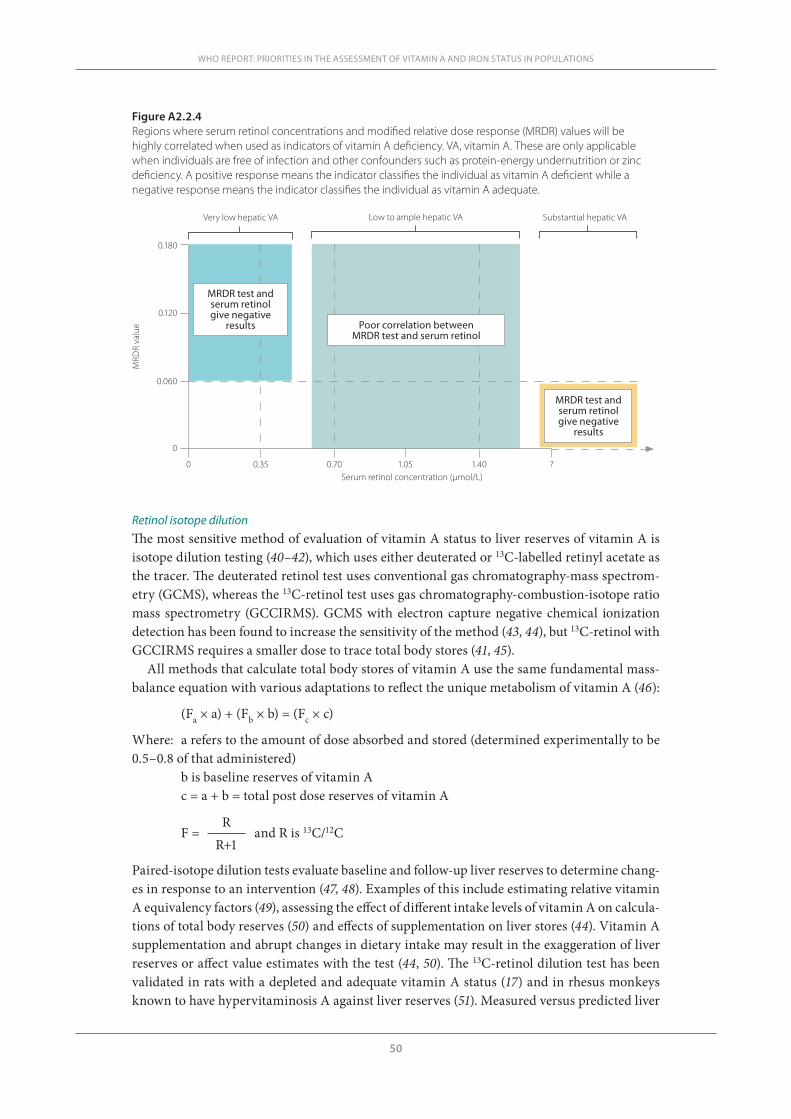
50
WHO REPORT: PRIORITIES IN THE ASSESSMENT OF VITAMIN A AND IRON STATUS IN POPULATIONS
Retinol isotope dilution The most sensitive method of evaluation of vitamin A status to liver reserves of vitamin A is isotope dilution testing (40–42), which uses either deuterated or 13C-labelled retinyl acetate as the tracer. The deuterated retinol test uses conventional gas chromatography-mass spectrom-etry (GCMS), whereas the 13C-retinol test uses gas chromatography-combustion-isotope ratio mass spectrometry (GCCIRMS). GCMS with electron capture negative chemical ionization detection has been found to increase the sensitivity of the method (43, 44), but 13C-retinol with GCCIRMS requires a smaller dose to trace total body stores (41, 45).
All methods that calculate total body stores of vitamin A use the same fundamental mass-balance equation with various adaptations to reflect the unique metabolism of vitamin A (46):
(Fa × a) + (Fb × b) = (Fc × c)
Where: a refers to the amount of dose absorbed and stored (determined experimentally to be 0.5–0.8 of that administered)
b is baseline reserves of vitamin A c = a + b = total post dose reserves of vitamin A
R F = and R is 13C/12C R+1
Paired-isotope dilution tests evaluate baseline and follow-up liver reserves to determine chang-es in response to an intervention (47, 48). Examples of this include estimating relative vitamin A equivalency factors (49), assessing the effect of different intake levels of vitamin A on calcula-tions of total body reserves (50) and effects of supplementation on liver stores (44). Vitamin A supplementation and abrupt changes in dietary intake may result in the exaggeration of liver reserves or affect value estimates with the test (44, 50). The 13C-retinol dilution test has been validated in rats with a depleted and adequate vitamin A status (17) and in rhesus monkeys known to have hypervitaminosis A against liver reserves (51). Measured versus predicted liver
Figure A2.2.4Regions where serum retinol concentrations and modified relative dose response (MRDR) values will be highly correlated when used as indicators of vitamin A deficiency. VA, vitamin A. These are only applicable when individuals are free of infection and other confounders such as protein-energy undernutrition or zinc deficiency. A positive response means the indicator classifies the individual as vitamin A deficient while a negative response means the indicator classifies the individual as vitamin A adequate.
0.180
0.120
0.060
0
0 0.35 0.70 1.05 1.40 ?
MRD
R va
lue
Serum retinol concentration (µmol/L)
Very low hepatic VA Low to ample hepatic VA Substantial hepatic VA
MRDR test and serum retinol give negative
results
MRDR test and serum retinol give negative
results Poor correlation between MRDR test and serum retinol
51
reserves in these monkeys revealed a linear relationship and all the monkeys were diagnosed as having hypervitaminosis A by the predicted values (41).
Although isotope dilution testing is usually too expensive to consider as a means to evaluate a programme, a sugar-fortification programme was evaluated in a small group of Nicaraguan children (52). The baseline mean liver retinol concentration was 0.57 μmol/g liver, well above what is currently considered deficient (0.07 μmol/g liver). All the children had serum retinol concentrations between 0.74 and 1.31 μmol/L. One year after sugar fortification was imple-mented, liver reserve concentrations increased to an average of 1.2 μmol/g liver. In 9 of 21 children, liver vitamin A concentrations were calculated to be >1.05 μmol/g liver after fortifica-tion, which was defined as toxic in 1990 (53). Because many foods are now being considered for fortification, this sensitive methodology may have to be used, as no other method except liver biopsy is able to diagnose hypervitaminosis A.
Considering the validation in monkeys and these results in children, isotope methodol-ogy can be useful in defining the hypervitaminotic range of liver reserves. Specifically, liver reserves >10 μmol/g have been quantified (41). The ramifications of a sub-toxic or toxic vita-min A status in humans are largely not known. Excessive liver reserves have been defined as 0.70–1.05 μmol/g liver and toxic as >1.05 μmol/g in humans (53). However, after sugar fortifi-cation in Nicaragua, many of the children had liver reserves greater than this range (52). The liver vitamin A concentration at which ill health in humans occurs needs to be examined more carefully. Are there ramifications from having a liver reserve that is hovering around 1 μmol/g liver or is the human body able to sequester this level in the liver? Considering the degree of fortification in some developing countries, the improvements in the stability of the fortificants used in formulations and the high consumption of some of these fortified foods, there is a need for further examination of toxicity or hypervitaminosis A.
Discussion and conclusions
Biomarkers of vitamin A status are needed in order to more specifically identify populations at risk for vitamin A deficiency and to evaluate the effectiveness of different interventions. A variety of biomarkers exist because of the multiple functions of vitamin A in the human body. Some biomarkers are more sensitive to changes in liver vitamin A reserves than others. Serum retinol is affected by a number of factors including infection, inflammation and recent dietary intake. The dose response tests are less affected by infection. Serum retinol concentrations and the MRDR test are correlated when serum retinol concentrations are very low or very high. Combining biomarkers will be more descriptive than a single marker in a population. For example, evaluating a group of preschool children in a country may be better described if RBP measurements are taken from a stratified population-representative sample. Then a subset of children could undergo a more robust test, such as the MRDR or isotope dilution, to better describe the RBP distribution. Considering the degree of fortification of commonly consumed foods in some countries, more sensitive methodology, such as isotope dilution, may be needed in the future to evaluate the hypervitaminotic range of liver reserves in population groups.
Acknowledgements
Research by the Tanumihardjo team that is cited in this review was supported by NIHNIDDK 61973, USDA NRI 2003-35200-13754, USDA NRI 2003-35200-05377 and the International Atomic Energy Agency.
A2.2 BIOMARKERS OF VITAMIN A STATUS
52
WHO REPORT: PRIORITIES IN THE ASSESSMENT OF VITAMIN A AND IRON STATUS IN POPULATIONS
References1. Ross SA et al. Retinoids in embryonal development. Physiological Reviews, 2000, 80:1021–1054.2. Global prevalence of vitamin A deficiency in populations at risk 1995–2005. WHO Global Database on
Vitamin A Deficiency. Geneva, World Health Organization, 2009 (http://www.who.int/vmnis/vitamina/en/, accessed December 2010).
3. Tanumihardjo SA. Vitamin A: Biomarkers of nutrition for development. American Journal of Clinical Nutrition, 2011, 94:658S–665S.
4. Indicators for assessing vitamin A deficiency and their application in monitoring and evaluating interven-tion programmes. Geneva, World Health Organization, 1996 (WHO/NUT/96.10).
5. Haskell MJ et al. Recovery from impaired dark adaptation in nightblind pregnant Nepali women who receive small daily doses of vitamin A as amaranth leaves, carrots, goat liver, vitamin A-fortified rice, or retinyl palmitate. American Journal of Clinical Nutrition, 2005, 81:461–471.
6. Graham JM et al. Supplementation with iron and riboflavin enhances dark adaptation response to vita-min A-fortified rice in iron-deficient, pregnant, nightblind Nepali women. American Journal of Clinical Nutrition, 2007, 85:1375–1384.
7. Gamble MV et al. Retinol binding protein as a surrogate measure for serum retinol: studies in vitamin A-deficient children from the Republic of the Marshall Islands. American Journal of Clinical Nutrition, 2001, 73:594–601.
8. Craft NE. Innovative approaches to vitamin A assessment. Journal of Nutrition, 2001, 131:1626S–1630S. 9. Wahed MA et al. Comparison of the modified relative dose response (MRDR) and the relative dose
response (RDR) in the assessment of vitamin A status in malnourished children. American Journal of Clinical Nutrition, 1995, 61:1253–1256.
10. Mills JP, Furr HC, Tanumihardjo SA. Retinol to retinol-binding protein (RBP) is low in obese adults due to elevated apo-RBP. Experimental Biology and Medicine, 2008, 233:1255–1261.
11. Tanumihardjo SA et al. Vitamin A status of Indonesian children infected with Ascaris lumbricoides after dosing with vitamin A supplements and albendazole. Journal of Nutrition, 1996, 126:451–457.
12. Tanumihardjo SA et al. Comparison of vitamin A assessment techniques in children from two Indone-sian villages. American Journal of Clinical Nutrition, 1994, 60:136–141.
13. Thurnham DI et al. Effects of subclinical infection on plasma retinol concentrations and assessment of prevalence of vitamin A deficiency: meta-analysis. Lancet, 2003, 362:2052–2058.
14. Tanumihardjo SA et al. Daily supplements of vitamin A (8.4 mumol; 8000 IU) improve the vitamin A status of lactating Indonesian women. American Journal of Clinical Nutrition, 1996, 63:32–35.
15. Tchum SK et al. Evaluation of vitamin A supplementation regimens in Ghanaian postpartum mothers using the modified-relative-dose-response test. American Journal of Clinical Nutrition, 2006, 84:1344–1349.
16. Tchum SK et al. Evaluation of a green leafy vegetable intervention in Ghanaian postpartum mothers. African Journal of Food, Agriculture, Nutrition and Development, 2009, 9:1294–1308.
17. Tanumihardjo SA. Vitamin A status assessment in rats with 13C4-retinyl acetate and gas chromatogra-phy/combustion/isotope ratio mass spectrometry. Journal of Nutrition, 2000, 130:2844–2849.
18. Riabroy N, Tanumihardjo SA. α-Retinol supports growth in rats despite its inability to bind to retinol-binding protein and 3, 4-didehydroretinol is as bioactive as retinol when fed at equimolar amounts. FASEB J (in press).
19. Erhardt JG et al. Combined measurement of ferritin, soluble transferrin receptor, retinol binding pro-tein, and C-reactive protein by an inexpensive, sensitive, and simple sandwich enzyme-linked immuno-sorbent assay technique. Journal of Nutrition, 2004, 134:3127–3132.
20. Tanumihardjo SA, Penniston KL. Simplified methodology to determine breast milk retinol concentra-tions. Journal of Lipid Research, 2002, 43:350–355.
21. Ayah RA et al. The effects of maternal and infant vitamin A supplementation on vitamin A status: a randomised trial in Kenya. British Journal of Nutrition, 2007, 98:422–430.
22. Ross AC, Pasatiempo AM, Green MH. Chylomicron margination, lipolysis, and vitamin A uptake in the lactating rat mammary gland: implications for milk retinoid content. Experimental Biology and Medi-cine, 2004, 229:46–55.
23. Surles RL, Li J, Tanumihardjo SA. The modified-relative-dose-response values in serum and milk are positively correlated over time in lactating sows with adequate vitamin A status. Journal of Nutrition, 2006, 136:939–945.
53
24. Rice AL et al. Evaluation of serum retinol, the modified-relative-dose-response ratio, and breast-milk vitamin A as indicators of response to postpartum maternal vitamin A supplementation. American Journal of Clinical Nutrition, 2000, 71:799–806.
25. Muto Y et al. Regulation of retinol-binding protein metabolism by vitamin A status in the rat. Journal of Biological Chemistry, 1972, 247:2542–2550.
26. Tanumihardjo SA, Barua AB, Olson JA. Use of 3,4-didehydroretinol to assess vitamin A status in rats. International Journal for Vitamin and Nutrition Research, 1987, 57:127–132.
27. Tanumihardjo SA, Olson JA. A modified relative dose-response assay employing 3,4-didehydroretinol (vitamin A2) in rats. Journal of Nutrition, 1988, 118:598–603.
28. Tanumihardjo SA et al. Use of the modified relative dose response (MRDR) assay in rats and its applica-tion to humans for the measurement of vitamin A status. European Journal of Clinical Nutrition, 1990, 44:219–224.
29. Tanumihardjo SA, Koellner PG, Olson JA. The modified relative-dose-response assay as an indicator of vitamin A status in a population of well-nourished American children. American Journal of Clinical Nutrition, 1990, 52:1064–1067.
30. Tanumihardjo SA et al. Assessment of vitamin A status in preschool-age Indonesian children by the modified relative dose response (MRDR) assay. American Journal of Clinical Nutrition, 1990, 52:1068–1072.
31. Tanumihardjo SA et al. Refinement of the modified-relative-dose-response test as a method for assess-ing vitamin A status in a field setting: experience with Indonesian children. American Journal of Clinical Nutrition, 1996, 64:966–971.
32. Valentine AR, Tanumihardjo SA. Adjustments to the modified relative dose response (MRDR) test for assessment of vitamin A status minimize the blood volume used in piglets. Journal of Nutrition, 2004, 134:1186–1192.
33. Tanumihardjo SA, Permaesih D, Muhilal. Vitamin A status and hemoglobin concentrations are im-proved in Indonesian children with vitamin A and deworming interventions. European Journal of Clini-cal Nutrition, 2004, 58:1223–1230.
34. Spannaus-Martin DJ et al. Vitamin A and vitamin E statuses of preschool children of socioeconomically disadvantaged families living in the Midwestern United States. European Journal of Clinical Nutrition, 1997, 51:864–869.
35. Duitsman PK et al. Vitamin A inadequacy in socioeconomically disadvantaged Iowan women as as-sessed by the modified relative dose response (MRDR) test. Nutrition Research, 1995, 15:1263–1276.
36. Surles RL et al. One-time graded doses of vitamin A to weanling piglets enhance hepatic retinol but do not always prevent a deficient vitamin A status. American Journal of Clinical Nutrition, 2007, 86:1045–1053.
37. Valentine AR, Tanumihardjo SA. One-time vitamin A supplementation of lactating sows enhances he-patic retinol of offspring independent of dose size. American Journal of Clinical Nutrition, 2005, 81:427–433.
38. Valentine AR. Evaluation of the modified relative dose response test and vitamin A supplementation in a swine model [thesis]. Madison, WI, University of Wisconsin-Madison, 2004.
39. Ross AC, Zolfaghari R. Regulation of hepatic retinol metabolism: perspectives from studies on vitamin A status. Journal of Nutrition, 2004, 134:269S–275S.
40. Furr HC et al. Stable isotope dilution techniques for assessing vitamin A status and bioefficacy of provi-tamin A carotenoids in humans. Public Health Nutrition, 2005, 8:596–607.
41. Escaron AE et al. Mathematical modeling of serum 13C-retinol in captive rhesus monkeys provides new insights on hypervitaminosis A. Journal of Nutrition, 2009, 139:2000–2006.
42. Tanumihardjo SA. A small physiological dose of vitamin A (17.5 mmol) takes 4 years to disappear in healthy individuals. XXI International Vitamin A Consultative Group (IVACG) meeting, Marrakech, Morocco, February 2003:31.
43. Tang G, Qin J, Dolnikowski GG. Deuterium enrichment of retinol in humans determined by gas chro-matography electron capture negative chemical ionization mass spectrometry. Journal of Nutritional Biochemistry, 1998, 9:408–414.
44. Ribaya-Mercado JD et al. Assessment of total body stores of vitamin A in Guatemalan elderly by the deuterated-retinol-dilution method. American Journal of Clinical Nutrition, 1999, 69:278–284.
45. Escaron AE, Tanumihardjo SA. Orally ingested 13C2-retinol is incorporated into hepatic retinyl esters in a nonhuman primate (Macaca mulatta) model of hypervitaminosis A. Complementary Medicine, 2010, 60:71–76.
A2.2 BIOMARKERS OF VITAMIN A STATUS
54
WHO REPORT: PRIORITIES IN THE ASSESSMENT OF VITAMIN A AND IRON STATUS IN POPULATIONS
46. Goodman KJ, Brenna JT. High sensitivity tracer detection using high-precision gas chromatography-combustion isotope ratio mass spectrometry and highly enriched [U-13C]-labeled precursors. Analyti-cal Chemistry, 1992, 64:1088–1095.
47. Tang G et al. Green and yellow vegetables can maintain body stores of vitamin A in Chinese children. American Journal of Clinical Nutrition, 1999, 70:1069–1076.
48. Haskell M, Ribaya-Mercado JD, Vitamin A Tracer Task Force. Handbook on vitamin A tracer dilution methods to assess status and evaluate intervention programs. Washington, DC, HarvestPlus, 2005 (Tech-nical Monograph 5).
49. Haskell MJ et al. Daily consumption of Indian spinach (Basella alba) or sweet potatoes has a positive effect on total-body vitamin A stores in Bangladeshi men. American Journal of Clinical Nutrition, 2004, 80:705–714.
50. Haskell MJ et al. Use of the deuterated-retinol-dilution technique to assess total-body vitamin A stores of adult volunteers consuming different amounts of vitamin A. American Journal of Clinical Nutrition, 1999, 70:874–880.
51. Penniston KL, Tanumihardjo SA. Subtoxic hepatic vitamin A concentrations in captive Rhesus mon-keys (Macaca mulatta). Journal of Nutrition, 2001, 131:2904–2909.
52. Ribaya-Mercado JD et al. Use of the deuterated-retinol-dilution technique to monitor the vitamin A status of Nicaraguan schoolchildren 1 y after initiation of the Nicaraguan national program of sugar fortification with vitamin A. American Journal of Clinical Nutrition, 2004, 80:1291–1298.
53. Olson JA. Vitamin A. In: Brown ML, ed. Present knowledge in nutrition, 6th ed. Washington, DC, Inter-national Life Science Institute, 1990:101.
55
A2.3 SELECTING AND STANDARDIZING IRON STATUS INDICATORS
A2.3The rationale for selecting and standardizing iron status indicatorsSean Lynch
Eastern Virginia Medical School, Department of Internal Medicine, Norfolk, Virginia, United States of America
Corresponding author: Sean Lynch; [email protected]
Suggested citation: Lynch S. The rationale for selecting and standardizing iron status indicators. In: World Health Organization. Report: Priorities in the assessment of vitamin A and iron status in populations, Panama City, Panama, 15–17 September 2010. Geneva, World Health Organization, 2012.
Abstract
n Both iron deficiency and iron excess have significant health consequences. A diet insuf-ficient in bioavailable iron and blood loss are the major causes of iron deficiency worldwide. An improved intake of bioavailable iron can prevent the long-term consequences of nutritional iron deficiency. Iron indicators are needed to identify population groups at risk for nutritional iron deficiency and to monitor the impact of intervention strategies. Currently available iron indicators permit a specific diagnosis of iron deficiency and iron deficiency anaemia in the clinical setting where other patient-related information is available, but are more difficult to interpret in populations in developing countries because anaemia is multifactorial. Progress towards reducing the prevalence of nutritional anaemia worldwide will depend on improved selection and standardization of iron indicators in these settings. The predictive value of these indicators for significant functional outcomes could provide the basis for selection and stand-ardization. The currently available indicators and a suggested approach are discussed in this brief review.
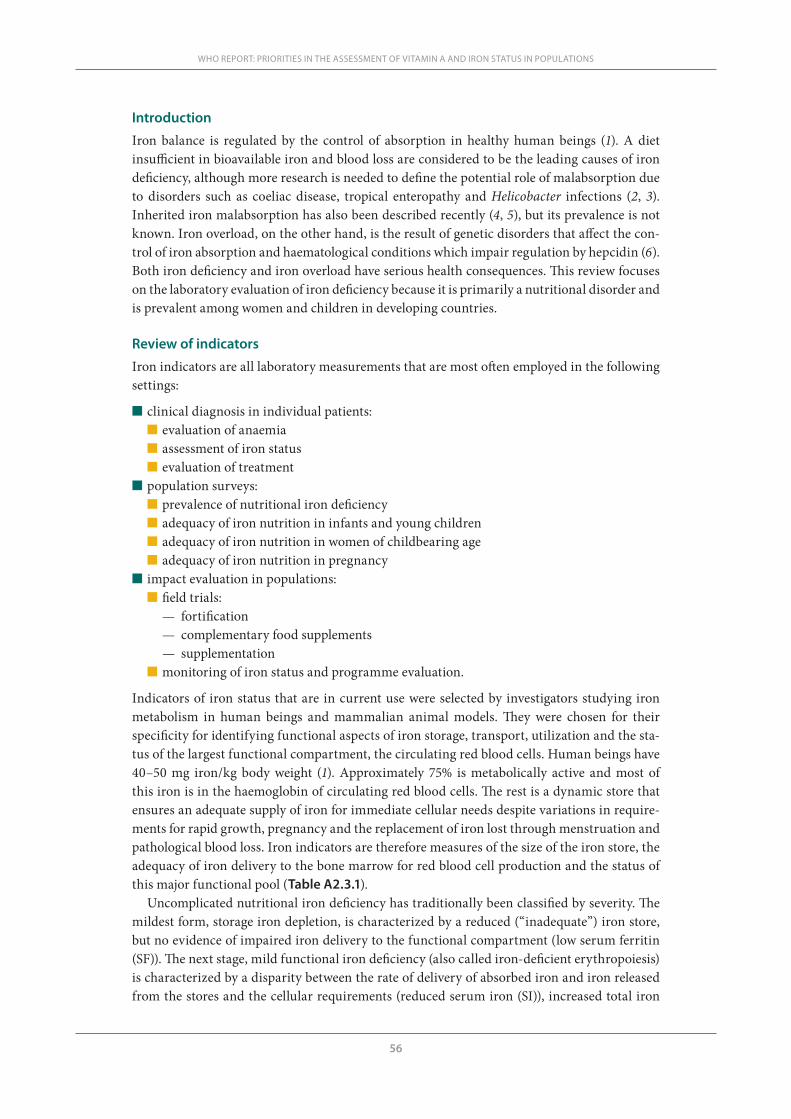
56
WHO REPORT: PRIORITIES IN THE ASSESSMENT OF VITAMIN A AND IRON STATUS IN POPULATIONS
Introduction
Iron balance is regulated by the control of absorption in healthy human beings (1). A diet insufficient in bioavailable iron and blood loss are considered to be the leading causes of iron deficiency, although more research is needed to define the potential role of malabsorption due to disorders such as coeliac disease, tropical enteropathy and Helicobacter infections (2, 3). Inherited iron malabsorption has also been described recently (4, 5), but its prevalence is not known. Iron overload, on the other hand, is the result of genetic disorders that affect the con-trol of iron absorption and haematological conditions which impair regulation by hepcidin (6). Both iron deficiency and iron overload have serious health consequences. This review focuses on the laboratory evaluation of iron deficiency because it is primarily a nutritional disorder and is prevalent among women and children in developing countries.
Review of indicators
Iron indicators are all laboratory measurements that are most often employed in the following settings:
n clinical diagnosis in individual patients:n evaluation of anaemian assessment of iron statusn evaluation of treatment
n population surveys:n prevalence of nutritional iron deficiencyn adequacy of iron nutrition in infants and young childrenn adequacy of iron nutrition in women of childbearing agen adequacy of iron nutrition in pregnancy
n impact evaluation in populations:n field trials:
— fortification— complementary food supplements— supplementation
n monitoring of iron status and programme evaluation.
Indicators of iron status that are in current use were selected by investigators studying iron metabolism in human beings and mammalian animal models. They were chosen for their specificity for identifying functional aspects of iron storage, transport, utilization and the sta-tus of the largest functional compartment, the circulating red blood cells. Human beings have 40–50 mg iron/kg body weight (1). Approximately 75% is metabolically active and most of this iron is in the haemoglobin of circulating red blood cells. The rest is a dynamic store that ensures an adequate supply of iron for immediate cellular needs despite variations in require-ments for rapid growth, pregnancy and the replacement of iron lost through menstruation and pathological blood loss. Iron indicators are therefore measures of the size of the iron store, the adequacy of iron delivery to the bone marrow for red blood cell production and the status of this major functional pool (Table A2.3.1).
Uncomplicated nutritional iron deficiency has traditionally been classified by severity. The mildest form, storage iron depletion, is characterized by a reduced (“inadequate”) iron store, but no evidence of impaired iron delivery to the functional compartment (low serum ferritin (SF)). The next stage, mild functional iron deficiency (also called iron-deficient erythropoiesis) is characterized by a disparity between the rate of delivery of absorbed iron and iron released from the stores and the cellular requirements (reduced serum iron (SI)), increased total iron
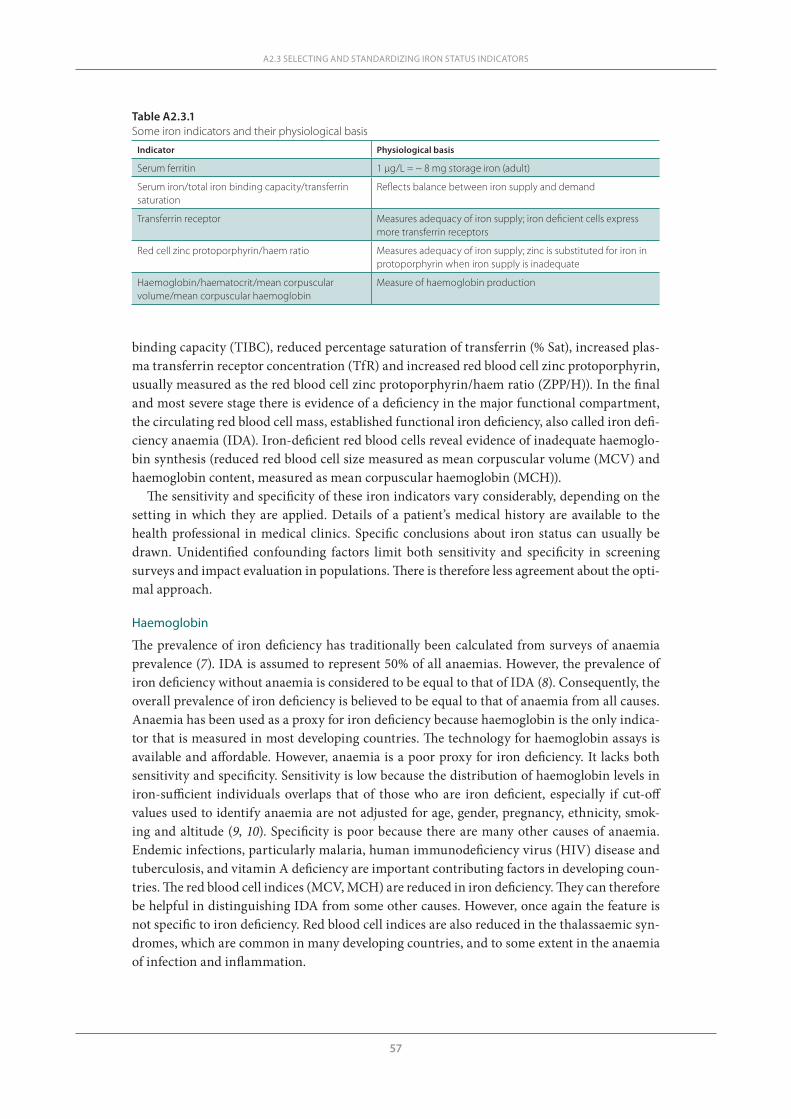
57
binding capacity (TIBC), reduced percentage saturation of transferrin (% Sat), increased plas-ma transferrin receptor concentration (TfR) and increased red blood cell zinc protoporphyrin, usually measured as the red blood cell zinc protoporphyrin/haem ratio (ZPP/H)). In the final and most severe stage there is evidence of a deficiency in the major functional compartment, the circulating red blood cell mass, established functional iron deficiency, also called iron defi-ciency anaemia (IDA). Iron-deficient red blood cells reveal evidence of inadequate haemoglo-bin synthesis (reduced red blood cell size measured as mean corpuscular volume (MCV) and haemoglobin content, measured as mean corpuscular haemoglobin (MCH)).
The sensitivity and specificity of these iron indicators vary considerably, depending on the setting in which they are applied. Details of a patient’s medical history are available to the health professional in medical clinics. Specific conclusions about iron status can usually be drawn. Unidentified confounding factors limit both sensitivity and specificity in screening surveys and impact evaluation in populations. There is therefore less agreement about the opti-mal approach.
Haemoglobin
The prevalence of iron deficiency has traditionally been calculated from surveys of anaemia prevalence (7). IDA is assumed to represent 50% of all anaemias. However, the prevalence of iron deficiency without anaemia is considered to be equal to that of IDA (8). Consequently, the overall prevalence of iron deficiency is believed to be equal to that of anaemia from all causes. Anaemia has been used as a proxy for iron deficiency because haemoglobin is the only indica-tor that is measured in most developing countries. The technology for haemoglobin assays is available and affordable. However, anaemia is a poor proxy for iron deficiency. It lacks both sensitivity and specificity. Sensitivity is low because the distribution of haemoglobin levels in iron-sufficient individuals overlaps that of those who are iron deficient, especially if cut-off values used to identify anaemia are not adjusted for age, gender, pregnancy, ethnicity, smok-ing and altitude (9, 10). Specificity is poor because there are many other causes of anaemia. Endemic infections, particularly malaria, human immunodeficiency virus (HIV) disease and tuberculosis, and vitamin A deficiency are important contributing factors in developing coun-tries. The red blood cell indices (MCV, MCH) are reduced in iron deficiency. They can therefore be helpful in distinguishing IDA from some other causes. However, once again the feature is not specific to iron deficiency. Red blood cell indices are also reduced in the thalassaemic syn-dromes, which are common in many developing countries, and to some extent in the anaemia of infection and inflammation.
A2.3 SELECTING AND STANDARDIZING IRON STATUS INDICATORS
Table A2.3.1Some iron indicators and their physiological basis
Indicator Physiological basis
Serum ferritin 1 µg/L = ~ 8 mg storage iron (adult)
Serum iron/total iron binding capacity/transferrin saturation
Reflects balance between iron supply and demand
Transferrin receptor Measures adequacy of iron supply; iron deficient cells express more transferrin receptors
Red cell zinc protoporphyrin/haem ratio Measures adequacy of iron supply; zinc is substituted for iron in protoporphyrin when iron supply is inadequate
Haemoglobin/haematocrit/mean corpuscular volume/mean corpuscular haemoglobin
Measure of haemoglobin production
58
WHO REPORT: PRIORITIES IN THE ASSESSMENT OF VITAMIN A AND IRON STATUS IN POPULATIONS
Serum ferritin
Serum ferritin is the specific iron status indicator that has gained widest acceptance. It reflects the size of the iron store. It has proven very useful in populations where the prevalence of infectious and inflammatory disorders is low. Plasma ferritin is, however, an acute phase pro-tein. Values may not reflect iron status accurately in the presence of infection. Its utility is therefore more limited in developing countries where malaria, HIV disease and tuberculosis are prevalent. The value of serum ferritin assays is also questionable for stages of the lifecycle during which depleted iron stores are physiologically appropriate (second and third trimesters of pregnancy and infancy between 6 and 12 months).
Serum iron, total iron binding capacity and percentage saturation of transferrin
Percentage saturation of transferrin is the element of these inter-related indicators that has been employed most often in the evaluation of iron status in the past (11). Its utility is limited by physiological and diurnal variability. Furthermore transferrin saturation is characteristically low in both iron deficiency and the anaemia of inflammation (chronic disease). Finally, assays require access to sophisticated laboratories. It is unlikely that SI/TIBC/% Sat will be suitable for assessing iron status in developing countries.
Red blood cell zinc protoporphyrin
Red blood cell protoporphyrin is now most often reported as ZPP/H because of the availability of the direct reading haematofluorometer. Attractive features of this assay are its applicabil-ity to capillary blood samples, minimal sample processing and the immediate availability of the result. The major obstacles to its widespread use in developing countries are the need to improve instrument technology and better assay standardization and quality control. It is also important to emphasize that ZPP/H is a measure of the adequacy of the iron supply to the bone marrow for red blood cell production. It is therefore not specific for iron deficiency. Values are also above the normal range when iron absorption and its release from stores are restricted by infection or inflammation, in thalassaemic syndromes and after chronic exposure to environ-mental lead.
Plasma transferrin receptor concentration
Raised plasma transferrin receptor concentration is potentially the most useful indicator of a functionally significant iron deficit. As with SI/TIBC/% Sat and ZPP/H, it is a measure of the discrepancy between iron supply (from stores and absorption) and requirements (primarily for haemoglobin production). It is therefore not a specific indicator of iron deficiency, since levels are raised above normal if the iron supply is interrupted by diminished absorption and release from stores and when requirements are increased. It is, however, less affected than SF by inflammation and infection, possibly because the reduced iron supply is to some extent offset by a diminished requirement resulting from suppressed erythropoiesis. The most important confounding factor appears to be increased erythropoiesis due to haemolysis in conditions such as malaria.
Other potential indicators that require further research
Reticulocyte haemoglobin and percentage hypochromic erythrocytes are indicators of recent iron delivery to the bone marrow. They require special instrumentation and are unlikely to prove useful for the evaluation of nutritional iron deficiency. Hepcidin, a recently discovered pep-tide hormone, is the principal regulator of systemic iron homeostasis (12). Plasma and uri-nary assays are available and have been shown to provide information about iron status and
59
metabolism. There is considerable enthusiasm for its potential role as an iron status indicator. However, more research is needed to determine its possible utility. Finally, there has been con-siderable interest in the possible role of non-transferrin bound iron (NTBI) as a mediator of the putative adverse effects of iron supplementation observed among young children exposed to P. falciparum malaria (13). Assays of NTBI can, however, only be considered a research tool at the present time.
DiscussionPopulation surveys
The selection of indicators of nutritional iron deficiency has traditionally been tied to the pres-ence or absence of anaemia (14). Cook et al. pioneered the use of a combination of three bio-markers (SF, % Sat and red cell protoporphyrin) for estimating the prevalence of nutritional iron deficiency in the USA (15). The prevalence of anaemia in a sample of 1564 volunteers living in northwestern USA was just slightly greater (10.9%) than that in the entire sample if only one parameter was abnormal. It increased to 28% with two or more abnormal parameters and to 63% when they were all abnormal. The investigators selected two of three abnormal indicators to define iron deficiency in population studies. This definition was employed in vari-ous National Health and Nutrition Examination Surveys (NHANES) in the USA (16). These indicators have also been employed in surveys and nutritional studies in other countries, but there has been little consistency in the way they were applied. Three indicators were not always measured. When two were measured, iron deficiency was often defined as an abnormal result for either indicator.
The TfR/SF ratio (17, 18) has replaced the multiple indicator method for iron status evalua-tions in NHANES evaluations (19). The method has several important advantages. It is the only method that has been calibrated against experimentally measured iron status, although it must be conceded that the observations involved only 14 adult volunteers; it provides a quantitative estimate of the iron store or iron deficit through the full iron status spectrum from deficiency to excess; haemoglobin measurements are not required to determine the severity of iron deficien-cy; the calculated iron store is not dependent on the selection of cut-off values; the assay meth-ods can be automated and standardized and are potentially suitable for surveys in developing countries. There was reasonably good agreement between the prevalence of iron deficiency by the TfR/SF ratio and the former multiple indicator index in preschool children and women of childbearing age in samples drawn from NHANES 2003–2006 (19). The major current obsta-cles to the implementation of the TfR/SF ratio method as the standard approach in countries with a low prevalence of malaria and other infectious disease are incomplete standardization of the TfR assay (an international standard is available to calibrate SF assays) and the expense of the reagents required. More research is needed to determine whether the SF/TfR ratio method could also be widely applied in developing countries where malaria, HIV disease, tuberculosis and other infections are endemic. SF is less reliable as a measure of iron status in these settings because it is an acute phase protein and therefore responsive to infectious and inflammatory stimuli. However, considerable progress towards developing correction factors for this effect has been made (20). TfR is less affected by inflammation, but results may be confounded by changes in erythropoietic activity. Haemolysis induced by malaria is particularly important.
Haemoglobin is likely to continue to be used to screen for iron deficiency. It is therefore important to define the relationship between anaemia and iron deficiency as clearly as pos-sible. Although it lacks sensitivity, anaemia is a useful screen for iron deficiency in women and children in Western societies because iron deficiency is the predominant cause of anaemia in these populations. It is less useful in developing countries where anaemia is multifactorial. The
A2.3 SELECTING AND STANDARDIZING IRON STATUS INDICATORS
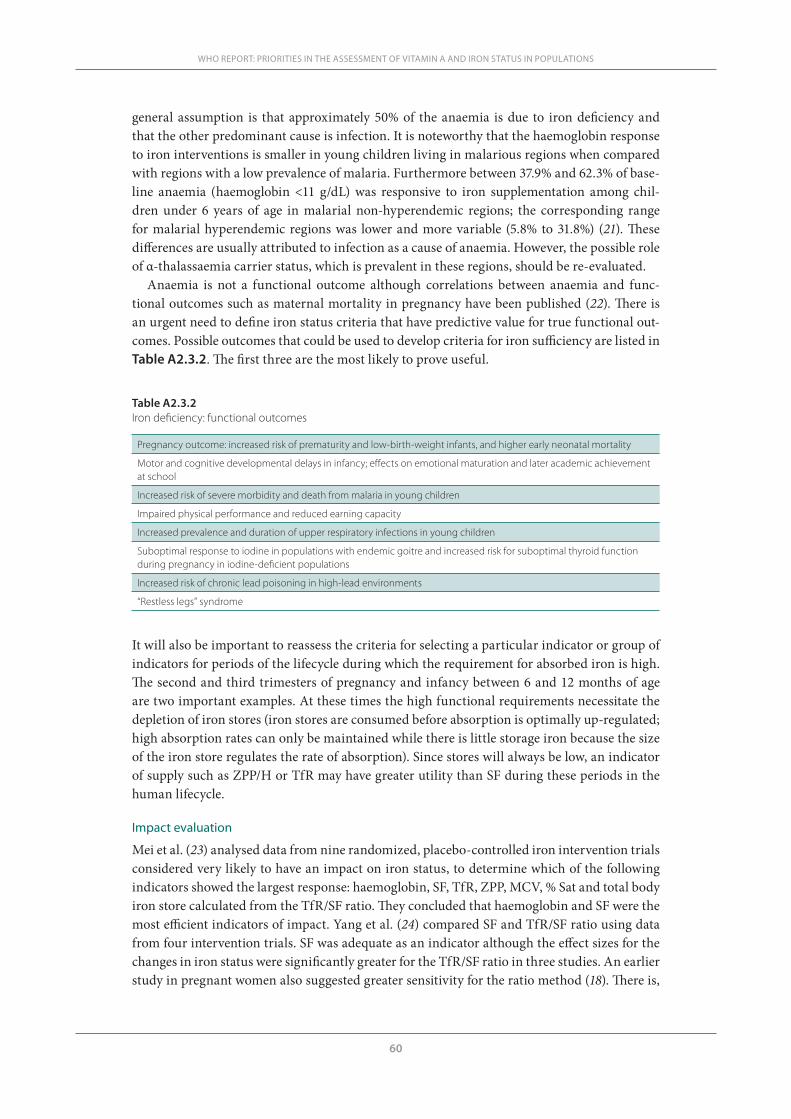
60
WHO REPORT: PRIORITIES IN THE ASSESSMENT OF VITAMIN A AND IRON STATUS IN POPULATIONS
general assumption is that approximately 50% of the anaemia is due to iron deficiency and that the other predominant cause is infection. It is noteworthy that the haemoglobin response to iron interventions is smaller in young children living in malarious regions when compared with regions with a low prevalence of malaria. Furthermore between 37.9% and 62.3% of base-line anaemia (haemoglobin <11 g/dL) was responsive to iron supplementation among chil-dren under 6 years of age in malarial non-hyperendemic regions; the corresponding range for malarial hyperendemic regions was lower and more variable (5.8% to 31.8%) (21). These differences are usually attributed to infection as a cause of anaemia. However, the possible role of α-thalassaemia carrier status, which is prevalent in these regions, should be re-evaluated.
Anaemia is not a functional outcome although correlations between anaemia and func-tional outcomes such as maternal mortality in pregnancy have been published (22). There is an urgent need to define iron status criteria that have predictive value for true functional out-comes. Possible outcomes that could be used to develop criteria for iron sufficiency are listed in Table A2.3.2. The first three are the most likely to prove useful.
Table A2.3.2Iron deficiency: functional outcomes
Pregnancy outcome: increased risk of prematurity and low-birth-weight infants, and higher early neonatal mortality
Motor and cognitive developmental delays in infancy; effects on emotional maturation and later academic achievement at school
Increased risk of severe morbidity and death from malaria in young children
Impaired physical performance and reduced earning capacity
Increased prevalence and duration of upper respiratory infections in young children
Suboptimal response to iodine in populations with endemic goitre and increased risk for suboptimal thyroid function during pregnancy in iodine-deficient populations
Increased risk of chronic lead poisoning in high-lead environments
“Restless legs” syndrome
It will also be important to reassess the criteria for selecting a particular indicator or group of indicators for periods of the lifecycle during which the requirement for absorbed iron is high. The second and third trimesters of pregnancy and infancy between 6 and 12 months of age are two important examples. At these times the high functional requirements necessitate the depletion of iron stores (iron stores are consumed before absorption is optimally up-regulated; high absorption rates can only be maintained while there is little storage iron because the size of the iron store regulates the rate of absorption). Since stores will always be low, an indicator of supply such as ZPP/H or TfR may have greater utility than SF during these periods in the human lifecycle.
Impact evaluation
Mei et al. (23) analysed data from nine randomized, placebo-controlled iron intervention trials considered very likely to have an impact on iron status, to determine which of the following indicators showed the largest response: haemoglobin, SF, TfR, ZPP, MCV, % Sat and total body iron store calculated from the TfR/SF ratio. They concluded that haemoglobin and SF were the most efficient indicators of impact. Yang et al. (24) compared SF and TfR/SF ratio using data from four intervention trials. SF was adequate as an indicator although the effect sizes for the changes in iron status were significantly greater for the TfR/SF ratio in three studies. An earlier study in pregnant women also suggested greater sensitivity for the ratio method (18). There is,
61
however, good reason to be cautious before endorsing the measurement of SF as the sole indi-cator for impact. Changes in SF are biased towards the more iron-sufficient individuals with higher SF values (24). It is, however, more important to ensure that those who are most iron deficient derive the greatest benefit. Moreover, Moretti et al. (25) reported that the absorption of ferric pyrophosphate (FePP) is poorly up-regulated in iron-deficient volunteers. As a result absorption of iron from ferrous sulfate and FePP was approximately the same in individuals with a serum ferritin of about 50 μg/L, but three times higher from ferrous sulfate when serum ferritin levels were below 10 μg/L. Impact evaluation of a trial employing FePP could be mis-leading if based on SF alone. Moretti and co-investigators suggested that other water-insoluble forms of fortification iron may behave like FePP.
Conclusion
There is an urgent need for improved selection and standardization of iron status indicators. A rational approach based on the analysis of observed outcome data should be applied. The cur-rent focus on anaemia prevention in developing countries, particularly those where malaria is endemic, merits more rigorous review. More research is needed to define the relationship between functionally significant iron deficiency and anaemia in these settings. The indicators with the greatest potential at the present time are SF, TfR and ZPP/H. More research is required to define their specific applications and to develop assay methods that will allow their use in populations in developing countries and to make them affordable.
References1. Bothwell TH et al. Iron metabolism in man. Oxford, Blackwell Scientific Publications, 1979.2. Walker MM. What is tropical sprue? Journal of Gastroenterology and Hepatology, 2003, 18:887–890.3. Hershko C, Skikne B. Pathogenesis and management of iron deficiency anemia: emerging role of celiac
disease, Helicobacter pylori, and autoimmune gastritis. Seminars in Hematology, 2009, 46:339–350.4. Finberg KE et al. Mutations in TMPRSS6 cause iron-refractory iron deficiency anemia (IRIDA). Nature
Genetics, 2008, 40:569–571.5. Finberg KE. Iron-refractory iron deficiency anemia. Seminars in Hematology, 2009, 46:378–386.6. Andrews NC. Forging a field: the golden age of iron biology. Blood, 2008, 112:219–230.7. McLean E et al. Worldwide prevalence of anaemia, WHO Vitamin and Mineral Nutrition Information
System, 1993–2005. Public Health Nutrition, 2008, 23:1–11.8. WHO/UNICEF/UNU. Iron deficiency anemia assessment, prevention, and control. Geneva, World
Health Organization, 2001.9. Cook JD et al. Nutritional deficiency and anemia in Latin America: a collaborative study. Blood, 1971,
38:591–603.10. Nestel P. Adjusting hemoglobin values in program surveys. Washington DC, International Nutritional
Anemia Consultative Group (INACG), 2002.11. Bainton DF, Finch CA. The diagnosis of iron deficiency anemia. American Journal of Medicine, 1964,
37:62–70.12. Nemeth E, Ganz T. Regulation of iron metabolism by hepcidin. Annual Review of Nutrition, 2006,
26:323–342.13. Sazawal S et al. Effects of routine prophylactic supplementation with iron and folic acid on admission to
hospital and mortality in preschool children in a high malaria transmission setting: community-based, randomised, placebo-controlled trial. Lancet, 2006, 367:133–143.
14. Cook JD. Defining optimal body iron. Proceedings of the Nutrition Society, 1999, 58:489–495.15. Cook JD, Finch CA, Smith NJ. Evaluation of the iron status of a population. Blood, 1976, 48:449–455.16. Looker AC, Gunter EW, Johnson CL. Methods to assess iron status in various NHANES surveys. Nutri-
tion Reviews, 1995, 53:246–254.17. Skikne BS, Flowers CH, Cook JD. Serum transferrin receptor: a quantitative measure of tissue iron de-
ficiency. Blood, 1990, 75:1870–1876.
A2.3 SELECTING AND STANDARDIZING IRON STATUS INDICATORS
62
WHO REPORT: PRIORITIES IN THE ASSESSMENT OF VITAMIN A AND IRON STATUS IN POPULATIONS
18. Cook JD, Flowers CH, Skikne BS. The quantitative assessment of body iron. Blood, 2003, 101:3359–3364.19. Cogswell ME et al. Assessment of iron deficiency in US preschool children and nonpregnant females of
childbearing age: National Health and Nutrition Examination Survey 2003–2006. American Journal of Clinical Nutrition, 2009, 89:1334–1342.
20. Thurnham DI et al. Adjusting plasma ferritin concentrations to remove the effects of subclinical inflam-mation in the assessment of iron deficiency: a meta-analysis. American Journal of Clinical Nutrition, 2010, 92:546–555.
21. Gera T et al. Effect of iron supplementation on haemoglobin response in children: systematic review of randomised controlled trials. Journal of Pediatric Gastroenterology and Nutrition, 2007, 44:468–486.
22. Stoltzfus RJ, Mullany L, Black RE. Iron Deficiency Anaemia. In: Ezzati M et al., eds. Comparative quan-tification of health risks: global and regional burden of disease attributable to selected major risk factors. Geneva, World Health Organization, 2004:163–209.
23. Mei Z et al. Hemoglobin and ferritin are currently the most efficient indicators of population response to iron interventions: an analysis of nine randomized controlled trials. Journal of Nutrition, 2005, 135:1974–1980.
24. Yang Z et al. Comparison of plasma ferritin concentration with the ratio of plasma transferrin receptor to ferritin in estimating body iron stores: results of 4 intervention trials. American Journal of Clinical Nutrition, 2008, 87:1892–1898.
25. Moretti D et al. Iron status and food matrix strongly affect the relative bioavailability of ferric pyroph-osphate in humans. American Journal of Clinical Nutrition, 2006, 83:632–638.
63
A2.4 INFLUENCE OF INFECTION AND INFLAMMATION ON BIOMARKERS OF NUTRITIONAL STATUS
A2.4Influence of infection and inflammation on biomarkers of nutritional status with an emphasis on vitamin A and iron David I. Thurnham1 and George P. McCabe2
1 Northern Ireland Centre for Food and Health, University of Ulster, Coleraine, United Kingdom of Great Britain and Northern Ireland
2 Statistics Department, Purdue University, West Lafayette, Indiana, United States of America
Corresponding author: David I. Thurnham; [email protected]
Suggested citation: Thurnham DI, McCabe GP. Influence of infection and inflammation on biomarkers of nutritional status with an emphasis on vitamin A and iron. In: World Health Organization. Report: Priorities in the assessment of vitamin A and iron status in populations, Panama City, Panama, 15–17 September 2010. Geneva, World Health Organization, 2012.
Abstract
n Many plasma nutrients are influenced by infection or tissue damage. These effects may be passive and the result of changes in blood volume and capillary permeability. They may also be the direct effect of metabolic alterations that depress or increase the concentration of a nutrient or metabolite in the plasma. Where the nutrient or metabolite is a nutritional biomarker as in the case of plasma retinol, a depression in retinol concentrations will result in an overestimate of vitamin A deficiency. In contrast, where the biomarker is increased due to infection as in the case of plasma ferritin concentrations, inflammation will result in an underestimate of iron deficiency. Infection and tissue damage can be recognized by their clinical effects on the body but, unfortunately, subclinical infection or inflammation can only be recognized by measur-ing inflammation biomarkers in the blood. It is therefore important to measure biomarkers of inflammation as well as of nutrition in prevalence surveys of nutritional status in apparently healthy people. The most commonly used biomarkers of inflammation are the cytokines and acute phase proteins. Cytokines have very short half-lives but the acute phase proteins remain longer in the blood, and their lifespans can be matched with the changes in plasma retinol and ferritin concentrations. Using meta-analyses to determine the mean effect of inflammation on retinol and ferritin in different stages of the infection cycle, it was possible to determine correc-tion factors that can be used either to modify raw data to remove the effects of inflammation or to modify cut-off values of nutritional risk to use when inflammation is detected in a blood sample.
64
WHO REPORT: PRIORITIES IN THE ASSESSMENT OF VITAMIN A AND IRON STATUS IN POPULATIONS
Plasma nutrients that appear to be influenced by infection and inflammation with an emphasis on vitamin A and iron and where possible a quantitative estimate of the effectsNutrient biomarkers and inflammation
The plasma concentrations of several important nutritional biomarkers are influenced by inflammation (1), including retinol (2–4), 25-hydroxy cholecalciferol (vitamin D) (2, 4, 5), iron (6), ferritin (7), transferrin receptors (8), zinc (6, 9), carotenoids (3, 10–12), selenium (4, 13), pyridoxal phosphate (2, 4, 14), α-tocopherol and total lipids (2), and vitamin C (1, 2, 4). In addition, concentrations of the transport proteins albumin, retinol-binding protein (RBP) and transferrin are often low in children frequently exposed to infections (15) or trauma (2). In the above reports the abnormal nutrient biomarker concentration was associated with a raised concentration of the acute phase protein (APP) C-reactive protein (CRP) or other evidence of inflammation. However, in a cross-sectional survey or single time-point observation there is no way of telling from the nutrient measurement alone whether a low or abnormal value repre-sents poor nutritional status or the effect of inflammation or both.
Children with acute infections display varying degrees of anorexia and it is customary for parents and physicians to accept a limited intake of food during infections. In the nutrition-ally normal child such transient malnutrition is rapidly compensated for during infection-free intervals but in the child with chronic illness or those exposed to frequent infections with asso-ciated anorexia, there is the possible risk of more long-standing malnutrition of clinical signifi-cance (15). Thus an apparently healthy child living in a region where there is a high exposure to disease may be genuinely malnourished, but there is also the possibility of subclinical inflam-mation and that the biomarkers used to measure nutritional status may also be influenced by disease and over- or underestimate the extent of malnutrition.
Plasma retinol, α-tocopherol, total lipids, pyridoxal phosphate, and 25-hydroxy cholecalciferol and leukocyte vitamin C concentrations
In the case of vitamin A, there are numerous reports of low retinol concentrations where inflammation is known to be, or is probably, present and where the retinol concentrations normalized when the subjects recovered without any vitamin A intervention (2, 16, 17). Louw and colleagues’ (2) study is particularly important with respect to vitamin A and is described more fully later. However, these authors also reported longitudinal data on a number of other nutritional biomarkers in 26 men and women with no underlying pathology who underwent uncomplicated orthopaedic surgery. No patient fasted postoperatively for more than 12 hours and intake was considered normal within 48 hours of surgery. The authors also monitored fluid intake postoperatively and found no evidence of overhydration.
Blood concentrations were measured at baseline and at 4, 12, 24, 48, 72 and 168 hours. CRP concentrations rose slightly between 4 and 12 hours and increased maximally between 12 and 48 hours. CRP concentrations fell significantly between 48 and 72 hours but no fur-ther measurements were made until day 7 when CRP concentrations in the women were still raised. Associated with these changes in CRP, there were similar changes in plasma retinol, α-tocopherol, total lipids, pyridoxal phosphate and 25-hydroxy cholecalciferol (25-HCC), and leukocyte vitamin C concentrations in both men and women. As a group, the premorbid nutri-tional status of the patients was adequate and dietary intakes compared favourably with rec-ommended dietary allowances.
The fall in leukocyte vitamin C concentrations following surgery (18) or the common cold (19) is well known and has been reported as long ago as in the 1970s. Likewise falls in plasma lipoprotein concentrations have been previously reported in connection with malaria
65
and can in part be ascribed to extravasation due to increased capillary permeability (20, 21). Almost all the vitamin E in plasma is incorporated within the lipoprotein fraction so changes in plasma vitamin E concentrations are probably also due to the increased capillary permeabil-ity in inflammation (see below). There are numerous reports of low 25-HCC concentrations in persons with or at risk of disease (22, 23). The association is normally considered to be indi-rect, i.e. a consequence of low or inadequate exposure to sunlight in persons with poor health. However, Reid and colleagues (5) recently confirmed marked depression in 25-HCC following surgery, associated with changes in inflammation, which was previously reported by Louw et al. (2).
Serum and erythrocyte folate, serum B12, and plasma vitamin C concentrations
Louw and colleagues also measured, but did not show, serum and erythrocyte folate, serum B12 and plasma vitamin C concentrations, and commented that although some values fell below baseline values the changes appeared random and not like CRP (2). We have previously found no evidence of any influence of inflammation on folate status in young Irish adults (Thurn-ham and Haldar 2007, unpublished data) but others have suggested that folate is influenced by inflammation although we are not aware of any published data (24, 25).
Low plasma vitamin C concentrations are frequently reported in elderly people, a group with a high risk of subclinical inflammation (26). Likewise, low plasma vitamin C has been reported in patients with cardiovascular disease (27), and the study concluded the apparent risk of an acute myocardial infarction associated with low plasma ascorbic acid was distorted by the acute phase response (APR). Low plasma vitamin C concentrations, however, may be a consequence of the effect of inflammation on leukocytes. Inflammation stimulates the release of leukocytes into the circulation and when the cells first emerge from the bone marrow, the new leukocytes are low in vitamin C. They dilute the apparent leukocyte vitamin C concentra-tion in the first 2–3 days following the APR but premorbid leukocyte vitamin C concentrations are generally achieved by day 5. The new leukocytes probably acquire their vitamin C from the plasma, hence plasma vitamin C concentrations are low following myocardial infarction and in elderly people, in whom there may be increased subclinical inflammatory activity.
Carotenoids
Low plasma carotenoid concentrations in the presence of infection and inflammation have been described by a number of workers. Smoking is frequently associated with low concentra-tions of carotenoids (28); this may be partly a dietary effect (29) but in all studies inflammation is strongly linked to the low concentrations (10–12).
Iron
Maintenance of cellular iron homeostasis is a prerequisite for many essential biological process-es and for the growth of organisms, and is also a central element in the regulation of immune function (30). The hypoferraemia following infection was described over 50 years ago (6, 31) and more recent longitudinal data have described the direct effects of the macrophage-derived cytokines on serum ferritin, transferrin receptors, iron and transferrin concentrations in humans (7). The importance of iron in the APR and the influence of inflammation on iron biomarkers will be described more fully below.
Interaction of inflammation, vitamin A and iron
Serum retinol concentrations have been shown to be positively associated with haemoglobin, haematocrit, serum iron and % transferrin saturation (for references see Strube et al. (32)).
A2.4 INFLUENCE OF INFECTION AND INFLAMMATION ON BIOMARKERS OF NUTRITIONAL STATUS
66
WHO REPORT: PRIORITIES IN THE ASSESSMENT OF VITAMIN A AND IRON STATUS IN POPULATIONS
Further work suggested that anaemia did not or only poorly responded to medicinal iron in the presence of vitamin A deficiency but was ameliorated when vitamin A was given (33, 34). These data suggested that vitamin A played a role in regulating plasma iron concentrations. How-ever, many studies have shown the vitamin A supplementation can reduce mortality (35) and morbidity, especially in measles (36, 37). Thus vitamin A supplementation may simply reduce inflammation and in so doing promote the release of iron into the circulation (38). Strube et al. (32) carried out 2 × 2 experiments with vitamin A (±) and iron (±). There was no evidence of inflammation but the authors reported lower plasma iron and % transferrin saturation in marginal vitamin A deficiency and an elevation of liver vitamin A in iron deficiency. This study suggested that severe deficiencies of the two nutrients do have an impact on each other but in human studies the deficiencies are unlikely to be as severe, therefore other explanations must be sought. Nevertheless the authors concluded that providing vitamin A may be more likely than treatment with iron alone to improve the iron and vitamin A status of human populations in which both deficiency conditions coexist (32).
Indicators of infection, e.g. acute phase proteins and cytokines, and their usefulness in the measurement of inflammationInfection
This term implies that the body’s structure and/or normal metabolism have been interfered with by the entry of material recognized as foreign within the tissues. The effects of the foreign material may be very small and cause only subclinical infection, or be severe enough to cause the outward appearance of clinical signs that are the symptoms of disease. The clinical signs of disease frequently take the form of fever, raised body temperature, anorexia, headache, cough, vomiting and diarrhoea, and may be nonspecific or characteristic of a disease caused by a par-ticular foreign organism.
Inflammation
The biochemical and physical changes in a body that are initiated in response to tissue damage or a foreign organism are termed the inflammatory response. The changes begin the moment an intruder is detected and expand exponentially to meet the perceived threat. The interac-tion between inflammation and the invader is responsible for the clinical signs and symptoms of disease. However, evidence of inflammation may be covert if the infection is minor or the body’s immunity is particularly effective in preventing the disease and removing the cause of the infection. In addition in all infections there is a short period before clinical symptoms appear, usually 24–48 hours, and after clinical signs have disappeared, i.e. during convales-cence, when evidence of inflammation may only be detected biochemically. Inflammation is essentially protective and designed to neutralize and remove the invader and repair the dam-age caused directly by the invader and indirectly in any ensuing conflict. However, the changes that constitute inflammation are metabolically demanding and potentially destructive. An inflammatory response should ideally not last longer than 9–10 days.
The inflammatory response
In the aftermath of injury trauma or infection of a tissue, a complex series of reactions is executed by the host in an effort to prevent ongoing tissue damage, isolate and destroy the infective organism, and activate the repair processes that are necessary to restore normal func-tion. This whole homeostatic process is known as inflammation and the early set of reactions that are induced are known as the acute phase response. The cell most commonly associat-ed with initiating the cascade of events during the APR is the tissue macrophage or blood
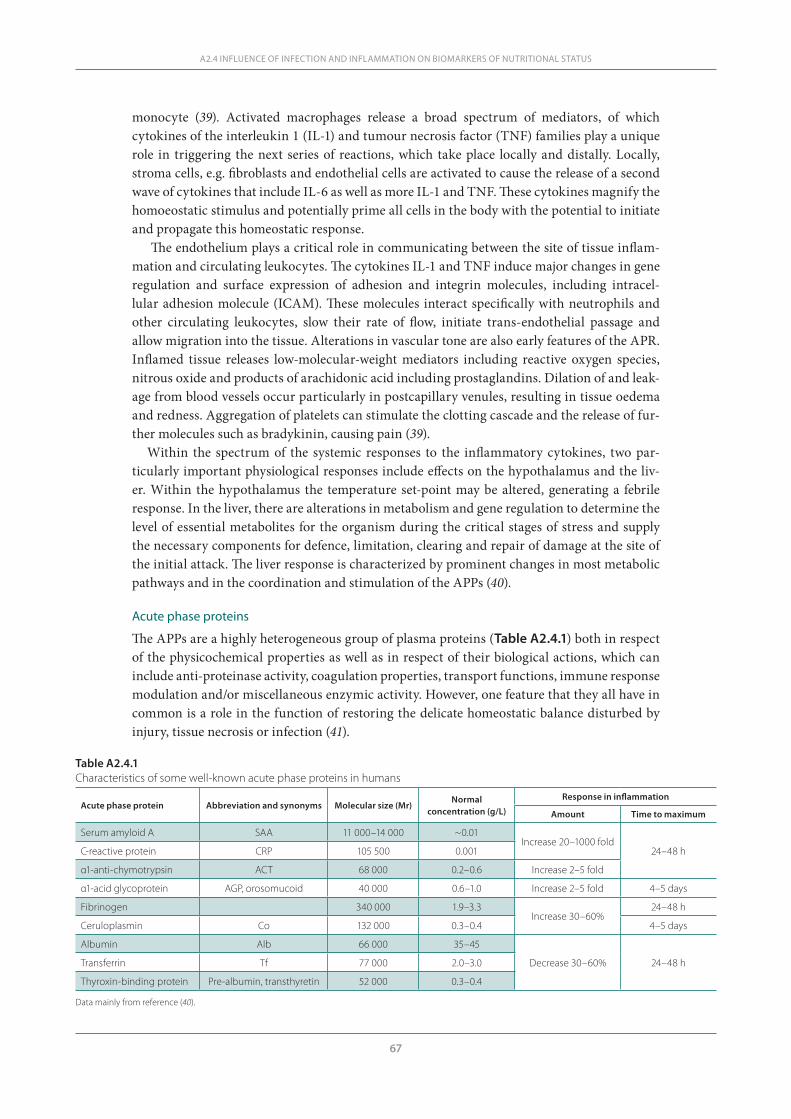
67
monocyte (39). Activated macrophages release a broad spectrum of mediators, of which cytokines of the interleukin 1 (IL-1) and tumour necrosis factor (TNF) families play a unique role in triggering the next series of reactions, which take place locally and distally. Locally, stroma cells, e.g. fibroblasts and endothelial cells are activated to cause the release of a second wave of cytokines that include IL-6 as well as more IL-1 and TNF. These cytokines magnify the homoeostatic stimulus and potentially prime all cells in the body with the potential to initiate and propagate this homeostatic response.
The endothelium plays a critical role in communicating between the site of tissue inflam-mation and circulating leukocytes. The cytokines IL-1 and TNF induce major changes in gene regulation and surface expression of adhesion and integrin molecules, including intracel-lular adhesion molecule (ICAM). These molecules interact specifically with neutrophils and other circulating leukocytes, slow their rate of flow, initiate trans-endothelial passage and allow migration into the tissue. Alterations in vascular tone are also early features of the APR. Inflamed tissue releases low-molecular-weight mediators including reactive oxygen species, nitrous oxide and products of arachidonic acid including prostaglandins. Dilation of and leak-age from blood vessels occur particularly in postcapillary venules, resulting in tissue oedema and redness. Aggregation of platelets can stimulate the clotting cascade and the release of fur-ther molecules such as bradykinin, causing pain (39).
Within the spectrum of the systemic responses to the inflammatory cytokines, two par-ticularly important physiological responses include effects on the hypothalamus and the liv-er. Within the hypothalamus the temperature set-point may be altered, generating a febrile response. In the liver, there are alterations in metabolism and gene regulation to determine the level of essential metabolites for the organism during the critical stages of stress and supply the necessary components for defence, limitation, clearing and repair of damage at the site of the initial attack. The liver response is characterized by prominent changes in most metabolic pathways and in the coordination and stimulation of the APPs (40).
Acute phase proteins
The APPs are a highly heterogeneous group of plasma proteins (Table A2.4.1) both in respect of the physicochemical properties as well as in respect of their biological actions, which can include anti-proteinase activity, coagulation properties, transport functions, immune response modulation and/or miscellaneous enzymic activity. However, one feature that they all have in common is a role in the function of restoring the delicate homeostatic balance disturbed by injury, tissue necrosis or infection (41).
A2.4 INFLUENCE OF INFECTION AND INFLAMMATION ON BIOMARKERS OF NUTRITIONAL STATUS
Table A2.4.1Characteristics of some well-known acute phase proteins in humans
Acute phase protein Abbreviation and synonyms Molecular size (Mr)Normal
concentration (g/L)
Response in inflammation
Amount Time to maximum
Serum amyloid A SAA 11 000–14 000 ~0.01Increase 20–1000 fold
24–48 hC-reactive protein CRP 105 500 0.001
α1-anti-chymotrypsin ACT 68 000 0.2–0.6 Increase 2–5 fold
α1-acid glycoprotein AGP, orosomucoid 40 000 0.6–1.0 Increase 2–5 fold 4–5 days
Fibrinogen 340 000 1.9–3.3Increase 30–60%
24–48 h
Ceruloplasmin Co 132 000 0.3–0.4 4–5 days
Albumin Alb 66 000 35–45
Decrease 30–60% 24–48 hTransferrin Tf 77 000 2.0–3.0
Thyroxin-binding protein Pre-albumin, transthyretin 52 000 0.3–0.4 Data mainly from reference (40).
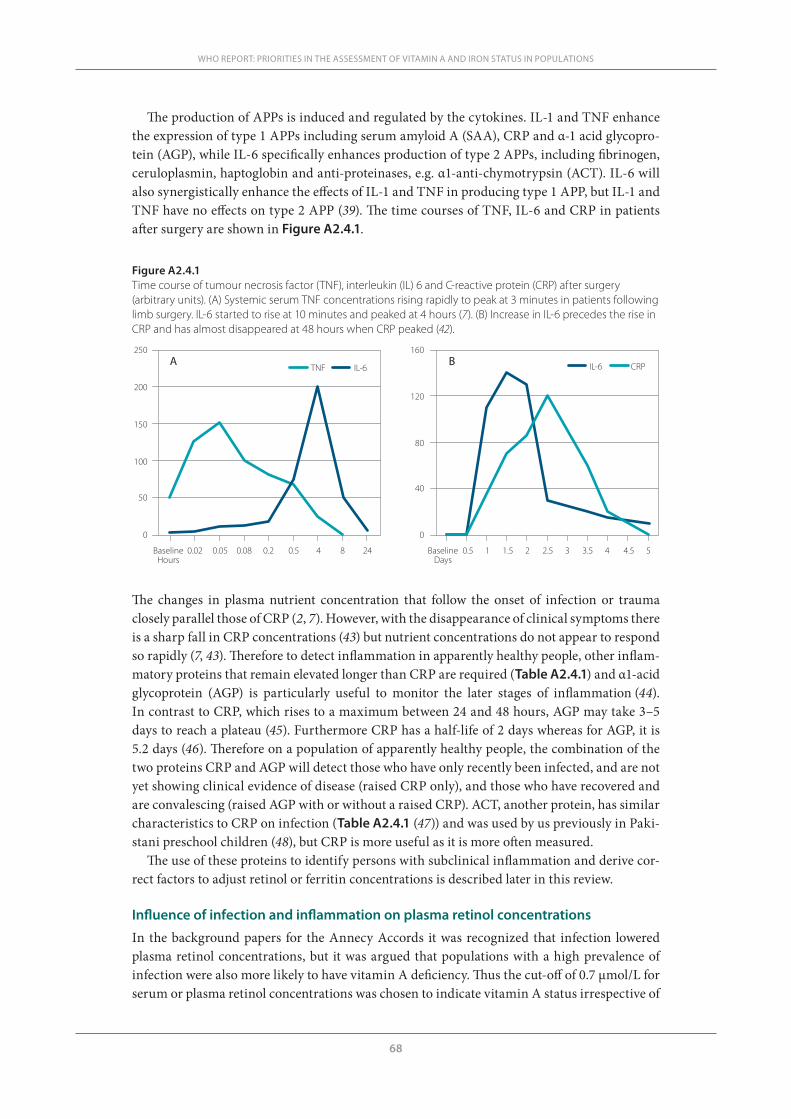
68
WHO REPORT: PRIORITIES IN THE ASSESSMENT OF VITAMIN A AND IRON STATUS IN POPULATIONS
The production of APPs is induced and regulated by the cytokines. IL-1 and TNF enhance the expression of type 1 APPs including serum amyloid A (SAA), CRP and α-1 acid glycopro-tein (AGP), while IL-6 specifically enhances production of type 2 APPs, including fibrinogen, ceruloplasmin, haptoglobin and anti-proteinases, e.g. α1-anti-chymotrypsin (ACT). IL-6 will also synergistically enhance the effects of IL-1 and TNF in producing type 1 APP, but IL-1 and TNF have no effects on type 2 APP (39). The time courses of TNF, IL-6 and CRP in patients after surgery are shown in Figure A2.4.1.
Figure A2.4.1Time course of tumour necrosis factor (TNF), interleukin (IL) 6 and C-reactive protein (CRP) after surgery (arbitrary units). (A) Systemic serum TNF concentrations rising rapidly to peak at 3 minutes in patients following limb surgery. IL-6 started to rise at 10 minutes and peaked at 4 hours (7). (B) Increase in IL-6 precedes the rise in CRP and has almost disappeared at 48 hours when CRP peaked (42).
0
50
100
150
200
250
0
40
80
120
160
BaselineHours
0.02 0.05 0.08 0.2 0.5 4 8 24 0.5 1 1.5 2 2.5 3 3.5 4 4.5 5BaselineDays
A BTNF IL-6 IL-6 CRP
The changes in plasma nutrient concentration that follow the onset of infection or trauma closely parallel those of CRP (2, 7). However, with the disappearance of clinical symptoms there is a sharp fall in CRP concentrations (43) but nutrient concentrations do not appear to respond so rapidly (7, 43). Therefore to detect inflammation in apparently healthy people, other inflam-matory proteins that remain elevated longer than CRP are required (Table A2.4.1) and α1-acid glycoprotein (AGP) is particularly useful to monitor the later stages of inflammation (44). In contrast to CRP, which rises to a maximum between 24 and 48 hours, AGP may take 3–5 days to reach a plateau (45). Furthermore CRP has a half-life of 2 days whereas for AGP, it is 5.2 days (46). Therefore on a population of apparently healthy people, the combination of the two proteins CRP and AGP will detect those who have only recently been infected, and are not yet showing clinical evidence of disease (raised CRP only), and those who have recovered and are convalescing (raised AGP with or without a raised CRP). ACT, another protein, has similar characteristics to CRP on infection (Table A2.4.1 (47)) and was used by us previously in Paki-stani preschool children (48), but CRP is more useful as it is more often measured.
The use of these proteins to identify persons with subclinical inflammation and derive cor-rect factors to adjust retinol or ferritin concentrations is described later in this review.
Influence of infection and inflammation on plasma retinol concentrations
In the background papers for the Annecy Accords it was recognized that infection lowered plasma retinol concentrations, but it was argued that populations with a high prevalence of infection were also more likely to have vitamin A deficiency. Thus the cut-off of 0.7 μmol/L for serum or plasma retinol concentrations was chosen to indicate vitamin A status irrespective of
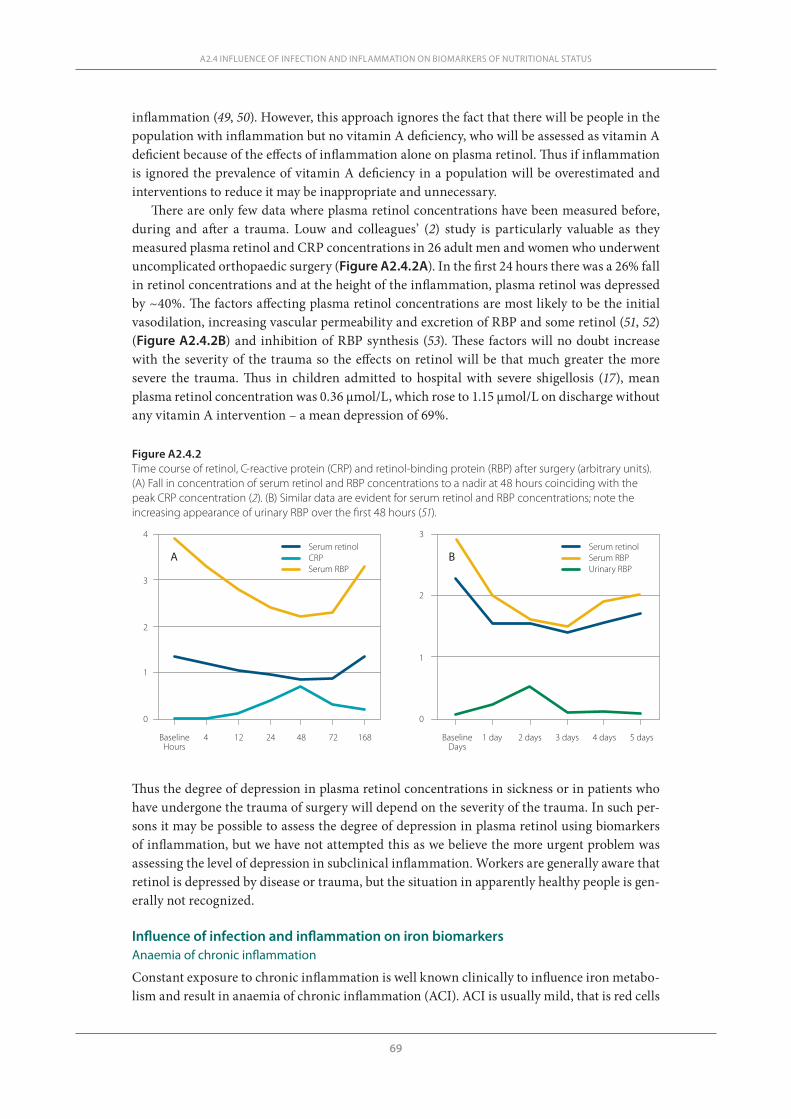
69
inflammation (49, 50). However, this approach ignores the fact that there will be people in the population with inflammation but no vitamin A deficiency, who will be assessed as vitamin A deficient because of the effects of inflammation alone on plasma retinol. Thus if inflammation is ignored the prevalence of vitamin A deficiency in a population will be overestimated and interventions to reduce it may be inappropriate and unnecessary.
There are only few data where plasma retinol concentrations have been measured before, during and after a trauma. Louw and colleagues’ (2) study is particularly valuable as they measured plasma retinol and CRP concentrations in 26 adult men and women who underwent uncomplicated orthopaedic surgery (Figure A2.4.2A). In the first 24 hours there was a 26% fall in retinol concentrations and at the height of the inflammation, plasma retinol was depressed by ~40%. The factors affecting plasma retinol concentrations are most likely to be the initial vasodilation, increasing vascular permeability and excretion of RBP and some retinol (51, 52) (Figure A2.4.2B) and inhibition of RBP synthesis (53). These factors will no doubt increase with the severity of the trauma so the effects on retinol will be that much greater the more severe the trauma. Thus in children admitted to hospital with severe shigellosis (17), mean plasma retinol concentration was 0.36 μmol/L, which rose to 1.15 μmol/L on discharge without any vitamin A intervention – a mean depression of 69%.
A2.4 INFLUENCE OF INFECTION AND INFLAMMATION ON BIOMARKERS OF NUTRITIONAL STATUS
Figure A2.4.2Time course of retinol, C-reactive protein (CRP) and retinol-binding protein (RBP) after surgery (arbitrary units). (A) Fall in concentration of serum retinol and RBP concentrations to a nadir at 48 hours coinciding with the peak CRP concentration (2). (B) Similar data are evident for serum retinol and RBP concentrations; note the increasing appearance of urinary RBP over the first 48 hours (51).
A B
4 12 24 48 72 168 1 day 2 days 3 days 4 days 5 daysBaselineHours
BaselineDays
0
1
2
3
4
0
1
2
3Serum retinolCRPSerum RBP
Serum retinolSerum RBPUrinary RBP
Thus the degree of depression in plasma retinol concentrations in sickness or in patients who have undergone the trauma of surgery will depend on the severity of the trauma. In such per-sons it may be possible to assess the degree of depression in plasma retinol using biomarkers of inflammation, but we have not attempted this as we believe the more urgent problem was assessing the level of depression in subclinical inflammation. Workers are generally aware that retinol is depressed by disease or trauma, but the situation in apparently healthy people is gen-erally not recognized.
Influence of infection and inflammation on iron biomarkersAnaemia of chronic inflammation
Constant exposure to chronic inflammation is well known clinically to influence iron metabo-lism and result in anaemia of chronic inflammation (ACI). ACI is usually mild, that is red cells
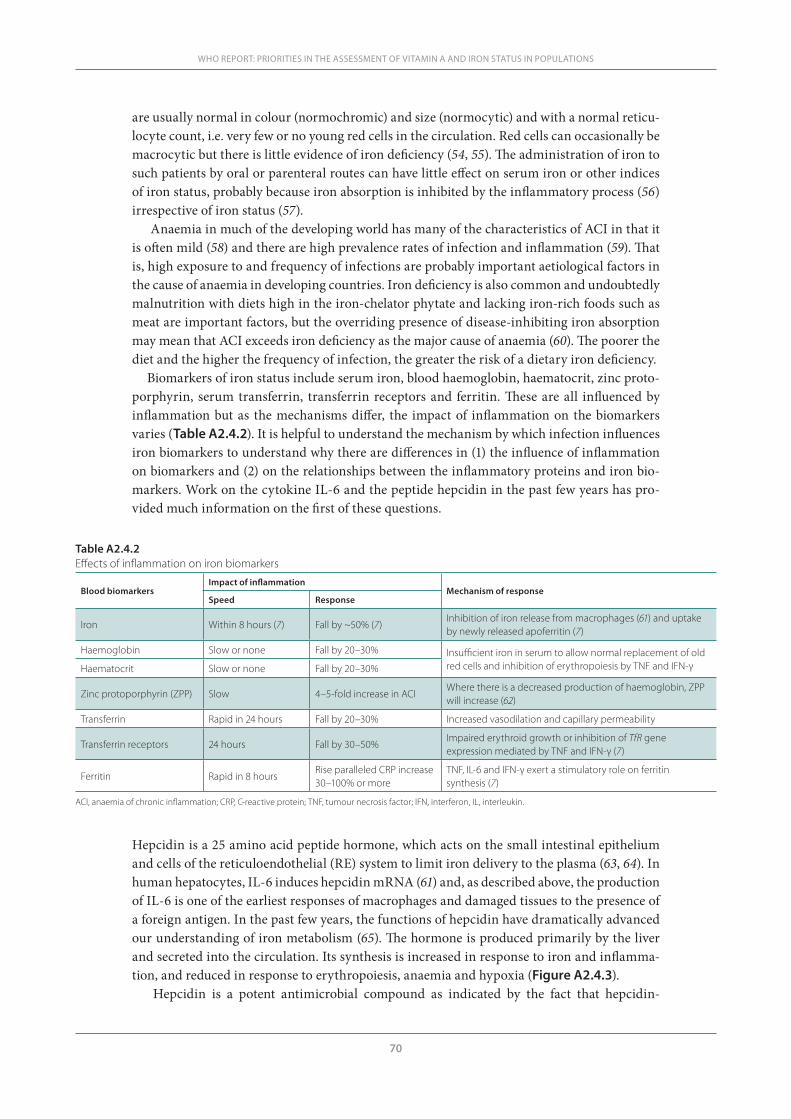
70
WHO REPORT: PRIORITIES IN THE ASSESSMENT OF VITAMIN A AND IRON STATUS IN POPULATIONS
are usually normal in colour (normochromic) and size (normocytic) and with a normal reticu-locyte count, i.e. very few or no young red cells in the circulation. Red cells can occasionally be macrocytic but there is little evidence of iron deficiency (54, 55). The administration of iron to such patients by oral or parenteral routes can have little effect on serum iron or other indices of iron status, probably because iron absorption is inhibited by the inflammatory process (56) irrespective of iron status (57).
Anaemia in much of the developing world has many of the characteristics of ACI in that it is often mild (58) and there are high prevalence rates of infection and inflammation (59). That is, high exposure to and frequency of infections are probably important aetiological factors in the cause of anaemia in developing countries. Iron deficiency is also common and undoubtedly malnutrition with diets high in the iron-chelator phytate and lacking iron-rich foods such as meat are important factors, but the overriding presence of disease-inhibiting iron absorption may mean that ACI exceeds iron deficiency as the major cause of anaemia (60). The poorer the diet and the higher the frequency of infection, the greater the risk of a dietary iron deficiency.
Biomarkers of iron status include serum iron, blood haemoglobin, haematocrit, zinc proto-porphyrin, serum transferrin, transferrin receptors and ferritin. These are all influenced by inflammation but as the mechanisms differ, the impact of inflammation on the biomarkers varies (Table A2.4.2). It is helpful to understand the mechanism by which infection influences iron biomarkers to understand why there are differences in (1) the influence of inflammation on biomarkers and (2) on the relationships between the inflammatory proteins and iron bio-markers. Work on the cytokine IL-6 and the peptide hepcidin in the past few years has pro-vided much information on the first of these questions.
Table A2.4.2Effects of inflammation on iron biomarkers
Blood biomarkersImpact of inflammation
Mechanism of responseSpeed Response
Iron Within 8 hours (7) Fall by ~50% (7)Inhibition of iron release from macrophages (61) and uptake by newly released apoferritin (7)
Haemoglobin Slow or none Fall by 20–30% Insufficient iron in serum to allow normal replacement of old red cells and inhibition of erythropoiesis by TNF and IFN-γHaematocrit Slow or none Fall by 20–30%
Zinc protoporphyrin (ZPP) Slow 4–5-fold increase in ACIWhere there is a decreased production of haemoglobin, ZPP will increase (62)
Transferrin Rapid in 24 hours Fall by 20–30% Increased vasodilation and capillary permeability
Transferrin receptors 24 hours Fall by 30–50%Impaired erythroid growth or inhibition of TfR gene expression mediated by TNF and IFN-γ (7)
Ferritin Rapid in 8 hoursRise paralleled CRP increase 30–100% or more
TNF, IL-6 and IFN-γ exert a stimulatory role on ferritin synthesis (7)
ACI, anaemia of chronic inflammation; CRP, C-reactive protein; TNF, tumour necrosis factor; IFN, interferon, IL, interleukin.
Hepcidin is a 25 amino acid peptide hormone, which acts on the small intestinal epithelium and cells of the reticuloendothelial (RE) system to limit iron delivery to the plasma (63, 64). In human hepatocytes, IL-6 induces hepcidin mRNA (61) and, as described above, the production of IL-6 is one of the earliest responses of macrophages and damaged tissues to the presence of a foreign antigen. In the past few years, the functions of hepcidin have dramatically advanced our understanding of iron metabolism (65). The hormone is produced primarily by the liver and secreted into the circulation. Its synthesis is increased in response to iron and inflamma-tion, and reduced in response to erythropoiesis, anaemia and hypoxia (Figure A2.4.3).
Hepcidin is a potent antimicrobial compound as indicated by the fact that hepcidin-
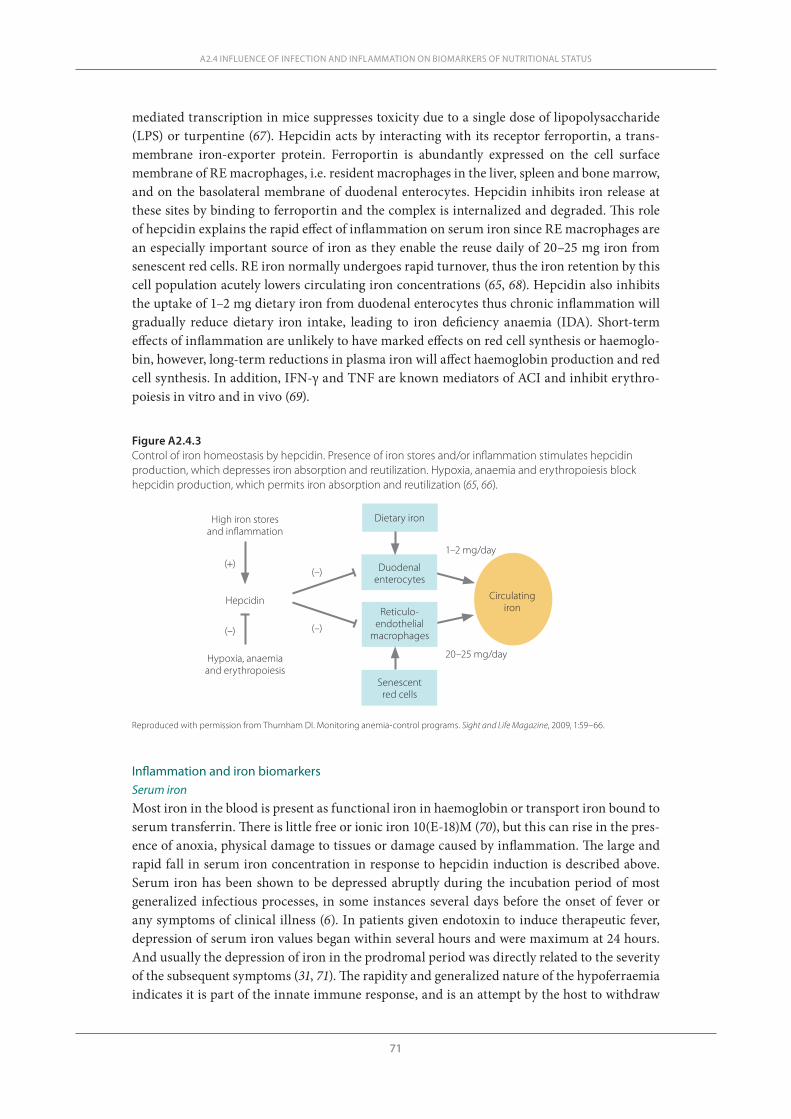
71
mediated transcription in mice suppresses toxicity due to a single dose of lipopolysaccharide (LPS) or turpentine (67). Hepcidin acts by interacting with its receptor ferroportin, a trans-membrane iron-exporter protein. Ferroportin is abundantly expressed on the cell surface membrane of RE macrophages, i.e. resident macrophages in the liver, spleen and bone marrow, and on the basolateral membrane of duodenal enterocytes. Hepcidin inhibits iron release at these sites by binding to ferroportin and the complex is internalized and degraded. This role of hepcidin explains the rapid effect of inflammation on serum iron since RE macrophages are an especially important source of iron as they enable the reuse daily of 20–25 mg iron from senescent red cells. RE iron normally undergoes rapid turnover, thus the iron retention by this cell population acutely lowers circulating iron concentrations (65, 68). Hepcidin also inhibits the uptake of 1–2 mg dietary iron from duodenal enterocytes thus chronic inflammation will gradually reduce dietary iron intake, leading to iron deficiency anaemia (IDA). Short-term effects of inflammation are unlikely to have marked effects on red cell synthesis or haemoglo-bin, however, long-term reductions in plasma iron will affect haemoglobin production and red cell synthesis. In addition, IFN-γ and TNF are known mediators of ACI and inhibit erythro-poiesis in vitro and in vivo (69).
A2.4 INFLUENCE OF INFECTION AND INFLAMMATION ON BIOMARKERS OF NUTRITIONAL STATUS
Figure A2.4.3Control of iron homeostasis by hepcidin. Presence of iron stores and/or inflammation stimulates hepcidin production, which depresses iron absorption and reutilization. Hypoxia, anaemia and erythropoiesis block hepcidin production, which permits iron absorption and reutilization (65, 66).
Dietary iron
Duodenal enterocytes
Senescent red cells
Reticulo-endothelial
macrophages
Circulatingiron
High iron stores and inflammation
Hepcidin
Hypoxia, anaemia and erythropoiesis
(+)
(–)(–)
(–)
20–25 mg/day
1–2 mg/day
Inflammation and iron biomarkersSerum iron Most iron in the blood is present as functional iron in haemoglobin or transport iron bound to serum transferrin. There is little free or ionic iron 10(E-18)M (70), but this can rise in the pres-ence of anoxia, physical damage to tissues or damage caused by inflammation. The large and rapid fall in serum iron concentration in response to hepcidin induction is described above. Serum iron has been shown to be depressed abruptly during the incubation period of most generalized infectious processes, in some instances several days before the onset of fever or any symptoms of clinical illness (6). In patients given endotoxin to induce therapeutic fever, depression of serum iron values began within several hours and were maximum at 24 hours. And usually the depression of iron in the prodromal period was directly related to the severity of the subsequent symptoms (31, 71). The rapidity and generalized nature of the hypoferraemia indicates it is part of the innate immune response, and is an attempt by the host to withdraw
Reproduced with permission from Thurnham DI. Monitoring anemia-control programs. Sight and Life Magazine, 2009, 1:59–66.
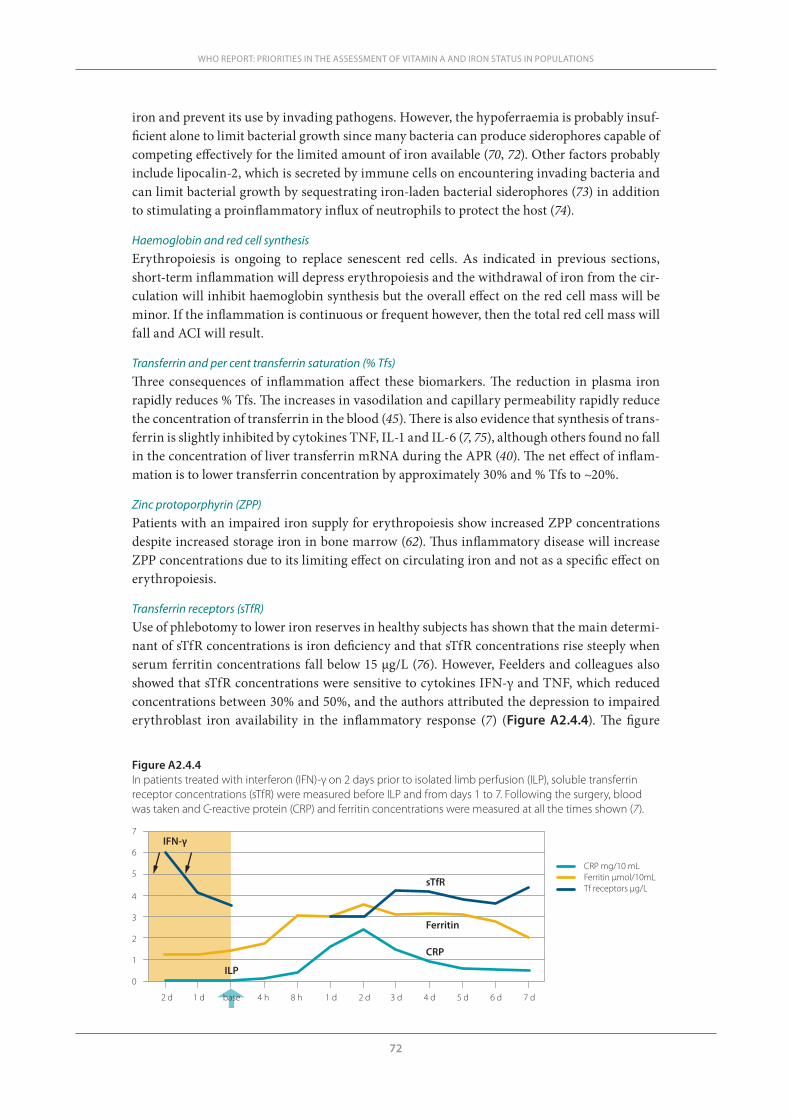
72
WHO REPORT: PRIORITIES IN THE ASSESSMENT OF VITAMIN A AND IRON STATUS IN POPULATIONS
iron and prevent its use by invading pathogens. However, the hypoferraemia is probably insuf-ficient alone to limit bacterial growth since many bacteria can produce siderophores capable of competing effectively for the limited amount of iron available (70, 72). Other factors probably include lipocalin-2, which is secreted by immune cells on encountering invading bacteria and can limit bacterial growth by sequestrating iron-laden bacterial siderophores (73) in addition to stimulating a proinflammatory influx of neutrophils to protect the host (74).
Haemoglobin and red cell synthesisErythropoiesis is ongoing to replace senescent red cells. As indicated in previous sections, short-term inflammation will depress erythropoiesis and the withdrawal of iron from the cir-culation will inhibit haemoglobin synthesis but the overall effect on the red cell mass will be minor. If the inflammation is continuous or frequent however, then the total red cell mass will fall and ACI will result.
Transferrin and per cent transferrin saturation (% Tfs) Three consequences of inflammation affect these biomarkers. The reduction in plasma iron rapidly reduces % Tfs. The increases in vasodilation and capillary permeability rapidly reduce the concentration of transferrin in the blood (45). There is also evidence that synthesis of trans-ferrin is slightly inhibited by cytokines TNF, IL-1 and IL-6 (7, 75), although others found no fall in the concentration of liver transferrin mRNA during the APR (40). The net effect of inflam-mation is to lower transferrin concentration by approximately 30% and % Tfs to ~20%.
Zinc protoporphyrin (ZPP) Patients with an impaired iron supply for erythropoiesis show increased ZPP concentrations despite increased storage iron in bone marrow (62). Thus inflammatory disease will increase ZPP concentrations due to its limiting effect on circulating iron and not as a specific effect on erythropoiesis.
Transferrin receptors (sTfR)Use of phlebotomy to lower iron reserves in healthy subjects has shown that the main determi-nant of sTfR concentrations is iron deficiency and that sTfR concentrations rise steeply when serum ferritin concentrations fall below 15 μg/L (76). However, Feelders and colleagues also showed that sTfR concentrations were sensitive to cytokines IFN-γ and TNF, which reduced concentrations between 30% and 50%, and the authors attributed the depression to impaired erythroblast iron availability in the inflammatory response (7) (Figure A2.4.4). The figure
Figure A2.4.4In patients treated with interferon (IFN)-γ on 2 days prior to isolated limb perfusion (ILP), soluble transferrin receptor concentrations (sTfR) were measured before ILP and from days 1 to 7. Following the surgery, blood was taken and C-reactive protein (CRP) and ferritin concentrations were measured at all the times shown (7).
0
1
2
3
4
5
6
7
2 d 1 d base 4 h 8 h 1 d 2 d 3 d 4 d 5 d 6 d 7 d
IFN-γ
ILP
sTfR
CRP
Ferritin
CRP mg/10 mLFerritin µmol/10mLTf receptors µg/L
73
shows that sTfR concentrations were initially depressed by the IFN-γ treatment and remained low during the 7 days following limb surgery. Other workers have also reported lower sTfR concentrations in patients with inflammation associated with malaria (8) and HIV (77).
Ferritin It is well established that serum ferritin concentrations are proportional to liver reserves of iron but that ferritin is increased by inflammation (60, 78). The sequential changes in CRP and fer-ritin concentrations following the inflammatory stimulus of limb isolation in 12 patients with melanomas or sarcomas is shown in Figure A2.4.4. Ferritin concentrations were minimally affected by treatments with IFN-γ over 2 days before surgery but following limb perfusion there were rapid increases in systemic TNF and IL-6. Subsequently ferritin and CRP concen-trations increased over the first 48 hours but then deviated (7). CRP concentrations fell but fer-ritin concentrations were still raised even on day 7. Others have also noted that serum ferritin concentrations parallel CRP concentrations in both acute and chronic diseases and that with recovery from illness, there is a sharp drop in CRP but not in ferritin concentrations (43). It was suggested that the persistence of ferritin might be due to a longer half-life than CRP or that erythropoiesis was still depressed (43).
Transferrin receptor/serum ferritin ratio (R/F ratio)The R/F ratio can be used to provide an estimate of body iron and is superior to earlier esti-mates of body iron that relied on haemoglobin, serum ferritin, erythrocyte protoporphyrin, serum iron and total iron-binding capacity (60). However, in spite of its advantage in being obtainable from a finger-stick sample, it still requires the measurement of serum ferritin and is therefore influenced by inflammation or liver disease. The authors suggest, however, that the R/F algorithm may be modifiable by suitable markers of inflammation (60) and it is pos-sible that the correction factors produced by the ferritin meta-analysis described in the next section (79) could be incorporated. The use of CRP only is not entirely suitable to address the problem of inflammation because of the different decay rates of CRP and ferritin (43, 80).
Outline of meta-analysis methods to calculate correction factors for retinol and ferritin Retinol meta-analysis
As indicated in the earlier sections of this review, plasma retinol concentrations fall rapidly with the onset of infection or trauma. The extent of the fall will depend on the severity of the trauma. In the case of subclinical inflammation, however, the effects on nutritional status will be, by definition, only mild and there should be little variation between populations or between people exposed to or recovering from different diseases. This, of course, assumes that normal nutritional status will be the same in different populations and it has been generally accepted, as the same cut-offs are applied to plasma retinol concentrations regardless of population (50).
As described above, two APPs, CRP and AGP, are useful to identify those with inflamma-tion and also characterize the temporal aspects of inflammation. We identified 15 studies with data on retinol and one or more APPs. Six of these had sufficient data in all subgroups on CRP and AGP and an additional study included ACT and AGP. ACT has similar characteristics to CRP (47) but all analyses were run with and without the latter study to ensure comparability of data. To define inflammation we used the cut-off values of >5 mg/L for CRP, >1 g/L for AGP, >0.6 g/L for ACT and >5 mg/L for SAA and then allocated the apparently healthy subjects in each study into four groups: reference (those with no raised APP), incubating (those with a raised CRP only), early convalescence (those with raised CRP and AGP) and late convalescence (those with a raised AGP only).
A2.4 INFLUENCE OF INFECTION AND INFLAMMATION ON BIOMARKERS OF NUTRITIONAL STATUS
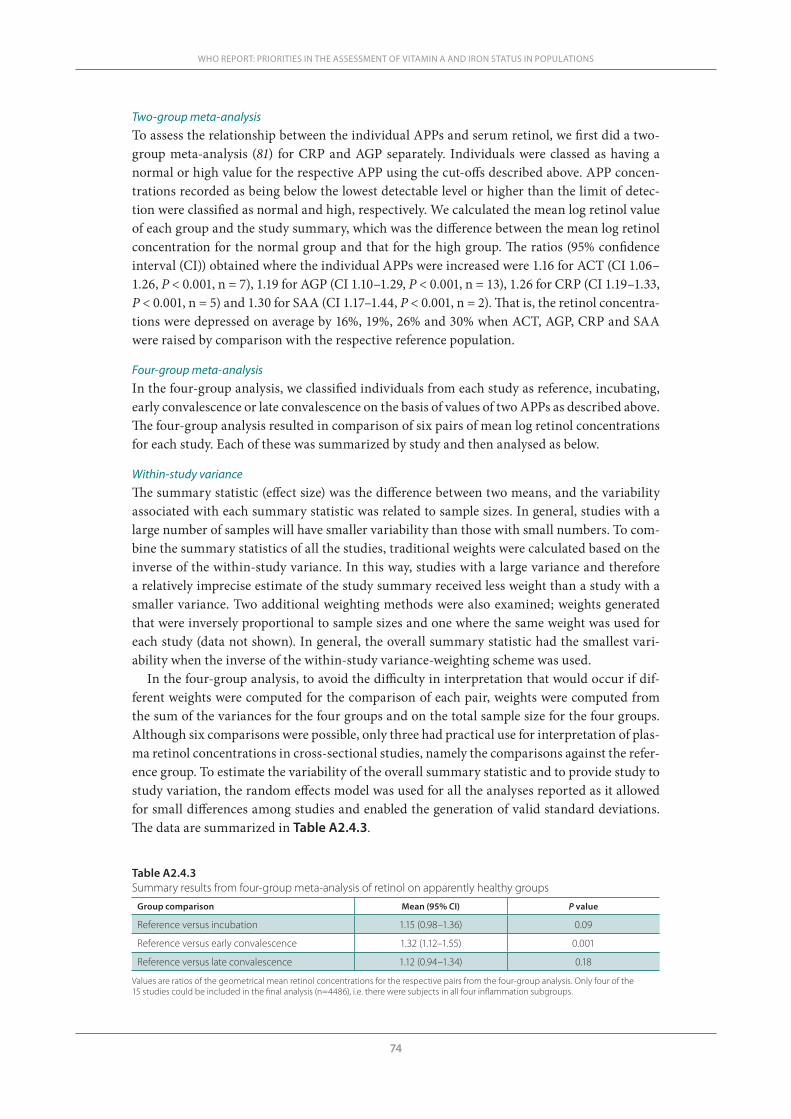
74
WHO REPORT: PRIORITIES IN THE ASSESSMENT OF VITAMIN A AND IRON STATUS IN POPULATIONS
Two-group meta-analysisTo assess the relationship between the individual APPs and serum retinol, we first did a two-group meta-analysis (81) for CRP and AGP separately. Individuals were classed as having a normal or high value for the respective APP using the cut-offs described above. APP concen-trations recorded as being below the lowest detectable level or higher than the limit of detec-tion were classified as normal and high, respectively. We calculated the mean log retinol value of each group and the study summary, which was the difference between the mean log retinol concentration for the normal group and that for the high group. The ratios (95% confidence interval (CI)) obtained where the individual APPs were increased were 1.16 for ACT (CI 1.06–1.26, P < 0.001, n = 7), 1.19 for AGP (CI 1.10–1.29, P < 0.001, n = 13), 1.26 for CRP (CI 1.19–1.33, P < 0.001, n = 5) and 1.30 for SAA (CI 1.17–1.44, P < 0.001, n = 2). That is, the retinol concentra-tions were depressed on average by 16%, 19%, 26% and 30% when ACT, AGP, CRP and SAA were raised by comparison with the respective reference population.
Four-group meta-analysisIn the four-group analysis, we classified individuals from each study as reference, incubating, early convalescence or late convalescence on the basis of values of two APPs as described above. The four-group analysis resulted in comparison of six pairs of mean log retinol concentrations for each study. Each of these was summarized by study and then analysed as below.
Within-study varianceThe summary statistic (effect size) was the difference between two means, and the variability associated with each summary statistic was related to sample sizes. In general, studies with a large number of samples will have smaller variability than those with small numbers. To com-bine the summary statistics of all the studies, traditional weights were calculated based on the inverse of the within-study variance. In this way, studies with a large variance and therefore a relatively imprecise estimate of the study summary received less weight than a study with a smaller variance. Two additional weighting methods were also examined; weights generated that were inversely proportional to sample sizes and one where the same weight was used for each study (data not shown). In general, the overall summary statistic had the smallest vari-ability when the inverse of the within-study variance-weighting scheme was used.
In the four-group analysis, to avoid the difficulty in interpretation that would occur if dif-ferent weights were computed for the comparison of each pair, weights were computed from the sum of the variances for the four groups and on the total sample size for the four groups. Although six comparisons were possible, only three had practical use for interpretation of plas-ma retinol concentrations in cross-sectional studies, namely the comparisons against the refer-ence group. To estimate the variability of the overall summary statistic and to provide study to study variation, the random effects model was used for all the analyses reported as it allowed for small differences among studies and enabled the generation of valid standard deviations. The data are summarized in Table A2.4.3.
Table A2.4.3Summary results from four-group meta-analysis of retinol on apparently healthy groups
Group comparison Mean (95% CI) P value
Reference versus incubation 1.15 (0.98–1.36) 0.09
Reference versus early convalescence 1.32 (1.12–1.55) 0.001
Reference versus late convalescence 1.12 (0.94–1.34) 0.18
Values are ratios of the geometrical mean retinol concentrations for the respective pairs from the four-group analysis. Only four of the 15 studies could be included in the final analysis (n=4486), i.e. there were subjects in all four inflammation subgroups.
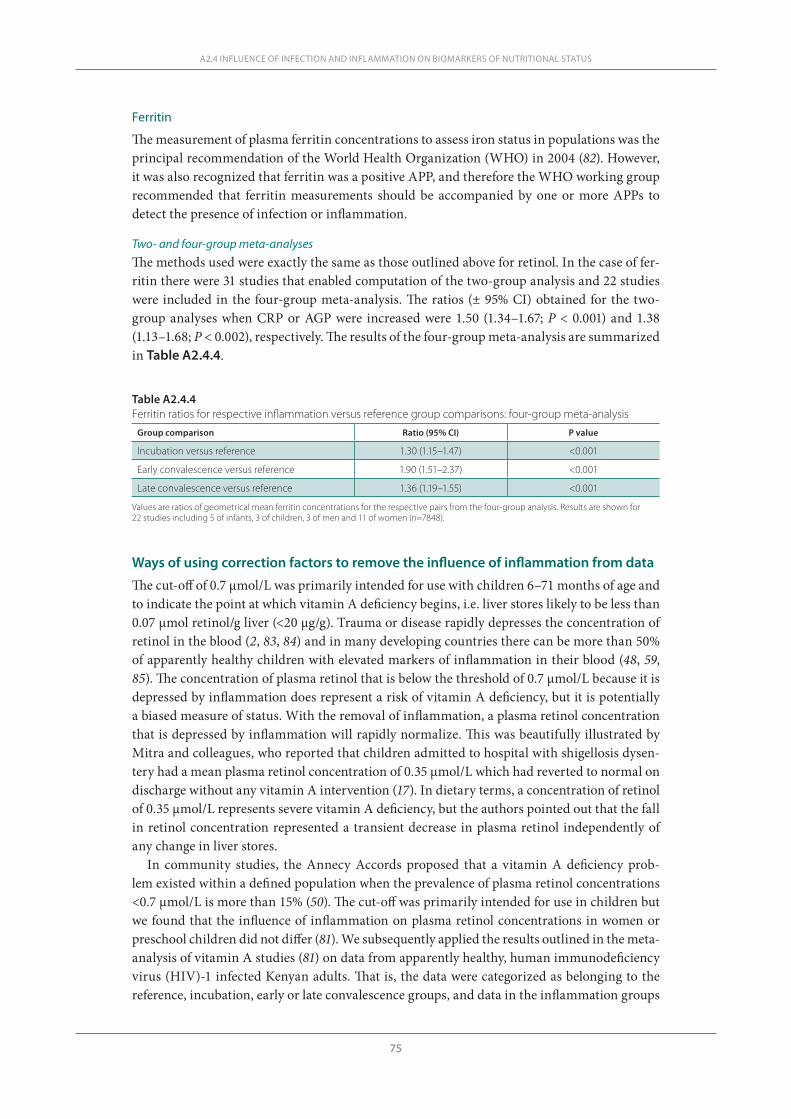
75
Ferritin
The measurement of plasma ferritin concentrations to assess iron status in populations was the principal recommendation of the World Health Organization (WHO) in 2004 (82). However, it was also recognized that ferritin was a positive APP, and therefore the WHO working group recommended that ferritin measurements should be accompanied by one or more APPs to detect the presence of infection or inflammation.
Two- and four-group meta-analysesThe methods used were exactly the same as those outlined above for retinol. In the case of fer-ritin there were 31 studies that enabled computation of the two-group analysis and 22 studies were included in the four-group meta-analysis. The ratios (± 95% CI) obtained for the two-group analyses when CRP or AGP were increased were 1.50 (1.34–1.67; P < 0.001) and 1.38 (1.13–1.68; P < 0.002), respectively. The results of the four-group meta-analysis are summarized in Table A2.4.4.
A2.4 INFLUENCE OF INFECTION AND INFLAMMATION ON BIOMARKERS OF NUTRITIONAL STATUS
Table A2.4.4Ferritin ratios for respective inflammation versus reference group comparisons: four-group meta-analysis
Group comparison Ratio (95% CI) P value
Incubation versus reference 1.30 (1.15–1.47) <0.001
Early convalescence versus reference 1.90 (1.51–2.37) <0.001
Late convalescence versus reference 1.36 (1.19–1.55) <0.001
Values are ratios of geometrical mean ferritin concentrations for the respective pairs from the four-group analysis. Results are shown for 22 studies including 5 of infants, 3 of children, 3 of men and 11 of women (n=7848).
Ways of using correction factors to remove the influence of inflammation from data
The cut-off of 0.7 μmol/L was primarily intended for use with children 6–71 months of age and to indicate the point at which vitamin A deficiency begins, i.e. liver stores likely to be less than 0.07 μmol retinol/g liver (<20 μg/g). Trauma or disease rapidly depresses the concentration of retinol in the blood (2, 83, 84) and in many developing countries there can be more than 50% of apparently healthy children with elevated markers of inflammation in their blood (48, 59, 85). The concentration of plasma retinol that is below the threshold of 0.7 μmol/L because it is depressed by inflammation does represent a risk of vitamin A deficiency, but it is potentially a biased measure of status. With the removal of inflammation, a plasma retinol concentration that is depressed by inflammation will rapidly normalize. This was beautifully illustrated by Mitra and colleagues, who reported that children admitted to hospital with shigellosis dysen-tery had a mean plasma retinol concentration of 0.35 μmol/L which had reverted to normal on discharge without any vitamin A intervention (17). In dietary terms, a concentration of retinol of 0.35 μmol/L represents severe vitamin A deficiency, but the authors pointed out that the fall in retinol concentration represented a transient decrease in plasma retinol independently of any change in liver stores.
In community studies, the Annecy Accords proposed that a vitamin A deficiency prob-lem existed within a defined population when the prevalence of plasma retinol concentrations <0.7 μmol/L is more than 15% (50). The cut-off was primarily intended for use in children but we found that the influence of inflammation on plasma retinol concentrations in women or preschool children did not differ (81). We subsequently applied the results outlined in the meta-analysis of vitamin A studies (81) on data from apparently healthy, human immunodeficiency virus (HIV)-1 infected Kenyan adults. That is, the data were categorized as belonging to the reference, incubation, early or late convalescence groups, and data in the inflammation groups
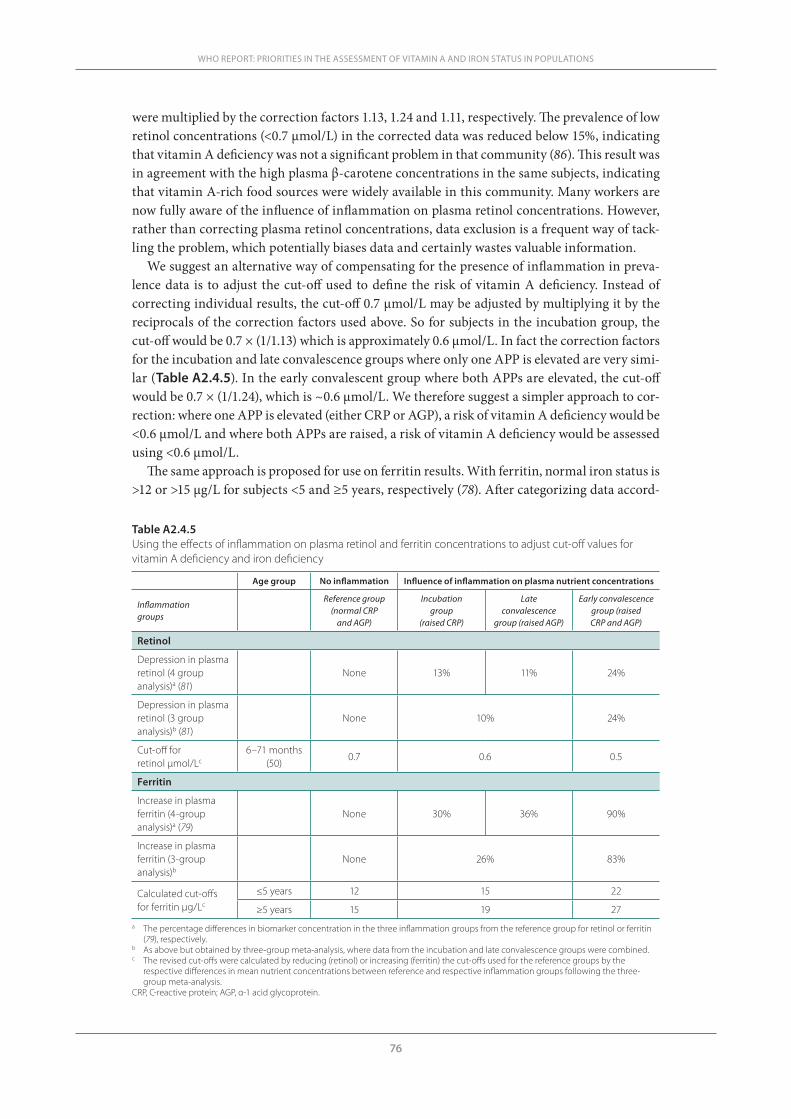
76
WHO REPORT: PRIORITIES IN THE ASSESSMENT OF VITAMIN A AND IRON STATUS IN POPULATIONS
were multiplied by the correction factors 1.13, 1.24 and 1.11, respectively. The prevalence of low retinol concentrations (<0.7 µmol/L) in the corrected data was reduced below 15%, indicating that vitamin A deficiency was not a significant problem in that community (86). This result was in agreement with the high plasma β-carotene concentrations in the same subjects, indicating that vitamin A-rich food sources were widely available in this community. Many workers are now fully aware of the influence of inflammation on plasma retinol concentrations. However, rather than correcting plasma retinol concentrations, data exclusion is a frequent way of tack-ling the problem, which potentially biases data and certainly wastes valuable information.
We suggest an alternative way of compensating for the presence of inflammation in preva-lence data is to adjust the cut-off used to define the risk of vitamin A deficiency. Instead of correcting individual results, the cut-off 0.7 μmol/L may be adjusted by multiplying it by the reciprocals of the correction factors used above. So for subjects in the incubation group, the cut-off would be 0.7 × (1/1.13) which is approximately 0.6 μmol/L. In fact the correction factors for the incubation and late convalescence groups where only one APP is elevated are very simi-lar (Table A2.4.5). In the early convalescent group where both APPs are elevated, the cut-off would be 0.7 × (1/1.24), which is ~0.6 μmol/L. We therefore suggest a simpler approach to cor-rection: where one APP is elevated (either CRP or AGP), a risk of vitamin A deficiency would be <0.6 μmol/L and where both APPs are raised, a risk of vitamin A deficiency would be assessed using <0.6 μmol/L.
The same approach is proposed for use on ferritin results. With ferritin, normal iron status is >12 or >15 μg/L for subjects <5 and ≥5 years, respectively (78). After categorizing data accord-
Table A2.4.5Using the effects of inflammation on plasma retinol and ferritin concentrations to adjust cut-off values for vitamin A deficiency and iron deficiency
Age group No inflammation Influence of inflammation on plasma nutrient concentrations
Inflammation groups
Reference group (normal CRP
and AGP)
Incubation group
(raised CRP)
Late convalescence
group (raised AGP)
Early convalescence group (raised CRP and AGP)
Retinol
Depression in plasma retinol (4 group analysis)a (81)
None 13% 11% 24%
Depression in plasma retinol (3 group analysis)b (81)
None 10% 24%
Cut-off for retinol μmol/Lc
6–71 months (50)
0.7 0.6 0.5
Ferritin
Increase in plasma ferritin (4-group analysis)a (79)
None 30% 36% 90%
Increase in plasma ferritin (3-group analysis)b
None 26% 83%
Calculated cut-offs for ferritin μg/Lc
≤5 years 12 15 22
≥5 years 15 19 27a The percentage differences in biomarker concentration in the three inflammation groups from the reference group for retinol or ferritin
(79), respectively.b As above but obtained by three-group meta-analysis, where data from the incubation and late convalescence groups were combined.c The revised cut-offs were calculated by reducing (retinol) or increasing (ferritin) the cut-offs used for the reference groups by the
respective differences in mean nutrient concentrations between reference and respective inflammation groups following the three-group meta-analysis.
CRP, C-reactive protein; AGP, α-1 acid glycoprotein.
77
A2.4 INFLUENCE OF INFECTION AND INFLAMMATION ON BIOMARKERS OF NUTRITIONAL STATUS
ing to inflammation status results for subjects in the incubation, early and late convalescence groups could be either individually corrected using multipliers 0.77, 0.53 and 0.75, respective-ly (79), and the data then assessed using the standard cut-offs of 12 and 15 μg/L, according to the age of the subject. Alternatively, the cut-offs of 12 and 15 μg/L can be adjusted by dividing the same factors (Table A2.4.5). For subjects <5 years, ferritin cut-offs of 12, 15 and 23 would define iron deficiency in subjects with no evidence of inflammation, with one raised APP and with two raised APPs, respectively. For subjects ≥5 years, the corresponding ferritin cut-offs would be 15, 19 and 28 μg/L.
Conclusion
Many nutrients or nutrient biomarkers are influenced by infection and tissue damage. The effects may be present in the absence of clinical evidence of disease. APPs are relatively stable markers of infection and inflammation and changes in blood nutrient concentrations can be matched with changes in APPs. Using APPs, we have shown how the changes in retinol and ferritin associated with the different stages of the infection cycle can be quantified and cor-rection factors produced, which can remove the influence of inflammation from the nutrient concentration in apparently healthy people.
References1. Thurnham DI. Impact of disease on markers of micronutrient status. Proceedings of the Nutrition Soci-
ety, 1997, 56:421–431.2. Louw JA et al. Blood vitamin concentrations during the acute-phase response. Critical Care Medicine,
1992, 20:934–941.3. Thurnham DI, Singkamani R. The acute phase response and vitamin A status in malaria. Transactions
of the Royal Society of Tropical Medicine and Hygiene, 1991, 85:194–199.4. Duncan A et al. Quantitative data on the magnitude of the systemic inflammatory response and its effect
on micronutrient status based on plasma measurements. American Journal of Clinical Nutrition, 2012, 95:64–71.
5. Reid D et al. The relation between acute changes in the systemic inflammatory response and plasma 25-hydroxyvitamin D concentrations after elective knee arthroplasty. American Journal of Clinical Nu-trition, 2011, 93:1006–1011.
6. Beisel WR. Trace elements in infectious processes. Medical Clinics of North America, 1976, 60:831–849.7. Feelders RA et al. Regulation of iron metabolism in the acute-phase response: interferon-g and tumor
necrosis factor-a induce hypoferraemia, ferritin production and a decrease in circulating transferrin receptors in cancer patients. European Society for Clinical Investigation, 1998, 28:520–527.
8. Beesley R et al. Impact of acute malaria on plasma concentrations of transferrin receptors. Transactions of the Royal Society of Tropical Medicine and Hygiene, 2000, 94:295–298.
9. Mburu ASW et al. The influence of inflammation on plasma zinc concentration in apparently-healthy, HIV+ Kenyan adults and zinc responses after a multi-micronutrient supplement. European Journal for Clinical Investigation, 2010, 64(5):510–517.
10. Kritchevsky SB et al. Serum carotenoids and markers of inflammation in non-smokers. American Jour-nal of Epidemiology, 2000, 152:1065–1071.
11. Erlinger TP et al. Relationship between systemic markers of inflammation and serum b-carotene levels. Archives of Internal Medicine, 2001, 161:1903–1908.
12. Boosalis MG et al. Acute phase response and plasma carotenoid concentrations in older women: find-ings from the Nun Study. Nutrition, 1996, 12:475–478.
13. Galloway P, McMillan DC, Sattar N. Effect of the inflammatory response on trace element and vitamin status. Annals of Clinical Biochemistry, 2000, 37:289–297.
14. Bates CJ et al. Plasma pyridoxal phosphate and pyridoxic acid and their relationship to plasma homo-cysteine in a representative sample of British men and women aged 65 years and over. British Journal of Nutrition, 1999, 81:191–201.
78
WHO REPORT: PRIORITIES IN THE ASSESSMENT OF VITAMIN A AND IRON STATUS IN POPULATIONS
15. Bondestam M, Foucard T, Gebre-Medhin M. Serum albumin, retinol-binding protein, thyroxin-bind-ing prealbumin and acute phase reactants as indicators of undernutrition in children with undue sus-ceptibility to acute infections. Acta Paediatrica Scandinavica, 1988, 77:94–98.
16. Reddy V et al. Relationship between measles, malnutrition, and blindness: a prospective study in Indian children. American Journal of Clinical Nutrition, 1986, 44:924–930.
17. Mitra AK et al. Predictors of serum retinol in children with shigellosis. American Journal of Clinical Nutrition, 1998, 68:1088–1094.
18. Irvin TT, Chattopadhyay K, Smythe A. Ascorbic acid requirements in postoperative patients. Surgery Gynecology and Obstetrics, 1978, 147:49–55.
19. Hume R, Weyers E. Changes in leucocyte ascorbic acid during the common cold. Scottish Medical Jour-nal, 1973, 18:3–7.
20. Djoumessi S. Serum lipids and lipoproteins during malaria infection. Pathologie Biologie, 1989, 37:909–911.
21. Nilsson-Ehle I, Nilsson-Ehle P. Changes in plasma lipoproteins in acute malaria. Journal of Interna-tional Medicine, 1990, 227:151–155.
22. Ali MM, Vaidya A. Vitamin D and cancer. Journal of Cancer Research and Therapeutics, 207, 3:225–230. 23. Chonchol M, Cigolini M, Targher G. Association between 25-hydroxyvitamin D deficiency and cardio-
vascular disease in type 2 diabetic patients with mild kidney dysfunction. Nephrology Dialysis Trans-plantation, 2007, 23:269–274.
24. Tomkins A. Assessing micronutrient status in the presence of inflammation. Journal of Nutrition, 2003, 133(5 Suppl. 2):1649S–1655S.
25. Gibson RS et al. Zinc, gravida, infection, and iron, but not vitamin B-12 or folate status, predict hemo-globin during pregnancy in Southern Ethiopia. Journal of Nutrition, 2008, 138(3):581–586.
26. Thurnham DI, Stephen JML. Biochemistry. Nutrition and health in old age. DHSS Reports on Health and Social Security No. 16. 1st ed. London, HMSO, 1979:79–90.
27. Riemersma RA et al. Vitamin C and the risk of acute myocardial infarction. American Journal of Clini-cal Nutrition, 2000, 71:1181–1186.
28. Pamuk ER et al. Effect of smoking on serum nutrient concentrations in African-American women. American Journal of Clinical Nutrition, 1994, 59:891–895.
29. Thurnham DI. Anti-oxidant vitamins and cancer prevention. Journal of Micronutrient Analysis, 1990, 7:279–299.
30. Weiss G, Wachter H, Fuchs D. Linkage of cell-mediated immunity to iron metabolism. Immunology Today, 1995, 16:495–500.
31. Pekarek RS et al. The effect of Francisella tularensis on iron metabolism in man. American Journal of Medical Sciences, 1969, 258:14–25.
32. Strube YNJ, Beard JL, Ross AC. Iron deficiency and marginal vitamin A deficiency affect growth, he-matological indices and the regulation of iron metabolism genes in rats. Journal of Nutrition, 2002, 132:3607–3615.
33. Hodges RE, Rucker RB, Gardner RH. Vitamin A deficiency and abnormal metabolism of iron. Annals of the New York Academy of Sciences, 1980, 355:58–61.
34. Suharno D et al. Supplementation with vitamin A and iron for nutritional anaemia in pregnant women in West Java, Indonesia. Lancet, 1993, 342:1325–1328.
35. Glasziou PP, Mackerras DEM. Vitamin A supplementation in infectious diseases: a meta-analysis. Brit-ish Medical Journal, 1993, 306:366–370.
36. Hussey GD, Klein M. A randomized, controlled trial of vitamin A in children with severe measles. New England Journal of Medicine, 1990, 323:160–164.
37. Mayo-Wilson E et al. Vitamin A supplements for preventing mortality, illness, and blindness in children aged under 5: systematic review and meta-analysis. British Medical Journal, 2011, 343:d5094.
38. Thurnham DI. Vitamin A, iron and haematopoiesis. Lancet, 1993, 342:1312–1313.39. Baumann H, Gauldie J. The acute phase response. Immunology Today, 1994, 15:74–80.40. Koj A. Definition and classification of acute-phase proteins. In: Gordon AH, Koj A, eds. The acute-phase
response to injury and infection, 1st ed. Amsterdam, Elsevier Science Publishers, 1985:139–144.41. Koj A. Biological functions of acute phase proteins. In: Gordon AH, Koj A, eds. The acute phase response
to injury and infection, 1st ed. Amsterdam, Elsevier Science Publishers, 1985:145–160.42. Engler R. Concept moderne de la résponse systématique de las phase aiguë de l’inflammation. Revue
Française d’Allergologie, 1996, 36:903–913.
79
43. Baynes RD et al. The non-immune inflammatory response: serial changes in plasma iron, iron-binding capacity, lactoferrin, ferritin and C-reactive protein. Scandinavian Journal of Clinical Laboratory Inves-tigation, 1986, 46:695–704.
44. Northrop-Clewes CA. Interpreting indicators of iron status during an acute phase response – lessons from malaria and HIV. Annals of Clinical Biochemistry, 2008, 45:18–32.
45. Fleck A, Myers MA. Diagnostic and prognostic significance of acute phase proteins. In: Gordon AH, Koj A, eds. The acute phase response to injury and infection, 1st ed. Amsterdam, Elsevier Science Publishers, 1985:249–271.
46. Koj A. Catabolism and turnover of acute-phase proteins. In: Gordon AH, Koj A, eds. The acute-phase response to injury and infection, 1st ed. Amsterdam, Elsevier Science Publishers, 1985:227–246.
47. Calvin J et al. The relative merits of acute phase proteins in the recognition of inflammatory conditions. Annals of Clinical Biochemistry, 1988, 25:60–66.
48. Paracha PI et al. Interpretation of vitamin A status in apparently-healthy Pakistani children using markers of sub-clinical infection. American Journal of Clinical Nutrition, 2000, 72:1164–1169.
49. de Pee S, Dary O. Biochemical indicators of vitamin A deficiency: serum retinol and serum retinol bind-ing protein. Journal of Nutrition, 2002, 132(Suppl. 9):2895S–2901S.
50. Sommer A, Davidson FR. Assessment of control and vitamin A deficiency: the Annecy accords. Journal of Nutrition, 2002, 132:2845S–2851S.
51. Ramsden DB et al. The inter-relationship of thyroid hormones, vitamin A and their binding proteins following acute stress. Clinical Endocrinology (Oxford), 1978, 8:109–122.
52. Stephensen CB et al. Vitamin A is excreted in the urine during acute infection. American Journal of Clinical Nutrition, 1994, 60:388–392.
53. Rosales FJ, Ross AC. Acute inflammation induces hyporetinemia and modifies the plasma and tissue response to vitamin A supplementation in marginally vitamin A-deficient rats. Journal of Nutrition, 1998, 128:960–966.
54. Means RTJr. The anaemia of infection. Baillieres Best Practice and Research Clinical Haematology, 2000, 13:151–162.
55. Abshire TC. The anemia of inflammation. A common cause of childhood anemia. Pediatric Clinics of North America, 1996, 43:623–637.
56. Beresford CH, Neale RJ, Brooks OG. Iron absorption and pyrexia. Lancet, 1971, i:568–572.57. Weber J et al. Decreased iron absorption in patients with active rheumatoid arthritis, with and without
iron deficiency. Annals of the Rheumatic Diseases, 1988, 47:404–409.58. Stoltzfus RJ. Rethinking anaemia surveillance. Lancet, 1997, 349:1764–1766.59. Darboe MK et al. Effectiveness of the new IVACG early high-dose vitamin A supplementation scheme
compared to the standard WHO protocol: A randomised controlled trial in Gambian mothers and in-fants. Lancet, 2007, 369:2088–2096.
60. Cook JD, Flowers CH, Skikne D. The quantitative assessment of body iron. Blood, 2003, 101:3359–3363.61. Nemeth E et al. IL-6 mediates hypoferremia of inflammation by inducing the synthesis of the iron regu-
latory hormone hepcidin. Journal of Clinical Investigations, 2004, 113:1271–1276.62. Hastka J et al. Zinc protoporphyrin in anemia of chronic disorders. Blood, 1993, 81:1200–1204.63. Darshan D, Anderson GJ. Liver-gut axis in the regulation of iron homeostasis. World Journal of Gastro-
enterology, 2007, 13:4737–4745.64. Ganz T. Molecular control of iron transport. Journal of the American Society of Nephrology, 2007,
18:394–400.65. Collins JF, Wessling-Resnick M, Knutson MD. Hepcidin regulation of iron transport. Journal of Nutri-
tion, 2008, 138:2284–2288.66. Nemeth E et al. Hepcidin, a putative mediator of anemia of inflammation, is a type II acute-phase pro-
tein. Blood, 2003, 101:2462–2463.67. De Domenico I et al. Hepcidin mediates transcriptional changes that modulate acute cytokine-induced
inflammatory responses in mice. Journal of Clinical Investigations, 2010, 120:2395–2405.68. Fleming RE. Iron and inflammation: cross-talk between pathways regulating hepcidin. Journal of Mo-
lecular Medicine, 2008, 86:491–494.69. Broxmeyer HE et al. The suppressive influences of human tumor necrosis factors on bone marrow he-
matopoietic progenitor cells from normal donors and patients with leukemia: synergism of tumor ne-crosis factor and interferon-gamma. Journal of Immunology, 1986, 136:4487–4495.
70. Bullen JJ. The significance of iron in infection. Reviews of Infectious Diseases, 1981, 3:1127–1138.
A2.4 INFLUENCE OF INFECTION AND INFLAMMATION ON BIOMARKERS OF NUTRITIONAL STATUS
80
WHO REPORT: PRIORITIES IN THE ASSESSMENT OF VITAMIN A AND IRON STATUS IN POPULATIONS
71. Pekarek RS et al. The effect of live attenuated Venezuelan equine encephalomyelitis virus vaccine on serum iron, zinc, and copper concentrations in man. Journal of Laboratory and Clinical Medicine, 1969, 76:293–303.
72. Barclay R. The role of iron in infection. Medical Laboratory Scientist, 1985, 42:166–177.73. Flo TH et al. Lipocalin 2 mediates an innate immune response to bacterial infection by sequestrating
iron. Nature, 2004, 16:917–921.74. Bachman MA, Miller VL, Weiser JN. Mucosal lipocalin 2 has pro-inflammatory and iron-sequestering
effects in response to bacterial enterobactin. PLoS Pathogens, 2009, 5:e1000622.75. Castell JV et al. Interleukin-6 is the major regulator of acute phase protein synthesis in adult human
hepatocytes. FEBS Letters, 1989, 242:237–239.76. Skikne BS, Flowers CH, Cook J. Serum transferrin receptor: a quantitative measure of tissue iron defi-
ciency. Blood, 2008, 75:1870–1876.77. Rawat R et al. Influence of inflammation as measured by alpha-1-acid glycoprotein on iron status indi-
cators among HIV-positive postpartum Zimbabwean women. European Journal of Clinical Nutrition, 2009, 63:787–793.
78. UNICEF, UNU, WHO. Iron deficiency anaemia. Assessment, prevention and control. A guide for pro-gramme managers. Geneva, World Health Organization, 2001.
79. Thurnham DI et al. Adjusting plasma ferritin concentrations to remove the effects of subclinical inflam-mation in the assessment of iron deficiency: a meta-analysis. American Journal of Clinical Nutrition, 2010, 92:546–555.
80. Cogswell ME et al. Assessment of iron deficiency in US preschool children and nonpregnant females of childbearing age: National Health and Nutrition Examination Survey 2003–2006. American Journal of Clinical Nutrition, 2009, 89:1334–1342.
81. Thurnham DI et al. Effect of subclinical infection on plasma retinol concentrations and assessment of prevalence of vitamin A deficiency: meta-analysis. Lancet, 2003, 362:2052–2058.
82. WHO/CDC. Assessing the iron status of populations including literature reviews. Report of a joint World Health Organization/Centers for Disease Control and Prevention technical consultation on the assessment of iron status at the population level, Geneva, Switzerland, 6–8 April 2004, 2nd ed. Geneva, World Health Organization, 2007.
83. Filteau SM et al. Influence of morbidity on serum retinol of children in a community-based study in northern Ghana. American Journal of Clinical Nutrition, 1993, 58:192–197.
84. Willumsen JF et al. Toxic damage to the respiratory epithelium induces acute phase changes in vitamin A metabolism without depleting retinol stores of South African children. Journal of Nutrition, 1997, 127:1339–1343.
85. Shankar AH et al. Effect of vitamin A supplementation on morbidity due to Plasmodium falciparum in young children in Papua New Guinea: a randomised trial. Lancet, 1999, 354:203–209.
86. Thurnham DI et al. Using plasma acute-phase protein concentrations to interpret nutritional biomark-ers in apparently healthy HIV-1-seropositive Kenyan adults. British Journal of Nutrition, 2008, 100:174–182.

For more information, please contact:
Department of Nutrition for Health and DevelopmentWorld Health OrganizationAvenue Appia 20, CH-1211 Geneva 27, SwitzerlandFax: +41 22 791 4156E-mail: [email protected]/nutrition
ISBN 978 92 4 150422 5