REPORT Wohkinp foh Meeting Date: May 12, 201 1 YOU ... · The Strategic Plan V Close Out report...
27
Wohkinp foh YOU REPORT Meeting Date: May 12, 201 1 Regional Council DATE: March 28, 201 1 REPORT TITLE: 2010 SEMI-ANNUAL FINANCIAL REPORT -YEAR END (UNAUDITED) FROM: Norma Trim, Chief Financial Officer and Commissioner of Corporate Services RECOMMENDATION That staff be authorized to implement the 2010 surplus management actions and administrative adjustments as outlined in the report of the Chief Financial Officer and Commissioner of Corporate Services titled "2010 Semi-Annual Financial Report - Year End (Unaudited)", dated March 28, 2011. Current Operations 0 The 2010 Regionally Controlled Tax Supported surplus of $30.7 million was created by changes in expenditures of $2.6 million and additional revenues of $28.1 million 0 Ontario Provincial Police (OPP) surplus was $0.8 million, and Peel Regional Police (PRP) was $0.2 million 0 Recommended allocation of $30 million to reduce the capital shortfall of $463 million and $0.7 million to maintain financial sustainability and $1.0 million to be allocated to Externally Funded Program reserves The 2010 Utility Rate program deficit was $4.0 million, due to rising electricity costs. Capital Operations Capital spending is $837.4 million gross and $640.5 million net for the twelve months ended December 31,201 0 Reserve and Reserve Funds DISCUSSION 1. CURRENT OPERATIONS The following report summarizes the financial status of Regional programs for the twelve months ended December 31, 2010 for Current Operations, Capital Operations, Reserves and Reserve Funds. a) Tax Supported Programs As reported to Council in the June 30, "Semi-Annual Financial Reporf - June 2010" report, the "Strategic Plan V:2007 - 2010 Final Reporf and Forecasted 2010 Financial Close Out"
Transcript of REPORT Wohkinp foh Meeting Date: May 12, 201 1 YOU ... · The Strategic Plan V Close Out report...
Wohkinp foh YOU
REPORT Meeting Date: May 12, 201 1
Regional Council
DATE: March 28, 201 1
REPORT TITLE: 2010 SEMI-ANNUAL FINANCIAL REPORT -YEAR END (UNAUDITED)
FROM: Norma Trim, Chief Financial Officer and Commissioner of Corporate Services
RECOMMENDATION
That staff be authorized to implement the 2010 surplus management actions and administrative adjustments as outlined in the report of the Chief Financial Officer and Commissioner of Corporate Services titled "2010 Semi-Annual Financial Report - Year End (Unaudited)", dated March 28, 2011.
Current Operations 0 The 2010 Regionally Controlled Tax Supported surplus of $30.7 million was created by
changes in expenditures of $2.6 million and additional revenues of $28.1 million 0 Ontario Provincial Police (OPP) surplus was $0.8 million, and Peel Regional Police (PRP)
was $0.2 million 0 Recommended allocation of $30 million to reduce the capital shortfall of $463 million and
$0.7 million to maintain financial sustainability and $1.0 million to be allocated to Externally Funded Program reserves The 2010 Utility Rate program deficit was $4.0 million, due to rising electricity costs.
Capital Operations Capital spending is $837.4 million gross and $640.5 million net for the twelve months ended December 31,201 0
Reserve and Reserve Funds
DISCUSSION
1. CURRENT OPERATIONS The following report summarizes the financial status of Regional programs for the twelve months ended December 31, 2010 for Current Operations, Capital Operations, Reserves and Reserve Funds.
a) Tax Supported Programs As reported to Council in the June 30, "Semi-Annual Financial Reporf - June 2010" report, the "Strategic Plan V:2007 - 2010 Final Reporf and Forecasted 2010 Financial Close Out"
68487
Rectangle
f i A - S t - 2 - March 28, 201 1 2010 SEMI-ANNUAL FINANCIAL REPORT -YEAR END (UNAUDITED)
report as well as during the 201 I Budget presentations financial results have benefited from a number of unanticipated variances to budget plan. After returning Working Fund Reserve draws which were not required, the 2010 Tax Supported operating surplus totaled $31.8 million including $0.8 million surplus for OPP and $0.2 million for PRP.. Appendix I provides a breakdown of the 2010 final financial results by program.
The June 30, 2010 Semi-Annual Financial Performance report to Council forecast a surplus of $17.8 million The Strategic Plan V Close Out report dated December 1, 2010 provided Council with an updated surplus forecast of $22.2 million . Subsequent to this report the Province announced a new funding formula and retroactive funding of $11.5 million for Ontario Works administration costs.
It is helpful to distinguish the drivers of the year end results between revenue and expenditure items as well as between anticipated and unanticipated.
With respect to revenues, 2010 was an unusual year. On a budget basis 26 per cent of expenditures are financed by transfers from senior levels of government. Ongoing advocacy efforts lead to additional provincial funding of $18.1 million. As reported to Council during the 201 1 Budget process additional provincial funding for fiscal 201 0 (Ontario Works Administration) was received in February 201 1. Of the additional provincial funding, $2.0 million was used to address the Seniors Dental waitlist ($1 . I million used in 2010 and $0.9 million carried forward to 201 I) , $1.4 million was set aside to phase in the tax impact of increasing the Community Grants program, and $2.3 million was returned to Best Start reserves. The 201 I Budget reflects the impact of base funding changes.
Additionally, Peel received higher than projected Supplementary Taxes ($7.5 million) in part attributable to an improving economy and in part due to process improvements at Municipal Property Assessment Corporation (MPAC). The 2011 Budget utilizes Area Municipal forecasts for Supplementary Taxes. When combined with additional Waste Diversion Ontario (WDO) grant of $2.5 million and increases in provincial funding the total unexpected revenue totals $28.1 million.
Of note, commodity prices increased more quickly in 201 0 following a significant decrease in 2008 resulting in an additional $5.4 million in recyclable revenue. The budget included a economic draw from Working Fund Reserves to offset the impact the recession had on recyclable revenues, resulting in no impact on year end surplus.
Expenditure variances may be affected by changes in the economy (i.e. Ontario Works benefit costs), weather patterns (roads maintenance costs), planning and service level assumptions (Energy From Waste shut down, staffing levels etc) as well as Council directed changes (i.e. Seniors Dental). Each year staff assess risks contained within corporate and program level planning assumptions. For example, the winter maintenance budget is based upon historical weather patterns over a number of years. In years with an above average number of winter events the program operates in deficit and is offset by working fund reserves. In a below average year, such as 2010, the program generates a surplus.
A summary of significant program variances are outlined below:
Transportation - surplus of $5.9 million driven primarily by savings of $3.8 million due to lower number of winter events. Additionally, the Accessible Transportation program generated an operating surplus of $1.6 million as a result of variances to planning assumptions regarding model mix and casual staffing. Assumptions used in developing the Accessible Transportation 201 1 Budget have been adjusted.
68487
Rectangle
d"l&-@t - 3 - March 28, 201 1 2010 SEMI-ANNUAL FINANCIAL REPORT -YEAR END (UNAUDITED)
a Waste Management - budget came in on target due primarily to fuel savings of $2.0 million and savings in energy costs of $2.9 million due to the shut down of the Algonquin power. The program also benefited from additional WDO grants as noted above.
0 Ontario Works - a surplus of $14.5 million driven primarily by unanticipated Provincial funding of $11.5 million for Ontario Works administration, average caseload was within 0.2 per cent of budget while a positive variance in case mix ratio (e.g. more singles) lead to savings of $1.4 million.
0 Social Housing - surplus of $1.5 million was primarily attributable to lower mortgage costs as interest rates continue to be at historical lows. The 2011 Budget incorporated a $1.0 million reduction for mortgage costs.
Long Term Care - operationally the program was on budget. A total of $2.6 million was set aside to address outstanding labour negotiation issues.
Paramedic Services - a surplus of $4.2 million was driven by unanticipated subsidy of $1.9 million and a change in the Paramedic staff coverage assumptions used to develop the 2010 budget in an additional $2.3 million. The Paramedic Services 201 1 Budget recognizes the new staff coverage assumptions and therefore includes a net reduction of 2.3 per cent.
Further, Council authorized the acquisition of 7120 Hurontario with 2010 operating impact of $1.3 million absorbed within the approved budget. This new facility will replace existing leases resulting in a $20 million return on investment (ROI) over 20 years.
In summary, final 2010 financial results total a $30.7 million surplus from Regionally Controlled Tax Supported Programs comprised of $28.1 million unanticipated revenues and $2.6 million in expenditure changes.
b) Utility Rate Supported Programs The Strategic Plan V Close Out report dated December 1, 2010 forecast a deficit of $8,5 million in the Utility Rate Programs. Changes in the fourth quarter due primarily to lower contractor costs, and a one-time salary credit from Ontario Clean Water Agency (OCWA) resulted in a final 2010 deficit of $4.0 million in the Utility Rate Programs. The deficit is primarily due to rising electricity costs as rates increased by 34 per cent, coupled with lower water consumption and lower operating costs.
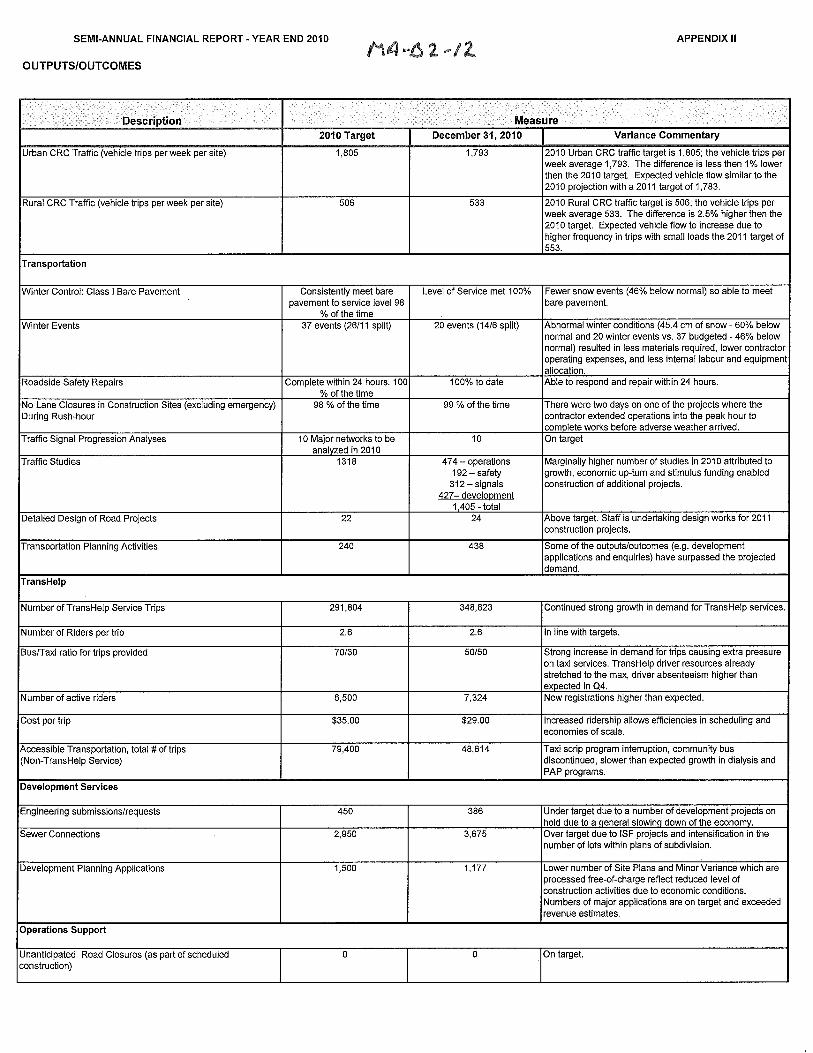
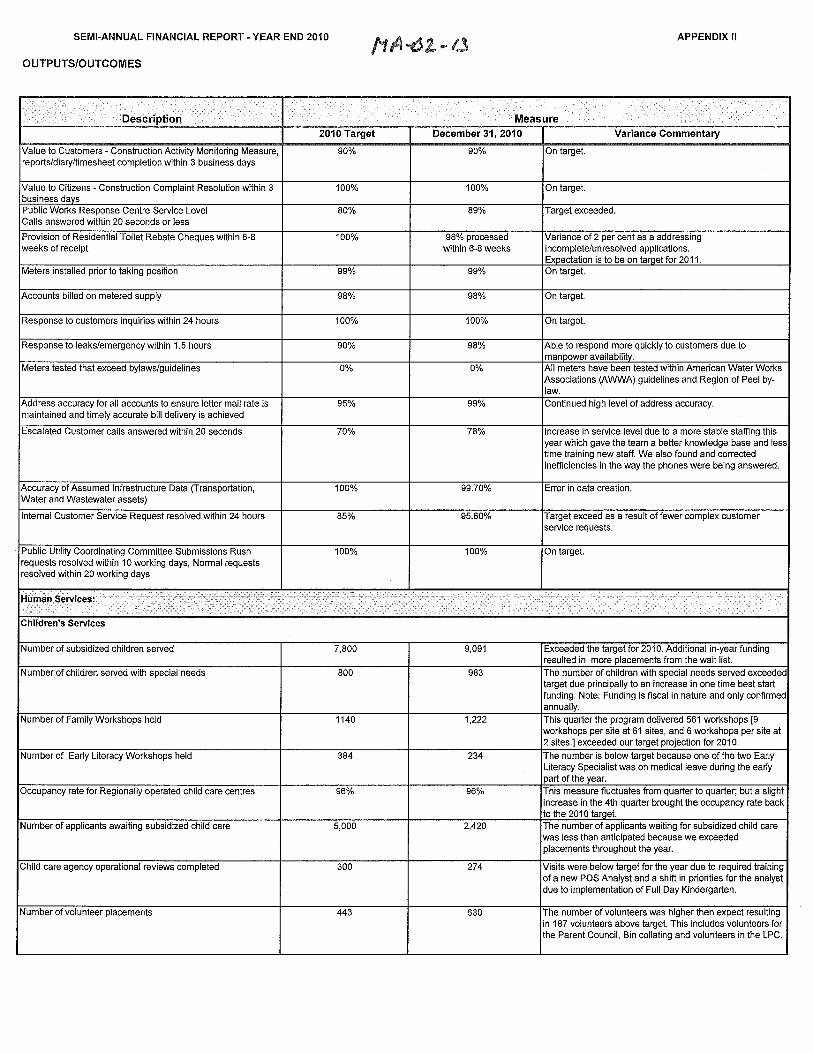
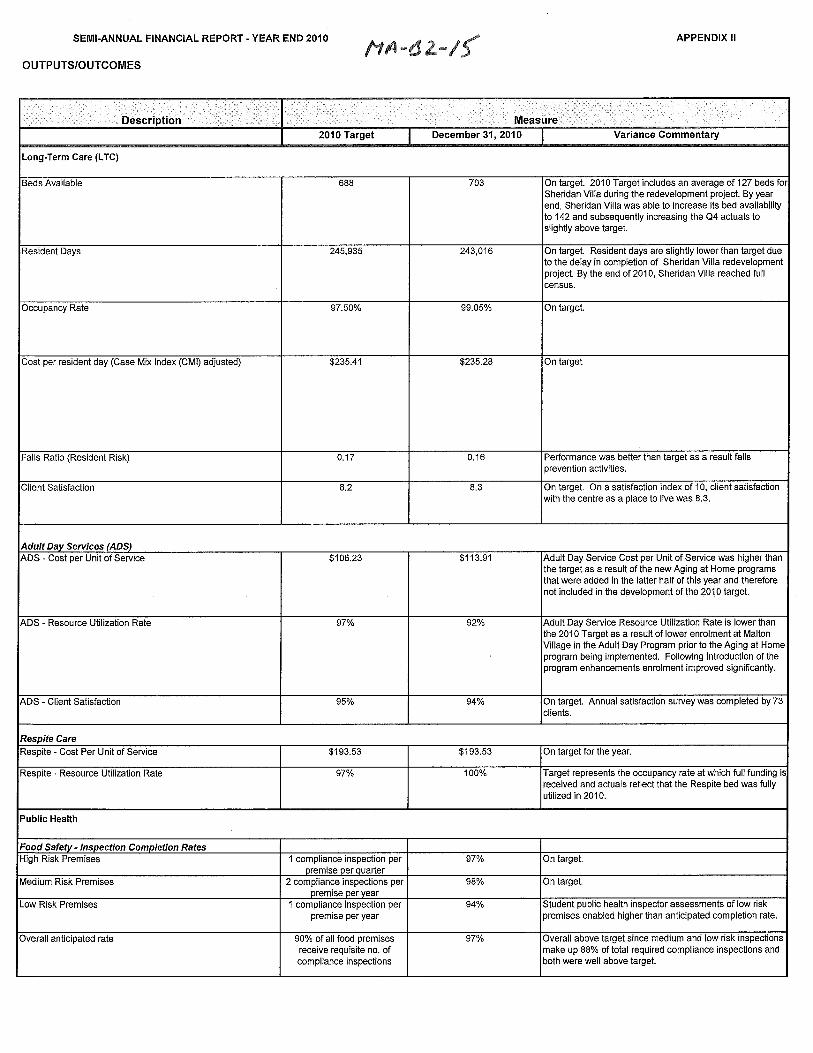
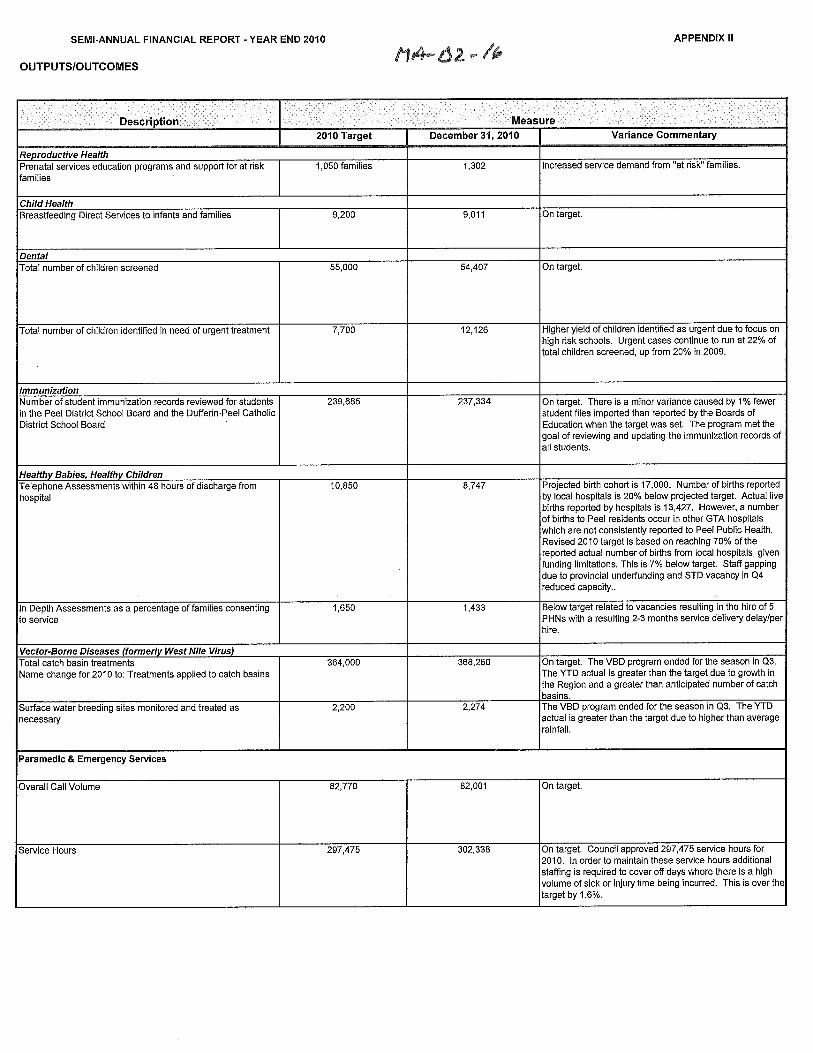
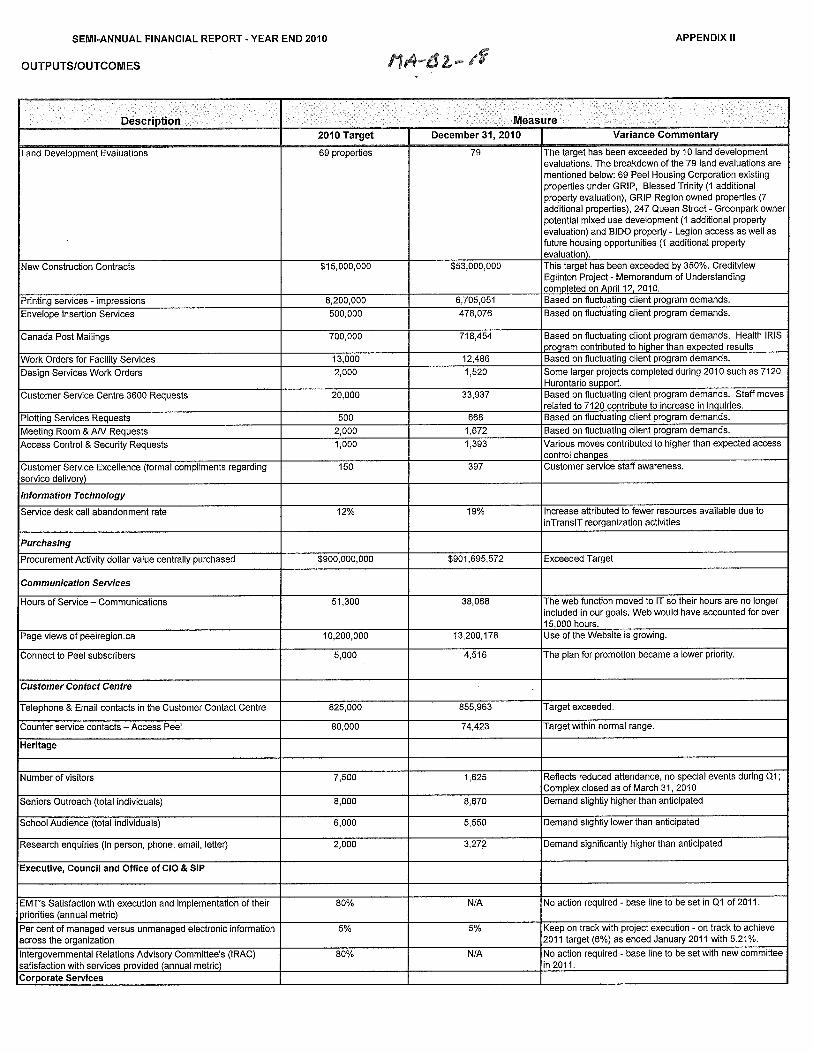
c) OutputslOutcomes As part of the yearly budget development each of the Region Controlled programs identifies a number of outputs and outcomes that will be measured to track program deliverables. Appendix II provides the status of these measures for the twelve months ended December 31, 201 0.
These measures can provide the rationale or reasons affecting financial results. This can be seen in a number of Peel's program areas;
Unscheduled 25 week shutdown of the Energy from Waste Facility (EFW) resulted in a lower cost for waste management per household Fewer "snow events" resulted in lower winter maintenance costs of roads
68487
Rectangle
fld-bL - 4 - March 28,201 1 2010 SEMI-ANNUAL FINANCIAL REPORT - YEAR END (UNAUDITED)
Discontinuation of the community bus and lower than expected growth in dialysis and Passenger Assistance programs (PAP) lead to a lower than expected number of (non-TransHelp) Accessible trips Monthly social assistance benefit cost per case was 3.7 per cent lower than budgeted
d) Surplus Management In accordance with the Financial Control By-law, the Chief Administrative Officer and the Chief Financial Officer and Commissioner of Corporate Services are authorized to carry out the necessary surplus management actions in order to stabilize the year-end fiscal position and future tax and utility rates. In accordance with the by-law, a summary of the surplus management transactions, including the contributions to reserve accounts which were used to offset the $31.8 million property tax supported surplus and the $4.0 million utility rate deficit, is set out in Appendix Ill.
Staff recommends the allocation of $30 million of the tax surplus to help reduce the capital shortfall of $463 million as identified to Council during the 201 1 Budget deliberation.
Staff also recommends the allocation of $0.7 million to the Insurance Stabilization reserve to mitigate future pressures.
e) Write-offs Accounts Receivable Policy F40-03 gives the Chief Financial Officer the authority to approve the write-off of Water and Sewer billings and General Receivable billings. Presented below are the write-off transactions for the period ended December 31, 201 0.
Write-off Balance in Allowance Account
General Receivables $ 23,423.95
Water & Wastewater Billings $ 180,904.40 $ 186,550.43
The annual budget incorporates an estimate of anticipated write-offs which are charged to an "Allowance for Doubtful accounts". Write-offs are only recorded when all means of collection have been exhausted. Write-offs are well within budgeted estimates, with positive balances remaining in the Allowance for Doubtful accounts.
f) 2011 Outlook Tax Supported Programs: As noted earlier, the 2010 surplus was primarily attributable to unanticipated revenue. Changes in provincial funding were incorporated in the development of the 2011 Budget. Further, 2011 provincial grants are not fully known at this time. As announcements are made, staff will inform Council of the financial impact to Peel.
In developing the 201 1 Budget for Transportation and Paramedic Services assumptions were adjusted to better reflect the program drivers as seen in 2010.
During the 201 I Budget process Council made available additional funding to reduce the significant waitlist for affordable housing. Staff will develop options for Council to ensure best use of this investment over the long term. Development of appropriate options and implementing strategies will take time and as such, it is unlikely the full base funding increase of $13.3 million will be fully utilized in 201 1. Council may wish to place unspent funds into reserves to enhance long term financial sustainability of the Housing program.
68487
Rectangle
H A - b l - 5 - March 28, 201 1 2010 SEMI-ANNUAL FINANCIAL REPORT - YEAR END (UNAUDITED)
Utility Rate Supported Programs: One of the major contributors to the overall 2010 utility rate deficit was rising electricity costs. This is expected to continue into 201 1 and accounts for about one half of the 201 1 Utility Rate of 9.1 per cent increase or 4.5 per cent. Barring unusual summer weather or other unforeseen circumstances the 201 1 operating results will be consistent with budget assumptions.
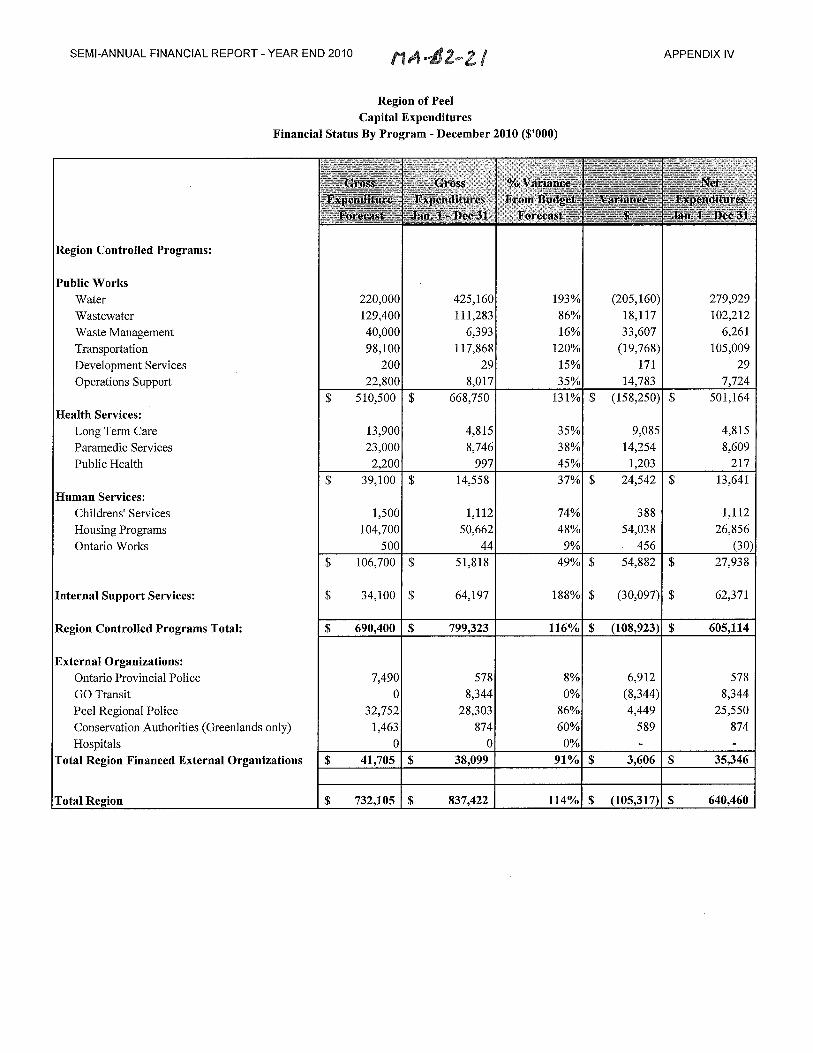
CAPITAL OPERATIONS
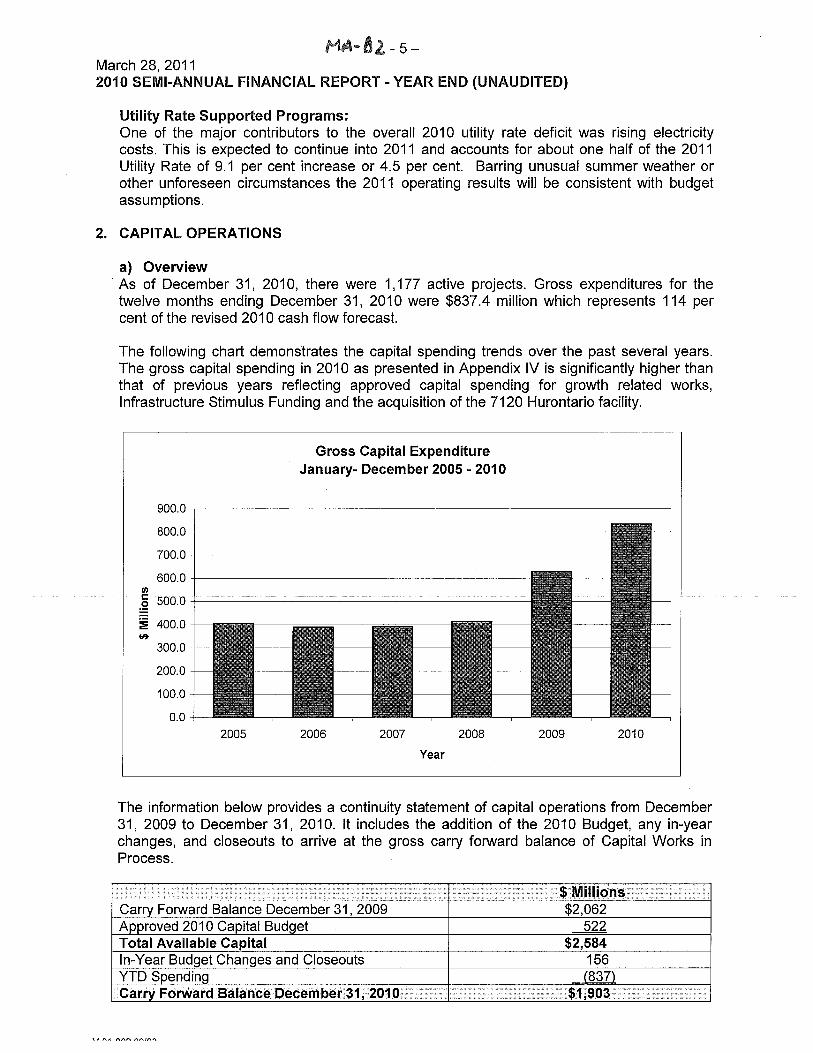
a) Overview As of December 31, 2010, there were 1,177 active projects. Gross expenditures for the twelve months ending December 31, 2010 were $837.4 million which represents 114 per cent of the revised 201 0 cash flow forecast.
The following chart demonstrates the capital spending trends over the past several years. The gross capital spending in 2010 as presented in Appendix IV is significantly higher than that of previous years reflecting approved capital spending for growth related works, Infrastructure Stimulus Funding and the acquisition of the 7120 Hurontario facility.
Gross Capital Expenditure January- December 2005 - 2010
2005 2006 2007 2008 2009
Year
The information below provides a continuity statement of capital operations from December 31, 2009 to December 31, 2010. It includes the addition of the 2010 Budget, any in-year changes, and closeouts to arrive at the gross carry forward balance of Capital Works in Process.
Carry Forward Balance December 31,2009 Approved 201 0 Capital Budget Total Available Capital In-Year Budget Changes and Closeouts YTD Spending Carry Forward Balance December 31,2010
$ Millions $2,062
522 $2,584
156 (837)
$1,903
68487
Rectangle
HA-da - 6 - March 28, 201 1 2010 SEMI-ANNUAL FINANCIAL REPORT - YEAR END (UNAUDITED)
The carry forward balance of capital works in process is in line with previous years; however expenditures for the same twelve month period in 2010 are approximately 88 per cent higher than the average for the last five years.
b) Unfunded Liability As of December 31, 2010 Peel has an outstanding liability to GO Transit of $35.2 million, which includes amounts for the 2007, 2008, 2009 fiscal years and the 2010 allocation up to December 31 2010. This represents an unfinanced liability due to Peel Regional Council's decision to limit funding for GO Transit to the growth capital plan funded through development charges.
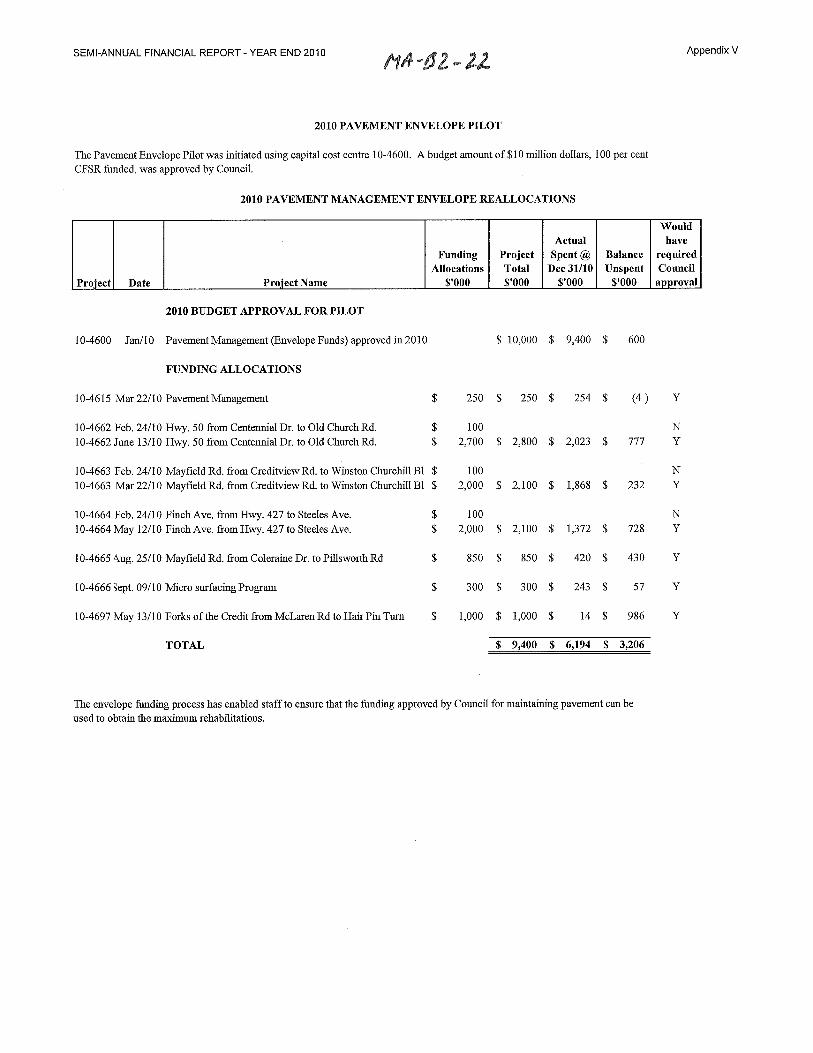
c) Envelope Funding In 2010, the Pavement Envelope Pilot was initiated using capital cost centre 10-4600. A budget amount of $10 million dollars, 100 per cent funded from the Capital Finance Stabilization Reserve, was approved by Council. During the year, funds were redeployed to eight pavement projects which would have otherwise required separate reports to Council. The funding envelope allowed for timely project funding and facilitated efficient implementation of the resurfacing program while reducing workload.
As this was a pilot project and process, the activity related to this master project and all subsequent sub projects was to be reported back to Council. The details related to the activity for this project are provided in Appendix V.
3. RESERVES AND RESERVE FUNDS
a) Highlights
- - . . . . . . . . . . - . - I - - I I \ ---, I \ 7 - - ---, I \ 2 - - - - - I I Balance after Commitments 1 641.3 7.5 1 (1,230.8) 1 (582.0) 1 Balance before Commitments 1 1,202.6 1 18.3
As per the Regional Financial Control By-law 45-2004; "Reserve means the unrestricted accumulation, at the discretion of Council, of appropriations from net revenues. Reserves include Working Funds, Capital Financing, Capital Construction and Infrastructure Replacement" and "Reserve Fund means the accumulation of appropriations from net revenues for purposes which are restricted by law or by the direction of Council contained in the by-law establishing the Reserve Fund".
(229.0) 1 991.9
As in previous years, reserves continue to play an integral role in managing the Region's diverse current and capital programs. Most programs use reserves for financing in order to avoid debt financing and to minimize annual tax and utility rate impacts.
Commitments 1 (561.3) 1 (10.8) 1 (1.001.8) 1 (1.573.9)
While the overall balance of the Region's Reserves and Reserve Fund portfolio before commitments is positive, the DC reserve funds are in a deficit position of $229 million as of December 31, 2010. The study that supported the 2007 Development Charge By-law recognized that the Development Charge Reserve balances would be in a deficit position before the next update and the development charge rate set at that time included the debt financing costs. As part of the funding strategy it is anticipated that debt will continue to be issued until such time DC reserves are able to sustain growth related infrastructure. Staff are starting to prepare for the DC background study to update the current DC By-law. This update will establish a new by-law with adjusted rates that include the cost to service any debt.
68487
Rectangle

Ha-di - 7 - March 28,201 1 2010 SEMI-ANNUAL FINANCIAL REPORT - YEAR END (UNAUDITED)
b) Debt Appendix VI provides a more detailed breakdown of fund balances by program and type while Appendix VII focuses on year-to-date activity. The majority of the reserves are committed to finance the 201 0 - 201 9 Ten-Year Capital Plan of $4.8 billion.
As highlighted in Appendix VII and above, reserves are underfunded by $1.2 billion. In 2010 Peel issued debt totaling $310 million to cash flow development charges and finance the acquisition of 7120 Hurontario facility (includes $5.4 million issued on behalf of the Town of Caledon). Staff will be bringing a report to Council in summer 2011 to outline the debt strategy to address the underfunding.
4. FINANCIAL CONTROL BY-LAW (FCBL) Provided below are the details of the Financial Control By-law requirements that are currently tracked and recorded.
Authorization to Increase Project Commitments Beyond Originally Approved Budget The Financial Control By-law requires that the Semi-annual Financial report discloses the activity related to all budget adjustments made to previously approved capital projects which are the lower of 10 per cent of the Council approved budget or $250 thousand. The requests for the 12 months ended December 31, 2010 total $294 thousand. These requests are presented in Appendix Vlll with an activity summary for the 12 months. Projects requiring budget increases beyond these parameters require Council reports.
Closed Capital Projects During the 12 month period ended December 31, 2010, 238 projects were closed. As a result of these closures, $67 million was returned to reserves and reserve funds for those projects. The chart below displays results broken down by tax rate and utility rate funding sources.
Redeployments Redeployments are processed to facilitate effective management of various programs and projects. In order to better manage existing projects, 57 redeployments were processed for the capital budget during the twelve months ended December 31, 2010, The majority of these adjustments involved the separation of large projects into smaller, more specific projects (40 per cent) and merging of projects for tendering purposes (30 per cent). The remainder of the activity was divided between the movement of dollars from unallocated projects (16 per cent) and Treasurer approved redeployment between capital projects within the same division (14 percent).
Reserve and Reserve Fund Changes Section 4 of the Financial Control By-law requires Council authority to create new Sub Reserves, to transfer funds between Sub Reserves for purposes of reclassification and to
68487
Rectangle

HA-42 - 8 - March 28, 201 1 2010 SEMI-ANNUAL FINANCIAL REPORT - YEAR END (UNAUDITED)
transfer reserve balances between reserves. Presented in Appendix IX is the activity related to these transactions for the twelve months ended December 31,201 0.
Unallocated Capital Financing The Financial Control By-law Section 3(9 iii requires that the financial report discloses the activity and available balances for the unallocated capital projects. Appendix X provides Council with a summary for the period ended December 31,201 0.
Working Fund Balance Requirements The Financial Control By-law requires that Working Fund balances for both the Tax Supported and Utility Rate Supported Reserves are maintained within 5 to 10 per cent of the operating budget. Maintaining these funds at required minimums provides Regional Council with an effective tool to balance risk with tax and utility rates.
Following proposed surplus management entries the balance of the tax supported working fund reserves as at December 31, 2010 is $154.8 million which represents approximately 11.2 per cent of the 201 1 operating budget, $1 6 million above the maximum ratio of 10 per cent FCBL requirement, with Utility Rate supported reserves at the minimum requirement of 5.0 per cent of the 201 1 total budgeted expenditures.
5. ADMINISTRATIVE ADJUSTMENTS
In accordance with the Financial Control By-law and the Purchasing By-law, staff are required to report to Council any transactions that change budgets, affect transfers to and from reserves and disclose purchasing decisions. Presented below are transactions for the six month period ended December 31,201 0.
Budget Changes: o The 2011 Peel Regional Police 10-year Capital Plan totaling $271.8 million includes a
capital project in 2015, Digital Recording (11-8270), totaling $1.5 million to replace the interview room equipment. It has become necessary to bring this project forward to 2011 to enable staff to commence the replacement of the existing interview room equipment and install a new interview system that will enable the central recording and storage of interviews.
o The budget for Capital project 00-4020 for Highway 410 Extension (resolution #1999- 631) within the Transportation capital portfolio has been increased by $4,173,439 to recognize funding being provided from the Ministry of Transportation of Ontario (MTO) and Caledon for additional works. The funding has already been received from MTO.
CONCLUSION
In summary, the Region of Peel's overall surplus position represents a variance of less than one per cent on a gross budget of $1.6 billion. The 2010 surplus was primarily related to uncontrollable drivers as outlined in this report. The surplus management activities support the organization's overall fiscal stability and sustainability.
68487
Rectangle
March 28, 201 1 HA-bz-9-
2010 SEMI-ANNUAL FINANCIAL REPORT - YEAR END (UNAUDITED)
Norma Trim Chief Financial Officer and Commissioner of Corporate Services
Approved for Submission:
D. Szwarc, Chief Administrative Officer
For further information regarding this report, please contact Elayne Thompson at extension 4536 or via email at elayne.thompson@pee/region.ca
Authored By: Elayne Thompson and Christine Banks
c. Legislative Services
68487
Rectangle

SEMI-ANNUAL FINANCIAL REPORT - YEAR END 2010 r\cr14bz-/8 Regional Municipality of Peel
Statement of Net Expenditures ($'000) For the Year Ended December 31,2010
APPENDIX I
2010 Actuals Revised Prior to Variance Budget Surplus Mgt. (Over)/Under
Health Services
Paramedic Services
Health Admin Services Subtotal Health Services
Corporate Services Employee & Business Services Executive Office, CIO, SIP, Council
Internal Support Services
Total Region Controlled Programs
Region Financed External Organizations
Police Services Peel Regional Police Ontario Provincial Police Subtotal Police Services
onservation Authorities ntario Disability Support Payment ssessment Services
Summary of Results by Funding Source $000'~ Tax Supported $ 31,768 Utility Rate Supported $ (4,027)
Total Surplus allocation $ 27,741
68487
Rectangle
SEMI-ANNUAL FINANCIAL REPORT -YEAR END 2010
OUTPUTSIOUTCOMES Hh-6 2 - / I
APPENDIX II
ow up with the Region if voice
a surplus of $5.9 million as a result of the Energy from Waste (EFW) Facility unscheduled shutdown, lower then budgeted fuel index, higher then budget grant funds for
Cost of Community Recycling Centres (CRCs) per Vehicle Trip $29 $25.43
Waste Diversion Ontario (WDO) for Blue Box program and seasonal low regarding yard waste. The 201 1 target is based on a projected increase of I .O% in households and an increase in net budget of $5.6 million the net effect is $214 per household. 2010 cost of CRCs per vehicle trip target is $29; the cost per trip is $25.43. The actual cost for 201 0 for CRCs had a $1 .I million surplus due to a net increase in WDO grant funding for Municipal Hazardous and Special Waste(MSHW) and an increase over budget for drop off fees. The vehicle trips remained on target with a total 335,159 trips for 2010. No major increase to CRC operations due to no new programs being introduced in 201 1 the same vehicle flow in 2010 is expected in 201 1 with a target of $29.
68487
Rectangle
SEMI-ANNUAL FINANCIAL REPORT -YEAR END 2010 f i4-6 2 -/2
APPENDIX II
OUTPUTSIOUTCOMES
construction activities due to economic conditions.
I I I I I
68487
Rectangle
SEMI-ANNUAL FINANCIAL REPORT - YEAR END 2010
OUTPUTSIOUTCOMES
APPENDIX II
umber of Early Literacy Workshops held
Occupancy rate for Regionally operated child care centres
Number of applicants awaiting subsidized child care
Child care agency operational reviews completed
Number of volunteer placements
384
96%
5,000
300
443
234
96%
2,420
274
630
The number is below target because one of the two Early Literacy Specialist was on medical leave during the early part of the year. This measure fluctuates from quarter to quarter; but a slight increase in the 4th quarter brought the occupancy rate back to the 2010 target. The number of applicants waiting for subsidized child care was less than anticipated because we exceeded placements throughout the year.
Visits were below target for the year due to required training of a new POS Analyst and a shift in priorities for the analyst due to implementation of Full Day Kindergarten.
The number of volunteers was higher then expect resulting in 187 volunteers above target. This includes volunteers for the Parent Council, Bin collating and volunteers in the LPC.
68487
Rectangle

SEMI-ANNUAL FINANCIAL REPORT -YEAR END 2010
OUTPUTSIOUTCOMES
APPENDIX II
resulting in a decrease in appeals. The % of cases
housing is reducing the % of victims of family violence on
68487
Rectangle
SEMI-ANNUAL FINANCIAL REPORT -YEAR END 2010 f i ~ -6 2-/f
APPENDIX II
Falls Ratio (Resident Risk)
Client Satisfaction
0.17
8.2
Adult Day Services (ADS)
0.16
8.3
Performance was better than target as a result falls prevention activities.
On target. On a satisfaction index of 10, client satisfaction with the centre as a place to live was 8.3.
Adult Day Service Cost per Unit of Service was higher than the target as a result of the new Aging at Home programs that were added in the latter half of this year and therefore not included in the development of the 2010 target.
Adult Day Service Resource Utilization Rate is lower than the 2010 Target as a result of lower enrolment at Malton Village in the Adult Day Program prior to the Aging at Home program being implemented. Following introduction of the program enhancements enrolment improved significantly.
On target. Annual satisfaction survey was completed by 73 clients.
ADS - Cost per Unit of Service
ADS - Resource Utilization Rate
ADS - Client Satisfaction
$106.23
97%
95%
Respite Care
$1 13.91
92%
94%
Respite - Cost Per Unit of Service
Respite - Resource Utilization Rate
$193.53
97%
Public Health
$1 93.53
100%
On target for the year.
Target represents the occupancy rate at which full funding is received and actuals reflect that the Respite bed was fully utilized in 2010.
Food Safety - Inspection Completion Rates High Risk Premises
Medium Risk Premises
Low Risk Premises
Overall anticipated rate
97%
98%
94%
97%
1 compliance inspection per premise per quarter
2 compliance inspections per premise per year
1 compliance inspection per premise per year
90% of all food premises receive requisite no. of compliance inspections
On target.
On target.
Student public health inspector assessments of low risk premises enabled higher than anticipated completion rate.
Overall above target since medium and low risk inspections make up 88% of total required compliance inspections and both were well above target.
68487
Rectangle
SEMI-ANNUAL FINANCIAL REPORT -YEAR END 2010
OUTPUTSIOUTCOMES
APPENDIX II
68487
Rectangle

SEMI-ANNUAL FINANCIAL REPORT -YEAR END 2010
OUTPUTSIOUTCOMES 8494-8 2-14 APPENDIX II
Real Property Asset Management Number of capital land transactions completed Number of real property and facility acquisition transactions completed
Per cent of Regional facilities that have had an energy audit
Number of Building Condition Assessments
Number of Capital Risk Assessments for 2010 capital planning
Capital Renewal - Residential - planned
Capital Renewal - Non Residential - Planned
Major Construction - Paramedic
Major Construction - LTC
Major Construction - Heritage
Major Construction - ETPS
MAP Construction Client feasibilities studies Affordable Housing construction completion
170
90
71 %
59
285
$14,000,000
$4,000,000
$16,500,000
$1,500,000
$5,000,000
$1,650,000
$500,000 10
230 Units
175
94
87%
34
235
$22,590,782
$3,100,000
$1,425,000
$1,030,000
$7,500,000
$1,700,000
$9,500,000 10
230
Exceeded Target
Exceeded Target
Submission of Final Audit Report is expected by April 201 1
The 25 buildings on the list were deferred to allow for the completion of renovationlconstruction activities at the various sites.
It was determined that the Public Works buildings at the properties managed by Ontario Clean Water Agency (OCWA) would not require the Capital Risk Analysis
Construction value increased after completing 2009 carryover projects, Social Housing Renovation and Retrofit Program (SHRRP) overflow and unscheduled projects.
Few major maintenance project has been deferred, to be included in the redevelopment of SuiteA Progress of the projects is behind forecast for the following reasons: -Winding Trail project construction start date postponed t~ l l March 201 1 due to winter. -Slow progress in Tomken Reporting station due to permit delay -Satellite station in Brampton-co-locate stalled pending settlement of law suit with consultant. -Difficulty in sourcing site for new satellite station. -Project roof replacement at Malton Village and Tall Pine is found to exceed the budget substantially and is waiting for further funding approval. -Huxley Hall renovation is behind schedule and will be in construction in 201 1. Scope of the work and hence construction value expanded to include tunnel and security upgrade Construction progress at 2 Copper is ahead of schedule, resulting in expedited cash flow. Project at 7120 Hurontario is included. Target Met. Target has been achieved at end of 2010 second quarter (John Street - 200 units completed June 30, 2010 and Peel Manor - 30 units for Seniors and Singles completed March 201 0
68487
Rectangle
APPENDIX II SEMI-ANNUAL FINANCIAL REPORT -YEAR END 2010
OUTPUTSIOUTCOMES
Customer Contact Centre
Telephone & Email contacts in the Customer Contact Centre
Counter service contacts - Access Peel
Heritage
Number of visitors
Seniors Outreach (total individuals)
School Audience (total individuals)
Research enquiries (in person, phone, email, letter)
Executive, Council and Office of CIO & SIP
EMT's Satisfaction with execution and implementation of their priorities (annual metric) Per cent of managed versus unmanaged electronic information across the organization Intergovernmental Relations Advisory Committee's (IRAC) satisfaction with services provided (annual metric) Corporate Services
825,000
80,000
7,500
8,000
6,000
2,000
80%
5%
80%
855,963
74,423
1,625
8,670
5,550
3,272
N/A
5%
N/A
Target exceeded.
Target within normal range.
Reflects reduced attendance, no special events during Q1; Complex closed as of March 31,2010 Demand slightly higher than anticipated
Demand slightly lower than anticipated
Demand significantly higher than anticipated
No action required - base line to be set in Q1 of 201 1.
Keep on track with project execution - on track to achieve 2011 target (6%) as ended January 2011 with 5.21%. No action required - base line to be set with new committee in2011.
68487
Rectangle

SEMI-ANNUAL FINANCIAL REPORT -YEAR END 2010
OUTPUTSIOUTCOMES
APPENDIX II
G81G20 activity derailed planned expenditures.
On target
Numbers are lower to due election year meeting calendar.
Numbers are lower to due election year meeting calendar.
Numbers are lower to due election year meeting calendar.
Driver appears to be Ontario Works Caseload Yurther note in 2009 10,000 pgs were processed, in 2010 30,000 pgs (approx) were processed; also an increased number of complex economic requests (RFP, contracts, agreements)
24,100 Internal; 5,457 External -Target exceeded
95% of target met
Over target
Over target
Approaching 201 1 Census, some of the pages related to the previous Census years may not generate as much interest. Hence the YTD Actuals is under target. Over target
Land secured is higher than anticipated as leveraged funding was received that required project completion this year.
Performed better than target.
An Improvement from 68% in 2009 to 70% in 2010
The yield was slightly higher than forecast as interest rates rebounded from mid-year lows.
22
6
43
6,967
5,634
187
29,557
982
655
28,550
73,420
532
108.5 hectares
5.4%
70%
3.80%
Emergency Management Presentation &Training Sessions
Emergency Exercises *Maintain 2417 On-Call Response Capability
Number of CouncillCommittee (based upon 15 committees) meetings supported
Number of Council/Committee/Subcommittee Support Hours
Total number of Agendas Packaged
Number of Municipal Freedom of Information and Protection of Privacy Act requests
Hours of legal service - Internal and External
New legal matters to be dealt with
New potential claims under Management
Number of page views for all Peel Region Official Plan Review (PROPR) web pages
Number of page views for all Peel Data Centre web pages
Number of datalinformation requests fulfilled
Amount of Greenlands secured in hectares
Accounts Receivable - per cent of the total dollar value that exceeds 90 days Accounts Payable - per cent paid within 30 days
Treasury - rate of return on investment
60
6
130
8,967
9,000
120
23,741
1,033
615
28,000
75,000
430
20 hectares
8%
70%
3.5%
68487
Rectangle

SEMI-ANNUAL FINANCIAL REPORT - YEAR END 2010 flA*d 2-26 Appendix Ill
2010 Summary of Proposed Surplus Management Entries
Status before Surplus Management Surplus/(Deficit)- Property Tax Supported Programs Surplus/(Deficit)- Water Program Surplus/(Deficit)- Wastewater Program Total SurpluslDeficit
I Allocation Details Tax Supported Allocations
External Agencies - WF Allocations ROO01 Cal Policing Cost Stab R1231 WF - PRP - General Total External Agency WF Allocations
Allocation to Capital and Specialty Reserves R0210 Cap - Fin Stab - Roads R0230 Cap - Fin Stab - Gen Govt R0235 Cap Fin Stab - Ambulance R1617 Ambulance Vehicle R1610 PW - ES Fleet Reserve R1901 Long Term Care - Buildings R1920 RPAM -Wellington Complex R1922 RPAM - Facility Major Maintenance R2311 IT - Client Computers R2316 HR - Systems R2328 EBS Infrastructure Replacement R0500 lnsur - Stab Region R1160 CCR - Housing New Development Total Allocation to Capital and Speciality Reserves
Total Proposed Tax Supported Allocations
Utility Rate Supported Allocations ROO10 Water Rate Stabilization $ (3,427,660) R0241 Cap Fin Stab -Water $ (2,464,384) ROO 12 Wastewater Rate Stabilization $ 1,680,312 R1610 PW - ES Fleet Reserve $ 185,000 Total Proposed Utility Rate Supported Allocations to WF $ (4,026,732) $ (4,026,732)
Surplusl(Deficit) allocated to Reserves
Status after Surplus Management $
* Includes allocation to Seniors Dental of $0.9 million and $1.4 million for Community Grants, as per Council direction.
68487
Rectangle
SEMI-ANNUAL FINANCIAL REPORT -YEAR END 2010 e&zwz / APPENDIX IV
Region of Peel Capital Expenditures
Financial Status By Program - December 2010 ($'000)
Region Controlled Programs:
Public Works
Waste Management Transportation Development Services Operations Support
Health Services: Long Term Care Paramedic Services Public Health
Human Services: Childrens' Services Housing Programs Ontario Works
Internal Support Services:
Region Controlled Programs Total:
External Organizations: Ontario Provincial Police GO Transit Peel Regional Police Conservation Authorities (Greenlands only) Hospitals
Total Region Financed External Organizations
Total Region
40,000 98,100
200 22,800
$ 510,500
13,900 23,000 2,200
$ 39,100
1,500 104,700
500 $ 106,700
$ 34,100
$ 690,400
7,490 0
32,752 1,463
0 $ 41,705
$ 732,105
6,393 117,868
29 8,017
$ 668,750
4,815 8,746
997 $ 14,558
1,112 50,662
44 $ 51,818
$ 64,197
$ 799,323
578 8,344
28,303 874
0 $ 38,099
$ 837,422
16% 120% 15% 35%
131%
35% 38% 45% 37%
74% 48% 9%
49%
188%
116%
8% 0%
86% 60% 0%
91%
114%
33,607 (19,768)
171 14,783
$ (158,250)
9,085 14,254
1,203 $ 24,542
388 54,038
456 $ 54,882
$ (30,097)
$ (108,923)
6,912
(8,344) 4,449
589
$ 3,606
$ (105,317)
6,261 105,009
29 7,724
$ 501,164
4,815 8,609
217 $ 13,641
1,112 26,856
(30) $ 27,938
$ 62,3 7 1
$ 605,114
578 8,344
25,550 874
$ 35,346
$ 640,460
68487
Rectangle
SEMI-ANNUAL FINANCIAL REPORT- YEAR END 2010 Appendix V
2010 PAVEMENT ENVELOPE PILOT
The Pavement Envelope Pilot was initiated using capital cost centre 10-4600. A budget amount of $10 million dollars, 100 per cent CFSR funded, was approved by Council.
2010 PAVEMENT MANAGEMENT ENVELOPE REALLOCATIONS
2010 BUDGET APPROVAL FOR PILOT
10-4600 Jan110 Pavement Management (l3nvelope Funds) approved in 2010
FUNDING ALLOCATIONS
Balance Unspent
$'000
10-4615 Mar 22/10 Pavement Management $
Would have
required Council
approval
Project Total $'000
Funding Allocations
$'OOO Project
10-4662 Feb. 24/10 Hwy. 50 from Centennial Dr. to Old ChurchRd. $ 10-4662 June 13/10 Hwy. 50 from Centennial Dr. to Old ChurchRd. $
Actual Spent @
Dec 31/10 $'000
10-4663 Feb. 2411 0 Mayfield Rd. from Creditview Rd. to Winston Churchill B1 $ 10-4663 Mar 22/10 Mayfield Rd. from Creditview Rd. to Winston Churchill B1 $
Date
10-4664 Feb. 24/10 Finch Ave. from Hwy. 427 to Steeles Ave. $ 10-4664 May 12/10 Finch Ave. from Hwy. 427 to Steeles Ave. $
Project Name
10-4665 4ug. 25/10 Mayfield Rd. from Coleraine Dr. to PiUsworth Rd $
10-4666 Sept. 09/10 Micro surfacing Program $
10-4697 May 13/10 Forks of the Credit from McLarenRd to Hair Pin Turn $
TOTAL
The envelope funding process has enabled staff to ensure that the funding approved by Council for maintaining pavement can be used to obtain the maximum rehabilitations.
68487
Rectangle

SEMI-ANNUAL FINANCIAL REPORT -YEAR END 2010 Appendix VI
Region of Peel Reserves & Reserve Fund Balance by Program ($'000)
As at December 31,2010
Program
Roads
Waste Management
PW Operation Support Tax
Regional Planning
Long Term Care
TransHelp
Children's Services
Public Health
Housing Accounts
Police - PRP
Police - OPP
Ontario Works
Conservation
GO Transit
Paramedic Services
Hospitals
Water
Wastewater
PW Operation Support Rate
Internal Support Services
Total
Reserve Funds
$ 5,332
201
(784) 2,766
15,124
508
4,379
818
6,573
1,155
1,362
335
1,353
(256,803)
6,188
824
$ (210,668)
Capital Construction
$ 80,954
133,530
1,838
(2,650)
2,414
(12,207)
5,979
2,106
29,337
17,354
96,948
158,398
94,783
$ 608,785
Total
$ 92,231
179,482
16,577
1,571
22,669
20,727
15,877
10,653
65,3 11
122,335
11,695
16,453
5,979
2,442
46,140
17,354
(143,372)
181,149
46,452
260,159
$ 991,885
Stabilization
$ 5,945
2,429
517
5,314
532
12,869
1,914
7,535
19,991
10,540
12,888
720
5,096
8,755
105,365
$ 200,409
Committed Balances
$ (325,795)
(27,881)
(12,344)
(1,944) (10,608)
(10,382)
(1,115)
(2,249) (92,241)
(25,413)
(6,958)
(626)
(1,354)
(21,687)
(2,922) (510,928)
(424,728)
(2,892)
(91,798)
$ (1,573,864)
Reserves
Vehicle and Equipment
Replacement
$ -
18,857
5,109
3,507
1,946
64,001
4,063
42,139
48,109
$ 187,730
Balance Available
$ (233,564)
151,601
4,233
(373) 12,061
10,345
14,763
8,404
(26,930)
96,922
4,737
15,828
4,625
2,442
24,453
14,432
(654,300)
(243,579)
43,560
168,361
$ (581,979)
Building Replacement
$ - 43,322
(2,280)
12,129
1,564
2,500
69,165
31,770
2,203
10,666
11,387
7,808
4,3 14
11,079
$ 205,629
68487
Rectangle

SEMI-ANNUAL FINANCIAL REPORT - YEAR END 2010 Appendix VII
Region of Peel
Continuity Schedule of Reserves and Reserve Funds (%'000) As at December 31,2010
Balance January 1,2010
Contribution
Interest
Transfers and Other
Expenditures
Balance December 31,2010
Balances Committed
Balance Available December 31,2010
Capital Construction
$ 641,936
149,674
29,707
(212,533)
608,785
(455,271)
$ 153,514
Other Restricted
Funds
$ 14,042
37,414
703
3
(33,878)
18,283
(10,780)
$ 7,503
Building Replacement
$ 182,538
23,468
8,805
7,218
(16,401)
205,629
(49,386)
$ 156,243
DC Funds
$ (228,417 )
$ 345,025
$ (15,747 )
$
$ (329,812 )
$ (228,951 )
$ (1,001,788 )
$ (1,230,738 )
Stabilization
$ 202,336
9,257
6,920
(7,215
(10,889)
200,409
(8,193)
$ 192,216
Total
$ 986,261
595,634
38,358
5
(628,374)
991,885
(1,573,864)
$ (581,979)
Reserves
Vehicle and Equipment
Replacement
$ 173,826
30,797
7,969
(24,862)
187,730
(48,447)
$ 139,283
68487
Rectangle

SEMI-ANNUAL FINANCIAL REPORT - YEAR END 2010 APPENDIX Vlll
Region of Peel Authorization to Commit a Project to Over Budget Expenditure ($'000)
For the Twelve Months Ended December 31,2010
Transhelp Vehicles - R1615
Wastewater - R0242
Note: These transactions meet the requirements of Clause 3.(n), Schedule C of the Financial Control By-law, within 10 % of approved budget
68487
Rectangle

SEMI-ANNUAL FINANCIAL REPORT - YEAR END 2010 fid-62- 26 APPENDIX IX
Reserve and Resewe Fund Changes ($'000) For the Twelve Months Ended December 31,2010
portion of the reserve balance
2010 12 31 R3615 R3515 $ 124 Corp Serv-DC South Peel Wastewater -0BL Transfer Transfer related to DC By-law update
2010 12 31 R3625 R3525 $ 50 Corp Serv-DC Regional Road Wastewater-OBL Transfer Transfer related to DC By-law update
2010 12 31 R3630 R3530 $ 1 Corp Serv-DC Regional Road Water-OBL Transfer Transfer related to DC By-law update
2010 12 31 R1030 R1033 $ 28,041 Human Services Transfer To transfer actual borrowing costs to Chapelview project.
Total $ 35,688
Note: The activity reported on this schedule represents a series of administrative adjustments made to the Region's Reserve portfolio.
68487
Rectangle

SEMI-ANNUAL FINANCIAL REPORT - YEAR END 2010
/"fA-gZ-2 3 Regional Municipality of Peel
Unallocated Capital Financing Project Status ($'000) As at December 31,2010
APPENDIX X
Balance at December 31,2009
20 10 Budget Allocation
Previous year's unallocated projects closed and funding returned
Less: Reallocations under $250,000 (approved under Treasurer Authority of Financial Control By-law 2004-45)
Less: Reallocations over $250,000 (approved by Council reports)
Balance at December 31,2010
(350)
$ 1,150
(50)
$ 1,450
(259)
$ 1,741
68487
Rectangle