Report to the State of Michigan Evaluation of … · Electroma gnetic Acoustic Transducer In-line...
127
Report to the State of Michigan Evaluation of technologies to assess the condition of pipe coating on Line 5 June 30, 2018
Transcript of Report to the State of Michigan Evaluation of … · Electroma gnetic Acoustic Transducer In-line...
Report to the State of Michigan
Evaluation of technologies to assess the condition of pipe coating on Line 5June 30, 2018

Report to the State of Michigan—Evaluation of Technologies to Assess the Condition of Pipe Coating on Line 5
Table of Contents
Executive Summary 1
Background 2
Sources of Data 3Third-party Consultancy 3
Enbridge Literature Search 3
Proprietary Vendor—Specific Data 3
Enbridge Experience and In-house Specialists 3
Evaluation Methodology 4Defect Detection Capability 4
Small-defect Detection 4
Large-defect Detection 4
Submarine/Offshore Readiness 5
Applicability to the Dual Pipelines 5
Evaluation 6Cathodic Protection Close Interval Survey 6
Direct Current Voltage Gradient Survey 7
Alternating Current Voltage Gradient Survey 7
Alternating Current Attenuation Survey 8
Electroma gnetic Acoustic Transducer In-line Inspection 8
Cathodic Protection Current Mapper In-line Inspection 9
Metal Loss In-line Inspection 9
Visual Examination 10
High-voltage Holiday Detection 10
Conclusions 11
References 12
Appendix A: Mears Report 13
Executive Summary | 1
Executive Summary
This report presents the findings of the Enbridge assessment of the technologies that may be suitable for detecting damage to the coating of the two 20-inch diameter pipelines (Dual Pipelines) that span the Straits of Mackinac (the Straits). This assessment was completed in response to Section D of the Agreement between the State of Michigan and Enbridge Energy, Limited Partnership and Enbridge Energy Company, Inc., dated November 27, 2017 (the Agreement).
A total of nine technologies have been evaluated:
1. Cathodic Protection Close Interval Survey.
2. Direct Current Voltage Gradient Survey.
3. Alternating Current Voltage Gradient Survey.
4. Alternating Current Attenuation Survey.
5. Electromagnetic Acoustic Transducer In-line Inspection.
6. Cathodic Protection Current Mapper In-line Inspection.
7. Metal Loss In-line Inspection.
8. Visual Examination.
9. High-voltage Holiday Detection.
All of these technologies (except #8) involve electrical, electromagnetic, and/or ultrasonic measurements that indirectly indicate the existence of coating damage. Although several of these technologies have experienced widespread industry utilization for onshore pipelines, their use on in-situ submarine/offshore pipe is limited or non-existent.
The results of this study have shown that only Cathodic Protection Close Interval Survey (CP CIS) has the maturity in application to be used on submarine/offshore pipelines for detection of coating damage. CP CIS, in conjunction with metal-loss in-line inspection (ILI)1 is the most reliable combination of technologies for managing any potential external corrosion threat on the Dual Pipelines in the Straits. Enbridge will execute CP CIS on the Dual Pipelines in 2018.
1 To evaluate the interior and exterior of its pipelines, most of which are underground, Enbridge uses sophisticated ILI tools that incorporate leading imaging and sensor technology to provide us with a level of detail similar to that of MRIs, ultrasound and x-ray technology in the medical industry. By examining the interior walls of our pipes inch by inch, ILI tools alert us to potential problems and help us determine whether or not further investigation, or preventive maintenance work, is required.
2 | Report to the State of Michigan—Evaluation of Technologies to Assess the Condition of Pipe Coating on Line 5
Background
External coating and cathodic protection (CP) are used synergistically to prevent external corrosion and metal loss on Enbridge’s Dual Pipelines across the Straits. The external coating system provides a primary barrier between the steel and the environment and substantially reduces the amount of metal requiring CP. CP is an electrochemical method of preventing corrosion where metal is exposed to aqueous environments.
Section D of the Agreement required Enbridge to assess technologies that would be capable of detecting damage to the external coating used on the Dual Pipelines across the Straits. Importantly, such technologies should be practicable and provide additional benefit to the objective of managing external corrosion on the Dual Pipelines—over and above Enbridge’s existing suite of external corrosion management practices, which include:
• Use of an external coating system to reduce the amount of pipe wall that is exposed to lake water/bottom sediment;
• Use of CP to electrochemically alter the pipe wall at locations of coating damage;
• CP monitoring programs to ensure adequacy of the applied protective current;
• Regular in-line inspections of the pipe wall to locate and size any areas of metal loss caused by external corrosion; and
• Rigorous, industry-leading integrity management processes that include detailed quality assurance of ILI, long-term trending of data, use of forward-looking analysis, and direct pipe examination of pipe as required.
Previous investigation—including regular ILI performed as part of Enbridge’s integrity management program, the Enbridge Line 5 Biota Investigationi, the Enbridge Line 5 Screw Anchor Inspectionsii, and all associated third-party reporting—have demonstrated that measureable external corrosion on the Dual Pipelines is non-existent, that the environment in the Straits is minimally corrosive, that the biota is not creating uniquely corrosive conditions on the pipe surface, and that CP on the pipeline is protecting the pipe from corrosion by, in part, creating protective calcareous deposits at areas of coating damage.
This report uses input from a variety of data sources (see Sources of Data) to assess technologies capable of detecting coating damage, and provides recommendations about their potential to provide additive benefit to Enbridge’s management of external corrosion on the Dual Pipelines in the Straits.
Sources of Data | 3
Sources of Data
Enbridge engaged an industry-leading engineering consulting firm, Mears Group Inc. (Mears)1, to perform a detailed review of potential technologies for detecting coating damage on submarine/offshore pipelines.
Elements of this effort included:
1. Review literature on available technologies.
2. Determine applicability to the Straits of Mackinac Line 5.
3. Summarize the findings in a comprehensive report.
The Mears report is included in this document as Appendix A.
Enbridge accessed additional industry research through its membership to Pipeline Research Council International (PRCI)2 and other subscription reference libraries, including the ASM Corrosion Analysis Network3. Such technical resources (requiring membership or subscription) is often state-of-the-art or industry leading. In some cases, this information is not available to Mears or the general public.
In some cases, vendors of specific technologies were unable to share proprietary information directly with Mears due to competing commercial interests. In these cases, Enbridge leveraged its access to such proprietary information to evaluate the potential of these technologies to detect coating damage on submarine/offshore pipelines.
Enbridge has in-house experience with eight of the nine technologies that are part of this assessment. Enbridge has leveraged the experience of its staff to provide additional commentary about these technologies for detecting coating damage on submarine/offshore pipelines.
1 Mears Group, Inc. is an international engineering and construction company encompassing pipeline-related services, including pipeline integrity engineering, testing and construction services. Corrosion prevention and control are at the core of their specialty technical and engineering services.
2 PRCI is a not-for-profit corporation comprised primarily of energy pipeline companies whose mission is to collaboratively deliver relevant and innovative applied research to continually improve global energy pipeline systems.
3 ASM International is the world’s largest and most established materials-information society. The Corrosion Analysis Network is a single source for comprehensive and authoritative online information for researching, understanding, preventing and solving corrosion-related problems.
Third-party Consultancy
Enbridge Literature Search
Proprietary Vendor— Specific Data
Enbridge Experience and In-house Specialists

4 | Report to the State of Michigan—Evaluation of Technologies to Assess the Condition of Pipe Coating on Line 5
Evaluation Methodology
Technologies potentially applicable to detect damage to the coating on Line 5 across the Straits were evaluated in consideration of several capability elements, as discussed in the following subsections.
In order to maintain simplicity in the assessment, each element is qualitatively assigned a traffic light color:
Green means the technology satisfactorily meets the objectives of that element and is ready for use with minimal development on the Dual Pipelines in the Straits.
Yellow indicates that the technology has some limitations and may not meet the objectives of that element directly in its present form, and that some development may be required for application to the Straits.
Red indicates that there are major limitations, that the technology does not meet the elements objectives, or that the technology is not at present adaptable for use in the Straits.
Small-defect1 Detection
This element considers the ability of the technology to detect isolated areas of coating damage and/or external corrosion smaller than 1 square inch (<600mm2). Technologies that meet this objective are graded green. Technologies that could detect clusters of a few closely spaced areas of coating damage are graded yellow. Red is assigned to technologies that cannot detect a few closely spaced areas of coating damage.
Large-defect2 Detection
This element considers the ability of the technology to detect areas of coating damage and/or external corrosion as small as 1 square inch (>600mm2). Technologies that meet this objective are graded green. Technologies that might only be expected to detect areas of coating damage larger than 16 square inches (12,900 mm2) are graded yellow. Technologies unable to detect areas of coating damage smaller than 160 square inches (103,200 mm2), i.e. one order of magnitude less sensitive, are graded red.
1 Enbridge uses the term ‘Small Defect’ according to guidance provided by ANSI/NACE SP0502-2010, in which “small coating holidays” are described as “…isolated and typically <600mm2 (1 in2)”. NB: The term “holiday” is an industry standard term defined as “a discontinuity in a protective coating that exposes unprotected surface to the environment.” The terms “holiday”, “defect”, “area of coating damage”, “coating damage”, and “damage to the coating” are used interchangeably throughout this document.
2 Enbridge uses the term ‘Large Defect’ to describe an area of coating damage that does not meet the previous definition of ‘Small’. This is consistent with ANSI/NACE SP0502-2010, which only defines a “small coating holiday” (see previous footnote); and NACE SP0207-2007, which describes ‘medium to large defects’ as “…typically >600 mm2 (1 in2)”.
Defect Detection Capability
Evaluation Methodology | 5
This element considers the maturity of the technology with respect to industry use with submarine/offshore pipelines. Green is assigned to technologies that are in widespread use for submarine/offshore pipelines and this is reflected in the commercial availability of the technology for that purpose from several vendors. Yellow is assigned to technologies that have extremely limited use (pilot or feasibility projects) but are not yet commonly available for submarine/offshore use. Red is assigned to technologies that are considered at present to be not feasible for submarine/offshore use.
This element considers the known technical limitations specific to conditions of the Straits. Green is assigned to technologies that are expected to provide satisfactory detection capability under the specific circumstances of the Dual Pipelines. Yellow indicates that the specific circumstances of the Dual Pipelines would have a significant impact on that technology’s ability to detect areas of coating damage. Red indicates that there are parameters/circumstances of the Dual Pipelines that would render the technology ineffective.
Submarine/ Offshore Readiness
Applicability to the Dual Pipelines

6 | Report to the State of Michigan—Evaluation of Technologies to Assess the Condition of Pipe Coating on Line 5
Evaluation
Small-defect Detection
Large-defect Detection
Submarine/Offshore Readiness
Applicability to the Dual Pipelines
Cathodic Protection Close Interval Survey (CP CIS) is performed on a buried or submerged metallic pipeline in order to obtain valid direct current (DC) structure-to-electrolyte potential measurements at a regular interval that is sufficiently small enough to permit a detailed assessment of cathodic protection levels.
In its simplest form, this survey requires an electrical connection from the protected pipeline structure to a voltmeter or datalogger, which is connected in turn to a reference electrode placed near the pipeline (typically directly above the pipeline). Voltage measurements are taken every few feet (i.e. at ‘close intervals’) by moving the reference electrode along the length of the pipeline. There are several methodologies to conduct CP CIS surveys, as presented in Appendix A. The methodology that would be most applicable to the Straits crossing would be an interrupted ON/OFF potential survey.
CP CIS is intended to provide comprehensive measurement of cathodic protection levels on a pipeline (status of protection with respect to industry and regulatory standards) as opposed to detecting areas of coating damage, yet the technology has been recognized as a coating-assessment techniqueiii.
Isolated areas of coating damage smaller than 1 square inch (<600 mm2) are unlikely to be detected by this method; but clusters of closely spaced coating defects will produce an indication similar to large defects. Areas of coating damage that are larger than 1 square inch (>600mm2) create a local depression in the level of cathodic protection and attenuation in the CP IR drop—the difference in potential between the current ON and current OFF CP readings—making these features detectableiv. It is noted that some cathodic protection byproducts (such as calcareous deposits) provide a barrier to the environment, acting similar to a coating, and may reduce the sensitivity of CIS for detecting areas of coating damagev (similar to Alternating Current Voltage Gradient, which is described on pages 7-8).
CP CIS is an established practice for onshore pipelines, and several references to submarine/offshore use were found through industry sources such as NACE International1 and ASM. Major service providers indicate expertise in submarine/offshore CP CIS, particularly in northern Europe. There are no obstacles specific to the application of this technology on the Dual Pipelines in the Straits.
1 NACE International serves nearly 36,000 members in over 130 countries and is recognized globally as the premier authority for corrosion-control solutions.
Cathodic Protection Close Interval Survey

Evaluation | 7
Small-defect Detection
Large-defect Detection
Submarine/Offshore Readiness
Applicability to the Dual Pipelines
Cathodically protected structures receive electrical current through the environment (i.e. water) surrounding the structure (i.e. the pipelines). This electrical current produces a voltage gradient according to ohms law: current (I) through a resistive material (R), in this case the environment, produces a voltage drop (V=I*R). This voltage drop through the environment can be measured using a voltmeter connected to two reference electrodes in contact with the environment in close proximity to the structure of interest.
Direct Current Voltage Gradient (DCVG) Survey comprises a series of voltage gradient measurements along a pipeline, using a voltmeter connected to a pair of reference electrodes. The paired reference electrodes are moved along the pipeline (similar to the CP CIS survey), producing a detailed examination of the voltage gradient along the pipeline. A pipeline with a uniform coating will produce a uniform voltage gradient. However, areas of coating damage allow a surplus of electrical current to flow between the pipe and the environment, and this surplus current produces a localized increase in the voltage gradient near the pipe. In this way, a DCVG survey can be used to identify areas of coating damage.
DCVG is quite sensitive to detecting small and large areas of coating damage. Its ability to size areas of coating damage is strongly dependent on the location and spacing of reference electrodes.
This technology is thoroughly established for onshore pipelines, particularly as associated with External Corrosion Direct Assessment procedures used to manage pipeline (corrosion) integrity on non-piggable pipelines where in-line inspection is not feasible. No actual references to DCVG submarine/offshore projects were discovered during the literature search, and no vendors of the service for submarine/offshore pipelines were identified. The use of electric-field-gradient (EFG) measurement data as an adjunct dataset for submarine/offshore CP CIS is discussed in industry literature, but the sensitivity of EFG measurements for detecting and sizing areas of coating damage on submarine/offshore pipelines is uncertain.
Considerable effort and development would be required to adapt this technology for use within the Straits.
Small-defect Detection
Large-defect Detection
Submarine/Offshore Readiness
Applicability to the Dual Pipelines
Alternating Current Voltage Gradient (ACVG) Survey is similar to the DCVG in that a voltmeter is used to measure the voltage gradient in the environment surrounding a pipeline, and these reference electrodes are moved along the pipeline to produce a detailed voltage gradient survey.
However, the important difference is that ACVG uses a unique AC current signal to energize the pipeline, as well as a specialized voltmeter (tuned to this frequency) to measure the voltage gradient between the two reference electrodes. The unique signal used for ACVG enables identification of extremely small areas of coating damage (smaller than 0.01 square inch).
This technology is thoroughly established for onshore pipelines, particularly as associated with External Corrosion Direct Assessment procedures used to manage pipeline integrity on non-piggable pipelines where in-line inspection is not feasible. It is noted that some cathodic protection byproducts (such as calcareous deposits) provide a barrier to the environment, acting similarly to a coating, and can further present a barrier to ACVG current discharge at
Direct Current Voltage Gradient Survey
Alternating Current Voltage Gradient Survey

8 | Report to the State of Michigan—Evaluation of Technologies to Assess the Condition of Pipe Coating on Line 5
areas of coating damage, resulting in a loss of sensitivityvi. No actual references to ACVG survey projects on submarine/offshore pipelines were discovered during the literature search and no vendors of this service for submarine/offshore pipelines could be identified.
Considerable effort and development would be required to adapt this technology for use within the Straits.
Small-defect Detection
Large-defect Detection
Submarine/Offshore Readiness
Applicability to the Dual Pipelines
Cathodically protected structures receive electrical current through the environment surrounding the structure. The collection of electrical current along a linear structure (such as a pipeline) produces an axial current profile that is dependent on the current density received by the structure—which is dependent on the performance of the external coating system. If current measurements are recorded at regular intervals, the generalized coating performance may be assessed by examining the rate at which electrical current is collected along the pipeline.
Alternating Current Attenuation Survey involves the application of a unique AC signal to energize the pipeline. This unique signal is easier to detect than the cathodic protection current (which is DC), and the attenuation characteristics of AC current is more strongly affected by coating performance than DC current—making this more sensitive than a DC current attenuation survey, which is described in the Cathodic Protection Current Mapper In-line Inspection section on page 9.
Alternating Current Attenuation Survey is not a technique intended for locating areas of coating damage, but is instead intended to screen pipeline regions (lengths of 150-300 feet) for generalized coating performance variation. It is usually performed in conjunction with ACVG.
Anecdotal reports of customized underwater survey equipment were encountered during Enbridge’s data-gathering efforts, but no vendors of this service for submarine/offshore pipelines were identified.
This technology is not readily available for underwater use, but could be adapted for use within the Straits.
Small-defect Detection
Large-defect Detection
Submarine/Offshore Readiness
Applicability to the Dual Pipelines
Electromagnetic acoustic transducers (EMATs) use electromagnetic energy to induce acoustic energy into a pipe wall. Sensors are used to evaluate the transmission of this energy along short distances of the pipe wall in both the axial and circumferential directions. Pipe wall features such as cracking, metal loss, and changes in the external coating performance produce variations in the acoustic energy transmission. A detailed examination of the pipe wall is created as the in-line inspection tools transits the pipeline—propelled by fluid flow.
This in-line inspection technology was first developed to detect mid-wall flaws for gas transportation pipelines, but subsequent analysis conducted as part of pipe inspection demonstrated that the acoustic signal was modified by the type and quality of external coatingvii.
While the technology is considered ‘ready’ for both onshore and submarine/offshore pipelines, the extremely thick pipe wall of the Dual Pipelines adversely affects the technology’s sensitivity to detecting even very large (>16-square-inch) areas of coating damage. Only one vendor was found with an EMAT in-line inspection tool capable of running in the Dual Pipelines, but the pipe wall thickness of the Dual Pipelines are outside the specified operating range—rendering this technology unfeasible at the present time.
Alternating Current Attenuation Survey
Electromagnetic Acoustic Transducer In-line Inspection

Evaluation | 9
Small-defect Detection
Large-defect Detection
Submarine/Offshore Readiness
Applicability to the Dual Pipelines
Cathodically protected structures receive electrical current through the environment surrounding the structure. The collection of electrical current along a linear structure (such as a pipeline) produces an axial current profile that is dependent on the current density received by the structure—which is dependent on the performance of the external coating system. If current measurements are recorded at regular intervals, the generalized coating performance may be assessed by examining the rate at which electrical current is collected along the pipeline.
The Cathodic Protection Current Mapper (CPCM) is an in-line inspection technology that measures axial DC current flow in a pipeline directly—by measuring the voltage drop along the length of the in-line inspection tool. When electrical current passes through a metal conductor of known or calculable resistance, a reproducible axial voltage gradient is produced along the pipe.
The original intent of this in-line inspection technology was to detect step changes in axial current in pipelines such as those created by unintentional or unknown bonds to foreign structures. The attenuation profile of the CP current is also used as a general indicator of coating performance, similar to the Alternating Current Attenuation survey described on page 8. This inline inspection technology is not intended—nor is it sensitive enough—to detect small or large areas of coating damage in thick-wall pipe.
This technology was briefly available to pipeline operators from 2012 to 2018 through a single vendor, but it was removed from commercial availability in 2018.
Small-defect Detection
Large-defect Detection
Submarine/Offshore Readiness
Applicability to the Dual Pipelines
For external corrosion to affect the safety of the Dual Pipelines in the Straits (i.e. creating a leak or rupture threat), several coincident requirements must be satisfied:
• There must be coating damage that exposes the pipe surface to the lake water or bottom sediments;
• The level of cathodic protection at the location of the coating damage must be inadequate to prevent corrosion;
• The environment of the pipe (lake water or bottom sediment) must be corrosive enough to drive corrosion processes; and
• Sufficient time must elapse for integrity-affecting corrosion to occur.
Metal Loss In-Line Inspection (ML-ILI) can be accomplished using a variety of technologies that measure pipe wall thickness directly or indirectly with very high resolution—typically at intervals of ¼ inch axially along the pipeline and ¼ inch circumferentially around the pipeline.
ML-ILI can only infer coating damage by detecting that measurable corrosion has occurred. External corrosion cannot occur where coating is bonded and intact because the coating prevents contact between the pipe wall and the corrosive environment. Although the absence of external corrosion does not provide assurance that a coating is in good condition, the presence of external corrosion is a very reliable indicator that coating damage is present. As such, small and large areas of coating damage that have produced small and large areas of metal loss are reliably detectable. A ‘yellow’ grading is assigned to this element because of the sensitivity of the technology to detecting metal loss that occurs at areas of coating damage.
Cathodic Protection Current Mapper In-line Inspection
Metal Loss In-line Inspection

10 | Report to the State of Michigan—Evaluation of Technologies to Assess the Condition of Pipe Coating on Line 5
ML-ILI has been used in the management of pipeline corrosion since the 1970s and is widely available from many vendors for virtually any set of pipeline specifications/parameters. Multiple technologies have been employed for this purpose, including several variations of ultrasonic and magnetic-flux leakage technologies.
Small-defect Detection
Large-defect Detection
Submarine/Offshore Readiness
Applicability to the Dual Pipelines
Visual examination of coated structures for detection of coating damage and/or external corrosion is frequently used for aboveground structures, underwater structures and within enclosed spaces. For underwater structures, such inspections may be performed using remotely operated vehicles (ROVs), or through direct examination by divers. Depending on the quality of the images produced, small and large areas of coating damage may be identified.
As part of the Line 5 Screw Anchor Inspection Work Plan executed in 2017/2018, Enbridge has already used ROV- and diver-based visual examination of the Dual Pipelines. Visual assessment of coating damage in the Straits is significantly obscured by the presence of sediment and biota (algae, plants, mussels). This method is graded yellow for both small and large defects because of the additional requirement that divers scrape or brush away sediment and biota in order to achieve satisfactory results. While this methodology has been successfully used at discrete locations, completing visual examinations with divers to examine long lengths of pipeline would be prohibitive due to logistics.
The formation of calcareous deposits as a protection layer, where the original coating may be thin but still intact, negatively affects the reliability of this coating inspection technique.
Small-defect Detection
Large-defect Detection
Submarine/Offshore Readiness
Applicability to the Dual Pipelines
High-voltage holiday detection, also called ‘jeeping’, requires an external voltage to be applied between the pipe metal and an electrode/contactor that is brushed over the coating. When an area of coating damage is encountered, detectable electrical current will flow between the pipe metal and the external electrode. Extremely small coating pinholes—even those invisible to the naked eye—are detectable using this method.
This technology is commonly used on pipelines during construction and maintenance activities to ensure the coating is in good condition.
Application of this technology to submarine/offshore pipelines is not possible due to the passage of electrical current through the water surrounding both the pipe and the external electrode/contactor. The application of open (uncontained) electric voltage sources may present danger to divers and aquatic organisms.
Visual Examination
High-voltage Holiday Detection
Conclusions | 11
Conclusions
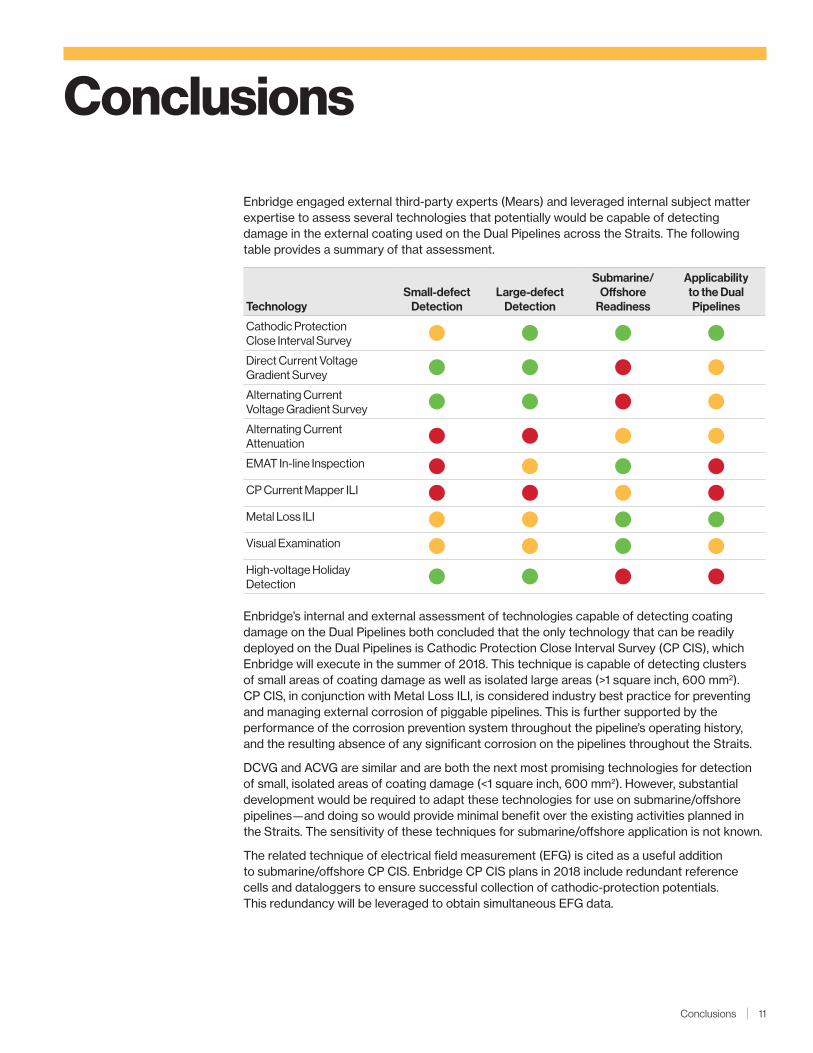
Enbridge engaged external third-party experts (Mears) and leveraged internal subject matter expertise to assess several technologies that potentially would be capable of detecting damage in the external coating used on the Dual Pipelines across the Straits. The following table provides a summary of that assessment.
TechnologySmall-defect
DetectionLarge-defect
Detection
Submarine/Offshore
Readiness
Applicability to the Dual Pipelines
Cathodic Protection Close Interval Survey
Direct Current Voltage Gradient Survey
Alternating Current Voltage Gradient Survey
Alternating Current Attenuation
EMAT In-line Inspection
CP Current Mapper ILI
Metal Loss ILI
Visual Examination
High-voltage Holiday Detection
Enbridge’s internal and external assessment of technologies capable of detecting coating damage on the Dual Pipelines both concluded that the only technology that can be readily deployed on the Dual Pipelines is Cathodic Protection Close Interval Survey (CP CIS), which Enbridge will execute in the summer of 2018. This technique is capable of detecting clusters of small areas of coating damage as well as isolated large areas (>1 square inch, 600 mm2). CP CIS, in conjunction with Metal Loss ILI, is considered industry best practice for preventing and managing external corrosion of piggable pipelines. This is further supported by the performance of the corrosion prevention system throughout the pipeline’s operating history, and the resulting absence of any significant corrosion on the pipelines throughout the Straits.
DCVG and ACVG are similar and are both the next most promising technologies for detection of small, isolated areas of coating damage (<1 square inch, 600 mm2). However, substantial development would be required to adapt these technologies for use on submarine/offshore pipelines—and doing so would provide minimal benefit over the existing activities planned in the Straits. The sensitivity of these techniques for submarine/offshore application is not known.
The related technique of electrical field measurement (EFG) is cited as a useful addition to submarine/offshore CP CIS. Enbridge CP CIS plans in 2018 include redundant reference cells and dataloggers to ensure successful collection of cathodic-protection potentials. This redundancy will be leveraged to obtain simultaneous EFG data.

12 | Report to the State of Michigan—Evaluation of Technologies to Assess the Condition of Pipe Coating on Line 5
References
i “Biota Investigation Work Plan Final Report”, Enbridge Energy, Limited Partnership, March 29, 2018. Retrieved from https://www.epa.gov/enbridge-spill-michigan/enbridge-line-5-biota-investigation.
ii “Anchor Inspection Work Plan: Interim Report”, Enbridge Energy, Limited Partnership, January 16, 2018, available upon request.
iii Segall, S., Gummow, R., Zahraee, M., Fingas, D., “Assessing the Integrity of Coating Systems on Pipelines in Trenchless Crossings”, Cataloque No. PR-444-133602-R01, Pipeline Research Council International, ©2015.
iv Standard Practice: “Performing Close-Interval Potential Surveys and DC Surface Potential Gradient Surveys on Buried or Submerged Metallic Pipelines”, SP0207-2007, Item No. 21121, NACE International, Houston, TX ©2007.
v Ukiwe, C. and McDonnell, S., “Assessing the Performance of Above Ground Coating Evaluation Surveys”, Catalogue No. L52362, Pipeline Research Council International, 2008, ©2012.
vi Ukiwe, C. and McDonnell, S., “Assessing the Performance of Above Ground Coating Evaluation Surveys”, Catalogue No. L52362, Pipeline Research Council International, 2008, ©2012.
vii “Augmenting MFL Tools with Sensors that Assess Coating Condition” (Battelle Memorial Institute), Catalogue No. L52298, Pipeline Research Council International, ©2009.

Appendix A: Mears Report | 13
Appendix A: Mears Report
14 | Report to the State of Michigan—Evaluation of Technologies to Assess the Condition of Pipe Coating on Line 5
4500 N. Mission Rd. * Rosebush, MI 48878 * ph: (989) 433-2929 * fax: (989) 433-5433 * www.mearscorrosion.com
Straits of Mackinac Line 5
Coating Assessment Technologies
State of The Art
Report
June 14, 2018
Mears Job #: 9141883308

Appendix A: Mears Report | 15
Coating Assessment Technologies State of The Art
Page 1
EXECUTIVE SUMMARY
Mears Group, Inc. (Mears) has been retained by Enbridge to provide a state-of-art report
describing available survey technologies to assess coating damage on in-situ pipelines. This
assessment includes a review of the current available technologies and the potential application
to assess coating condition on the underwater segments of the Line 5 crossings of the Straits of
Mackinac.
The scope of work consisted of three tasks:
Task 1 – Review Literature on Available Technologies,
Task 2 – Determine Applicability to Straits of Mackinac Line 5, and
Task 3 – Summarize the Findings in a State-of-the-Art Report.
The technologies reviewed in this report include Close Interval Survey (CIS), Direct Current
Voltage Gradient (DCVG), Alternating Current Voltage Gradient (ACVG), AC Attenuation, Electro-
Magnetic Acoustic Transducer In-Line Inspection (EMAT ILI), Cathodic Protection Pipeline
Inspection (CPCMTM). The industry standards, practice and guidelines are summarized for each
technology. Special focus was on the applications for utilizing these techniques to assess coating
anomalies on underwater pipelines such as the Line 5 crossings of the Straits of Mackinac. A
literature review of these technologies was performed and summarized in this report.
The CIS survey has been successfully used throughout the world to assess CP levels on subsea
and submerged pipelines and is deemed to be the most reliable indirect inspection tool for this
application. NACE SP0207-2007 indicates that CIS can locate medium-to-large defects in
coatings (isolated or continuous and typically >600 mm2 [1 in2]).
DCVG surveys are capable of distinguishing between isolated and continuous coating damage,
due to the fact that the shape of the gradient field surrounding a fault provides this information.
DCVG can also be used to identify isolated coating damage, such as rock damage, or continuous
coating damage. The vast majority of DCVG surveys have been performed on land based buried
pipelines. The commonly used instrumentation and techniques are not adapted for deep
submerged pipelines making such surveys unfeasible.

16 | Report to the State of Michigan—Evaluation of Technologies to Assess the Condition of Pipe Coating on Line 5
Coating Assessment Technologies State of The Art
Page 2
ACVG can be utilized to identify several types of problems on underground pipelines with the
most common use being to identify indications of coating anomalies utilizing a unique AC
frequency as its signal source. ACVG survey equipment has not been for use on deep subsea
or deep underwater pipelines.
The review has also shown that the EMAT tool shows promise as a coating assessment tool, but
likely will not yield incremental value to the use of the CIS tool to assess and ensure CP efficacy
in conjunction with periodic inspection through ILI intended to detect external metal loss
anomalies. Pipe wall thickness impacts the sensitivity of the EMAT tool in detecting coating
anomalies, this inspection tool is not capable of detecting small coating defects and is not
additionally useful compared to the option of using CIS to detect medium to large size coating
defects.
The capabilities and effectiveness of Baker Hughes Cathodic Protection Current
Measurement (CPCMTM) ILI for detecting coating holidays was specifically requested. The heavy
wall pipe utilized in the straits crossings dis not compatible with this technique. Information
obtained at the time of conducting this review indicated that the tool is no longer commercially
available and thus the analysis of CPCM ILI for this application is only superficially discussed in
this report.
While other coating assessment tools such as DCVG, ACVG and AC Attenuation can be reliably
performed for onshore land-based pipelines, those technologies present significant challenges
for underwater pipelines. The instrumentation and techniques have not been adapted for deep
submerged pipelines making such surveys unfeasible at this time. The technical challenges and
lack of proven detection capabilities and calibration of those techniques to an underwater pipeline
introduce too much risk of unreliable and potentially misleading results to warrant serious
consideration.
The use of CIS and CP measurements are demonstrated to be the most appropriate technologies
to continue to evaluate the coating performance of the Straits crossings. Integrity management
practices, including inline inspection to assess corrosion condition, provide an additional method
of validation to confirm the performance of corrosion protection systems beyond the inspections
methods evaluated herein. CIS provides adequate detection of moderate and large coating

Appendix A: Mears Report | 17
Coating Assessment Technologies State of The Art
Page 3
defects in addition to comprehensive cathodic protection status, while periodic metal loss ILI
continues to be the preferred industry standard and best practice for monitoring corrosion.
The results of this study have shown that CIS and ILI remain the two most reliable tools for
assessing the integrity of the Line 5 Straits of Mackinac pipeline crossing. Moreover, CIS has
evolved into a mature and reliable technology for subsea and marine crossing pipelines.

18 | Report to the State of Michigan—Evaluation of Technologies to Assess the Condition of Pipe Coating on Line 5
Coating Assessment Technologies State of The Art
Page 4
Table of Contents
Section Page
1.0 INTRODUCTION...........................................................................................................12
2.0 REFERENCES..............................................................................................................13
3.0 CATHODIC PROTECTION (CP) ...................................................................................14
3.1 Cathodic Protection Theory .......................................................................................14
3.2 Cathodic Protection Types.........................................................................................16
3.3 Effect of Coating on Cathodic Protection ...................................................................17
4.0 METHODS FOR EVALUATING CORROSION PROTECTION SYSTEMS ...................19
5.0 CLOSE-INTERVAL SURVEY (CIS) ..............................................................................22
Description of Technology .........................................................................................23
Equipment .................................................................................................................23
Potential Survey Types..............................................................................................24
5.3.1 Interrupted or ON/OFF Potential Survey ................................................................24
5.3.2 ON Potential Survey ..............................................................................................25
5.3.3 Depolarized Potential Survey.................................................................................25
CIS Procedures .........................................................................................................26
5.4.1 Pipeline Location and Marking ...............................................................................27
5.4.2 Current Interrupters ...............................................................................................27
5.4.3 Survey Spacing Interval .........................................................................................27
5.4.4 Reference Electrode Placement ............................................................................28
5.4.5 Survey Areas .........................................................................................................28
5.4.6 Survey Direction ....................................................................................................28
Appendix A: Mears Report | 19
Coating Assessment Technologies State of The Art
Page 5
5.4.7 Start and End of Survey.........................................................................................28
Interpretation of Data.................................................................................................28
5.5.1 IR Drop ..................................................................................................................28
5.5.2 Criteria for Cathodic Protection ..............................................................................30
Corrosion Control Surveys for Offshore Pipeline........................................................30
5.6.1 Equipment .............................................................................................................31
5.6.2 Subsea Survey ......................................................................................................32
5.6.3 CIS Pipelines in Shallow Water..............................................................................33
5.6.4 CIS Pipelines in Deep Water Offshore ...................................................................34
CIS Limitations ..........................................................................................................40
Applicability to Subsea or Submerged Pipelines ........................................................40
6.0 DIRECT CURRENT VOLTAGE GRADIENT SURVEYS (DCVG)..................................41
Equipment .................................................................................................................42
DCVG Procedure.......................................................................................................42
Interpretation of Data.................................................................................................43
Limitations .................................................................................................................44
6.4.1 Depth of Cover ......................................................................................................44
6.4.2 Interference ...........................................................................................................45
6.4.3 Signal Strength ......................................................................................................45
6.4.4 Applicability to Subsea or Submerged Pipelines ....................................................45
Integrated CIS/DCVG Survey ....................................................................................45
7.0 ALTERNATING CURRENT VOLTAGE GRADIENT (ACVG) .......................................48
Description ................................................................................................................48

20 | Report to the State of Michigan—Evaluation of Technologies to Assess the Condition of Pipe Coating on Line 5
Coating Assessment Technologies State of The Art
Page 6
Application of ACVG..................................................................................................48
Limitations .................................................................................................................52
7.3.1 Shielding Coatings.................................................................................................52
7.3.2 Pipe Depth of Cover. .............................................................................................52
7.3.3 High resistant ground conditions............................................................................53
7.3.4 Rocky Terrain ........................................................................................................53
7.3.5 Very Dry Soil..........................................................................................................53
7.3.6 Probe Spacing .......................................................................................................53
Coating Assessment..................................................................................................54
Applicability to Subsea or Submerged Pipelines ........................................................55
8.0 AC ATTENUATION.......................................................................................................56
Description ................................................................................................................56
Application of AC Attenuation ....................................................................................56
Limitations .................................................................................................................57
Coating Assessment..................................................................................................57
Applicability to Subsea or Submerged Pipelines ........................................................58
9.0 ELECTRO-MAGNETIC ACOUSTIC TRANSDUCER (EMAT).......................................60
Description of EMAT..................................................................................................60
EMAT Principle..........................................................................................................60
9.2.1 EMAT Resolution...................................................................................................62
Application of EMAT ..................................................................................................63
EMAT for Coating Assessment..................................................................................64
9.4.1 Identifying Disbonded Coatings .............................................................................65
Appendix A: Mears Report | 21
Coating Assessment Technologies State of The Art
Page 7
9.4.2 Identify Coating Types ...........................................................................................66
Limitations and Challenges for Coating Assessments................................................68
9.5.1 EMAT Sensor Operation........................................................................................68
9.5.2 Noise Ratio ............................................................................................................68
9.5.3 High Wear of Sensor .............................................................................................68
9.5.4 Impact of Pipe Wall Thickness ...............................................................................69
10.0 CPCM ILI TOOL............................................................................................................69
11.0 LITERATURE REVIEW.................................................................................................69
Literature Review on CIS/DCVG/ACVG.....................................................................69
Literature Review on Offshore Pipeline Survey..........................................................73
Literature Review on EMAT.......................................................................................74
Literature Review on CPCM ......................................................................................77
12.0 SUMMARY OF STATE OF THE ART ...........................................................................77
13.0 BIBLIOGRAPHY...........................................................................................................78
APPENDIX A............................................................................................................................80
Literature Review on CIS/DCVG/ACVG ................................................................................80
Literature Review on Offshore Pipeline Survey .....................................................................94
Literature Review on EMAT ..................................................................................................98
Literature Review on CPCM................................................................................................109

22 | Report to the State of Michigan—Evaluation of Technologies to Assess the Condition of Pipe Coating on Line 5
Coating Assessment Technologies State of The Art
Page 8
List of Tables
Table Page
Table 1: Sensitivity of the EMAT Tool .....................................................................................105
Appendix A: Mears Report | 23
Coating Assessment Technologies State of The Art
Page 9
List of Figures
Figure Page
Figure 1: Location of Enbridge Line 5 Pipelines ........................................................................12
Figure 2: Basic CP Theory ........................................................................................................15
Figure 3: Impressed Current CP. ..............................................................................................16
Figure 4: Galvanic (or Sacrificial) Anode Cathodic Protection ...................................................17
Figure 5: Cathodic protection of a coated pipeline.....................................................................18
Figure 6: Coating breakdown factors from Table 3 of ISO 15589-2-2012. .................................19
Figure 7: ECDA Tool Selections................................................................................................21
Figure 8: Schematic of CIS Survey (AW Peabody) ...................................................................24
Figure 9: CIS Data Showing On, Off, And Depolarized Potentials .............................................26
Figure 10: Pipe-to-Soil Potential Measurements .......................................................................29
Figure 11: Potentials Variations along the Pipeline ...................................................................31
Figure 12: Example of Half Cell Contact Probe used in seawater (Copper/Copper Sulfate
Reference Cells Are Typically Used During Fresh Water Surveys)....................................33
Figure 13: Trailing Wire Technique for Offshore Pipeline CIS Survey .......................................35
Figure 14: Pipe to Electrolyte Potential Profile-Towed Fish Trailing Wire Survey ......................36
Figure 15: P/E Potential Profile-Submersible Assisted Survey ..................................................37
Figure 16: ROV Survey Method of Gathering CP Data..............................................................39
Figure 17: High Resolution Survey Plot for a CP Survey...........................................................39
Figure 18: Voltage Gradient in the Earth Around A Catholically Protected Bare Pipeline ..........41
Figure 19: Coating Holiday Detection Using Voltage Gradient Method [NACE Class CP3] .......43
Figure 20: Voltage Gradient (NACE Class CP2) .......................................................................44

24 | Report to the State of Michigan—Evaluation of Technologies to Assess the Condition of Pipe Coating on Line 5
Coating Assessment Technologies State of The Art
Page 10
Figure 21: Integrated CIPS/DCVG Arrangement ......................................................................46
Figure 22: 16” Pipeline Identification of Indication Based on Potential and Gradient Profile ......47
Figure 23: Example of Transmitter Connection for ACVG .........................................................49
Figure 24: Picture of A Display from An ACVG Receiver...........................................................50
Figure 25: Picture of a Typical A-frame Utilized for ACVG20 ......................................................50
Figure 26: Pinpointing the Indication with Four Arrows Pointing to the Same Location20 ...........51
Figure 27: A-frame Digital Display with Locate and ACVG Signals Being Displayed Together2051
Figure 28: dB Microvolt Levels Will Rise When Approaching the indication and Current at the
Indication Will Affect the dB Microvolt Value20 ...................................................................52
Figure 29: The Effect of Probe Spacing on the ACVG...............................................................54
Figure 30: Types of Analysis From Current Attenuation Surveys ..............................................59
Figure 31: EMAT Principles23 ...................................................................................................61
Figure 32: Configuration of Individual EMAT Sensor Representing One of EMAT ILI Tool23 .....61
Figure 33: Low Resolution Approach (left) and High Resolution Approach (right) .....................62
Figure 34: Coating Disbondment (Loss of Adhesion) Detection by EMAT.................................64
Figure 35: Signal Transmitted by One Sensor Received by Remote Sensor.............................65
Figure 36: Increase of Transmission Signal in Regions with Disbonded Coating.......................66
Figure 37: Signal Effect with Different Coatings ........................................................................66
Figure 38: EMAT Identification of Different Coatings.................................................................67
Figure 39: Distribution of Coating Types by EMAT by Now. ......................................................67

Appendix A: Mears Report | 25
Coating Assessment Technologies State of The Art
Page 11
Acronyms and Abbreviations
A Ampere
ACVG Alternating Current Voltage Gradient
CP Cathodic Protection
CSE Copper-Copper Sulfate Reference Electrode
CIS
CTE
DC
Close Interval Survey
Coal Tar Enamel
Direct Current
DCVG Direct Current Voltage Gradient
PCM Pipeline Current Mapper
ECDA
ICCP
External Corrosion Direct Assessment
Impressed Current Cathodic Protection
ILI In-Line Inspection
EMAT Electro-Magnetic Acoustic Transducer
ROV Remote Operated Vehicle
V Volt
26 | Report to the State of Michigan—Evaluation of Technologies to Assess the Condition of Pipe Coating on Line 5
Coating Assessment Technologies State of The Art
Page 12
1.0 INTRODUCTION
Background
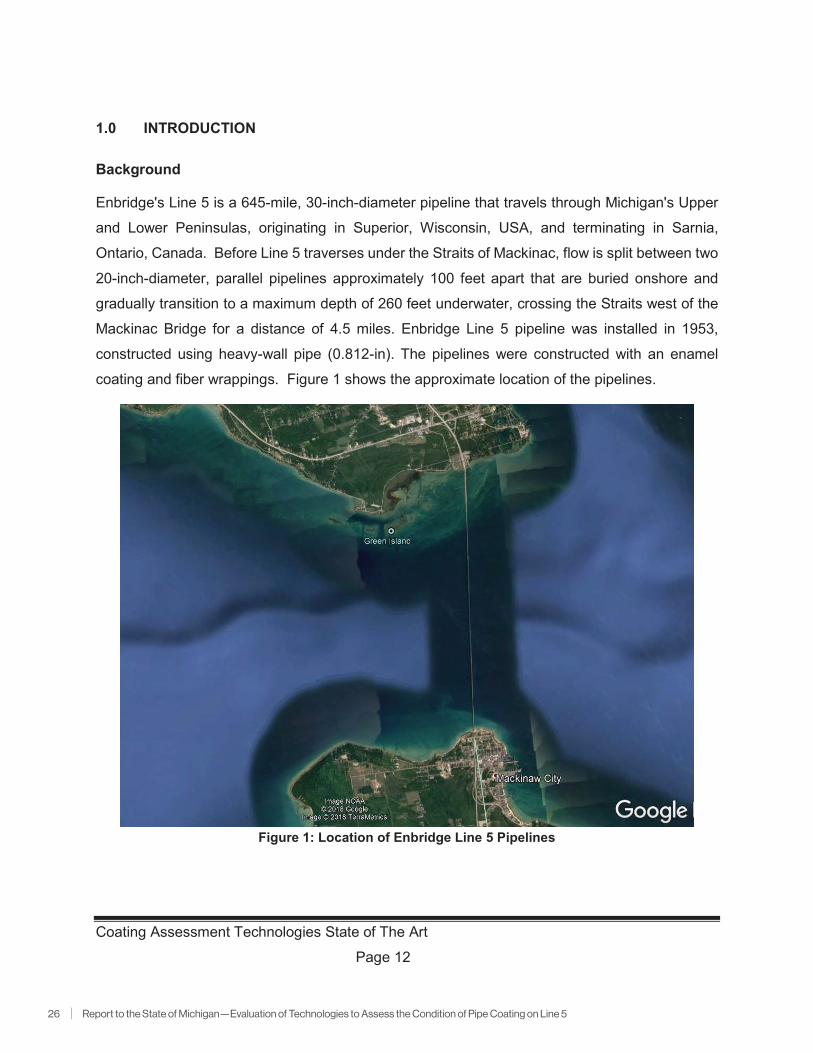
Enbridge's Line 5 is a 645-mile, 30-inch-diameter pipeline that travels through Michigan's Upper
and Lower Peninsulas, originating in Superior, Wisconsin, USA, and terminating in Sarnia,
Ontario, Canada. Before Line 5 traverses under the Straits of Mackinac, flow is split between two
20-inch-diameter, parallel pipelines approximately 100 feet apart that are buried onshore and
gradually transition to a maximum depth of 260 feet underwater, crossing the Straits west of the
Mackinac Bridge for a distance of 4.5 miles. Enbridge Line 5 pipeline was installed in 1953,
constructed using heavy-wall pipe (0.812-in). The pipelines were constructed with an enamel
coating and fiber wrappings. Figure 1 shows the approximate location of the pipelines.
Figure 1: Location of Enbridge Line 5 Pipelines

Appendix A: Mears Report | 27
Coating Assessment Technologies State of The Art
Page 13
Project Objective and Scope of Work
Mears Group, Inc. (Mears) was retained by Enbridge to prepare a state-of-the-art report
summarizing presently available technologies to detect and assess coating damage on in-situ
pipelines, and the applicability of these technologies to the dual pipelines in the Straits of
Mackinac.
The scope of work consisted of three tasks:
Task 1 – Review Literature on Available Technologies,
Task 2 – Determine Applicability of These Technologies to Straits of Mackinac Line 5, and
Task 3 – Summarize the Findings in a State-of-the-Art Report.
The work was carried out in accordance with Mears Proposal CP 5393, February 23rd, 2018 and
in accordance with Enbridge WLAW-1000010-18.
2.0 REFERENCES
The information and documentation reviewed and relied upon in these analyses is shown below:
Standards/Procedures/Specifications
• SP0169-2013 Control of External Corrosion on Underground or Submerged Metallic Piping Systems-Item No. 21001
• SP0502-2010 Pipeline External Corrosion Direct Assessment Methodology (ECDA)
• SP027-2007 Potential Surveys and DC Surface Potential Gradient Surveys on Buried or Submerged -Item No. 21121
• TM0109-2009 Aboveground Survey Techniques for the Evaluation of Underground Pipeline Coating Condition-Item No. 21254
• TM0497-2002, Measurement Techniques Related to Criteria for Cathodic Protection on
Underground or Submerged Metallic Piping Systems-Item No. 21231
• ISO Standard 15589–2-2012 Petroleum, petrochemical and natural gas industries-
Cathodic protection of pipeline transportation systems Part2: Offshore pipelines

28 | Report to the State of Michigan—Evaluation of Technologies to Assess the Condition of Pipe Coating on Line 5
Coating Assessment Technologies State of The Art
Page 14
Industry Literature Research
Detailed summaries of literature reviewed along with a bibliography of references are listed at the
end of this report and also in Appendix A.
3.0 CATHODIC PROTECTION (CP)
CP is a widely used and effective method of corrosion control. It is commonly used as part of a
corrosion prevention system, in concert with coatings on underground and submerged structures.
For transmission pipelines carrying hazardous liquids and natural gas, the use of coatings and
cathodic protection is required by Federal regulations (Title 49 CFR Part 195 and 192).
It is commonly accepted that protective coatings are considered the first line of defense for
corrosion protection of buried and submerged pipelines1. It is also understood that protective
coatings are not perfect and will have pinholes, flaws and defects where the pipe substrate will
be protected by the application of CP, often through the development of calcareous deposits/films
consisting primarily of calcium carbonate and magnesium carbonate.2
The following section discusses the theory of cathodic protection, and the types of cathodic
protection systems in common use.
3.1 Cathodic Protection Theory
Direct current (DC) is applied to all surfaces of the pipeline through an external source. This direct
current shifts the electric potential of the pipeline in the negative direction, resulting in a reduction
in the corrosion rate of the metal. When the amount of current flowing is adjusted properly, it will
overpower the corrosion current discharging from the anodic areas on the pipeline, and there will
be a net current flow onto the pipe surface at these points. The entire surface then will be a
cathode and the corrosion rate will be reduced. This concept is illustrated in Figure 2. Details of
1 SP0169-2013 “Control of External Corrosion on Underground or Submerged Metallic Piping Systems, NACE International, Texas.
2 Characteristics of Cathodic Protection And Calcareous Deposits For Type 316L Stainless Steel In Simulated Deep
Sea Condition by Ki-Joon Kim and William H Hartt.

Appendix A: Mears Report | 29
Coating Assessment Technologies State of The Art
Page 15
the application of CP are given in Chapters 4 and 5 of the book “CONTROL OF PIPELINE
CORROSION” by A. W. Peabody.
Figure 2: Basic CP Theory3
The CP system requirements, procedure, design, installation, operation and maintenance
processes are also recommended by NACE standard practice SP0169 “Control of External
Corrosion on Underground or Submerged Metallic Piping Systems”1.
3 A.W. Peabody, “Control of Pipeline Corrosion” by Peabody, NACE International, the Corrosion Society, Texas, 1967, 2001.
30 | Report to the State of Michigan—Evaluation of Technologies to Assess the Condition of Pipe Coating on Line 5
Coating Assessment Technologies State of The Art
Page 16
3.2 Cathodic Protection Types
There are two general types of cathodic protection installation that differ primarily in the manner
in which a voltage is obtained to supply cathodic protection current. These two types are
commonly referred to as impressed current cathodic protection and galvanic (or sacrificial) anode
cathodic protection4. These are described below.
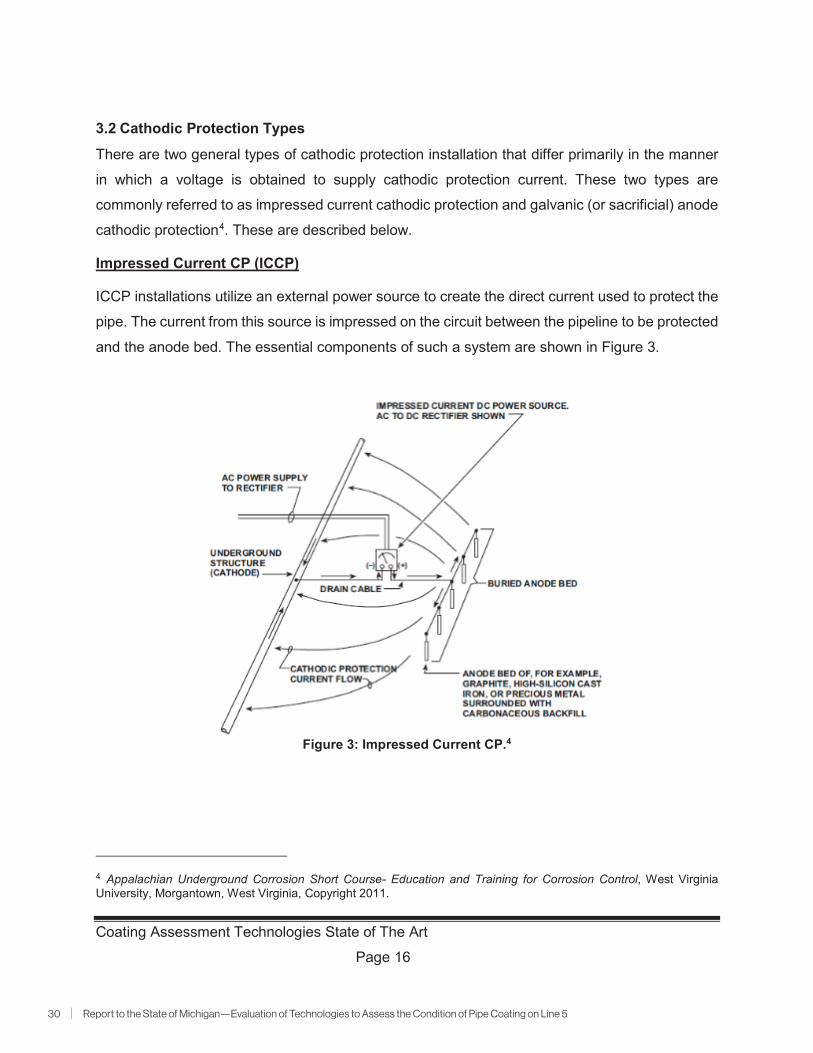
Impressed Current CP (ICCP)
ICCP installations utilize an external power source to create the direct current used to protect the
pipe. The current from this source is impressed on the circuit between the pipeline to be protected
and the anode bed. The essential components of such a system are shown in Figure 3.
Figure 3: Impressed Current CP.4
4 Appalachian Underground Corrosion Short Course- Education and Training for Corrosion Control, West Virginia University, Morgantown, West Virginia, Copyright 2011.

Appendix A: Mears Report | 31
Coating Assessment Technologies State of The Art
Page 17
Galvanic (or Sacrificial) Anode Cathodic Protection
This type of cathodic protection depends on the voltage difference between dissimilar metals to
cause protective direct current to flow. A typical galvanic anode cathodic protection installation is
shown in Figure 4. The anode material can be magnesium (as shown in Figure 4), zinc or
aluminum. The anode material is normally available in cast shapes of various sizes to fit the
requirements of differing galvanic anode cathodic protection installation designs.
Figure 4: Galvanic (or Sacrificial) Anode Cathodic Protection4
3.3 Effect of Coating on Cathodic Protection
A protective coating applied to the pipe surface serves to isolate the pipeline from potentially
corrosive environments in which the pipeline is installed. CP with a high-resistance barrier coating
between the pipeline and the environment is shown in Figure 5. Current from the CP ground bed
is flowing to all areas where pipe metal is exposed. This area is substantially reduced due to the
presence of the coating. In addition to the current flowing to defects, current also flows through
the coating material itself. No coating material is a perfect insulator (even when absolutely free of
any defects) and will conduct some current. The amount will depend on the electrical resistivity of
the material and its thickness.

32 | Report to the State of Michigan—Evaluation of Technologies to Assess the Condition of Pipe Coating on Line 5
Coating Assessment Technologies State of The Art
Page 18
Figure 5: Cathodic protection of a coated pipeline3
ISO Standard 15589–2-2012 Petroleum, petrochemical and natural gas industries-Cathodic
protection of pipeline transportation systems Part2: Offshore pipelines, provides guidance on
coating breakdown factors (Table 3 of ISO 15589-2-2012 – Figure 6), acknowledging that
coatings are expected to degrade, have flaws, age and require consideration of CP requirements
to assure adequate corrosion protection.

Appendix A: Mears Report | 33
Coating Assessment Technologies State of The Art
Page 19
Figure 6: Coating breakdown factors from Table 3 of ISO 15589-2-2012.
4.0 METHODS FOR EVALUATING CORROSION PROTECTION SYSTEMS
In order to ensure the effectiveness of the cathodic protection systems, which provides protection
on the pipeline against corrosion, surveys and inspections are routinely completed. The quality
and condition of the pipeline coating can significantly affect the performance of the CP system.
NACE standard practice SP0169 recommends provides guidance on inspection of coating
systems. In the case of buried and submerged pipelines, indirect inspections methods using
electrical methodology is commonly applied to assess the CP system and coating condition.
NACE developed a standard practice to provide guidance to the industry on methodologies to
assess the extent and severity of external corrosion. This standard was first developed to assist
in evaluating the integrity of pipelines that could not be assessed through ILI or pressure testing.
NACE standard practice SP0502 “Pipeline External Corrosion Direct Assessment Methodology”

34 | Report to the State of Michigan—Evaluation of Technologies to Assess the Condition of Pipe Coating on Line 5
Coating Assessment Technologies State of The Art
Page 20
suggests close interval survey (CIS), direct current voltage gradient (DCVG), alternate current
voltage gradient (ACVG), and alternating current (AC) attenuation surveys to assess the CP levels
and the identify locations of coating holidays, as shown in Figure 6. In the absence of ILI data, a
combination of the surveys listed above provide a comprehensive assessment on CP levels and
pipeline coating damage or degradation to evaluate the corrosion prevention system as a whole.
These concepts are embodied in the External Corrosion Direct Assessment (ECDA) process
developed specifically as a tool to assess pipelines that cannot be inspected by ILI.

Appendix A: Mears Report | 35
Coating Assessment Technologies State of The Art
Page 21
Figure 7: ECDA Tool Selections5

36 | Report to the State of Michigan—Evaluation of Technologies to Assess the Condition of Pipe Coating on Line 5
Coating Assessment Technologies State of The Art
Page 22
Research of industry practices for coating assessments, including an evaluation of NACE/ISO
standards, technical papers and related articles, was completed as part of this scope. The
research assessed the available technologies used to detect and assess coating damage on in-
situ pipelines including:
• Close Interval Survey (CIS),
• Direct Current Voltage Gradient (DCVG),
• Alternating Current Voltage Gradient (ACVG),
• AC Attenuation,
• Electro-Magnetic Acoustic Transducer In-Line Inspection EMAT (ILI), and
• Cathodic Protection Current Measurement (CPCM) ILI Tool.
The following summaries are based on the research of each technology.
5.0 CLOSE-INTERVAL SURVEY (CIS)
CIS is a potential survey performed at close spaced intervals along a buried or submerged metallic
pipeline. The DC pipe-to-electrolyte potentials are measured at a regular interval over the
pipeline. The objective of a CIS is to measure the pipe-to-electrolyte potential at sufficient points
along a pipeline in order to:
• Confirm performance of CP system along the length of the pipeline;
• Identify the areas outside of the range of potential criteria of a pipeline not identified by
test point survey;
• Determine the extent of areas outside the range of potential criteria;
• Determine the influence of CP, measure the level of CP, evaluate the effectiveness of
current distribution along a pipeline, locate CP shielding areas;
• Identify the risk of interference condition;
5 SP0502-Pipeline External Corrosion Direct Assessment Methodology, NACE International, Texas.

Appendix A: Mears Report | 37
Coating Assessment Technologies State of The Art
Page 23
• Locate medium-to-large defects in coatings (isolated or continuous and typically > 600
mm2 (~1 inch2)6;
• Identify shorted casings, defective electrical isolation devices, or contact with other
metallic structures etc.
A general description of the CIS technology will be discussed in Section 5.1. The equipment,
applications, procedures, and data analysis of the CIS are given in Section 5.2 and 5.5 . The
application of CIS technology for the offshore pipeline will be given in Section 5.6. The limitations
of this technology will be addressed in Section 5.7.
Description of Technology
CIS is used to measure the potential difference between the pipe and the electrolyte, such as soil
or water media. Figure 7 shows a general schematic of the CIS survey methodology. An
insulated wire is typically used to electrically connect the pipe test station or other electrically
continuous pipeline appurtenance with a voltmeter terminal. A reference electrode is connected
to the other terminal of the voltmeter and is placed directly over the pipeline at specific intervals.
Because the electrical potential of the pipe is taken at such close spacing, this survey provides
the most comprehensive evaluation of cathodic protection levels for pipelines.
Equipment
The details of the equipment are given in the book “Cathodic Protection Survey Procedures” by
H. Brian Holtsbaum7.
• The voltmeter has a high input resistance (typically 10 megohm or higher);
• A copper – copper sulfate (CSE) reference electrode is normally used for pipe in soil or
fresh water, whereas a silver-silver chloride (Ag/AgCl) reference electrode is used in high
chloride electrolytes such as seawater. Other electrodes may be used, such as a
6 SP0207-2007 Perforating Close-Interval Potential Surveys and DC Surface Potential Gradient Surveys on Buried or Submerged Metallic Pipelines”7 H. Brian Holtsbaum, “Cathodic Protection Survey Procedures-3rd Edition”, NACE International, The Corrosion Society, Texas, 2016

38 | Report to the State of Michigan—Evaluation of Technologies to Assess the Condition of Pipe Coating on Line 5
Coating Assessment Technologies State of The Art
Page 24
saturated calomel electrode (SCE) and a hydrogen electrode; however, these are normally
used in laboratory conditions.
• Test lead complete with electrically insulated spring clips or connectors. Ensure that there
are low contact resistances between the instrument terminals and the wires the wire
connectors, or the spring clip and the wire and the reference electrode, and
• Long electrical connection typically on a spool or reel.
Figure 8: Schematic of CIS Survey (AW Peabody)
Potential Survey Types
The types of CIS surveys include ON/OFF potential surveys, ON potential surveys, and
depolarized potential surveys5.
5.3.1 Interrupted or ON/OFF Potential Survey
Interrupted, or ON/OFF, potential survey measures the potential difference between the
pipeline and the electrolyte with the CP current source (CP system) interrupted. This survey
Appendix A: Mears Report | 39
Coating Assessment Technologies State of The Art
Page 25
is used to evaluate the CP system performance in accordance with CP criteria, to detect
medium to large size or CP current drains, and as a screening tool for identifying areas of
possible stray current interference.
ON potentials are the measurements with the CP system operating and providing the CP
current to the pipeline. OFF potentials are the measurements with the CP system briefly
interrupted and not providing the CP current to the pipeline and more accurately reflect the
true polarized potential.
ON/OFF surveys typically incorporate electronically synchronized current interrupters at each
CP current source, bond, and other current drain point that influences the pipeline potential in
the survey area. Typical interrupter cycles are evenly divisible in 60 seconds, with an ON duty
cycle of at least 75% to avoid significant depolarization. The selection of interrupt cycles is
determined by equipment capabilities and transient behavior of the pipeline potentials during
the interrupt cycle.
The accuracy of the ON and OFF data is typically verified using the following techniques:
• Wave form capture and analysis,
• Digital oscilloscope, and
• Digitized signal equipment.
5.3.2 ON Potential Survey
ON potential surveys are performed by measuring the potential difference between the pipe
and the ground surface above the pipe at regular intervals while the CP is operating in its
normal mode. ON potential surveys are used on pipelines protected with CP current sources
that cannot be interrupted.
5.3.3 Depolarized Potential Survey
Depolarized potential surveys measure the potential difference between the pipe and the
ground surface after the cathodic current has been switched off long enough for the pipe-to-
soil potential to stabilize to equilibrium (‘native state’) potentials. Depolarized potential
surveys are used to evaluate the effectiveness of the CP system with respect to a polarization

40 | Report to the State of Michigan—Evaluation of Technologies to Assess the Condition of Pipe Coating on Line 5
Coating Assessment Technologies State of The Art
Page 26
decay criterion. The surveys are often performed in conjunction with ON/OFF potential
surveys where compliance with the polarized OFF potential criterion is not achievable. All CP
current sources, such as transformer-rectifiers or other DC power supplies, are de-energized
by either breaking critical bonds or adjusting them so that they overcome interference effects
while not providing additional CP. The pipeline is allowed to depolarize until a plot of potential
versus time indicates that the pipe-to-soil potential is no longer decaying.
Figure 8 illustrates an example of the data results from these three types of CIS surveys (on,
off, and native potentials).
Figure 9: CIS Data Showing On, Off, And Depolarized Potentials3
CIS Procedures
Accurate potential measurements are critical to many areas of corrosion control work, especially
when potential measurements are used for evaluating the efficacy of cathodic protection systems.

Appendix A: Mears Report | 41
Coating Assessment Technologies State of The Art
Page 27
The details of CIS survey are described in “SP0207-2007 Performing Close-Interval Potential
Surveys and DC Surface Potential Gradient Surveys on Buried or Submerged Metallic Pipelines”
by NACE International8.
5.4.1 Pipeline Location and Marking
Accurate location of a pipeline is required in order to minimize the voltage drops in the
electrolyte and to obtain the highest resolution of the survey. This includes reviewing pipeline
drawings prior to locating the pipeline, visual identification of the pipeline by aboveground
appurtenances, casing vents, or pipeline markers. For land-based survey, the pipeline is
typically flagged by survey crews using electromagnetic pipe detection equipment in advance
of the CIS potential surveyor.
5.4.2 Current Interrupters
Install synchronized current interrupters in all DC power sources and all bonds that supply
current to the pipe5. Select a long ON cycle and a short OFF to preserve as much polarization
as possible. The length of the OFF cycle must be sufficient to allow to capture the instant
OFF value. When multiple current sources are being interrupted, the installation of a
stationary data logger is recommended to observe any loss of synchronization of the
interrupters. Stationary data loggers can also be used to identify and correct for transient (time
dependent) influences such as telluric earth currents and/or pipe depolarization over each
survey day due to current interruption.
5.4.3 Survey Spacing Interval
For coated pipelines, the survey measurement interval (distance between individual
measurements) required for a continuous evaluation of the pipeline is a function of the depth
of burial and the ratio of the resistivity of the coating to the resistivity of the electrolyte. For
land-based survey’s the spacing is typically 3-5 feet.
8 SP0207-2007 Perforating Close-Interval Potential Surveys and DC Surface Potential Gradient Surveys on Buried or Submerged Metallic Pipelines” NACE International, Texas
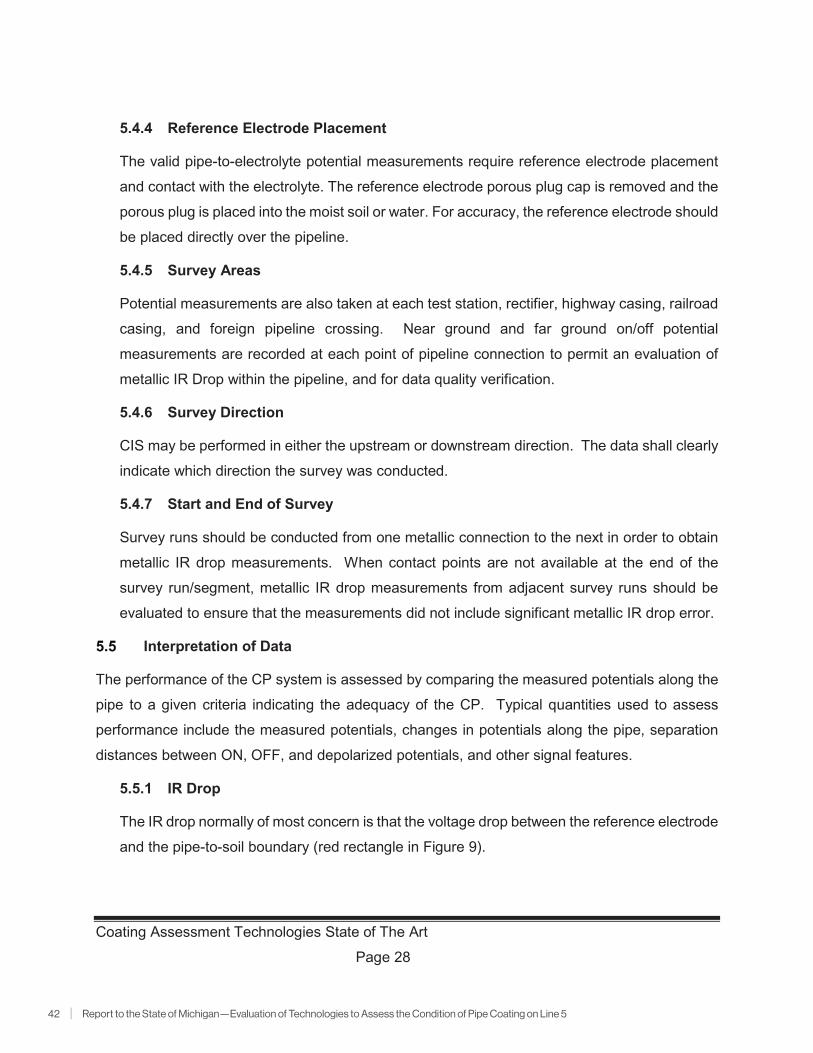
42 | Report to the State of Michigan—Evaluation of Technologies to Assess the Condition of Pipe Coating on Line 5
Coating Assessment Technologies State of The Art
Page 28
5.4.4 Reference Electrode Placement
The valid pipe-to-electrolyte potential measurements require reference electrode placement
and contact with the electrolyte. The reference electrode porous plug cap is removed and the
porous plug is placed into the moist soil or water. For accuracy, the reference electrode should
be placed directly over the pipeline.
5.4.5 Survey Areas
Potential measurements are also taken at each test station, rectifier, highway casing, railroad
casing, and foreign pipeline crossing. Near ground and far ground on/off potential
measurements are recorded at each point of pipeline connection to permit an evaluation of
metallic IR Drop within the pipeline, and for data quality verification.
5.4.6 Survey Direction
CIS may be performed in either the upstream or downstream direction. The data shall clearly
indicate which direction the survey was conducted.
5.4.7 Start and End of Survey
Survey runs should be conducted from one metallic connection to the next in order to obtain
metallic IR drop measurements. When contact points are not available at the end of the
survey run/segment, metallic IR drop measurements from adjacent survey runs should be
evaluated to ensure that the measurements did not include significant metallic IR drop error.
Interpretation of Data
The performance of the CP system is assessed by comparing the measured potentials along the
pipe to a given criteria indicating the adequacy of the CP. Typical quantities used to assess
performance include the measured potentials, changes in potentials along the pipe, separation
distances between ON, OFF, and depolarized potentials, and other signal features.
5.5.1 IR Drop
The IR drop normally of most concern is that the voltage drop between the reference electrode
and the pipe-to-soil boundary (red rectangle in Figure 9).

Appendix A: Mears Report | 43
Coating Assessment Technologies State of The Art
Page 29
The voltage drop errors, which are often referred to as ohmic potential drop or IR drop errors,
occur as a result of the flow of CP or stray current in the electrolyte (soil) or in the pipeline. IR
voltage drops are more prevalent in the vicinity of an anode bed or in areas where stray
currents are present and generally increase with increasing soil resistivity1.
Figure 10: Pipe-to-Soil Potential Measurements4
IR drop minimization during CIS may be achieved by:
• For bare or very poorly coated structures, IR voltage drops can be reduced by placing the
reference electrode as close as possible to the structure. For the majority of coated
structures, most of the IR voltage drop is across the coating, and the measurement is less
affected by reference electrode placement. IR drop may not be a significant concern when
electrolyte, current densities, depth of burial, and coating condition are consistent, and the
magnitude of the IR drop is known or considered to be negligible. On land based surveys,
in areas of coating damage, potentials often show depressions and convergence of the
On- and Off-potentials (reduction in IR drop).
• The most common method is the instant OFF potential method using synchronized current
interrupters installed at CP current sources. The IR voltage drop can be minimized or
eliminated by interrupting all of the direct current sources of the CP system and measuring
the instantaneous OFF potential.

44 | Report to the State of Michigan—Evaluation of Technologies to Assess the Condition of Pipe Coating on Line 5
Coating Assessment Technologies State of The Art
Page 30
5.5.2 Criteria for Cathodic Protection
The primary criteria for CP of underground or submerged steel and gray or ductile cast-iron
piping are listed in Section 6 of NACE Standard SP0169-2013 and other industry recognized
codes:
• A structure-to-electrolyte potential of –850 mV or more negative as measured with respect
to a saturated copper/copper sulfate (CSE) reference electrode. This potential may be
either a direct measurement of the polarized potential or a current-applied potential.
Interpretation of a current-applied measurement requires consideration of the significance
of voltage drops in the earth and metallic paths.
• A minimum of 100 mV of cathodic polarization. Either the formation or the decay of
polarization must be measured to satisfy this criterion. This criterion states that adequate
protection is achieved with “a minimum of 100 mV of cathodic polarization between the
structure surface and a stable reference electrode contacting the electrolyte”.
Only one of these criteria needs to be met. When two or more dissimilar metals are coupled,
the 100 mV polarization cannot be used, unless the potential of the most active (most
electronegative) metal is known.
Corrosion Control Surveys for Offshore Pipeline
Marine pipelines (in seawater) are typically provided with cathodic protection by bracelet anodes
of zinc or aluminum. Impressed current systems on platforms or onshore are also used, as well
as hybrid systems which employ a combination of the two techniques9.
The CP conditions can be verified by the potential measurements between the pipeline and the
reference electrode in close proximity, as in the case for underground pipelines. The potential
variations along the offshore pipeline protected by sacrificial bracelet anodes is illustrate in Figure
10. It should be noted that potential voltage gradients are expected to be minimized in high
conductivity seawater.
9C. Weldon and D. Kroon. Corrosion Control Survey Methods for Offshore Pipelines and Structures, Corrpro Technical Library, Medina, OH, www.corrpro.com
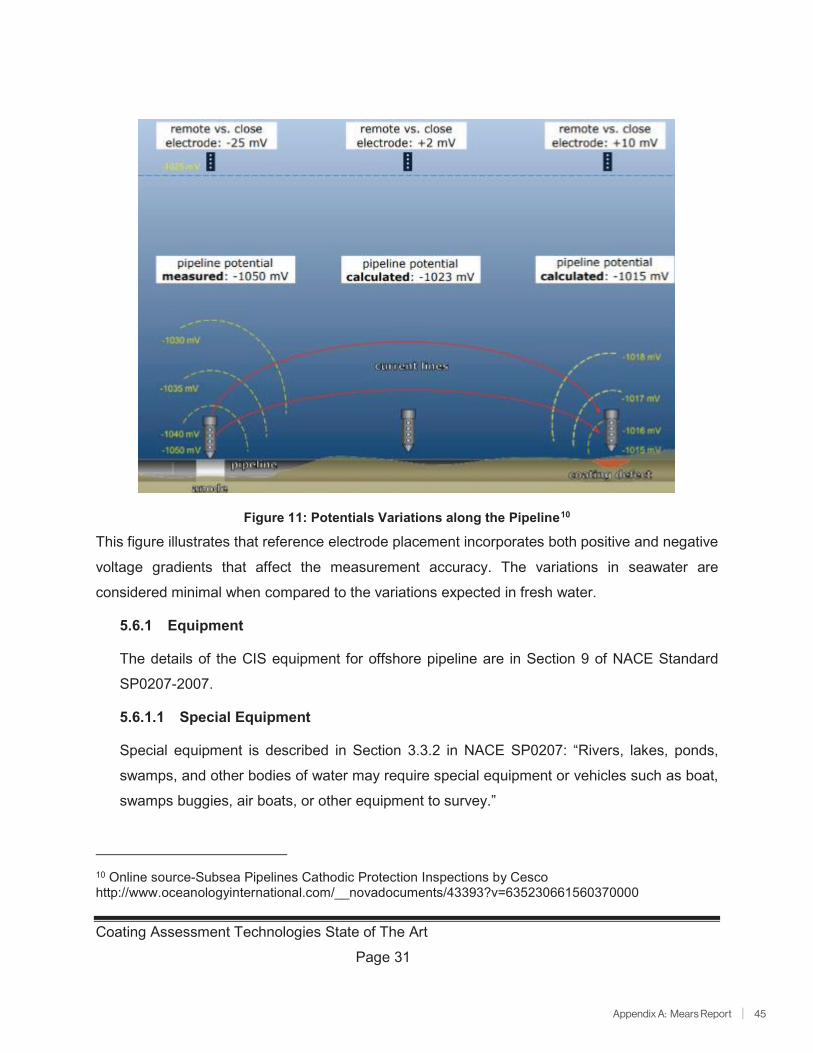
Appendix A: Mears Report | 45
Coating Assessment Technologies State of The Art
Page 31
Figure 11: Potentials Variations along the Pipeline10
This figure illustrates that reference electrode placement incorporates both positive and negative
voltage gradients that affect the measurement accuracy. The variations in seawater are
considered minimal when compared to the variations expected in fresh water.
5.6.1 Equipment
The details of the CIS equipment for offshore pipeline are in Section 9 of NACE Standard
SP0207-2007.
5.6.1.1 Special Equipment
Special equipment is described in Section 3.3.2 in NACE SP0207: “Rivers, lakes, ponds,
swamps, and other bodies of water may require special equipment or vehicles such as boat,
swamps buggies, air boats, or other equipment to survey.”
10 Online source-Subsea Pipelines Cathodic Protection Inspections by Cesco http://www.oceanologyinternational.com/__novadocuments/43393?v=635230661560370000
46 | Report to the State of Michigan—Evaluation of Technologies to Assess the Condition of Pipe Coating on Line 5
Coating Assessment Technologies State of The Art
Page 32
5.6.1.2 Pipeline Locator
In case of a survey performed offshore, specialized methods may be required for accurate
pipeline location. If the GPS coordinates of a pipeline are accurately known, then a
combination of on-boat GPS in conjunction with high resolution sonar can be used to ensure
the reference electrode (fish or ROV) is maintained close to the pipeline. Survey along
exposed pipe spans can be visually guided if the ROV has on-board video.
5.6.1.3 Reference Electrodes
In a marine or marsh areas with salt or brackish water, a silver-silver chloride (Ag/AgCl)
reference electrodes should be used. For fresh water surveys, copper/copper sulfate (CSE)
reference cells are typically used with appropriate provisions for deep submersion. All the
reference electrodes must be calibrated periodically with an uncontaminated reference
electrode to ensure accuracy according to the industry standard NACE TM0497.
5.6.1.4 Wire for Electrical Connections
Submerged wire during a survey must have adequate insulation for electrical isolation in
submersion service, and be robust enough to resist breakage due to water currents.
Reference electrode use in submersion service must utilize cable connections that are
waterproof to prevent erroneous measurements.
5.6.2 Subsea Survey
The “Guidelines for Subsea Pipeline Cathodic Protection Survey” documents the methodology
for ROV (remote operated underwater vehicle) pipeline CP surveys for offshore pipelines11.
The advantages and disadvantages of reference cell configurations are discussed in the
guideline. A Twin half-cell contact probe with remote cell has become a common industry
practice for ROV pipeline CP survey as shown in Figure 11. Equipment such as vessel,
11 Online source-Guidelines for Subsea Pipeline Cathodic Protection Surveyhttp://www.ises.tech/wp-content/uploads/2013/06/Guidelines-for-Subsea-Pipeline-Cathodic-Protection-Survey.pdf
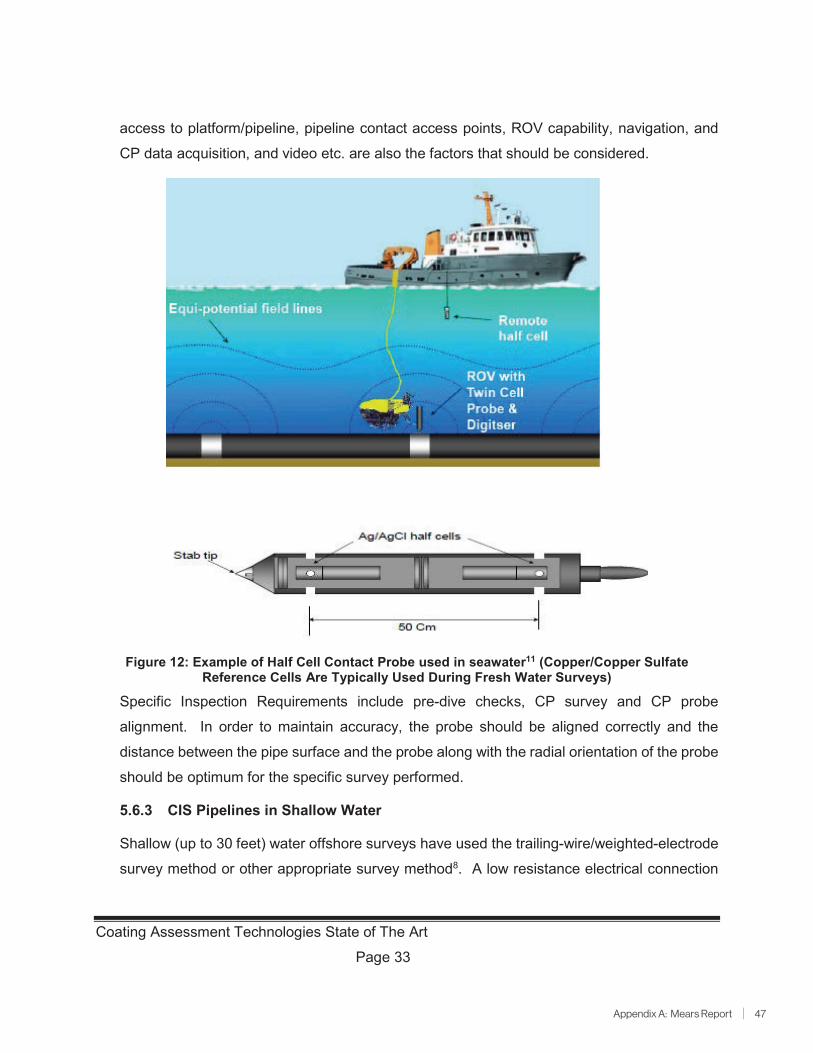
Appendix A: Mears Report | 47
Coating Assessment Technologies State of The Art
Page 33
access to platform/pipeline, pipeline contact access points, ROV capability, navigation, and
CP data acquisition, and video etc. are also the factors that should be considered.
Figure 12: Example of Half Cell Contact Probe used in seawater11 (Copper/Copper Sulfate Reference Cells Are Typically Used During Fresh Water Surveys)
Specific Inspection Requirements include pre-dive checks, CP survey and CP probe
alignment. In order to maintain accuracy, the probe should be aligned correctly and the
distance between the pipe surface and the probe along with the radial orientation of the probe
should be optimum for the specific survey performed.
5.6.3 CIS Pipelines in Shallow Water
Shallow (up to 30 feet) water offshore surveys have used the trailing-wire/weighted-electrode
survey method or other appropriate survey method8. A low resistance electrical connection

48 | Report to the State of Michigan—Evaluation of Technologies to Assess the Condition of Pipe Coating on Line 5
Coating Assessment Technologies State of The Art
Page 34
to the pipeline can be established with a clip-on connector or clamp that is mechanically
sound. A weighted reference electrode can be towed along directly over the pipeline while
spooling out a light gauge insulated wire from a survey vessel. Pipeline may be located using
a variety of methods including:
• Visual location, where practical,
• Electronic positioning in conjunction with the pipeline’s as-built coordinates, and
• Magnetometer pipe location using buoys at an offset to mark the pipeline.
In very shallow water (where ROV/tow fish survey equipment is unfeasible), divers may be
used to ‘swim’ the pipeline ROW.
5.6.4 CIS Pipelines in Deep Water Offshore
Deep water pipelines require additional provisions for executing a valid close interval survey.
Survey techniques are discussed below.
5.6.4.1 Trailing Wire Technique
Trailing wire technique is the same technique utilized for onshore pipeline close interval
surveys (CIS). A spool of insulated wire is connected to a test station, and pipe to electrolyte
potentials are continuously measured and recorded using a portable data logging system.
The trailing wire technique for offshore pipeline was developed by HARCO Corporation in the
1970’s utilizing the towed fish method. The trailing wire was connected to a riser at a platform,
and a towed “fish” was used as half-cell, as shown in Figure 12. Remote operated vehicle
(ROV) assisted trailing wire surveys were first performed in 1983, where the ROV was utilized
to replace the towed fish half-cell as shown in Figure 12. The technique has been utilized in
the US in both State, Federal Waters and overseas12.
12 Online Source, Underwater Cathodic Protection Surveys - Facts and Fiction. http://www.mpmi.com/services/cathodic-protection-services/underwater-cathodic-protection-surveys-facts-and-fiction/

Appendix A: Mears Report | 49
Coating Assessment Technologies State of The Art
Page 35
Figure 13: Trailing Wire Technique for Offshore Pipeline CIS Survey13
Three types of trailing wire technique will be discussed in the following sections:
Towed Fish Trailing Wire Survey: The objective of a towed fish trailing wire survey is to
determine the general level of cathodic protection on a submarine pipeline. A towed fish
survey can identify general areas of low CP, electrical interference from foreign CP systems,
and other major anomalies such as shorted casings. Towed fish survey is not suitable for
identifying small discrete coating defects, individual bracelet anodes (in seawater) or other
localized anomalies due to lack of precision in guiding the reference electrode.11 As a general
rule, sensitivity of the survey to detecting localized potential variations decreases the further
the CP electrodes (on the fish) are from the pipeline. A key component to an accurate survey
then, is the ability to keep the fish near to the pipeline, and as such the pipeline’s as-built x-y
coordinates and tow fish / pipeline elevation must be utilized in conducting the survey. Some
tow fish systems incorporate a depth transducer, surface and subsurface navigation, and a
vessel-mounted fathometer/sonar to accurately locate the fish in relation to the seafloor and
a pipeline’s as-built route12. Figure 13 shows a pipe-to-electrolyte (P/E) potential profile with
13 J. Grapiglia. Cathodic Protection (CP) Surveys for Subsea Assets. Corrosion Control Engineering

50 | Report to the State of Michigan—Evaluation of Technologies to Assess the Condition of Pipe Coating on Line 5
Coating Assessment Technologies State of The Art
Page 36
depressions in potentials in the middle either due to coating damage or anode depletion.
Further analysis would be needed in order to identify the cause14.
Figure 14: Pipe to Electrolyte Potential Profile-Towed Fish Trailing Wire Survey14
The advantages of the towed fish trailing wire technique is the relatively low cost, when
compared to a submersible or diver assisted survey. Additionally, this is the only technique
which can be used economically on buried pipelines and under other conditions where visual
or magnetic tracking with a diver or ROV is difficult to impossible. The disadvantage is lack
of sensitivity to minor anomalies such as individual anode bracelets, small coating defects,
and poorly insulated field joints14.
Submersible Trailing Wire Survey This technique uses the same principle as the towed
vehicle survey, but a guided submersible/ROV is used to carry the reference electrode along
the pipeline. Under normal circumstances, the reference electrode position can be maintained
within a meter of the pipeline at all times. The technique permits detection of individual
features such as bracelet anodes and coating holidays that cannot be detected using towed
fish trailing method14. For example, the presence of functioning bracelet anodes and two
poorly coated field joints are shown in Figure 14.
14 C. Weldon and D. Kroon. Corrosion Control Survey Methods for Offshore Pipelines and Structures, Corrpro Technical Library, Medina, OH, www.corrpro.com

Appendix A: Mears Report | 51
Coating Assessment Technologies State of The Art
Page 37
Figure 15: P/E Potential Profile-Submersible Assisted Survey14
The advantage of this technique is the increased sensitivity to minor changes in potential,
providing the locations of problem areas. This survey has often been performed in conjunction
with the electric field gradient (EFG) measurements (discussed later), and most of the surveys
are performed in conjunction with other work requiring an ROV. This technique was developed
to aid in pinpointing deficiencies in CP performance related to failed bracelet anodes or
coating defects that impacted CP effectiveness.
ROV Assisted Trailing-Wire Method: The ROV assisted trailing wire survey is the most
widely used method for monitoring CP levels along offshore and submerged pipelines. Deep
water offshore surveys are performed using an ROV to replace the towed fish and connected
to a survey vessel through an umbilical.
Offshore, a riser is typically used to obtain direct electrical connection to the pipeline. Two
reference electrodes mounted on an ROV are carried above the pipeline while the connection
to the pipeline is maintained by spooling out a light gauge insulated wire from a wire supply
apparatus aboard the survey support vessel. The structure-to-electrolyte and the two
reference electrodes are mounted on the ROV. Electrode configuration may vary depending
on the pipeline accessibility, pipeline diameter, and operating condition. One reference
electrode should be mounted on the ROV and located approximately 6 to 12 inches above

52 | Report to the State of Michigan—Evaluation of Technologies to Assess the Condition of Pipe Coating on Line 5
Coating Assessment Technologies State of The Art
Page 38
the pipeline. The second electrode is mounted approximately 24 inches away from the first
electrode. The wire should be attached to a weighted calibrated reference electrode that is
lowered to the sea floor near the pipeline. The location of the electrode is not critical because
it serves simply as a fixed voltage source.
Potential measurements should be continuously recorded onboard the surface vessel. The
pipe-to-electrolyte potential should be measured using the electrode placed closest to the
pipeline.
5.6.4.2 Remote Electrode Technique
ROV Assisted Remote Electrode Method This method may only be used on unburied or
partially buried pipelines in water depths in excess of 100 feet, and not where the pipeline is
adjacent to the onshore riser. The survey utilizes a remote electrode as a stable voltage
source instead of a connection to the riser or as a stationary electrode. An electrode is defined
as remote when the distance between the electrode and the pipeline being surveyed is such
that a change of electrode position does not change the measured potential between the
electrode and the pipeline. On a typical coated subsea pipeline cathodically protected by
sacrificial bracelet anodes, an electrode is considered remote at a distance of 100 feet or
more8.
At the start of a remote electrode survey, a direct contact pipe-to-electrolyte potential should
be measured between the remote electrode and the pipe using a metallic contact probe
aboard the ROV. The survey should proceed by continuously measuring the potential
between the remote electrode and an electrode mounted on the ROV. Direct contact potential
measurements should be taken at approximately 1-mile intervals to recalibrate the remote
electrode and adjust the offset voltage accordingly. Figure 15 illustrates the scheme of ROV
assisted remoted-electrode method. The ROV survey can provide high resolution and low-
resolution systems. Low resolution systems give only potential profiles. High resolution
systems measure accurate potential profiles and current density of the pipeline. A typical
graph displayed by the high resolution system is shown in Figure 1613.
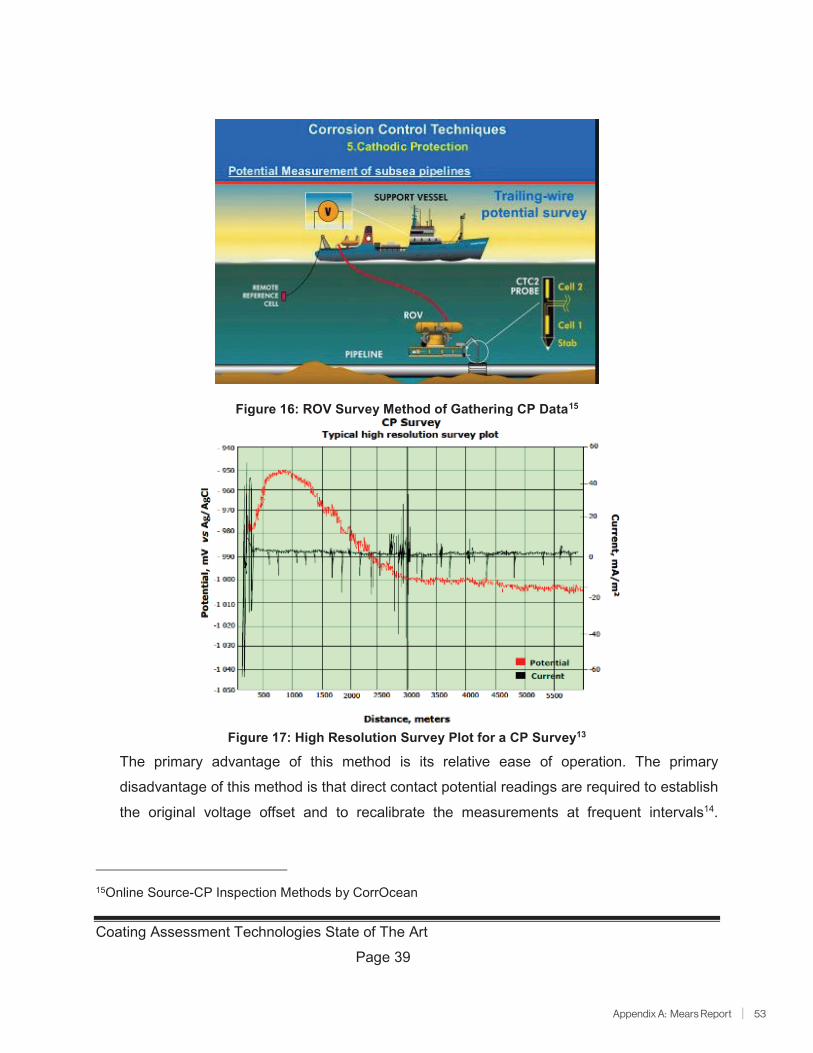
Appendix A: Mears Report | 53
Coating Assessment Technologies State of The Art
Page 39
Figure 16: ROV Survey Method of Gathering CP Data15
Figure 17: High Resolution Survey Plot for a CP Survey13
The primary advantage of this method is its relative ease of operation. The primary
disadvantage of this method is that direct contact potential readings are required to establish
the original voltage offset and to recalibrate the measurements at frequent intervals14.
15Online Source-CP Inspection Methods by CorrOcean
54 | Report to the State of Michigan—Evaluation of Technologies to Assess the Condition of Pipe Coating on Line 5
Coating Assessment Technologies State of The Art
Page 40
Additionally, the remote cell is moving and is subject to some potential drift or variation over
time.
CIS Limitations
Certain conditions may make CIS survey impractical to perform, or the data from the CIS
survey difficult to interpret correctly8.
• Areas of high contact resistance: pipeline located under concrete or asphalt pavement,
pipeline under frozen ground, or very dry conditions.
• Adjacent buried or submerged metallic pipelines within 50 feet.
• Surface conditions limiting access to the electrolyte.
• Telluric or other dynamic stray current interference that are not compensated through
specific survey procedures and data analysis.
• High levels of induced alternating current (AC) that could influence potential
measurements or present a safety hazard,
• Pipelines that are buried very deep where it is impossible to place the roving electrode
within 10-20 feet for the onshore pipeline.
• Locations at which coating cause electrical shielding, and
• Lack of electrical continuity such as some forms of mechanically coupled pipe that have
not been made electrically continuous through the use of bonding cables or straps welded
across each coupling.
CIS is typically used to determine CP levels, shorts or to other structures, stray current issues,
and medium to large coating defects (isolated or continuous and typically >600 mm2 [1 in2])5.
CIS is limited in detecting small coating holidays5.
Applicability to Subsea or Submerged Pipelines
The CIS survey has been successfully used throughout the world to assess CP levels on subsea
and submerged pipelines and is deemed to be the most reliable indirect inspection tool for this

Appendix A: Mears Report | 55
Coating Assessment Technologies State of The Art
Page 41
application. NACE SP0207-2007 indicates that CIS can locate medium-to-large defects in
coatings (isolated or continuous and typically >600 mm2 [1 in2]).
6.0 DIRECT CURRENT VOLTAGE GRADIENT SURVEYS (DCVG)
Direct Current Voltage Gradient (DCVG) surveys have been in use for over 40 years for onshore
pipelines, and primarily are used to locate coating defects or holidays. A DCVG survey is a
method of measuring the change in electrical voltage gradient in the soil along and around a
pipeline16. During the pipeline CP normal operating situation, the voltage gradients are a result
of CP current pickup or discharge at indications as shown in Figure 17.
Figure 18: Voltage Gradient in the Earth Around A Catholically Protected Bare Pipeline [NACE Class CP3]
DCVG surveys are capable of distinguishing between isolated and continuous coating damage,
due to the fact that the shape of the gradient field surrounding a fault provides this information.
DCVG can also be used to identify isolated coating damage, such as rock damage, or continuous
coating damage.
16 P. Nicholson, Combined CIPS and DCVG Surveys for Improved Data Correlation, NACE Paper No. 07181, 2007.
56 | Report to the State of Michigan—Evaluation of Technologies to Assess the Condition of Pipe Coating on Line 5
Coating Assessment Technologies State of The Art
Page 42
In a DCVG survey, the existing pipeline or a temporary CP system is interrupted to produce a
pulsed CP current applied to the pipeline. The DCVG signal magnitude maybe raised by
increasing the DC output of a CP current source or by installing a temporary DC supply and
connecting it to the pipeline. No direct continuous electrical connection to the pipeline in the
DCVG technique when used to locate coating faults.
Equipment
The DCVG survey equipment consists of a current interrupter, voltmeter, connection cables, and
two probe electrodes filled with electrolyte17. The details of the equipment are described in the
NACE standard TM 0109-2009, “Standard Practice for Aboveground Survey Techniques for the
Evaluation of Underground Pipeline Coating Condition-Item No. 21254.DCVG Procedure
DCVG Procedure
DCVG Survey Procedure as defined by in NACE TM0109-2009. Below sections are summarizing
the DCVG Procedure from this standard.
DCVG surveys may be performed with foreign impressed current CP systems energized. A
current interrupter shall be installed in the CP system or temporary CP current supply to be
interrupted. The DCVG signal strength should be adequate to enable the surveyor to detect small
indications distant from the CP current source.
Two probes are placed directly above the pipeline centerline, with one probe in front of the other
in contact with the soil. The probes are separated by approximately 3 to 4 ft apart.
Every third step (~10 Feet), one probe should be placed at 90 degrees to the survey direction
while the other probe is placed where the surveyor is located to ensure the survey is being
conducted on top of the pipeline, as shown in Figure 18. The voltage gradient readings measured
with the electrodes place at the 90 degree locations are conducted at both sides of the survey
direction.
17 TM0109-2009 Aboveground Survey Techniques for the Evaluation of Underground Pipeline Coating Condition-Item No. 21254, NACE International, Taxes.

Appendix A: Mears Report | 57
Coating Assessment Technologies State of The Art
Page 43
Figure 19: Coating Holiday Detection Using Voltage Gradient Method [NACE Class CP3]
The direction and the magnitude of the voltmeter illustrate the location and the shape of the
indication. As the indication is approached, the magnitude increased and reverses direction when
the indication is passed. No pulse (a null) is observed when the indication epicenter lies midway
between the two probes. With one probes placed at the indication, and one placed approximately
4 feet away, the DCVG pulse magnitudes are measured at the four locations (two along the
pipeline centerline, and two 90 degree on the sides), and used to determine the shape of the
indication.
Interpretation of Data
The DCVG Signal Strength at Indication are calculated based on the guidance in NACE Standard
TM0109-2009.
The size of the holiday is measured in terms of percentage IR (%IR), which is defined as the ratio
between the lateral gradient shift measured with respect to remote earth and the pipe-to-soil shift

58 | Report to the State of Michigan—Evaluation of Technologies to Assess the Condition of Pipe Coating on Line 5
Coating Assessment Technologies State of The Art
Page 44
measured with respect to remote earth. The shift represents the difference between the ON and
OFF values, when DC source(s) is/are interrupted18.
Figure 20: Voltage Gradient (NACE Class CP2)
Limitations
The interpretation of DCVG data involves comparison of potential gradient shift magnitudes at
coating flaw indications. The magnitude of this voltage gradient is influenced by several factors,
including the magnitude of the current source, the distance from the current source, soil
moisture/resistivity, pipeline depth of cover, and relative position of other flaw indications.
6.4.1 Depth of Cover
According to NACE standard TM0109, “The indirect inspection tools covered in this standard
are less sensitive when pipeline burials exceeded normal depth ranges (2-6 feet). Field
conditions and terrain may affect depth and detection sensitivity”. The magnitude of a defect,
which is indicated by the DCVG on the measuring tool, will diminished as the depth of cover
increases. This magnitude will also be used to illustrate the size of the defect. Therefore, the
size information from DCVG will not be accurate. The approach to solve this problem is to
18 Assessing the Integrity of Coating Systems on Pipelines in Trenchless Crossings, PRCI Catalog No.PR-444-133602-R01, 2015.

Appendix A: Mears Report | 59
Coating Assessment Technologies State of The Art
Page 45
employ voltage gradient probes with adjustable spacing. The probes are in contact with
positions of larger differential gradients on the soil that is measurable, and then normalizing
the same probe spacing used for other locations to ensure consistency21.
6.4.2 Interference
Another limitation on the interpretation of DCVG data is that the presence of some flaws may
be masked by the presence of other flaws, either larger flaws in close proximity or flaws that
are nearer to the source of test current. The basic approach to DCVG attempts to utilize
cathodic protection current as the test current.
6.4.3 Signal Strength
Sometimes it is necessary to increase source outputs and/or use supplemental current
sources to provide sufficient signal strength. Because the locations for test current sources
are limited and the distribution patterns of the test current are not known in advance, it is not
always possible to detect all coating flaws.
6.4.4 Applicability to Subsea or Submerged Pipelines
The vast majority of DCVG surveys have been performed on land based buried pipelines. The
instrumentation and techniques have not been adapted for deep submerged pipelines making
such surveys unfeasible at this time. Use of this technique on the Line 5 assets would require
significant development and testing prior to deployment.
Integrated CIS/DCVG Survey
This method also called “intensive measurement survey,” according to German Standard DIN 50
925 has been successfully applied in numerous projects18.
The same principles governing the independent Close Interval Potential Survey (CIPS) and
DCVG techniques apply to this method. In an integrated CIPS/DCVG survey, the two surveys
are conducted simultaneously, and the data are recorded either on two back-to-back data loggers,
as shown in Figure 20 or more recently on two-channel data loggers.

60 | Report to the State of Michigan—Evaluation of Technologies to Assess the Condition of Pipe Coating on Line 5
Coating Assessment Technologies State of The Art
Page 46
Figure 21: Integrated CIPS/DCVG Arrangement 19
CIS appears to be the only reasonable tool for estimating the cathodic protection level of the pipe
and subsequently the risk of corrosion activity. The DCVG survey has been successfully used to
detect, locate and estimate the size of coating holidays in almost every area on onshore pipelines,
except where limited by high contact resistance or significant dynamic stray current activity.
In many applications, these two complimentary indirect tools are used independently, with the
CIS followed by a fast-paced DCVG survey, often using different instrumentation. The main
problem in this approach is aligning the indications from the two surveys, although flagging the
19 S.M. Segall, R.G. Reid, R.A. Gummow, Use of an Integrated CIPS/DCVG Survey in the ECDA Process, Corrosion, Paper No. 10061, NACE, 2010.

Appendix A: Mears Report | 61
Coating Assessment Technologies State of The Art
Page 47
suspect coating fault locations and using sub-meter GPS co-ordinates can minimize or even
eliminate this problem. A second disadvantage of separate surveys is the possibility of errors
when calculating the percentage IR to classify the severity of the holiday. Since the pipe-to-soil
potentials are not measured during the DCVG survey, they are typically interpolated from potential
measurement records at adjacent test posts. When the soil resistivity varies significantly, the error
introduced by this interpolation becomes appreciable.
The main advantages of this approach for onshore pipelines are the ease with which the survey
data is aligned and the instant access of the operator to two different sets of data that facilitates
the identification of an indication (i.e. coating holiday or protection level). Developments in
instrumentation, such as multi-channel data loggers give the integrated method additional
technical facility. Identification of indications based on potentials and gradient profile is shown in
Figure 21.This survey is not considered feasible for the Line 5 crossings of the Straits.
Figure 22: 16” Pipeline Identification of Indication Based on Potential and Gradient Profile19

62 | Report to the State of Michigan—Evaluation of Technologies to Assess the Condition of Pipe Coating on Line 5
Coating Assessment Technologies State of The Art
Page 48
7.0 ALTERNATING CURRENT VOLTAGE GRADIENT (ACVG)
Description
ACVG can be utilized to identify several types of problems on underground pipelines with the
most common use being to identify indications of coating anomalies utilizing a unique AC
frequency as its signal source. One type of ACVG came into use for pipeline in the USA in the
late 1990’s although the technique was utilized in other underground infrastructure types such as
electric, telephone and cable well before this. ACVG became a mainstream tool for identifying
indications of coating defects after the passage of the Pipeline Safety Improvement Act of 2002
and publication of the External Corrosion Direct Assessment Standard SP0502 by the NACE
International. ACVG is known for pinpointing indications, ease of use and providing a relative
severity of the indications where “corrosion activity has occurred, is occurring, or may occur.”
ACVG is recognized by NACE TM0109-2009 standard as “used to evaluate in detail the coating
condition on buried pipelines and identify and classify coating holidays”.
Application of ACVG
The technique is performed from above ground at grade over the pipeline. A transmitter with
unique signal is connected to a nearby test station to produce the signal needed to perform the
survey (see Figure 22). A digital receiver connected to an A-frame device (see Figure 23 and
Figure 24) with two fixed distance probes is utilized to pinpoint indications of possible underground
coating damage. The A-frame device is in contact with the surface (i.e. soil, pavement, concrete)
and looks at the difference in the electrical field in the ground and measures minute voltage
differences and pinpoints an indication of a coating defect (see Figure 32). The ACVG indications
are categorized by their value which is in decibel microvolts (dBµV) (see Figure 26). This dBµV
at the indication is then compared to the amount of current flow at the indication in milliamperes
and adjusted so as to account for the different amounts of current flow at each indication and its
effect on the dBµV indication level (see Figure 33). The magnitude of the signal strength is related
to the level of coating damage. However, many factors will affect the dBµV level including but not
limited to resistivity, depth of the pipeline, amount of transmitted signal, pipe diameter, coating
type, clock position of the indication (i.e. 12 o’clock versus 6 o’clock), pipeline length, number of

Appendix A: Mears Report | 63
Coating Assessment Technologies State of The Art
Page 49
indications in the area and A-frame contact to the surface. The same pipeline with the same
general conditions will produce ACVG indications that may be compared to each other.
Figure 23: Example of Transmitter Connection for ACVG20
20 Radiotection Pipeline Current Mapper User’s Manual.

64 | Report to the State of Michigan—Evaluation of Technologies to Assess the Condition of Pipe Coating on Line 5
Coating Assessment Technologies State of The Art
Page 50
Figure 24: Picture of A Display from An ACVG Receiver
Figure 25: Picture of a Typical A-frame Utilized for ACVG20

Appendix A: Mears Report | 65
Coating Assessment Technologies State of The Art
Page 51
Figure 26: Pinpointing the Indication with Four Arrows Pointing to the Same Location20
1 Locate Icon2 Graph3 Coating Defect Indication Direction4 Coating Defect Indication Signal
Figure 27: A-frame Digital Display with Locate and ACVG Signals Being Displayed Together20

66 | Report to the State of Michigan—Evaluation of Technologies to Assess the Condition of Pipe Coating on Line 5
Coating Assessment Technologies State of The Art
Page 52
Figure 28: dB Microvolt Levels Will Rise When Approaching the indication and Current at the Indication Will Affect the dB Microvolt Value20
Limitations
As other indirect inspection techniques used for coating condition assessments, the uncertainty
generally results from the complexity of some underground pipeline and environment conditions,
making it difficult to adopt a unifying standard under all conditions21.
7.3.1 Shielding Coatings
The ACVG method is not applicable for detecting pipeline steel that is electrically shielded
from the electrolyte bulk by disbonded coatings with no electrically continuous path to the
electrolyte.
7.3.2 Pipe Depth of Cover.
All of the indirect inspection tools are less sensitive when pipe burials exceed normal depth
ranges. Field conditions and terrain may affect depth and detection sensitivities.
21 C, Ukiwe and S. McDonnell. Optimization of the Coating Anomaly Detection and Priortization Methodology Using voltage Gradient Surveys. Corrosion, Paper No. 11132, NACE, 2011
Appendix A: Mears Report | 67
Coating Assessment Technologies State of The Art
Page 53
7.3.3 High resistant ground conditions
In some cases holes may have to be drilled if applying water on the pavement is not sufficient
for good electrical contact with the probes. If the pipe is no more than 5 feet away from soil
contact, it may be possible to conduct the survey offset and parallel to the pipeline.
7.3.4 Rocky Terrain
When in rocky terrain it may be necessary to wet the ground in order to obtain good electrical
contact with the probes. If the pipe is no more than 5 feet away from an area where concrete
or soil contact can be made, it may be possible to conduct the survey offset and parallel to
the pipeline.
7.3.5 Very Dry Soil
When in very dry soil conditions it may be necessary to wet the ground in order to obtain good
electrical contact with the probes.
If the pipe is no more than 5 feet away from an area where concrete or better soil contact can
be made, it may be possible to conduct the survey offset and parallel to the pipeline.
7.3.6 Probe Spacing
The measured voltage gradient increase with probe spacing till the remote earth is reached,
as shown in Figure 28. Therefore, the probe spacing should be maintained consistently during
the survey21.

68 | Report to the State of Michigan—Evaluation of Technologies to Assess the Condition of Pipe Coating on Line 5
Coating Assessment Technologies State of The Art
Page 54
Figure 29: The Effect of Probe Spacing on the ACVG
Coating Assessment
An ACVG indication is measured and viewed in decibel microvolts (dBµV). The dBµV is normally
on a scale from 0 to 100 dBµV although it is rare to find any indications less than 25 dBµVNot all
manufacturers have the exact same dBµV scale although the two top producers of tools are
similar. The indication viewed in dBµV is affected by the amount of current applied to the pipe
and flowing across the coating holiday indication. More current flow across an indication would
produce more voltage change and therefore a different dBµV value. The amount of change in
the dBµV at an indication will change by approximately 6 dBµV for when the current is doubled
(or halved). This would mean that an ACVG indication of 60 dBµV when 0.500 Amperes of 4Hz
current is flowing across the coating holiday is equal to a 66 dBµV indication when 1 Amperes of
4Hz current is flowing across the coating holiday. Therefore it is vital to perform some sort of post
process analysis to “normalize” the dBµV according to the amount of current flow at each
indication. The actual mathematical formula for this calculation to provide a dBµV with 1 Ampere
flowing on the pipeline at the ACVG indication is as follows:

Appendix A: Mears Report | 69
Coating Assessment Technologies State of The Art
Page 55
a = b-(20*LOG(c))
Where:
a = normalized/calculated dBµV (the result)
b = dBµV as found in the field with the instrument
c = Amperes of current flowing across the holiday (3Hz or 4Hz normally)
Or to normalize to 0.1 Ampere the formula would be: a = b-(20*LOG(c/.1))
Applicability to Subsea or Submerged Pipelines
ACVG survey equipment has not been used on deep subsea or underwater pipelines. The
instrumentation and techniques have not been adapted for deep submerged pipelines making
such surveys unfeasible at this time. Use of this technique on the Line 5 assets would require
significant development and testing prior to deployment.

70 | Report to the State of Michigan—Evaluation of Technologies to Assess the Condition of Pipe Coating on Line 5
Coating Assessment Technologies State of The Art
Page 56
8.0 AC ATTENUATION
Description
A Current Attenuation survey (also known as an Electromagnetic Survey or Alternating Current
Attenuation) is used to determine the relative coating condition of a buried pipeline. The pipeline
coating condition of a buried pipeline can be assessed by measuring the current attenuation of
an applied AC or interrupted DC signal. Readings are normally taken at 50 or 100 foot intervals
although larger distances between readings may be utilized. The more current that attenuates
between the readings, the greater the coating degradation. It is generally accepted as a lower
resolution tool in that it finds the larger types of coating problems (severe coating deterioration or
damage) or unintended contacts and bonds on a pipeline. The instrument can also provide an
estimated depth of the pipeline.
The information needed for the survey is detected from the electromagnetic field created when a
specific frequency flows along a pipeline. The amount of current flowing in the area being
surveyed will affect the size of the magnetic field and therefore how strong the signal will be.
Various soils, water and ground cover will not affect the electromagnetic field and therefore no
direct contact to the electrolyte is necessary for the receiver to obtain the information in a Current
Attenuation survey.
Application of AC Attenuation
A transmitter with unique frequencies is connected to the pipeline by connecting the output lead
to the pipeline at an above ground appurtenance or test station and the return lead to an
independent ground away from the area to be surveyed. The current output is adjusted to the
needed level usually 1, 2, or 3 Amperes to insure adequate coverage to the next test station or
pipeline access point.
The horizontal position of the pipeline is determined by moving the receiver blade over the pipeline
and perpendicular to the position of the pipeline. In the peak locate mode when you reach the
highest signal strength you should be over the center of the pipeline. Depth measurement
function is performed by setting the receiver on the ground over the pipeline and pressing the
depth button. The information will be viewed on the screen in inches up to 35 inches and feet
and inches for depths 3 feet and greater. After accurate location and depth measurements have

Appendix A: Mears Report | 71
Coating Assessment Technologies State of The Art
Page 57
been taken, the current measurement button is utilized to obtain the current values on the pipeline.
The current measurement will be recorded and takes approximately 4 seconds to obtain each
measurement, during which time the instruments location and orientation must be maintained
(stable). The current direction is also obtained during this process.
The information is recorded into the data logger along with the flag number, GPS coordinates,
and depth. A sub-meter GPS data logger is utilized for recording pipeline survey information
when conducting a CA survey.
Limitations
The Current Attenuation method is not applicable for detecting pipeline steel that is electrically
shielded from the electrolyte by disbonded coatings with no electrically continuous path to the
electrolyte. All indirect inspection tools are less sensitive when pipe burials exceed very deep
ranges. Field conditions and terrain may affect depth and detection sensitivities.
If normal fluctuations of more than 10% are obtained at the same location, there may be
interference that must be mitigated to obtain an accurate current attenuation survey.
Bonds to close parallel structures may cause fluctuations in the measurements. If there are
fluctuations over 10% at normal intervals, an effort should be made to disconnect any bonds
before continuing the survey.
Other sources of electrical interference in large amounts may affect the accuracy of the
measurements. Removing interrupters or conducting the survey at a time when the DC
interference is less may be necessary to achieve accurate results.
Coating Assessment
Once a transmitter has been connected and a sufficient amount of current is traveling down the
pipeline, the receiver will detect the magnetic field and be able to obtain location, depth, current
and current direction readings. How the current attenuates will signify if there is little or no damage
to the coating or if there are larger areas of concern about the coating. Typical findings of a
current attenuation tool include:
• Shorts to other structures,• Grounding to electric neutral,
72 | Report to the State of Michigan—Evaluation of Technologies to Assess the Condition of Pipe Coating on Line 5
Coating Assessment Technologies State of The Art
Page 58
• Faulty insulators,• Large coating defects,• Shorted casings, and• Other current distribution problems.
Figure 29 illustrates the typical examples of the types of analysis from current attenuation surveys.
Applicability to Subsea or Submerged Pipelines
Underwater locators/receivers are available to conduct a current attenuation survey on subsea or
submerged pipelines. Since this technique represents a low resolution assessment of coating
quality, it may not provide additional benefit to the existing tools being utilized to assess the Line
5 crossing. Further assessment and development of the tool would be required for application to
the Straits.
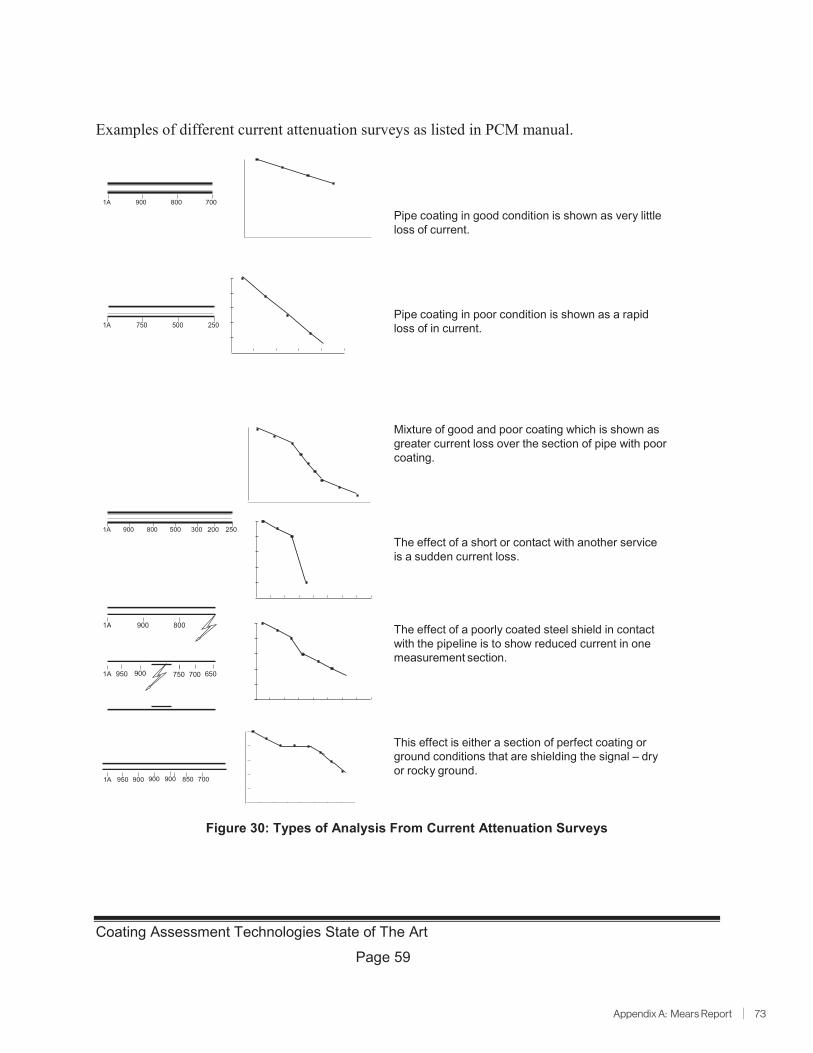
Appendix A: Mears Report | 73
Coating Assessment Technologies State of The Art
Page 59
Figure 30: Types of Analysis From Current Attenuation Surveys
Examples of different current attenuation surveys as listed in PCM manual.
1A 900 800 700
1A 750 500 250
Pipe coating in good condition is shown as very littleloss of current.
Pipe coating in poor condition is shown as a rapidloss of in current.
Mixture of good and poor coating which is shown asgreater current loss over the section of pipe with poorcoating.
The effect of a short or contact with another serviceis a sudden current loss.
The effect of a poorly coated steel shield in contactwith the pipeline is to show reduced current in onemeasurement section.
1A 950 900 900 900 850 700
This effect is either a section of perfect coating orground conditions that are shielding the signal – dryor rocky ground.
1A 900 800 500 300 200 250
1A 900 800
1A 950 900 750 700 650
74 | Report to the State of Michigan—Evaluation of Technologies to Assess the Condition of Pipe Coating on Line 5
Coating Assessment Technologies State of The Art
Page 60
9.0 ELECTRO-MAGNETIC ACOUSTIC TRANSDUCER (EMAT)
Description of EMAT
The EMAT inline inspection technology can be used to locate pipeline defects, both internally and
externally in the pipeline carrying oil, water, or gas at normal system conditions. While normally
deployed to inspect buried pipelines, EMAT tool can also inspect pipelines on pipe supports or
lying on the ground, and can identify corrosion, erosion, cracking and other defects22.
The application of the traditional piezoelectric transducers has been used for wall thickness
measurements and crack detection for inline inspection. It requires a liquid couplant for ultrasonic
energy and signal transfer into the pipe wall. This requirement for a liquid couplant limits the cost-
effective use of such tools for gas filled pipelines. Electro Magnetic Acoustic Transducers (EMAT)
are dry-coupled sensors23.
EMAT Principle
As illustrated in Figure 30, an alternating current in a wire induces an eddy current in the metal
surface and transmits it into the pipe wall. This eddy current is combined with a static magnetic
field to produce a force, which causes the steel metal grid to oscillate, thus generating a guided
ultrasonic sound wave in the pipe wall24.
Guided waves can be categorized into Lamb waves and tailored horizontal polarized shear waves
of different order. In general, the horizontal shear wave, characterized by distinct frequencies,
has an especially high energy concentration at the surfaces of the wall and hence are sensitive
for possible cracks or slots inside the sound beam25.
22G. Peck, Cost Effective On-Stream Inspection Technique Using EMAT Technology for Pipeline Integrity at ELK Hills, Paper No. 01635, NACE 2001.23 M. Klann et al. Pipeline Inspection with The High Resolution EMAT ILI–Tool: Report on Field Experience, IPC2006-10156, International Pipeline Conference, September 25-29, 2006, Calgary, Alberta, Canada24 S. Shrestha, In-Lin Inspection EMAT Utilizing an Oblique Field, Corrosion, Paper No.2012-0001318, NACE 2012.25 T. Bueker et al. Review of Advanced In-Line Inspection Solutions for Gas Pipelines. November 17th, 2010.
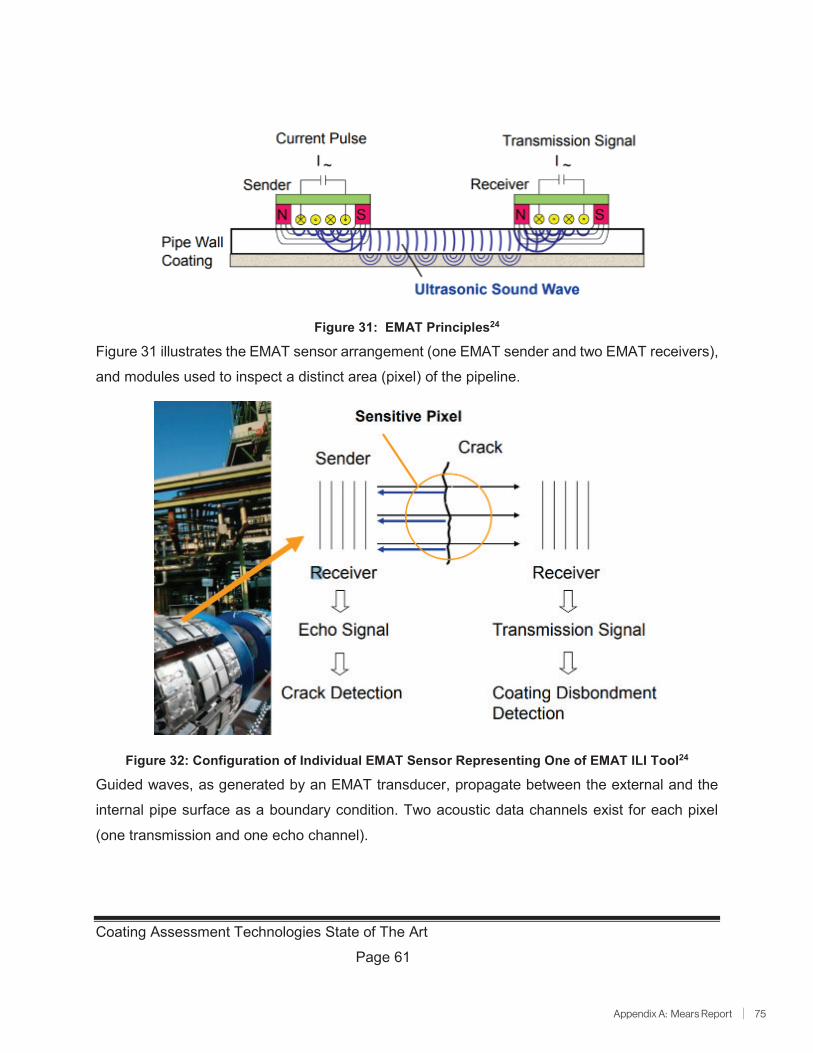
Appendix A: Mears Report | 75
Coating Assessment Technologies State of The Art
Page 61
Figure 31: EMAT Principles24
Figure 31 illustrates the EMAT sensor arrangement (one EMAT sender and two EMAT receivers),
and modules used to inspect a distinct area (pixel) of the pipeline.
Figure 32: Configuration of Individual EMAT Sensor Representing One of EMAT ILI Tool24
Guided waves, as generated by an EMAT transducer, propagate between the external and the
internal pipe surface as a boundary condition. Two acoustic data channels exist for each pixel
(one transmission and one echo channel).
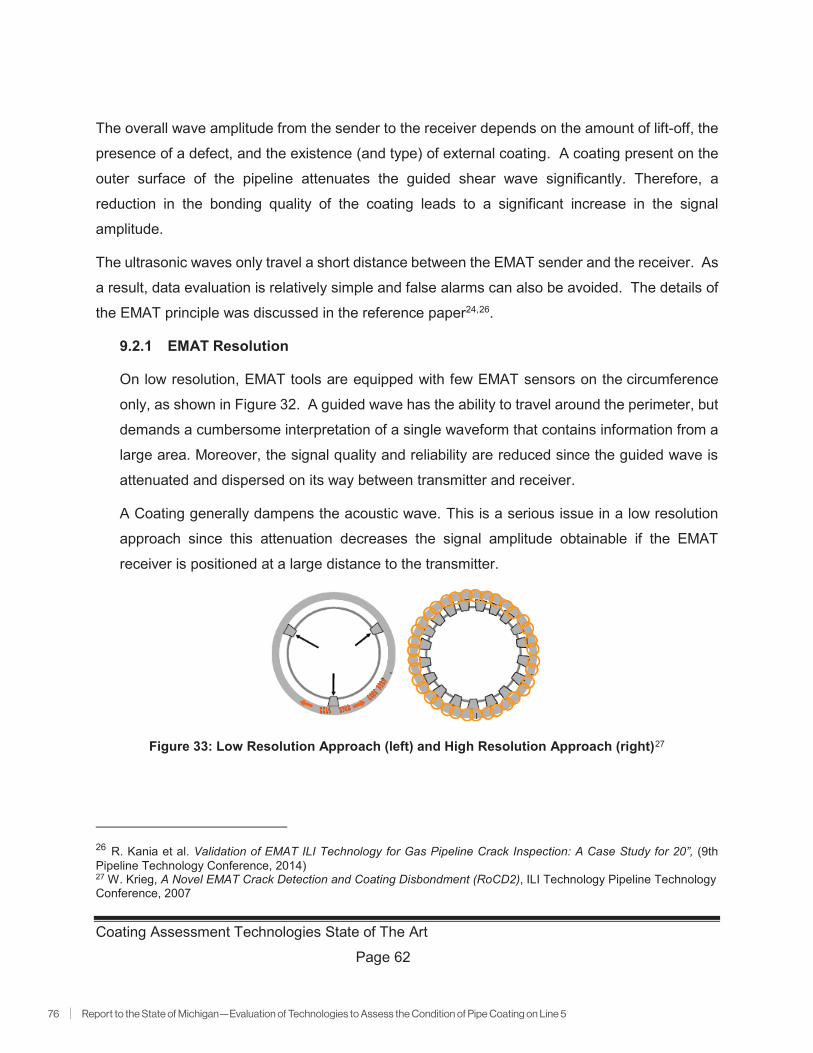
76 | Report to the State of Michigan—Evaluation of Technologies to Assess the Condition of Pipe Coating on Line 5
Coating Assessment Technologies State of The Art
Page 62
The overall wave amplitude from the sender to the receiver depends on the amount of lift-off, the
presence of a defect, and the existence (and type) of external coating. A coating present on the
outer surface of the pipeline attenuates the guided shear wave significantly. Therefore, a
reduction in the bonding quality of the coating leads to a significant increase in the signal
amplitude.
The ultrasonic waves only travel a short distance between the EMAT sender and the receiver. As
a result, data evaluation is relatively simple and false alarms can also be avoided. The details of
the EMAT principle was discussed in the reference paper24,26.
9.2.1 EMAT Resolution
On low resolution, EMAT tools are equipped with few EMAT sensors on the circumference
only, as shown in Figure 32. A guided wave has the ability to travel around the perimeter, but
demands a cumbersome interpretation of a single waveform that contains information from a
large area. Moreover, the signal quality and reliability are reduced since the guided wave is
attenuated and dispersed on its way between transmitter and receiver.
A Coating generally dampens the acoustic wave. This is a serious issue in a low resolution
approach since this attenuation decreases the signal amplitude obtainable if the EMAT
receiver is positioned at a large distance to the transmitter.
Figure 33: Low Resolution Approach (left) and High Resolution Approach (right)27
26 R. Kania et al. Validation of EMAT ILI Technology for Gas Pipeline Crack Inspection: A Case Study for 20”, (9th Pipeline Technology Conference, 2014)27 W. Krieg, A Novel EMAT Crack Detection and Coating Disbondment (RoCD2), ILI Technology Pipeline Technology Conference, 2007

Appendix A: Mears Report | 77
Coating Assessment Technologies State of The Art
Page 63
A high-resolution approach with a large number of individual EMAT sensors distributed around
the circumference of the pipeline is arranged on an in-line inspection tool as shown in Figure
32. Each individual sensor is sampling a distinct area that is a fraction of the whole
circumference. Since the sound path is limited to a short distance between transmitter and
receiver, both propagation loss and dispersion effects between transmitter and receiver are
negligible on crack detection capabilities. This provides a superior signal-to-noise ratio of the
EMAT sensor which simplifies the subsequent data evaluation and avoids misinterpretations.
The generated waves are travelling in both clockwise and counter clockwise direction and are
reflected preferentially by axially oriented features. This interrogates irregular cracks from two
different sides23.
Application of EMAT
EMAT inspection technology can be applied to pipelines carrying all products (e.g. natural gas,
LNG, crude oil and liquids) due to the fundamental EMAT principle. EMAT provides a detailed
view of the dimensions and distribution of the defects around the circumference and along the
pipeline axis.
While specifically designed and intended to detect pipeline wall defects, it is reported that EMAT
can identify the coating type and the accurate sizing of the disbondment area through a high
density of EMAT sensors and high sampling rates. EMAT can also reliably identify and
characterize composite repairs and field coatings. An example is shown in Figure 33. The details
of EMAT coating assessment is discussed in Section 9.4.

78 | Report to the State of Michigan—Evaluation of Technologies to Assess the Condition of Pipe Coating on Line 5
Coating Assessment Technologies State of The Art
Page 64
Figure 34: Coating Disbondment (Loss of Adhesion) Detection by EMAT23
EMAT for Coating Assessment
EMAT inspection technology, originally designed and intended for detection of stress corrosion
cracking (SCC), is also reported to be sensitive to areas of disbonded coating, other crack-like
features, and anomalies like gouging and channeling. High resolution EMAT tool provides
advanced maps and better visualization to aid the analyst in coating condition assessment. The
tool is reported to be capable of identifying coating disbondment and areas of missing coating as
well as identifying different types of coating repair material
The external coating attenuates the transmission signal significantly as it transmits through the
wall. In the case of intact coating, lower signal amplitude is captured by the receiver. In the case
of coating disbondment or coating holidays, higher signal amplitude is captured since the
attenuation is reduced as shown in Figure 34.
Detection of very large (3.94 inch x 3.94 inch) areas of coating damage was listed in commercial
EMAT tool specifications with a minimum size at POD 85%28. These areas of damage are
28 Rosen RoDD EMAT Service In-Line High Resolution Coating Disbondment Analysis

Appendix A: Mears Report | 79
Coating Assessment Technologies State of The Art
Page 65
significantly larger than those detectible by CIS (medium-to-large defects in coatings isolated or
continuous and typically >600 mm2 [1 in2]).
Figure 35: Signal Transmitted by One Sensor Received by Remote Sensor24
9.4.1 Identifying Disbonded Coatings
An attenuation map corresponding to the pipe surface is calculated from the contrast of
transmission signal amplitudes from various signals. Changes in attenuation indicate differences
in bond integrity of the pipe coating, as shown in Figure 33 in Section 9.3.
Coating disbondment is detectable as an increase of the transmission amplitude, as shown in
Figure 35. The minimum detectable disbondment area is approximately 20 mm long and 50 mm
wide. As suggested by the figure, the sensitivity of this tool diminishes with increasing wall
thickness. The heavy wall pipe utilized in the straits would further diminish the tools sensitivity.

80 | Report to the State of Michigan—Evaluation of Technologies to Assess the Condition of Pipe Coating on Line 5
Coating Assessment Technologies State of The Art
Page 66
Figure 36: Increase of Transmission Signal in Regions with Disbonded Coating23
9.4.2 Identify Coating Types
A high-resolution attenuation map of the pipe surface is constructed with the attenuation map
being synonymous with a map of the coating condition due to the signal amplitude only slightly
attenuated. In this configuration the absolute transmission amplitude obtained depends on the
types of coating present as shown in Figure 36 and Figure 37.
Figure 37: Signal Effect with Different Coatings23

Appendix A: Mears Report | 81
Coating Assessment Technologies State of The Art
Page 67
Figure 38: EMAT Identification of Different Coatings23
EMAT technology has been used to assess different types of coating. The distribution of coating
types inspected with the EMAT tools is shown in Figure 38.
Figure 39: Distribution of Coating Types by EMAT by Now29.
29 R. Norsworthy et al. Importance of Locating Disbonded Coatings with Electro-Magnetic Acoustic Transducer Technology, Paper No. 0001673, NACE 2012.

82 | Report to the State of Michigan—Evaluation of Technologies to Assess the Condition of Pipe Coating on Line 5
Coating Assessment Technologies State of The Art
Page 68
The population of pipelines inspected by EMAT for coating assessments is reported to be very
small when compared to the use of EMAT for pipeline defect assessments.
Limitations and Challenges for Coating Assessments
9.5.1 EMAT Sensor Operation
The following are key requirements and issues that present challenges:
• A magnetic field must be applied in the steel,
• The transducer coil must be very close (approximately 1 mm) to the surface of the steel
plate during the inspection, and
• The receiver must be extremely sensitive.
9.5.2 Noise Ratio
Several factors play in determining signal to noise ratio. The first is the strength of the reflected
signal compared to background. Since pipe coating has an attenuating effect on the signal as
it travels in the pipe wall, sensor spacing in the circumferential direction was considered. Here,
a trade-off is required. The closer the receiver is to the reflector, the stronger the return signal
will be. Therefore, this closeness dictates an increase in the number of sensors arranged on
the circumference27.
The entire signal is not reflected by a feature, which allows the unreflected portion of the wave
to travel farther through the pipe. This wave then affects the signal of neighboring sensors.
This increased density has diminishing returns because increasing noise is detected from
other sensors or an overly complicated firing sequence must be devised to limit noise from
neighboring sensors.
9.5.3 High Wear of Sensor
Another operational challenge encountered in the initial inspection was high wear of sensor
surfaces from girth welds and pipe surface due to the dry coupling environment. Extensive
testing in the lab did not accurately simulate harsh wear conditions of a real pipeline. An
improved wear material was implemented to extend the inspection range of the tool, but
impacted the sensitivity of the sensor by introducing extra background noise into the pipe wall.

Appendix A: Mears Report | 83
Coating Assessment Technologies State of The Art
Page 69
9.5.4 Impact of Pipe Wall Thickness
Given the effect of pipe wall thickness on the sensitivity of the EMAT tool in detecting coating
anomalies, this inspection tool is not capable of detecting small coating defects and is not
additionally useful compared to the option of using CIS to detect coating defects.
10.0 CPCM ILI TOOL
The CPCM ILI tool relies upon the electrical resistance of the pipe wall to calculate electrical
current magnitude and direction based upon the voltage drop between two contacts on the tool.
As such, the tool is only capable of measuring significant amounts of current or large changes in
the amount of current such as what might occur at an electrical short to a foreign structure. This
would be considered to be a ‘macro’ tool in terms of assessing coating quality, as very large areas
of coating damage would be required to show a significant change in the line current. Resolution
of the line current for the Line 5 lines is further hampered by the heavy wall pipe (low electrical
resistance).
Based upon the information provided by Enbridge, the raw data from the CPCM inspection is
highly subject to electrical contact ‘noise’ which produces large swings in the foot by foot axial
current measurement. This noise limits the tools ability to reliably detect small variations in axial
current and precludes its use for detection of localized coating defects.
11.0 LITERATURE REVIEW
A detailed literature search was performed to support the SOTA. The review included technical
papers to online articles. The following summaries are based on the research of relevant
literature. The details of the literature review for each paper are shown in Appendix A.
Literature Review on CIS/DCVG/ACVG
Direct Assessment Pipeline Integrity Management (Corrosion 2011 Paper No.11126)
Authored By: Asokan P. Pillai
This paper provides an overview of the various inspection tools that are used to locate
areas on the pipeline where corrosion might be taking place. The most common inspection
tools include close interval surveys (CIS), direct current voltage gradient surveys (DCVG)
soil type and topography surveys. All these tools are used during the implementation of

84 | Report to the State of Michigan—Evaluation of Technologies to Assess the Condition of Pipe Coating on Line 5
Coating Assessment Technologies State of The Art
Page 70
the External Corrosion Direct Assessment (ECDA) in order to evaluate the pipeline
integrity. One of the main requirements of Direct Assessment is to carry out a minimum of
2 complimentary indirect inspection techniques for each pipeline that is being investigated.
The paper explains the application, practicality and limitations of each inspection tool. For
the purpose of this report, the discussion will be concentrated on the CIS and DCVG tools
technology.
Improvements to Cathodic Protection Performance using DCVG Prioritization (Corrosion 2016 Paper No.7091)
Authored By: C. Onuaha, S. McDonnell, E. Pozniak, M. Krywko, V. Shankar
This paper shows the importance of correlating close interval survey (CIS) and direct
current voltage gradient (DCVG) during the implementation of an external corrosion direct
assessment (ECDA) implementation to select location that might present external
corrosion.
The paper is mainly focused on DCVG but it provides important case studies where the
CIS surveys were used as a complementary technique to DCVG. It also confirms the
important role of CIS and DCVG to locate areas where a coating anomaly and exposed
pipe might be present.
Use of Close-Interval Survey Data in Applying ECDA and SCCDA (Corrosion 2007 Paper No.07157)
Authored By: Andrew Hevle
This paper concentrates mainly on the role of close interval surveys (CIS) as the primary
indirect inspection tool in applying direct assessment on pipelines. The paper also
indicates that close-interval surveys are often performed in conjunction with coating
assessment surveys such as DCVG or ACVG or current attenuation surveys to identify
areas at risk. The paper clearly indicates that the interpretation of the data helps to identify
areas outside the range of acceptable industry criteria, locating defects on coatings
(isolated or continuous and typically >600 mm2 (1 in.2)..
Appendix A: Mears Report | 85
Coating Assessment Technologies State of The Art
Page 71
The paper also provides guidance on selecting types of close-interval surveys based on
the specific pipeline condition to be encountered and the ability to reliably detect corrosion
activity.
PHMSA-Sponsored Research: Improvements to ECDA Process – Severity Ranking
(Corrosion 2010 Paper No.10054)
Authored By: David Kroon, James Carroll, Dale Lindemuth, Marlene Miller
This paper highlights a PHMSA sponsored research project directed toward enhancing
external corrosion direct assessment (ECDA) classification and prioritization for effective
of possible areas where corrosion might be present on a pipeline. CIS and DCVG were
included in this study as part of the indirect inspection tools that are actually used during
the ECDA process.
The approach in this study considers CIS, DCVG, ACVG, etc. and
operational/maintenance data, as well as from soils data tools.
In the study, CIS is considered as an indirect inspection tool that is capable of assessing
different aspects of pipeline polarization characteristics including CP effectiveness and
coating condition.
Based on the data and analysis that was included in this study, the group developed an
enhanced severity classification. The content of the tables is also based on effective
ECDA programs of many operators’ pipeline integrity programs.
DCVG – Analysis of practical limits and suggestions for improvements (Corrosion 2009Paper No.09132)
Authored By: L. Bortels, P.J.Stehouwer, K. Dijkstra
This paper studies the practical limitations of the DCVG methods and introduces a new
improvement named as DCVG calibration electrode.

86 | Report to the State of Michigan—Evaluation of Technologies to Assess the Condition of Pipe Coating on Line 5
Coating Assessment Technologies State of The Art
Page 72
The calibration electrode provides an idea of the size and location of defects that can be
detected during a practical situation.
Based on these results, a study was put in place which resulted in the introduction of a
calibration method to assess the practical limits of the DCVG coating survey method.
ACVG or DCVG – Does it matter? Absolutely it Does (Corrosion 2017 Paper No.9374
Authored By: Jim Walton
The paper describes the applicability of DCVG and ACVG and their ability to successfully
detect coating defects.
The ACVG indications are categorized by their value which is in decibel microvolts (dBµV).
The decibel microvolt at the indication is then compared to the amount of current flow at
the indication in mill amperes and adjusted to account for different amounts of current flow
at each indication and its effect on the dBµV indication level. The larger the indication, the
more severe the coating damage.
The DCVG indications are categorized in percentage IR (%IR). The larger the indication
the more severe the coating damage.
The main differences between both techniques arealso discussed in the paper. :The
author concludes that ACVG and DCVG can provide suitable results in some cases, but
ACVG with higher levels of accuracy, it is more sensitive, requires less operator
interpretation and can be implemented in a more efficient manner.
Use of an Integrated CIPS/DCVG Survey in the ECDA Process (Corrosion 2006 Paper No. 06193)
Authored By: S.M. Segall, P. Eng., R.G. Reid, P. Eng., R.A. Gummow, P. Eng.
The research study consisted of the following items:
1. The paper reviews two indirect inspection tools, close interval potential survey and
DC voltage gradient survey, applied in combination as one integrated survey.
2. The paper presents the results of the ECDA process completed by Corrosion
Service Company Limited (CSCL) on three pipelines for Union Gas Limited (UGL).

Appendix A: Mears Report | 87
Coating Assessment Technologies State of The Art
Page 73
3. The measured voltages and gradients were tabulated and graphed to represent the
effectiveness of applying an integrated CIPS/DCVG survey.
A simple procedure was derived for the longitudinal gradient profile for possible application
to validate the lateral DCVG results, analyze previous CIPS survey conducted with no
associated DCVG and validation of the results of AC attenuation surveys conducted in
conjunction with CIPS.
How Deep is too Deep for Indirect Inspections (Corrosion 2017 Paper No. 9378)
Authored By: Jim Walton
Test an area where a lack of CP on a pipe that is buried less than 10 feet deep and to
conduct CIS at an offset of 10 feet, 25 feet and 50 feet. If the voltage potential
measurements that are consistent to the regular survey over the pipe, then utilize this
technique on pipes with similar coatings/CP systems that are buried deep.
Depending on the length of the deep section of pipe, take a measurement before and after
the deep section to see how much current change over the deep section of pipe by
comparing the two measurements. Another useful technique for deeper pipe sections is
to increase the amount of applied signal on the pipe.
To increase the sensitivity for ACVG, lengthen the probe spacing of the “A-frame” to be
a 10 foot or even 20-foot length.
Literature Review on Offshore Pipeline Survey
Inspection Technologies and Tools Used to Determine the Effectiveness of Cathodic Protection for Subsea Pipelines in the Gulf of Mexico – A Review, (Corrosion 2009 Paper No. 09527 NACE)
Authored By: M. Galicia
The general effective tools and technologies applied to monitor, characterize and assess
the effectiveness of a cathodic protection systems for subsea pipelines are discussed. For
the existing pipeline, permanent technologies and portable technologies are utilized to
provide a reliable concept to implement the CP system. Permanent technologies such as
permanently mounted sensors include current density sensors, anode current monitors,

88 | Report to the State of Michigan—Evaluation of Technologies to Assess the Condition of Pipe Coating on Line 5
Coating Assessment Technologies State of The Art
Page 74
coating efficiency monitors and various reference electrodes. Portable technologies can
provide a comprehensive status of CP in real time, especially with the use of ROV
mounted survey systems.
Literature Review on EMAT
Cost Effective On-Stream Inspection Technique Using EMAT Technology for Pipeline
Integrity at ELK Hills, (Corrosion 2001 Paper No. 01635 NACE)
Authored By: G. E. Peck
EMAT tool was selected to perform inspection on the oil and gas pipelines at Elk Hills,
which is one of the giant oilfields in western Kern County, California. The field was
discovered in 1918 and was operated as a petroleum reserve prior to 1998.
The EMAT inspection was used for inspection. The tool is motorized on wheels that move
the magnetically coupled EMAT along the pipeline at a rate up to 50 feet/minute.
Unexpected details such as clear right of way was experienced in this project. The
accuracy, tool coverage, survey speed, and the cost were discussed in the paper.
In-Line Inspection with High Resolution EMAT Technology Crack Detection and Coating Disbondment, (Corrosion 2007 Paper No. 07131, NACE)
Authored By: A.O. Al-Oadah, W. A. Borjailah
A 16” EMAT high resolution tool was selected to perform inspections on two FBE coated
pipes experienced presence of SCCs and coating damages: one in gas pipeline and the
other one in an oil pipeline during operation conditions. The echo signal and transmission
signal were evaluated, and field results of echo signal and transmission signal were
discussed.
Echo channels are sensitive to both defects in the axial and in the circumferential direction.
A weaker or even disbonded coating indications were observed by transmission channel
in strong red colored areas;Transmission channels are sensitive to large reflections
(signals decrease) and are also sensitive to coating qualities (signals increase as coating
is disbonding)

Appendix A: Mears Report | 89
Coating Assessment Technologies State of The Art
Page 75
Acceptance of EMAT Based In-Line Inspection Technology for the Assessment of Stress Corrosion Cracking and other Forms of Cracking in Pipelines, (Corrosion 2009 Paper No. 09108 NACE)
Authored By: T. Beuker, C. Doescher, B.Brown
Sensitivity of the EMAT tool was discussed by inspecting of several gas pipelines and a
series of pull tests results.
With increasing the length of defect, the detection of shallower defects becomes more
likely. The minimum dimension found by the EMAT was 0.79 inch long and 0.026 inch
deep with a probability-of-detection (POD) of 92%.
Coating Assessment: EMAT inspection system can provide both characteristics about
the coating types as well as characteristics about the disbanded coating. This information
is derived from the attenuation of the signal from the “coating” channel (transmission
channel). The differentiation between the coal tar and FBE coating is reflected very well.
Disbonded area is also identified by a change in transmission amplitude and reported as
individual features.
EMAT, pipe Coatings, Corrosion Control and Cathodic Protection Shielding (Corrosion 2013 Paper No. 2378, NACE)
Authored By: R. Norsworthy, J. Grillenberger, S. Brockhaus, M. Ginten
EMAT not only can be used to identify the disbanded coatings, but also be used to identify
different types of coating, coating disbondment and the associated failure scenarios. The
coating type and coating adhesion condition are critical to make decision about when and
where to make repairs or replacement of the coating or pipes.
90 | Report to the State of Michigan—Evaluation of Technologies to Assess the Condition of Pipe Coating on Line 5
Coating Assessment Technologies State of The Art
Page 76
Validation of EMAT ILI Technology for Gas Pipeline Crack Inspection: A Case Study for 20”, (9th Pipeline Technology Conference, 2014)
Authored By: R. Kania, K. Myden, R. Weber, S. Klein
EMAT tool was selected to perform inspections on two 20 inches gas pipelines with the
length of 186.4 miles and 93.2 miles, respectively. Sensitivity of the EMAT is influenced
by the signal-to-noise-ratio of the time-integral of the EMAT echo amplitude. A total of
66,694 anomalies have been initially detected by EMAT tool in the pipe body and 22,839
anomalies in the longitudinal weld area. A total of 755 crack-like defects have been
reported above the criteria.
Investigating EMAT Dig Results for a Low Frequency EWR Seam Inspection, (Corrosion 2017 Paper No. 9184, NACE)
Authored By: S. Moran, R. Meyers
The efficacy of EMAT technology is validated run in conjunction with a multiple dataset
platform by analyzing the seam of a 16”, low-frequency electric resistance welded (LF-
ERW) liquid pipe with 38 miles in length. The comparison the field and EMAT results were
compared well. 131 NDE dig results were correlated with the EMAT results, the depth
accuracy of the EMAT results to NDE were within +/- 20% of nominal wall thickness at an
89.3% certainty. The length performance results from all 131 EMAT features to NDE
results did not indicate a positive correlation.
Four ILI tools were chosen for the assessment the same pipeline. Multiple Dataset (MDS),
Circumferential Magnetic Flux Leakage (CMFL), Ultrasonic Crack Detection (UTCD), and
EMAT. A list the features types from each of the four ILI technologies had various
descriptions for crack-like defects. After combining these features types, a total of 562
cracks were reported The majority of the cracks were reported by EMAT.

Appendix A: Mears Report | 91
Coating Assessment Technologies State of The Art
Page 77
Literature Review on CPCM
P.K. Scott and M.W. Mateer. Cathodic Protection Monitoring Via In-Line Inspection. Pigging Products and Services Association. 2007.
• The results show that CP currents can be quickly, accurately and efficiently gathered
without access to the outside surface of the pipe.
• CPCM provides two advantages:
o Measures CP current direction and magnitude in the pipeline
o Allows the operator to easily gather CP information regardless of ROW conditions
• Pipe product cannot be conductive.
D.C. Janda. ILI tool enhances CP monitoring. Pipeline and Gas Technology. 2009
• This publication is more or less a copy of the paper referenced above by Scott and Mateer.
• CPCM Cathodic Protection In-Line Inspection Services provide for a reliable, cost-
effective, time-saving way to monitor, validate, or troubleshoot a pipeline’s CP system.
• CPCM tool measures CP current direction / magnitude, and allows the pipeline operator
to easily gather CP information regardless of ROW conditions.
• Interpretation of CPCM data continues to be refined. More work is needed to fully exploit
all the capabilities of the inspection tool and the resulting measurements.
12.0 SUMMARY OF STATE OF THE ART
The results of this study have shown that CIS, complemented by regular ILI remain the two most
reliable tools for assessing the integrity of the Line 5 Straits of Mackinac pipeline crossing.
Moreover, CIS has evolved into a mature and reliable technology for subsea and marine crossing
pipelines. NACE SP0207-2007 suggests that CIS surveys for buried and submerged structures
can locate medium to large defects in coatings (isolated or continuous and typically >600mm2 [1
in2]). While other coating assessment tools such as DCVG, ACVG and AC Attenuation can be
reliably performed for onshore land based pipelines, those technologies present significant
92 | Report to the State of Michigan—Evaluation of Technologies to Assess the Condition of Pipe Coating on Line 5
Coating Assessment Technologies State of The Art
Page 78
challenges for the application of the Line 5 crossing. The technical challenges and lack of proven
detection capabilities and calibration of those techniques to a subsea pipeline introduces too
much risk of unreliable and potentially misleading results to warrant serious consideration.
The review has also shown that the EMAT tool shows promise as a coating assessment tool, but
likely will not yield incremental value to the use of the CIS tool to assess and ensure CP efficacy
in conjunction with periodic inspection through ILI intended to detect external metal loss
anomalies. Further the sensitivity of the tool is greatly diminished for thicker wall pipe.
Similarly, The CPCM tool is not expected to yield meaningful results regarding coating
assessment as the pipe wall thickness and linear resistance, when coupled with the applied CP
current will yield a very small linear voltage drop that is likely below the detection limit of the tool.
The use of CIS and CP measurements coupled with periodic ILI inspections represents the best
technology to assess the integrity of Line 5.
13.0 BIBLIOGRAPHY
1. A.W. Peabody, “Control of Pipeline Corrosion” by Peabody, NACE International, The Corrosion Society, Texas, 1967, 2001.
2. SP0169-2013 “Control of External Corrosion on Underground or Submerged Metallic Piping Systems, NACE International, Texas.
3. Appalachian Underground Corrosion Short Course- Education and Training for Corrosion Control, West Virginia University, Morgantown, West Virginia, Copyright 2011.
4. SP0502-Pipeline External Corrosion Direct Assessment Methodology, NACE International, Texas.
5. H. Brian Holtsbaum, “Cathodic Protection Survey Procedures-3rd Edition”, NACE International, The Corrosion Society, Texas, 2016
6. SP0207-2007 Perforating Close-Interval Potential Surveys and DC Surface Potential Gradient Surveys on Buried or Submerged Metallic Pipelines”
7. C. Weldon and D. Kroon. Corrosion Control Survey Methods for Offshore Pipelines and Structures, Corrpro Technical Library, Medina, OH, www.corrpro.com
8. Online source-Subsea Pipelines Cathodic Protection Inspections by Cesco , http://www.oceanologyinternational.com/__novadocuments/43393?v=635230661560370000
9. Online source-Guidelines for Subsea Pipeline Cathodic Protection Surveyhttp://www.ises.tech/wp-content/uploads/2013/06/Guidelines-for-Subsea-Pipeline-Cathodic-Protection-Survey.pdf

Appendix A: Mears Report | 93
Coating Assessment Technologies State of The Art
Page 79
10. Online Source, Underwater Cathodic Protection Surveys - Facts and Fiction. http://www.mpmi.com/services/cathodic-protection-services/underwater-cathodic-protection-surveys-facts-and-fiction/
11. J. Grapiglia. Cathodic Protection (CP) Surveys for Subsea Assets. Corrosion Control Engineering
12. C. Weldon and D. Kroon. Corrosion Control Survey Methods for Offshore Pipelines and Structures, Corrpro Technical Library, Medina, OH, www.corrpro.com
13. J. Bushman et al. Electrical Surveys of Underwater or Underground Structures with Electrode-to-Electrolyte Potential Correction, Patent Number 4,467,274, Date of Patient 08/21/1984.
14. 7L192 Cathodic Protection Design Considerations for Deep Water Projects, Item No.24165, NACE International, 2009.
15. Online Source-CP Inspection Methods by CorrOceanhttps://www.google.com/search?q=Trailing+Wire+Drop+Cell+Technique&tbm=isch&source=iu&ictx=1&fir=vmdNWMFFieq6kM%253A%252CJXQG313cQK0_2M%252C_&usg=__ssda4T3squ_pJtyrzMsQPi_v7pA%3D&sa=X&ved=0ahUKEwir1NO79enaAhUm_4MKHXaVBnQQ9QEILTAB#imgrc=XQ21JkCYycJgcM
16. TM0109-2009 Aboveground Survey Techniques for the Evaluation of Underground Pipeline Coating Condition-Item No. 21254
17. Assessing the Integrity of Coating Systems on Pipelines in Trenchless Crossings, PRCI Catalog No.PR-444-133602-R01, 2015.
18. S.M. Segall, R.G. Reid, R.A. Gummow, Use of an Integrated CIPS/DCVG Survey in the ECDA Process, Corrosion, Paper No. 10061, NACE, 2010.
19. G. Peck, Cost Effective On-Stream Inspection Technique Using EMAT Technology for Pipeline Integrity at ELK Hills, Paper No. 01635, NACE 2001.
20. M. Klann et al. Pipeline Inspection with The High Resolution EMAT ILI–Tool: Report on Field Experience, IPC2006-10156, International Pipeline Conference, September 25-29, 2006, Calgary, Alberta, Canada
21. S. Shrestha, In-Lin Inspection EMAT Utilizing an Oblique Field, Corrosion, Paper No.2012-0001318, NACE 2012.
22. T. Bueker et al. Review of Advanced In-Line Inspection Solutions for Gas Pipelines.November 17th, 2010.
23. S. Tappert et al., Third-Generation EMAT Tool Enhanced for Finding SCC and Disbonded Coating in Dry Gas Pipelines, Pipeline and Gas Journal, June 2009 Vol. 236 No. 6
24. R. Kania et al. Validation of EMAT ILI Technology for Gas Pipeline Crack Inspection: A Case Study for 20”, (9th Pipeline Technology Conference, 2014)
25. W. Krieg, A Novel EMAT Crack Detection and Coating Disbondment (RoCD2), ILI Technology Pipeline Technology Conference, 2007
26. RODD EMAT Service In-Line High Resolution Coating Disbondment Analysis27. A. O. Al-Oadah et al. In-Line Inspection with High Resolution EMAT Technology Crack
Detection and Coating Disbondment, Corrosion 2007 Paper No. 07131, NACE28. Norsworthy et al. Importance of Locating Disbonded Coatings with Electro-Magnetic
Acoustic Transducer Technology, Paper No. 0001673, NACE 2012.
94 | Report to the State of Michigan—Evaluation of Technologies to Assess the Condition of Pipe Coating on Line 5
Coating Assessment Technologies State of The Art
Page 80
APPENDIX A
A detailed literature search was performed to support the SOTA. The review included technical
papers to online articles. The following summaries are based on the research of relevant
literature.
Literature Review on CIS/DCVG/ACVG
Direct Assessment Pipeline Integrity Management (Corrosion 2011 Paper No.11126)
Authored By: Asokan P. Pillai
This paper provides an overview of the various inspection tools that are used to locate
areas on the pipeline where corrosion might be taking place. The most common inspection
tools include close interval surveys (CIS), direct current voltage gradient surveys (DCVG)
soil type and topography surveys. All these tools are used during the implementation of
the External Corrosion Direct Assessment (ECDA) in order to evaluate the pipeline
integrity. One of the main requirements of Direct Assessment is to carry out a minimum of
2 complimentary indirect inspection techniques for each pipeline that is being investigated.
The paper explains the application, practicality and limitations of each inspection tool. For
the purpose of this report, the discussion will be concentrated on the CIS and DCVG tools
technology.
Close interval potential survey is basically a pipe-to-soil survey conducted at close
intervals along a pipeline to assess the performance of the cathodic protection system and
to estimate the location of coating holidays.
Direct current voltage gradient (DCVG) is normally considered a secondary indirect
inspection tool during the ECDA process and it is normally implemented to measure the
voltage gradients resulting from current pickup and discharge points at coating holidays.
DCVG is used to detect coating holidays and size them by determining the percent IR.
The author also describes ways to analyze the data. Reference is being made to the NACE
SP0502 “Pipeline External Corrosion Direct Assessment Methodology” classification
approach which consists on the following:

Appendix A: Mears Report | 95
Coating Assessment Technologies State of The Art
Page 81
• Minor – indications that can be considered inactive or with the lowest likelihood of corrosion activity, e.g. small On/OFF potential above CP criteria (small dips)
• Moderate – indications considered as experiencing possible corrosion activity, e.g. OFF potentials below CP criteria (medium dips).
• Severe – indications considered as having the highest probability of corrosion activity, e.g. On/OFF potentials below CP criteria (large dips).
This information can be correlated to voltage ranges as follows: small dips as less than
50mV, medium dips as between 50 mV to 100mV or below CP criteria, and large dips as
anything greater than 100mV or below CP criteria.
The following Table from the paper shows the corresponding link of CIS severity ranking
to a risk index.
The risk index ranges from 1 to 5 with I indicating the lowest likelihood of any corrosion
activity and 5 indicating the highest likelihood of corrosion activity. This risk ranking is
automatically computed to the collected close interval survey data. The index can be
combined with another complementary indirect inspection tool survey like Direct Current
Voltage Gradient (DCVG) to prioritize direct examination locations.
Like the Close interval survey, the most critical challenge in a DCVG survey is the analysis
of the data. The NACE SP0502’s approach is as follows:
• Category 1 - 1-15% IR: Holidays in this category are considered of low importance, and repair is not required.
• Category 2 – 16 to 35% IR: Holidays in this category are generally considered of no serious threat and can be protected by maintaining adequate levels of CP. Generally

96 | Report to the State of Michigan—Evaluation of Technologies to Assess the Condition of Pipe Coating on Line 5
Coating Assessment Technologies State of The Art
Page 82
considered for repair, based on proximity to groundbeds or other structures of importance.
• Category 3 – 36-60% IR: Holidays in this category will be considered a threat to the overall integrity of the pipeline and will be scheduled for repair.
• Category 4 – 61-100%IR: Holidays are generally recommended for immediate repair and are considered likely to pose a threat to the integrity of the pipeline.
Additionally, there are four possible statues of corrosion for each:
C/C – cathodic/cathodic: Holidays that are consumers of CP but are not actively
corroding.
C/N – cathodic/neutral: These holidays consume current and may corrode when
there is an upset in CP.
C/A – cathodic/anodic: These holidays may corrode even when the CP system is
properly operating and they also consume CP current.
A/A – anodic/anodic: Holidays that may be corroding and may or may not consume
current.
As per NACE SP0502 “Pipeline External Corrosion Direct Assessment Methodology”
classification approach which consists on the following:
• Minor: Small indication (low voltage drop and cathodic condition at indication when CP is On and OFF).
• Moderate: Medium indication (medium voltage drop and/or neutral condition at indication when CP is OFF).
• Severe: Large indication (high voltage drop and/or anodic condition when CP is ON or OFF).
The following Table shows the corresponding link of DCVG severity ranking to a risk index.

Appendix A: Mears Report | 97
Coating Assessment Technologies State of The Art
Page 83
Improvements to Cathodic Protection Performance using DCVG Prioritization (Corrosion 2016 Paper No.7091)
Authored By: C. Onuaha, S. McDonnell, E. Pozniak, M. Krywko, V. Shankar
This paper shows the importance of correlating close interval survey (CIS) and direct
current voltage gradient (DCVG) during the implementation of an external corrosion direct
assessment (ECDA) implementation to select location that might present external
corrosion.
The paper is mainly focused on DCVG but it provides important case studies where the
CIS surveys were used as a complementary technique to DCVG. It also confirms the
important role of CIS and DCVG to locate areas where a coating anomaly and exposed
pipe might be present.
The DCVG %IR methodology involves linear interpolation of the measured IR drop
difference measured in the pipe to soil potential (measured to remote earth) at the
upstream and downstream point of the pipe segment that is being inspected.
New technologies have been developed that integrate CIS and DCVG survey data. The
analogy to follow during the evaluation and analysis of the data will depend on the level of
cathodic protection, soil corrosivity and DCVG %IR. For example, if a pipeline is receiving
good cathodic protection and the DCVG %IR is greater than 70, the probability for
corrosion will be low when compared to another pipeline with the same condition but not
receiving enough cathodic protection. Another analogy is also presented where a pipeline
with small DCVG %IR is not receiving enough cathodic protection and the pipe is buried
in a highly conductive and corrosive soil. The presence of a tiny coating anomaly could
expose the metal to highly corrosive metal. The section will become anodic (creating a
small anode to a large cathode) to the rest of the coated pipe leading to a severe localized
corrosion.
The following Table and Figure present the results of some case studies that are
presented in the paper. The correlation of the CIS and DCVG data can provide useful
information on severity of corrosion.
The pipeline integrity data show that:

98 | Report to the State of Michigan—Evaluation of Technologies to Assess the Condition of Pipe Coating on Line 5
Coating Assessment Technologies State of The Art
Page 84
The pipeline integrity data show that:
a) The polarized and depolarized potentials are -891mV/CSE and -704mV/CSE, respectively. As per NACE requirements, the pipeline should be receiving enough CP. The sudden drop in the polarized potential could mean that the exposed bare metal is consuming much of the CP current.
b) The difference between “Instant OFF” and ON potential is 81 mV. This could indicate a possible coating anomaly creating a low resistive path.
c) The soil resistivity of 723.9 Ω-cm indicates that the soil could be highly corrosive to the exposed metal.
d) The DCVG IR of 76% indicates an immediate repair is recommended.
Use of Close-Interval Survey Data in Applying ECDA and SCCDA (Corrosion 2007 PaperNo.07157)
Authored By: Andrew Hevle

Appendix A: Mears Report | 99
Coating Assessment Technologies State of The Art
Page 85
This paper concentrates mainly on the role of close interval surveys (CIS) as the primary
indirect inspection tool in applying direct assessment on pipelines. A close-interval survey
(CIS) is a series of structure-to-electrolyte direct current (DC) potential measurements
performed at regular intervals for assessing the level of cathodic protection (CP) on buried
or submerged pipelines. The paper also indicates that close-interval surveys are often
performed in conjunction with coating assessment surveys such as Direct Current Voltage
Gradient (DCVG) or Alternating Current Voltage Gradient (ACVG) or current attenuation
surveys to identify areas at risk. The paper clearly indicates that the interpretation of the
data helps to identify areas outside the range of acceptable industry criteria, locating
defects on coatings (isolated or continuous and typically >600 mm2 (1 in.2)., locating areas
of stray current pickup and discharge or at risk for interference corrosion, identify possible
shorted casings, defective electrical isolation devices, or unintentional contact with other
metallic structures, and locating possible high pH stress corrosion cracking risk areas.
The paper also provides guidance on selecting types of close-interval surveys based on
the specific pipeline condition to be encountered and the ability to reliably detect corrosion
activity.
The author stresses the fact that care must be exercised to ensure that the data collected
during a CIS survey is accurate, valid, and capable of integration with other data sets. The
success of a CIS and its ability to detect coating faults and exposed areas depends on the
following:
• Detailed close-interval survey specifications.• Proper preparations should be made prior to the start of the survey.• Proper locating and distance measurement techniques should be selected and
performed. • Implementing additional measurements to ensure that the data is valid and accurate,
that current interrupters are synchronized, that IR drop in the soil and along the pipeline are minimized, and sufficient measurements to evaluate the effectiveness of electrical isolation and the influence of foreign cathodic protection systems.
• Sufficient field comments should be entered while conducting the survey to documents any physical features that may significantly affect the measurement or aid in the location of indications.
• Implement data validation methods to ensure that the CIS data is accurate and valid.

100 | Report to the State of Michigan—Evaluation of Technologies to Assess the Condition of Pipe Coating on Line 5
Coating Assessment Technologies State of The Art
Page 86
PHMSA-Sponsored Research: Improvements to ECDA Process – Severity Ranking (Corrosion 2010 Paper No.10054)
Authored By: David Kroon, James Carroll, Dale Lindemuth, Marlene Miller
This paper highlights a PHMSA sponsored research project directed toward enhancing
external corrosion direct assessment (ECDA) classification and prioritization for effective
of possible areas where corrosion might be present on a pipeline. Close-interval surveys
(CIS) and Direct Current Voltage Gradient surveys (DCVG) were included in this study as
part of the indirect inspection tools that are actually used during the ECDA process.
The classification and prioritization methodologies provided in the NACE SP0502 are
considered very general and provide limited guidance for accurately classifying and
prioritizing indirect inspection indications under various conditions.
The approach in this study considers close interval surveys (CIS), DC voltage gradient
(DCVG), AC voltage gradient (ACVG), etc. and operational/maintenance data, as well as
from soils data tools.
With respect to CIS, the field data includes Polarized CP, ON Profile Depression, OFF
Profile Depression, ON/OFF Convergence, and Polarization (Native or Static OFF). In the
study, CIS is considered as an indirect inspection tool that is capable of assessing different
aspects of pipeline polarization characteristics including CP effectiveness and coating
condition.
Based on the data and analysis that was included in this study, the group developed an
enhanced severity classification table which is shown in Table 1 and 2. The content of the
tables is also based on effective ECDA programs of many operators’ pipeline integrity
programs.
The two Tables were also enhanced using a soil texture modifier factor. The addition of
this factor in Table 1 provides a notable improvement from NACE SP0502-2008 in that
objective measurable values are assigned to each indirect inspection technique.
Additionally, consideration of soil characteristics improves the prioritization action shown
in Table 2.
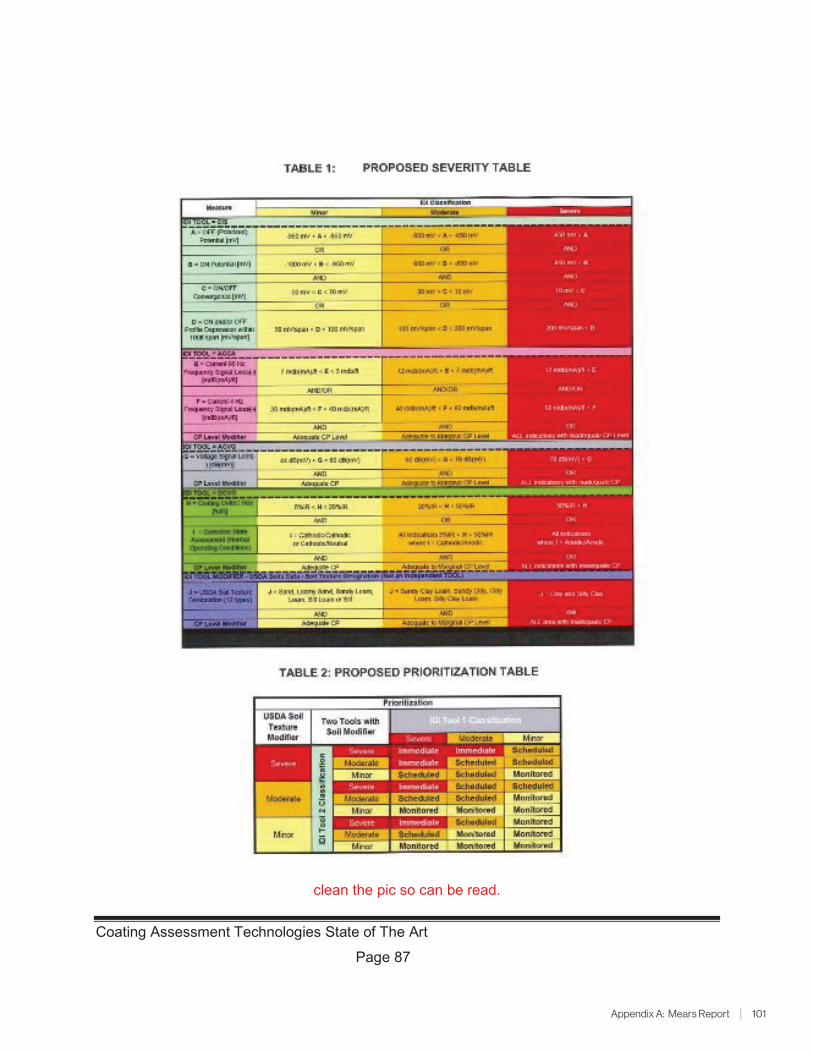
Appendix A: Mears Report | 101
Coating Assessment Technologies State of The Art
Page 87
clean the pic so can be read.

102 | Report to the State of Michigan—Evaluation of Technologies to Assess the Condition of Pipe Coating on Line 5
Coating Assessment Technologies State of The Art
Page 88
The study concluded that the enhanced classification and prioritization Tables contribute
to effectively, economically, efficiently and safely address the external corrosion threat to
pipeline integrity.
DCVG – Analysis of practical limits and suggestions for improvements (Corrosion 2009 Paper No.09132)
Authored By: L. Bortels, P.J.Stehouwer, K. Dijkstra
This paper studies the practical limitations of the Direct Current Voltage Gradient (DCVG)
methods and introduces a new improvement named as DCVG calibration electrode. The
approach is based on:
• The combination of numerical calculations, and• Development of a calibration electrode (pen) which can be used in the field to
simulate coating defects.
The calibration electrode provides an idea of the size and location of defects that can be
detected during a practical situation.
The DCVG calibration technique is based on the combination of sound mathematics and
advance 3D computer simulations (based on Finite element Method). The model takes
into account ohmic drop effects in the soil (multi-layer/domain) and anodic and cathodic
reaction polarization behavior.
In order to prove the limitations of the DCVG technology, the authors presented in Figure
3 the calculated DCVG signal for a defect on a 42” pipe with 120 cm coverage, located at
the top, side and bottom.
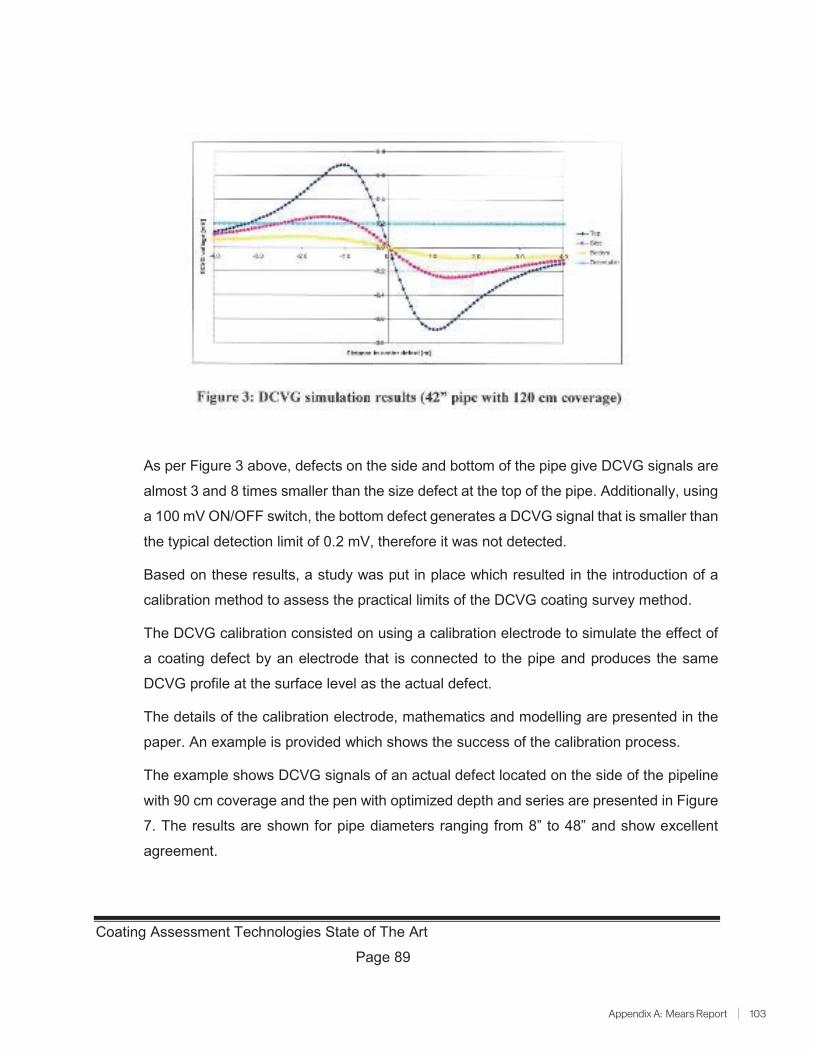
Appendix A: Mears Report | 103
Coating Assessment Technologies State of The Art
Page 89
As per Figure 3 above, defects on the side and bottom of the pipe give DCVG signals are
almost 3 and 8 times smaller than the size defect at the top of the pipe. Additionally, using
a 100 mV ON/OFF switch, the bottom defect generates a DCVG signal that is smaller than
the typical detection limit of 0.2 mV, therefore it was not detected.
Based on these results, a study was put in place which resulted in the introduction of a
calibration method to assess the practical limits of the DCVG coating survey method.
The DCVG calibration consisted on using a calibration electrode to simulate the effect of
a coating defect by an electrode that is connected to the pipe and produces the same
DCVG profile at the surface level as the actual defect.
The details of the calibration electrode, mathematics and modelling are presented in the
paper. An example is provided which shows the success of the calibration process.
The example shows DCVG signals of an actual defect located on the side of the pipeline
with 90 cm coverage and the pen with optimized depth and series are presented in Figure
7. The results are shown for pipe diameters ranging from 8” to 48” and show excellent
agreement.

104 | Report to the State of Michigan—Evaluation of Technologies to Assess the Condition of Pipe Coating on Line 5
Coating Assessment Technologies State of The Art
Page 90
ACVG or DCVG – Does it matter? Absolutely it Does (Corrosion 2017 Paper No.9374
Authored By: Jim Walton
The paper describes the applicability of Direct Current Voltage Gradient (DCVG) and
Alternating Current Voltage Gradient (ACVG) and their ability to successfully detect
coating defects.
Details related to both techniques are provided in the report. A summary of each technique
is provided as follows:
The ACVG indications are categorized by their value which is in decibel microvolts (dBµV).
The decibel microvolt at the indication is then compared to the amount of current flow at
the indication in mill amperes and adjusted to account for different amounts of current flow
at each indication and its effect on the dBµV indication level. The larger the indication, the
more severe the coating damage. The dBµV level can be affected by:
• Soil resistance,• Depth of the pipeline, amount of transmitted signal,• Pipe diameter,• Coating type,• Clock positon of the indication,• Pipeline length, number of indications in the area, and
Appendix A: Mears Report | 105
Coating Assessment Technologies State of The Art
Page 91
• A-frame contact to the surface.
The DCVG indications are categorized in percentage IR (%IR). The larger the indication
the more severe the coating damage.
The %IR level can be affected by:
• Soil resistance,• Depth of the pipeline,• Pipe diameter, Coating type, clock position of the indication, Pipeline length,• Number of indications in the area, and• Probe contact to the surface.
Both techniques are capable of finding and locating the following:
• Large coating defects,• Small coating defects,• Relative severity of the coating defect, possible interference areas. Shorted casings
(both metallic and electrolytic conditions),• CP cable breaks, and Position of anodes.
The main differences between both techniques are as follows:
• DCVG uses interrupted CP sources. ACVG uses either low frequency AC or interrupted DC.
• DCVG uses two poles with half-cell type of contact probes. ACVG uses two metal probes.
• DCVG probe varies. ACVG probe specie is fixed.• DCVG can be interfered with existing or stray DC sources. ACVG normally is not.• DCVG normally requires 400-800 mV shift which cannot be obtained in all pipeline
conditions without significant effort. ACVG requires a minimum amount of low frequency applied current.
• DCVG can be less sensitive under paved surfaces than ACVG therefore requiring the use of drilled holes in pavement.
• ACVG requires less operator interpretation because of the fixed spacing.• DCVG can provide a relative cathodic/anodic condition of CP at an indication.• CP current may create a state of passivation in which little or no current change is
occurring at the holiday. DCVGG is not able to identify an indication at these locations.
The author concludes that ACVG and DCVG can provide suitable results in some cases,
but ACVG with higher levels of accuracy, it is more sensitive, requires less operator
interpretation and can be implemented in a more efficient manner.
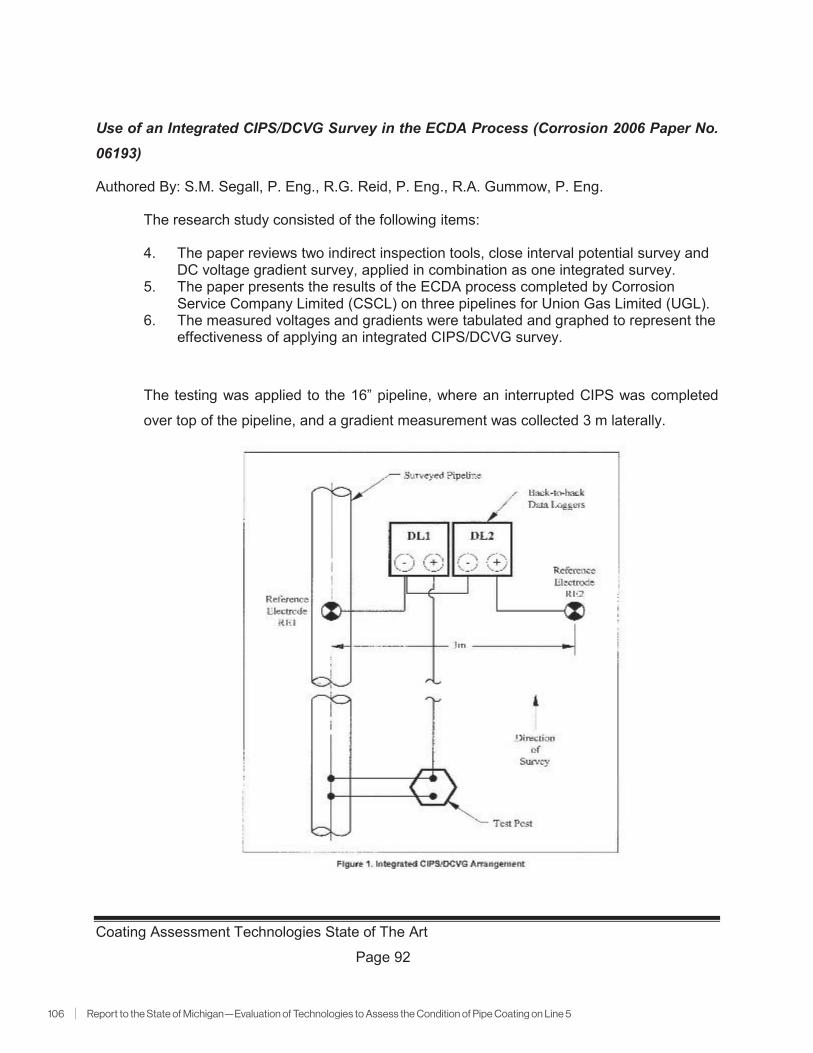
106 | Report to the State of Michigan—Evaluation of Technologies to Assess the Condition of Pipe Coating on Line 5
Coating Assessment Technologies State of The Art
Page 92
Use of an Integrated CIPS/DCVG Survey in the ECDA Process (Corrosion 2006 Paper No. 06193)
Authored By: S.M. Segall, P. Eng., R.G. Reid, P. Eng., R.A. Gummow, P. Eng.
The research study consisted of the following items:
4. The paper reviews two indirect inspection tools, close interval potential survey and DC voltage gradient survey, applied in combination as one integrated survey.
5. The paper presents the results of the ECDA process completed by Corrosion Service Company Limited (CSCL) on three pipelines for Union Gas Limited (UGL).
6. The measured voltages and gradients were tabulated and graphed to represent the effectiveness of applying an integrated CIPS/DCVG survey.
The testing was applied to the 16” pipeline, where an interrupted CIPS was completed
over top of the pipeline, and a gradient measurement was collected 3 m laterally.

Appendix A: Mears Report | 107
Coating Assessment Technologies State of The Art
Page 93
The measured data was plotted to compare the potentials to the measured gradients. In
addition, the %IR was calculated from the recorded data, which was based on a ratio
comparison of pipe depth and holiday size to the 3 m gradient. Formulas were developed
to calculate the %IR with respect to remote earth. The accuracy of this formula was verified
by five measurements to remote earth on the 16” pipeline.
A simple procedure was derived for the longitudinal gradient profile for possible application
to validate the lateral DCVG results, analyze previous CIPS survey conducted with no
associated DCVG and validation of the results of AC attenuation surveys conducted in
conjunction with CIPS.
How Deep is too Deep for Indirect Inspections (Corrosion 2017 Paper No. 9378)
Authored By: Jim Walton
As a pipeline installation depth becomes greater, there is a reduced sensitivity of the
indirect inspection tools. The question becomes how deep is too deep to run a successful
indirect inspection and still have valid results?
You will have exceeded the depth at which CIS is valuable when the average voltage
gradient would mask all indications of a lack of cathodic protection. One way to test this
theory is to test an area where you have a lack of CP on a pipe that is buried less than 10
feet deep and to conduct CIS at an offset of 10 feet, 25 feet and 50 feet. If you can still
see the voltage potential measurements that are consistent to what you saw in the regular
survey over the pipe, then you may be able to utilize this technique on pipes with similar
coatings/CP systems that are buried deep.
Depending on the length of the deep section of pipe, you may be able to take a
measurement before and after the deep section to see how much current change you had
over the deep section of pipe by comparing the two measurements. Another useful
technique for deeper pipe sections is to increase the amount of applied signal on the pipe.
108 | Report to the State of Michigan—Evaluation of Technologies to Assess the Condition of Pipe Coating on Line 5
Coating Assessment Technologies State of The Art
Page 94
One technique to increase the sensitivity for ACVG is to lengthen the probe spacing of the
“A-frame” to be a 10 foot or even 20-foot length. This will further increase the sensitivity
of the tool. You could also perform a similar test utilizing ACVG/DCVG like you can with
CIS by completing an offset survey to see what you can and cannot see with the tool.
Another technique is increasing the amount of applied signal on the pipe.
Indirect inspections are valid survey techniques at many depths including those where the
pipeline is very deep. The validity of the data can vary pipeline to pipeline depending on
environmental conditions.
A direct quote from the paper: “Indirect Inspections are valid survey techniques at many
depths including those where the pipeline is very deep. I have heard for years now people
try to put pipelines that are more than ten feet deep in a category of not being able to be
inspected. Some have even said their locating instrument can’t locate pipe greater than
10 feet deep. This simply is not true! I have great confidence in the tools where the
pipeline is buried 30 feet deep and with the right circumstance can go much deeper than
this. It is true that if you ask to survey a pipe that is 80 or 100 feet deep, it is unlikely that
we will obtain good results. I have however in many cases been able to obtain decent
results 50 or more feet deep. It just depends.”
Literature Review on Offshore Pipeline Survey
Inspection Technologies and Tools Used to Determine the Effectiveness of Cathodic Protection for Subsea Pipelines in the Gulf of Mexico – A Review, (Corrosion 2009 Paper No. 09527 NACE)
Authored By: M. Galicia
The general effective tools and technologies applied to monitor, characterize and assess
the effectiveness of a cathodic protection systems for subsea pipelines are discussed. For
the existing pipeline, permanent technologies and portable technologies are utilized to
provide a reliable concept to implement the CP system. Permanent technologies such as
permanently mounted sensors include current density sensors, anode current monitors,
coating efficiency monitors and various reference electrodes. Portable technologies can

Appendix A: Mears Report | 109
Coating Assessment Technologies State of The Art
Page 95
provide a comprehensive status of CP in real time, especially with the use of ROV
mounted survey systems.
The below table summarized the monitoring technologies identified as applicable to
subsea pipeline in the Gulf of Mexico, with emphasis to the possible applicability in the
Mexican territory, and highlights some advantages and disadvantages, strengths and
weaknesses.
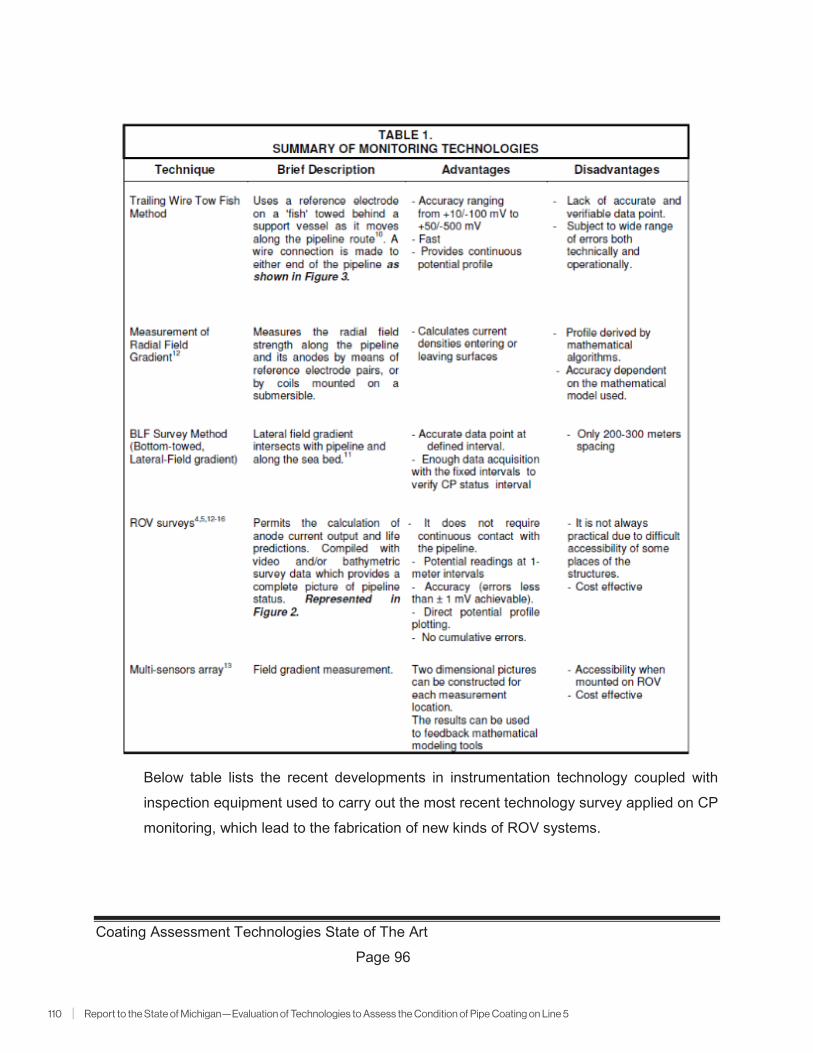
110 | Report to the State of Michigan—Evaluation of Technologies to Assess the Condition of Pipe Coating on Line 5
Coating Assessment Technologies State of The Art
Page 96
Below table lists the recent developments in instrumentation technology coupled with
inspection equipment used to carry out the most recent technology survey applied on CP
monitoring, which lead to the fabrication of new kinds of ROV systems.

Appendix A: Mears Report | 111
Coating Assessment Technologies State of The Art
Page 97

112 | Report to the State of Michigan—Evaluation of Technologies to Assess the Condition of Pipe Coating on Line 5
Coating Assessment Technologies State of The Art
Page 98
Literature Review on EMAT
Cost Effective On-Stream Inspection Technique Using EMAT Technology for Pipeline Integrity at ELK Hills, (Corrosion 2001 Paper No. 01635 NACE)
Authored By: G. E. Peck
EMAT tool was selected to perform inspection on the oil and gas pipelines at Elk Hills,
which is one of the giant oilfields in western Kern County, California. The field was
discovered in 1918 and was operated as a petroleum reserve prior to 1998.
The EMAT inspection was used for inspection. The tool is motorized on wheels that move
the magnetically coupled EMAT along the pipeline at a rate up to 50 feet/minute.
Unexpected details such as clear right of way was experienced in this project.
The paper consisted of the following items regarding the EMAT tool:
1. Accuracy: Defects can be located that will prove to be 15-100% of body wall
penetration. Pipeline joints and the indication of worst defect in each joint were
detected.
2. Coverage: The tool can evaluate the entire exposed surface up to welds, and
connections. The tool evaluated the entire diameter and length as it travels.
3. Speed: The tool speed was used to inspect 2,500 to 5,000 feet per day from pipeline
diameter from 3 inches to 48 inches. The inspection process is quicker where the
pipeline was in good condition. When a defect was detected, the tool was stopped
and reversed to center the EMAT over the defect for marking and measurement.
4. Cost: the inspection was done from 6 inches to 14 inches diameter of pipelines in
2001. The cost may vary due to the number of defects found, the difficulty in clearing
the right-of-way, and other factors related to the speed.
In-Line Inspection with High Resolution EMAT Technology Crack Detection and Coating Disbondment, (Corrosion 2007 Paper No. 07131, NACE)
Authored By: A.O. Al-Oadah, W. A. Borjailah
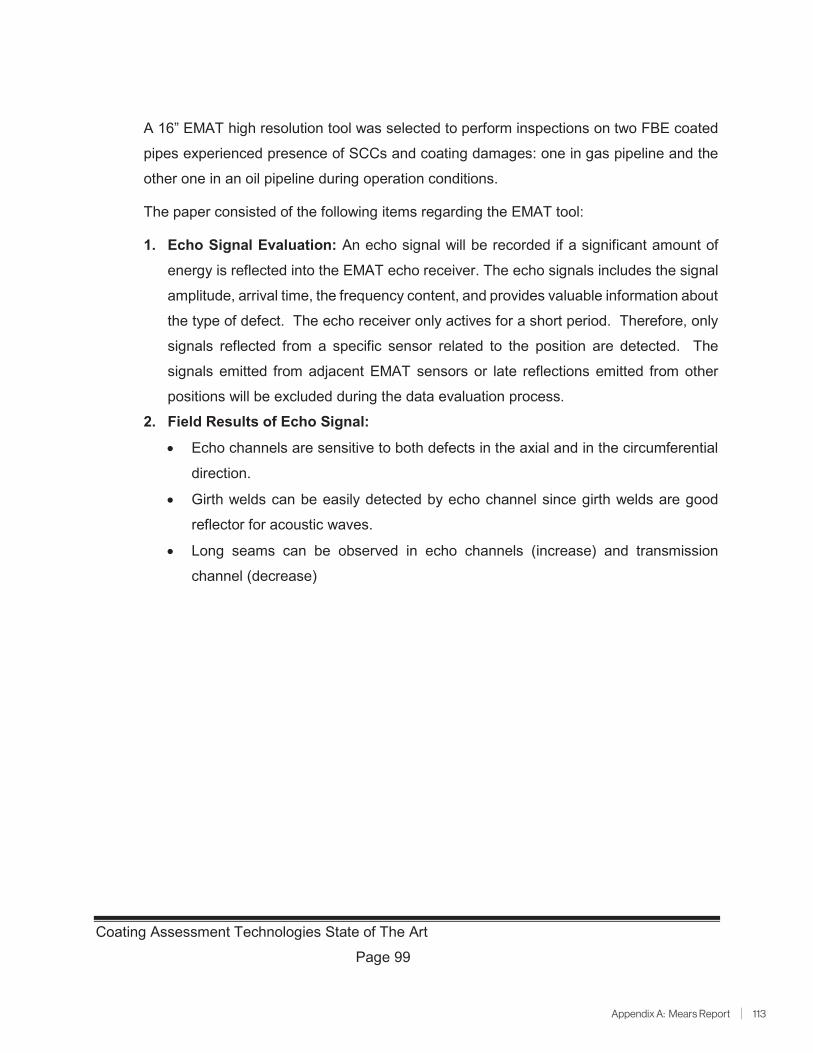
Appendix A: Mears Report | 113
Coating Assessment Technologies State of The Art
Page 99
A 16” EMAT high resolution tool was selected to perform inspections on two FBE coated
pipes experienced presence of SCCs and coating damages: one in gas pipeline and the
other one in an oil pipeline during operation conditions.
The paper consisted of the following items regarding the EMAT tool:
1. Echo Signal Evaluation: An echo signal will be recorded if a significant amount of
energy is reflected into the EMAT echo receiver. The echo signals includes the signal
amplitude, arrival time, the frequency content, and provides valuable information about
the type of defect. The echo receiver only actives for a short period. Therefore, only
signals reflected from a specific sensor related to the position are detected. The
signals emitted from adjacent EMAT sensors or late reflections emitted from other
positions will be excluded during the data evaluation process.
2. Field Results of Echo Signal:
• Echo channels are sensitive to both defects in the axial and in the circumferential
direction.
• Girth welds can be easily detected by echo channel since girth welds are good
reflector for acoustic waves.
• Long seams can be observed in echo channels (increase) and transmission
channel (decrease)

114 | Report to the State of Michigan—Evaluation of Technologies to Assess the Condition of Pipe Coating on Line 5
Coating Assessment Technologies State of The Art
Page 100
3. Transmission Signal Evaluation: Transmission channel contains the information
about the wave directly propagates from the EMAT sender to the transmission
receiver. The amplitude of this wave depends on the lift-off, the presence of a defect
and the presence of an external coating. This signal can be used to detect the coating
disbondment since a coating generally attenuates the acoustic wave. A significant
increase of signal amplitude can be observed if the bonding quality of coating is poor.
4. Field Results of Transmission Signal:
• A weaker or even disbonded coating indications were observed by transmission
channel in strong red colored areas;
• Decreased signals amplitudes can be observed at girth welds and long seams;
• Transmission channels are sensitive to large reflections (signals decrease) and
are also sensitive to coating qualities (signals increase as coating is disbonding)

Appendix A: Mears Report | 115
Coating Assessment Technologies State of The Art
Page 101
Acceptance of EMAT Based In-Line Inspection Technology for the Assessment of Stress Corrosion Cracking and other Forms of Cracking in Pipelines, (Corrosion 2009 Paper No. 09108 NACE)
Authored By: T. Beuker, C. Doescher, B.Brown
Sensitivity of the EMAT tool was discussed by inspecting of several gas pipelines and a
series of pull tests results. The paper consisted of the following items regarding the EMAT
tool:
1. Sensitivity: With increasing the length of defect, the detection of shallower defects
becomes more likely. The minimum dimension found by the EMAT was 0.79 inch long
and 0.026 inch deep with a probability-of-detection (POD) of 92%. Sensitivity was
compared with UT data taken manually in the ditch. High sensitivity of EMAT was
illustrated from the strong EMAT amplitude as shown in the below figure.

116 | Report to the State of Michigan—Evaluation of Technologies to Assess the Condition of Pipe Coating on Line 5
Coating Assessment Technologies State of The Art
Page 102
2. Depth Sizing: The accuracy achieved in EMAT analysis is comparable to that found
in established process for crack evaluation with other inspection technologies. The
crack depth reported as part of an EMAT inspection follows the API categorization
scheme.
3. Length Sizing: For short defects, a stable length sizing can be achieved. A slightly
larger scattering of the length measurement can be observed for short features.
4. Defect Characterization: Multi-parameter correlation model (MPC) is used to detect
the sensitivity to a particular feature type such as differentiating the crack-like features
and mill related features.
5. Clustering: The cracks in close vicinity are classified by their length 2Ci and their
distance to each other Si. The clustering method for branches cracks has been
applied according to the APT 579 standard. The results from MPI and EMAT are
comparable quality as shown in the below figure.
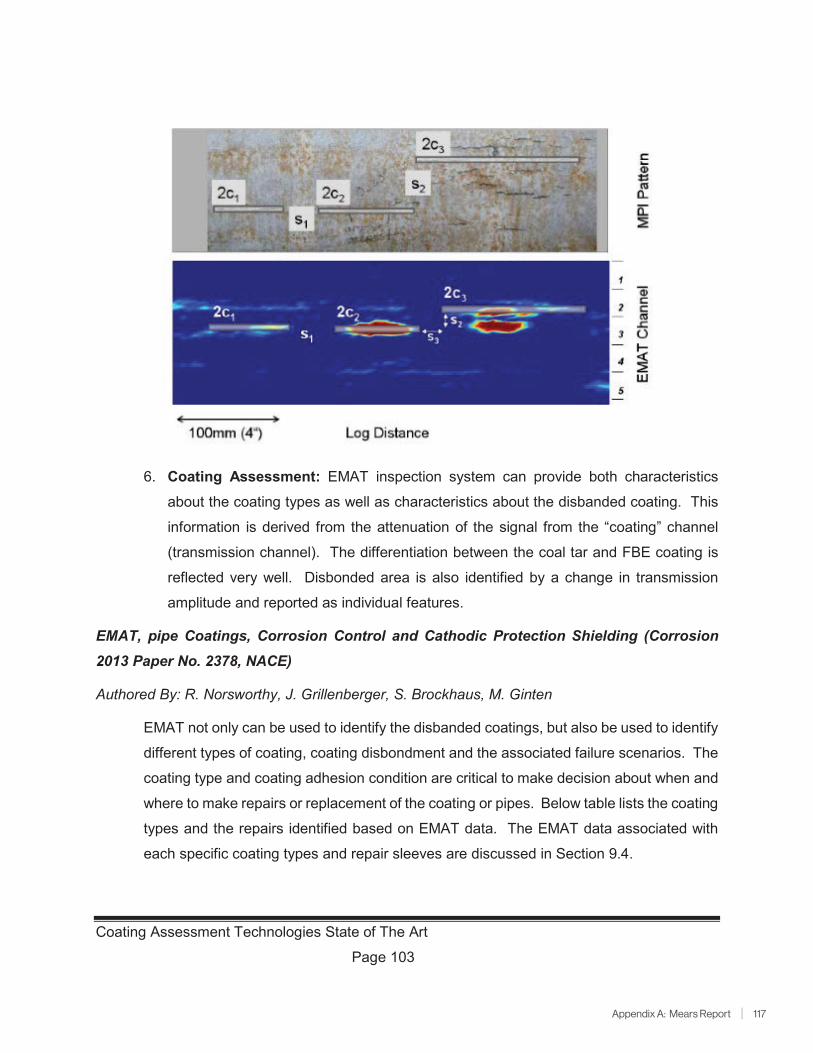
Appendix A: Mears Report | 117
Coating Assessment Technologies State of The Art
Page 103
6. Coating Assessment: EMAT inspection system can provide both characteristics
about the coating types as well as characteristics about the disbanded coating. This
information is derived from the attenuation of the signal from the “coating” channel
(transmission channel). The differentiation between the coal tar and FBE coating is
reflected very well. Disbonded area is also identified by a change in transmission
amplitude and reported as individual features.
EMAT, pipe Coatings, Corrosion Control and Cathodic Protection Shielding (Corrosion 2013 Paper No. 2378, NACE)
Authored By: R. Norsworthy, J. Grillenberger, S. Brockhaus, M. Ginten
EMAT not only can be used to identify the disbanded coatings, but also be used to identify
different types of coating, coating disbondment and the associated failure scenarios. The
coating type and coating adhesion condition are critical to make decision about when and
where to make repairs or replacement of the coating or pipes. Below table lists the coating
types and the repairs identified based on EMAT data. The EMAT data associated with
each specific coating types and repair sleeves are discussed in Section 9.4.

118 | Report to the State of Michigan—Evaluation of Technologies to Assess the Condition of Pipe Coating on Line 5
Coating Assessment Technologies State of The Art
Page 104
Validation of EMAT ILI Technology for Gas Pipeline Crack Inspection: A Case Study for 20”, (9th Pipeline Technology Conference, 2014)
Authored By: R. Kania, K. Myden, R. Weber, S. Klein
EMAT tool was selected to perform inspections on two 20 inches gas pipelines with the
length of 186.4 miles and 93.2 miles, respectively. Both pipes have been experienced with
SCC and corrosion history.
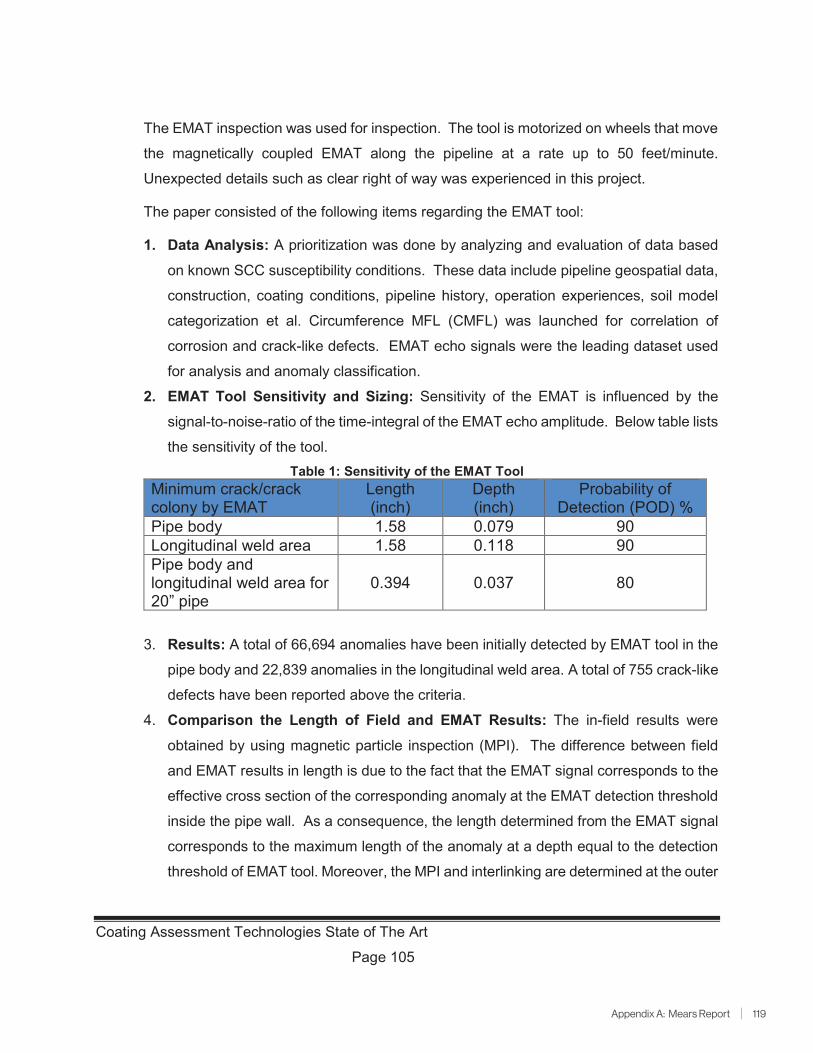
Appendix A: Mears Report | 119
Coating Assessment Technologies State of The Art
Page 105
The EMAT inspection was used for inspection. The tool is motorized on wheels that move
the magnetically coupled EMAT along the pipeline at a rate up to 50 feet/minute.
Unexpected details such as clear right of way was experienced in this project.
The paper consisted of the following items regarding the EMAT tool:
1. Data Analysis: A prioritization was done by analyzing and evaluation of data based
on known SCC susceptibility conditions. These data include pipeline geospatial data,
construction, coating conditions, pipeline history, operation experiences, soil model
categorization et al. Circumference MFL (CMFL) was launched for correlation of
corrosion and crack-like defects. EMAT echo signals were the leading dataset used
for analysis and anomaly classification.
2. EMAT Tool Sensitivity and Sizing: Sensitivity of the EMAT is influenced by the
signal-to-noise-ratio of the time-integral of the EMAT echo amplitude. Below table lists
the sensitivity of the tool.Table 1: Sensitivity of the EMAT Tool
Minimum crack/crack colony by EMAT
Length (inch)
Depth(inch)
Probability of Detection (POD) %
Pipe body 1.58 0.079 90Longitudinal weld area 1.58 0.118 90Pipe body and longitudinal weld area for 20” pipe
0.394 0.037 80
3. Results: A total of 66,694 anomalies have been initially detected by EMAT tool in the
pipe body and 22,839 anomalies in the longitudinal weld area. A total of 755 crack-like
defects have been reported above the criteria.
4. Comparison the Length of Field and EMAT Results: The in-field results were
obtained by using magnetic particle inspection (MPI). The difference between field
and EMAT results in length is due to the fact that the EMAT signal corresponds to the
effective cross section of the corresponding anomaly at the EMAT detection threshold
inside the pipe wall. As a consequence, the length determined from the EMAT signal
corresponds to the maximum length of the anomaly at a depth equal to the detection
threshold of EMAT tool. Moreover, the MPI and interlinking are determined at the outer

120 | Report to the State of Michigan—Evaluation of Technologies to Assess the Condition of Pipe Coating on Line 5
Coating Assessment Technologies State of The Art
Page 106
surface of the pipe wall. Consequently, underestimation of the EMAT length when
compared to the MPI or interlinked length is observed. The results are shown
below.Figure 34
5. Comparison the Depth of Field and EMAT Results: The boundary of specified
accuracy of 15% at 80% confidence is indicated by two dashed lines in the below
figure. 96% of the crack-like indications are within the tolerance.
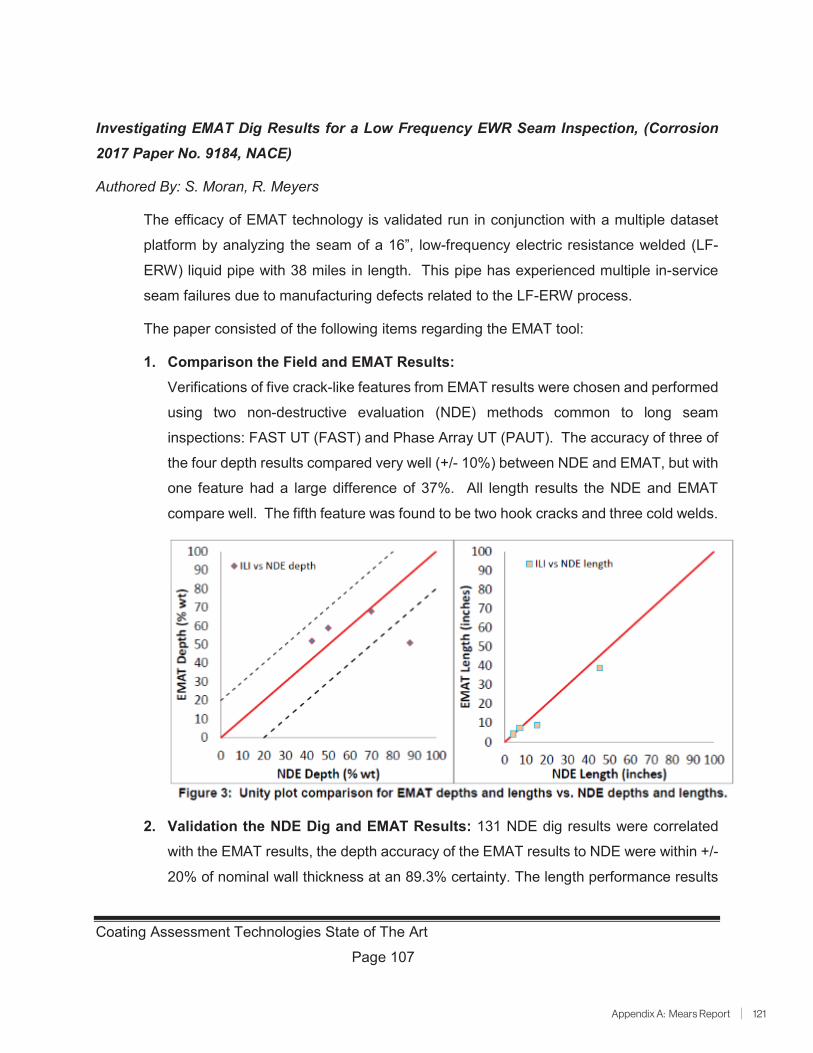
Appendix A: Mears Report | 121
Coating Assessment Technologies State of The Art
Page 107
Investigating EMAT Dig Results for a Low Frequency EWR Seam Inspection, (Corrosion 2017 Paper No. 9184, NACE)
Authored By: S. Moran, R. Meyers
The efficacy of EMAT technology is validated run in conjunction with a multiple dataset
platform by analyzing the seam of a 16”, low-frequency electric resistance welded (LF-
ERW) liquid pipe with 38 miles in length. This pipe has experienced multiple in-service
seam failures due to manufacturing defects related to the LF-ERW process.
The paper consisted of the following items regarding the EMAT tool:
1. Comparison the Field and EMAT Results:Verifications of five crack-like features from EMAT results were chosen and performed
using two non-destructive evaluation (NDE) methods common to long seam
inspections: FAST UT (FAST) and Phase Array UT (PAUT). The accuracy of three of
the four depth results compared very well (+/- 10%) between NDE and EMAT, but with
one feature had a large difference of 37%. All length results the NDE and EMAT
compare well. The fifth feature was found to be two hook cracks and three cold welds.
2. Validation the NDE Dig and EMAT Results: 131 NDE dig results were correlated
with the EMAT results, the depth accuracy of the EMAT results to NDE were within +/-
20% of nominal wall thickness at an 89.3% certainty. The length performance results

122 | Report to the State of Michigan—Evaluation of Technologies to Assess the Condition of Pipe Coating on Line 5
Coating Assessment Technologies State of The Art
Page 108
from all 131 EMAT features to NDE results did not indicate a positive correlation. The
divergence is from the difference in the detectable thresholds of ILI length vs. NDE
length as shown in below figure.
3. Correlation of ILI Results: Four ILI tools were chosen for the assessment the same
pipeline. Multiple Dataset (MDS), Circumferential Magnetic Flux Leakage (CMFL),
Ultrasonic Crack Detection (UTCD), and EMAT. A list the features types from each of
the four ILI technologies had various descriptions for crack-like defects. For
consistency, the feature types reported as crack-like defects are combined (crack-like
such as axial planar, linear indication, seam feature A and B). After combining these
features types, a total of 562 cracks were reported as shown in below figure. The
majority of the cracks were reported by EMAT.
The correlation of different ILI tools was also discussed by the author. A list of the
correlations was shown in the paper e.g. the number of reported cracks in one ILI tool
was common to the number of cracks reported to the other ILI tool.
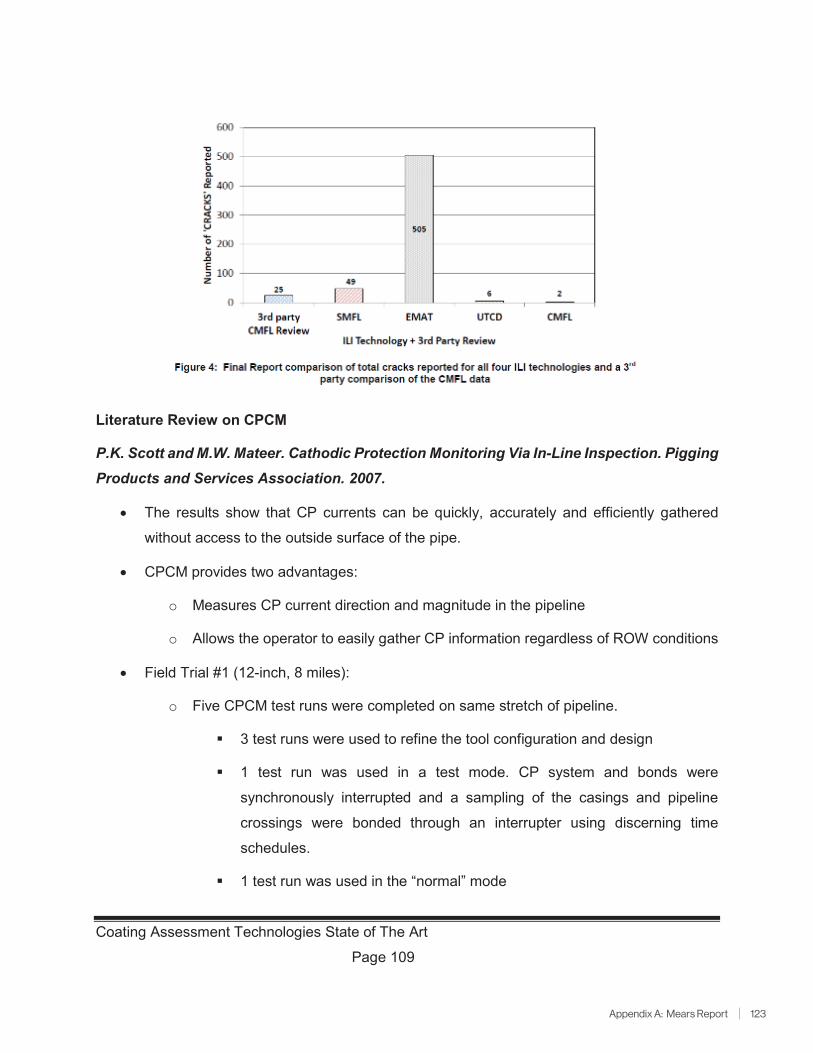
Appendix A: Mears Report | 123
Coating Assessment Technologies State of The Art
Page 109
Literature Review on CPCM
P.K. Scott and M.W. Mateer. Cathodic Protection Monitoring Via In-Line Inspection. Pigging Products and Services Association. 2007.
• The results show that CP currents can be quickly, accurately and efficiently gathered
without access to the outside surface of the pipe.
• CPCM provides two advantages:
o Measures CP current direction and magnitude in the pipeline
o Allows the operator to easily gather CP information regardless of ROW conditions
• Field Trial #1 (12-inch, 8 miles):
o Five CPCM test runs were completed on same stretch of pipeline.
3 test runs were used to refine the tool configuration and design
1 test run was used in a test mode. CP system and bonds were
synchronously interrupted and a sampling of the casings and pipeline
crossings were bonded through an interrupter using discerning time
schedules.
1 test run was used in the “normal” mode
124 | Report to the State of Michigan—Evaluation of Technologies to Assess the Condition of Pipe Coating on Line 5
Coating Assessment Technologies State of The Art
Page 110
o Pipe features complicated the analysis but offered valuable information.
Knowledge and experience were gained with respect to the effect of the physical
features such as wall thickness changes.
• Field Trial #2 (12-inch, mileage unknown)
o Crude pipeline with low potentials. CPCM tool was used to identify the locations of
shorted pipelines.
o Paraffin build-up prevented the collection of usable data
o Erratic voltage data indicated a lack of contact between the tool and pipe wall
• Pipe product cannot be conductive.
D.C. Janda. ILI tool enhances CP monitoring. Pipeline and Gas Technology. 2009
• This publication is more or less a copy of the paper referenced above by Scott and Mateer.
• In-line inspection tools are capable of reading and recording the magnitude and polarity
of current supplied by a CP system and has been tested in both crude oil and refined
product pipelines.
• CPCM Cathodic Protection In-Line Inspection Services provide for a reliable, cost-
effective, time-saving way to monitor, validate, or troubleshoot a pipeline’s CP system.
• CPCM tool measures CP current direction / magnitude, and allows the pipeline operator
to easily gather CP information regardless of ROW conditions.
• Interpretation of CPCM data continues to be refined. More work is needed to fully exploit
all the capabilities of the inspection tool and the resulting measurements.
• Two field trials: 24-inch, 34 miles and 12-inch, unknown mileage. Shorts were identified
and corrected in both field trials.

200, 425 – 1st Street S. W.Calgary, Alberta, Canada T2P 3L8
Telephone: 403-231-3900Facsimile: 403-231-3920Toll free: 800-481-2804
enbridge.com