Report to The LEGISLATIVE FINANCE COMMITTEE 062415 Item 2... · Representative Jimmie C. Hall, ......
108
Report to The LEGISLATIVE FINANCE COMMITTEE Human Services Department Centennial Care Waiver and Medicaid Managed Care Costs June 24, 2015 Report #15-08
Transcript of Report to The LEGISLATIVE FINANCE COMMITTEE 062415 Item 2... · Representative Jimmie C. Hall, ......
Report to
The LEGISLATIVE FINANCE COMMITTEE
Human Services Department Centennial Care Waiver and Medicaid Managed Care Costs
June 24, 2015
Report #15-08
LEGISLATIVE FINANCE COMMITTEE
Senator John Arthur Smith, Chairman Representative Jimmie C. Hall, Vice-Chairman
Representative Paul C. Bandy Senator Sue Wilson Beffort
Senator Pete Campos Senator Carlos R. Cisneros
Representative George Dodge Representative Jason C. Harper
Representative Larry A. Larrañaga Senator Carroll H. Leavell
Representative Patricia A. Lundstrom Senator Howie C. Morales Senator George K. Muñoz Senator Steven P. Neville
Representative Nick L. Salazar Representative Luciano “Lucky” Varela
DIRECTOR
David Abbey
DEPUTY DIRECTOR FOR PROGRAM EVALUATION
Charles Sallee
PROGRAM EVALUATION TEAM
Michelle Aubel, CGFM Jon R. Courtney, Ph.D.
Cody Cravens Nathan Eckberg, Esq. Jenny Felmley, Ph.D.
Brenda Fresquez, CICA Pamela Galbraith Maria D. Griego
Brian Hoffmeister Yann Lussiez, Ed.D.
Travis McIntyre, Ph.D. Rachel Mercer-Smith
Madelyn Serna Mármol, Ed.D. Shane Shariff, Intern
Table of Contents
Page No.
EXECUTIVE SUMMARY ..................................................................................................................... 5
BACKGROUND INFORMATION...................................................................................................... 11
FINDINGS AND RECOMMENDATIONS ......................................................................................... 18
Centennial Care is Estimated to Save $257 Million Over Five Years But Implementation of Cost Management Components Have Been Problematic ............................................................................ 18 A Lack Of Utilization Data From Centennial Care Limits New Mexico’s Ability To Determine If The Medicaid System is Adequate and Cost-Effective .............................................................................. 36 HSD Needs a More Uniform Strategy to Ensure Appropriately Low Capitation Rates to Maximize Limited Budget Dollars ....................................................................................................................... 58 More Detailed Information and Reporting Is Needed to Leverage Medicaid Savings And Increase the Legislature’s Ability To Budget At a Detailed Level .............................................. 67
AGENCY RESPONSES ........................................................................................................................ 74
APPENDIX A: EVALUATION SCOPE, OBJECTIVES, AND METHODOLOGY ..................... 89
APPENDIX B: GLOSSARY OF MEDICAID TERMS ..................................................................... 91
APPENDIX C: PAYMENT AND DELIVERY REFORM MODELS .............................................. 94
APPENDIX D: HEALTH CARE INNOVATION AWARDS IMPACTING NEW MEXICO ...... 97
APPENDIX E: CY14 BUDGET NEUTRALITY ANALYSIS ......................................................... 100
APPENDIX F: HUMAN SERVICES DEPARTMENT PERFORMANCE REPORT CARD Q3
FY15 ...................................................................................................................................................... 101
APPENDIX G: BEHAVIORAL HEALTH COLLABORATIVE PERFORMANCE REPORT
CARD Q3 FY15.................................................................................................................................... 103
APPENDIX H: HSD OVERSIGHT ON ACCESS TO CARE ........................................................ 106
APPENDIX I: APPROVED MCO PAYMENT REFORM PROJECTS ....................................... 108
Human Services Department Report #15-08 Centennial Care Waiver and Medicaid Managed Care Costs June 24, 2015
5
EXECUTIVE SUMMARY
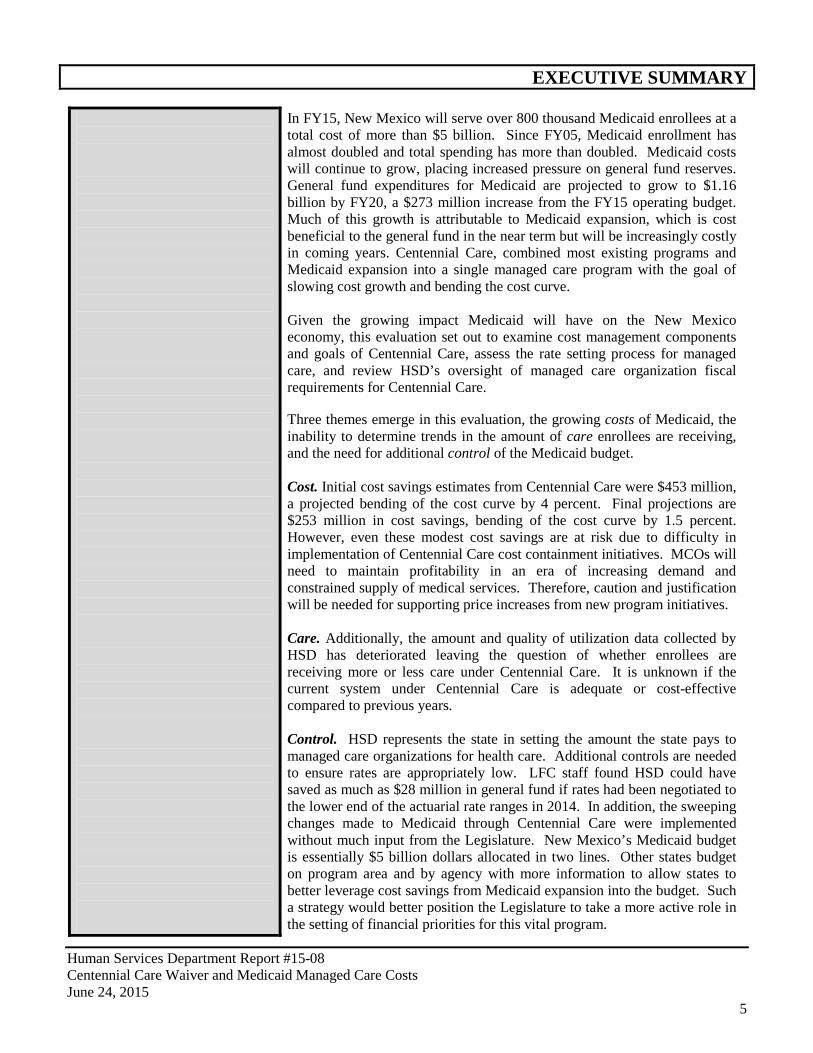
In FY15, New Mexico will serve over 800 thousand Medicaid enrollees at a total cost of more than $5 billion. Since FY05, Medicaid enrollment has almost doubled and total spending has more than doubled. Medicaid costs will continue to grow, placing increased pressure on general fund reserves. General fund expenditures for Medicaid are projected to grow to $1.16 billion by FY20, a $273 million increase from the FY15 operating budget. Much of this growth is attributable to Medicaid expansion, which is cost beneficial to the general fund in the near term but will be increasingly costly in coming years. Centennial Care, combined most existing programs and Medicaid expansion into a single managed care program with the goal of slowing cost growth and bending the cost curve. Given the growing impact Medicaid will have on the New Mexico economy, this evaluation set out to examine cost management components and goals of Centennial Care, assess the rate setting process for managed care, and review HSD’s oversight of managed care organization fiscal requirements for Centennial Care. Three themes emerge in this evaluation, the growing costs of Medicaid, the inability to determine trends in the amount of care enrollees are receiving, and the need for additional control of the Medicaid budget. Cost. Initial cost savings estimates from Centennial Care were $453 million, a projected bending of the cost curve by 4 percent. Final projections are $253 million in cost savings, bending of the cost curve by 1.5 percent. However, even these modest cost savings are at risk due to difficulty in implementation of Centennial Care cost containment initiatives. MCOs will need to maintain profitability in an era of increasing demand and constrained supply of medical services. Therefore, caution and justification will be needed for supporting price increases from new program initiatives. Care. Additionally, the amount and quality of utilization data collected by HSD has deteriorated leaving the question of whether enrollees are receiving more or less care under Centennial Care. It is unknown if the current system under Centennial Care is adequate or cost-effective compared to previous years. Control. HSD represents the state in setting the amount the state pays to managed care organizations for health care. Additional controls are needed to ensure rates are appropriately low. LFC staff found HSD could have saved as much as $28 million in general fund if rates had been negotiated to the lower end of the actuarial rate ranges in 2014. In addition, the sweeping changes made to Medicaid through Centennial Care were implemented without much input from the Legislature. New Mexico’s Medicaid budget is essentially $5 billion dollars allocated in two lines. Other states budget on program area and by agency with more information to allow states to better leverage cost savings from Medicaid expansion into the budget. Such a strategy would better position the Legislature to take a more active role in the setting of financial priorities for this vital program.
Human Services Department Report #15-08 Centennial Care Waiver and Medicaid Managed Care Costs June 24, 2015
6
As of January 2015, over 790 thousand New Mexicans were enrolled in Medicaid with over 622 thousand (79 percent) of these served by managed care.
Centennial Care’s goals include cost-effective care, slowing the rate of cost growth, and streamlining and modernizing the program.
KEY FINDINGS Centennial Care is estimated to save $257 million over five years but implementation of cost management components has been problematic. Centennial Care was approved under a federal demonstration waiver and includes components such as care coordination, designed to bend the cost curve of Medicaid spending. According to the Human Services Department (HSD), Centennial Care’s goals include cost-effective care, slowing the rate of cost growth, and streamlining and modernizing the program. MCOs spent $100 million on care coordination in CY14, but only completed 47 percent of care coordination tasks. Care coordination is the implementation of a comprehensive care management plan through appropriate linkages, referrals, coordination and follow-up to needed services and supports. HSD describes care coordination as fundamental to the comprehensive care system it wanted to create with Centennial Care, projecting it will save $31 million in total costs over five years. MCOs reported the main reason for not completing care coordination activities was an inability to reach clients. Additionally, care coordination costs were underestimated in the first year of Centennial Care by $66 million. HSD planned to deploy health homes as part of Centennial Care but delayed implementation to develop a comprehensive phased in approach. Health homes offer coordinated care to individuals with chronic health conditions. HSD projected health homes would reduce costs by $36.6 million over five years. However, HSD scaled back MCO performance metrics on health homes, eventually pausing initial implementation plans for health homes altogether. In CY14, HSD initiated the Centennial Rewards program at a cost of $19 million, with 47 thousand Medicaid enrollees participating at a cost of $400 per participant. The program rewards members for carrying out certain wellness activities (e.g. completing a health risk assessment) with points which they can then redeem for items. The participation rate was reported as 39 percent and the redemption rate as 8 percent for CY14. Evidence of the effectiveness of wellness programs is mixed. HSD originally incorporated various payment and service delivery reforms into Centennial Care, but has rolled back many of these initiatives. In original Centennial Care contracts, HSD required MCOs to incorporate several payment reform projects, but requirements have been reduced in subsequent contract amendments, instead asking MCOs to submit proposals for payment reform projects. Additionally, incentives to implement specific payment reform projects were removed from the contract. CMS is funding several innovation awards which could prove promising in terms of cost savings for New Mexico. For example, DOH received a $2 million innovation grant award from CMS to better integrate public, primary, and behavioral health care in New Mexico. Working in conjunction with HSD, DOH has conducted two summits related to better health care integration to improve outcomes and reduce costs.
$89
1
$91
2
$97
2
$1,
076
$1,
111
$1,
164
$0
$200
$400
$600
$800
$1,000
$1,200
$1,400
Projected General Fund Impact From
Medicaid FY15 to FY20 (in millions)
Source: LFC 2015 Post Session Review and May 2015 HSD Medicaid Projection
Human Services Department Report #15-08 Centennial Care Waiver and Medicaid Managed Care Costs June 24, 2015
7
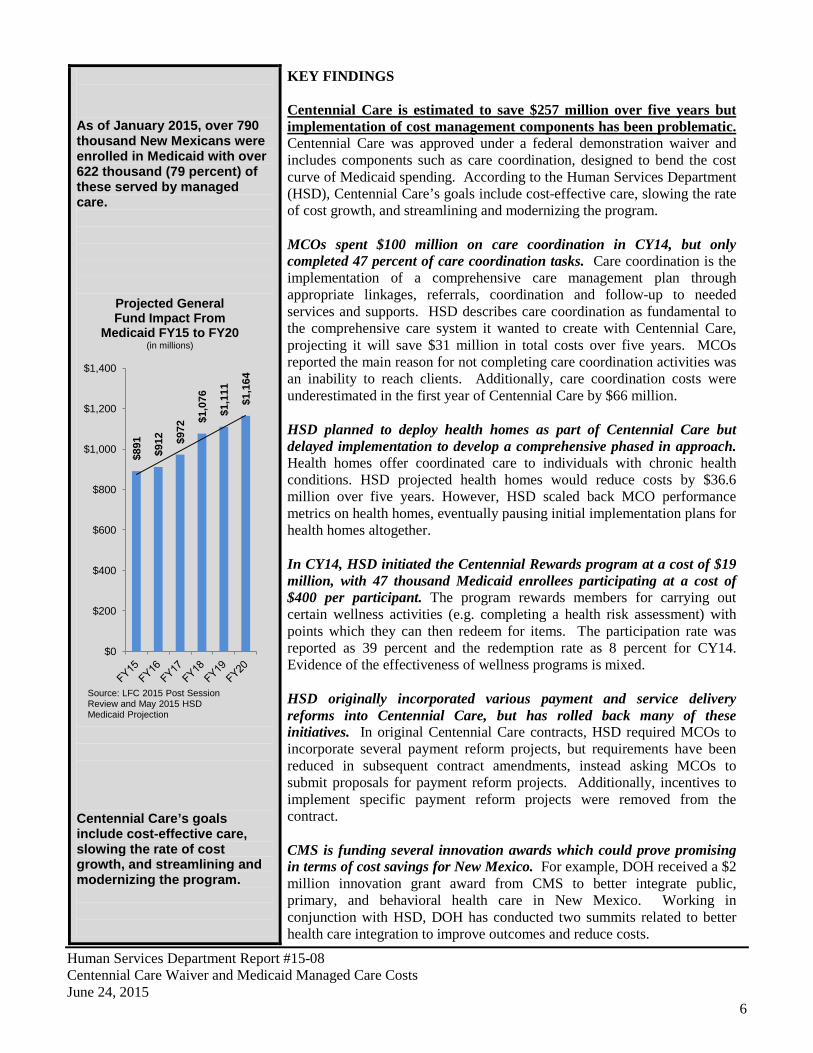
Collection of utilization data has been reduced from 27 categories to nine under Centennial Care.
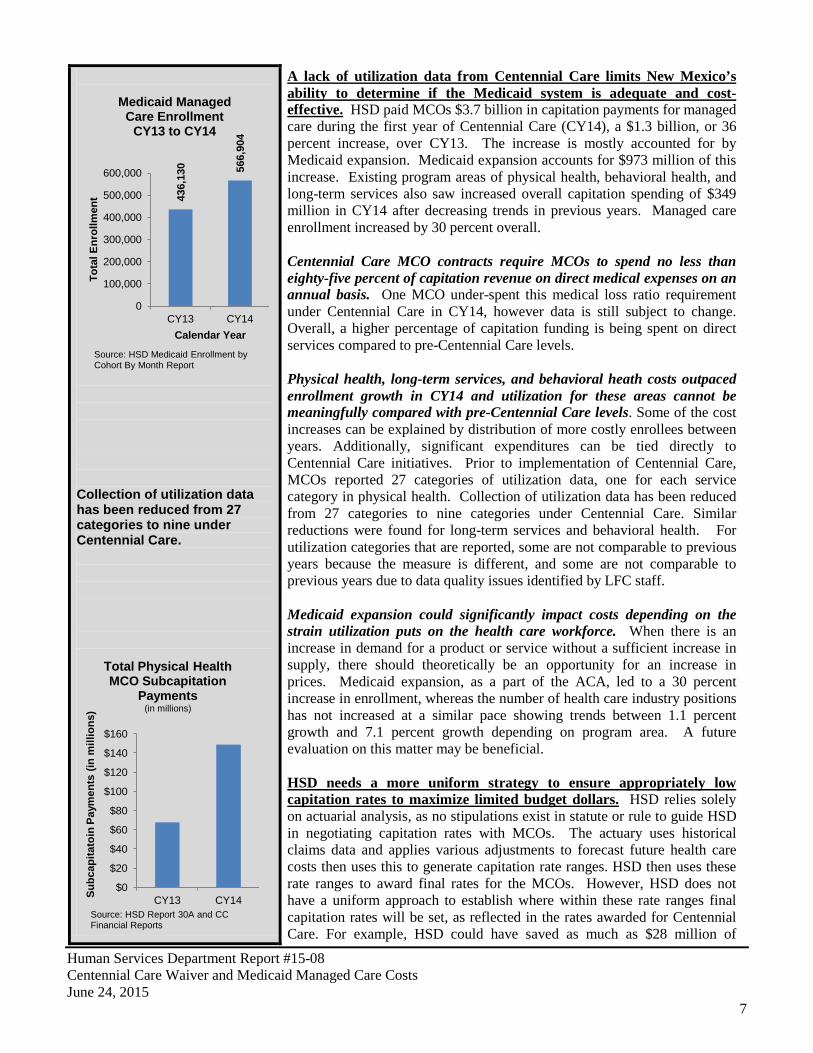
A lack of utilization data from Centennial Care limits New Mexico’s ability to determine if the Medicaid system is adequate and cost-effective. HSD paid MCOs $3.7 billion in capitation payments for managed care during the first year of Centennial Care (CY14), a $1.3 billion, or 36 percent increase, over CY13. The increase is mostly accounted for by Medicaid expansion. Medicaid expansion accounts for $973 million of this increase. Existing program areas of physical health, behavioral health, and long-term services also saw increased overall capitation spending of $349 million in CY14 after decreasing trends in previous years. Managed care enrollment increased by 30 percent overall. Centennial Care MCO contracts require MCOs to spend no less than eighty-five percent of capitation revenue on direct medical expenses on an annual basis. One MCO under-spent this medical loss ratio requirement under Centennial Care in CY14, however data is still subject to change. Overall, a higher percentage of capitation funding is being spent on direct services compared to pre-Centennial Care levels. Physical health, long-term services, and behavioral heath costs outpaced enrollment growth in CY14 and utilization for these areas cannot be meaningfully compared with pre-Centennial Care levels. Some of the cost increases can be explained by distribution of more costly enrollees between years. Additionally, significant expenditures can be tied directly to Centennial Care initiatives. Prior to implementation of Centennial Care, MCOs reported 27 categories of utilization data, one for each service category in physical health. Collection of utilization data has been reduced from 27 categories to nine categories under Centennial Care. Similar reductions were found for long-term services and behavioral health. For utilization categories that are reported, some are not comparable to previous years because the measure is different, and some are not comparable to previous years due to data quality issues identified by LFC staff. Medicaid expansion could significantly impact costs depending on the strain utilization puts on the health care workforce. When there is an increase in demand for a product or service without a sufficient increase in supply, there should theoretically be an opportunity for an increase in prices. Medicaid expansion, as a part of the ACA, led to a 30 percent increase in enrollment, whereas the number of health care industry positions has not increased at a similar pace showing trends between 1.1 percent growth and 7.1 percent growth depending on program area. A future evaluation on this matter may be beneficial. HSD needs a more uniform strategy to ensure appropriately low capitation rates to maximize limited budget dollars. HSD relies solely on actuarial analysis, as no stipulations exist in statute or rule to guide HSD in negotiating capitation rates with MCOs. The actuary uses historical claims data and applies various adjustments to forecast future health care costs then uses this to generate capitation rate ranges. HSD then uses these rate ranges to award final rates for the MCOs. However, HSD does not have a uniform approach to establish where within these rate ranges final capitation rates will be set, as reflected in the rates awarded for Centennial Care. For example, HSD could have saved as much as $28 million of
436,
130 56
6,90
4
0
100,000
200,000
300,000
400,000
500,000
600,000
CY13 CY14
Tota
l Enr
ollm
ent
Calendar Year
Medicaid Managed Care Enrollment
CY13 to CY14
Source: HSD Medicaid Enrollment by Cohort By Month Report
$0
$20
$40
$60
$80
$100
$120
$140
$160
CY13 CY14 Subc
apita
toin
Pay
men
ts (i
n m
illio
ns)
Total Physical Health MCO Subcapitation
Payments (in millions)
Source: HSD Report 30A and CC Financial Reports
Human Services Department Report #15-08 Centennial Care Waiver and Medicaid Managed Care Costs June 24, 2015
8
There are no guidelines in statute or rule to prohibit HSD from awarding capitation rates that fall outside the actuarially sound rate range approved by CMS. The cost of Hepatitis C treatment is approximately $92,169 per patient. MCO financial statements show differing profits from New Mexico Medicaid programs than data reported to HSD.
general fund in CY14 if it had paid rates on the lower end of the actuarially sound rate range. As the federal match rate for Medicaid expansion enrollees steps down starting in CY17, it will become critical for HSD to set rates to maximize limited state funding. No express regulations exist at the state level to ensure capitation rates do not exceed actuarially-established maximums. There are no guidelines in statute or rule to prohibit HSD from awarding capitation rates that fall outside the actuarially sound rate range approved by CMS. CMS states it will not approve rates higher than the actuarially sound rate range, and stated it expects Centennial Care capitation rates to fall within plus or minus five percent of the actuarial midpoint. However, a 2010 GAO report found that CMS was inconsistent in its oversight of state rate setting processes. Centennial Care program changes estimated to cost $589 million between CY14 and CY15 were not clearly spelled out in Medicaid cost projections or HSD’s budget requests. HSD’s actuary identified various program changes such as nursing facility price adjustments, Hepatitis C treatment, and rate increases for core service agencies, quantifying their impact on monthly capitation rates. However, HSD did not specifically call out these potential cost drivers in Medicaid projections or in their budget request for FY15 or FY16. In fact, actuarial rate adjustments for Medicaid program changes are developed well after HSD submits its budget request on an annual basis. For CY14, this means the actuary released rate ranges 15 months after HSD submitted its budget request for Medicaid. Inclusion of populations previously covered under the Medicaid fee-for-service program will reallocate $206 million to managed care over the first two years of Centennial Care. HSD’s actuary evaluated the impact of integrating developmentally disabled waiver participants, Mi Via waiver services, and breast and cervical cancer clients whose medical care had previously been managed as fee-for-service into Centennial Care. New Mexico’s Medicaid program has been generally profitable for MCOs in CY13 and CY14. According to annual revenue and expense reports MCOs submit to HSD, MCOs showed profits or losses between a loss of $2 million at Blue Cross Blue Shield to a profit of $15 million for United Healthcare for CY13. For CY14, the first year of Centennial Care, Blue Cross Blue Shield reported a loss of $27 million, while Presbyterian reported the highest profit at $27 million. However, there are disparities in what MCOs report to HSD and what appears in financial statements presented to shareholders. More detailed information and reporting is needed to leverage Medicaid savings and increase the Legislature’s ability to budget at a detailed level. Many states, including New Mexico, are realizing savings and revenue gains from Medicaid expansion. Some states identified over $300 million in savings generated by Medicaid expansion. Additionally, some states undergoing Medicaid expansions include projected savings into their agency budgets. For example, Kentucky proposed reducing general fund appropriations by $56 million across multiple departments for the next two fiscal years based on projected cost savings from Medicaid expansion.
Human Services Department Report #15-08 Centennial Care Waiver and Medicaid Managed Care Costs June 24, 2015
9
In the SFY16 GAA, $5.5 billion was appropriated to the Medicaid program in two line items.
The current budgeting process limits legislative visibility and oversight of the $5 billion Medicaid program. Currently, Medicaid is budgeted and appropriated under two line items: physical health and behavioral health. As a result, the legislature is unable to make specific appropriations to different components of the Medicaid program, and is also unable to see the impact of specific programmatic changes. This budgeting process is far more detailed in other states where appropriations are broken down into specific sub-categories, which increases budget transparency for lawmakers. Under Centennial Care, some MCO reporting to HSD has been discontinued, transitioned from contractual requirement to a requirement in the MCO policy manual, or put on hold, and utilization reporting is weakened. HSD provided LFC with a matrix of reports listing six reports as being “on hold”. Examples of reports on hold include a quarterly member care coordination activities report, a monthly payment reform pilot project update report, and a quarterly health homes report. Service utilization reporting has been weakened under Centennial Care and data quality appears to be an issue. KEY RECOMMENDATIONS The Legislature should consider:
• Budgeting Medicaid to program area level (physical health, behavioral health, long term services, Medicaid expansion), and requiring reporting on Medicaid spending through other state agencies including CYFD, DOH, etc. along with appropriate performance measures for each part of Medicaid;
• Requiring HSD to include, as a part of its budget proposal, approved rates and rate ranges for the upcoming budget year; and
• Amending statute to require HSD to develop a Centennial Care performance report card inclusive of cost savings measures, quality performance measures, and clinical outcome measures.
The Human Services Department should:
• Examine whether the 85/15 medical loss ratio requirement is appropriate as efficiencies are gained and economies of scale continue to grow under Centennial Care;
• Contractually require MCOs to report utilization data for each cohort and program area as reported prior to Centennial Care;
• Amend MCO contracts to require sub-capitation agreements to be submitted and approved by HSD;
• Focus rate setting to the lower bound estimate of the actuarial sound rate range;
• Incorporate profit margin analysis into rate setting process on an annual basis;
• Continue working with LFC and DFA to develop a regular reporting format for Medicaid managed care as part of regular projection meetings. Reports should provide, at a minimum, up-to-date cohort level data on enrollment and average PMPM spending
Human Services Department Report #15-08 Centennial Care Waiver and Medicaid Managed Care Costs June 24, 2015
10
compared to beginning of the year projections. HSD should also include projections by major program;
• Include actuarial analysis in budgeting and forecasting process and provide line item detail for key program changes within the Medicaid program; and
• Incentivize lower rates by awarding MCOs with enrollees (who do not select an MCO) based on rates.
Human Services Department Report #15-08 Centennial Care Waiver and Medicaid Managed Care Costs June 24, 2015
11
BACKGROUND INFORMATION MEDICAID AT A GLANCE Medicaid is a federal-state funded program for financing health care services for eligible persons based on financial need and/or health status. Medicaid was enacted in 1965 as an optional program for states authorized by Title XIX of the Social Security Act. It was created to provide health insurance for low-income families with dependent children, families receiving welfare, and elderly, blind, or disabled individuals. Currently every state has Medicaid programs in place. Since the start of Medicaid, Congress expanded the program considerably to include other low-income adults, pregnant women, and children. There has also been expansion in the amount and types of services offered to Medicaid recipients. States have the option to administer their own programs and are held responsible for determining aspects such as the eligibility criteria of applicants, the scope of health services to cover, setting provider reimbursement rates, processing claims, and paying a portion of the total program.
Title XIX of the Social Security Act specifies which groups of people must be eligible under Medicaid, but states have the flexibility to extend coverage to additional groups. To receive federal funding, states must cover certain “mandatory” populations:
• children under age 6 in families with income below 133 percent of the federal poverty level; • children aged 6-18 in families with income below the poverty line; • pregnant women with income below 133 percent of the poverty line; • parents whose income is within the state’s eligibility limit for cash assistance that was in place prior to
welfare reform; and • most seniors and persons with disabilities who receive cash assistance through the federal Supplemental
Security Income (SSI) program.
States may also receive federal Medicaid funds for the costs of covering additional, “optional” populations, including: pregnant women, children, and parents with income above “mandatory” coverage income limits; seniors and persons with disabilities with income below the poverty line; and “medically needy” people — those whose income exceeds the state’s regular Medicaid eligibility limit but who have high medical expenses (such as for nursing home care) that reduce their disposable income below the eligibility limit. The states base their decisions on factors such as income level, financial resources, age, disability status, other government assistance, and other health or medical conditions.
Under the Affordable Care Act (ACA), states have the option to expand Medicaid to include all persons meeting an income requirement of 138 percent of the federal poverty level, or an annual salary of $16,105 for a single person household (based on 2014 levels). Under the ACA, new enrollees are subsidized by the federal government at 100 percent through calendar year 2016, with the subsidy percentage incrementally stepping down to 90 percent in calendar year 2020. New Mexico chose to expand Medicaid and expansion enrollees started receiving coverage as of January 1, 2014. According to the May 2015 HSD Medicaid projection, as of June 2014, 154 thousand people enrolled with a projected increase to 222 thousand by June 2015 as a result of Medicaid expansion.

Human Services Department Report #15-08 Centennial Care Waiver and Medicaid Managed Care Costs June 24, 2015
12
FAST FACTS Population enrolled: As of January 2015, over 790 thousand New Mexicans were enrolled in Medicaid with over 622 thousand (79 percent) of these served by managed care. Funding: The total spending for Medicaid managed care in state fiscal year (SFY) 14 was $3 billion, grew to $4.1 billion in SFY15, and is projected to reach $4.5 billion by SFY16. Providers: There are currently four managed care organizations in New Mexico providing services for all managed care Medicaid recipients related to physical health, behavioral health, and long-term services: Blue Cross Blue Shield of New Mexico, Molina Healthcare, Presbyterian Health Plan, and United Healthcare (effective January 2014). Note that not all individuals enrolled in Medicaid are enrolled in managed care. MAJOR EVENTS IN THE MEDICAID SYSTEM
1965 The United States Congress passed Medicaid Title XVII and Medicare Title XIX as components of the Social Security Act to provide health insurance for families receiving welfare.
1967 The Early and Periodic Screening, Diagnostic, and Treatment (EPSDT) comprehensive health services benefit for all Medicaid children under age 21 was established.
1973 New Mexico implements Medicaid with the passage of the ‘Public Assistance Act,’ later known as Medicaid.
1977 Health Care Financing Administration (HCFA) assumed control over federal Medicaid and Medicare programs.
1981 Freedom of choice waivers (1915b) and home and community-based care waivers (1915c) were mandated. States were required to pay additional payments to hospitals treating a disproportionate share of low-income patients (called disproportionate share hospitals or "DSH").
1988 Requirement established making Medicaid coverage mandatory for uninsured pregnant women 1990 Medicaid for children age 6-18 phased in. Also the Medicaid prescription drug rebate program was
enacted. 1994 Legislature requires managed care for most Medicaid recipients. 1997 Federal government encourages expansion of managed care by making waivers more easily
accessible. Congress authorizes State Children’s Health Insurance Program (SCHIP). 1997 New Mexico implements managed care. 2001 HCFA renamed Centers for Medicare and Medicaid Services (CMS). 2005 New Mexico behavioral health services carved out into a separate managed care contract. 2008 A fourth managed care organization, Blue Cross Blue Shield, is added. Coordinated Long-Term Care
Services (CoLTS) managed care program begins. 2012 HSD submits an 1115 Medicaid demonstration waiver application to the Centers for Medicare
and Medicaid Services. The New Mexico plan is called Centennial Care. 2013 The Federal government approves New Mexico’s Medicaid Waiver proposal. Governor Martinez
announces New Mexico will expand access to Medicaid for up to 170 thousand eligible New Mexicans under the Patient Protection and Affordable Care Act.
2014 Centennial Care integrates physical and behavioral health and HSD selects four MCOs to manage state general and federal grant funds. This change coincided with Medicaid expansion and the establishment of the New Mexico Health Insurance Exchange.
Human Services Department Report #15-08 Centennial Care Waiver and Medicaid Managed Care Costs June 24, 2015
13
Managed Care. Managed care is a health care delivery system in which managed care organizations (MCOs) accept a set per-member-per-month (PMPM) capitation payment for services. In theory, by contracting with MCOs states can reduce Medicaid program costs and better manage utilization of health services compared to a fee-for-service approach where providers are paid for each service delivered. The Balanced Budget Act of 1997 (BBA) gave states new authority to require certain Medicaid beneficiaries to enroll in managed care plans and also required the establishment of consumer protections for Medicaid managed care enrollees in areas such as access to quality care. Under managed care, doctors, hospitals, and other providers are organized into groups in order to enhance the quality and cost-effectiveness of health care. According to the May 2015 HSD Medicaid projection, in SFY15, about 79 percent of the Medicaid budget is allocated toward managed care while 21 percent is allocated to fee-for-service and other programming including disproportionate share hospitals, graduate and indirect medical education, Medicare buy-ins and others.
State law authorizes the Human Services Department to provide a statewide managed care system to offer cost-efficient preventative primary and acute care for Medicaid recipients (Section 27-12-12.6 NMSA 1978). The managed care system “shall ensure:
• access to medically necessary services, particularly for Medicaid recipients with chronic health problems; • to the extent practicable, maintenance of the rural primary care delivery infrastructure; • that the department’s approach is consistent with national and state health care reform principles; and • to the maximum extent possible that Medicaid-eligible individuals are not identified as such except as
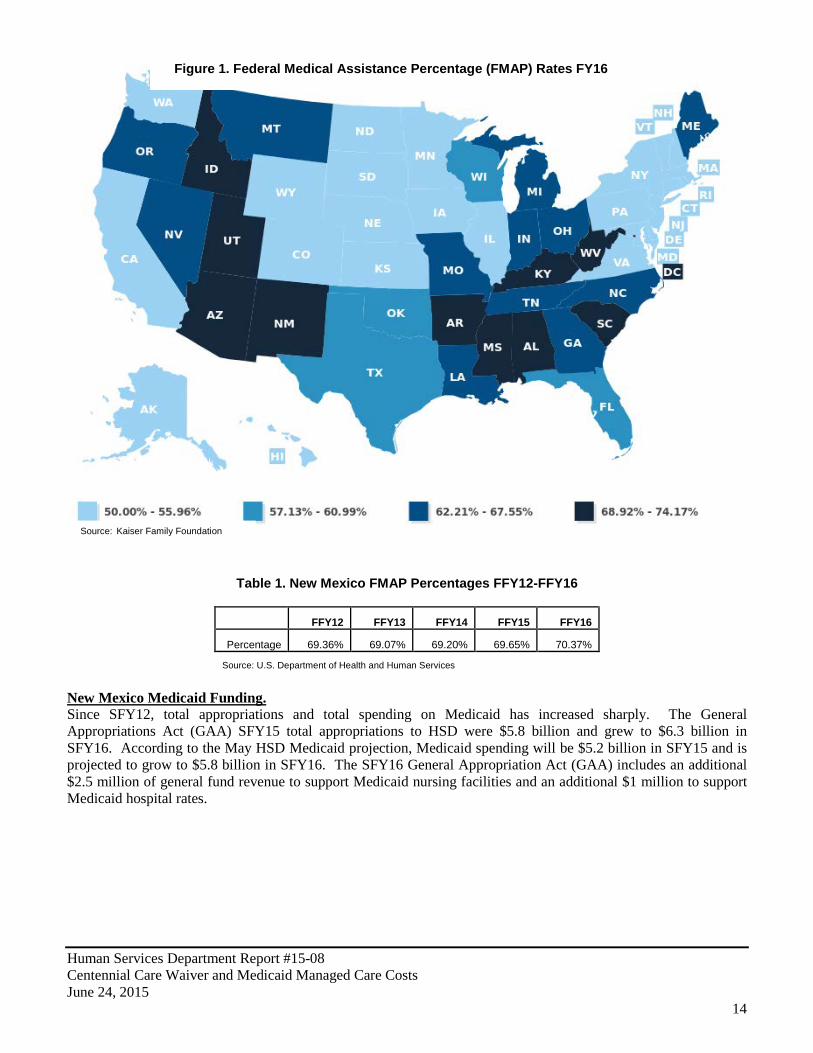
necessary for billing purposes (Section 27-12-12.6 NMSA 1978).” In SFY 1998, New Mexico moved its Medicaid program towards a managed care plan in an effort to improve the health status of recipients and to stabilize and lower costs. New Mexico instituted mandatory managed care for most Medicaid recipients. Exceptions included individuals needing long term care, home and community based services, and partial benefit individuals, those also receiving Medicare, and Native Americans (who, by federal law, may choose whether or not to enroll in managed care). Medicaid managed care attempts to appropriate health care services in a cost-efficient manner by paying managed care organizations to manage and arrange for all covered health care services for enrollees. However, because managed care organizations are paid a fixed amount per member per month regardless of the number of services they provide, Medicaid enrolled members utilized, safeguards are required for managed care programs to minimize incentive for some plans to under-serve enrollees, such as limiting enrollees’ access to care. Access is also affected by other factors, such as physician location and willingness to participate in managed care plans. Safeguards to ensure enrollees have access to care could include requiring plans to maintain provider networks that provide enrollees with sufficient geographic access to providers or requiring managed care plans to develop and monitor certain quality indicators, such as HEDIS performance measures, enrollee satisfaction or grievances (Appendix H). Medicaid Funding. The funding for the Medicaid program is split between the federal government and the state. States pay providers or managed care organizations for costs and then report these payments to the Centers for Medicare and Medicaid Services (CMS). Under Medicaid Title XIX, the federal government contributes at least one dollar in matching funds for every dollar a state spends on its Medicaid program, whatever those costs may be. The portion of Medicaid the federal government pays differs from state to state and the percentage, known as the Federal Medical Assistance Percentage (FMAP), is based on a statutory formula that takes into account each state’s per capita income with some adjustments. Poorer states receive larger federal amounts for each dollar they spend. In federal fiscal year (FFY) 2015, the federal government pays 73.58 percent of all Medicaid service costs; the national average is about 57 percent. New Mexico’s current FMAP (FFY15) is 69.65 percent, among the highest in the nation. Note that FMAP is one of several Federal Financial Participation (FFP) rates for the Medicaid program. Other FFPs also exist including an enhanced FMAP for the Title XXI Children’s Health Insurance Program (CHIP), a 100 percent FFP for Indian Health Services (IHS), and a 90 percent FFP for family planning services. Medicaid expansion also created a new FFP for this newly covered population starting at 100 percent through CY16 and phasing down to 90 percent in CY20.
Human Services Department Report #15-08 Centennial Care Waiver and Medicaid Managed Care Costs June 24, 2015
14
Table 1. New Mexico FMAP Percentages FFY12-FFY16
FFY12 FFY13 FFY14 FFY15 FFY16
Percentage 69.36% 69.07% 69.20% 69.65% 70.37%
Source: U.S. Department of Health and Human Services
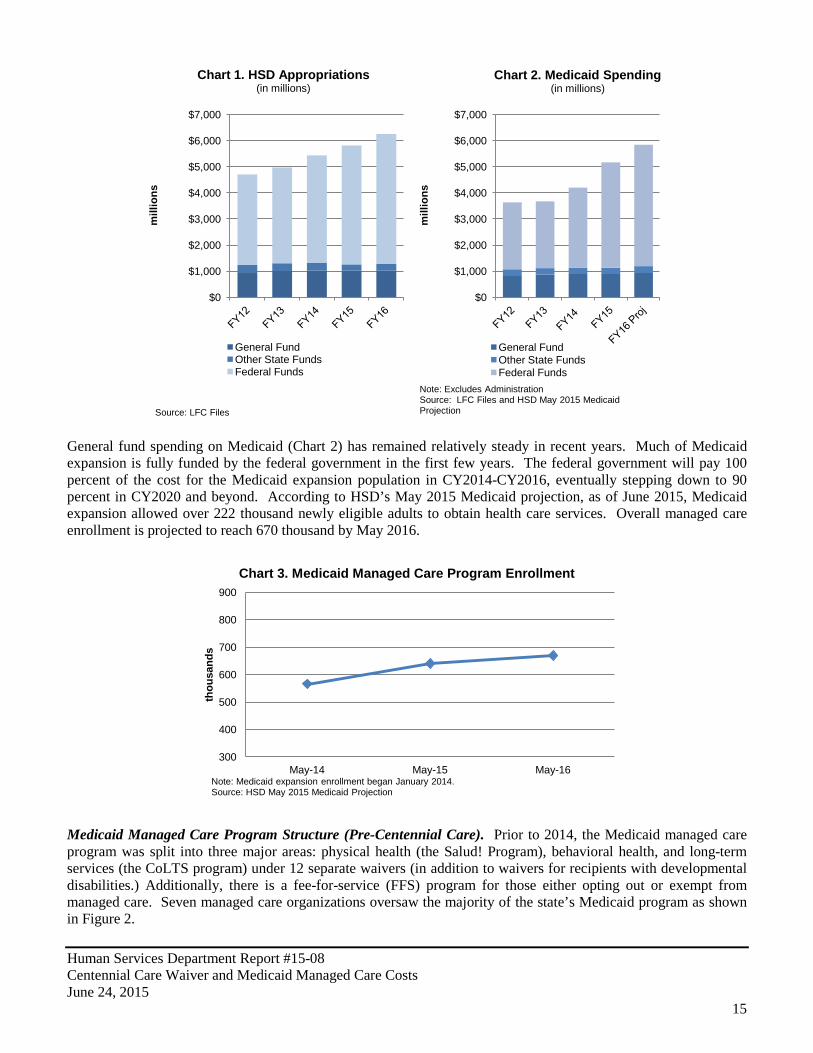
New Mexico Medicaid Funding. Since SFY12, total appropriations and total spending on Medicaid has increased sharply. The General Appropriations Act (GAA) SFY15 total appropriations to HSD were $5.8 billion and grew to $6.3 billion in SFY16. According to the May HSD Medicaid projection, Medicaid spending will be $5.2 billion in SFY15 and is projected to grow to $5.8 billion in SFY16. The SFY16 General Appropriation Act (GAA) includes an additional $2.5 million of general fund revenue to support Medicaid nursing facilities and an additional $1 million to support Medicaid hospital rates.
Figure 1. Federal Medical Assistance Percentage (FMAP) Rates FY16
Source: Kaiser Family Foundation
Human Services Department Report #15-08 Centennial Care Waiver and Medicaid Managed Care Costs June 24, 2015
15
General fund spending on Medicaid (Chart 2) has remained relatively steady in recent years. Much of Medicaid expansion is fully funded by the federal government in the first few years. The federal government will pay 100 percent of the cost for the Medicaid expansion population in CY2014-CY2016, eventually stepping down to 90 percent in CY2020 and beyond. According to HSD’s May 2015 Medicaid projection, as of June 2015, Medicaid expansion allowed over 222 thousand newly eligible adults to obtain health care services. Overall managed care enrollment is projected to reach 670 thousand by May 2016.
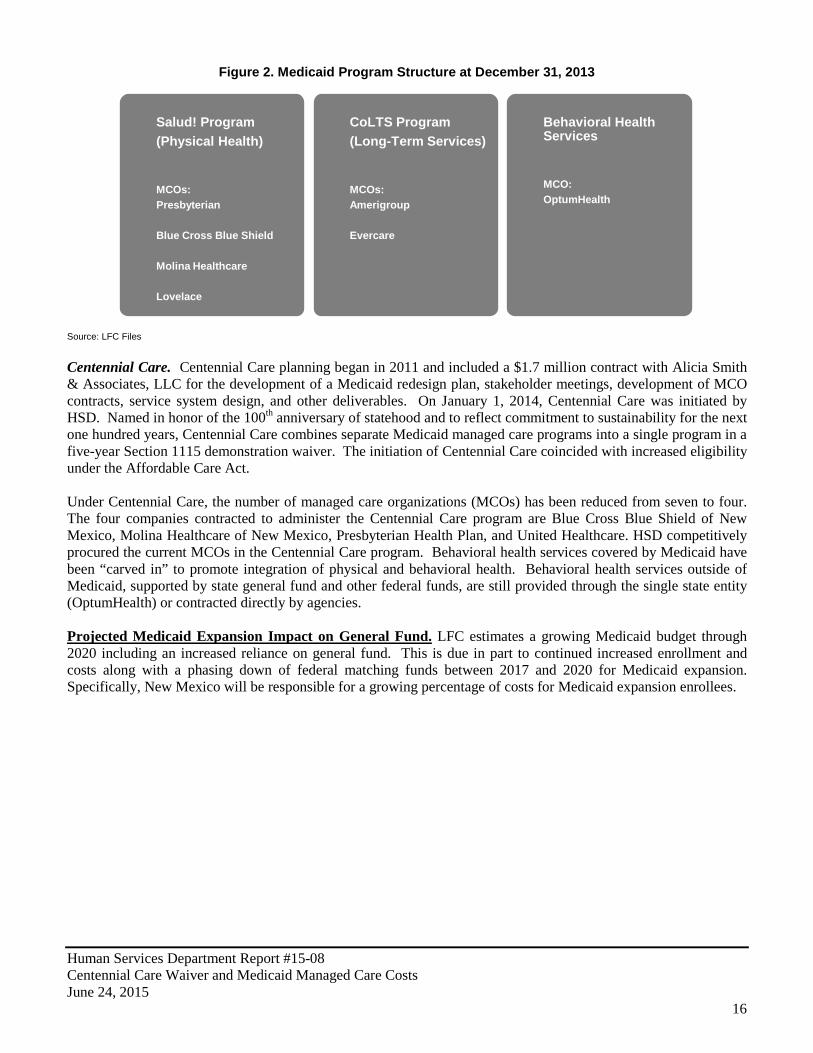
Medicaid Managed Care Program Structure (Pre-Centennial Care). Prior to 2014, the Medicaid managed care program was split into three major areas: physical health (the Salud! Program), behavioral health, and long-term services (the CoLTS program) under 12 separate waivers (in addition to waivers for recipients with developmental disabilities.) Additionally, there is a fee-for-service (FFS) program for those either opting out or exempt from managed care. Seven managed care organizations oversaw the majority of the state’s Medicaid program as shown in Figure 2.
$0
$1,000
$2,000
$3,000
$4,000
$5,000
$6,000
$7,000
mill
ions
Chart 1. HSD Appropriations (in millions)
General Fund Other State Funds Federal Funds
Source: LFC Files
$0
$1,000
$2,000
$3,000
$4,000
$5,000
$6,000
$7,000
mill
ions
Chart 2. Medicaid Spending (in millions)
General Fund Other State Funds Federal Funds
Note: Excludes Administration Source: LFC Files and HSD May 2015 Medicaid Projection
300
400
500
600
700
800
900
May-14 May-15 May-16
thou
sand
s
Chart 3. Medicaid Managed Care Program Enrollment
Note: Medicaid expansion enrollment began January 2014. Source: HSD May 2015 Medicaid Projection
Human Services Department Report #15-08 Centennial Care Waiver and Medicaid Managed Care Costs June 24, 2015
16
Figure 2. Medicaid Program Structure at December 31, 2013
Source: LFC Files Centennial Care. Centennial Care planning began in 2011 and included a $1.7 million contract with Alicia Smith & Associates, LLC for the development of a Medicaid redesign plan, stakeholder meetings, development of MCO contracts, service system design, and other deliverables. On January 1, 2014, Centennial Care was initiated by HSD. Named in honor of the 100th anniversary of statehood and to reflect commitment to sustainability for the next one hundred years, Centennial Care combines separate Medicaid managed care programs into a single program in a five-year Section 1115 demonstration waiver. The initiation of Centennial Care coincided with increased eligibility under the Affordable Care Act. Under Centennial Care, the number of managed care organizations (MCOs) has been reduced from seven to four. The four companies contracted to administer the Centennial Care program are Blue Cross Blue Shield of New Mexico, Molina Healthcare of New Mexico, Presbyterian Health Plan, and United Healthcare. HSD competitively procured the current MCOs in the Centennial Care program. Behavioral health services covered by Medicaid have been “carved in” to promote integration of physical and behavioral health. Behavioral health services outside of Medicaid, supported by state general fund and other federal funds, are still provided through the single state entity (OptumHealth) or contracted directly by agencies. Projected Medicaid Expansion Impact on General Fund. LFC estimates a growing Medicaid budget through 2020 including an increased reliance on general fund. This is due in part to continued increased enrollment and costs along with a phasing down of federal matching funds between 2017 and 2020 for Medicaid expansion. Specifically, New Mexico will be responsible for a growing percentage of costs for Medicaid expansion enrollees.
Salud! Program (Physical Health) MCOs: Presbyterian Blue Cross Blue Shield Molina Healthcare Lovelace
CoLTS Program (Long-Term Services) MCOs: Amerigroup Evercare
Behavioral Health Services MCO: OptumHealth
Human Services Department Report #15-08 Centennial Care Waiver and Medicaid Managed Care Costs June 24, 2015
17
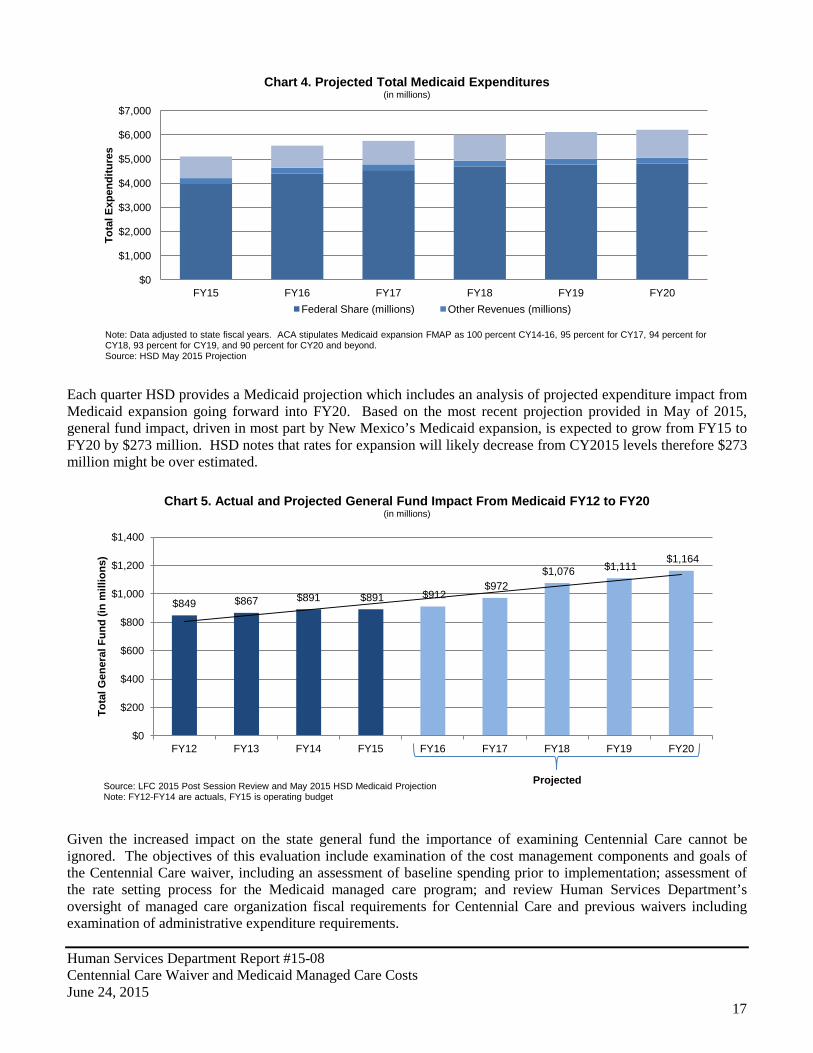
Each quarter HSD provides a Medicaid projection which includes an analysis of projected expenditure impact from Medicaid expansion going forward into FY20. Based on the most recent projection provided in May of 2015, general fund impact, driven in most part by New Mexico’s Medicaid expansion, is expected to grow from FY15 to FY20 by $273 million. HSD notes that rates for expansion will likely decrease from CY2015 levels therefore $273 million might be over estimated.
Given the increased impact on the state general fund the importance of examining Centennial Care cannot be ignored. The objectives of this evaluation include examination of the cost management components and goals of the Centennial Care waiver, including an assessment of baseline spending prior to implementation; assessment of the rate setting process for the Medicaid managed care program; and review Human Services Department’s oversight of managed care organization fiscal requirements for Centennial Care and previous waivers including examination of administrative expenditure requirements.
$0
$1,000
$2,000
$3,000
$4,000
$5,000
$6,000
$7,000
FY15 FY16 FY17 FY18 FY19 FY20
Tota
l Exp
endi
ture
s
Chart 4. Projected Total Medicaid Expenditures (in millions)
Federal Share (millions) Other Revenues (millions)
Note: Data adjusted to state fiscal years. ACA stipulates Medicaid expansion FMAP as 100 percent CY14-16, 95 percent for CY17, 94 percent for CY18, 93 percent for CY19, and 90 percent for CY20 and beyond. Source: HSD May 2015 Projection
$849 $867 $891 $891 $912 $972
$1,076 $1,111 $1,164
$0
$200
$400
$600
$800
$1,000
$1,200
$1,400
FY12 FY13 FY14 FY15 FY16 FY17 FY18 FY19 FY20
Tota
l Gen
eral
Fun
d (in
mill
ions
)
Chart 5. Actual and Projected General Fund Impact From Medicaid FY12 to FY20 (in millions)
Source: LFC 2015 Post Session Review and May 2015 HSD Medicaid Projection Note: FY12-FY14 are actuals, FY15 is operating budget
Projected
Human Services Department Report #15-08 Centennial Care Waiver and Medicaid Managed Care Costs June 24, 2015
18
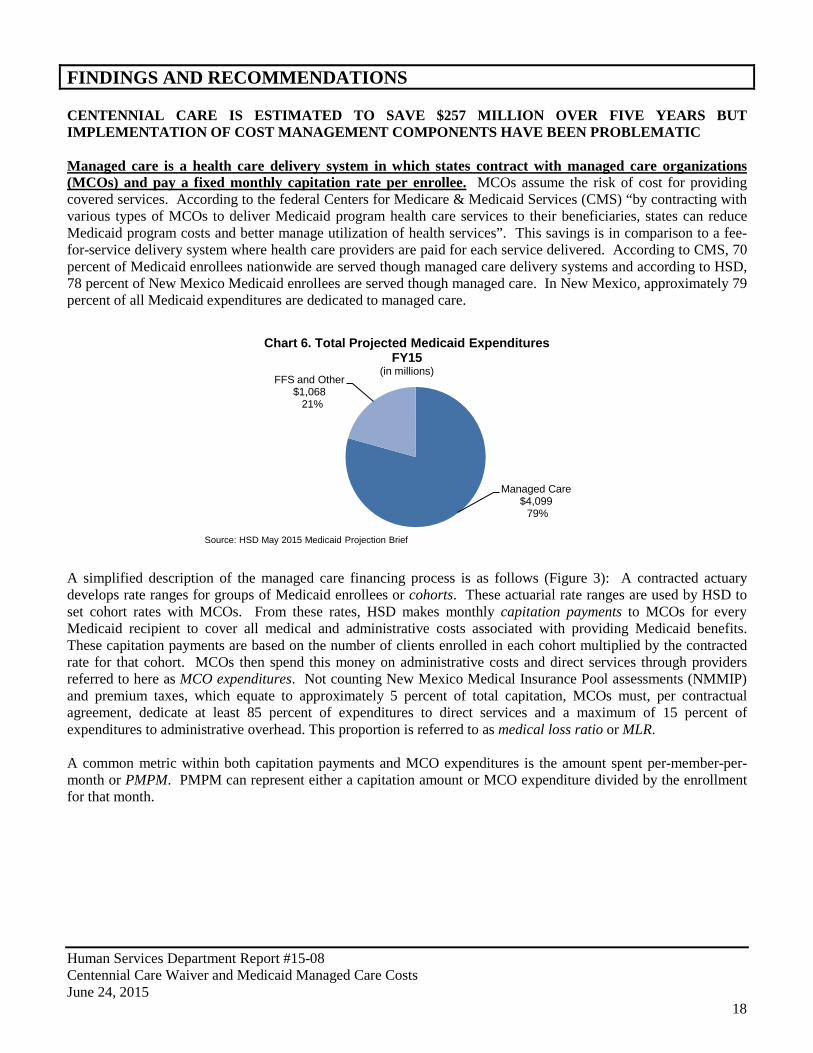
FINDINGS AND RECOMMENDATIONS CENTENNIAL CARE IS ESTIMATED TO SAVE $257 MILLION OVER FIVE YEARS BUT IMPLEMENTATION OF COST MANAGEMENT COMPONENTS HAVE BEEN PROBLEMATIC Managed care is a health care delivery system in which states contract with managed care organizations (MCOs) and pay a fixed monthly capitation rate per enrollee. MCOs assume the risk of cost for providing covered services. According to the federal Centers for Medicare & Medicaid Services (CMS) “by contracting with various types of MCOs to deliver Medicaid program health care services to their beneficiaries, states can reduce Medicaid program costs and better manage utilization of health services”. This savings is in comparison to a fee-for-service delivery system where health care providers are paid for each service delivered. According to CMS, 70 percent of Medicaid enrollees nationwide are served though managed care delivery systems and according to HSD, 78 percent of New Mexico Medicaid enrollees are served though managed care. In New Mexico, approximately 79 percent of all Medicaid expenditures are dedicated to managed care.
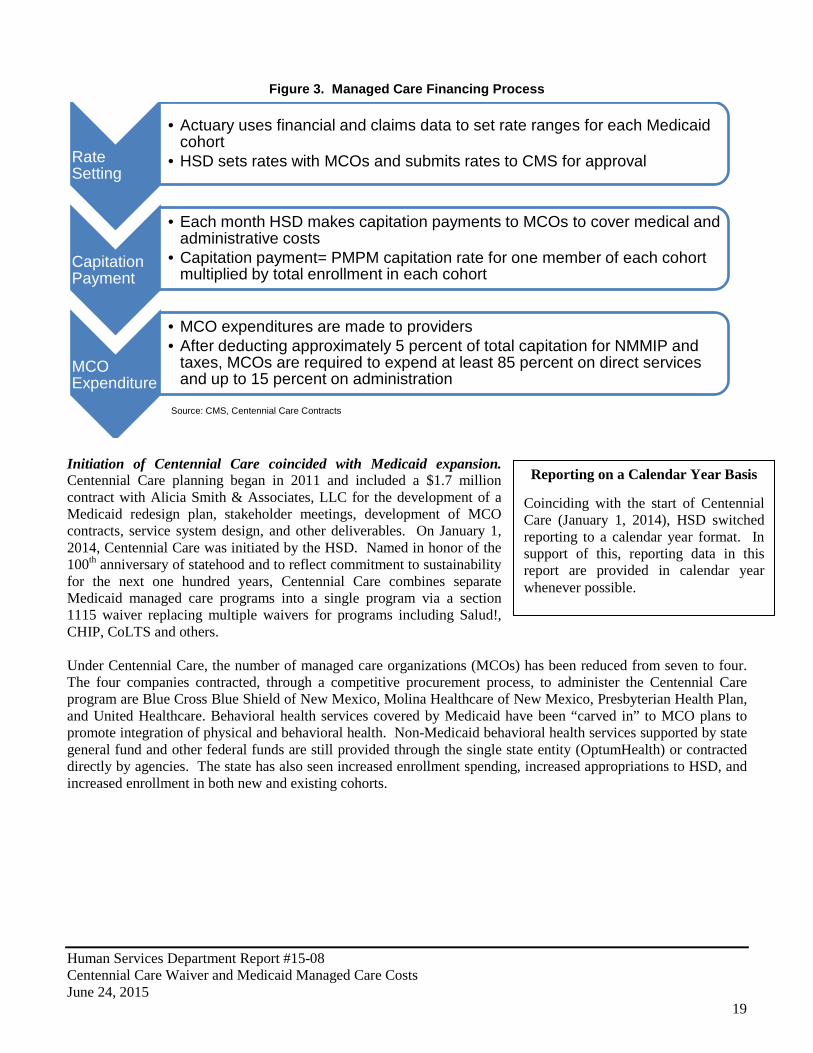
A simplified description of the managed care financing process is as follows (Figure 3): A contracted actuary develops rate ranges for groups of Medicaid enrollees or cohorts. These actuarial rate ranges are used by HSD to set cohort rates with MCOs. From these rates, HSD makes monthly capitation payments to MCOs for every Medicaid recipient to cover all medical and administrative costs associated with providing Medicaid benefits. These capitation payments are based on the number of clients enrolled in each cohort multiplied by the contracted rate for that cohort. MCOs then spend this money on administrative costs and direct services through providers referred to here as MCO expenditures. Not counting New Mexico Medical Insurance Pool assessments (NMMIP) and premium taxes, which equate to approximately 5 percent of total capitation, MCOs must, per contractual agreement, dedicate at least 85 percent of expenditures to direct services and a maximum of 15 percent of expenditures to administrative overhead. This proportion is referred to as medical loss ratio or MLR. A common metric within both capitation payments and MCO expenditures is the amount spent per-member-per-month or PMPM. PMPM can represent either a capitation amount or MCO expenditure divided by the enrollment for that month.
Managed Care $4,099 79%
FFS and Other $1,068 21%
Chart 6. Total Projected Medicaid Expenditures FY15
(in millions)
Source: HSD May 2015 Medicaid Projection Brief
Human Services Department Report #15-08 Centennial Care Waiver and Medicaid Managed Care Costs June 24, 2015
19
Figure 3. Managed Care Financing Process
Initiation of Centennial Care coincided with Medicaid expansion. Centennial Care planning began in 2011 and included a $1.7 million contract with Alicia Smith & Associates, LLC for the development of a Medicaid redesign plan, stakeholder meetings, development of MCO contracts, service system design, and other deliverables. On January 1, 2014, Centennial Care was initiated by the HSD. Named in honor of the 100th anniversary of statehood and to reflect commitment to sustainability for the next one hundred years, Centennial Care combines separate Medicaid managed care programs into a single program via a section 1115 waiver replacing multiple waivers for programs including Salud!, CHIP, CoLTS and others. Under Centennial Care, the number of managed care organizations (MCOs) has been reduced from seven to four. The four companies contracted, through a competitive procurement process, to administer the Centennial Care program are Blue Cross Blue Shield of New Mexico, Molina Healthcare of New Mexico, Presbyterian Health Plan, and United Healthcare. Behavioral health services covered by Medicaid have been “carved in” to MCO plans to promote integration of physical and behavioral health. Non-Medicaid behavioral health services supported by state general fund and other federal funds are still provided through the single state entity (OptumHealth) or contracted directly by agencies. The state has also seen increased enrollment spending, increased appropriations to HSD, and increased enrollment in both new and existing cohorts.
Rate Setting
• Actuary uses financial and claims data to set rate ranges for each Medicaid cohort
• HSD sets rates with MCOs and submits rates to CMS for approval
Capitation Payment
• Each month HSD makes capitation payments to MCOs to cover medical and administrative costs
• Capitation payment= PMPM capitation rate for one member of each cohort multiplied by total enrollment in each cohort
MCO Expenditure
• MCO expenditures are made to providers • After deducting approximately 5 percent of total capitation for NMMIP and
taxes, MCOs are required to expend at least 85 percent on direct services and up to 15 percent on administration
Reporting on a Calendar Year Basis Coinciding with the start of Centennial Care (January 1, 2014), HSD switched reporting to a calendar year format. In support of this, reporting data in this report are provided in calendar year whenever possible.
Source: CMS, Centennial Care Contracts

Human Services Department Report #15-08 Centennial Care Waiver and Medicaid Managed Care Costs June 24, 2015
20
Centennial Care is divided into five major programs areas: Physical Health (PH)- This program area primarily includes former Salud! program participants and
consists of 12 cohorts of enrollees including, but not limited to, Temporary Assistance for Needy Families (TANF) and Supplemental Security Income (SSI) recipients, pregnant women (up to 250 percent of FPL), breast and cervical cancer patients, children under 19 years of age, and children in foster care who meet the income eligibility up to 133 percent of federal poverty level. December 2014 enrollment totaled 386 thousand.
Long-Term Services and Supports (LTSS)- This program area primarily includes former CoLTS
participants and consists of nine cohorts including, but not limited to, enrollees who are dually eligible for Medicare and Medicaid, seniors who are not eligible for Medicare, and Mi Via and other self-directed home and community-based service recipients who meet the income eligibility up to 133 percent of federal poverty level. December 2014 enrollment totaled 44 thousand.
Behavioral Health (BH)- All physical and long-term service and support Medicaid enrollees are
automatically eligible for behavioral health services through Centennial Care. There are seven cohorts for behavioral health services. Behavioral health services before 2014 had been carved out and managed by OptumHealth.
Medicaid Expansion Physical Health- This group includes new enrollees not previously eligible for
Medicaid, as well as Medicaid recipients from other programs such as the majority of former State Coverage Initiative (SCI) enrollees, and Family Planning clients meeting the income eligibility requirements. Under the ACA, New Mexico opted to expand Medicaid eligibility to 138 percent of federal poverty level. People eligible under these expanded guidelines are assigned to one of 12 Medicaid expansion cohorts. Native Americans newly eligible for Medicaid are not required to participate in Centennial Care, unless they meet a nursing facility level of care and require long-term services and supports. According to the HSD May 2015 HSD Medicaid projection enrollment totaled 81 thousand in January of 2014 growing to 169 thousand in December 2014.
Medicaid Expansion Behavioral Health- All Medicaid expansion physical health enrollees are also
eligible for behavioral health services and are assigned to one behavioral health cohort. Centennial Care was approved under a federal demonstration waiver and includes components such as care coordination designed to bend the cost curve of Medicaid spending. Centennial Care was approved under a five-year 1115 demonstration waiver. CMS approves such waivers for states to demonstrate and evaluate policy approaches such as expanding Medicaid eligibility, providing services not typically covered by Medicaid, and using innovative delivery systems to improve care, increase efficiency and reduce costs. According to HSD, Centennial Care’s goals include cost-effective care, slowing the rate of cost growth, and streamlining and modernizing the program. HSD described steps to accomplish these goals including:
• Care coordination; • Health literacy; • Prevention and patient-centered medical homes; • Payment reforms to reward cost-effective, “best-practices” care; • The use of technology to bring healthcare to rural and frontier areas of the state; and • Encouraging more engagement in personal health decisions while rewarding those who engage in healthy
behaviors including a small sliding co-pay for non-emergency use of an emergency room, as well as rewards for engaging in healthy behaviors, or actively participating in a recipient’s health care plan.
Human Services Department Report #15-08 Centennial Care Waiver and Medicaid Managed Care Costs June 24, 2015
21
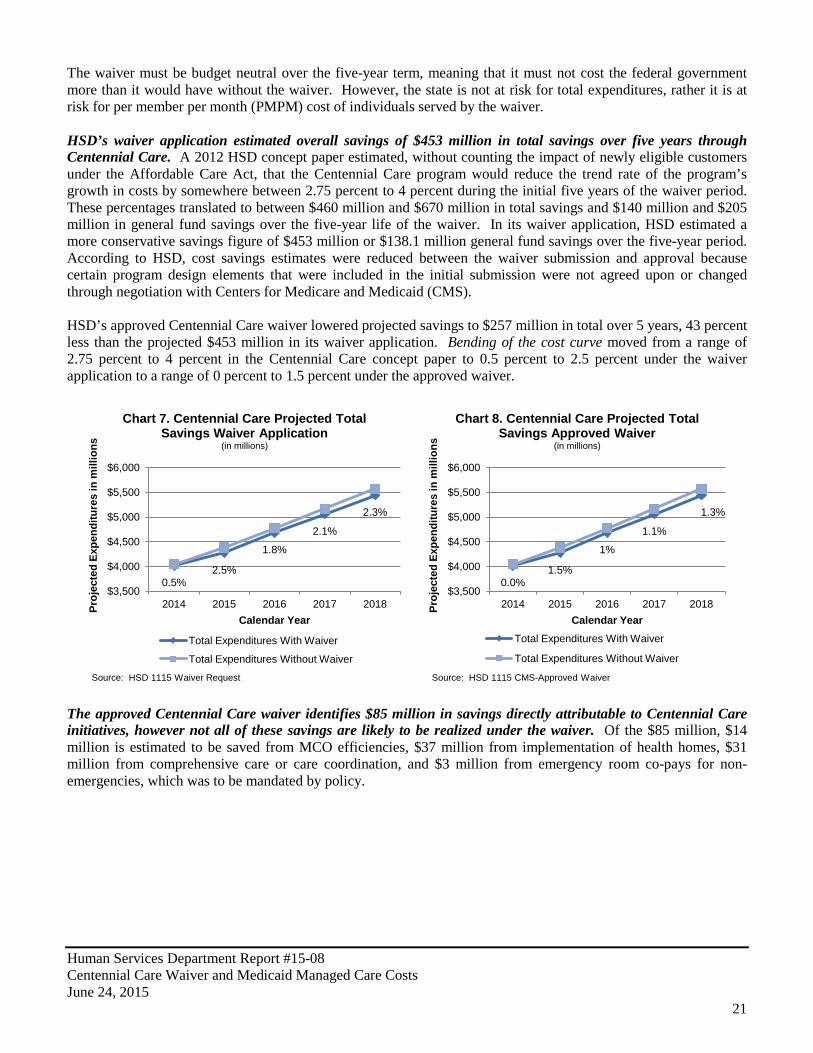
The waiver must be budget neutral over the five-year term, meaning that it must not cost the federal government more than it would have without the waiver. However, the state is not at risk for total expenditures, rather it is at risk for per member per month (PMPM) cost of individuals served by the waiver. HSD’s waiver application estimated overall savings of $453 million in total savings over five years through Centennial Care. A 2012 HSD concept paper estimated, without counting the impact of newly eligible customers under the Affordable Care Act, that the Centennial Care program would reduce the trend rate of the program’s growth in costs by somewhere between 2.75 percent to 4 percent during the initial five years of the waiver period. These percentages translated to between $460 million and $670 million in total savings and $140 million and $205 million in general fund savings over the five-year life of the waiver. In its waiver application, HSD estimated a more conservative savings figure of $453 million or $138.1 million general fund savings over the five-year period. According to HSD, cost savings estimates were reduced between the waiver submission and approval because certain program design elements that were included in the initial submission were not agreed upon or changed through negotiation with Centers for Medicare and Medicaid (CMS). HSD’s approved Centennial Care waiver lowered projected savings to $257 million in total over 5 years, 43 percent less than the projected $453 million in its waiver application. Bending of the cost curve moved from a range of 2.75 percent to 4 percent in the Centennial Care concept paper to 0.5 percent to 2.5 percent under the waiver application to a range of 0 percent to 1.5 percent under the approved waiver.
The approved Centennial Care waiver identifies $85 million in savings directly attributable to Centennial Care initiatives, however not all of these savings are likely to be realized under the waiver. Of the $85 million, $14 million is estimated to be saved from MCO efficiencies, $37 million from implementation of health homes, $31 million from comprehensive care or care coordination, and $3 million from emergency room co-pays for non-emergencies, which was to be mandated by policy.
0.5% 2.5%
1.8%
2.1%
2.3%
$3,500
$4,000
$4,500
$5,000
$5,500
$6,000
2014 2015 2016 2017 2018 Proj
ecte
d Ex
pend
iture
s in
mill
ions
Calendar Year
Chart 7. Centennial Care Projected Total Savings Waiver Application
(in millions)
Total Expenditures With Waiver
Total Expenditures Without Waiver
Source: HSD 1115 Waiver Request
0.0% 1.5%
1%
1.1%
1.3%
$3,500
$4,000
$4,500
$5,000
$5,500
$6,000
2014 2015 2016 2017 2018 Proj
ecte
d Ex
pend
iture
s in
mill
ions
Calendar Year
Chart 8. Centennial Care Projected Total Savings Approved Waiver
(in millions)
Total Expenditures With Waiver
Total Expenditures Without Waiver
Source: HSD 1115 CMS-Approved Waiver
Human Services Department Report #15-08 Centennial Care Waiver and Medicaid Managed Care Costs June 24, 2015
22
Table 2. Centennial Care Waiver Savings Initiatives (in millions)
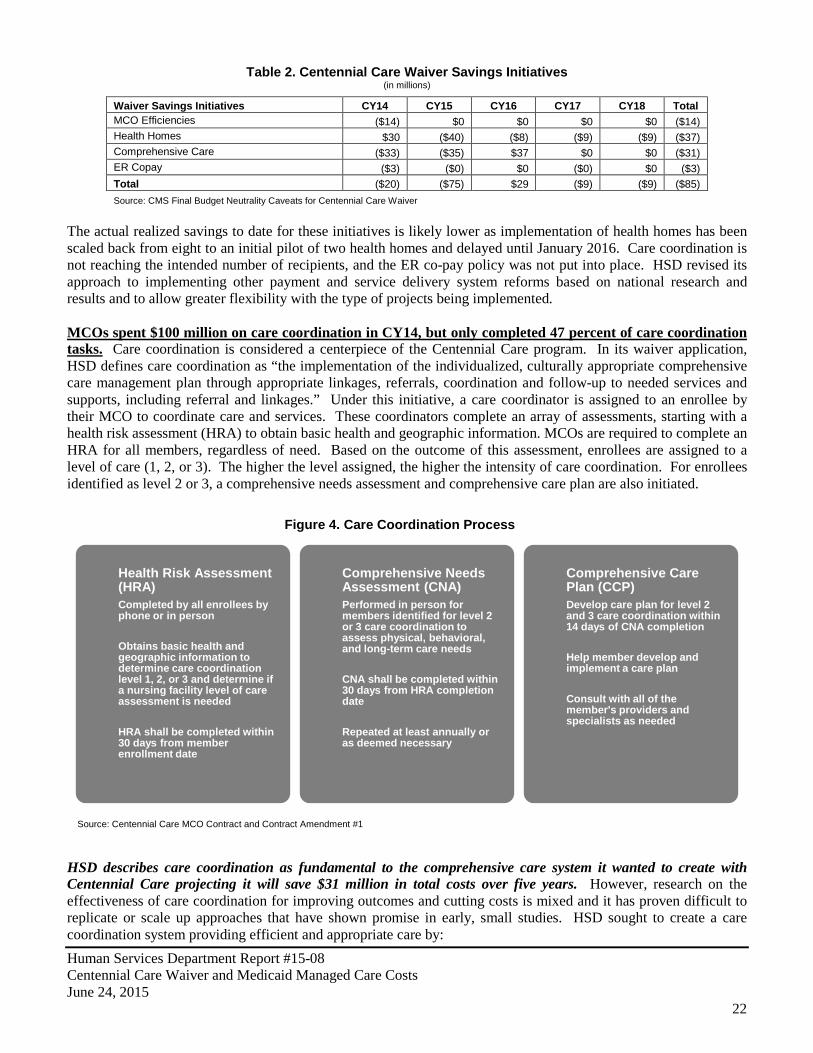
Waiver Savings Initiatives CY14 CY15 CY16 CY17 CY18 Total MCO Efficiencies ($14) $0 $0 $0 $0 ($14) Health Homes $30 ($40) ($8) ($9) ($9) ($37) Comprehensive Care ($33) ($35) $37 $0 $0 ($31) ER Copay ($3) ($0) $0 ($0) $0 ($3) Total ($20) ($75) $29 ($9) ($9) ($85) Source: CMS Final Budget Neutrality Caveats for Centennial Care Waiver
The actual realized savings to date for these initiatives is likely lower as implementation of health homes has been scaled back from eight to an initial pilot of two health homes and delayed until January 2016. Care coordination is not reaching the intended number of recipients, and the ER co-pay policy was not put into place. HSD revised its approach to implementing other payment and service delivery system reforms based on national research and results and to allow greater flexibility with the type of projects being implemented. MCOs spent $100 million on care coordination in CY14, but only completed 47 percent of care coordination tasks. Care coordination is considered a centerpiece of the Centennial Care program. In its waiver application, HSD defines care coordination as “the implementation of the individualized, culturally appropriate comprehensive care management plan through appropriate linkages, referrals, coordination and follow-up to needed services and supports, including referral and linkages.” Under this initiative, a care coordinator is assigned to an enrollee by their MCO to coordinate care and services. These coordinators complete an array of assessments, starting with a health risk assessment (HRA) to obtain basic health and geographic information. MCOs are required to complete an HRA for all members, regardless of need. Based on the outcome of this assessment, enrollees are assigned to a level of care (1, 2, or 3). The higher the level assigned, the higher the intensity of care coordination. For enrollees identified as level 2 or 3, a comprehensive needs assessment and comprehensive care plan are also initiated.
HSD describes care coordination as fundamental to the comprehensive care system it wanted to create with Centennial Care projecting it will save $31 million in total costs over five years. However, research on the effectiveness of care coordination for improving outcomes and cutting costs is mixed and it has proven difficult to replicate or scale up approaches that have shown promise in early, small studies. HSD sought to create a care coordination system providing efficient and appropriate care by:
Health Risk Assessment (HRA) Completed by all enrollees by phone or in person Obtains basic health and geographic information to determine care coordination level 1, 2, or 3 and determine if a nursing facility level of care assessment is needed HRA shall be completed within 30 days from member enrollment date
Comprehensive Needs Assessment (CNA) Performed in person for members identified for level 2 or 3 care coordination to assess physical, behavioral, and long-term care needs CNA shall be completed within 30 days from HRA completion date Repeated at least annually or as deemed necessary
Comprehensive Care Plan (CCP) Develop care plan for level 2 and 3 care coordination within 14 days of CNA completion Help member develop and implement a care plan Consult with all of the member's providers and specialists as needed
Source: Centennial Care MCO Contract and Contract Amendment #1
Figure 4. Care Coordination Process
Human Services Department Report #15-08 Centennial Care Waiver and Medicaid Managed Care Costs June 24, 2015
23
• Assessing the recipient’s physical, behavioral, functional, and psychosocial needs; • Identifying the medical, behavioral, and long-term care services, and other social support services and
assistance (e.g. housing, transportation, or income assistance) necessary to meet identified needs; • Ensuring timely access and provision, coordination, and monitoring of services needed to help each
recipient maintain or improve his or her physical and/or behavioral health status or functional abilities and maximize independence; and
• Facilitating access to other social support services and assistance needed in order to promote each recipient’s health, safety, and welfare.
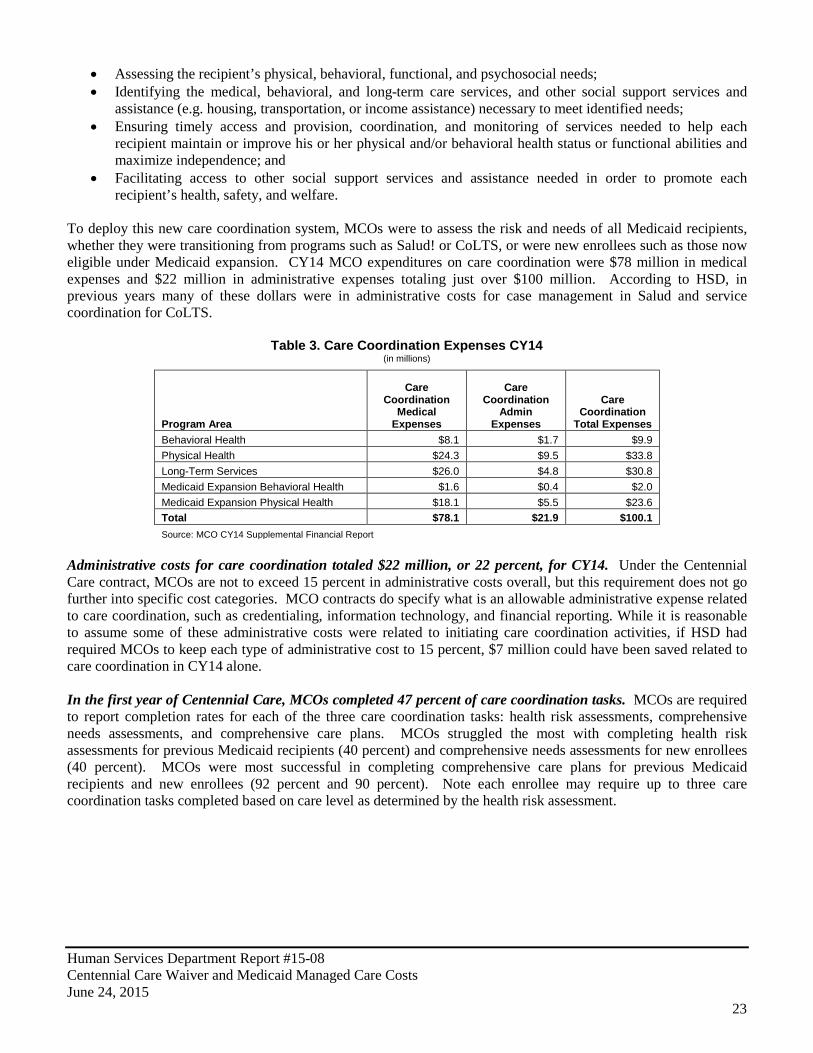
To deploy this new care coordination system, MCOs were to assess the risk and needs of all Medicaid recipients, whether they were transitioning from programs such as Salud! or CoLTS, or were new enrollees such as those now eligible under Medicaid expansion. CY14 MCO expenditures on care coordination were $78 million in medical expenses and $22 million in administrative expenses totaling just over $100 million. According to HSD, in previous years many of these dollars were in administrative costs for case management in Salud and service coordination for CoLTS.
Table 3. Care Coordination Expenses CY14 (in millions)
Program Area
Care Coordination
Medical Expenses
Care Coordination
Admin Expenses
Care Coordination
Total Expenses Behavioral Health $8.1 $1.7 $9.9 Physical Health $24.3 $9.5 $33.8 Long-Term Services $26.0 $4.8 $30.8 Medicaid Expansion Behavioral Health $1.6 $0.4 $2.0 Medicaid Expansion Physical Health $18.1 $5.5 $23.6 Total $78.1 $21.9 $100.1 Source: MCO CY14 Supplemental Financial Report
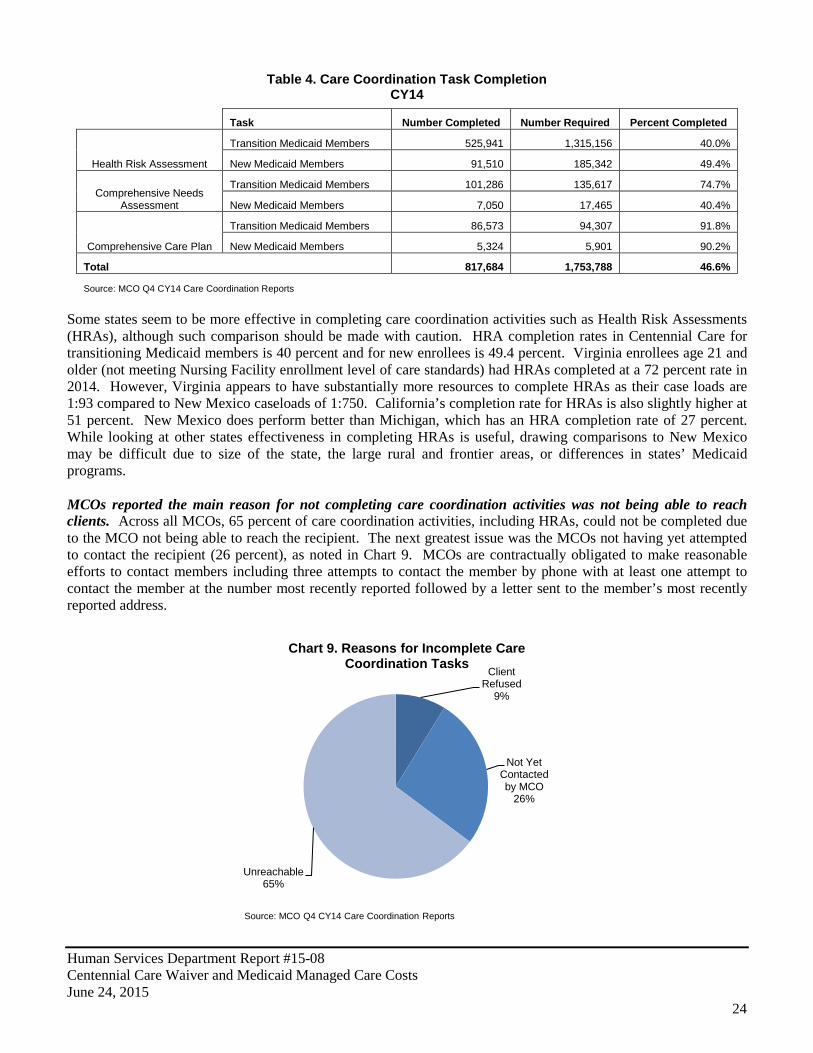
Administrative costs for care coordination totaled $22 million, or 22 percent, for CY14. Under the Centennial Care contract, MCOs are not to exceed 15 percent in administrative costs overall, but this requirement does not go further into specific cost categories. MCO contracts do specify what is an allowable administrative expense related to care coordination, such as credentialing, information technology, and financial reporting. While it is reasonable to assume some of these administrative costs were related to initiating care coordination activities, if HSD had required MCOs to keep each type of administrative cost to 15 percent, $7 million could have been saved related to care coordination in CY14 alone. In the first year of Centennial Care, MCOs completed 47 percent of care coordination tasks. MCOs are required to report completion rates for each of the three care coordination tasks: health risk assessments, comprehensive needs assessments, and comprehensive care plans. MCOs struggled the most with completing health risk assessments for previous Medicaid recipients (40 percent) and comprehensive needs assessments for new enrollees (40 percent). MCOs were most successful in completing comprehensive care plans for previous Medicaid recipients and new enrollees (92 percent and 90 percent). Note each enrollee may require up to three care coordination tasks completed based on care level as determined by the health risk assessment.
Human Services Department Report #15-08 Centennial Care Waiver and Medicaid Managed Care Costs June 24, 2015
24
Table 4. Care Coordination Task Completion CY14
Task Number Completed Number Required Percent Completed
Health Risk Assessment
Transition Medicaid Members 525,941 1,315,156 40.0%
New Medicaid Members 91,510 185,342 49.4%
Comprehensive Needs Assessment
Transition Medicaid Members 101,286 135,617 74.7%
New Medicaid Members 7,050 17,465 40.4%
Comprehensive Care Plan
Transition Medicaid Members 86,573 94,307 91.8%
New Medicaid Members 5,324 5,901 90.2%
Total 817,684 1,753,788 46.6%
Source: MCO Q4 CY14 Care Coordination Reports
Some states seem to be more effective in completing care coordination activities such as Health Risk Assessments (HRAs), although such comparison should be made with caution. HRA completion rates in Centennial Care for transitioning Medicaid members is 40 percent and for new enrollees is 49.4 percent. Virginia enrollees age 21 and older (not meeting Nursing Facility enrollment level of care standards) had HRAs completed at a 72 percent rate in 2014. However, Virginia appears to have substantially more resources to complete HRAs as their case loads are 1:93 compared to New Mexico caseloads of 1:750. California’s completion rate for HRAs is also slightly higher at 51 percent. New Mexico does perform better than Michigan, which has an HRA completion rate of 27 percent. While looking at other states effectiveness in completing HRAs is useful, drawing comparisons to New Mexico may be difficult due to size of the state, the large rural and frontier areas, or differences in states’ Medicaid programs. MCOs reported the main reason for not completing care coordination activities was not being able to reach clients. Across all MCOs, 65 percent of care coordination activities, including HRAs, could not be completed due to the MCO not being able to reach the recipient. The next greatest issue was the MCOs not having yet attempted to contact the recipient (26 percent), as noted in Chart 9. MCOs are contractually obligated to make reasonable efforts to contact members including three attempts to contact the member by phone with at least one attempt to contact the member at the number most recently reported followed by a letter sent to the member’s most recently reported address.
Client Refused
9%
Not Yet Contacted by MCO
26%
Unreachable 65%
Chart 9. Reasons for Incomplete Care Coordination Tasks
Source: MCO Q4 CY14 Care Coordination Reports

Human Services Department Report #15-08 Centennial Care Waiver and Medicaid Managed Care Costs June 24, 2015
25
MCOs are also required to complete care coordination activities within prescribed timeframes for new enrollees. Overall, 78 percent of total care coordination tasks were completed within required timeframes. Specifically, MCOs were most challenged completing health risk assessments, 62 percent within 30 days of enrollment. MCOs were more successful completing comprehensive needs assessments and comprehensive care plans, completing 67 percent and 68 percent within prescribed timeframes respectively. HSD quarterly reports indicate MCOs identified finding recipients and completing HRAs as an issue. HSD has tasked MCOs with addressing this issue and has implemented plans with MCOs to boost performance. Performance targets include reducing the number of unreachable members 10 percent by October 1, 2014 and 5 percent per month thereafter. MCOs exceeded the October target, reducing unreachable members by 20 percent. Three of four MCOs continued to meet or exceed the 5 percent goal per month in CY14. HSD reports MCOs have increased the HRA completion rate to 62 percent as of June 2015. Initial impacts of care coordination based on existing performance measures is mixed. At least three measures typically used as performance measures for care coordination exist in HSD’s performance measures. Performance has been mixed on these measures. The number of emergency room visits per thousand members has increased since last year from 35 per thousand to 41 per thousand in the most recent quarter of HSD’s performance measures, where a reduction should be expected with care coordination. The figure of 41 is still below the target of 50. The percent of hospital readmissions for children and adults within thirty days of discharge has fallen since last year, a potential signal that care coordination is leading to desired outcomes in this area (Appendix F). Additionally, these measures include new enrollees which could be a confounding variable in making comparisons with previous years. It would be beneficial for HSD to implement care coordination-specific performance measures to examine benefits. Care coordination costs were underestimated in the first year of Centennial Care by $66 million. HSD’s actuary identified approximately $33.8 million for new care coordination activities to be implemented across all Centennial Care program areas for CY14. MCOs reported actual costs to be around $100 million. While these increased expenditures did not result in increased funding requirements from the Medicaid program, capitation revenues were likely redirected from medical services or other administrative costs toward care coordination. Long-term service clients (formerly CoLTS) accounted for $31 million (31 percent) of care coordination expense, but only represent 3.7 percent of Medicaid enrollment as of December 2014. Physical health clients (formerly Salud!) care coordination expense was $34 million (34 percent), representing 32.4 percent of total enrollment. New enrollees from Medicaid expansion accounted for a total of $25.6 million, or 25 percent, of total care coordination costs, while accounting for 14 percent of enrollment. The remaining 10 percent is related to care coordination for LTSS or physical health clients also receiving behavioral health services, as detailed in MCO CY14 financial reports.
Behavioral Health $9.9 10% Physical
Health $33.8 34%
Long-Term Services
$30.8 31%
Medicaid Expansion Behavioral
Health $2.0 2%
Medicaid Expansion Physical Health $23.6 23%
Chart 10. Care Coordination Expense by Program Area
CY14 (in millions)
Total: $100 Million
Source: MCO CY14 Supplemental Financial Report

Human Services Department Report #15-08 Centennial Care Waiver and Medicaid Managed Care Costs June 24, 2015
26
HSD’s actuary decreased the rates for Medicaid expansion care coordination by more than 25 percent for CY15. All other program areas remained relatively flat in per-member-per-month rate impact related to care coordination for CY15 as noted in Table 5.
Table 5. Care Coordination Capitation PMPM Revenue by Program CY14-CY15
Capitation PMPM Impact Designated by
Actuary Program CY14 CY15 Percent Change Physical Health $1.37 $1.37 0.00% Behavioral Health $0.40 $0.40 0.00% Long-Term Services $5.75 $5.88 2.26% Medicaid Expansion Physical Health $12.57 $9.21 -26.73% Medicaid Expansion Behavioral Health $1.12 $0.70 -37.50%
Source: Centennial Care CY14 and CY15 Actuarial Letters
The Medicaid expansion physical health population had the highest capitation PMPM impact from care coordination for CY14. According to HSD, the higher capitation PMPM was due to anticipation that newly eligible persons with higher health care needs would be more likely to enroll in Medicaid before those with less health care needs. The actuary reduced the capitation PMPM rate for Medicaid expansion physical health care coordination by 27 percent for CY15. HSD is monitoring care coordinator-to-member ratios and some MCOs are falling short. Care coordinator staffing ratios are determined by the care level identified through the health risk assessment. Care coordinators working with higher care level enrollees have smaller case loads as noted in Table 6.
Table 6. Care Coordination Staffing Ratio Requirements
Care Coordination Level Staffing Ratio Level 1 1:750 Level 2 1:75 Level 3 1:50 Self-Directed Community Benefit 1:40 Source: Centennial Care MCO Contract
In their first quarterly report, MCOs stated how many care coordinators were hired as well as how many were needed to meet contractual requirements. These numbers were based on current enrollment as of May 7, 2014 and vary from month to month. For example, between the months of February and May, BCBSNM hired a total of 794 care coordinators and still needed 42 to meet contractual requirements. Molina Healthcare hired a total of 1,611 care coordinators and still needed 420 to meet the requirements. HSD amended MCO contracts, lowering qualification requirements for care coordination staff. In the original MCO contracts, care coordinators completing comprehensive needs assessments needed to have at minimum, a bachelor’s degree in social work, nursing, or other health care profession and/or two years relevant experience. Care coordination supervisors should have been a licensed social worker or registered nurse with a minimum two years relevant health care experience. In the third contract amendment, care coordinator requirements changed to a bachelor’s degree (no specific course of study specified) and/or two years relevant health care experience. Supervisor requirements were adjusted to a bachelor’s degree, again without a specific course of study identified, and a minimum of two years relevant health care experience.

Human Services Department Report #15-08 Centennial Care Waiver and Medicaid Managed Care Costs June 24, 2015
27
HSD planned to deploy health homes as part of Centennial Care but delayed implementation to develop a comprehensive phased in approach. The Affordable Care Act (ACA) provides enhanced funding for an integrated care model known as health homes for Medicaid patients based on the concept of patient-centered medical homes. A health home offers coordinated care to individuals with chronic health conditions. As stipulated in Section 2703 of the ACA, states can receive up to eight quarters of enhanced reimbursement (90 percent) for Medicaid patients with two or more chronic conditions, one chronic condition and risk of another, or a serious or persistent mental health condition who are participating in a health home. CMS has approved state plan amendments for health homes for 19 states. A state plan amendment for health homes has not yet been submitted by New Mexico. HSD originally planned to deploy four health homes targeting behavioral health as part of Centennial Care, but has scaled this down to a smaller pilot project with an anticipated start date in January 2016. According to HSD the phased in approach is being taken to garner lessons learned from other states and from initial pilot sites in New Mexico. HSD’s describes health homes as a key component of Centennial Care to reduce costs by $36.6 million over five years. While the $36 million savings figure will fluctuate due to enrollment projections, health home are anticipated to garner some savings. HSD intends to focus its health home efforts first on serving Medicaid clients with a primary behavioral health diagnosis such as a serious mental illness or severe emotional disturbance. The health home builds linkages to community supports and resources as well as enhances coordination and integration of primary and behavioral health care to better meet the needs of people with chronic conditions. The model aims to improve healthcare quality while also reducing costs. Health homes provide comprehensive case management, care coordination, health promotion, and transitional care when moving from inpatient to other settings. HSD’s intent was to develop health homes in core service agencies (CSAs) statewide. In HSD’s 2012 concept paper on Centennial Care it was noted that:
“MCOs will be further challenged to support care integration through the proliferation of health homes, targeted first at those with a behavioral health condition plus a chronic physical condition and, over time, towards others with chronic and/or co-morbid conditions. In these health homes, all six services prescribed by federal law will be offered, including intensive care management delivered at the “point of service.”
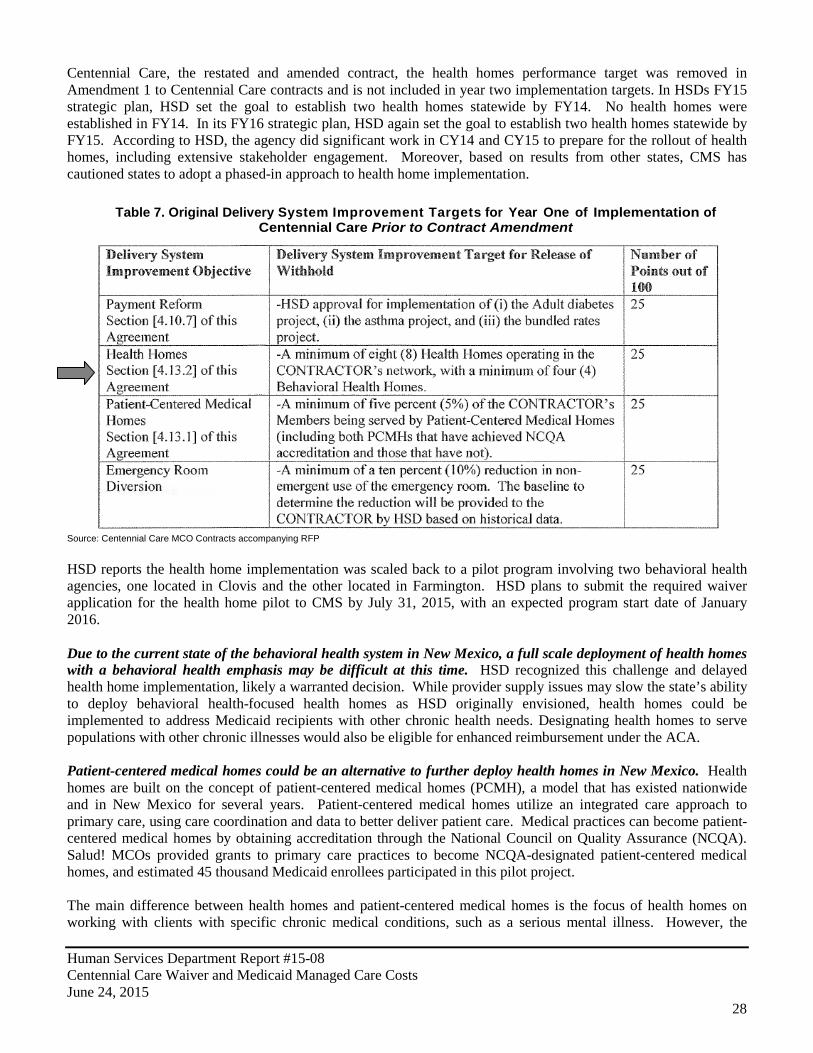
However, MCOs informed LFC staff only three CSAs exist in New Mexico that would be good candidates for health homes focusing primarily on behavioral health and one of these is in financial distress. HSD determined providers with Comprehensive Community Support Services (CCSS) certification were the best candidates for health homes. Certified CCSS providers are primarily core service agencies (CSAs), but can also be IHS clinics and federally-qualified health centers (FQHCs). Research on effectiveness of health homes is mixed. In one of the more comprehensive studies done to date published by Druss et al in the American Journal of Psychiatry, a health home targeting serious mental illness was evaluated. The authors found gains in quality and outcomes that persisted at 2 years and also found reductions in average costs per patient. However, the program as a whole was not sustainable because not enough patients in the clinic had Medicaid and the program was closed. HSD scaled back MCO performance metrics on health homes, eventually pausing initial implementation plans for health homes altogether. The Delivery System Improvement Fund includes withholding of 1.5 percent of HSD’s Medicaid capitation payments after premium taxes and assessments from MCOs. The fund is used as an incentive and is awarded based on MCO performance on delivery system improvement targets. If performance goals are not met, HSD recoups these funds. In late 2013, HSD amended contracts to change delivery system improvement targets. In the original Centennial Care contract that accompanied the request for proposals, one of the performance targets tied to the Delivery System Improvement Fund incentive was a requirement for a minimum of eight health homes operating in the MCO network, with a minimum of four behavioral health homes. According to HSD this original contract was never signed as changes were necessary after award and based on the selected bidder’s request for proposal responses. In the contract that was negotiated and signed for the first year of
Human Services Department Report #15-08 Centennial Care Waiver and Medicaid Managed Care Costs June 24, 2015
28
Centennial Care, the restated and amended contract, the health homes performance target was removed in Amendment 1 to Centennial Care contracts and is not included in year two implementation targets. In HSDs FY15 strategic plan, HSD set the goal to establish two health homes statewide by FY14. No health homes were established in FY14. In its FY16 strategic plan, HSD again set the goal to establish two health homes statewide by FY15. According to HSD, the agency did significant work in CY14 and CY15 to prepare for the rollout of health homes, including extensive stakeholder engagement. Moreover, based on results from other states, CMS has cautioned states to adopt a phased-in approach to health home implementation.
Table 7. Original Delivery System Improvement Targets for Year One of Implementation of Centennial Care Prior to Contract Amendment
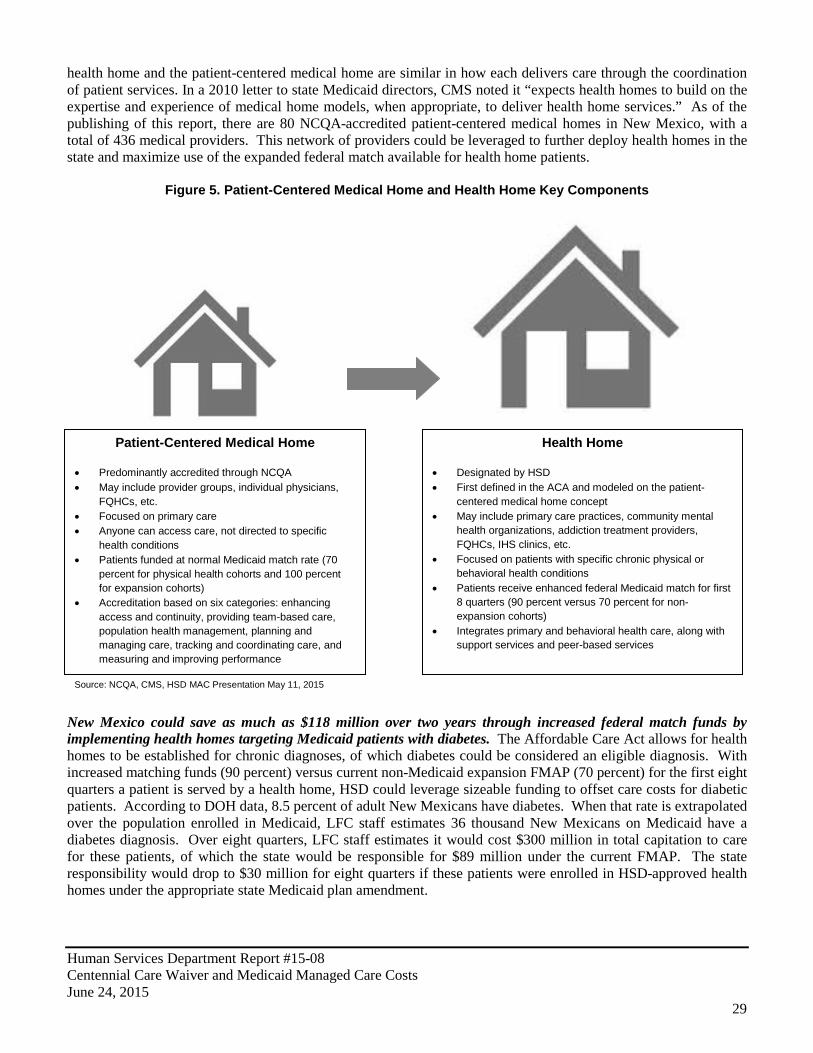
Source: Centennial Care MCO Contracts accompanying RFP HSD reports the health home implementation was scaled back to a pilot program involving two behavioral health agencies, one located in Clovis and the other located in Farmington. HSD plans to submit the required waiver application for the health home pilot to CMS by July 31, 2015, with an expected program start date of January 2016. Due to the current state of the behavioral health system in New Mexico, a full scale deployment of health homes with a behavioral health emphasis may be difficult at this time. HSD recognized this challenge and delayed health home implementation, likely a warranted decision. While provider supply issues may slow the state’s ability to deploy behavioral health-focused health homes as HSD originally envisioned, health homes could be implemented to address Medicaid recipients with other chronic health needs. Designating health homes to serve populations with other chronic illnesses would also be eligible for enhanced reimbursement under the ACA. Patient-centered medical homes could be an alternative to further deploy health homes in New Mexico. Health homes are built on the concept of patient-centered medical homes (PCMH), a model that has existed nationwide and in New Mexico for several years. Patient-centered medical homes utilize an integrated care approach to primary care, using care coordination and data to better deliver patient care. Medical practices can become patient-centered medical homes by obtaining accreditation through the National Council on Quality Assurance (NCQA). Salud! MCOs provided grants to primary care practices to become NCQA-designated patient-centered medical homes, and estimated 45 thousand Medicaid enrollees participated in this pilot project. The main difference between health homes and patient-centered medical homes is the focus of health homes on working with clients with specific chronic medical conditions, such as a serious mental illness. However, the
Human Services Department Report #15-08 Centennial Care Waiver and Medicaid Managed Care Costs June 24, 2015
29
health home and the patient-centered medical home are similar in how each delivers care through the coordination of patient services. In a 2010 letter to state Medicaid directors, CMS noted it “expects health homes to build on the expertise and experience of medical home models, when appropriate, to deliver health home services.” As of the publishing of this report, there are 80 NCQA-accredited patient-centered medical homes in New Mexico, with a total of 436 medical providers. This network of providers could be leveraged to further deploy health homes in the state and maximize use of the expanded federal match available for health home patients.
Figure 5. Patient-Centered Medical Home and Health Home Key Components
New Mexico could save as much as $118 million over two years through increased federal match funds by implementing health homes targeting Medicaid patients with diabetes. The Affordable Care Act allows for health homes to be established for chronic diagnoses, of which diabetes could be considered an eligible diagnosis. With increased matching funds (90 percent) versus current non-Medicaid expansion FMAP (70 percent) for the first eight quarters a patient is served by a health home, HSD could leverage sizeable funding to offset care costs for diabetic patients. According to DOH data, 8.5 percent of adult New Mexicans have diabetes. When that rate is extrapolated over the population enrolled in Medicaid, LFC staff estimates 36 thousand New Mexicans on Medicaid have a diabetes diagnosis. Over eight quarters, LFC staff estimates it would cost $300 million in total capitation to care for these patients, of which the state would be responsible for $89 million under the current FMAP. The state responsibility would drop to $30 million for eight quarters if these patients were enrolled in HSD-approved health homes under the appropriate state Medicaid plan amendment.
Patient-Centered Medical Home
• Predominantly accredited through NCQA • May include provider groups, individual physicians,
FQHCs, etc. • Focused on primary care • Anyone can access care, not directed to specific
health conditions • Patients funded at normal Medicaid match rate (70
percent for physical health cohorts and 100 percent for expansion cohorts)
• Accreditation based on six categories: enhancing access and continuity, providing team-based care, population health management, planning and managing care, tracking and coordinating care, and measuring and improving performance
Health Home
• Designated by HSD • First defined in the ACA and modeled on the patient-
centered medical home concept • May include primary care practices, community mental
health organizations, addiction treatment providers, FQHCs, IHS clinics, etc.
• Focused on patients with specific chronic physical or behavioral health conditions
• Patients receive enhanced federal Medicaid match for first 8 quarters (90 percent versus 70 percent for non-expansion cohorts)
• Integrates primary and behavioral health care, along with support services and peer-based services
Source: NCQA, CMS, HSD MAC Presentation May 11, 2015
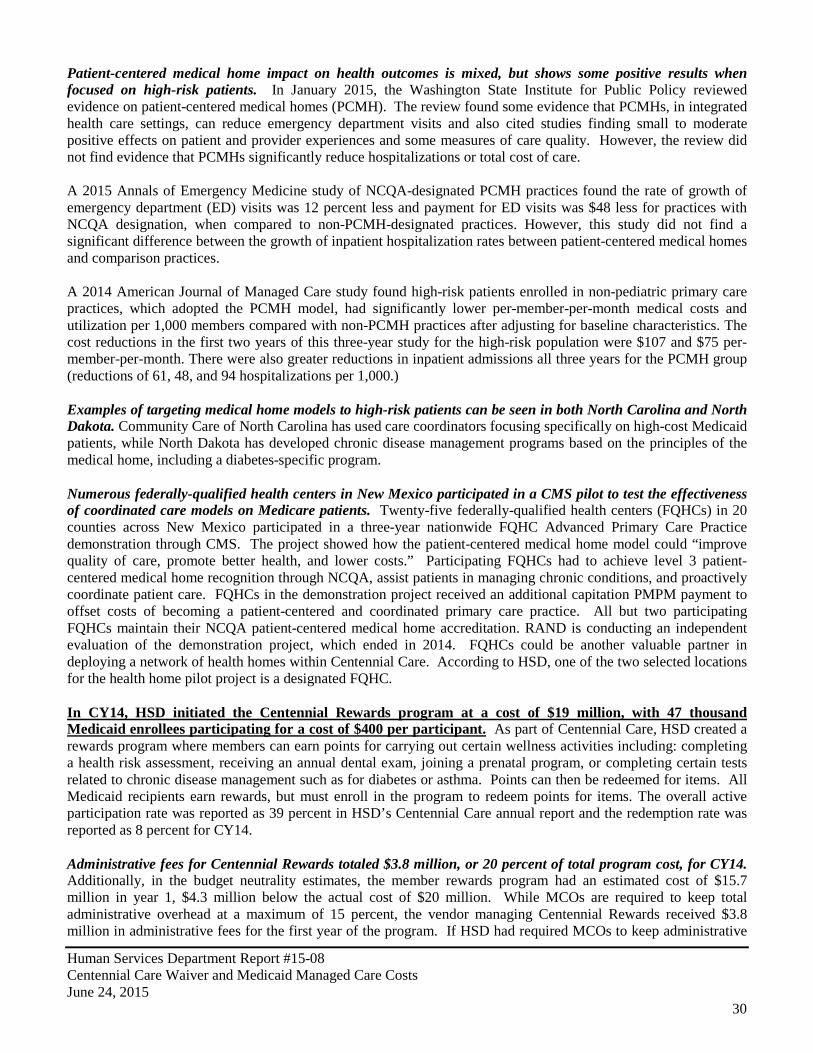
Human Services Department Report #15-08 Centennial Care Waiver and Medicaid Managed Care Costs June 24, 2015
30
Patient-centered medical home impact on health outcomes is mixed, but shows some positive results when focused on high-risk patients. In January 2015, the Washington State Institute for Public Policy reviewed evidence on patient-centered medical homes (PCMH). The review found some evidence that PCMHs, in integrated health care settings, can reduce emergency department visits and also cited studies finding small to moderate positive effects on patient and provider experiences and some measures of care quality. However, the review did not find evidence that PCMHs significantly reduce hospitalizations or total cost of care. A 2015 Annals of Emergency Medicine study of NCQA-designated PCMH practices found the rate of growth of emergency department (ED) visits was 12 percent less and payment for ED visits was $48 less for practices with NCQA designation, when compared to non-PCMH-designated practices. However, this study did not find a significant difference between the growth of inpatient hospitalization rates between patient-centered medical homes and comparison practices. A 2014 American Journal of Managed Care study found high-risk patients enrolled in non-pediatric primary care practices, which adopted the PCMH model, had significantly lower per-member-per-month medical costs and utilization per 1,000 members compared with non-PCMH practices after adjusting for baseline characteristics. The cost reductions in the first two years of this three-year study for the high-risk population were $107 and $75 per-member-per-month. There were also greater reductions in inpatient admissions all three years for the PCMH group (reductions of 61, 48, and 94 hospitalizations per 1,000.) Examples of targeting medical home models to high-risk patients can be seen in both North Carolina and North Dakota. Community Care of North Carolina has used care coordinators focusing specifically on high-cost Medicaid patients, while North Dakota has developed chronic disease management programs based on the principles of the medical home, including a diabetes-specific program. Numerous federally-qualified health centers in New Mexico participated in a CMS pilot to test the effectiveness of coordinated care models on Medicare patients. Twenty-five federally-qualified health centers (FQHCs) in 20 counties across New Mexico participated in a three-year nationwide FQHC Advanced Primary Care Practice demonstration through CMS. The project showed how the patient-centered medical home model could “improve quality of care, promote better health, and lower costs.” Participating FQHCs had to achieve level 3 patient-centered medical home recognition through NCQA, assist patients in managing chronic conditions, and proactively coordinate patient care. FQHCs in the demonstration project received an additional capitation PMPM payment to offset costs of becoming a patient-centered and coordinated primary care practice. All but two participating FQHCs maintain their NCQA patient-centered medical home accreditation. RAND is conducting an independent evaluation of the demonstration project, which ended in 2014. FQHCs could be another valuable partner in deploying a network of health homes within Centennial Care. According to HSD, one of the two selected locations for the health home pilot project is a designated FQHC. In CY14, HSD initiated the Centennial Rewards program at a cost of $19 million, with 47 thousand Medicaid enrollees participating for a cost of $400 per participant. As part of Centennial Care, HSD created a rewards program where members can earn points for carrying out certain wellness activities including: completing a health risk assessment, receiving an annual dental exam, joining a prenatal program, or completing certain tests related to chronic disease management such as for diabetes or asthma. Points can then be redeemed for items. All Medicaid recipients earn rewards, but must enroll in the program to redeem points for items. The overall active participation rate was reported as 39 percent in HSD’s Centennial Care annual report and the redemption rate was reported as 8 percent for CY14. Administrative fees for Centennial Rewards totaled $3.8 million, or 20 percent of total program cost, for CY14. Additionally, in the budget neutrality estimates, the member rewards program had an estimated cost of $15.7 million in year 1, $4.3 million below the actual cost of $20 million. While MCOs are required to keep total administrative overhead at a maximum of 15 percent, the vendor managing Centennial Rewards received $3.8 million in administrative fees for the first year of the program. If HSD had required MCOs to keep administrative
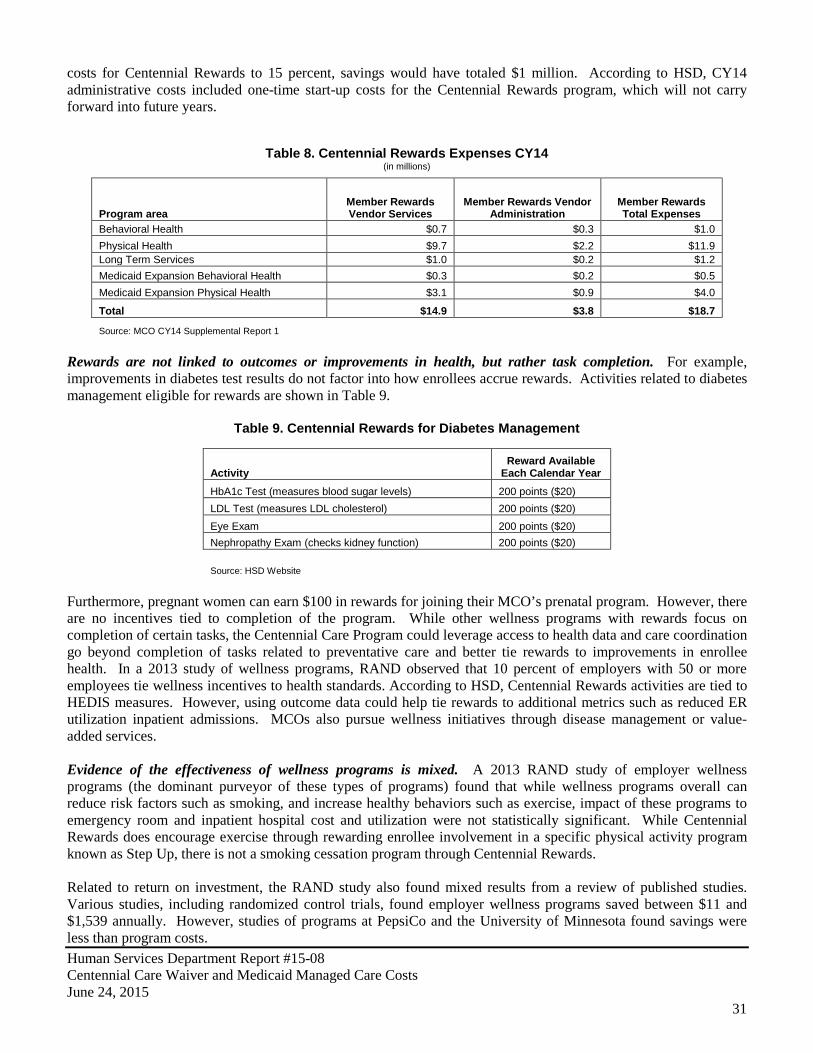
Human Services Department Report #15-08 Centennial Care Waiver and Medicaid Managed Care Costs June 24, 2015
31
costs for Centennial Rewards to 15 percent, savings would have totaled $1 million. According to HSD, CY14 administrative costs included one-time start-up costs for the Centennial Rewards program, which will not carry forward into future years.
Table 8. Centennial Rewards Expenses CY14 (in millions)
Program area Member Rewards Vendor Services
Member Rewards Vendor Administration
Member Rewards Total Expenses
Behavioral Health $0.7 $0.3 $1.0 Physical Health $9.7 $2.2 $11.9 Long Term Services $1.0 $0.2 $1.2 Medicaid Expansion Behavioral Health $0.3 $0.2 $0.5 Medicaid Expansion Physical Health $3.1 $0.9 $4.0
Total $14.9 $3.8 $18.7
Source: MCO CY14 Supplemental Report 1
Rewards are not linked to outcomes or improvements in health, but rather task completion. For example, improvements in diabetes test results do not factor into how enrollees accrue rewards. Activities related to diabetes management eligible for rewards are shown in Table 9.
Table 9. Centennial Rewards for Diabetes Management
Activity Reward Available
Each Calendar Year HbA1c Test (measures blood sugar levels) 200 points ($20) LDL Test (measures LDL cholesterol) 200 points ($20) Eye Exam 200 points ($20) Nephropathy Exam (checks kidney function) 200 points ($20)
Source: HSD Website Furthermore, pregnant women can earn $100 in rewards for joining their MCO’s prenatal program. However, there are no incentives tied to completion of the program. While other wellness programs with rewards focus on completion of certain tasks, the Centennial Care Program could leverage access to health data and care coordination go beyond completion of tasks related to preventative care and better tie rewards to improvements in enrollee health. In a 2013 study of wellness programs, RAND observed that 10 percent of employers with 50 or more employees tie wellness incentives to health standards. According to HSD, Centennial Rewards activities are tied to HEDIS measures. However, using outcome data could help tie rewards to additional metrics such as reduced ER utilization inpatient admissions. MCOs also pursue wellness initiatives through disease management or value-added services. Evidence of the effectiveness of wellness programs is mixed. A 2013 RAND study of employer wellness programs (the dominant purveyor of these types of programs) found that while wellness programs overall can reduce risk factors such as smoking, and increase healthy behaviors such as exercise, impact of these programs to emergency room and inpatient hospital cost and utilization were not statistically significant. While Centennial Rewards does encourage exercise through rewarding enrollee involvement in a specific physical activity program known as Step Up, there is not a smoking cessation program through Centennial Rewards. Related to return on investment, the RAND study also found mixed results from a review of published studies. Various studies, including randomized control trials, found employer wellness programs saved between $11 and $1,539 annually. However, studies of programs at PepsiCo and the University of Minnesota found savings were less than program costs.
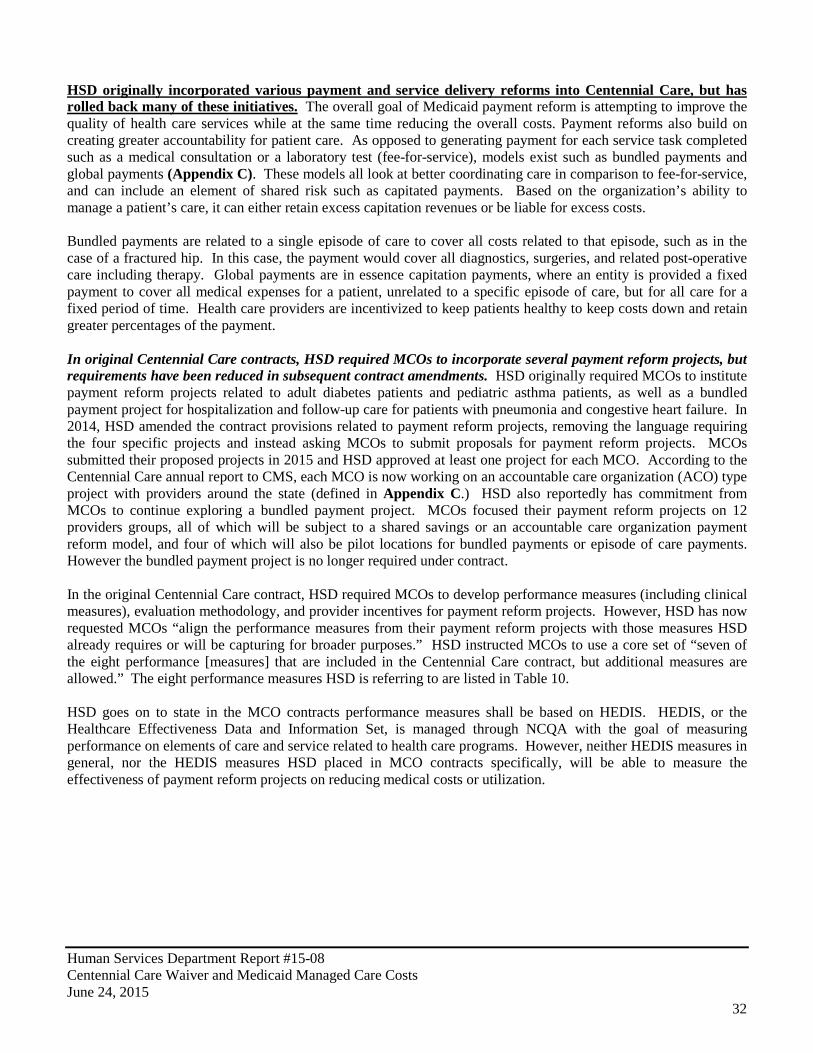
Human Services Department Report #15-08 Centennial Care Waiver and Medicaid Managed Care Costs June 24, 2015
32
HSD originally incorporated various payment and service delivery reforms into Centennial Care, but has rolled back many of these initiatives. The overall goal of Medicaid payment reform is attempting to improve the quality of health care services while at the same time reducing the overall costs. Payment reforms also build on creating greater accountability for patient care. As opposed to generating payment for each service task completed such as a medical consultation or a laboratory test (fee-for-service), models exist such as bundled payments and global payments (Appendix C). These models all look at better coordinating care in comparison to fee-for-service, and can include an element of shared risk such as capitated payments. Based on the organization’s ability to manage a patient’s care, it can either retain excess capitation revenues or be liable for excess costs. Bundled payments are related to a single episode of care to cover all costs related to that episode, such as in the case of a fractured hip. In this case, the payment would cover all diagnostics, surgeries, and related post-operative care including therapy. Global payments are in essence capitation payments, where an entity is provided a fixed payment to cover all medical expenses for a patient, unrelated to a specific episode of care, but for all care for a fixed period of time. Health care providers are incentivized to keep patients healthy to keep costs down and retain greater percentages of the payment. In original Centennial Care contracts, HSD required MCOs to incorporate several payment reform projects, but requirements have been reduced in subsequent contract amendments. HSD originally required MCOs to institute payment reform projects related to adult diabetes patients and pediatric asthma patients, as well as a bundled payment project for hospitalization and follow-up care for patients with pneumonia and congestive heart failure. In 2014, HSD amended the contract provisions related to payment reform projects, removing the language requiring the four specific projects and instead asking MCOs to submit proposals for payment reform projects. MCOs submitted their proposed projects in 2015 and HSD approved at least one project for each MCO. According to the Centennial Care annual report to CMS, each MCO is now working on an accountable care organization (ACO) type project with providers around the state (defined in Appendix C.) HSD also reportedly has commitment from MCOs to continue exploring a bundled payment project. MCOs focused their payment reform projects on 12 providers groups, all of which will be subject to a shared savings or an accountable care organization payment reform model, and four of which will also be pilot locations for bundled payments or episode of care payments. However the bundled payment project is no longer required under contract. In the original Centennial Care contract, HSD required MCOs to develop performance measures (including clinical measures), evaluation methodology, and provider incentives for payment reform projects. However, HSD has now requested MCOs “align the performance measures from their payment reform projects with those measures HSD already requires or will be capturing for broader purposes.” HSD instructed MCOs to use a core set of “seven of the eight performance [measures] that are included in the Centennial Care contract, but additional measures are allowed.” The eight performance measures HSD is referring to are listed in Table 10. HSD goes on to state in the MCO contracts performance measures shall be based on HEDIS. HEDIS, or the Healthcare Effectiveness Data and Information Set, is managed through NCQA with the goal of measuring performance on elements of care and service related to health care programs. However, neither HEDIS measures in general, nor the HEDIS measures HSD placed in MCO contracts specifically, will be able to measure the effectiveness of payment reform projects on reducing medical costs or utilization.
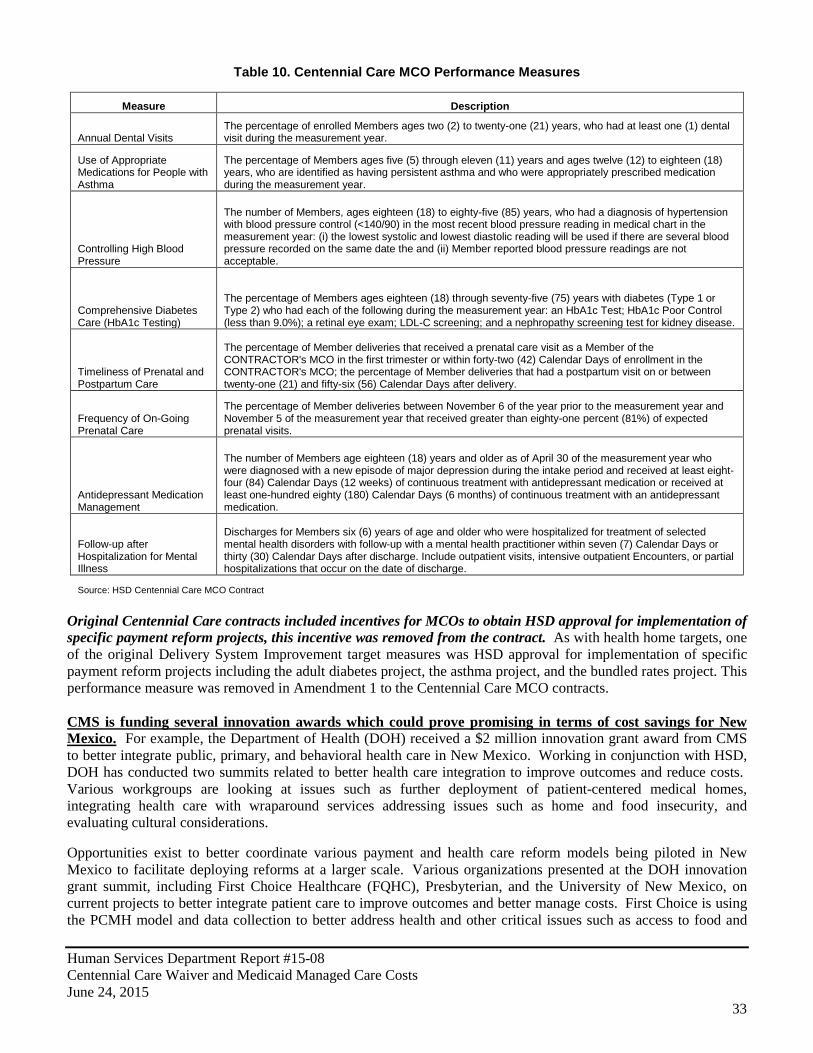
Human Services Department Report #15-08 Centennial Care Waiver and Medicaid Managed Care Costs June 24, 2015
33
Table 10. Centennial Care MCO Performance Measures
Measure Description
Annual Dental Visits The percentage of enrolled Members ages two (2) to twenty-one (21) years, who had at least one (1) dental visit during the measurement year.
Use of Appropriate Medications for People with Asthma
The percentage of Members ages five (5) through eleven (11) years and ages twelve (12) to eighteen (18) years, who are identified as having persistent asthma and who were appropriately prescribed medication during the measurement year.
Controlling High Blood Pressure
The number of Members, ages eighteen (18) to eighty-five (85) years, who had a diagnosis of hypertension with blood pressure control (<140/90) in the most recent blood pressure reading in medical chart in the measurement year: (i) the lowest systolic and lowest diastolic reading will be used if there are several blood pressure recorded on the same date the and (ii) Member reported blood pressure readings are not acceptable.
Comprehensive Diabetes Care (HbA1c Testing)
The percentage of Members ages eighteen (18) through seventy-five (75) years with diabetes (Type 1 or Type 2) who had each of the following during the measurement year: an HbA1c Test; HbA1c Poor Control (less than 9.0%); a retinal eye exam; LDL-C screening; and a nephropathy screening test for kidney disease.
Timeliness of Prenatal and Postpartum Care
The percentage of Member deliveries that received a prenatal care visit as a Member of the CONTRACTOR's MCO in the first trimester or within forty-two (42) Calendar Days of enrollment in the CONTRACTOR's MCO; the percentage of Member deliveries that had a postpartum visit on or between twenty-one (21) and fifty-six (56) Calendar Days after delivery.
Frequency of On-Going Prenatal Care
The percentage of Member deliveries between November 6 of the year prior to the measurement year and November 5 of the measurement year that received greater than eighty-one percent (81%) of expected prenatal visits.
Antidepressant Medication Management
The number of Members age eighteen (18) years and older as of April 30 of the measurement year who were diagnosed with a new episode of major depression during the intake period and received at least eight-four (84) Calendar Days (12 weeks) of continuous treatment with antidepressant medication or received at least one-hundred eighty (180) Calendar Days (6 months) of continuous treatment with an antidepressant medication.
Follow-up after Hospitalization for Mental Illness
Discharges for Members six (6) years of age and older who were hospitalized for treatment of selected mental health disorders with follow-up with a mental health practitioner within seven (7) Calendar Days or thirty (30) Calendar Days after discharge. Include outpatient visits, intensive outpatient Encounters, or partial hospitalizations that occur on the date of discharge.
Source: HSD Centennial Care MCO Contract
Original Centennial Care contracts included incentives for MCOs to obtain HSD approval for implementation of specific payment reform projects, this incentive was removed from the contract. As with health home targets, one of the original Delivery System Improvement target measures was HSD approval for implementation of specific payment reform projects including the adult diabetes project, the asthma project, and the bundled rates project. This performance measure was removed in Amendment 1 to the Centennial Care MCO contracts. CMS is funding several innovation awards which could prove promising in terms of cost savings for New Mexico. For example, the Department of Health (DOH) received a $2 million innovation grant award from CMS to better integrate public, primary, and behavioral health care in New Mexico. Working in conjunction with HSD, DOH has conducted two summits related to better health care integration to improve outcomes and reduce costs. Various workgroups are looking at issues such as further deployment of patient-centered medical homes, integrating health care with wraparound services addressing issues such as home and food insecurity, and evaluating cultural considerations.
Opportunities exist to better coordinate various payment and health care reform models being piloted in New Mexico to facilitate deploying reforms at a larger scale. Various organizations presented at the DOH innovation grant summit, including First Choice Healthcare (FQHC), Presbyterian, and the University of New Mexico, on current projects to better integrate patient care to improve outcomes and better manage costs. First Choice is using the PCMH model and data collection to better address health and other critical issues such as access to food and
Human Services Department Report #15-08 Centennial Care Waiver and Medicaid Managed Care Costs June 24, 2015
34
housing for its patients. The University of New Mexico is working with Hidalgo Medical Services on various integrated primary care including training for future primary care providers.
The Centers for Medicare and Medicaid Services funded five payment and service delivery reform projects in New Mexico collectively called health care innovation awards. CMS distributed two rounds of health care innovation awards with New Mexico selected for five projects in round one and one project in round two (Appendix D). According to CMS, all round one projects are anticipated to result in cost savings over three years, the round two project being conducted in New Mexico has no specific estimated cost savings. Initial evaluations of the five projects are mixed and reflect hurdles introduced by Centennial Care and MCOs. Although most evaluations of projects state it is too early to share conclusions, some information around implementation and cost is available. For example, the evaluation of the $8.4 million investment in the ECHO Care project at the UNM Health Sciences Center cited significant challenges in targeting interventions to high risk clients due to incorrect or incomplete/missing Medicaid data resulting in a slower than expected recruitment into the program. The evaluation also cited implementation of Centennial Care as requiring a renegotiation of agreements with Medicaid vendors and negotiations on data-sharing with MCOs who “compete for enrollees rather than collaborating to coordinate care.” The Innovative Oncology Business Solutions, Inc. (IOBS) COME HOME model lowers cost of care and hospitalizations. Evaluators found IOBS’s program site in New Mexico, which had the longest program implementation experience, had a lower cost of care and acute hospitalizations compared to other sites. The COME HOME model originated in New Mexico and has been expanded to other practices. Evaluators submit lower rates could reflect New Mexico’s greater experience with the model compared to other states.
Human Services Department Report #15-08 Centennial Care Waiver and Medicaid Managed Care Costs June 24, 2015
35
Recommendations: HSD should amend the state plan amendment application for health homes to include health homes for chronic physical health conditions such as diabetes and cardiovascular disease. HSD should leverage the existing network of patient-centered medical homes to deploy these services. HSD should consider taking steps to improve the Health Risk Assessment (HRA) completion rates including standardizing HRA procedures and forms. HSD should require in contract that Centennial Care initiatives including care coordination and the member rewards program spend at least 85 percent of funding on direct services leaving up to 15 percent for administrative expenditures. HSD should strengthen contract requirements for MCOs to incorporate payment and delivery reforms. HSD should evaluate the benefits of care coordination to determine if the benefits are outweighing the costs. HSD, in conjunction with LFC and DFA, should develop performance measures specific to Centennial Care initiatives to include in quarterly performance reporting.
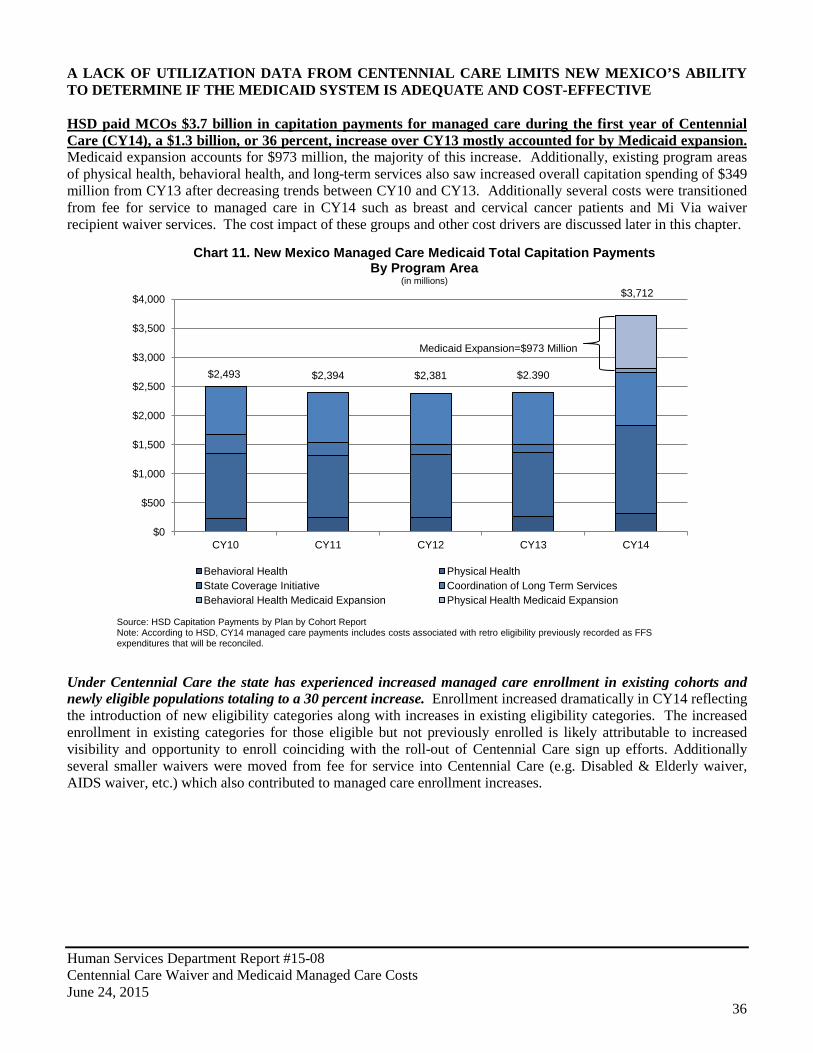
Human Services Department Report #15-08 Centennial Care Waiver and Medicaid Managed Care Costs June 24, 2015
36
A LACK OF UTILIZATION DATA FROM CENTENNIAL CARE LIMITS NEW MEXICO’S ABILITY TO DETERMINE IF THE MEDICAID SYSTEM IS ADEQUATE AND COST-EFFECTIVE HSD paid MCOs $3.7 billion in capitation payments for managed care during the first year of Centennial Care (CY14), a $1.3 billion, or 36 percent, increase over CY13 mostly accounted for by Medicaid expansion. Medicaid expansion accounts for $973 million, the majority of this increase. Additionally, existing program areas of physical health, behavioral health, and long-term services also saw increased overall capitation spending of $349 million from CY13 after decreasing trends between CY10 and CY13. Additionally several costs were transitioned from fee for service to managed care in CY14 such as breast and cervical cancer patients and Mi Via waiver recipient waiver services. The cost impact of these groups and other cost drivers are discussed later in this chapter.
Under Centennial Care the state has experienced increased managed care enrollment in existing cohorts and newly eligible populations totaling to a 30 percent increase. Enrollment increased dramatically in CY14 reflecting the introduction of new eligibility categories along with increases in existing eligibility categories. The increased enrollment in existing categories for those eligible but not previously enrolled is likely attributable to increased visibility and opportunity to enroll coinciding with the roll-out of Centennial Care sign up efforts. Additionally several smaller waivers were moved from fee for service into Centennial Care (e.g. Disabled & Elderly waiver, AIDS waiver, etc.) which also contributed to managed care enrollment increases.
$2,493 $2,394 $2,381 $2.390
$3,712
$0
$500
$1,000
$1,500
$2,000
$2,500
$3,000
$3,500
$4,000
CY10 CY11 CY12 CY13 CY14
Chart 11. New Mexico Managed Care Medicaid Total Capitation Payments By Program Area
(in millions)
Behavioral Health Physical Health State Coverage Initiative Coordination of Long Term Services Behavioral Health Medicaid Expansion Physical Health Medicaid Expansion
Source: HSD Capitation Payments by Plan by Cohort Report Note: According to HSD, CY14 managed care payments includes costs associated with retro eligibility previously recorded as FFS expenditures that will be reconciled.
Medicaid Expansion=$973 Million
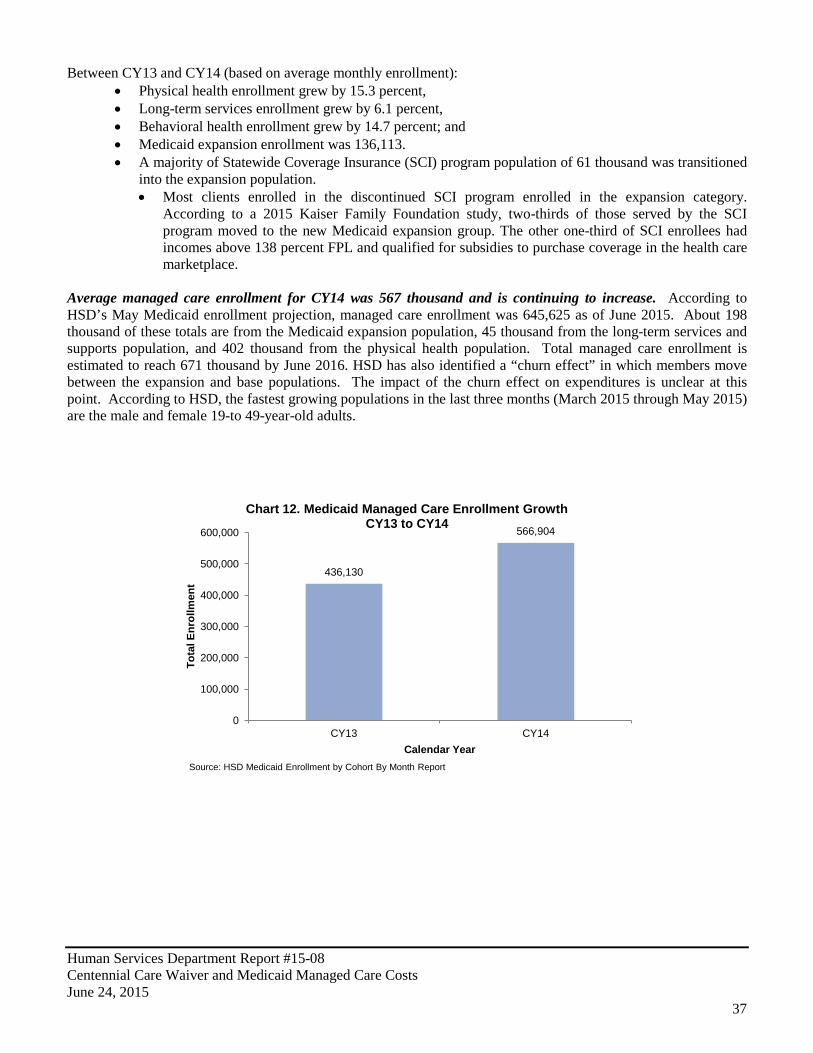
Human Services Department Report #15-08 Centennial Care Waiver and Medicaid Managed Care Costs June 24, 2015
37
Between CY13 and CY14 (based on average monthly enrollment): • Physical health enrollment grew by 15.3 percent, • Long-term services enrollment grew by 6.1 percent, • Behavioral health enrollment grew by 14.7 percent; and • Medicaid expansion enrollment was 136,113. • A majority of Statewide Coverage Insurance (SCI) program population of 61 thousand was transitioned
into the expansion population. • Most clients enrolled in the discontinued SCI program enrolled in the expansion category.
According to a 2015 Kaiser Family Foundation study, two-thirds of those served by the SCI program moved to the new Medicaid expansion group. The other one-third of SCI enrollees had incomes above 138 percent FPL and qualified for subsidies to purchase coverage in the health care marketplace.
Average managed care enrollment for CY14 was 567 thousand and is continuing to increase. According to HSD’s May Medicaid enrollment projection, managed care enrollment was 645,625 as of June 2015. About 198 thousand of these totals are from the Medicaid expansion population, 45 thousand from the long-term services and supports population, and 402 thousand from the physical health population. Total managed care enrollment is estimated to reach 671 thousand by June 2016. HSD has also identified a “churn effect” in which members move between the expansion and base populations. The impact of the churn effect on expenditures is unclear at this point. According to HSD, the fastest growing populations in the last three months (March 2015 through May 2015) are the male and female 19-to 49-year-old adults.
436,130
566,904
0
100,000
200,000
300,000
400,000
500,000
600,000
CY13 CY14
Tota
l Enr
ollm
ent
Calendar Year
Chart 12. Medicaid Managed Care Enrollment Growth CY13 to CY14
Source: HSD Medicaid Enrollment by Cohort By Month Report
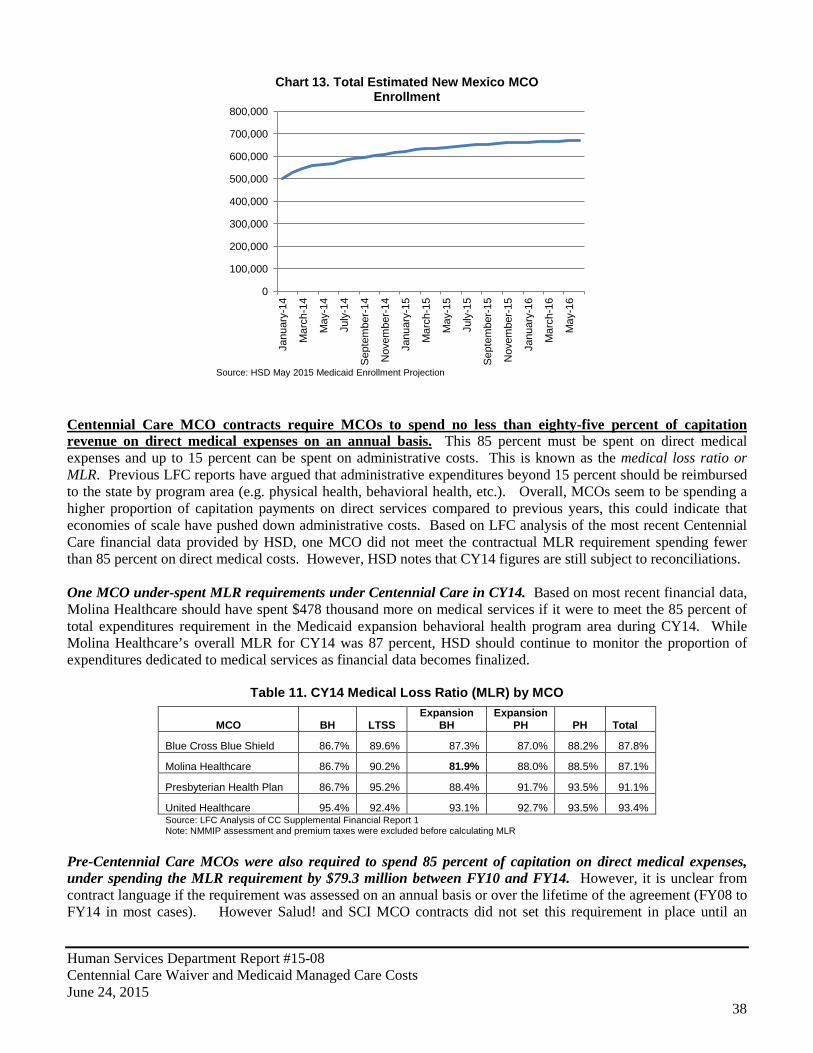
Human Services Department Report #15-08 Centennial Care Waiver and Medicaid Managed Care Costs June 24, 2015
38
Centennial Care MCO contracts require MCOs to spend no less than eighty-five percent of capitation revenue on direct medical expenses on an annual basis. This 85 percent must be spent on direct medical expenses and up to 15 percent can be spent on administrative costs. This is known as the medical loss ratio or MLR. Previous LFC reports have argued that administrative expenditures beyond 15 percent should be reimbursed to the state by program area (e.g. physical health, behavioral health, etc.). Overall, MCOs seem to be spending a higher proportion of capitation payments on direct services compared to previous years, this could indicate that economies of scale have pushed down administrative costs. Based on LFC analysis of the most recent Centennial Care financial data provided by HSD, one MCO did not meet the contractual MLR requirement spending fewer than 85 percent on direct medical costs. However, HSD notes that CY14 figures are still subject to reconciliations. One MCO under-spent MLR requirements under Centennial Care in CY14. Based on most recent financial data, Molina Healthcare should have spent $478 thousand more on medical services if it were to meet the 85 percent of total expenditures requirement in the Medicaid expansion behavioral health program area during CY14. While Molina Healthcare’s overall MLR for CY14 was 87 percent, HSD should continue to monitor the proportion of expenditures dedicated to medical services as financial data becomes finalized.
Table 11. CY14 Medical Loss Ratio (MLR) by MCO
MCO BH LTSS Expansion
BH Expansion
PH PH Total
Blue Cross Blue Shield 86.7% 89.6% 87.3% 87.0% 88.2% 87.8%
Molina Healthcare 86.7% 90.2% 81.9% 88.0% 88.5% 87.1%
Presbyterian Health Plan 86.7% 95.2% 88.4% 91.7% 93.5% 91.1%
United Healthcare 95.4% 92.4% 93.1% 92.7% 93.5% 93.4% Source: LFC Analysis of CC Supplemental Financial Report 1 Note: NMMIP assessment and premium taxes were excluded before calculating MLR
Pre-Centennial Care MCOs were also required to spend 85 percent of capitation on direct medical expenses, under spending the MLR requirement by $79.3 million between FY10 and FY14. However, it is unclear from contract language if the requirement was assessed on an annual basis or over the lifetime of the agreement (FY08 to FY14 in most cases). However Salud! and SCI MCO contracts did not set this requirement in place until an
0
100,000
200,000
300,000
400,000
500,000
600,000
700,000
800,000
Janu
ary-
14
Mar
ch-1
4
May
-14
July
-14
Sep
tem
ber-1
4
Nov
embe
r-14
Janu
ary-
15
Mar
ch-1
5
May
-15
July
-15
Sep
tem
ber-1
5
Nov
embe
r-15
Janu
ary-
16
Mar
ch-1
6
May
-16
Chart 13. Total Estimated New Mexico MCO Enrollment
Source: HSD May 2015 Medicaid Enrollment Projection
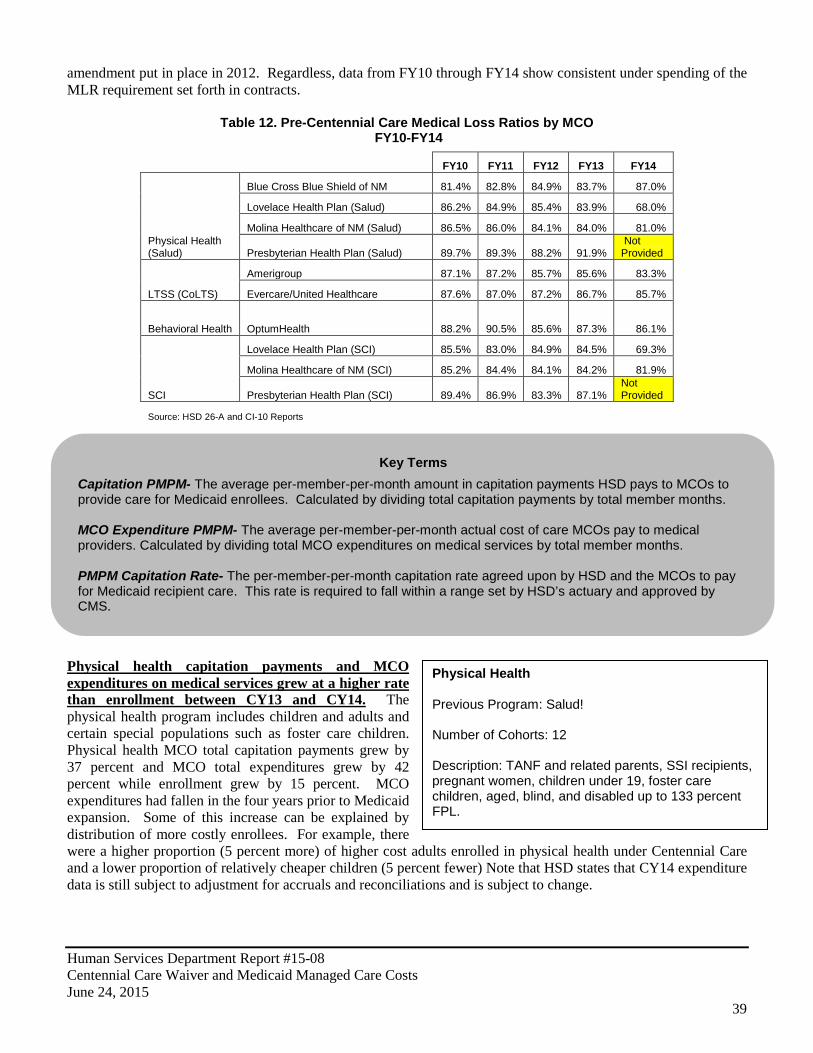
Human Services Department Report #15-08 Centennial Care Waiver and Medicaid Managed Care Costs June 24, 2015
39
Physical Health
Previous Program: Salud! Number of Cohorts: 12 Description: TANF and related parents, SSI recipients, pregnant women, children under 19, foster care children, aged, blind, and disabled up to 133 percent FPL.
amendment put in place in 2012. Regardless, data from FY10 through FY14 show consistent under spending of the MLR requirement set forth in contracts.
Table 12. Pre-Centennial Care Medical Loss Ratios by MCO FY10-FY14
FY10 FY11 FY12 FY13 FY14
Physical Health (Salud)
Blue Cross Blue Shield of NM 81.4% 82.8% 84.9% 83.7% 87.0%
Lovelace Health Plan (Salud) 86.2% 84.9% 85.4% 83.9% 68.0%
Molina Healthcare of NM (Salud) 86.5% 86.0% 84.1% 84.0% 81.0%
Presbyterian Health Plan (Salud) 89.7% 89.3% 88.2% 91.9% Not Provided
LTSS (CoLTS)
Amerigroup 87.1% 87.2% 85.7% 85.6% 83.3%
Evercare/United Healthcare 87.6% 87.0% 87.2% 86.7% 85.7%
Behavioral Health OptumHealth 88.2% 90.5% 85.6% 87.3% 86.1%
SCI
Lovelace Health Plan (SCI) 85.5% 83.0% 84.9% 84.5% 69.3%
Molina Healthcare of NM (SCI) 85.2% 84.4% 84.1% 84.2% 81.9%
Presbyterian Health Plan (SCI) 89.4% 86.9% 83.3% 87.1% Not Provided
Source: HSD 26-A and CI-10 Reports
Physical health capitation payments and MCO expenditures on medical services grew at a higher rate than enrollment between CY13 and CY14. The physical health program includes children and adults and certain special populations such as foster care children. Physical health MCO total capitation payments grew by 37 percent and MCO total expenditures grew by 42 percent while enrollment grew by 15 percent. MCO expenditures had fallen in the four years prior to Medicaid expansion. Some of this increase can be explained by distribution of more costly enrollees. For example, there were a higher proportion (5 percent more) of higher cost adults enrolled in physical health under Centennial Care and a lower proportion of relatively cheaper children (5 percent fewer) Note that HSD states that CY14 expenditure data is still subject to adjustment for accruals and reconciliations and is subject to change.
Key Terms
Capitation PMPM- The average per-member-per-month amount in capitation payments HSD pays to MCOs to provide care for Medicaid enrollees. Calculated by dividing total capitation payments by total member months. MCO Expenditure PMPM- The average per-member-per-month actual cost of care MCOs pay to medical providers. Calculated by dividing total MCO expenditures on medical services by total member months. PMPM Capitation Rate- The per-member-per-month capitation rate agreed upon by HSD and the MCOs to pay for Medicaid recipient care. This rate is required to fall within a range set by HSD’s actuary and approved by CMS.

Human Services Department Report #15-08 Centennial Care Waiver and Medicaid Managed Care Costs June 24, 2015
40
Table 13. Physical Health Managed Care Statistics CY10-CY14
Calendar Year Enrollment1
Member Months
Capitation Payments from HSD to MCOs (millions)
Capitation PMPM
(Total HSD Capitation Payments / Member Months)
Total MCO expenditures on medical
services (millions)
MCO PMPM (Total MCO
expenditures on medical services / Member Months)
CY2010 339,000 3,944,435 $1,105.20 $280 $978.10 $248
CY2011 346,066 4,025,252 $1,064.90 $265 $950.10 $236
CY2012 341,716 4,037,875 $1,071.80 $265 $931.00 $231
CY2013 335,458 3,953,297 $1,099.10 $278 $914.30 $231
CY2014 386,659 4,669,876 $1,503.50 $322 $1,294.62 $277 1 Average enrollment over 12 months
Source: LFC Analysis of HSD 30A, CC Financial Reports, FY10-CY14 Capitation Payments by Plan by Cohort, Medicaid Enrollment by Cohort by Month All MCOs Report
Physical health cost drivers are widespread and have grown significantly between CY13 and CY14. Overall, significant growth in MCO expenditures has occurred in all types of service delivery except for pharmacy which underwent an $8 million decrease in spending. The largest increases have been in inpatient services, physicians and other practitioners, and sub-capitations (capitated payment agreements between MCOs and providers). The May HSD Medicaid projection also reflects increased PMPM and predicted that enrollment, capitations, and PMPM will continue to rise in 2015.
Inpatient $211 23%
Other $169 19%
Physicians $141 15%
Outpatient $139 15%
Subcap $68 7%
Pharmacy $107 12%
Dental $80 9%
Chart 14. Physical Health MCO Expenditures by Service Type
CY2013 (in millions)
Total: $914
Source; HSD 30A Report
Inpatient $328 25%
Other $243 19%
Physicians $232 18%
Outpatient $171 13%
Subcap $149 11%
Pharmacy $99 8%
Dental $80 6%
Chart 15. Physical Health MCO Expenditures by Service Type
CY2014* (in millions)
Total: $1,295
Source: HSD CC Financial Report 1 *Note: Does not include Medicaid Expansion
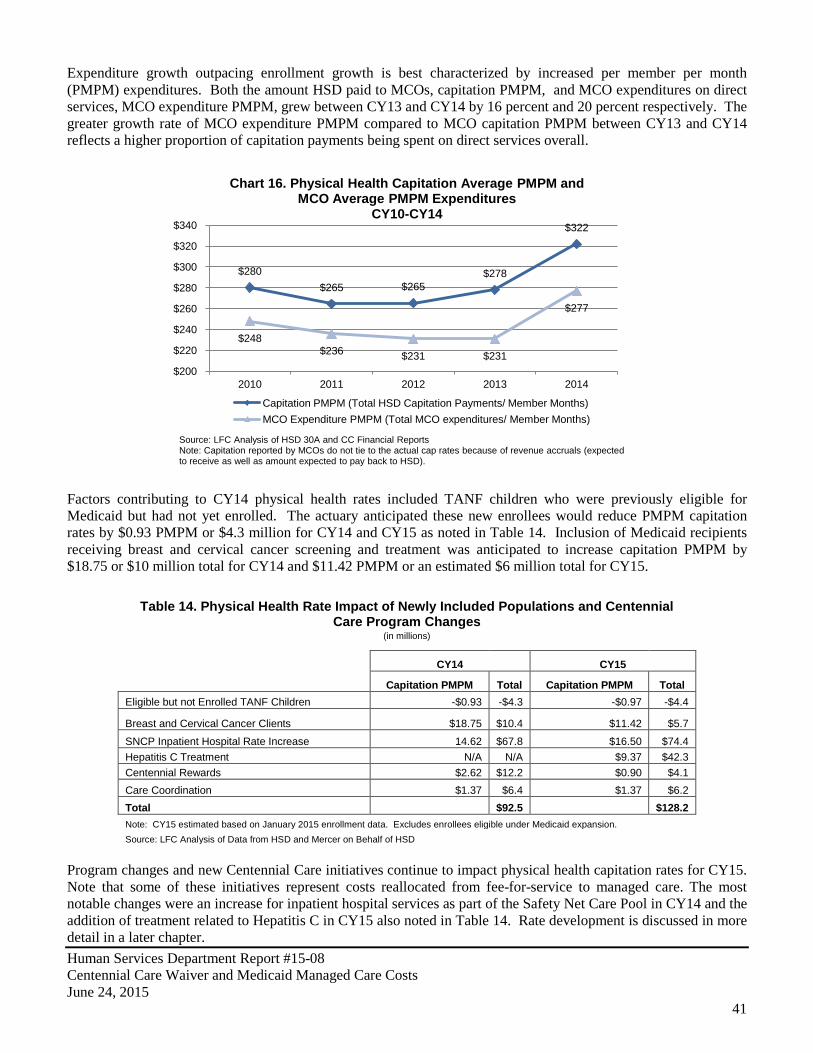
Human Services Department Report #15-08 Centennial Care Waiver and Medicaid Managed Care Costs June 24, 2015
41
Expenditure growth outpacing enrollment growth is best characterized by increased per member per month (PMPM) expenditures. Both the amount HSD paid to MCOs, capitation PMPM, and MCO expenditures on direct services, MCO expenditure PMPM, grew between CY13 and CY14 by 16 percent and 20 percent respectively. The greater growth rate of MCO expenditure PMPM compared to MCO capitation PMPM between CY13 and CY14 reflects a higher proportion of capitation payments being spent on direct services overall.
Factors contributing to CY14 physical health rates included TANF children who were previously eligible for Medicaid but had not yet enrolled. The actuary anticipated these new enrollees would reduce PMPM capitation rates by $0.93 PMPM or $4.3 million for CY14 and CY15 as noted in Table 14. Inclusion of Medicaid recipients receiving breast and cervical cancer screening and treatment was anticipated to increase capitation PMPM by $18.75 or $10 million total for CY14 and $11.42 PMPM or an estimated $6 million total for CY15.
Table 14. Physical Health Rate Impact of Newly Included Populations and Centennial Care Program Changes
(in millions)
CY14 CY15
Capitation PMPM Total Capitation PMPM Total
Eligible but not Enrolled TANF Children -$0.93 -$4.3 -$0.97 -$4.4
Breast and Cervical Cancer Clients $18.75 $10.4 $11.42 $5.7
SNCP Inpatient Hospital Rate Increase 14.62 $67.8 $16.50 $74.4 Hepatitis C Treatment N/A N/A $9.37 $42.3 Centennial Rewards $2.62 $12.2 $0.90 $4.1 Care Coordination $1.37 $6.4 $1.37 $6.2 Total $92.5 $128.2 Note: CY15 estimated based on January 2015 enrollment data. Excludes enrollees eligible under Medicaid expansion. Source: LFC Analysis of Data from HSD and Mercer on Behalf of HSD
Program changes and new Centennial Care initiatives continue to impact physical health capitation rates for CY15. Note that some of these initiatives represent costs reallocated from fee-for-service to managed care. The most notable changes were an increase for inpatient hospital services as part of the Safety Net Care Pool in CY14 and the addition of treatment related to Hepatitis C in CY15 also noted in Table 14. Rate development is discussed in more detail in a later chapter.
$280 $265 $265
$278
$322
$248 $236 $231 $231
$277
$200
$220
$240
$260
$280
$300
$320
$340
2010 2011 2012 2013 2014
Chart 16. Physical Health Capitation Average PMPM and MCO Average PMPM Expenditures
CY10-CY14
Capitation PMPM (Total HSD Capitation Payments/ Member Months) MCO Expenditure PMPM (Total MCO expenditures/ Member Months)
Source: LFC Analysis of HSD 30A and CC Financial Reports Note: Capitation reported by MCOs do not tie to the actual cap rates because of revenue accruals (expected to receive as well as amount expected to pay back to HSD).
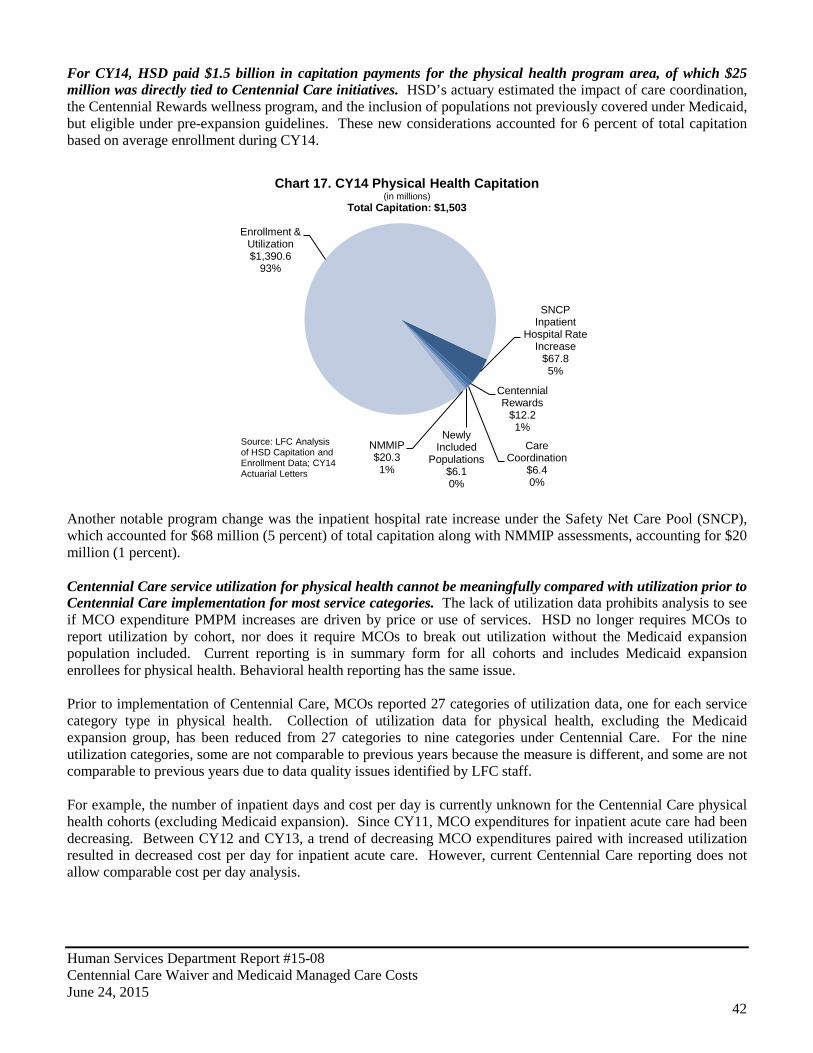
Human Services Department Report #15-08 Centennial Care Waiver and Medicaid Managed Care Costs June 24, 2015
42
For CY14, HSD paid $1.5 billion in capitation payments for the physical health program area, of which $25 million was directly tied to Centennial Care initiatives. HSD’s actuary estimated the impact of care coordination, the Centennial Rewards wellness program, and the inclusion of populations not previously covered under Medicaid, but eligible under pre-expansion guidelines. These new considerations accounted for 6 percent of total capitation based on average enrollment during CY14.
Another notable program change was the inpatient hospital rate increase under the Safety Net Care Pool (SNCP), which accounted for $68 million (5 percent) of total capitation along with NMMIP assessments, accounting for $20 million (1 percent). Centennial Care service utilization for physical health cannot be meaningfully compared with utilization prior to Centennial Care implementation for most service categories. The lack of utilization data prohibits analysis to see if MCO expenditure PMPM increases are driven by price or use of services. HSD no longer requires MCOs to report utilization by cohort, nor does it require MCOs to break out utilization without the Medicaid expansion population included. Current reporting is in summary form for all cohorts and includes Medicaid expansion enrollees for physical health. Behavioral health reporting has the same issue. Prior to implementation of Centennial Care, MCOs reported 27 categories of utilization data, one for each service category type in physical health. Collection of utilization data for physical health, excluding the Medicaid expansion group, has been reduced from 27 categories to nine categories under Centennial Care. For the nine utilization categories, some are not comparable to previous years because the measure is different, and some are not comparable to previous years due to data quality issues identified by LFC staff. For example, the number of inpatient days and cost per day is currently unknown for the Centennial Care physical health cohorts (excluding Medicaid expansion). Since CY11, MCO expenditures for inpatient acute care had been decreasing. Between CY12 and CY13, a trend of decreasing MCO expenditures paired with increased utilization resulted in decreased cost per day for inpatient acute care. However, current Centennial Care reporting does not allow comparable cost per day analysis.
SNCP Inpatient
Hospital Rate Increase
$67.8 5%
Centennial Rewards
$12.2 1%
Care Coordination
$6.4 0%
Newly Included
Populations $6.1 0%
NMMIP $20.3 1%
Enrollment & Utilization $1,390.6
93%
Chart 17. CY14 Physical Health Capitation (in millions)
Total Capitation: $1,503
Source: LFC Analysis of HSD Capitation and Enrollment Data; CY14 Actuarial Letters
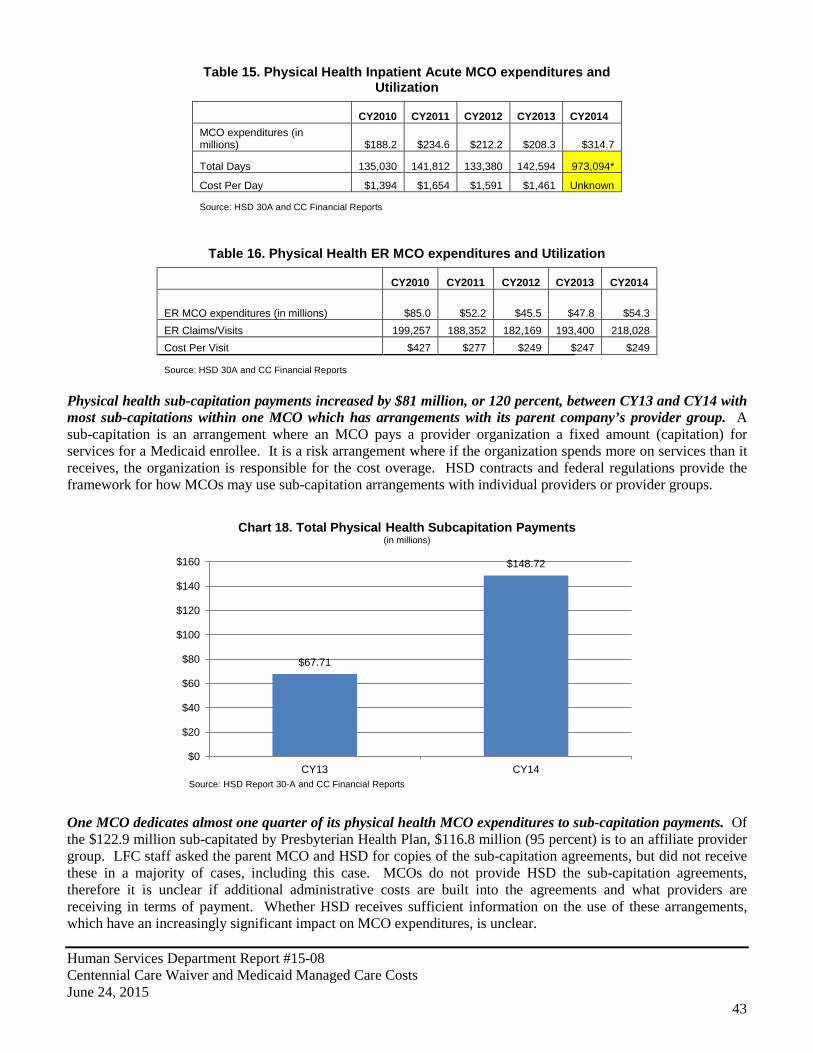
Human Services Department Report #15-08 Centennial Care Waiver and Medicaid Managed Care Costs June 24, 2015
43
Table 15. Physical Health Inpatient Acute MCO expenditures and Utilization
CY2010 CY2011 CY2012 CY2013 CY2014 MCO expenditures (in millions) $188.2 $234.6 $212.2 $208.3 $314.7
Total Days 135,030 141,812 133,380 142,594 973,094*
Cost Per Day $1,394 $1,654 $1,591 $1,461 Unknown
Source: HSD 30A and CC Financial Reports
Table 16. Physical Health ER MCO expenditures and Utilization
CY2010 CY2011 CY2012 CY2013 CY2014
ER MCO expenditures (in millions) $85.0 $52.2 $45.5 $47.8 $54.3 ER Claims/Visits 199,257 188,352 182,169 193,400 218,028 Cost Per Visit $427 $277 $249 $247 $249
Source: HSD 30A and CC Financial Reports
Physical health sub-capitation payments increased by $81 million, or 120 percent, between CY13 and CY14 with most sub-capitations within one MCO which has arrangements with its parent company’s provider group. A sub-capitation is an arrangement where an MCO pays a provider organization a fixed amount (capitation) for services for a Medicaid enrollee. It is a risk arrangement where if the organization spends more on services than it receives, the organization is responsible for the cost overage. HSD contracts and federal regulations provide the framework for how MCOs may use sub-capitation arrangements with individual providers or provider groups.
One MCO dedicates almost one quarter of its physical health MCO expenditures to sub-capitation payments. Of the $122.9 million sub-capitated by Presbyterian Health Plan, $116.8 million (95 percent) is to an affiliate provider group. LFC staff asked the parent MCO and HSD for copies of the sub-capitation agreements, but did not receive these in a majority of cases, including this case. MCOs do not provide HSD the sub-capitation agreements, therefore it is unclear if additional administrative costs are built into the agreements and what providers are receiving in terms of payment. Whether HSD receives sufficient information on the use of these arrangements, which have an increasingly significant impact on MCO expenditures, is unclear.
$67.71
$148.72
$0
$20
$40
$60
$80
$100
$120
$140
$160
CY13 CY14
Chart 18. Total Physical Health Subcapitation Payments (in millions)
Source: HSD Report 30-A and CC Financial Reports
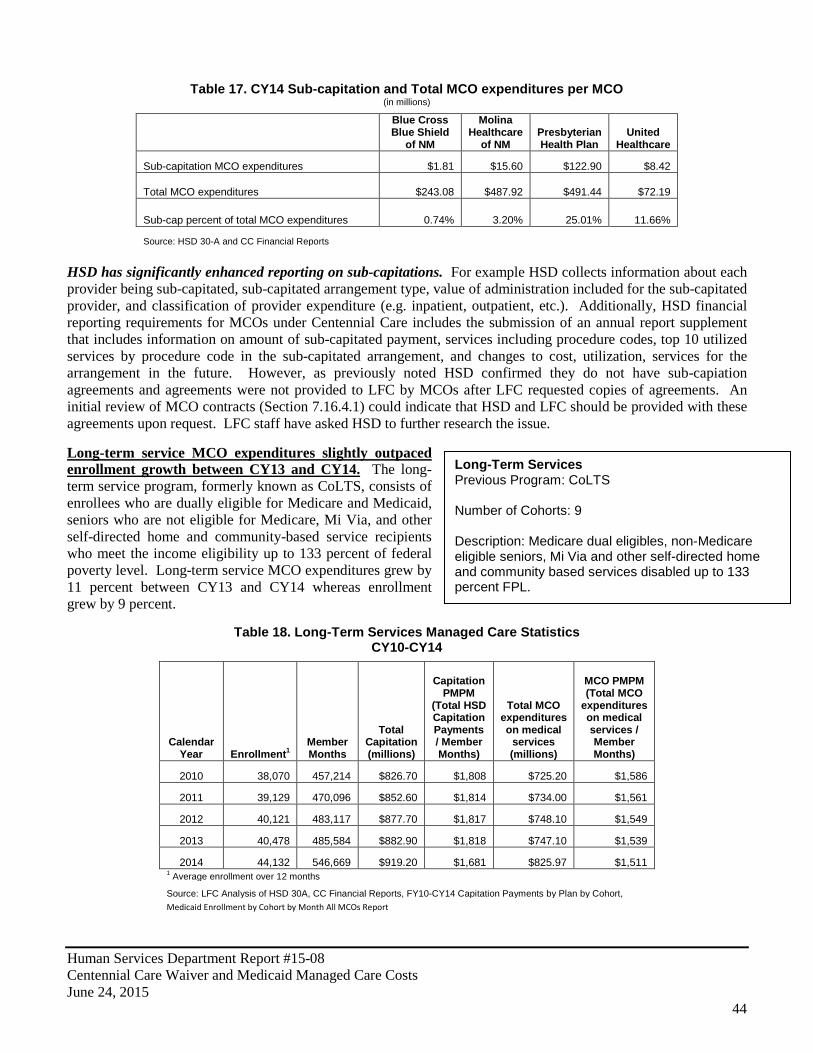
Human Services Department Report #15-08 Centennial Care Waiver and Medicaid Managed Care Costs June 24, 2015
44
Long-Term Services Previous Program: CoLTS Number of Cohorts: 9 Description: Medicare dual eligibles, non-Medicare eligible seniors, Mi Via and other self-directed home and community based services disabled up to 133 percent FPL.
Table 17. CY14 Sub-capitation and Total MCO expenditures per MCO
(in millions)
Blue Cross Blue Shield
of NM
Molina Healthcare
of NM Presbyterian Health Plan
United Healthcare
Sub-capitation MCO expenditures $1.81 $15.60 $122.90 $8.42
Total MCO expenditures $243.08 $487.92 $491.44 $72.19
Sub-cap percent of total MCO expenditures 0.74% 3.20% 25.01% 11.66%
Source: HSD 30-A and CC Financial Reports
HSD has significantly enhanced reporting on sub-capitations. For example HSD collects information about each provider being sub-capitated, sub-capitated arrangement type, value of administration included for the sub-capitated provider, and classification of provider expenditure (e.g. inpatient, outpatient, etc.). Additionally, HSD financial reporting requirements for MCOs under Centennial Care includes the submission of an annual report supplement that includes information on amount of sub-capitated payment, services including procedure codes, top 10 utilized services by procedure code in the sub-capitated arrangement, and changes to cost, utilization, services for the arrangement in the future. However, as previously noted HSD confirmed they do not have sub-capiation agreements and agreements were not provided to LFC by MCOs after LFC requested copies of agreements. An initial review of MCO contracts (Section 7.16.4.1) could indicate that HSD and LFC should be provided with these agreements upon request. LFC staff have asked HSD to further research the issue. Long-term service MCO expenditures slightly outpaced enrollment growth between CY13 and CY14. The long-term service program, formerly known as CoLTS, consists of enrollees who are dually eligible for Medicare and Medicaid, seniors who are not eligible for Medicare, Mi Via, and other self-directed home and community-based service recipients who meet the income eligibility up to 133 percent of federal poverty level. Long-term service MCO expenditures grew by 11 percent between CY13 and CY14 whereas enrollment grew by 9 percent.
Table 18. Long-Term Services Managed Care Statistics CY10-CY14
Calendar Year Enrollment1
Member Months
Total Capitation (millions)
Capitation PMPM
(Total HSD Capitation Payments / Member Months)
Total MCO expenditures on medical
services (millions)
MCO PMPM (Total MCO
expenditures on medical services / Member Months)
2010 38,070 457,214 $826.70 $1,808 $725.20 $1,586
2011 39,129 470,096 $852.60 $1,814 $734.00 $1,561
2012 40,121 483,117 $877.70 $1,817 $748.10 $1,549
2013 40,478 485,584 $882.90 $1,818 $747.10 $1,539
2014 44,132 546,669 $919.20 $1,681 $825.97 $1,511 1 Average enrollment over 12 months
Source: LFC Analysis of HSD 30A, CC Financial Reports, FY10-CY14 Capitation Payments by Plan by Cohort, Medicaid Enrollment by Cohort by Month All MCOs Report
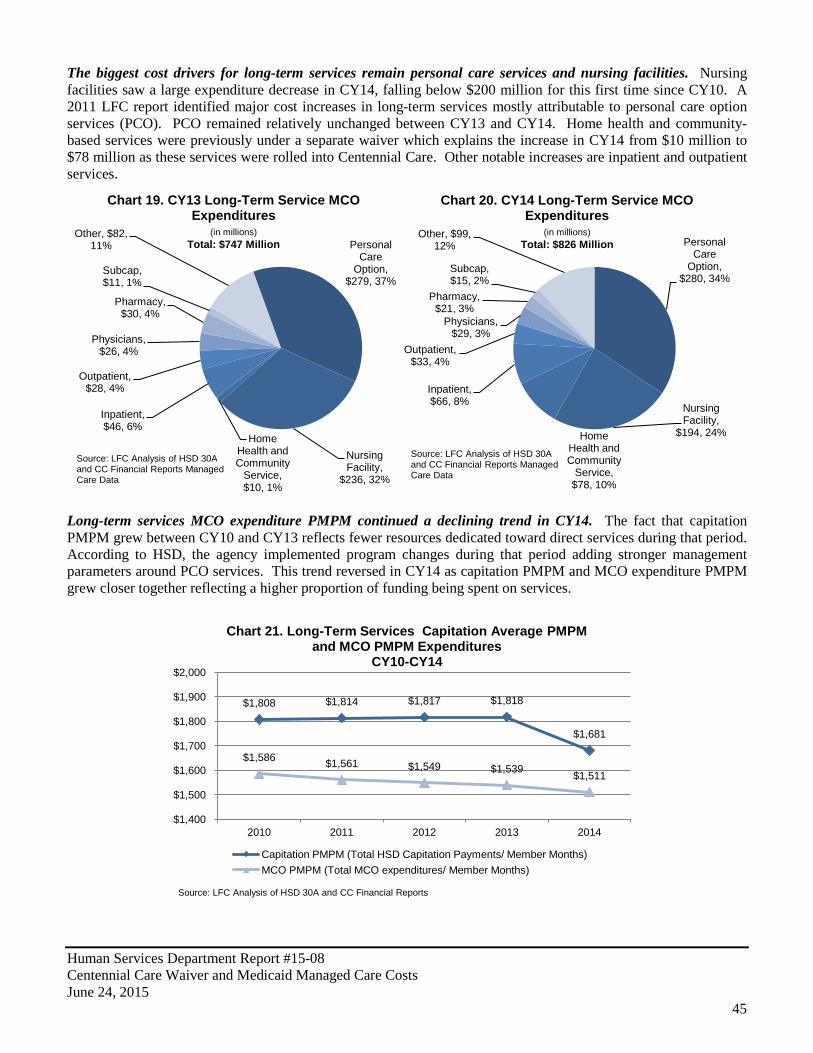
Human Services Department Report #15-08 Centennial Care Waiver and Medicaid Managed Care Costs June 24, 2015
45
The biggest cost drivers for long-term services remain personal care services and nursing facilities. Nursing facilities saw a large expenditure decrease in CY14, falling below $200 million for this first time since CY10. A 2011 LFC report identified major cost increases in long-term services mostly attributable to personal care option services (PCO). PCO remained relatively unchanged between CY13 and CY14. Home health and community-based services were previously under a separate waiver which explains the increase in CY14 from $10 million to $78 million as these services were rolled into Centennial Care. Other notable increases are inpatient and outpatient services.
Long-term services MCO expenditure PMPM continued a declining trend in CY14. The fact that capitation PMPM grew between CY10 and CY13 reflects fewer resources dedicated toward direct services during that period. According to HSD, the agency implemented program changes during that period adding stronger management parameters around PCO services. This trend reversed in CY14 as capitation PMPM and MCO expenditure PMPM grew closer together reflecting a higher proportion of funding being spent on services.
Personal Care
Option, $279, 37%
Nursing Facility,
$236, 32%
Home Health and Community
Service, $10, 1%
Inpatient, $46, 6%
Outpatient, $28, 4%
Physicians, $26, 4%
Pharmacy, $30, 4%
Subcap, $11, 1%
Other, $82, 11%
Chart 19. CY13 Long-Term Service MCO Expenditures
(in millions) Total: $747 Million
Source: LFC Analysis of HSD 30A and CC Financial Reports Managed Care Data
Personal Care
Option, $280, 34%
Nursing Facility,
$194, 24% Home Health and Community
Service, $78, 10%
Inpatient, $66, 8%
Outpatient, $33, 4%
Physicians, $29, 3%
Pharmacy, $21, 3%
Subcap, $15, 2%
Other, $99, 12%
Chart 20. CY14 Long-Term Service MCO Expenditures
(in millions) Total: $826 Million
Source: LFC Analysis of HSD 30A and CC Financial Reports Managed Care Data
$1,808 $1,814 $1,817 $1,818
$1,681
$1,586 $1,561 $1,549 $1,539 $1,511
$1,400
$1,500
$1,600
$1,700
$1,800
$1,900
$2,000
2010 2011 2012 2013 2014
Chart 21. Long-Term Services Capitation Average PMPM and MCO PMPM Expenditures
CY10-CY14
Capitation PMPM (Total HSD Capitation Payments/ Member Months) MCO PMPM (Total MCO expenditures/ Member Months)
Source: LFC Analysis of HSD 30A and CC Financial Reports
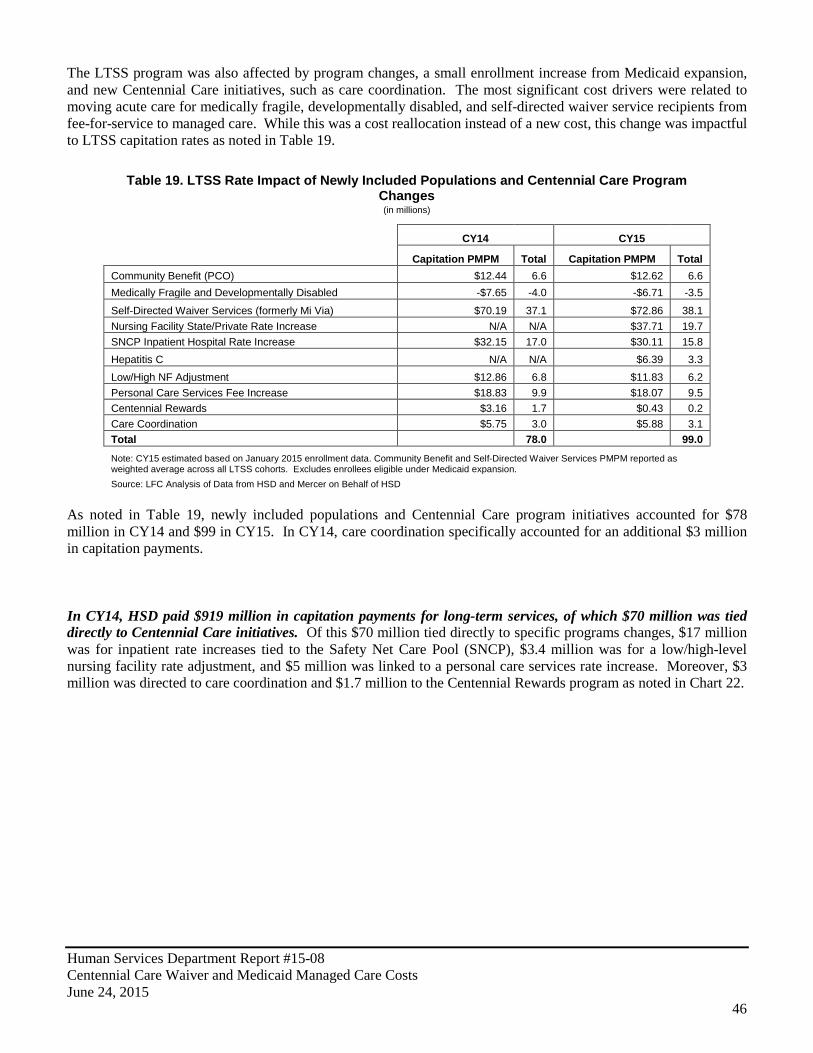
Human Services Department Report #15-08 Centennial Care Waiver and Medicaid Managed Care Costs June 24, 2015
46
The LTSS program was also affected by program changes, a small enrollment increase from Medicaid expansion, and new Centennial Care initiatives, such as care coordination. The most significant cost drivers were related to moving acute care for medically fragile, developmentally disabled, and self-directed waiver service recipients from fee-for-service to managed care. While this was a cost reallocation instead of a new cost, this change was impactful to LTSS capitation rates as noted in Table 19.
Table 19. LTSS Rate Impact of Newly Included Populations and Centennial Care Program Changes (in millions)
CY14 CY15
Capitation PMPM Total Capitation PMPM Total
Community Benefit (PCO) $12.44 6.6 $12.62 6.6 Medically Fragile and Developmentally Disabled -$7.65 -4.0 -$6.71 -3.5
Self-Directed Waiver Services (formerly Mi Via) $70.19 37.1 $72.86 38.1 Nursing Facility State/Private Rate Increase N/A N/A $37.71 19.7 SNCP Inpatient Hospital Rate Increase $32.15 17.0 $30.11 15.8 Hepatitis C N/A N/A $6.39 3.3 Low/High NF Adjustment $12.86 6.8 $11.83 6.2 Personal Care Services Fee Increase $18.83 9.9 $18.07 9.5 Centennial Rewards $3.16 1.7 $0.43 0.2 Care Coordination $5.75 3.0 $5.88 3.1 Total 78.0 99.0 Note: CY15 estimated based on January 2015 enrollment data. Community Benefit and Self-Directed Waiver Services PMPM reported as weighted average across all LTSS cohorts. Excludes enrollees eligible under Medicaid expansion. Source: LFC Analysis of Data from HSD and Mercer on Behalf of HSD
As noted in Table 19, newly included populations and Centennial Care program initiatives accounted for $78 million in CY14 and $99 in CY15. In CY14, care coordination specifically accounted for an additional $3 million in capitation payments. In CY14, HSD paid $919 million in capitation payments for long-term services, of which $70 million was tied directly to Centennial Care initiatives. Of this $70 million tied directly to specific programs changes, $17 million was for inpatient rate increases tied to the Safety Net Care Pool (SNCP), $3.4 million was for a low/high-level nursing facility rate adjustment, and $5 million was linked to a personal care services rate increase. Moreover, $3 million was directed to care coordination and $1.7 million to the Centennial Rewards program as noted in Chart 22.
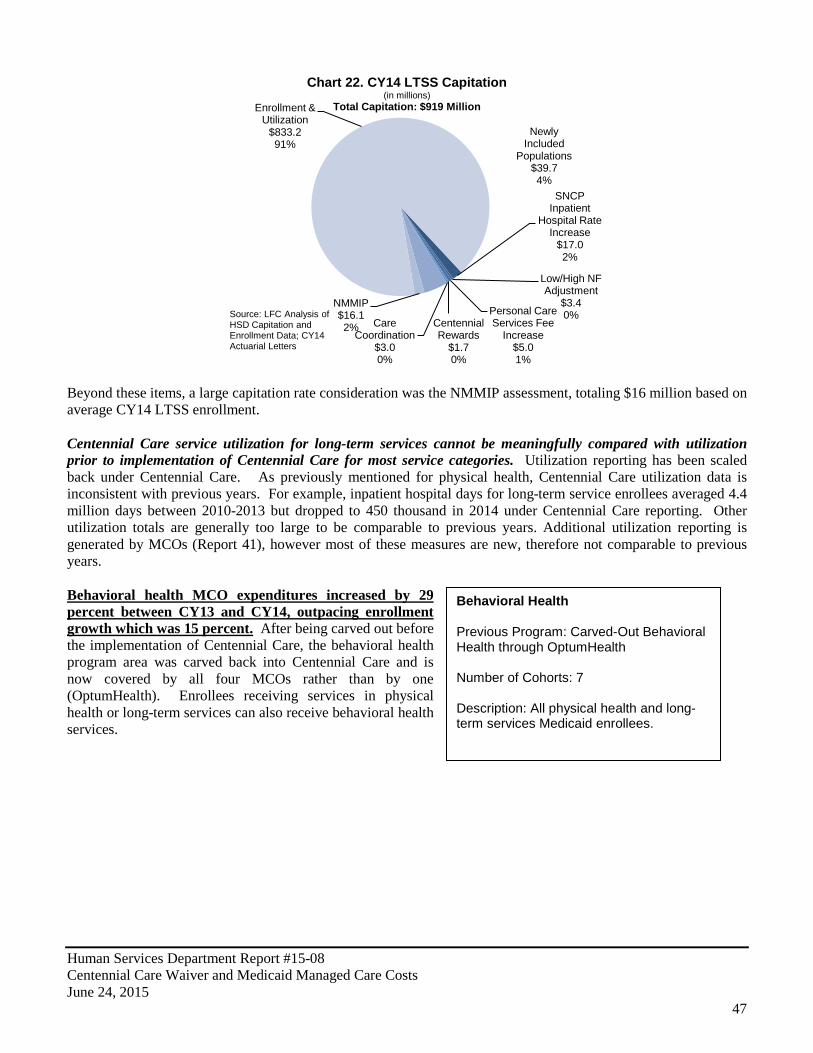
Human Services Department Report #15-08 Centennial Care Waiver and Medicaid Managed Care Costs June 24, 2015
47
Behavioral Health Previous Program: Carved-Out Behavioral Health through OptumHealth Number of Cohorts: 7 Description: All physical health and long-term services Medicaid enrollees.
Beyond these items, a large capitation rate consideration was the NMMIP assessment, totaling $16 million based on average CY14 LTSS enrollment. Centennial Care service utilization for long-term services cannot be meaningfully compared with utilization prior to implementation of Centennial Care for most service categories. Utilization reporting has been scaled back under Centennial Care. As previously mentioned for physical health, Centennial Care utilization data is inconsistent with previous years. For example, inpatient hospital days for long-term service enrollees averaged 4.4 million days between 2010-2013 but dropped to 450 thousand in 2014 under Centennial Care reporting. Other utilization totals are generally too large to be comparable to previous years. Additional utilization reporting is generated by MCOs (Report 41), however most of these measures are new, therefore not comparable to previous years. Behavioral health MCO expenditures increased by 29 percent between CY13 and CY14, outpacing enrollment growth which was 15 percent. After being carved out before the implementation of Centennial Care, the behavioral health program area was carved back into Centennial Care and is now covered by all four MCOs rather than by one (OptumHealth). Enrollees receiving services in physical health or long-term services can also receive behavioral health services.
SNCP Inpatient
Hospital Rate Increase
$17.0 2%
Low/High NF Adjustment
$3.4 0% Personal Care
Services Fee Increase
$5.0 1%
Centennial Rewards
$1.7 0%
Care Coordination
$3.0 0%
Newly Included
Populations $39.7 4%
NMMIP $16.1 2%
Enrollment & Utilization
$833.2 91%
Chart 22. CY14 LTSS Capitation (in millions)
Total Capitation: $919 Million
Source: LFC Analysis of HSD Capitation and Enrollment Data; CY14 Actuarial Letters

Human Services Department Report #15-08 Centennial Care Waiver and Medicaid Managed Care Costs June 24, 2015
48
Table 20. Behavioral Health Managed Care Statistics
Calendar Year Enrollment1
Member Months
Total Capitation (millions)
Capitation PMPM (Total
HSD Capitation Payments /
Member Months)
Total MCO expenditures on medical
services (millions)
MCO PMPM (Total MCO
expenditures on medical services / Member Months)
2010 365,875 Unknown $236.80 Unknown $234.10 Unknown
2011 373,838 Unknown $245.80 Unknown $215.60 Unknown
2012 375,904 4,512,463 $252.50 $56 $211.60 $47
2013 375,337 4,503,981 $258.20 $57 $202.00 $45
2014 430,791 5,216,545 $316.20 $61 $261.46 $50 1 Average enrollment over 12 months
Source: LFC Analysis of HSD 30-A, CC Financial Reports, FY10-CY14 Capitation Payments by Plan by Cohort, Medicaid Enrollment by Cohort by Month All MCOs Report
Total managed care expenditures for existing behavioral health cohorts increased by $61 million between CY13 and CY14 with newly emerging cost drivers. Spending in most categories increased with the exception of residential treatment centers and related services. Residential treatment spending fell by $4 million between CY13 and CY14. Spending on pharmaceuticals increased by over $11 million between CY13 and CY14, according to HSD this may have been due to a reclassification of pharmaceutical expenditures between programs (e.g. physical health and long-term services to behavioral health). Note that this increase in pharmaceutical spending was paired with decreases in pharmaceutical spending for physical health and long-term services.
Between CY13 and CY14, capitation PMPM increased by 6 percent, whereas MCO expenditure PMPM increased by 11 percent. This difference in growth likely indicates more capitation payments were spent on direct services than in the previous year. Note that member months were not provided in OptumHealth reporting (Report HSD-10) for calendar years 2010 or 2011; therefore, trends for these years are unknown.
Evaluation/Therapies
$41.90 21%
Pharmaceuticals
$26.80 13%
Residential Treatment
$41.60 21%
Therapeutic Foster Care
$19.20 9%
Hospital Facility $13.80
7%
Skills Training $10.30
5%
Other $48.30 24%
Chart 23. CY13 Behavioral Health MCO Expenditures by Service Type
(in millions) Total: $202 Million
Source: OptumHealth 30A Report and HSD CC Financial Reports Managed Care Data
Evaluation/Therapies $44.90 17%
Pharmaceuticals
$37.93 14%
Residential Treatment
$37.63 14%
Therapeutic Foster Care
$22.44 9%
Hospital Facility $30.34 12%
Skills Training $12.52
5%
Other $75.70 29%
Chart 24. CY14 Behavioral Health Expenditures by Service Type
(in millions) Total: $261 Million
Source: OptumHealth 30A Report and HSD CC Financial Reports Managed Care Data
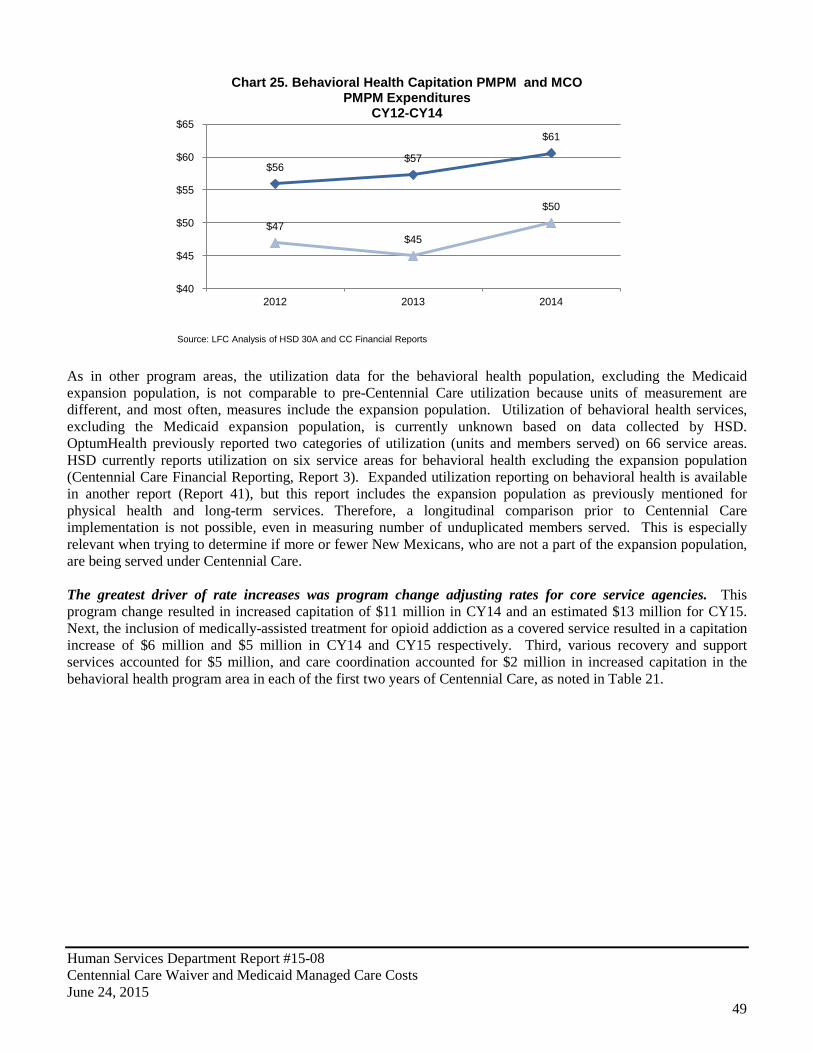
Human Services Department Report #15-08 Centennial Care Waiver and Medicaid Managed Care Costs June 24, 2015
49
As in other program areas, the utilization data for the behavioral health population, excluding the Medicaid expansion population, is not comparable to pre-Centennial Care utilization because units of measurement are different, and most often, measures include the expansion population. Utilization of behavioral health services, excluding the Medicaid expansion population, is currently unknown based on data collected by HSD. OptumHealth previously reported two categories of utilization (units and members served) on 66 service areas. HSD currently reports utilization on six service areas for behavioral health excluding the expansion population (Centennial Care Financial Reporting, Report 3). Expanded utilization reporting on behavioral health is available in another report (Report 41), but this report includes the expansion population as previously mentioned for physical health and long-term services. Therefore, a longitudinal comparison prior to Centennial Care implementation is not possible, even in measuring number of unduplicated members served. This is especially relevant when trying to determine if more or fewer New Mexicans, who are not a part of the expansion population, are being served under Centennial Care. The greatest driver of rate increases was program change adjusting rates for core service agencies. This program change resulted in increased capitation of $11 million in CY14 and an estimated $13 million for CY15. Next, the inclusion of medically-assisted treatment for opioid addiction as a covered service resulted in a capitation increase of $6 million and $5 million in CY14 and CY15 respectively. Third, various recovery and support services accounted for $5 million, and care coordination accounted for $2 million in increased capitation in the behavioral health program area in each of the first two years of Centennial Care, as noted in Table 21.
$56 $57
$61
$47 $45
$50
$40
$45
$50
$55
$60
$65
2012 2013 2014
Chart 25. Behavioral Health Capitation PMPM and MCO PMPM Expenditures
CY12-CY14
Source: LFC Analysis of HSD 30A and CC Financial Reports
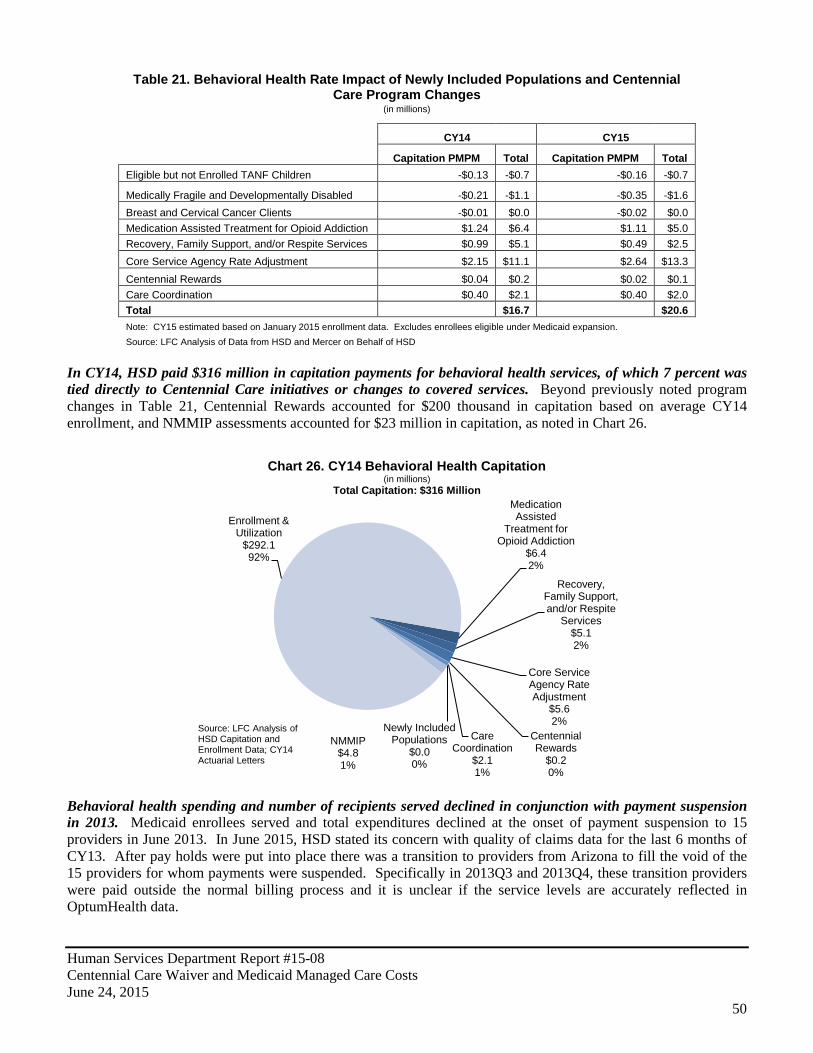
Human Services Department Report #15-08 Centennial Care Waiver and Medicaid Managed Care Costs June 24, 2015
50
Table 21. Behavioral Health Rate Impact of Newly Included Populations and Centennial Care Program Changes
(in millions)
CY14 CY15
Capitation PMPM Total Capitation PMPM Total
Eligible but not Enrolled TANF Children -$0.13 -$0.7 -$0.16 -$0.7
Medically Fragile and Developmentally Disabled -$0.21 -$1.1 -$0.35 -$1.6 Breast and Cervical Cancer Clients -$0.01 $0.0 -$0.02 $0.0 Medication Assisted Treatment for Opioid Addiction $1.24 $6.4 $1.11 $5.0 Recovery, Family Support, and/or Respite Services $0.99 $5.1 $0.49 $2.5 Core Service Agency Rate Adjustment $2.15 $11.1 $2.64 $13.3 Centennial Rewards $0.04 $0.2 $0.02 $0.1 Care Coordination $0.40 $2.1 $0.40 $2.0 Total $16.7 $20.6 Note: CY15 estimated based on January 2015 enrollment data. Excludes enrollees eligible under Medicaid expansion. Source: LFC Analysis of Data from HSD and Mercer on Behalf of HSD
In CY14, HSD paid $316 million in capitation payments for behavioral health services, of which 7 percent was tied directly to Centennial Care initiatives or changes to covered services. Beyond previously noted program changes in Table 21, Centennial Rewards accounted for $200 thousand in capitation based on average CY14 enrollment, and NMMIP assessments accounted for $23 million in capitation, as noted in Chart 26.
Behavioral health spending and number of recipients served declined in conjunction with payment suspension in 2013. Medicaid enrollees served and total expenditures declined at the onset of payment suspension to 15 providers in June 2013. In June 2015, HSD stated its concern with quality of claims data for the last 6 months of CY13. After pay holds were put into place there was a transition to providers from Arizona to fill the void of the 15 providers for whom payments were suspended. Specifically in 2013Q3 and 2013Q4, these transition providers were paid outside the normal billing process and it is unclear if the service levels are accurately reflected in OptumHealth data.
Medication Assisted
Treatment for Opioid Addiction
$6.4 2%
Recovery, Family Support, and/or Respite
Services $5.1 2%
Core Service Agency Rate Adjustment
$5.6 2%
Centennial Rewards
$0.2 0%
Care Coordination
$2.1 1%
Newly Included Populations
$0.0 0%
NMMIP $4.8 1%
Enrollment & Utilization
$292.1 92%
Chart 26. CY14 Behavioral Health Capitation (in millions)
Total Capitation: $316 Million
Source: LFC Analysis of HSD Capitation and Enrollment Data; CY14 Actuarial Letters

Human Services Department Report #15-08 Centennial Care Waiver and Medicaid Managed Care Costs June 24, 2015
51
Cost per client for behavioral health services decreased steadily between CY11 and CY14. The cost per client for behavioral health decreased from $1,753 per client to $1,171 per client pre-Centennial Care. Again, this metric for Centennial Care is not directly comparable as unique members served data includes new Medicaid expansion enrollment groups. It is possible that these members are healthier, and therefore drove down cost per client in CY14. According to HSD, various program changes including utilization reductions in residential treatment and treatment foster care services along with unit cost reductions for prescription drugs associated with loss of patents for brand drugs also contributed to this decline.
$0
$10,000
$20,000
$30,000
$40,000
$50,000
$60,000
0
10,000
20,000
30,000
40,000
50,000
60,000
Expe
nditu
re A
mou
nt (T
hous
ands
)
Und
uplic
ated
Mem
bers
Ser
ved
Chart 27. Behavioral Health Service Category Members Served and Expenditures (Quarterly)
Expenditure Amount Members Served Source: OptumHealth CI-09, CC Report 41
HSD Suspends Payment to 15 providers
Medicaid Expansion Begins
$800
$1,000
$1,200
$1,400
$1,600
$1,800
$2,000
Cos
t Per
Clie
nt
Chart 28. Behavioral Health Cost Per Client Served (Quarterly)
Source: OptumHealth CI-09, CC Report 41
HSD Suspends Payment to 15 providers
Medicaid Expansion Begins

Human Services Department Report #15-08 Centennial Care Waiver and Medicaid Managed Care Costs June 24, 2015
52
It is unclear whether most pre-existing behavioral health cohorts are being served at higher or lower levels under Centennial Care. In May 2015, HSD presented a report on behavioral health utilization to LFC. HSD reported 98,393 unique Centennial Care members received behavioral health services in CY14. Utilization data suggests that around 51 thousand unique Centennial Care members received behavioral health services in each quarter of CY14. However these figures included those newly eligible under Medicaid expansion and are therefore not directly comparable to pre-Centennial Care behavioral health totals. Spending and number of children served in several key service categories decreased following suspension of Medicaid payments to 15 New Mexico behavioral health providers, and have not recovered under Centennial Care. Although most other program areas do not have comparable utilization data pre-Centennial Care to Centennial Care, some behavioral health service data can be compared due to the existence of similar reporting pre-Centennial Care to Centennial Care on an age group level. Data available for comparison is limited to recipients under 18 years of age. Multisystemic therapy (MST) is an intensive evidence based program that has been proven to improve outcomes for participants and has been shown by the Washington State Institute for Public Policy (WSIPP) to be a cost beneficial investment. Spending on, and utilization of, this service decreased dramatically in conjunction with suspension of payments to 15 behavioral health providers in late June 2013. Data shows under Centennial Care, these numbers continued to drop and have not recovered as of the fourth quarter of CY14.
A similar trend is evident in comprehensive community support services (CCSS) for clients ages 0-18. According to the New Mexico Behavioral Health Collaborative, CCSS was initiated as a significant step in the development of a statewide system of care for behavioral health, based on principles of recovery and resiliency. CCSS is meant to be a powerful and robust service that will enable providers to assist consumers and family members in flexible and broad-ranging ways. Based on expenditures and utilization data, the total spent on CCSS and number of clients served declined in conjunction with suspension of the 15 providers and has started to recover to previous levels under Centennial Care, but has not recovered to initial CY13 levels.
0 50 100 150 200 250 300 350 400 450 500
$0.00
$0.50
$1.00
$1.50
$2.00
$2.50
CY13Q1 CY13Q2 CY13Q3 CY13Q4 CY14Q1 CY14Q2 CY14Q3 CY14Q4 U
ndup
licat
ed C
lient
s Se
rved
Tota
l Spe
nt (i
n m
llion
s)
Chart 29. Multisystemic Therapy Total Spent and Clients Served Ages 0-18
Unique Members Served Total Spent
HSD Suspends Payment to 15 Providers
Source: OptumHealth CI-09, CC Report 41
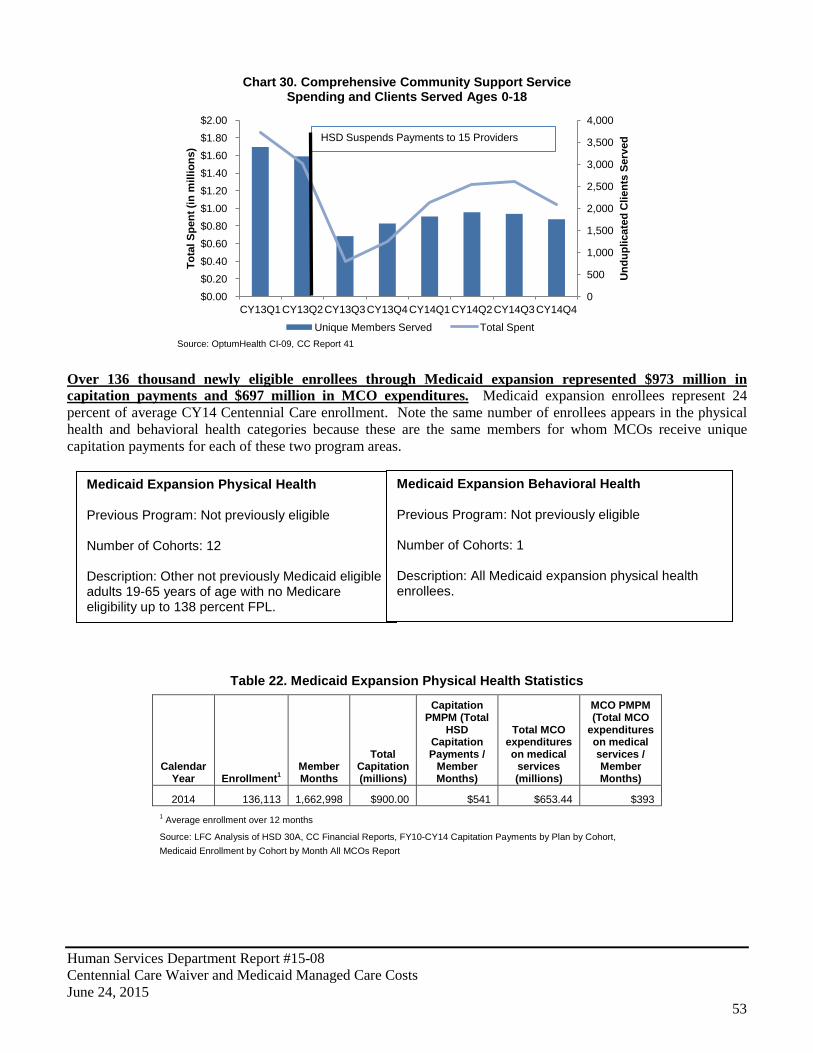
Human Services Department Report #15-08 Centennial Care Waiver and Medicaid Managed Care Costs June 24, 2015
53
Medicaid Expansion Physical Health Previous Program: Not previously eligible Number of Cohorts: 12 Description: Other not previously Medicaid eligible adults 19-65 years of age with no Medicare eligibility up to 138 percent FPL.
Medicaid Expansion Behavioral Health Previous Program: Not previously eligible Number of Cohorts: 1 Description: All Medicaid expansion physical health enrollees.
Over 136 thousand newly eligible enrollees through Medicaid expansion represented $973 million in capitation payments and $697 million in MCO expenditures. Medicaid expansion enrollees represent 24 percent of average CY14 Centennial Care enrollment. Note the same number of enrollees appears in the physical health and behavioral health categories because these are the same members for whom MCOs receive unique capitation payments for each of these two program areas.
Table 22. Medicaid Expansion Physical Health Statistics
Calendar Year Enrollment1
Member Months
Total Capitation (millions)
Capitation PMPM (Total
HSD Capitation Payments /
Member Months)
Total MCO expenditures on medical
services (millions)
MCO PMPM (Total MCO
expenditures on medical services / Member Months)
2014 136,113 1,662,998 $900.00 $541 $653.44 $393 1 Average enrollment over 12 months
Source: LFC Analysis of HSD 30A, CC Financial Reports, FY10-CY14 Capitation Payments by Plan by Cohort, Medicaid Enrollment by Cohort by Month All MCOs Report
0
500
1,000
1,500
2,000
2,500
3,000
3,500
4,000
$0.00 $0.20 $0.40 $0.60 $0.80 $1.00 $1.20 $1.40 $1.60 $1.80 $2.00
CY13Q1 CY13Q2 CY13Q3 CY13Q4 CY14Q1 CY14Q2 CY14Q3 CY14Q4
Und
uplic
ated
Clie
nts
Serv
ed
Tota
l Spe
nt (i
n m
illio
ns)
Chart 30. Comprehensive Community Support Service Spending and Clients Served Ages 0-18
Unique Members Served Total Spent
HSD Suspends Payments to 15 Providers
Source: OptumHealth CI-09, CC Report 41
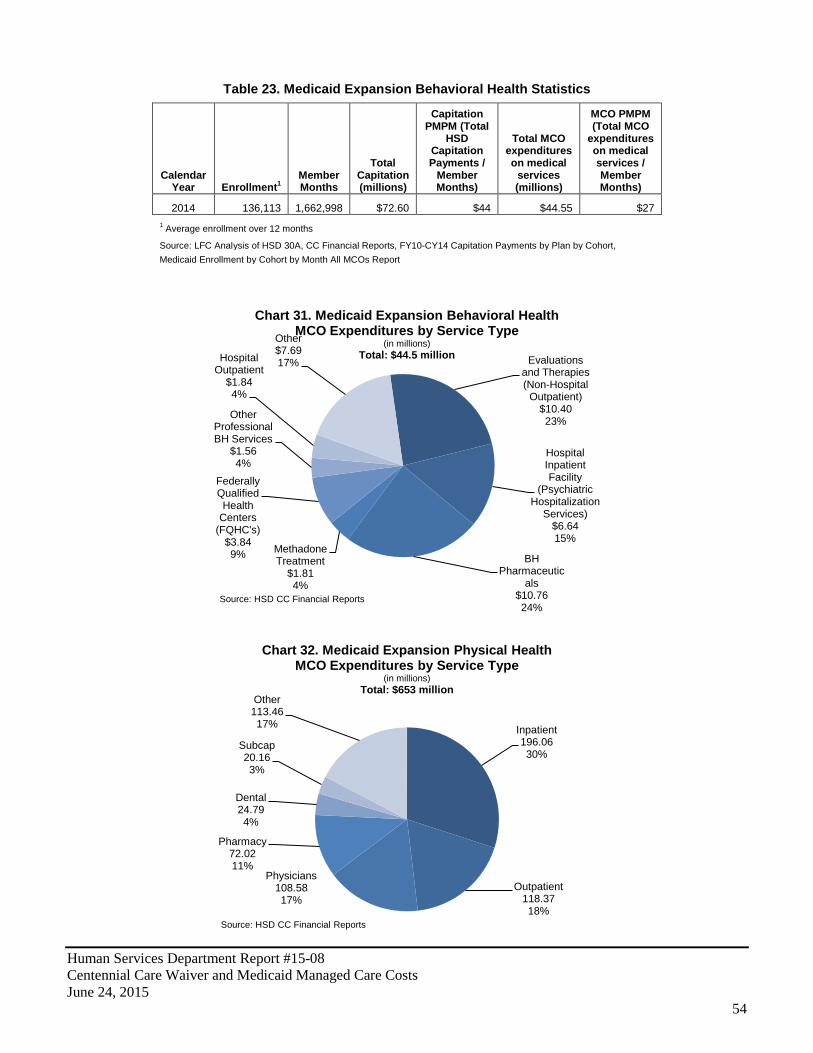
Human Services Department Report #15-08 Centennial Care Waiver and Medicaid Managed Care Costs June 24, 2015
54
Table 23. Medicaid Expansion Behavioral Health Statistics
Calendar Year Enrollment1
Member Months
Total Capitation (millions)
Capitation PMPM (Total
HSD Capitation Payments /
Member Months)
Total MCO expenditures on medical
services (millions)
MCO PMPM (Total MCO
expenditures on medical services / Member Months)
2014 136,113 1,662,998 $72.60 $44 $44.55 $27 1 Average enrollment over 12 months
Source: LFC Analysis of HSD 30A, CC Financial Reports, FY10-CY14 Capitation Payments by Plan by Cohort, Medicaid Enrollment by Cohort by Month All MCOs Report
Evaluations and Therapies (Non-Hospital
Outpatient) $10.40 23%
Hospital Inpatient Facility
(Psychiatric Hospitalization
Services) $6.64 15%
BH Pharmaceutic
als $10.76 24%
Methadone Treatment
$1.81 4%
Federally Qualified Health
Centers (FQHC's)
$3.84 9%
Other Professional BH Services
$1.56 4%
Hospital Outpatient
$1.84 4%
Other $7.69 17%
Chart 31. Medicaid Expansion Behavioral Health MCO Expenditures by Service Type
(in millions) Total: $44.5 million
Source: HSD CC Financial Reports
Inpatient 196.06 30%
Outpatient 118.37 18%
Physicians 108.58 17%
Pharmacy 72.02 11%
Dental 24.79 4%
Subcap 20.16 3%
Other 113.46 17%
Chart 32. Medicaid Expansion Physical Health MCO Expenditures by Service Type
(in millions) Total: $653 million
Source: HSD CC Financial Reports

Human Services Department Report #15-08 Centennial Care Waiver and Medicaid Managed Care Costs June 24, 2015
55
Physical health expenditures were largely dedicated to inpatient and outpatient hospital services, physicians, and pharmacy. The percentage dedicated to sub-capitation was only 3 percent compared to 7 percent in sub-capitations for the physical health program area. Behavioral health expenditures were largely dedicated to pharmaceuticals, hospital inpatient facilities, and evaluations and therapies.
For the Medicaid expansion population, HSD paid $973 million for physical and behavioral health services in CY14, with care coordination and rate increases attached to program changes as notable components. Medicaid expansion physical health PMPM capitation for care coordination was the largest of all programs areas at $12.57 PMPM, leading to a total of $21 million of total capitation. According the HSD the higher PMPM was due to the fact that during the first year of the program it was estimated that individuals covered by NMMIP would transition as well as high acuity, high cost members. Note that the $973 million is for managed care capitations only and do not include projected amounts for IHS reconciliations and the Health Insurance Provider Fee initiated under the ACA.
Table 24. Medicaid Expansion Rate Impact of Centennial Care Program Changes
CY14 CY15
Capitation PMPM
Total (in
millions) Capitation PMPM
Total (in
millions) Medicaid Expansion Physical Health
SNCP Inpatient Hospital Rate Increase $26.15 $42.7 $25.25 $50.0 Hepatitis C N/A N/A $47.68 $94.4 Centennial Rewards $2.17 $3.5 $1.51 $3.0 Care Coordination $12.57 $20.5 $9.21 $18.2
Medicaid Expansion Behavioral Health
Medication Assisted Treatment for Opioid Addiction $0.45 $0.7 $1.52 $3.0 Behavioral Health FFS Rate Change N/A N/A $1.67 $3.3 Core Service Agency Rate Adjustment $0.85 $1.4 $0.80 $1.6 Centennial Rewards $0.14 $0.2 $0.07 $0.1 Care Coordination $1.12 $1.8 $0.70 $1.4 Total $71.0 $175.0 Note: CY15 estimated based on January 2015 enrollment data. Source: LFC Analysis of Data from HSD and Mercer on Behalf of HSD
Beyond this, the inpatient hospital rate increase for the Safety Net Care Pool accounted for $43 million in CY14, as noted in Chart 33.
SNCP Inpatient Hospital
Rate Increase
$42.7 5%
Centennial Rewards
$3.5 0% Care
Coordination
$20.5 2%
NMMIP $4.0 1%
Enrollment &
Utilization $829.3 92%
Chart 33. CY14 Medicaid Expansion Physical Health Capitation
(in millions) Total Capitation: $900 Million
Source: LFC Analysis of HSD Capitation and Enrollment Data; CY14 Actuarial Letters
Medication Assisted
Treatment for Opioid Addiction
$0.7 1%
Core Service Agency
Rate Adjustment
$1.4 2%
Centennial Rewards
$0.2 0%
Care Coordinati
on $1.8 3%
NMMIP $0.3 0%
Enrollment &
Utilization $68.1 94%
Chart 34. CY14 Medicaid Expansion Behavioral Health Capitation
(in millions) Total Capitation: $73 Million
Source: LFC Analysis of HSD Capitation and Enrollment Data; CY14 Actuarial Letters
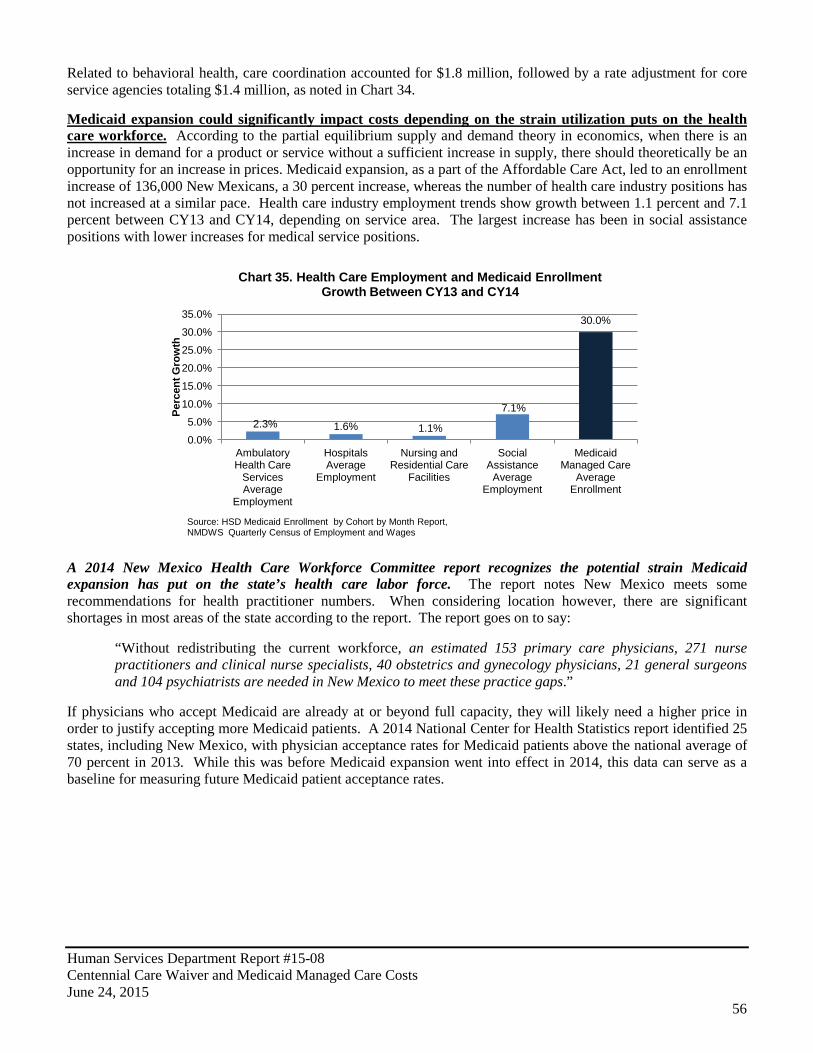
Human Services Department Report #15-08 Centennial Care Waiver and Medicaid Managed Care Costs June 24, 2015
56
Related to behavioral health, care coordination accounted for $1.8 million, followed by a rate adjustment for core service agencies totaling $1.4 million, as noted in Chart 34. Medicaid expansion could significantly impact costs depending on the strain utilization puts on the health care workforce. According to the partial equilibrium supply and demand theory in economics, when there is an increase in demand for a product or service without a sufficient increase in supply, there should theoretically be an opportunity for an increase in prices. Medicaid expansion, as a part of the Affordable Care Act, led to an enrollment increase of 136,000 New Mexicans, a 30 percent increase, whereas the number of health care industry positions has not increased at a similar pace. Health care industry employment trends show growth between 1.1 percent and 7.1 percent between CY13 and CY14, depending on service area. The largest increase has been in social assistance positions with lower increases for medical service positions.
A 2014 New Mexico Health Care Workforce Committee report recognizes the potential strain Medicaid expansion has put on the state’s health care labor force. The report notes New Mexico meets some recommendations for health practitioner numbers. When considering location however, there are significant shortages in most areas of the state according to the report. The report goes on to say:
“Without redistributing the current workforce, an estimated 153 primary care physicians, 271 nurse practitioners and clinical nurse specialists, 40 obstetrics and gynecology physicians, 21 general surgeons and 104 psychiatrists are needed in New Mexico to meet these practice gaps.”
If physicians who accept Medicaid are already at or beyond full capacity, they will likely need a higher price in order to justify accepting more Medicaid patients. A 2014 National Center for Health Statistics report identified 25 states, including New Mexico, with physician acceptance rates for Medicaid patients above the national average of 70 percent in 2013. While this was before Medicaid expansion went into effect in 2014, this data can serve as a baseline for measuring future Medicaid patient acceptance rates.
2.3% 1.6% 1.1%
7.1%
30.0%
0.0%
5.0%
10.0%
15.0%
20.0%
25.0%
30.0%
35.0%
Ambulatory Health Care
Services Average
Employment
Hospitals Average
Employment
Nursing and Residential Care
Facilities
Social Assistance
Average Employment
Medicaid Managed Care
Average Enrollment
Perc
ent G
row
th
Chart 35. Health Care Employment and Medicaid Enrollment Growth Between CY13 and CY14
Source: HSD Medicaid Enrollment by Cohort by Month Report, NMDWS Quarterly Census of Employment and Wages
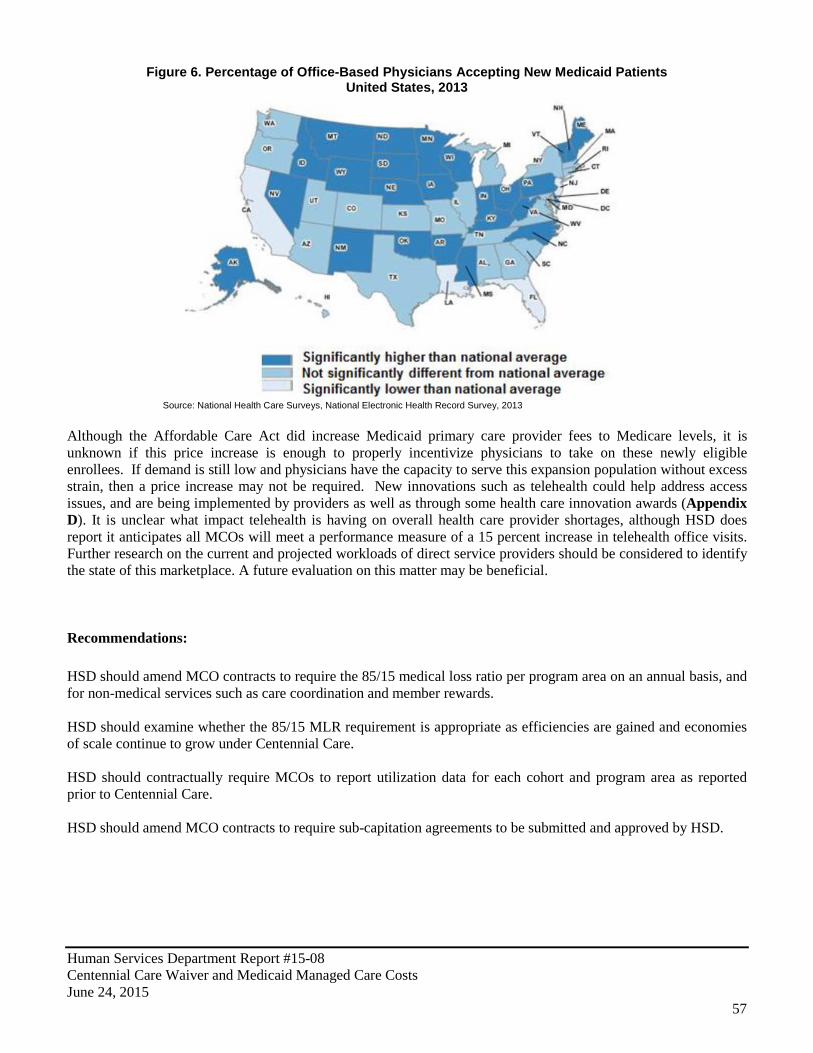
Human Services Department Report #15-08 Centennial Care Waiver and Medicaid Managed Care Costs June 24, 2015
57
Figure 6. Percentage of Office-Based Physicians Accepting New Medicaid Patients United States, 2013
Source: National Health Care Surveys, National Electronic Health Record Survey, 2013 Although the Affordable Care Act did increase Medicaid primary care provider fees to Medicare levels, it is unknown if this price increase is enough to properly incentivize physicians to take on these newly eligible enrollees. If demand is still low and physicians have the capacity to serve this expansion population without excess strain, then a price increase may not be required. New innovations such as telehealth could help address access issues, and are being implemented by providers as well as through some health care innovation awards (Appendix D). It is unclear what impact telehealth is having on overall health care provider shortages, although HSD does report it anticipates all MCOs will meet a performance measure of a 15 percent increase in telehealth office visits. Further research on the current and projected workloads of direct service providers should be considered to identify the state of this marketplace. A future evaluation on this matter may be beneficial. Recommendations: HSD should amend MCO contracts to require the 85/15 medical loss ratio per program area on an annual basis, and for non-medical services such as care coordination and member rewards. HSD should examine whether the 85/15 MLR requirement is appropriate as efficiencies are gained and economies of scale continue to grow under Centennial Care. HSD should contractually require MCOs to report utilization data for each cohort and program area as reported prior to Centennial Care. HSD should amend MCO contracts to require sub-capitation agreements to be submitted and approved by HSD.
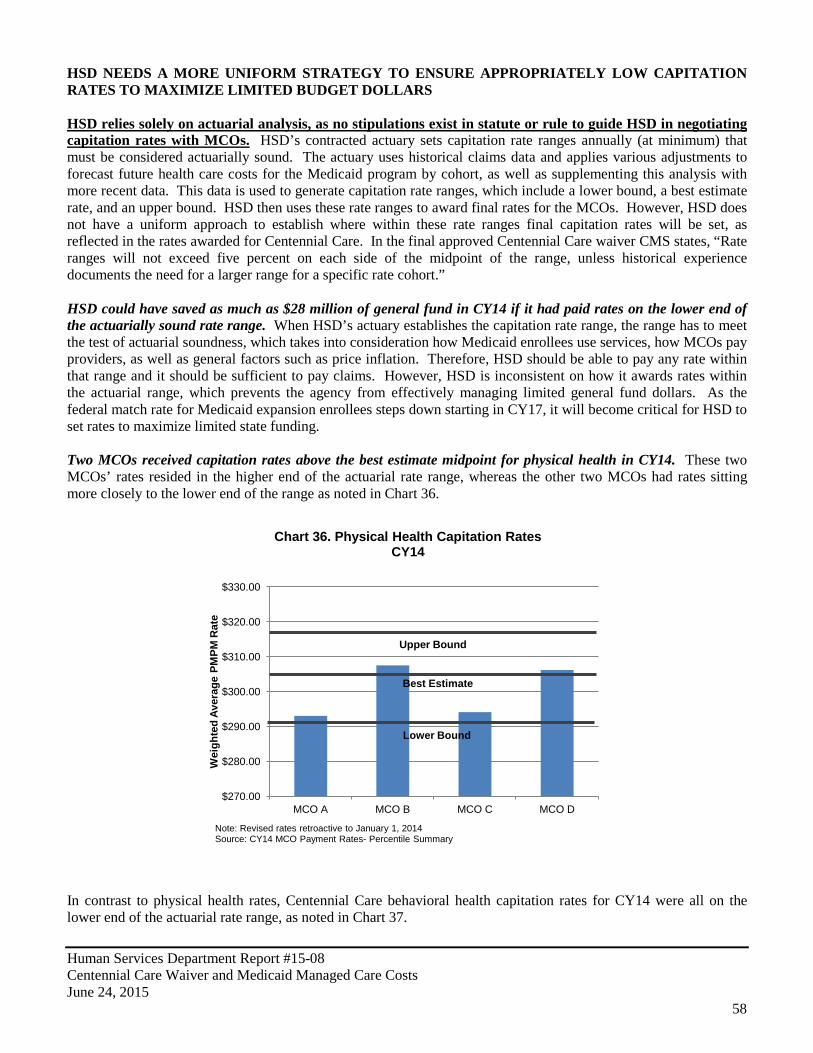
Human Services Department Report #15-08 Centennial Care Waiver and Medicaid Managed Care Costs June 24, 2015
58
HSD NEEDS A MORE UNIFORM STRATEGY TO ENSURE APPROPRIATELY LOW CAPITATION RATES TO MAXIMIZE LIMITED BUDGET DOLLARS HSD relies solely on actuarial analysis, as no stipulations exist in statute or rule to guide HSD in negotiating capitation rates with MCOs. HSD’s contracted actuary sets capitation rate ranges annually (at minimum) that must be considered actuarially sound. The actuary uses historical claims data and applies various adjustments to forecast future health care costs for the Medicaid program by cohort, as well as supplementing this analysis with more recent data. This data is used to generate capitation rate ranges, which include a lower bound, a best estimate rate, and an upper bound. HSD then uses these rate ranges to award final rates for the MCOs. However, HSD does not have a uniform approach to establish where within these rate ranges final capitation rates will be set, as reflected in the rates awarded for Centennial Care. In the final approved Centennial Care waiver CMS states, “Rate ranges will not exceed five percent on each side of the midpoint of the range, unless historical experience documents the need for a larger range for a specific rate cohort.” HSD could have saved as much as $28 million of general fund in CY14 if it had paid rates on the lower end of the actuarially sound rate range. When HSD’s actuary establishes the capitation rate range, the range has to meet the test of actuarial soundness, which takes into consideration how Medicaid enrollees use services, how MCOs pay providers, as well as general factors such as price inflation. Therefore, HSD should be able to pay any rate within that range and it should be sufficient to pay claims. However, HSD is inconsistent on how it awards rates within the actuarial range, which prevents the agency from effectively managing limited general fund dollars. As the federal match rate for Medicaid expansion enrollees steps down starting in CY17, it will become critical for HSD to set rates to maximize limited state funding. Two MCOs received capitation rates above the best estimate midpoint for physical health in CY14. These two MCOs’ rates resided in the higher end of the actuarial rate range, whereas the other two MCOs had rates sitting more closely to the lower end of the range as noted in Chart 36.
In contrast to physical health rates, Centennial Care behavioral health capitation rates for CY14 were all on the lower end of the actuarial rate range, as noted in Chart 37.
$270.00
$280.00
$290.00
$300.00
$310.00
$320.00
$330.00
MCO A MCO B MCO C MCO D
Wei
ghte
d Av
erag
e PM
PM R
ate
Chart 36. Physical Health Capitation Rates CY14
Note: Revised rates retroactive to January 1, 2014 Source: CY14 MCO Payment Rates- Percentile Summary
Upper Bound
Lower Bound
Best Estimate
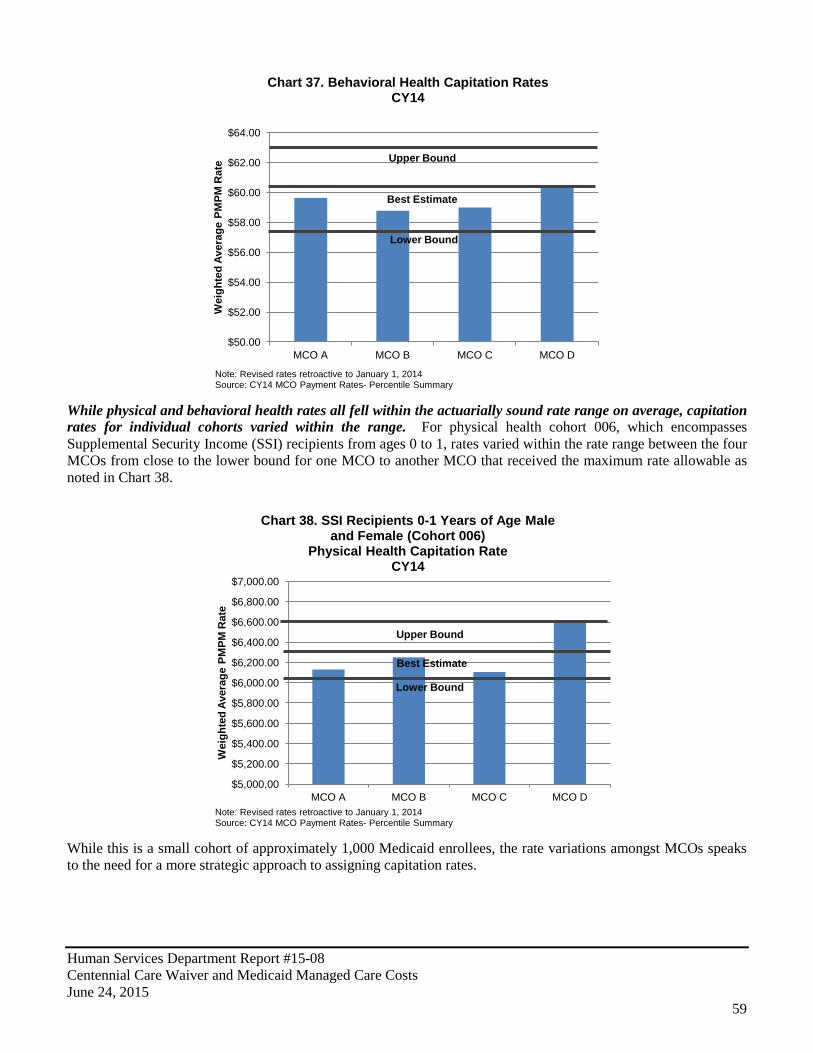
Human Services Department Report #15-08 Centennial Care Waiver and Medicaid Managed Care Costs June 24, 2015
59
While physical and behavioral health rates all fell within the actuarially sound rate range on average, capitation rates for individual cohorts varied within the range. For physical health cohort 006, which encompasses Supplemental Security Income (SSI) recipients from ages 0 to 1, rates varied within the rate range between the four MCOs from close to the lower bound for one MCO to another MCO that received the maximum rate allowable as noted in Chart 38.
While this is a small cohort of approximately 1,000 Medicaid enrollees, the rate variations amongst MCOs speaks to the need for a more strategic approach to assigning capitation rates.
$50.00
$52.00
$54.00
$56.00
$58.00
$60.00
$62.00
$64.00
MCO A MCO B MCO C MCO D
Wei
ghte
d Av
erag
e PM
PM R
ate
Chart 37. Behavioral Health Capitation Rates CY14
Best Estimate
Upper Bound
Lower Bound
Note: Revised rates retroactive to January 1, 2014 Source: CY14 MCO Payment Rates- Percentile Summary
$5,000.00
$5,200.00
$5,400.00
$5,600.00
$5,800.00
$6,000.00
$6,200.00
$6,400.00
$6,600.00
$6,800.00
$7,000.00
MCO A MCO B MCO C MCO D
Wei
ghte
d Av
erag
e PM
PM R
ate
Chart 38. SSI Recipients 0-1 Years of Age Male and Female (Cohort 006)
Physical Health Capitation Rate CY14
Note: Revised rates retroactive to January 1, 2014 Source: CY14 MCO Payment Rates- Percentile Summary
Upper Bound
Lower Bound
Best Estimate
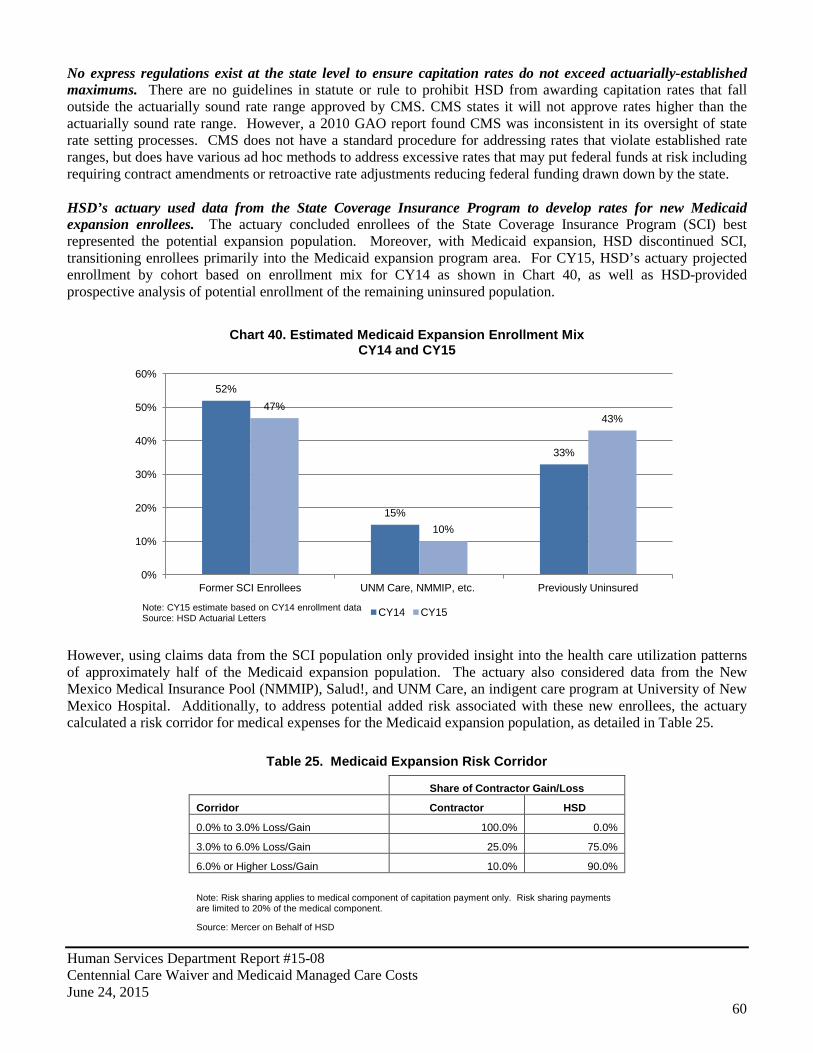
Human Services Department Report #15-08 Centennial Care Waiver and Medicaid Managed Care Costs June 24, 2015
60
No express regulations exist at the state level to ensure capitation rates do not exceed actuarially-established maximums. There are no guidelines in statute or rule to prohibit HSD from awarding capitation rates that fall outside the actuarially sound rate range approved by CMS. CMS states it will not approve rates higher than the actuarially sound rate range. However, a 2010 GAO report found CMS was inconsistent in its oversight of state rate setting processes. CMS does not have a standard procedure for addressing rates that violate established rate ranges, but does have various ad hoc methods to address excessive rates that may put federal funds at risk including requiring contract amendments or retroactive rate adjustments reducing federal funding drawn down by the state. HSD’s actuary used data from the State Coverage Insurance Program to develop rates for new Medicaid expansion enrollees. The actuary concluded enrollees of the State Coverage Insurance Program (SCI) best represented the potential expansion population. Moreover, with Medicaid expansion, HSD discontinued SCI, transitioning enrollees primarily into the Medicaid expansion program area. For CY15, HSD’s actuary projected enrollment by cohort based on enrollment mix for CY14 as shown in Chart 40, as well as HSD-provided prospective analysis of potential enrollment of the remaining uninsured population.
However, using claims data from the SCI population only provided insight into the health care utilization patterns of approximately half of the Medicaid expansion population. The actuary also considered data from the New Mexico Medical Insurance Pool (NMMIP), Salud!, and UNM Care, an indigent care program at University of New Mexico Hospital. Additionally, to address potential added risk associated with these new enrollees, the actuary calculated a risk corridor for medical expenses for the Medicaid expansion population, as detailed in Table 25.
Table 25. Medicaid Expansion Risk Corridor
Share of Contractor Gain/Loss
Corridor Contractor HSD
0.0% to 3.0% Loss/Gain 100.0% 0.0%
3.0% to 6.0% Loss/Gain 25.0% 75.0%
6.0% or Higher Loss/Gain 10.0% 90.0%
Note: Risk sharing applies to medical component of capitation payment only. Risk sharing payments are limited to 20% of the medical component.
Source: Mercer on Behalf of HSD
52%
15%
33%
47%
10%
43%
0%
10%
20%
30%
40%
50%
60%
Former SCI Enrollees UNM Care, NMMIP, etc. Previously Uninsured
Chart 40. Estimated Medicaid Expansion Enrollment Mix CY14 and CY15
CY14 CY15 Note: CY15 estimate based on CY14 enrollment data Source: HSD Actuarial Letters
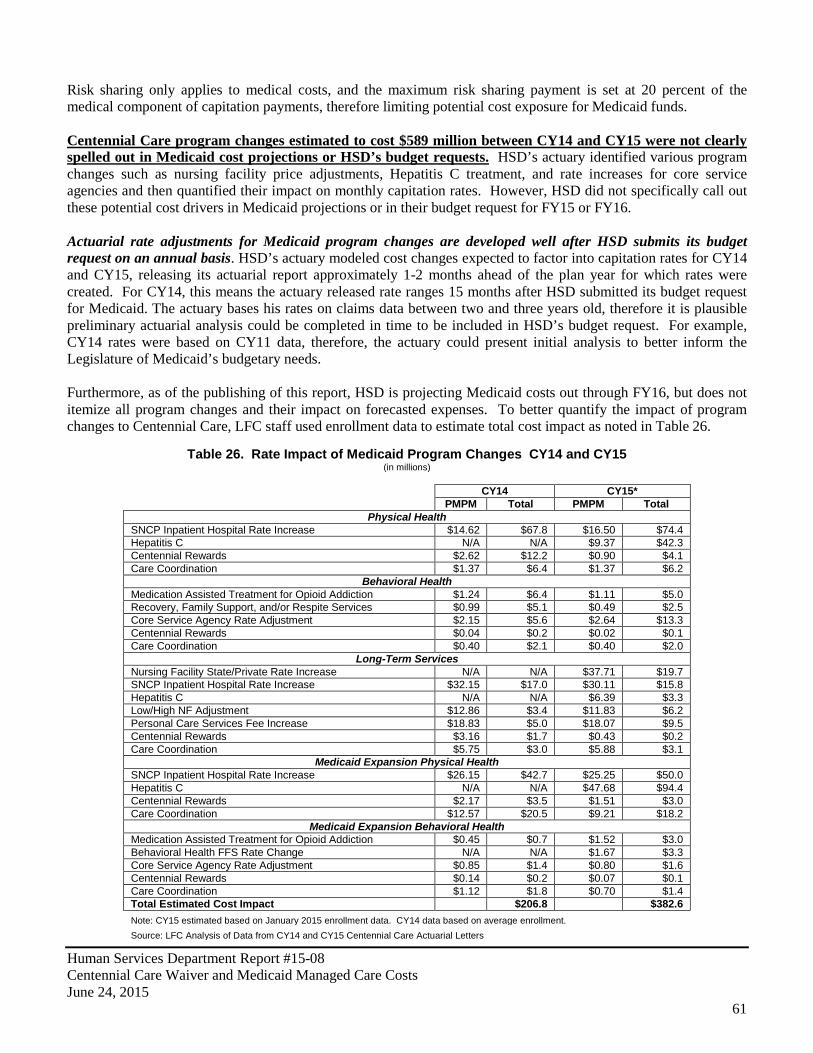
Human Services Department Report #15-08 Centennial Care Waiver and Medicaid Managed Care Costs June 24, 2015
61
Risk sharing only applies to medical costs, and the maximum risk sharing payment is set at 20 percent of the medical component of capitation payments, therefore limiting potential cost exposure for Medicaid funds. Centennial Care program changes estimated to cost $589 million between CY14 and CY15 were not clearly spelled out in Medicaid cost projections or HSD’s budget requests. HSD’s actuary identified various program changes such as nursing facility price adjustments, Hepatitis C treatment, and rate increases for core service agencies and then quantified their impact on monthly capitation rates. However, HSD did not specifically call out these potential cost drivers in Medicaid projections or in their budget request for FY15 or FY16. Actuarial rate adjustments for Medicaid program changes are developed well after HSD submits its budget request on an annual basis. HSD’s actuary modeled cost changes expected to factor into capitation rates for CY14 and CY15, releasing its actuarial report approximately 1-2 months ahead of the plan year for which rates were created. For CY14, this means the actuary released rate ranges 15 months after HSD submitted its budget request for Medicaid. The actuary bases his rates on claims data between two and three years old, therefore it is plausible preliminary actuarial analysis could be completed in time to be included in HSD’s budget request. For example, CY14 rates were based on CY11 data, therefore, the actuary could present initial analysis to better inform the Legislature of Medicaid’s budgetary needs. Furthermore, as of the publishing of this report, HSD is projecting Medicaid costs out through FY16, but does not itemize all program changes and their impact on forecasted expenses. To better quantify the impact of program changes to Centennial Care, LFC staff used enrollment data to estimate total cost impact as noted in Table 26.
Table 26. Rate Impact of Medicaid Program Changes CY14 and CY15 (in millions)
CY14 CY15*
PMPM Total PMPM Total
Physical Health SNCP Inpatient Hospital Rate Increase $14.62 $67.8 $16.50 $74.4 Hepatitis C N/A N/A $9.37 $42.3 Centennial Rewards $2.62 $12.2 $0.90 $4.1 Care Coordination $1.37 $6.4 $1.37 $6.2
Behavioral Health Medication Assisted Treatment for Opioid Addiction $1.24 $6.4 $1.11 $5.0 Recovery, Family Support, and/or Respite Services $0.99 $5.1 $0.49 $2.5 Core Service Agency Rate Adjustment $2.15 $5.6 $2.64 $13.3 Centennial Rewards $0.04 $0.2 $0.02 $0.1 Care Coordination $0.40 $2.1 $0.40 $2.0
Long-Term Services Nursing Facility State/Private Rate Increase N/A N/A $37.71 $19.7 SNCP Inpatient Hospital Rate Increase $32.15 $17.0 $30.11 $15.8 Hepatitis C N/A N/A $6.39 $3.3 Low/High NF Adjustment $12.86 $3.4 $11.83 $6.2 Personal Care Services Fee Increase $18.83 $5.0 $18.07 $9.5 Centennial Rewards $3.16 $1.7 $0.43 $0.2 Care Coordination $5.75 $3.0 $5.88 $3.1
Medicaid Expansion Physical Health SNCP Inpatient Hospital Rate Increase $26.15 $42.7 $25.25 $50.0 Hepatitis C N/A N/A $47.68 $94.4 Centennial Rewards $2.17 $3.5 $1.51 $3.0 Care Coordination $12.57 $20.5 $9.21 $18.2
Medicaid Expansion Behavioral Health Medication Assisted Treatment for Opioid Addiction $0.45 $0.7 $1.52 $3.0 Behavioral Health FFS Rate Change N/A N/A $1.67 $3.3 Core Service Agency Rate Adjustment $0.85 $1.4 $0.80 $1.6 Centennial Rewards $0.14 $0.2 $0.07 $0.1 Care Coordination $1.12 $1.8 $0.70 $1.4 Total Estimated Cost Impact $206.8 $382.6 Note: CY15 estimated based on January 2015 enrollment data. CY14 data based on average enrollment. Source: LFC Analysis of Data from CY14 and CY15 Centennial Care Actuarial Letters
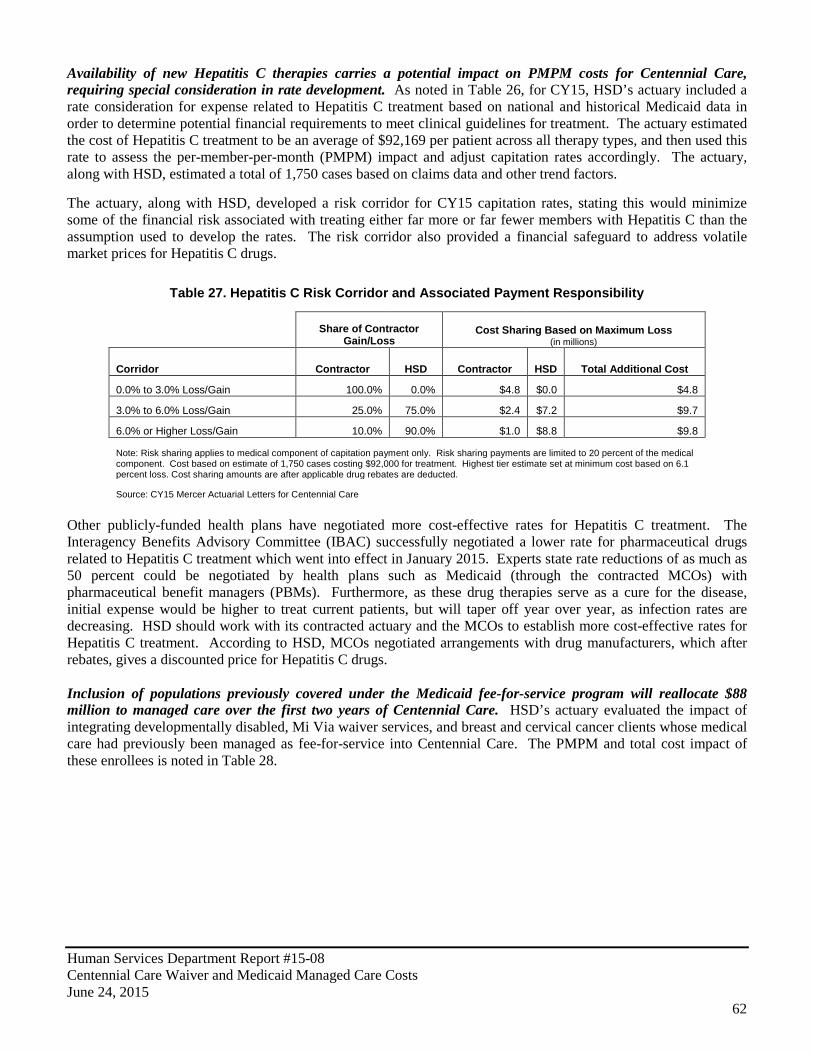
Human Services Department Report #15-08 Centennial Care Waiver and Medicaid Managed Care Costs June 24, 2015
62
Availability of new Hepatitis C therapies carries a potential impact on PMPM costs for Centennial Care, requiring special consideration in rate development. As noted in Table 26, for CY15, HSD’s actuary included a rate consideration for expense related to Hepatitis C treatment based on national and historical Medicaid data in order to determine potential financial requirements to meet clinical guidelines for treatment. The actuary estimated the cost of Hepatitis C treatment to be an average of $92,169 per patient across all therapy types, and then used this rate to assess the per-member-per-month (PMPM) impact and adjust capitation rates accordingly. The actuary, along with HSD, estimated a total of 1,750 cases based on claims data and other trend factors. The actuary, along with HSD, developed a risk corridor for CY15 capitation rates, stating this would minimize some of the financial risk associated with treating either far more or far fewer members with Hepatitis C than the assumption used to develop the rates. The risk corridor also provided a financial safeguard to address volatile market prices for Hepatitis C drugs.
Table 27. Hepatitis C Risk Corridor and Associated Payment Responsibility
Share of Contractor Gain/Loss
Cost Sharing Based on Maximum Loss (in millions)
Corridor Contractor HSD Contractor HSD Total Additional Cost
0.0% to 3.0% Loss/Gain 100.0% 0.0% $4.8 $0.0 $4.8
3.0% to 6.0% Loss/Gain 25.0% 75.0% $2.4 $7.2 $9.7
6.0% or Higher Loss/Gain 10.0% 90.0% $1.0 $8.8 $9.8
Note: Risk sharing applies to medical component of capitation payment only. Risk sharing payments are limited to 20 percent of the medical component. Cost based on estimate of 1,750 cases costing $92,000 for treatment. Highest tier estimate set at minimum cost based on 6.1 percent loss. Cost sharing amounts are after applicable drug rebates are deducted.
Source: CY15 Mercer Actuarial Letters for Centennial Care
Other publicly-funded health plans have negotiated more cost-effective rates for Hepatitis C treatment. The Interagency Benefits Advisory Committee (IBAC) successfully negotiated a lower rate for pharmaceutical drugs related to Hepatitis C treatment which went into effect in January 2015. Experts state rate reductions of as much as 50 percent could be negotiated by health plans such as Medicaid (through the contracted MCOs) with pharmaceutical benefit managers (PBMs). Furthermore, as these drug therapies serve as a cure for the disease, initial expense would be higher to treat current patients, but will taper off year over year, as infection rates are decreasing. HSD should work with its contracted actuary and the MCOs to establish more cost-effective rates for Hepatitis C treatment. According to HSD, MCOs negotiated arrangements with drug manufacturers, which after rebates, gives a discounted price for Hepatitis C drugs. Inclusion of populations previously covered under the Medicaid fee-for-service program will reallocate $88 million to managed care over the first two years of Centennial Care. HSD’s actuary evaluated the impact of integrating developmentally disabled, Mi Via waiver services, and breast and cervical cancer clients whose medical care had previously been managed as fee-for-service into Centennial Care. The PMPM and total cost impact of these enrollees is noted in Table 28.
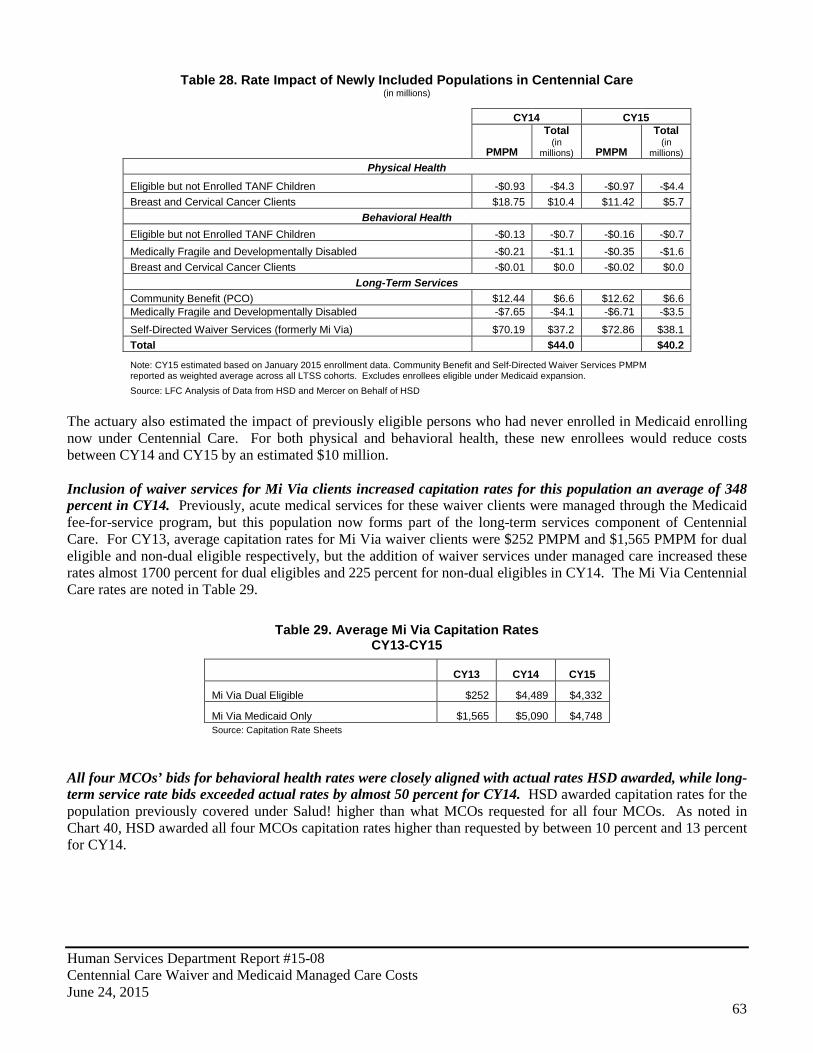
Human Services Department Report #15-08 Centennial Care Waiver and Medicaid Managed Care Costs June 24, 2015
63
Table 28. Rate Impact of Newly Included Populations in Centennial Care (in millions)
CY14 CY15
PMPM
Total (in
millions) PMPM
Total (in
millions) Physical Health
Eligible but not Enrolled TANF Children -$0.93 -$4.3 -$0.97 -$4.4 Breast and Cervical Cancer Clients $18.75 $10.4 $11.42 $5.7
Behavioral Health Eligible but not Enrolled TANF Children -$0.13 -$0.7 -$0.16 -$0.7 Medically Fragile and Developmentally Disabled -$0.21 -$1.1 -$0.35 -$1.6 Breast and Cervical Cancer Clients -$0.01 $0.0 -$0.02 $0.0
Long-Term Services Community Benefit (PCO) $12.44 $6.6 $12.62 $6.6 Medically Fragile and Developmentally Disabled -$7.65 -$4.1 -$6.71 -$3.5
Self-Directed Waiver Services (formerly Mi Via) $70.19 $37.2 $72.86 $38.1 Total $44.0 $40.2
Note: CY15 estimated based on January 2015 enrollment data. Community Benefit and Self-Directed Waiver Services PMPM reported as weighted average across all LTSS cohorts. Excludes enrollees eligible under Medicaid expansion. Source: LFC Analysis of Data from HSD and Mercer on Behalf of HSD
The actuary also estimated the impact of previously eligible persons who had never enrolled in Medicaid enrolling now under Centennial Care. For both physical and behavioral health, these new enrollees would reduce costs between CY14 and CY15 by an estimated $10 million. Inclusion of waiver services for Mi Via clients increased capitation rates for this population an average of 348 percent in CY14. Previously, acute medical services for these waiver clients were managed through the Medicaid fee-for-service program, but this population now forms part of the long-term services component of Centennial Care. For CY13, average capitation rates for Mi Via waiver clients were $252 PMPM and $1,565 PMPM for dual eligible and non-dual eligible respectively, but the addition of waiver services under managed care increased these rates almost 1700 percent for dual eligibles and 225 percent for non-dual eligibles in CY14. The Mi Via Centennial Care rates are noted in Table 29.
Table 29. Average Mi Via Capitation Rates CY13-CY15
CY13 CY14 CY15
Mi Via Dual Eligible $252 $4,489 $4,332
Mi Via Medicaid Only $1,565 $5,090 $4,748 Source: Capitation Rate Sheets
All four MCOs’ bids for behavioral health rates were closely aligned with actual rates HSD awarded, while long-term service rate bids exceeded actual rates by almost 50 percent for CY14. HSD awarded capitation rates for the population previously covered under Salud! higher than what MCOs requested for all four MCOs. As noted in Chart 40, HSD awarded all four MCOs capitation rates higher than requested by between 10 percent and 13 percent for CY14.

Human Services Department Report #15-08 Centennial Care Waiver and Medicaid Managed Care Costs June 24, 2015
64
While awarding rates above MCO bids is neither expressly forbidden in the state procurement code nor in statute or rule, HSD awards rates by combining the MCO bid rate and additional PMPM capitation for any program changes such as those discussed previously in this chapter. New Mexico’s Medicaid program has been generally profitable for MCOs in CY13 and CY14. According to annual revenue and expense reports MCOs submit to HSD, MCOs showed profits or losses between a loss of $2 million at Blue Cross Blue Shield to a profit of $15 million for United Healthcare for CY13. For CY14, the first year of Centennial Care, Blue Cross Blue Shield reported a loss of $27 million, while Presbyterian reported the highest profit at $27 million. However, there are disparities in what MCOs report to HSD and what appears in financial statements presented to shareholders. MCO financial statements show differing profits from New Mexico Medicaid programs than data reported to HSD. In contracts, HSD requires MCOs report audited profit and loss data related specifically to Medicaid. However, for CY13 and CY14, profit data reported by MCOs does not match what is reported in annual financial statements as noted in Table 30.
$240
$250
$260
$270
$280
$290
$300
$310
$320
Bid Rate CY14 Final Rate
Bid Rate CY14 Final Rate
Bid Rate CY14 Final Rate
Bid Rate CY14 Final Rate
MCO A MCO B MCO C MCO D
Chart 40. Physical Health Bid Rates Versus Final CY14 Capitation Rates
Note: CY14 Final Rates reflect revised rates. All rate data based on weighted averages. Source: MCO RFP Responses, CY14 MCO Payment Rates-Percentile Summary
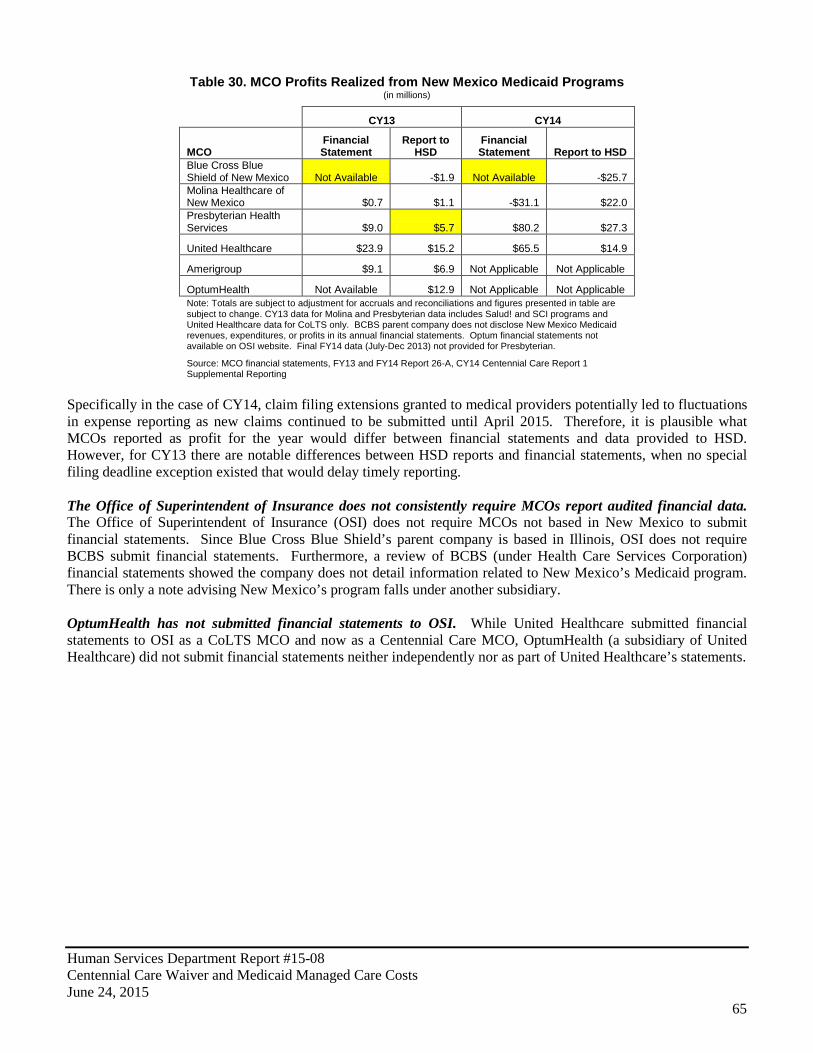
Human Services Department Report #15-08 Centennial Care Waiver and Medicaid Managed Care Costs June 24, 2015
65
Table 30. MCO Profits Realized from New Mexico Medicaid Programs (in millions)
CY13 CY14
MCO Financial Statement
Report to HSD
Financial Statement Report to HSD
Blue Cross Blue Shield of New Mexico Not Available -$1.9 Not Available -$25.7 Molina Healthcare of New Mexico $0.7 $1.1 -$31.1 $22.0 Presbyterian Health Services $9.0 $5.7 $80.2 $27.3
United Healthcare $23.9 $15.2 $65.5 $14.9
Amerigroup $9.1 $6.9 Not Applicable Not Applicable
OptumHealth Not Available $12.9 Not Applicable Not Applicable Note: Totals are subject to adjustment for accruals and reconciliations and figures presented in table are subject to change. CY13 data for Molina and Presbyterian data includes Salud! and SCI programs and United Healthcare data for CoLTS only. BCBS parent company does not disclose New Mexico Medicaid revenues, expenditures, or profits in its annual financial statements. Optum financial statements not available on OSI website. Final FY14 data (July-Dec 2013) not provided for Presbyterian.
Source: MCO financial statements, FY13 and FY14 Report 26-A, CY14 Centennial Care Report 1 Supplemental Reporting
Specifically in the case of CY14, claim filing extensions granted to medical providers potentially led to fluctuations in expense reporting as new claims continued to be submitted until April 2015. Therefore, it is plausible what MCOs reported as profit for the year would differ between financial statements and data provided to HSD. However, for CY13 there are notable differences between HSD reports and financial statements, when no special filing deadline exception existed that would delay timely reporting. The Office of Superintendent of Insurance does not consistently require MCOs report audited financial data. The Office of Superintendent of Insurance (OSI) does not require MCOs not based in New Mexico to submit financial statements. Since Blue Cross Blue Shield’s parent company is based in Illinois, OSI does not require BCBS submit financial statements. Furthermore, a review of BCBS (under Health Care Services Corporation) financial statements showed the company does not detail information related to New Mexico’s Medicaid program. There is only a note advising New Mexico’s program falls under another subsidiary. OptumHealth has not submitted financial statements to OSI. While United Healthcare submitted financial statements to OSI as a CoLTS MCO and now as a Centennial Care MCO, OptumHealth (a subsidiary of United Healthcare) did not submit financial statements neither independently nor as part of United Healthcare’s statements.
Human Services Department Report #15-08 Centennial Care Waiver and Medicaid Managed Care Costs June 24, 2015
66
Recommendations: The Legislature should consider amending statute to require HSD to award rates within the actuarially sound rate range including clawback provisions if rates are paid outside of this range. HSD should require its actuary to use encounter data for rate setting purposes. HSD should focus rate setting to the lower bound estimate of the actuarial sound rate range. HSD should negotiate a lower rate for pharmaceutical drugs related to high cost treatments such as Hepatitis C such as done by Interagency Benefits Advisory Committee for New Mexico public employees. HSD should ensure access to clinically effective medications remains intact. HSD should require the actuary to incorporate pharmaceutical discounts into the rate setting process. HSD should incorporate profit margin analysis into rate setting process on an annual basis. The Office of Superintendent of Insurance (OSI) should amend rules to require all MCOs with interests in New Mexico submit financial statements annually for review and publication on the OSI website.
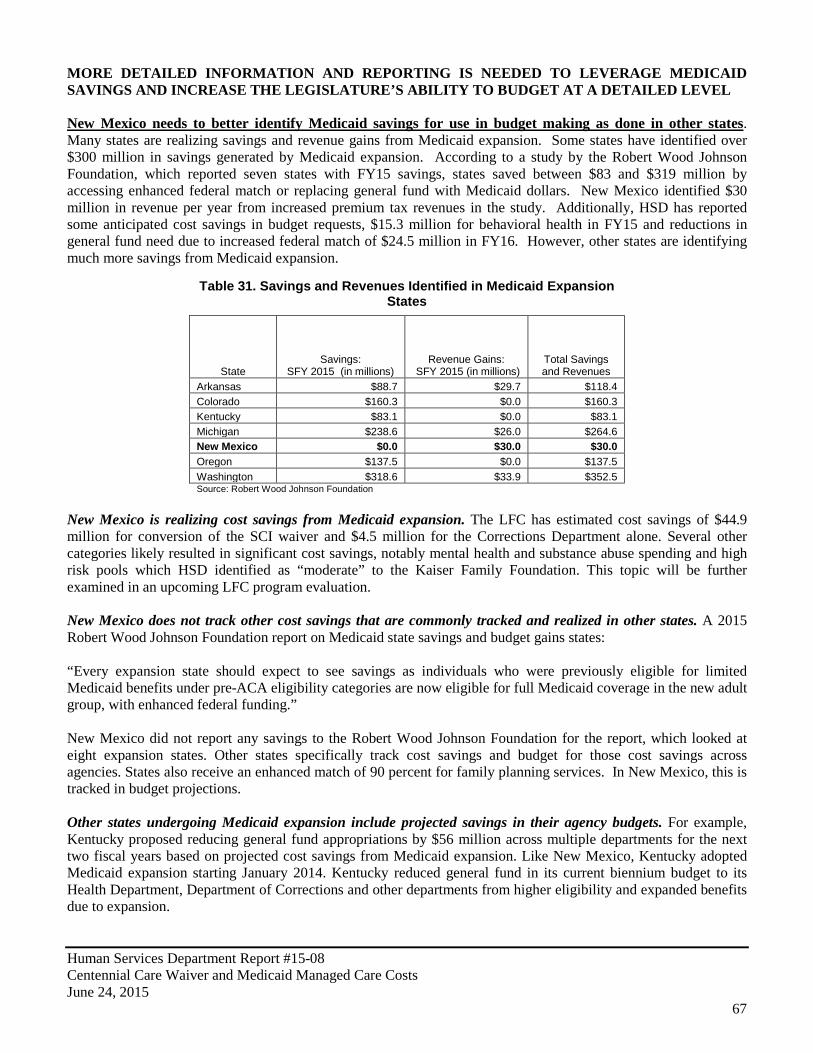
Human Services Department Report #15-08 Centennial Care Waiver and Medicaid Managed Care Costs June 24, 2015
67
MORE DETAILED INFORMATION AND REPORTING IS NEEDED TO LEVERAGE MEDICAID SAVINGS AND INCREASE THE LEGISLATURE’S ABILITY TO BUDGET AT A DETAILED LEVEL New Mexico needs to better identify Medicaid savings for use in budget making as done in other states. Many states are realizing savings and revenue gains from Medicaid expansion. Some states have identified over $300 million in savings generated by Medicaid expansion. According to a study by the Robert Wood Johnson Foundation, which reported seven states with FY15 savings, states saved between $83 and $319 million by accessing enhanced federal match or replacing general fund with Medicaid dollars. New Mexico identified $30 million in revenue per year from increased premium tax revenues in the study. Additionally, HSD has reported some anticipated cost savings in budget requests, $15.3 million for behavioral health in FY15 and reductions in general fund need due to increased federal match of $24.5 million in FY16. However, other states are identifying much more savings from Medicaid expansion.
Table 31. Savings and Revenues Identified in Medicaid Expansion States
State Savings:
SFY 2015 (in millions) Revenue Gains:
SFY 2015 (in millions) Total Savings and Revenues
Arkansas $88.7 $29.7 $118.4 Colorado $160.3 $0.0 $160.3 Kentucky $83.1 $0.0 $83.1 Michigan $238.6 $26.0 $264.6 New Mexico $0.0 $30.0 $30.0 Oregon $137.5 $0.0 $137.5 Washington $318.6 $33.9 $352.5 Source: Robert Wood Johnson Foundation
New Mexico is realizing cost savings from Medicaid expansion. The LFC has estimated cost savings of $44.9 million for conversion of the SCI waiver and $4.5 million for the Corrections Department alone. Several other categories likely resulted in significant cost savings, notably mental health and substance abuse spending and high risk pools which HSD identified as “moderate” to the Kaiser Family Foundation. This topic will be further examined in an upcoming LFC program evaluation. New Mexico does not track other cost savings that are commonly tracked and realized in other states. A 2015 Robert Wood Johnson Foundation report on Medicaid state savings and budget gains states: “Every expansion state should expect to see savings as individuals who were previously eligible for limited Medicaid benefits under pre-ACA eligibility categories are now eligible for full Medicaid coverage in the new adult group, with enhanced federal funding.” New Mexico did not report any savings to the Robert Wood Johnson Foundation for the report, which looked at eight expansion states. Other states specifically track cost savings and budget for those cost savings across agencies. States also receive an enhanced match of 90 percent for family planning services. In New Mexico, this is tracked in budget projections. Other states undergoing Medicaid expansion include projected savings in their agency budgets. For example, Kentucky proposed reducing general fund appropriations by $56 million across multiple departments for the next two fiscal years based on projected cost savings from Medicaid expansion. Like New Mexico, Kentucky adopted Medicaid expansion starting January 2014. Kentucky reduced general fund in its current biennium budget to its Health Department, Department of Corrections and other departments from higher eligibility and expanded benefits due to expansion.
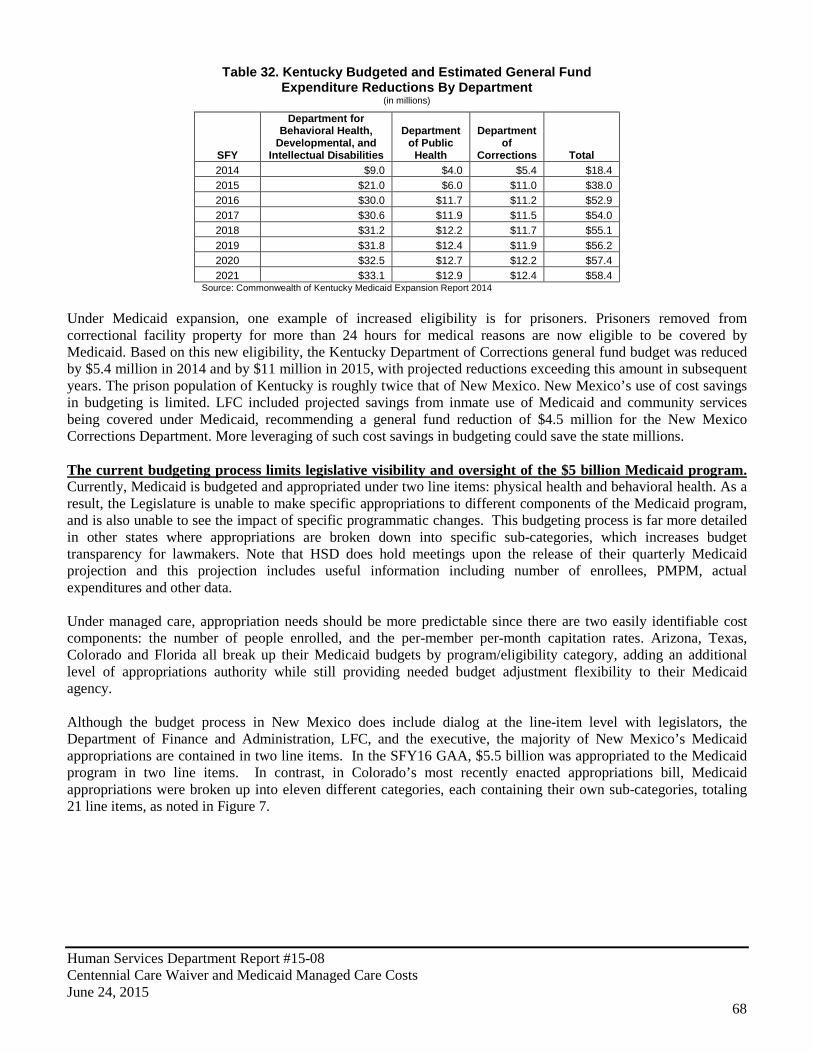
Human Services Department Report #15-08 Centennial Care Waiver and Medicaid Managed Care Costs June 24, 2015
68
Table 32. Kentucky Budgeted and Estimated General Fund Expenditure Reductions By Department
(in millions)
SFY
Department for Behavioral Health,
Developmental, and Intellectual Disabilities
Department of Public
Health
Department of
Corrections Total 2014 $9.0 $4.0 $5.4 $18.4 2015 $21.0 $6.0 $11.0 $38.0 2016 $30.0 $11.7 $11.2 $52.9 2017 $30.6 $11.9 $11.5 $54.0 2018 $31.2 $12.2 $11.7 $55.1 2019 $31.8 $12.4 $11.9 $56.2 2020 $32.5 $12.7 $12.2 $57.4 2021 $33.1 $12.9 $12.4 $58.4
Source: Commonwealth of Kentucky Medicaid Expansion Report 2014 Under Medicaid expansion, one example of increased eligibility is for prisoners. Prisoners removed from correctional facility property for more than 24 hours for medical reasons are now eligible to be covered by Medicaid. Based on this new eligibility, the Kentucky Department of Corrections general fund budget was reduced by $5.4 million in 2014 and by $11 million in 2015, with projected reductions exceeding this amount in subsequent years. The prison population of Kentucky is roughly twice that of New Mexico. New Mexico’s use of cost savings in budgeting is limited. LFC included projected savings from inmate use of Medicaid and community services being covered under Medicaid, recommending a general fund reduction of $4.5 million for the New Mexico Corrections Department. More leveraging of such cost savings in budgeting could save the state millions. The current budgeting process limits legislative visibility and oversight of the $5 billion Medicaid program. Currently, Medicaid is budgeted and appropriated under two line items: physical health and behavioral health. As a result, the Legislature is unable to make specific appropriations to different components of the Medicaid program, and is also unable to see the impact of specific programmatic changes. This budgeting process is far more detailed in other states where appropriations are broken down into specific sub-categories, which increases budget transparency for lawmakers. Note that HSD does hold meetings upon the release of their quarterly Medicaid projection and this projection includes useful information including number of enrollees, PMPM, actual expenditures and other data. Under managed care, appropriation needs should be more predictable since there are two easily identifiable cost components: the number of people enrolled, and the per-member per-month capitation rates. Arizona, Texas, Colorado and Florida all break up their Medicaid budgets by program/eligibility category, adding an additional level of appropriations authority while still providing needed budget adjustment flexibility to their Medicaid agency. Although the budget process in New Mexico does include dialog at the line-item level with legislators, the Department of Finance and Administration, LFC, and the executive, the majority of New Mexico’s Medicaid appropriations are contained in two line items. In the SFY16 GAA, $5.5 billion was appropriated to the Medicaid program in two line items. In contrast, in Colorado’s most recently enacted appropriations bill, Medicaid appropriations were broken up into eleven different categories, each containing their own sub-categories, totaling 21 line items, as noted in Figure 7.
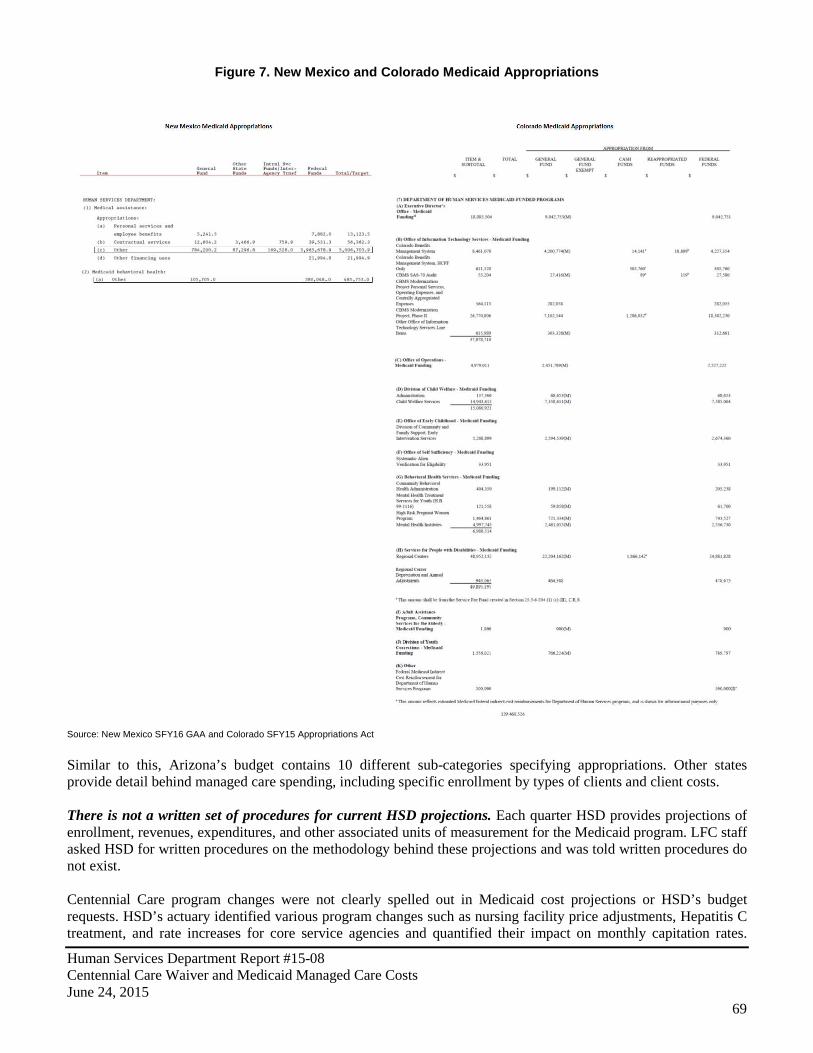
Human Services Department Report #15-08 Centennial Care Waiver and Medicaid Managed Care Costs June 24, 2015
69
Figure 7. New Mexico and Colorado Medicaid Appropriations
Source: New Mexico SFY16 GAA and Colorado SFY15 Appropriations Act Similar to this, Arizona’s budget contains 10 different sub-categories specifying appropriations. Other states provide detail behind managed care spending, including specific enrollment by types of clients and client costs. There is not a written set of procedures for current HSD projections. Each quarter HSD provides projections of enrollment, revenues, expenditures, and other associated units of measurement for the Medicaid program. LFC staff asked HSD for written procedures on the methodology behind these projections and was told written procedures do not exist. Centennial Care program changes were not clearly spelled out in Medicaid cost projections or HSD’s budget requests. HSD’s actuary identified various program changes such as nursing facility price adjustments, Hepatitis C treatment, and rate increases for core service agencies and quantified their impact on monthly capitation rates.

Human Services Department Report #15-08 Centennial Care Waiver and Medicaid Managed Care Costs June 24, 2015
70
Although HSD does provide quarterly narratives of budget changes and a cost component summary for the budget request, HSD did not specifically call out these potential cost drivers in Medicaid projections or in their budget request for FY15 or FY16. Actuarial rate adjustments for Medicaid program changes are developed well after HSD submits its budget request. HSD’s actuary modeled cost changes expected to factor into capitation rates for CY14 and CY15, releasing his actuarial report approximately 1-2 months ahead of the plan year for which rates were created. This is two budget cycles after when HSD would have submitted its request for Medicaid program funding to the Legislature. The actuary bases his rates on claims data between two and three years old, therefore it is plausible preliminary actuarial analysis could be completed in time to be included in HSD’s budget request. Furthermore, as of the publishing of this report, HSD is projecting Medicaid expenditures out through FY16, but does not itemize all program changes and their impact on forecasted expenses. Actual expenditures for CY14 are $516 million below cost estimates provided to CMS in the approved waiver. Due to overestimates for most eligibility categories in member months and capitation PMPM, the actual expenditures for CY14 came in more than $516 million lower than initial care cost estimates (Appendix E). This should translate to approximately $139 million in general fund savings. Because cost estimates made to the federal government are done on a different timeframe (calendar year versus fiscal year), and because different categories are used in the federal estimate (Medicaid eligibility groups) than those used in the HSD-produced Medicaid projections, it is unclear if these cost savings could translate to state fiscal year savings for New Mexico. It is likely that at least part of these savings are due to health homes not being implemented as cost estimates in the approved waiver estimated a net loss for health homes in CY14 of $30 million. In other states, the Medicaid cost projection process is more transparent, and incorporates greater oversight. In Washington, the Caseload Forecast Council (CFC), a small independent agency, has ultimate authority and responsibility for entitlement forecasts. The major decisions affecting the forecast are made through the Technical Workgroup (comprised of legislative, executive, and program staff), which performs a critical review of the forecast assumptions, exchange information, and discusses how to incorporate policy changes into the forecast. The process in Florida is equally comprehensive and transparent. The Office of Economic and Demographic Research (EDR) is in charge of publishing the Medicaid Services and Expenditures Forecast, which provides detailed expenditure forecasts for up to five years, broken down into multiple sub-categories. The Florida EDR gets its projections from the Social Services Estimating Conference which is a Consensus Estimating Conference in charge of developing forecast projections for Medicaid. This conference is led by four professional staff members from multiple departments (EDR, the House of Representatives, the Senate, and the Governor’s Office). New Mexico could benefit from aligning performance measures more closely to appropriations for Medicaid. New Mexico currently includes eight total performance measures for Medicaid (six for physical health and two for behavioral health) in the General Appropriation Act. While this is comparable to other states, the issue is many of New Mexico’s measures have very little to do with costs. In contrast, the Oregon Health Authority (OHA), which consolidates public health, Medicaid, and state employee health plans, ties performance measures more directly to appropriations. In the Oregon Health Authority’s section of the state budget, each specific appropriation includes a column specifying the particular performance measure that is being addressed with that individual appropriation.
Human Services Department Report #15-08 Centennial Care Waiver and Medicaid Managed Care Costs June 24, 2015
71
Under Centennial Care, some MCO reporting to HSD has been discontinued, transitioned from contractual requirement to a requirement in the MCO policy manual, or put on hold, and utilization reporting is weakened. As a part of its 1115 demonstration waiver application, HSD identified reporting as a key part of Centennial Care noting that MCOs will be required to demonstrate compliance with monitoring and reporting requirements, specifically listing reporting in program elements of care coordination, health homes, and cultural considerations. As part of its contract, HSD requires extensive reporting on the part of MCOs. The original Centennial Care contract lists eighty-two reports required from MCOs in an appendix (section 4.21). The contract also provides a $5,000 penalty for failure on the part of MCOs to submit accurate or properly formatted reports per each occurrence. A report matrix provided to LFC from HSD lists sixty-six different reports required on the part of MCOs. In MCO contracts, additional reporting can also be required as requested by HSD.
HSD provided LFC with a matrix of reports listing six reports as being “on hold”. Reports listed as being on hold included a quarterly member care coordination activities report, a monthly payment reform pilot project update report, a monthly electronic visit verification report, a quarterly program integrity report, a quarterly member rewards report, and a quarterly health homes report. Many of these reports are related to new Centennial Care initiatives including payment reform, member rewards and health homes. As noted elsewhere in this report, at least two of these initiatives have been delayed, including payment reform and health homes.
A January 2015 contract amendment moved much of the required reporting for MCOs to the HSD managed care policy manual. A contract amendment to all MCO contracts moves reporting requirements out of contract and into the HSD managed care policy manual, including reporting requirements for member reports, cultural and linguistic competencies plans and reports, administrative reports, provider reports, provider outreach and education plans and reports, specialized services reports, care coordination reports, utilization management reports, quality reports, systems reports, claims management reports, and financial management reports. According to HSD, the financial penalty for MCO failure to report in contract is still enforceable.
In three letters of direction (#29, #29A, #29B) to MCOs, HSD discontinued requirement of 12 reports, made four reports due less frequently, and listed five of the six reports noted as being on hold earlier in this report, as still being on hold. HSD’s explanation for each action is listed in Table 33. The quarterly program integrity report (Report 56) provides information regarding suspicious activity, fraud and abuse cases, return on investment, cost avoidance, and adverse events was put on hold in November 2014 and reinstated in February 2015 in letter of direction #29B “Report 56 is no longer on hold. Email directive issued on 1/15/15. The first submission is due 2/9/15. Subsequent submissions will follow the regular quarterly schedule”. According to HSD, this hold did not cause any interruption in 2014 program integrity reporting.

Human Services Department Report #15-08 Centennial Care Waiver and Medicaid Managed Care Costs June 24, 2015
72
Table 33. MCO Reporting Discontinued or Put on Hold by HSD
Report Number Report Title Frequency Determination
HSD Explanation
10 Caseload and Staffing Ratio Report Monthly Discontinued
Pursuant to Letter of Direction 29, this report was discontinued and designated as an ad hoc report. MCOs submit a weekly ad hoc staffing report consisting of care coordination staffing numbers by each Care Coordination Level.
13 Call Center Report Daily Discontinued This report was submitted daily during the transition phase of Centennial Care. Now a monthly report
14 Call Center Report Weekly Discontinued This report was submitted weekly during the transition phase of Centennial Care. Now a monthly report.
28 Privacy/Security Incident Report Annual Discontinued
This report was discontinued pursuant to Letter of Direction 29, as MCOs are mandated under the Heath Information Patient and Portability Act to report security breaches and incidents to HSD within 30 days of discovery.
52 Care Plan Report Monthly Discontinued This report was discontinued pursuant to Letter of Direction 29, as the data is reported in the weekly ad hoc staffing report.
29
Business Continuity and Disaster Recovery (BC-DR) Plan Annual Discontinued
MCOs submitted their BCDR plans during readiness and are only required to resubmit if they revise their plans. HSD receives MCO test results annually.
34
Cultural Competency/Sensitivity Plan Annual Discontinued
This report was discontinued pursuant to Letter of Direction 29. Currently, Native American liaisons within each MCO provide cultural competency and sensitivity training for all new employees and offer refresher training to seasoned employees. The liaisons also respond to complaints and provide trained when needed. Each MCO is required to incorporate this training in their respective policies.
36A Critical Incidents Report Monthly Discontinued Reports 36, 36A, and 36 were combined into a single report (36).
57 Claims Activity Report Weekly Discontinued
This report was submitted weekly during the transition phase of Centennial Care. MCOs are required to report claims activity via Report 47, which is submitted monthly.
58 Member Enrollment Materials Report Quarterly Discontinued This report was discontinued pursuant to Letter of Direction 29.
59 Hiring Report Quarterly Discontinued This report was discontinued pursuant to Letter of Direction 29.
60
Systems Availability and Performance Report Quarterly Discontinued
This report was discontinued pursuant to Letter of Direction 29. MCOs currently report incidents affecting systems performance directly to the MAD Systems Bureau. Requirements for such reporting are outlined in the MAD Policy Manual.
17
Member Care Coordination Activities Report Quarterly On Hold This report has not been developed.
26 Payment Reform Pilot Project Updates Monthly On Hold A reporting template is being developed for issuance in July 2015.
35 Electronic Visit Verification Quarterly On Hold
A governance board and workgroup is currently developing program requirements.
65 Member Rewards Report Quarterly On Hold
The data for member rewards is produced by Finity and shared with the MCOs who then upload the data to HSD. A separate report for this information is not required.
66 Health Homes Report Quarterly On Hold This report is currently being developed for issuance in late 2015. Source: HSD Letters of Direction #29. #29A. #29B
Some administrative reporting has improved under Centennial Care. Although no longer specifically required under contract, administrative reporting has improved under Centennial Care. More detailed information regarding what administrative spending consists of within financial reports is provided and an administrative expense detail report is required of MCOs on an annual basis. Service utilization reporting has been weakened under Centennial Care and data quality appears to be an issue. Prior to the implementation of Centennial Care, MCOs reported on 27 categories of utilization data, one for each service category type in physical health and long-term services. Additionally, OptumHealth reported on utilization in their CI-09 report. Collection of utilization data for each program area under Centennial Care has been reduced. For the categories of utilization that are consistent between pre-Centennial Care and Centennial Care, some are not currently comparable due to data quality issues identified by LFC staff. For example, one MCO reports members having about three times as many inpatient days as the other three MCOs combined. HSD has confirmed data
Human Services Department Report #15-08 Centennial Care Waiver and Medicaid Managed Care Costs June 24, 2015
73
quality issues with utilization reporting however, it is unclear if MCOs are subject to penalty amounts previously imposed by contract.
HSD should consider awarding MCOs with enrollees based on rates. Currently, MCOs have little incentive to negotiate for lower rates. HSD could in theory provide additional enrollees to MCOs negotiating the lowest rates rather than basing number of enrollees awarded on HRA completion. HSD should consult DHHS to see if this potential cost control measure is considered equitable under federal law. Recommendations: The Legislature should consider budgeting Medicaid to program area level (physical health, behavioral health, long-term services, Medicaid expansion), and requiring reporting on Medicaid spending through other state agencies including CYFD, DOH, etc. along with appropriate performance measures for each part of Medicaid. The Legislature should consider requiring HSD to include, as a part of its budget proposal, approved rates and rate ranges for the upcoming budget year. The Legislature should consider amending statute to require HSD to develop a Centennial Care performance report card inclusive of measures for cost savings, quality performance, and clinical outcomes. HSD should work with LFC and DFA to develop a regular reporting format for Medicaid managed care as part of regular projection meetings. Reports should provide, at a minimum, up-to-date cohort level data on enrollment and average PMPM spending compared to beginning of the year projections. HSD should also include projections by major program. HSD should institute a set list of performance measures for MCO payment reform to measure performance uniformly across all MCOs. These performance measures should include measurement of cost savings and utilization reduction. HSD should include actuarial analysis in budgeting and forecasting process and provide line-item detail for key program changes within the Medicaid program. HSD should consider incentivizing lower rates by awarding MCOs with enrollees based on rates.
Human Services Department Report #15-08 Centennial Care Waiver and Medicaid Managed Care Costs June 24, 2015
74
AGENCY RESPONSES

Human Services Department Report #15-08 Centennial Care Waiver and Medicaid Managed Care Costs June 24, 2015
75
Human Services Department Report #15-08 Centennial Care Waiver and Medicaid Managed Care Costs June 24, 2015
76
Human Services Department Report #15-08 Centennial Care Waiver and Medicaid Managed Care Costs June 24, 2015
77

Human Services Department Report #15-08 Centennial Care Waiver and Medicaid Managed Care Costs June 24, 2015
78

Human Services Department Report #15-08 Centennial Care Waiver and Medicaid Managed Care Costs June 24, 2015
79

Human Services Department Report #15-08 Centennial Care Waiver and Medicaid Managed Care Costs June 24, 2015
80
Human Services Department Report #15-08 Centennial Care Waiver and Medicaid Managed Care Costs June 24, 2015
81
Human Services Department Report #15-08 Centennial Care Waiver and Medicaid Managed Care Costs June 24, 2015
82
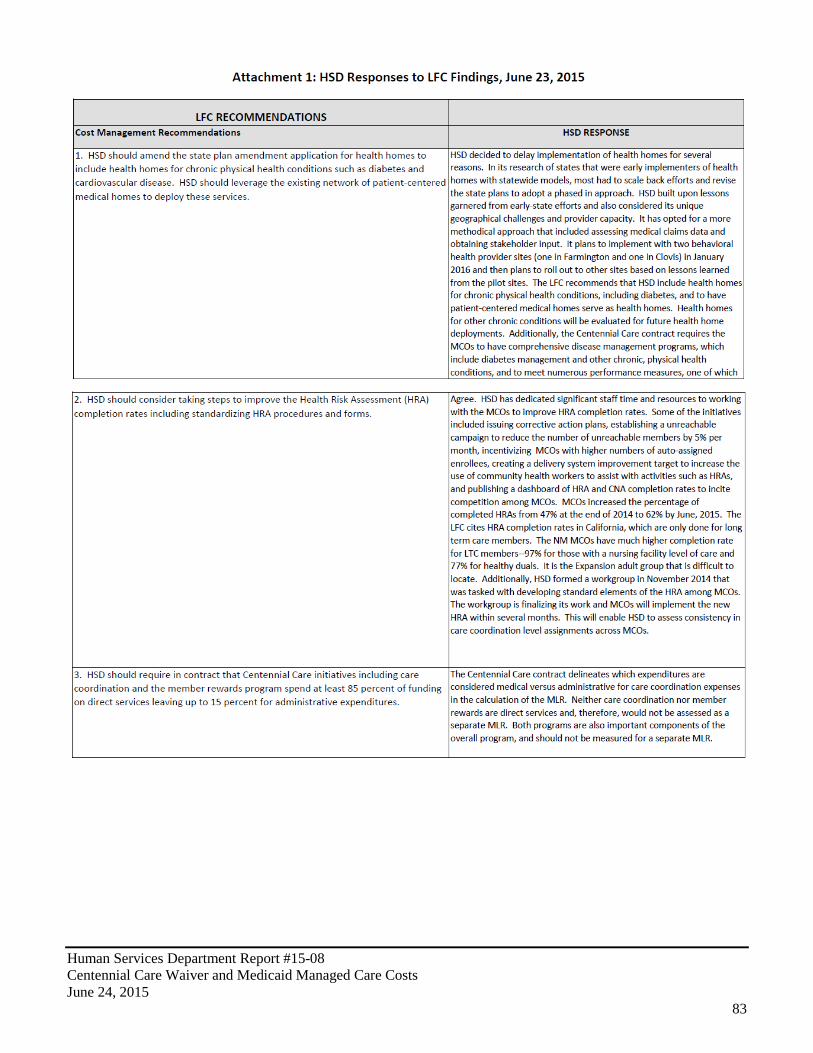
Human Services Department Report #15-08 Centennial Care Waiver and Medicaid Managed Care Costs June 24, 2015
83
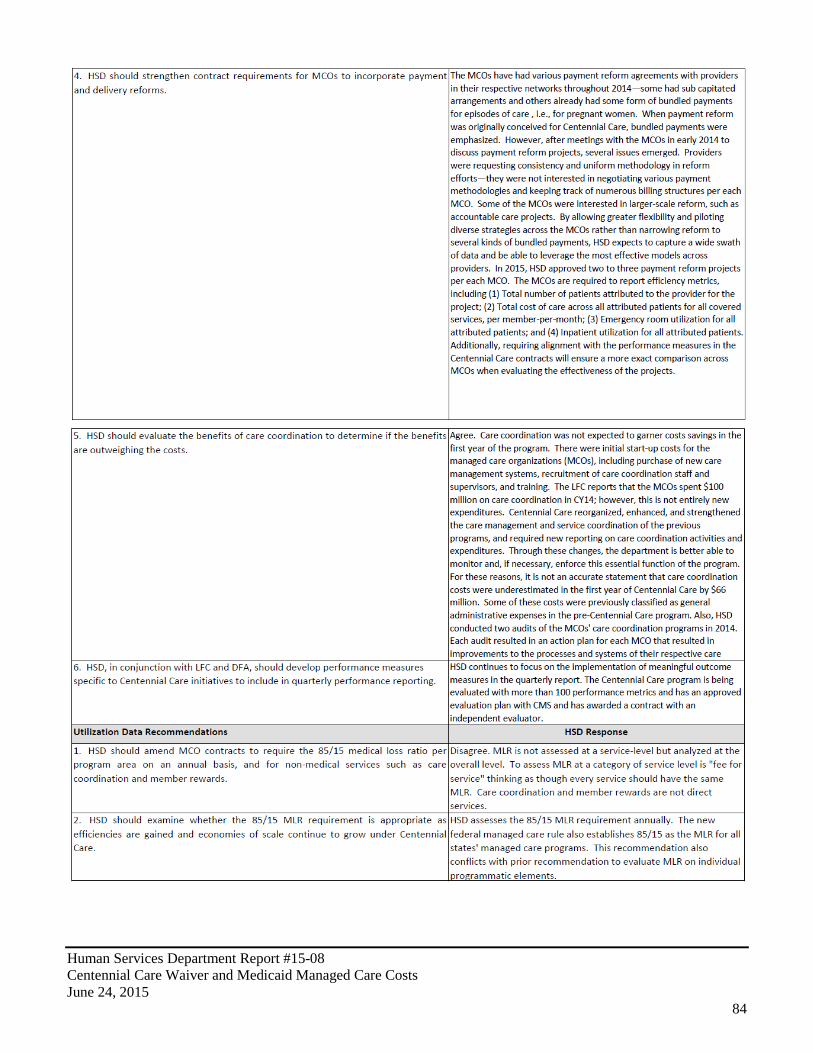
Human Services Department Report #15-08 Centennial Care Waiver and Medicaid Managed Care Costs June 24, 2015
84
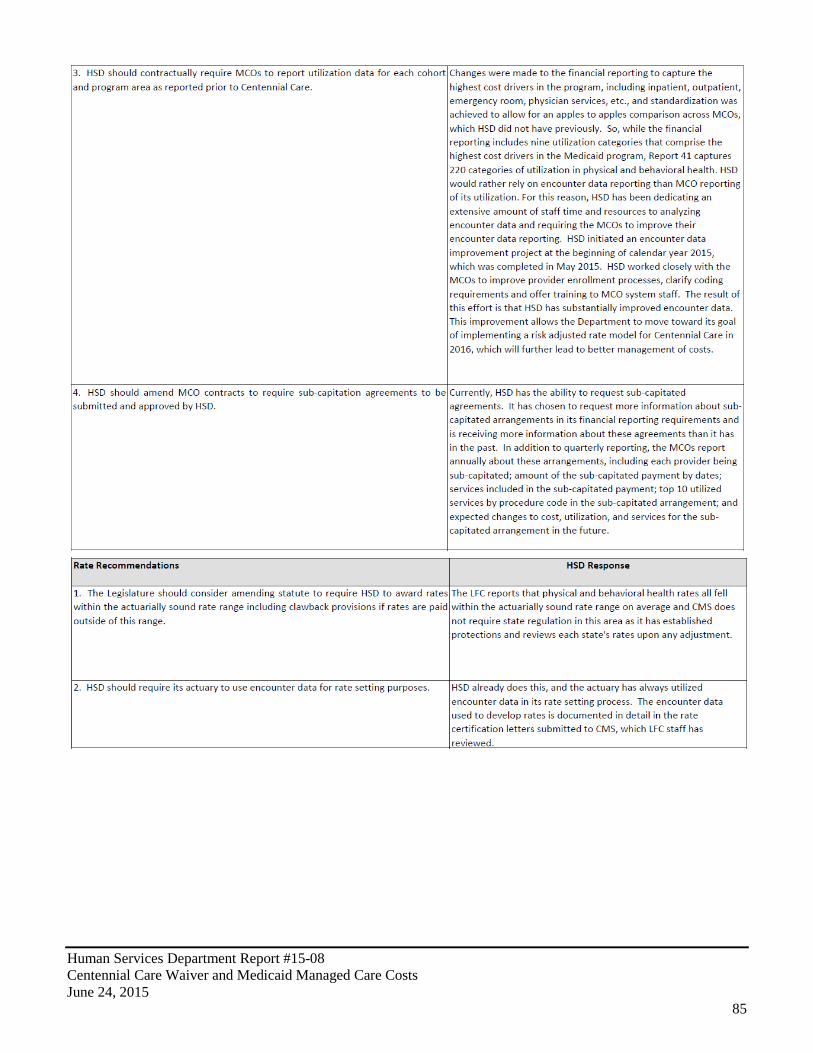
Human Services Department Report #15-08 Centennial Care Waiver and Medicaid Managed Care Costs June 24, 2015
85
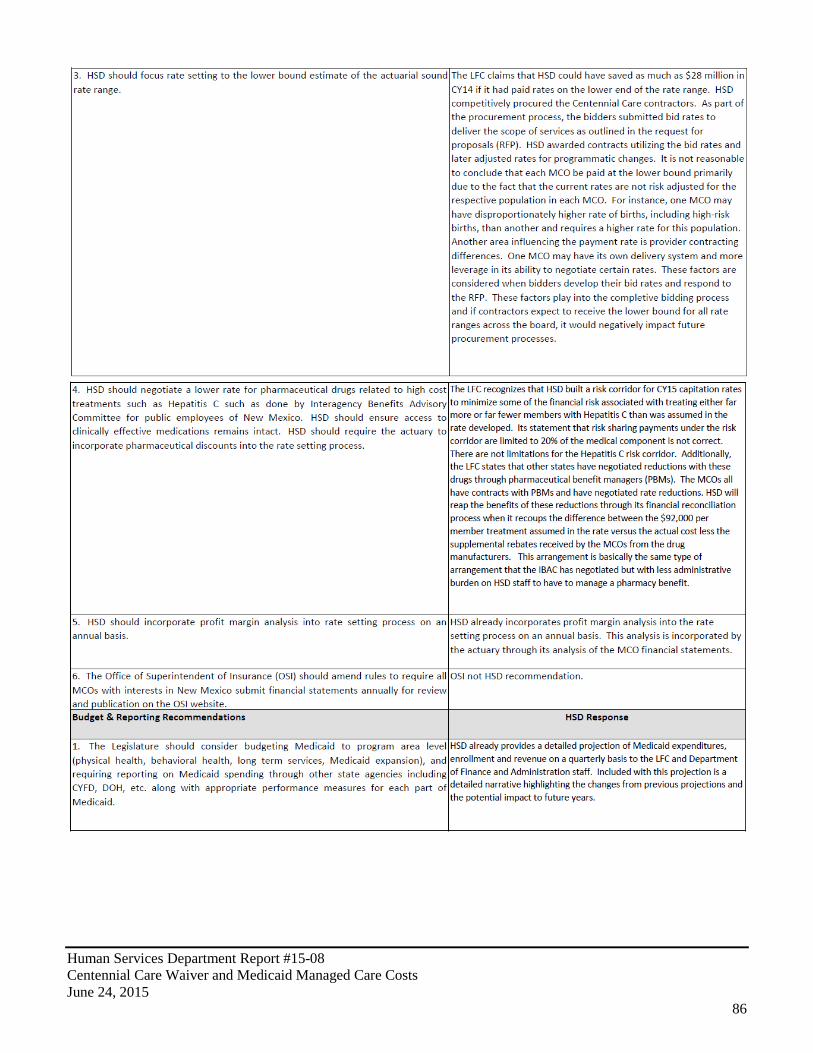
Human Services Department Report #15-08 Centennial Care Waiver and Medicaid Managed Care Costs June 24, 2015
86
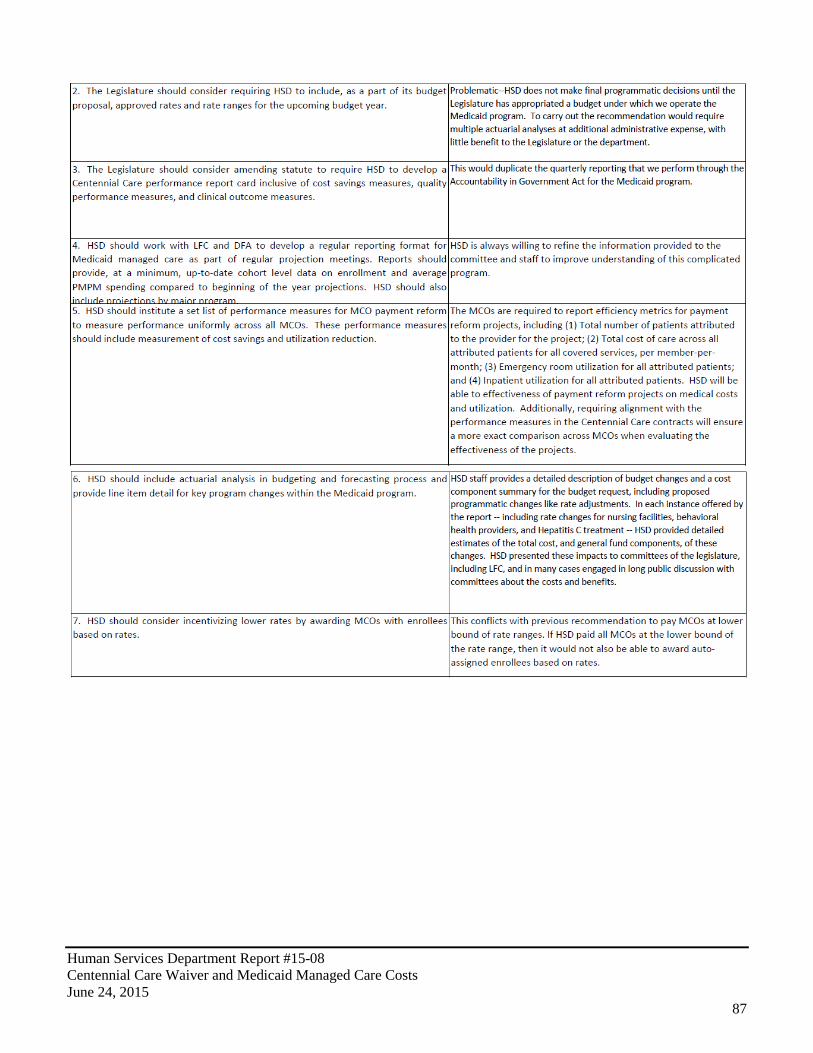
Human Services Department Report #15-08 Centennial Care Waiver and Medicaid Managed Care Costs June 24, 2015
87
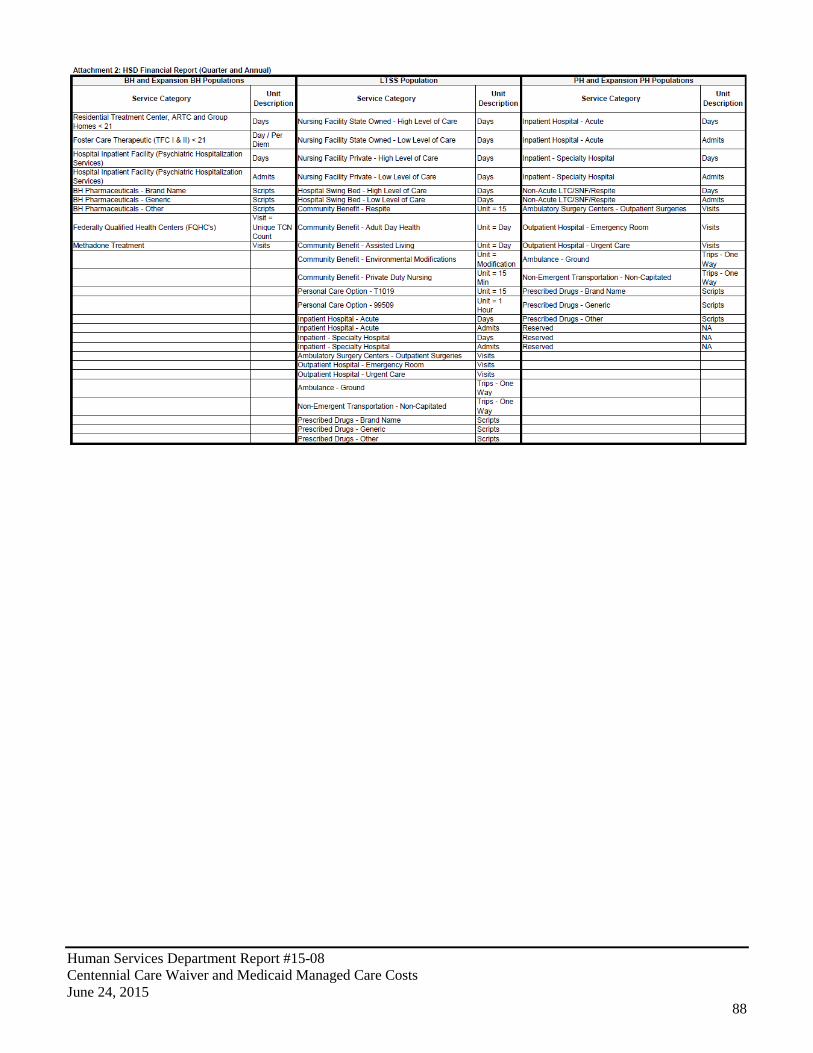
Human Services Department Report #15-08 Centennial Care Waiver and Medicaid Managed Care Costs June 24, 2015
88

Human Services Department Report #15-08 Centennial Care Waiver and Medicaid Managed Care Costs June 24, 2015
89
APPENDIX A: EVALUATION SCOPE, OBJECTIVES, AND METHODOLOGY Evaluation Objectives.
• Examine cost management components and goals of the Centennial Care waiver, including an assessment of baseline spending prior to implementation;
• Assess the rate setting process for the Medicaid managed care program; and • Review Human Services Department’s oversight of managed care organization fiscal requirements for • Centennial Care and previous waivers.
Scope and Methodology.
• Interview HSD, MCO employees; • Review state and federal laws, regulations and policies – goals and objectives of the program; • Review MCO contracts, list of deliverables or reports required and review selected sample as appropriate; • Review department reports, Medicaid plans, waivers and any related correspondence with CMS, including
CMS audit reports; • Review public (CMS, GAO, other states) and private research and evaluations of managed care, Medicaid
managed care and costs of health care in general; • Collect financial, and other aggregate utilization data from the department for FY10-FY14, and projected
FY15 for Medicaid managed care as a whole, and individually for each MCO; • Review recent policy or programmatic changes related to Centennial Care intended to control costs and any
data or reports showing evidence of success etc. (either at state or federal levels); • Review improvement reports of MCOs to assess evidence of improved care management and its effect on
costs (disease management for example); • Department Actuary - request letters of direction, contracts, and reports to assess managed care costs,
projected costs and suggested rate ranges; and CMS approval of actuarial reports; • Review other states per-member-per-month costs and/or specific rates; • Review changes in cohort enrollment and costs from FY10-FY14 and how costs compared to actuarial
projections and percent of enrollees actually using services; • Review the department’s pay for performance program, compare to other selected states, obtain amounts
awarded versus available awards, and verify MCOs met fair targets before receiving awards; • Request and review reports that combine resource use and performance at the department, MCOs and
research other states and evaluations; • Review summary contract compliance reports from the department, selected improvement plans by the
MCOs, any contract enforcement actions and related documents; • Request data on number/percent of new enrollees who select MCO versus those who were auto enrolled; • Review any program goals or other documents (or interviews) on expected results of enrollee choice and
subsequent evaluations or assessments Evaluation Team. Jon R. Courtney, Ph.D. Program Evaluation Manager Maria D. Griego, Program Evaluator Cody Cravens, Program Evaluator Shane Shariff, LFC Intern Authority for Evaluation. LFC is authorized under the provisions of Section 2-5-3 NMSA 1978 to examine laws governing the finances and operations of departments, agencies, and institutions of New Mexico and all of its political subdivisions; the effects of laws on the proper functioning of these governmental units; and the policies and costs. LFC is also authorized to make recommendations for change to the Legislature. In furtherance of its statutory responsibility, LFC may conduct inquiries into specific transactions affecting the operating policies and cost of governmental units and their compliance with state laws.

Human Services Department Report #15-08 Centennial Care Waiver and Medicaid Managed Care Costs June 24, 2015
90
Exit Conferences. The contents of this report were discussed with the Secretary of the Human Services Department and his staff on June 11, 2015. Report Distribution. This report is intended for the information of the Office of the Governor; Human Services Department; Office of the State Auditor; and the Legislative Finance Committee. This restriction is not intended to limit distribution of this report, which is a matter of public record.
Charles Sallee Deputy Director for Program Evaluation

Human Services Department Report #15-08 Centennial Care Waiver and Medicaid Managed Care Costs June 24, 2015
91
APPENDIX B: GLOSSARY OF MEDICAID TERMS Accountable Care Organization (ACO) – An ACO is a network of doctors and hospitals that shares financial and medical responsibility for providing coordinated care to patients in hopes of limiting unnecessary spending. At the heart of each patient’s care is a primary care physician. It is a type of payment and delivery reform model that ties provider reimbursements to quality metrics and reductions in the total cost of care for an assigned population of patients. Actuarially Sound – The federal statutory standard to which capitation payments made by state Medicaid programs under risk contracts to managed care organizations (MCOs) are held. Actuary – A business professional who analyzes the financial consequences of risk. Actuaries use mathematics, statistics and financial theory to study uncertain future events, especially those of concern to insurance and pension programs. They evaluate the likelihood of those events, design creative ways to reduce the likelihood and decrease the impact of adverse events that actually do occur. Bundled Payments –A single payment that covers services delivered for an episode of care defined by a specified set of services delivered by designated providers in a specified health care setting over a specified period of time for a procedure or condition. Capitation Payment – A payment made by a state Medicaid agency under a risk contract, generally to a managed care organization (MCO). The payment is made on a monthly basis at a fixed amount on behalf of each Medicaid beneficiary enrolled in the MCO. Capitation Per Member Per Month (PMPM) – The average per-member-per-month amount in capitation payments HSD pays to MCOs to provide care for Medicaid enrollees. Calculated by dividing total capitation payments by total member months. Carve Out – The term used informally to describe the exclusion of certain services to which Medicaid beneficiaries are entitled from a risk contract between a state Medicaid agency and an MCO. Centers for Medicare and Medicaid Services (CMS) – The agency in the Department of Health and Human Services (DHHS) with responsibility for administering the Medicaid, Medicare, and State Children’s Health Insurance programs at the federal level. CMS was formerly known as the Health Care Financing Administration (HCFA). Dual Eligibles – An individual who is eligible both for Medicare and for full Medicaid coverage, including nursing home services and prescription drugs, as well as for payment of Medicare premiums, deductibles, and co-insurance. Federal Financial Participation (FFP) – The technical term for federal Medicaid matching funds paid to states for allowable expenditures for Medicaid services or administrative costs. Federal Medical Assistance Percentage (FMAP) – The statutory term for the federal Medicaid matching rate. The portion of the Medicaid services or administration costs which are paid by the Federal government. Federal Poverty Level (FPL) – The federal government’s working definition of poverty that is used as the reference point for the income standard for Medicaid eligibility for certain categories of beneficiaries. Federally Qualified Health Center (FQHC) – Health centers that have been approved by the government for a program to give low cost health care. Medicare pays for some health services in FQHCs that are not usually covered, like preventive care. FQHCs include community health centers, tribal health clinics, migrant health
Human Services Department Report #15-08 Centennial Care Waiver and Medicaid Managed Care Costs June 24, 2015
92
services, and health centers for the homeless. Fee-For-Service – A traditional method of paying for medical services under which doctors and hospitals are paid for each service they provide. Health Home – A health home is a Medicaid State Plan Option that provides a comprehensive system of care coordination for Medicaid individuals with chronic conditions. Health home providers will integrate and coordinate all primary, acute, behavioral health, and long-term services and supports to treat the “whole person” across the lifespan. Home and Community-Based Services (HCBS) – The HCBS programs offer different choices to some people with Medicaid. If you qualify, you will get care in your home and community so you can stay independent and close to your family and friends. HCBS programs help the elderly and disabled, mentally retarded, developmentally disabled, and certain other disabled adults. These programs give quality and low-cost services. Managed Care Organization (MCO) – Entities that serve Medicare or Medicaid beneficiaries through a network of employed or affiliated providers. They serve beneficiaries on a risk basis with a state agency to provide a specified package of benefits to enrollees in exchange for an actuarially sound monthly capitation payment. The term generally includes HMOs, PPOs, and Point of Service plans. MCO Expenditure PMPM – The average per-member-per-month actual cost of care MCOs pay to medical providers. Calculated by dividing total MCO expenditures on medical services by total member months. Medicaid – A joint federal and state program that helps with medical costs for some individuals and families with low incomes and limited resources. Although largely funded by the federal government, Medicaid is run by the state where coverage may vary. Medical Loss Ratio – The Affordable Care Act requires health insurance issuers to submit data on the proportion of premium revenues spent on clinical services and quality improvement. MLR requires insurance companies spend at least 80 percent or 85 percent of premium dollars on medical care, with the review provisions imposing tighter limits on health insurance rate increases. If they fail to meet these standards, the insurance companies will be required to provide a rebate to their customers starting in 2012. This is intended to limit the portion of premium dollars health insurers may spend on administration, marketing, and profits. Medicare – The federal health insurance program for: people 65 years of age or older, certain younger people with disabilities, and people with End-Stage Renal Disease (permanent kidney failure with dialysis or a transplant, sometimes called ESRD). Patient-Centered Medical Home – is an approach to providing comprehensive primary care for children, youth and adults. The PCMH is a health care setting that facilitates partnerships between individual patients, and their personal physicians, and when appropriate, the patient's family. It is a way of organizing primary care that emphasizes care coordination and communication. Payment Reform – Payment methods that reflect or support provider performance, especially the quality and safety of care that providers deliver, and are designed to spur provider efficiency and reduce unnecessary spending. Per-Member-Per-Month (PMPM) – Is an alternative payment scheme in which a provider organization is given a set amount of money each month to provide an agreed upon range of services for the patients enrolled in the program for the period of time covered by the agreement.

Human Services Department Report #15-08 Centennial Care Waiver and Medicaid Managed Care Costs June 24, 2015
93
PMPM Capitation Rate –The per-member-per-month capitation rate agreed upon by HSD and the MCOs to pay for Medicaid recipient care. This rate is required to fall within a range set by HSD’s actuary and approved by CMS. Section 1115 Waiver – Section 1115 of the Social Security Act gives the Secretary of Health and Human Services authority to approve experimental, pilot, or demonstration projects that promote the objectives of the Medicaid and CHIP programs. The purpose of these demonstrations, which give States additional flexibility to design and improve their programs, is to demonstrate and evaluate policy approaches such as: expanding eligibility to individuals who are not otherwise Medicaid or CHIP eligible, providing services not typically covered by Medicaid, and using innovative service delivery systems that improve care, increase efficiency, and reduce costs. In general, section 1115 demonstrations are approved for a five-year period and can be renewed, typically for an additional three years. Demonstrations must be "budget neutral" to the Federal government, which means that during the course of the project Federal Medicaid expenditures will not be more than Federal spending without the waiver. State Plan Amendment (SPA) – A state that wishes to change its Medicaid eligibility criteria or its covered benefits or its provider reimbursement rates must amend its state Medicaid plan to reflect the proposed change. Similarly, states must conform their state plans to changes in federal Medicaid law. In either case, the state must submit a state plan amendment (SPA) to CMS for approval. Sub-capitation – An arrangement that exists when an organization that is being paid under a capitated system contracts with other providers on a capitated basis, sharing a portion of the original capitated premium. It can be done under Carve Out, with the providers being paid on a PMPM basis. Supplemental Security Income (SSI) – A federal entitlement program that provides cash assistance to low income aged, blind, and disabled individuals. Individuals receiving SSI benefits are eligible for Medicaid coverage in all states except “section 209(b)” states. Temporary Assistance for Needy Families (TANF) – A block grant program that makes federal matching funds available to states for cash and other assistance to low income families with children. TANF was established by the 1996 welfare law that repealed its predecessor, the Aid to Families with Dependent Children (AFDC) program. Waivers – Various statutory authorities under which the Secretary of DHHS may, upon the request of a state, allow the state to receive federal Medicaid matching funds for its expenditures even though it is no longer in compliance with certain requirements or limitations of the federal Medicaid statute. In the case of program waivers such as the 1915(c) waiver for home- and community-based services, states may receive federal matching funds for services for which federal matching funds are not otherwise available. In the case of demonstration waivers such as the section 1115 waivers, states may receive federal matching funds for covering certain categories of individuals for which federal matching funds are not otherwise available. Under Section 1915(b) waivers, states may restrict the choice of providers that Medicaid beneficiaries would otherwise have.
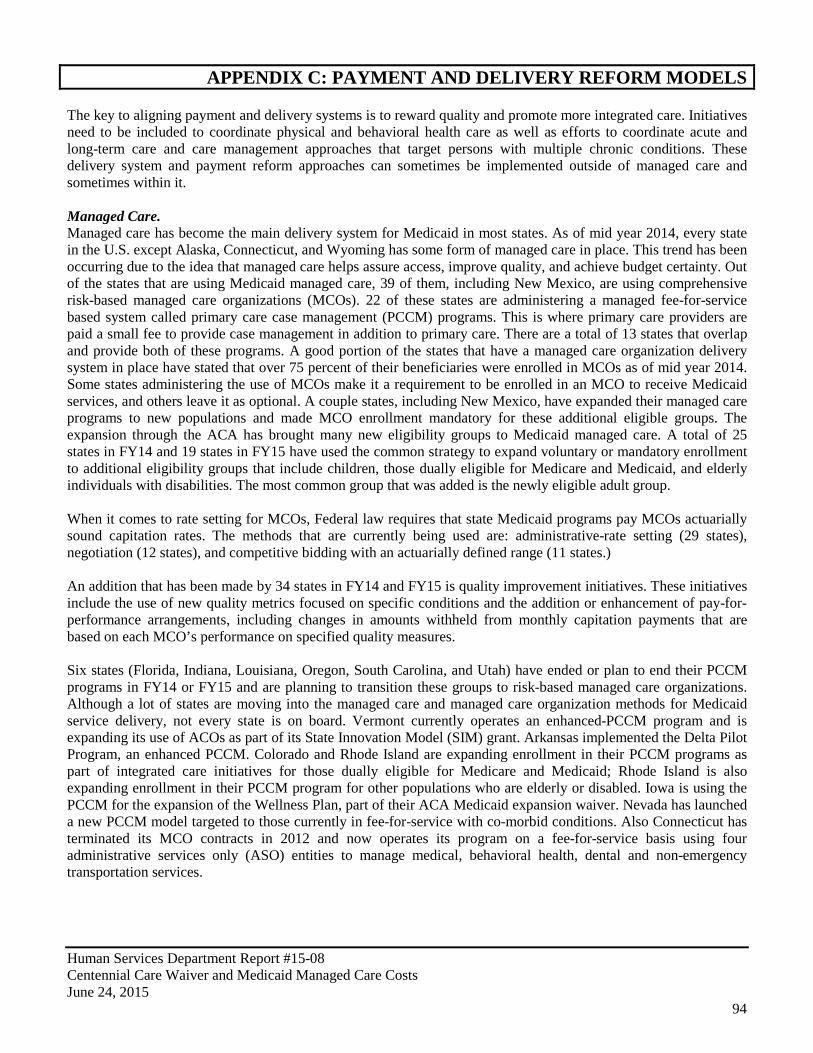
Human Services Department Report #15-08 Centennial Care Waiver and Medicaid Managed Care Costs June 24, 2015
94
APPENDIX C: PAYMENT AND DELIVERY REFORM MODELS The key to aligning payment and delivery systems is to reward quality and promote more integrated care. Initiatives need to be included to coordinate physical and behavioral health care as well as efforts to coordinate acute and long-term care and care management approaches that target persons with multiple chronic conditions. These delivery system and payment reform approaches can sometimes be implemented outside of managed care and sometimes within it. Managed Care. Managed care has become the main delivery system for Medicaid in most states. As of mid year 2014, every state in the U.S. except Alaska, Connecticut, and Wyoming has some form of managed care in place. This trend has been occurring due to the idea that managed care helps assure access, improve quality, and achieve budget certainty. Out of the states that are using Medicaid managed care, 39 of them, including New Mexico, are using comprehensive risk-based managed care organizations (MCOs). 22 of these states are administering a managed fee-for-service based system called primary care case management (PCCM) programs. This is where primary care providers are paid a small fee to provide case management in addition to primary care. There are a total of 13 states that overlap and provide both of these programs. A good portion of the states that have a managed care organization delivery system in place have stated that over 75 percent of their beneficiaries were enrolled in MCOs as of mid year 2014. Some states administering the use of MCOs make it a requirement to be enrolled in an MCO to receive Medicaid services, and others leave it as optional. A couple states, including New Mexico, have expanded their managed care programs to new populations and made MCO enrollment mandatory for these additional eligible groups. The expansion through the ACA has brought many new eligibility groups to Medicaid managed care. A total of 25 states in FY14 and 19 states in FY15 have used the common strategy to expand voluntary or mandatory enrollment to additional eligibility groups that include children, those dually eligible for Medicare and Medicaid, and elderly individuals with disabilities. The most common group that was added is the newly eligible adult group. When it comes to rate setting for MCOs, Federal law requires that state Medicaid programs pay MCOs actuarially sound capitation rates. The methods that are currently being used are: administrative-rate setting (29 states), negotiation (12 states), and competitive bidding with an actuarially defined range (11 states.) An addition that has been made by 34 states in FY14 and FY15 is quality improvement initiatives. These initiatives include the use of new quality metrics focused on specific conditions and the addition or enhancement of pay-for-performance arrangements, including changes in amounts withheld from monthly capitation payments that are based on each MCO’s performance on specified quality measures. Six states (Florida, Indiana, Louisiana, Oregon, South Carolina, and Utah) have ended or plan to end their PCCM programs in FY14 or FY15 and are planning to transition these groups to risk-based managed care organizations. Although a lot of states are moving into the managed care and managed care organization methods for Medicaid service delivery, not every state is on board. Vermont currently operates an enhanced-PCCM program and is expanding its use of ACOs as part of its State Innovation Model (SIM) grant. Arkansas implemented the Delta Pilot Program, an enhanced PCCM. Colorado and Rhode Island are expanding enrollment in their PCCM programs as part of integrated care initiatives for those dually eligible for Medicare and Medicaid; Rhode Island is also expanding enrollment in their PCCM program for other populations who are elderly or disabled. Iowa is using the PCCM for the expansion of the Wellness Plan, part of their ACA Medicaid expansion waiver. Nevada has launched a new PCCM model targeted to those currently in fee-for-service with co-morbid conditions. Also Connecticut has terminated its MCO contracts in 2012 and now operates its program on a fee-for-service basis using four administrative services only (ASO) entities to manage medical, behavioral health, dental and non-emergency transportation services.
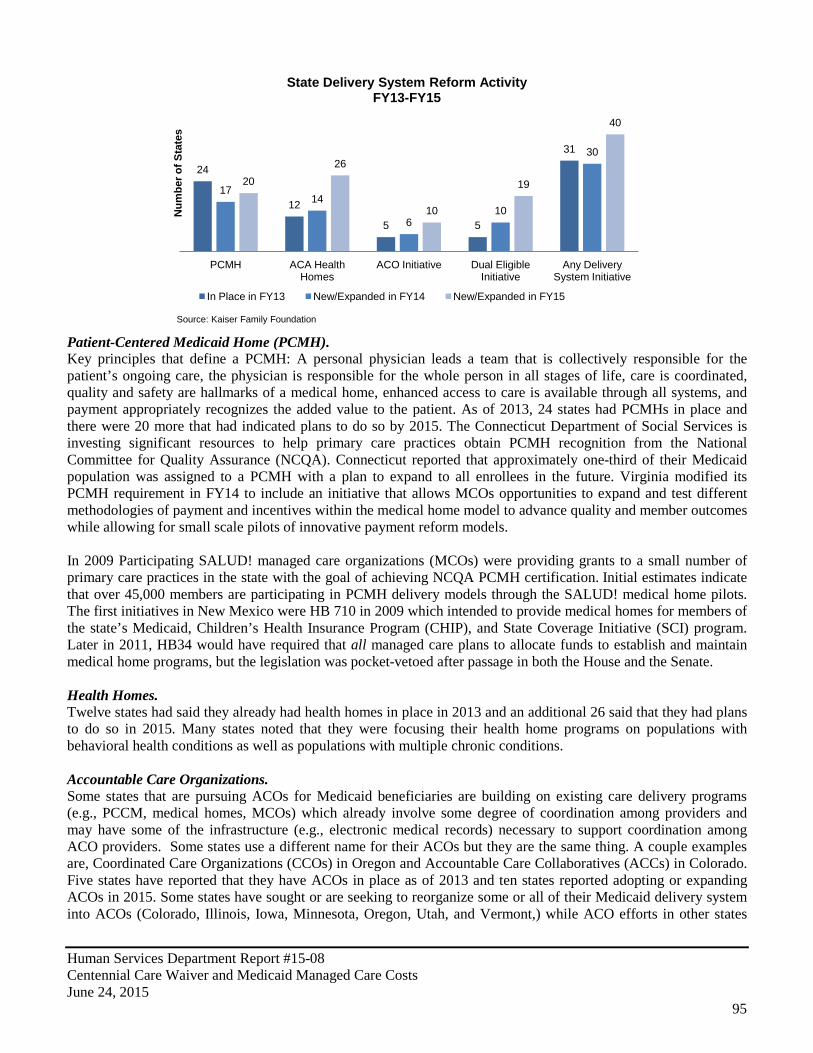
Human Services Department Report #15-08 Centennial Care Waiver and Medicaid Managed Care Costs June 24, 2015
95
Patient-Centered Medicaid Home (PCMH). Key principles that define a PCMH: A personal physician leads a team that is collectively responsible for the patient’s ongoing care, the physician is responsible for the whole person in all stages of life, care is coordinated, quality and safety are hallmarks of a medical home, enhanced access to care is available through all systems, and payment appropriately recognizes the added value to the patient. As of 2013, 24 states had PCMHs in place and there were 20 more that had indicated plans to do so by 2015. The Connecticut Department of Social Services is investing significant resources to help primary care practices obtain PCMH recognition from the National Committee for Quality Assurance (NCQA). Connecticut reported that approximately one-third of their Medicaid population was assigned to a PCMH with a plan to expand to all enrollees in the future. Virginia modified its PCMH requirement in FY14 to include an initiative that allows MCOs opportunities to expand and test different methodologies of payment and incentives within the medical home model to advance quality and member outcomes while allowing for small scale pilots of innovative payment reform models. In 2009 Participating SALUD! managed care organizations (MCOs) were providing grants to a small number of primary care practices in the state with the goal of achieving NCQA PCMH certification. Initial estimates indicate that over 45,000 members are participating in PCMH delivery models through the SALUD! medical home pilots. The first initiatives in New Mexico were HB 710 in 2009 which intended to provide medical homes for members of the state’s Medicaid, Children’s Health Insurance Program (CHIP), and State Coverage Initiative (SCI) program. Later in 2011, HB34 would have required that all managed care plans to allocate funds to establish and maintain medical home programs, but the legislation was pocket-vetoed after passage in both the House and the Senate. Health Homes. Twelve states had said they already had health homes in place in 2013 and an additional 26 said that they had plans to do so in 2015. Many states noted that they were focusing their health home programs on populations with behavioral health conditions as well as populations with multiple chronic conditions. Accountable Care Organizations. Some states that are pursuing ACOs for Medicaid beneficiaries are building on existing care delivery programs (e.g., PCCM, medical homes, MCOs) which already involve some degree of coordination among providers and may have some of the infrastructure (e.g., electronic medical records) necessary to support coordination among ACO providers. Some states use a different name for their ACOs but they are the same thing. A couple examples are, Coordinated Care Organizations (CCOs) in Oregon and Accountable Care Collaboratives (ACCs) in Colorado. Five states have reported that they have ACOs in place as of 2013 and ten states reported adopting or expanding ACOs in 2015. Some states have sought or are seeking to reorganize some or all of their Medicaid delivery system into ACOs (Colorado, Illinois, Iowa, Minnesota, Oregon, Utah, and Vermont,) while ACO efforts in other states
24
12
5 5
31
17 14
6 10
30
20 26
10
19
40
PCMH ACA Health Homes
ACO Initiative Dual Eligible Initiative
Any Delivery System Initiative
State Delivery System Reform Activity FY13-FY15
In Place in FY13 New/Expanded in FY14 New/Expanded in FY15
Source: Kaiser Family Foundation
Num
ber o
f Sta
tes
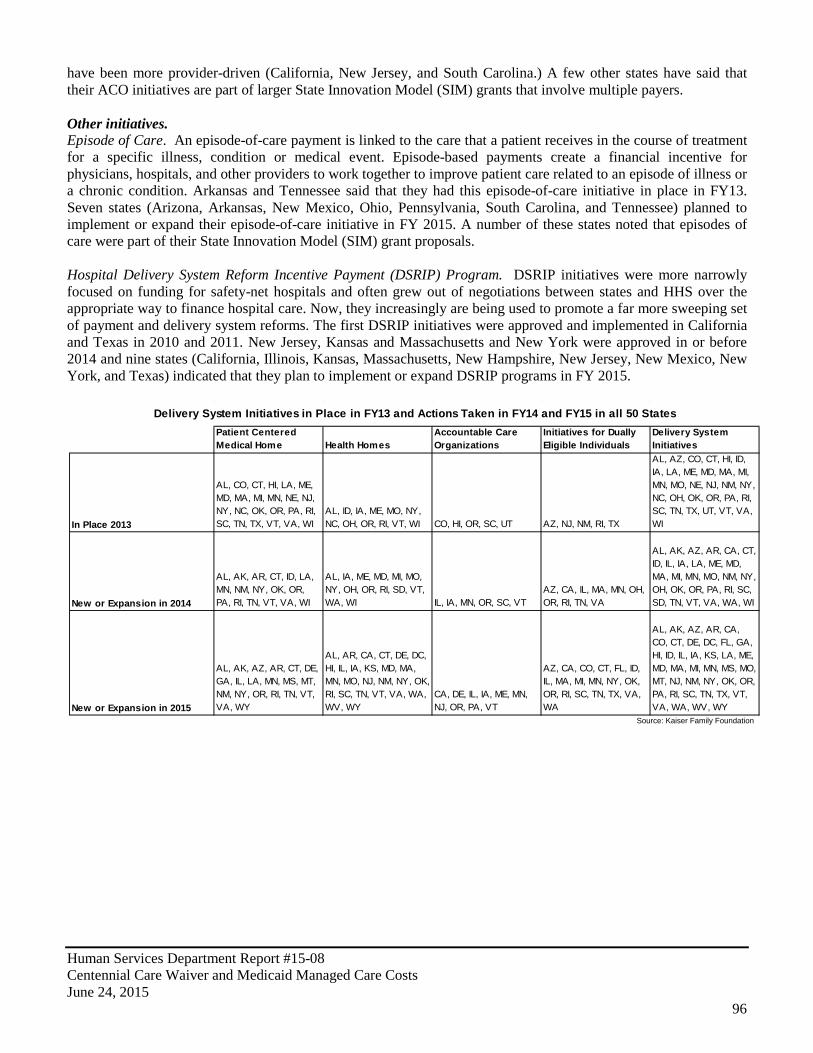
Human Services Department Report #15-08 Centennial Care Waiver and Medicaid Managed Care Costs June 24, 2015
96
have been more provider-driven (California, New Jersey, and South Carolina.) A few other states have said that their ACO initiatives are part of larger State Innovation Model (SIM) grants that involve multiple payers. Other initiatives. Episode of Care. An episode-of-care payment is linked to the care that a patient receives in the course of treatment for a specific illness, condition or medical event. Episode-based payments create a financial incentive for physicians, hospitals, and other providers to work together to improve patient care related to an episode of illness or a chronic condition. Arkansas and Tennessee said that they had this episode-of-care initiative in place in FY13. Seven states (Arizona, Arkansas, New Mexico, Ohio, Pennsylvania, South Carolina, and Tennessee) planned to implement or expand their episode-of-care initiative in FY 2015. A number of these states noted that episodes of care were part of their State Innovation Model (SIM) grant proposals. Hospital Delivery System Reform Incentive Payment (DSRIP) Program. DSRIP initiatives were more narrowly focused on funding for safety-net hospitals and often grew out of negotiations between states and HHS over the appropriate way to finance hospital care. Now, they increasingly are being used to promote a far more sweeping set of payment and delivery system reforms. The first DSRIP initiatives were approved and implemented in California and Texas in 2010 and 2011. New Jersey, Kansas and Massachusetts and New York were approved in or before 2014 and nine states (California, Illinois, Kansas, Massachusetts, New Hampshire, New Jersey, New Mexico, New York, and Texas) indicated that they plan to implement or expand DSRIP programs in FY 2015.
Patient Centered Medical Home Health Homes
Accountable Care Organizations
Initiatives for Dually Eligible Individuals
Delivery System Initiatives
In Place 2013
AL, CO, CT, HI, LA, ME, MD, MA, MI, MN, NE, NJ, NY, NC, OK, OR, PA, RI, SC, TN, TX, VT, VA, WI
AL, ID, IA, ME, MO, NY, NC, OH, OR, RI, VT, WI CO, HI, OR, SC, UT AZ, NJ, NM, RI, TX
AL, AZ, CO, CT, HI, ID, IA, LA, ME, MD, MA, MI, MN, MO, NE, NJ, NM, NY, NC, OH, OK, OR, PA, RI, SC, TN, TX, UT, VT, VA, WI
New or Expansion in 2014
AL, AK, AR, CT, ID, LA, MN, NM, NY, OK, OR, PA, RI, TN, VT, VA, WI
AL, IA, ME, MD, MI, MO, NY, OH, OR, RI, SD, VT, WA, WI IL, IA, MN, OR, SC, VT
AZ, CA, IL, MA, MN, OH, OR, RI, TN, VA
AL, AK, AZ, AR, CA, CT, ID, IL, IA, LA, ME, MD, MA, MI, MN, MO, NM, NY, OH, OK, OR, PA, RI, SC, SD, TN, VT, VA, WA, WI
New or Expansion in 2015
AL, AK, AZ, AR, CT, DE, GA, IL, LA, MN, MS, MT, NM, NY, OR, RI, TN, VT, VA, WY
AL, AR, CA, CT, DE, DC, HI, IL, IA, KS, MD, MA, MN, MO, NJ, NM, NY, OK, RI, SC, TN, VT, VA, WA, WV, WY
CA, DE, IL, IA, ME, MN, NJ, OR, PA, VT
AZ, CA, CO, CT, FL, ID, IL, MA, MI, MN, NY, OK, OR, RI, SC, TN, TX, VA, WA
AL, AK, AZ, AR, CA, CO, CT, DE, DC, FL, GA, HI, ID, IL, IA, KS, LA, ME, MD, MA, MI, MN, MS, MO, MT, NJ, NM, NY, OK, OR, PA, RI, SC, TN, TX, VT, VA, WA, WV, WY
Source: Kaiser Family Foundation
Delivery System Initiatives in Place in FY13 and Actions Taken in FY14 and FY15 in all 50 States
Human Services Department Report #15-08 Centennial Care Waiver and Medicaid Managed Care Costs June 24, 2015
97
APPENDIX D: HEALTH CARE INNOVATION AWARDS IMPACTING NEW MEXICO
BEN ARCHER HEALTH CENTER Geographic Reach: New Mexico Project Title: “A home visitation program for rural populations in Northern Dona Ana County, New Mexico” Funding Amount: $1,270,845 Estimated 3-Year Savings: $6,325,888 Summary: Ben Archer Health Center in southern New Mexico has implemented an innovative home visitation program for individuals diagnosed with chronic disease, persons at risk of developing diabetes, vulnerable seniors, and homebound individuals, as well as young children and hard to reach county residents. Ben Archer Health Center provides primary health, dental, and behavioral health care to rural Doña Ana County, a medically underserved and health professional shortage area. The Ben Archer Health Center's Health Care Innovation Award uses nurse health educators and community health workers to bridge the gap between patients and medical providers, aid patient navigation of the health care system, and offer services including case management, medication management, chronic disease management, preventive care, home safety assessments, and health education, thereby preventing the onset and progression of diseases and reducing complications. Project staff provides diabetes and asthma management classes for patients and families. The project implements a culturally-appropriate, immunization methodology utilizing door-to-door outreach campaigns. The staff connects individuals with primary care homes to decrease the cost of complications caused by disease in the predominately Hispanic population. FEINSTEIN INSTITUTE FOR MEDICAL RESEARCH Project Title: “Using care managers and technology to improve the care of patients with schizophrenia” Geographic Reach: Florida, Indiana, Michigan, Missouri, New Hampshire, New Mexico, New York, Oregon Funding Amount: $9,380,855 Estimated 3-Year Savings: $10,080,000 Summary: The Feinstein Institute for Medical Research received an award to develop a workforce that is capable of delivering effective treatments, using newly available technologies, to at-risk, high-cost patients with schizophrenia. The intervention will test the use of care managers, physicians, and nurse practitioners trained to use new technology as part of the treatment regime for patients recently discharged from the hospital at community treatment centers in eight states. These trained providers will educate patients and their caregivers about pharmacologic management, cognitive behavior therapy, and web-based/home-based monitoring tools for their conditions. This intervention is expected to improve patients’ quality of life and lower cost by reducing hospitalizations. Over a three-year period, the Feinstein Institute for Medical Research will retrain nurse practitioners, physician assistants, physicians, and case managers to use newly available mental health protocols and health technology resources. INNOVATIVE ONCOLOGY BUSINESS SOLUTIONS, INC. Project Title: “Community oncology medical homes (COME HOME)” Geographic Reach: Florida, Georgia, Maine, New Mexico, Ohio, Texas Funding Amount: $19,757,338 Estimated 3-Year Savings: $33,514,877 Summary: Innovative Oncology Business Solutions, Inc., representing 7 community oncology practices across the United States received an award to implement and test a medical home model of care delivery for newly diagnosed or relapsed Medicare and Medicaid beneficiaries and commercially insured patients with one of the following seven cancer types: breast, lung, colon, pancreas, thyroid, melanoma and lymphoma. Cancer care is complicated,
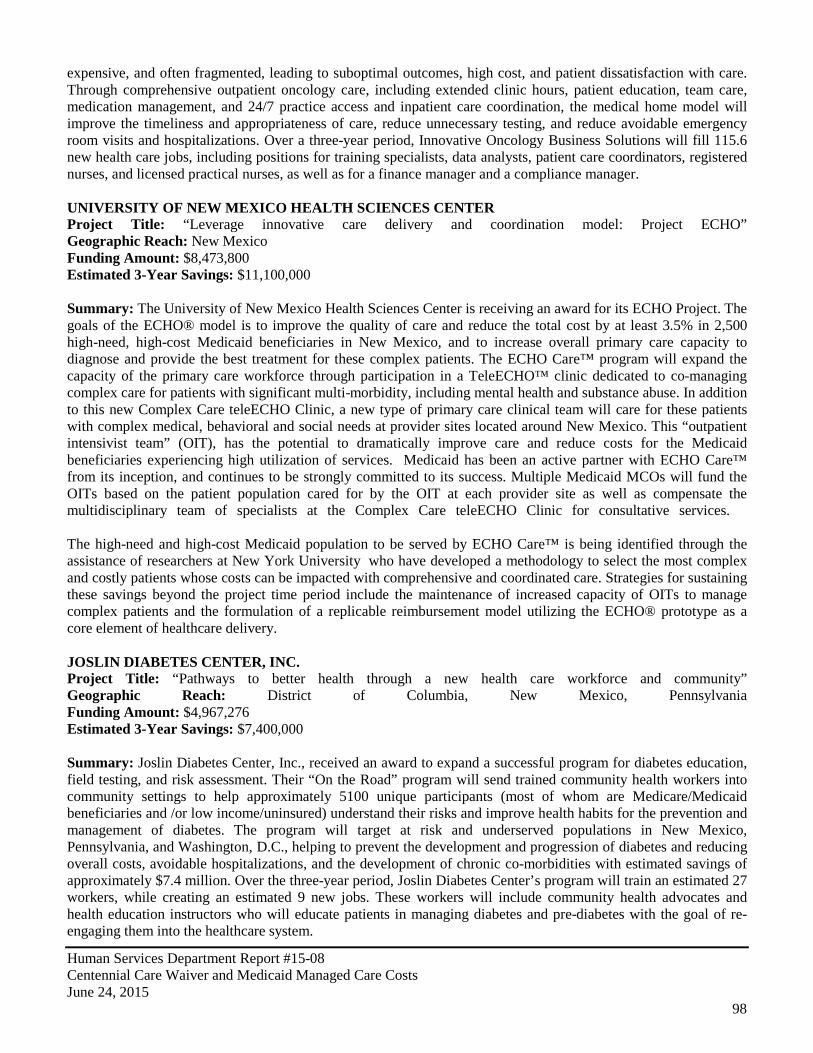
Human Services Department Report #15-08 Centennial Care Waiver and Medicaid Managed Care Costs June 24, 2015
98
expensive, and often fragmented, leading to suboptimal outcomes, high cost, and patient dissatisfaction with care. Through comprehensive outpatient oncology care, including extended clinic hours, patient education, team care, medication management, and 24/7 practice access and inpatient care coordination, the medical home model will improve the timeliness and appropriateness of care, reduce unnecessary testing, and reduce avoidable emergency room visits and hospitalizations. Over a three-year period, Innovative Oncology Business Solutions will fill 115.6 new health care jobs, including positions for training specialists, data analysts, patient care coordinators, registered nurses, and licensed practical nurses, as well as for a finance manager and a compliance manager. UNIVERSITY OF NEW MEXICO HEALTH SCIENCES CENTER Project Title: “Leverage innovative care delivery and coordination model: Project ECHO” Geographic Reach: New Mexico Funding Amount: $8,473,800 Estimated 3-Year Savings: $11,100,000 Summary: The University of New Mexico Health Sciences Center is receiving an award for its ECHO Project. The goals of the ECHO® model is to improve the quality of care and reduce the total cost by at least 3.5% in 2,500 high-need, high-cost Medicaid beneficiaries in New Mexico, and to increase overall primary care capacity to diagnose and provide the best treatment for these complex patients. The ECHO Care™ program will expand the capacity of the primary care workforce through participation in a TeleECHO™ clinic dedicated to co-managing complex care for patients with significant multi-morbidity, including mental health and substance abuse. In addition to this new Complex Care teleECHO Clinic, a new type of primary care clinical team will care for these patients with complex medical, behavioral and social needs at provider sites located around New Mexico. This “outpatient intensivist team” (OIT), has the potential to dramatically improve care and reduce costs for the Medicaid beneficiaries experiencing high utilization of services. Medicaid has been an active partner with ECHO Care™ from its inception, and continues to be strongly committed to its success. Multiple Medicaid MCOs will fund the OITs based on the patient population cared for by the OIT at each provider site as well as compensate the multidisciplinary team of specialists at the Complex Care teleECHO Clinic for consultative services. The high-need and high-cost Medicaid population to be served by ECHO Care™ is being identified through the assistance of researchers at New York University who have developed a methodology to select the most complex and costly patients whose costs can be impacted with comprehensive and coordinated care. Strategies for sustaining these savings beyond the project time period include the maintenance of increased capacity of OITs to manage complex patients and the formulation of a replicable reimbursement model utilizing the ECHO® prototype as a core element of healthcare delivery. JOSLIN DIABETES CENTER, INC. Project Title: “Pathways to better health through a new health care workforce and community” Geographic Reach: District of Columbia, New Mexico, Pennsylvania Funding Amount: $4,967,276 Estimated 3-Year Savings: $7,400,000 Summary: Joslin Diabetes Center, Inc., received an award to expand a successful program for diabetes education, field testing, and risk assessment. Their “On the Road” program will send trained community health workers into community settings to help approximately 5100 unique participants (most of whom are Medicare/Medicaid beneficiaries and /or low income/uninsured) understand their risks and improve health habits for the prevention and management of diabetes. The program will target at risk and underserved populations in New Mexico, Pennsylvania, and Washington, D.C., helping to prevent the development and progression of diabetes and reducing overall costs, avoidable hospitalizations, and the development of chronic co-morbidities with estimated savings of approximately $7.4 million. Over the three-year period, Joslin Diabetes Center’s program will train an estimated 27 workers, while creating an estimated 9 new jobs. These workers will include community health advocates and health education instructors who will educate patients in managing diabetes and pre-diabetes with the goal of re-engaging them into the healthcare system.

Human Services Department Report #15-08 Centennial Care Waiver and Medicaid Managed Care Costs June 24, 2015
99
Round Two: UNIVERSITY OF NEW MEXICO HEALTH SCIENCE CENTER Project Title: "Access to Critical Cerebral Emergency Support Services (ACCESS)" Geographic Reach: New Mexico Estimated Funding Amount: $15,120,767 Summary: The University of New Mexico Health Science Center project will test expansion of the existing tele-health infrastructure (11 hospitals) to form a statewide 30 hospital telehealth system (THS). In conjunction with Net Medical Xpress Solutions, the model test will provide remote emergency neurological consultation using inexpensive audiovisual equipment and software. The goal of this model is to prevent unnecessary transport to tertiary care hospitals when non-operative care is appropriate. The Implementation of THS aims to improve the access to emergency neurological care statewide. Around the clock triage by on call ACCESS staff will allow rural emergency departments to improve timeliness of emergency care, decrease avoidable inpatient admissions, and prevent unnecessary transfers.
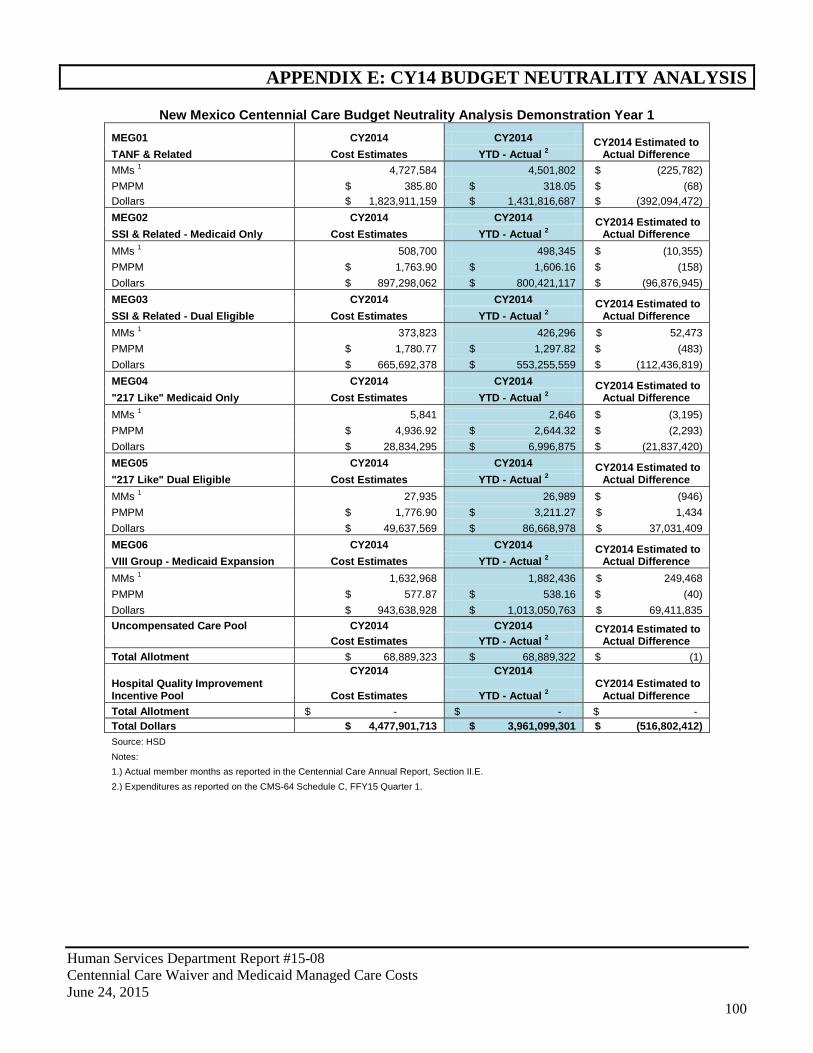
Human Services Department Report #15-08 Centennial Care Waiver and Medicaid Managed Care Costs June 24, 2015
100
APPENDIX E: CY14 BUDGET NEUTRALITY ANALYSIS
New Mexico Centennial Care Budget Neutrality Analysis Demonstration Year 1 MEG01 CY2014 CY2014 CY2014 Estimated to
Actual Difference TANF & Related Cost Estimates YTD - Actual 2 MMs 1 4,727,584 4,501,802 $ (225,782) PMPM $ 385.80 $ 318.05 $ (68) Dollars $ 1,823,911,159 $ 1,431,816,687 $ (392,094,472) MEG02 CY2014 CY2014 CY2014 Estimated to
Actual Difference SSI & Related - Medicaid Only Cost Estimates YTD - Actual 2 MMs 1 508,700 498,345 $ (10,355) PMPM $ 1,763.90 $ 1,606.16 $ (158) Dollars $ 897,298,062 $ 800,421,117 $ (96,876,945) MEG03 CY2014 CY2014 CY2014 Estimated to
Actual Difference SSI & Related - Dual Eligible Cost Estimates YTD - Actual 2 MMs 1 373,823 426,296 $ 52,473 PMPM $ 1,780.77 $ 1,297.82 $ (483) Dollars $ 665,692,378 $ 553,255,559 $ (112,436,819) MEG04 CY2014 CY2014 CY2014 Estimated to
Actual Difference "217 Like" Medicaid Only Cost Estimates YTD - Actual 2 MMs 1 5,841 2,646 $ (3,195) PMPM $ 4,936.92 $ 2,644.32 $ (2,293) Dollars $ 28,834,295 $ 6,996,875 $ (21,837,420) MEG05 CY2014 CY2014 CY2014 Estimated to
Actual Difference "217 Like" Dual Eligible Cost Estimates YTD - Actual 2 MMs 1 27,935 26,989 $ (946) PMPM $ 1,776.90 $ 3,211.27 $ 1,434 Dollars $ 49,637,569 $ 86,668,978 $ 37,031,409 MEG06 CY2014 CY2014 CY2014 Estimated to
Actual Difference VIII Group - Medicaid Expansion Cost Estimates YTD - Actual 2 MMs 1 1,632,968 1,882,436 $ 249,468 PMPM $ 577.87 $ 538.16 $ (40) Dollars $ 943,638,928 $ 1,013,050,763 $ 69,411,835 Uncompensated Care Pool CY2014 CY2014 CY2014 Estimated to
Actual Difference Cost Estimates YTD - Actual 2 Total Allotment $ 68,889,323 $ 68,889,322 $ (1)
CY2014 CY2014
CY2014 Estimated to Actual Difference
Hospital Quality Improvement Incentive Pool Cost Estimates YTD - Actual 2 Total Allotment $ - $ - $ - Total Dollars $ 4,477,901,713 $ 3,961,099,301 $ (516,802,412) Source: HSD
Notes: 1.) Actual member months as reported in the Centennial Care Annual Report, Section II.E.
2.) Expenditures as reported on the CMS-64 Schedule C, FFY15 Quarter 1.

Human Services Department Report #15-08 Centennial Care Waiver and Medicaid Managed Care Costs June 24, 2015
101
APPENDIX F: HUMAN SERVICES DEPARTMENT PERFORMANCE REPORT CARD Q3 FY15
Performance Overview: New Mexico showed poor performance in percent of first trimester prenatal care visits for both FY14 and in early results for FY15. Third quarter results for diabetes care, while low, showed improvement over the same period in 2014. (However, the National Committee for Quality Assurance recently reported performance declines nationally for comprehensive diabetes care and prenatal and postpartum care.) Well-child visits, particularly for infants, have also lagged behind targets. On a positive note, hospital readmissions and emergency room visits remain low. Current-year Healthcare Effectiveness Data and Information Set (HEDIS) measures rely on encounter data and managed care organizations have up to 120 days to report this information; consequently, performance results typically improve over time. It should be noted that despite disappointing performance in certain areas, New Mexico typically performs above national averages. Audited HEDIS information for calendar year 2014 (first full year of Centennial Care and Medicaid expansion) should be available July 2015. Medical Assistance Program
Budget:
$4,342,815.4
FTE: 191.5
FY13 Actual
FY14 Actual
FY15 Target Q1 Q2 Q3 Rating
1
Percent of infants in Medicaid managed care who had six or more well-child visits with a primary care physician during the first fifteen months (cumulative)
63% 52% 72% 51% 50% 48%
2
Percent of children and youth in Medicaid managed care who had one or more well-child visits with a primary care physician during the measurement year (cumulative)
92% 83% 92% 36% 52% 64%
3
Percent of children ages two to twenty-one enrolled in Medicaid managed care who had at least one dental visit during the measurement year (cumulative)
65% 62% 72% 25% 45% 54%
4 Percent of children in managed care with persistent asthma who were appropriately prescribed medication
92% 68% 94% 78% 81% 78%
5 Percent hospital readmissions for children ages two to seventeen within thirty days of discharge 8% 7% 10% 8% 7% 6%
6 Percent hospital readmissions for adults eighteen and over, within thirty days of discharge 13% 11% 10% 11% 11% 10%
7 Number of emergency room visits per one thousand Medicaid member months 39 35 50 46 43 41
8
Percent of individuals in Medicaid managed care ages eighteen through seventy-five with diabetes (type 1 or type 2) who had a HbA1c test during the measurement year
84% 50% 86% 39% 52% 60%
9
Percent of newborns with Medicaid coverage whose mothers received a prenatal care visit in the first trimester or within 42 days of enrollment in the managed care organization
85% 19% 85% 14% 15% 16%
Program Rating Comments: Well-child visits for infants continue to lag; these visits are critical for early screening and can help lessen the risk of serious and long-term health effects. However, hospital readmissions and emergency room visits remain low; according to the Robert Wood Johnson Foundation, many readmissions can be avoided and reflect the quality of inpatient care, discharge planning and care coordination, and the availability and effectiveness of local primary care. For the first two quarters, the department could not report on percent of newborns whose mothers received a prenatal care visit in the first trimester because an eligible pregnancy would have taken place before the implementation of Centennial Care. Lagging third quarter results may continue to reflect this timing issue.
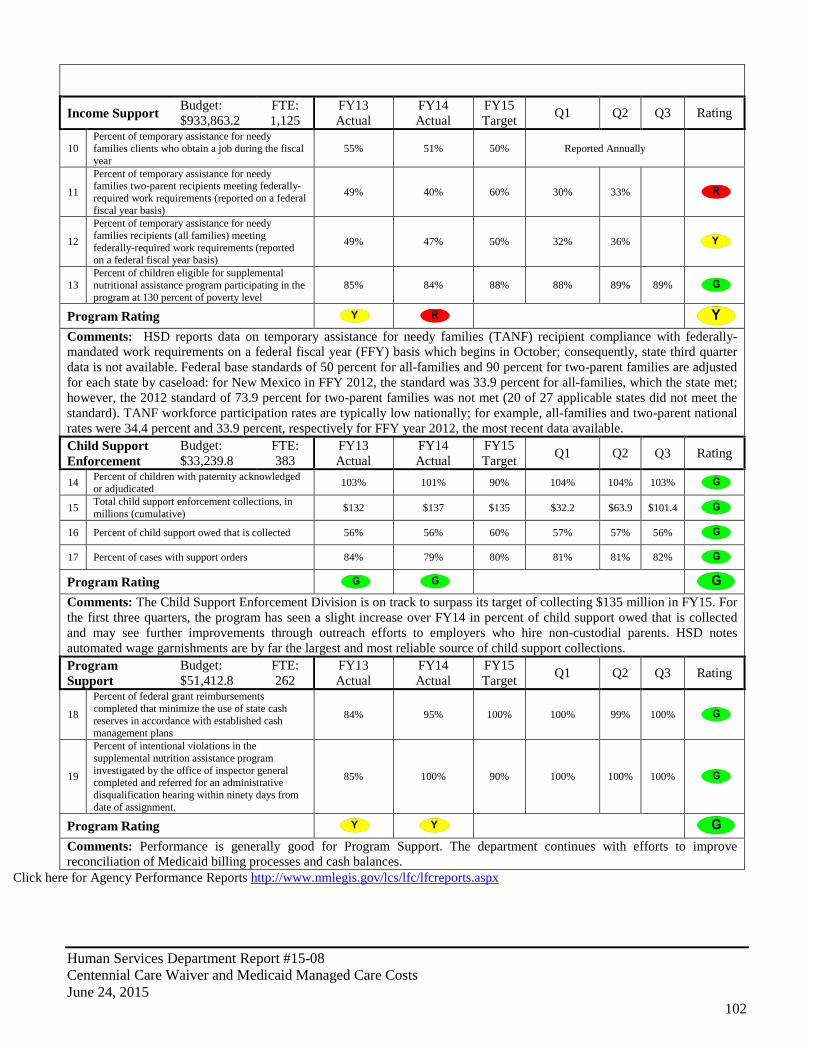
Human Services Department Report #15-08 Centennial Care Waiver and Medicaid Managed Care Costs June 24, 2015
102
Income Support Budget: $933,863.2
FTE: 1,125
FY13 Actual
FY14 Actual
FY15 Target Q1 Q2 Q3 Rating
10 Percent of temporary assistance for needy families clients who obtain a job during the fiscal year
55% 51% 50% Reported Annually
11
Percent of temporary assistance for needy families two-parent recipients meeting federally-required work requirements (reported on a federal fiscal year basis)
49% 40% 60% 30% 33%
12
Percent of temporary assistance for needy families recipients (all families) meeting federally-required work requirements (reported on a federal fiscal year basis)
49% 47% 50% 32% 36%
13 Percent of children eligible for supplemental nutritional assistance program participating in the program at 130 percent of poverty level
85% 84% 88% 88% 89% 89%
Program Rating Comments: HSD reports data on temporary assistance for needy families (TANF) recipient compliance with federally-mandated work requirements on a federal fiscal year (FFY) basis which begins in October; consequently, state third quarter data is not available. Federal base standards of 50 percent for all-families and 90 percent for two-parent families are adjusted for each state by caseload: for New Mexico in FFY 2012, the standard was 33.9 percent for all-families, which the state met; however, the 2012 standard of 73.9 percent for two-parent families was not met (20 of 27 applicable states did not meet the standard). TANF workforce participation rates are typically low nationally; for example, all-families and two-parent national rates were 34.4 percent and 33.9 percent, respectively for FFY year 2012, the most recent data available. Child Support Enforcement
Budget: $33,239.8
FTE: 383
FY13 Actual
FY14 Actual
FY15 Target Q1 Q2 Q3 Rating
14 Percent of children with paternity acknowledged or adjudicated 103% 101% 90% 104% 104% 103%
15 Total child support enforcement collections, in millions (cumulative) $132 $137 $135 $32.2 $63.9 $101.4
16 Percent of child support owed that is collected 56% 56% 60% 57% 57% 56% 17 Percent of cases with support orders 84% 79% 80% 81% 81% 82% Program Rating Comments: The Child Support Enforcement Division is on track to surpass its target of collecting $135 million in FY15. For the first three quarters, the program has seen a slight increase over FY14 in percent of child support owed that is collected and may see further improvements through outreach efforts to employers who hire non-custodial parents. HSD notes automated wage garnishments are by far the largest and most reliable source of child support collections. Program Support
Budget: $51,412.8
FTE: 262
FY13 Actual
FY14 Actual
FY15 Target Q1 Q2 Q3 Rating
18
Percent of federal grant reimbursements completed that minimize the use of state cash reserves in accordance with established cash management plans
84% 95% 100% 100% 99% 100%
19
Percent of intentional violations in the supplemental nutrition assistance program investigated by the office of inspector general completed and referred for an administrative disqualification hearing within ninety days from date of assignment.
85% 100% 90% 100% 100% 100%
Program Rating Comments: Performance is generally good for Program Support. The department continues with efforts to improve reconciliation of Medicaid billing processes and cash balances.
Click here for Agency Performance Reports http://www.nmlegis.gov/lcs/lfc/lfcreports.aspx
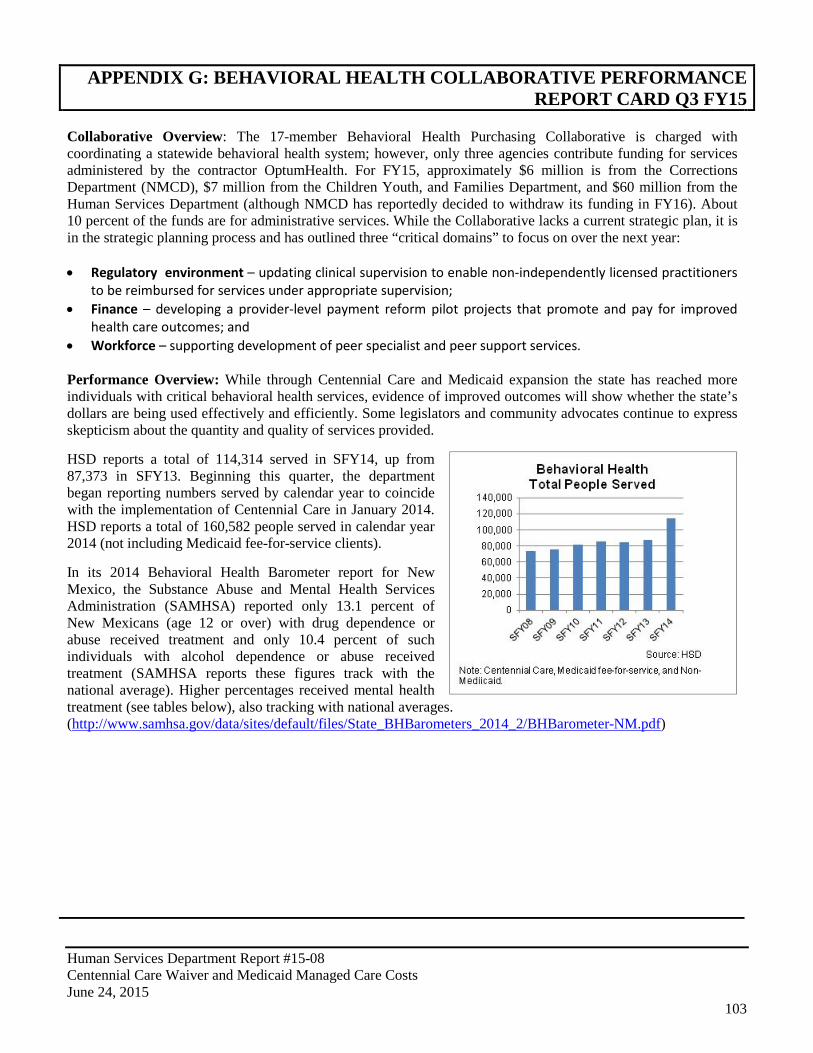
Human Services Department Report #15-08 Centennial Care Waiver and Medicaid Managed Care Costs June 24, 2015
103
APPENDIX G: BEHAVIORAL HEALTH COLLABORATIVE PERFORMANCE REPORT CARD Q3 FY15
Collaborative Overview: The 17-member Behavioral Health Purchasing Collaborative is charged with coordinating a statewide behavioral health system; however, only three agencies contribute funding for services administered by the contractor OptumHealth. For FY15, approximately $6 million is from the Corrections Department (NMCD), $7 million from the Children Youth, and Families Department, and $60 million from the Human Services Department (although NMCD has reportedly decided to withdraw its funding in FY16). About 10 percent of the funds are for administrative services. While the Collaborative lacks a current strategic plan, it is in the strategic planning process and has outlined three “critical domains” to focus on over the next year: • Regulatory environment – updating clinical supervision to enable non-independently licensed practitioners
to be reimbursed for services under appropriate supervision; • Finance – developing a provider-level payment reform pilot projects that promote and pay for improved
health care outcomes; and • Workforce – supporting development of peer specialist and peer support services. Performance Overview: While through Centennial Care and Medicaid expansion the state has reached more individuals with critical behavioral health services, evidence of improved outcomes will show whether the state’s dollars are being used effectively and efficiently. Some legislators and community advocates continue to express skepticism about the quantity and quality of services provided. HSD reports a total of 114,314 served in SFY14, up from 87,373 in SFY13. Beginning this quarter, the department began reporting numbers served by calendar year to coincide with the implementation of Centennial Care in January 2014. HSD reports a total of 160,582 people served in calendar year 2014 (not including Medicaid fee-for-service clients). In its 2014 Behavioral Health Barometer report for New Mexico, the Substance Abuse and Mental Health Services Administration (SAMHSA) reported only 13.1 percent of New Mexicans (age 12 or over) with drug dependence or abuse received treatment and only 10.4 percent of such individuals with alcohol dependence or abuse received treatment (SAMHSA reports these figures track with the national average). Higher percentages received mental health treatment (see tables below), also tracking with national averages. (http://www.samhsa.gov/data/sites/default/files/State_BHBarometers_2014_2/BHBarometer-NM.pdf)

Human Services Department Report #15-08 Centennial Care Waiver and Medicaid Managed Care Costs June 24, 2015
104
However, performance measures indicating the percentage of individuals receiving follow up services after discharge from inpatient facilities show critical after care services need to be improved. Further, while SAMHSA reports many other New Mexico measures are similar to national averages (such as past-year serious mental illness among adults), New Mexico ranks higher for past-month illicit drug use among adolescents (12.4 percent in New Mexico versus 9.2 percent nationally). Indeed, the New Mexico Department of Health reports the state consistently has among the highest drug overdose rates, suicide rates, and alcohol-related death rates in the nation. To help address these problems, HSD recently launched a statewide prevention campaign, A Dose of Reality, to positively impact the inappropriate use of prescription drugs by adolescents.
Program Budget: N/A
FTE: N/A
SFY13 Actual
SFY14 Actual
SFY15 Target Q1 Q2 Q3 Rating
1 Percent of readmissions to the same level of care or higher for children or youth discharged from behavioral health residential treatment centers and inpatient care
3% 4% 8% 9% 4% 8%
2 Percent of people with a diagnosis of alcohol or drug dependency who initiated treatment and received two or more additional services within 30 days of the initial visit*
New Measure
New Measure 25% Semi-
Annual 39% Semi-Annual
3 Percent of individuals discharged from inpatient facilities who receive follow-up services at seven days 38% 26% 45% 31% 25% 29%
4 Percent of individuals discharged from inpatient facilities who receive follow-up services at 30 days* 52% 52% 65% 48% 41% 47%
5 Percent of youth on probation served by the statewide entity 57% 59% 54% Annual
6 Number of youth suicides among fifteen to nineteen year olds served by the statewide entity* 4 0 2 0 2 0
Program Rating Comments: Measure 1 does not include Medicaid fee-for-service or non-Medicaid clients; for the third quarter, 411 youth were discharged from residential and inpatient facilities, a 7 percent increase over the second quarter. HSD notes measure 2 results for the second quarter indicate a high proportion of engagement for the substance abuse field. The measure 2 result is for non-Medicaid clients only; however, HSD expects to include Medicaid managed care and fee-for-service data in FY16. HSD reports for measures 3 and 4, the Behavioral Health Services Division and managed care organizations have launched a Performance Improvement Project (PIP) that includes creating “bridges” between inpatient and outpatient care, including helping individuals keep follow-up appointments and improve medication adherence after discharge. Finally, with the launch of Centennial Care in January 2014, the state no longer has one “statewide entity” providing behavioral health services; consequently, measures 5 and 6 will be reworded for FY16.
* Denotes House Bill 2 measure
Human Services Department Report #15-08 Centennial Care Waiver and Medicaid Managed Care Costs June 24, 2015
105
Behavioral Health Provider Audit: HSD has been working with community leaders to rebuild capacity in affected areas following the closure and replacement of 12 New Mexico behavioral health providers in 2013. According to the Attorney General’s Office, four of the 15 New Mexico behavioral health provider audits have been completed. Of the remaining eleven, the AGO is investigating four. For FY16, the AGO received a $1.8 million special appropriation in support for the investigations; the AGO reports an RFP is in process with a target issuance date in June. The AGO expects the contractor will work on the seven pending investigations and any remaining portion of the four not completed. All investigations should be completed within eight months of contract award. Finally, in June 2015 the AGO reported his office filed Medicaid fraud charges against four employees of another provider for allegedly falsifying documents, knowingly conspiring to commit fraud and stealing more than $20 thousand from non-Medicaid funds.

Human Services Department Report #15-08 Centennial Care Waiver and Medicaid Managed Care Costs June 24, 2015
106
APPENDIX H: HSD OVERSIGHT ON ACCESS TO CARE
HSD’s annual Centennial Care report cites measures that are required to be in place to ensure that their enrollees have access to care. HSD has identified that MCO’s have to meet a specific primary care physician-to-member ration. That ratio as laid out in the contract is 1:2000. This measure is in place to assure that there are enough primary care physicians to adequately serve all their enrollees and ensure they have access to care. Another safeguard that is in place is geographic access. It encompasses access to hospitals, primary care physicians, pharmacies, dentists, and most specialty providers. This measure is put in place to ensure that each enrollee has access to all of these services across urban, rural, and frontier counties. The MCO’s are also conducting provider satisfaction survey reports. The surveys focus on retention of provider satisfaction and could result in efforts to recruit and contract new providers if necessary. Another area that MCO’s have to ensure access to care is through telemedicine. The MCO are required to submit a report that describes its progress in improving access and availability of physical, Long-Term Care, and Behavioral Health services to Members residing in Rural, Frontier, and Tribal areas through the use of Telehealth technology. This is a way that the MCO’s can provide comprehensive clinical care for patients living in remote access community. This report will include: telehealth member demographics and telehealth services received, number of unduplicated Members utilizing telehealth services, name and location of contracted telehealth distant sites (remote provider). HSD is also able to see and address any members concerns through the MCO grievance and appeals report. Another measure that will give HSD the ability to further evaluate member experiences related to access is through the Consumer Assessment of Healthcare Providers and Systems (CAHPS). HSD has access standard in place that address pharmacy, long-term care, transportation and behavioral health services for urban, rural, and frontier areas. Measure Description Performance Primary Care Provider-to-member ratio
The PCP-to-member ratio is calculated by dividing the total number of non-dual members by the total numbers of PCP's. Dual-eligible members are excluded from the equation because they have a PCP through Medicare. The contractual required ratio for the MCOs is 1:2000. The MCO must ensure that members have adequate access to specialty providers.
All MCOs far exceeded the PCP-to-member contractually required ratio of 1:2000. The ratios ranged from 1:15 to 1:102 in December 2014. There were no identified PCP ratio concerns in 2014.
Geographic Access To ensure access to hospitals, primary care physicians, pharmacies, dentists and most specialty providers in the urban, rural and frontier counties.
Geographic access as met in the urban, rural and frontier counties. MHNM did not meet the geographic standards for FQHCs in rural areas, specifically Lea and San Juan counties. Due to the majority of members living greater than 60 miles from the facilities
Provider Satisfaction Survey Reports
Encompasses long-term, behavioral and physical health providers. The report shall include but not be limited to, a summary of the provider survey methods and findings for physical health, behavioral health, and long-term care providers separately and an analysis of opportunities for improvement. The MCO must conduct the survey at least once a year that covers Contract Providers and follows NCQA guidelines to the extent applicable. Through primarily telephone surveys, 1,485 adults and 1,085 parents/caregivers of children receiving services were telephoned and asked about their satisfaction with their care in seven areas.
There are areas that need improvement, but New Mexico meets or exceeds the US Average in all areas. The two categories that New Mexico scored the lowest in was improved functioning and outcomes.

Human Services Department Report #15-08 Centennial Care Waiver and Medicaid Managed Care Costs June 24, 2015
107
Telemedicine Used to address specialty services and sub-specialty services to ensure they are available state wide. The MCOs must submit a report that describes its progress in improving access and availability of physical, Long-Term Care, and Behavioral Health services to Members residing in Rural, Frontier, and Tribal areas through the use of Telehealth technology. This is a way that the MCO’s can provide comprehensive clinical care for patients living in remote access community.
Preliminary results indicate that all MCOs will meet the targets for telemedicine components. Those components are: A minimum of 15 percent increase in telehealth “office” visits with specialists, including BH specialists, for members in rural and frontier areas.
Grievance and Appeals Report
The MCO shall submit reports of all provider and Member Grievances (informal and formal), Appeals, and Fair Hearings utilizing the State-provided reporting templates and codes. Within five (5) Business Days of receipt of the Grievance, the CONTRACTOR shall provide the grievant with written notice that the Grievance has been received and the expected date' Of its resolution.
A total of 2,668 grievances were filed by all Centennial Care members in the first waiver year. MCOs reported a combined total of 1,693 grievances within the top three types of grievances: Ground transportation non-emergency, Primary Care Physician and Other Specialists. A total of 1,764 appeals were filed by Centennial Care members in the first waiver year. Of the total appeals filed, 1,101 (62 percent) were upheld, 430 (24 percent) were overturned and the remainder, 233 (14 percent) were still pending resolution at the end of the year. Denial or limited authorization of a requested service was 1,552 (88 percent) of all appeals.
Consumer Assessment of Healthcare Providers and Systems (CAHPS)
The CAHPS survey shall provide a statistically valid sample of CONTRACTOR's Members who must have at least six (6) months of continuous enrollment, including Members who have requested to change their PCPs.
No performance data yet. Will be given to HSD in June 2015
Pharmacy Ensure access to pharmacy networks for urban, rural, and frontier areas. Expansive pharmacy network including many 24-hour access pharmacies.
MCOs reported that pharmacy costs are a key driver in the increased utilization of high-cost specialty pharmacy products. HSD estimates that cost per individual is just under $90,000.
Long-Term Care Always look to improve long term care to continue meeting the access standards for both delegated and direct personal care service agencies and nursing facilities.
All MCOs met the access standard for both delegated and directed personal care service (PCS) agencies and nursing facilities (NFs) in the fourth quarter. None of the MCOs met the established standard for assisted living facilities (ALFs) in rural areas.
Transportation Ensuring that members have access to non-emergency ground transportation. Must ensure that they are meeting the access standards in urban, rural, and frontier areas of the state. Network development efforts in the rural areas include a focused effort to identify potential transportation providers that are community-based and recruit them into the network.
BCBSNM and UHC both met the access standard for urban and rural areas in the fourth quarter. UHC did not meet the standard in frontier areas.

Human Services Department Report #15-08 Centennial Care Waiver and Medicaid Managed Care Costs June 24, 2015
108
APPENDIX I: APPROVED MCO PAYMENT REFORM PROJECTS
Health Plan Proposal
Type of Payment Reform
Project Description P4P or ACO-Like
Bundled Payments/ Episodes
Accountable Care - Closing Gaps in Care
X Performance-based model with partial payment paid as a bonus for achieving valued outcomes.
Behavioral Health – Value Based Contracting
X Targets reducing emergency room visits, hospital admissions, hospital readmissions and improving depression medication adherence.
Accountable Care Organization
X ACO model with shared savings for improving quality and reducing total cost of care.
Bundled Payments for Episodes
X Pursuing bundles for diabetes, bariatric, and maternity.
Emergency Room and Inpatient Reduction Incentives with Behavioral Health Focus
X Piloting with CSA to reduce ER and inpatient through intensive follow-up, use of peer specialists, crisis visits, and PCP coordination.
Three-tiered Reimbursement for PCMHs
X PMPM increases for base care coordination; data transfer to HIE; telehealth; use of EHRs; and performing HRAs. A total performance incentive per member payment is possible if the targets for every measure are met.
Bundled Payments for Targeted Inpatient Admission Episodes
X Working to bundle payments for pneumonia and colonoscopies.
Obstetrics Gain Sharing X Reducing unnecessary primary C-sections by developing savings targets that reward appropriate use of C-sections. Under this program, obstetricians can earn enhanced fees for meeting metrics related to reducing unwarranted C-sections.