Tanzania Dairy Development Forum: Second national dairy stakeholders' meeting, August 2013

USDA
Report to Congress
on the
National Dairy Promotion a n d Research Program
and the
National Fluid Milk Processor Promotion Program
.July 1, 2004
USDA
United States Department of Agriculture
Marketing and Regulatory Programs
Agricultural Marketing Service
1400Independence Ave. Washington, DC 20250
July 2004
To the Reader:
I am pleased to present the Department of Agriculture's (USDA) 2004 "Report to Congress on the National Dairy Promotion and Research Program and the National Fluid Milk Processor Promotion Program."
The Dairy Production Stabilization Act of 1983 authorized a national producer program for dairy product promotion, research, and nutrition education as a part of a comprehensive strategy to increase human consumption of milk and dairy products. The Dairy Promotion and Research Order became effective on May 1, 1984, and so began the era of national dairy promotion.
With the passage of the National Fluid Milk Promotion Act of 1990 and subsequent coordination of the fluid milk and dairy promotion programs, America's dairy farmers and milk processors now spend over $350 million annually to help drive demand for fluid milk and dairy products. USDA strongly supports national commodity research and promotion initiatives such as these, which provide industry with important self- help tools for the development, maintenance, and expansion of domestic and international markets for agricultural products.
The report is intended to provide accurate, detailed information on the two dairy promotion programs. Please send your comments and suggestions on how it can be modified to serve readers' needs more effectively to the address listed on the contact information page.
This year marks the 20 th anniversary of the National Dairy Promotion and Research Program. We look forward to the next 20 years of national dairy product and fluid milk promotion in ~e United States.
t //
A. J. "fates Administra or

Contact Information
To obtain additional copies of the 2004 Report to Congress on the National Dairy Promotion and Research Program and the National Fluid Milk Processor Promotion Program and the complete independent analysis of the programs, please contact:
Promotion and Research Branch Dairy Programs, Agricultural Marketing Service, USDA Stop 0233, Room 2958-South 1400 Independence Avenue, SW Washington, DC 20250-0233 (202) 72%6909 http://www.ams.usda.gov/dairy/dairyrp.htm
To obtain copies of the complete independent analysis report or for questions on Chapter 3, please contact:
Harry M. Kaiser, Ph.D. Cornell Commodity Promotion Research Program Department of Agricultural, Resource, and Managerial Economics Cornell University 349 Warren Hall Ithaca, NY 14853 (607) 255-1620 E-mail address: [email protected]
To obtain copies of or for questions on the Fluid Milk Market and Promotion Assessment by Beverage Marketing Corporation of New York, please contact:
Gary Hemphill 850 Third Avenue, 14 ~h Floor New York, NY 10022 (212) 688-7640
For additional information about the National Dairy Promotion and Research Board and Dairy Management Inc., please contact:
National Dairy Promotion and Research Board Dairy Management Inc. 10255 West Higgins Road, Suite 900 Rosemont, IL 60018-5616 (847) 803-2000 http://www.dairyinfo.com

For additional information about the National Fluid Milk Processor Promotion Board, please contact:
National Fluid Milk Processor Promotion Board 1250 H Street, NW, Suite 950 Washington, DC 20005 (202) 737-0153 http://www.whymilk.com
The U.S. Department of Agriculture (USDA) prohibits discrimination in all of its programs and activities on the basis of race, color, national origin, gender, religion, age, disability, political beliefs, sexual orientation, and marital or family status. (Not all prohibited bases apply to all programs.) Persons with disabilities who require alternative means for communication of program information (Braille, large print, audiotape, etc.) should contact the USDA's Target Center at (202) 720-2600 (voice and TDD).
To file a complaint of discrimination, write USDA Director, Office of Civil Rights, USDA, Room 326W, Whitten Building, 14 th and Independence Avenue, SW, Washington, DC 20250-9410 or call (202) 720-5964 (voice or TDD). USDA is an equal opportunity provider and employer.
Report printed on recycled paper®using vegetable-based i n k . ~ .
iii

Contents
Page
Acknowledgment ........................................................................................................................... i Contact Information ...................................................................................................................... ii
Executive Summary ....................................................................................................................... 1
Chapter 1: The Dairy Promotion Programs .................................................................................. 5
National Dairy Promotion and Research Board ............................................................................. 5 3-A-Day T M of Dairy for Stronger Bones .......................................................................................... 8
Cheese ............................................................................................................................................ 8 Communica t ions and Technology ............................................................................................... I0 Export and Dry Ingredients .......................................................................................................... 11 Research/National Dairy Council ® ............................................................................................... 14
15 Fluid Milk .................................................................................................................................... Qualif ied State or Regional Dairy Product Promotion, Research, or Nutrition Education
Programs .................................................................................................................................... 15 National Fluid Milk Processor Promotion Board ........................................................................ 18
Medical and Scientific Activities ................................................................................................. 19
National Fluid Milk Programs ..................................................................................................... 20 Sponsorships ................................................................................................................................ 20 Advert is ing ................................................................................................................................... 21
Promotions ................................................................................................................................... 22 Public Relations ........................................................................................................................... 22
Strategic Thinking ........................................................................................................................ 24 School Market ing ......................................................................................................................... 24 Other Research ............................................................................................................................. 25
Chapter 2: USDA Activities ....................................................................................................... 26
National Dairy Promotion and Research Board Oversight .......................................................... 26
Nominat ions and Appointments .................................................................................................. 26
Foreign Agricultural Service ........................................................................................................ 27
Contracts ...................................................................................................................................... 27
Contractor Audits ......................................................................................................................... 27 Collections ................................................................................................................................... 27 Compliance .................................................................................................................................. 27 Qualif ied Programs ...................................................................................................................... 28 Order Amendments ...................................................................................................................... 28
Litigation ...................................................................................................................................... 28
iv
Contents, continued
Chapter 2, cont inued
National Fluid Milk Processor Promot ion Board Oversight ........................................................ 29 Nominat ions and Appointments .................................................................................................. 29 Program Deve lopment ................................................................................................................. 29 Contractor Audits ......................................................................................................................... 29 Compl iance .................................................................................................................................. 30
Chapter 3: Impact of Generic Fluid Milk and Dairy Advert is ing and Promot ion on Dairy Markets: An Independent Analysis ................................................................................. 31
Highlights ..................................................................................................................................... 31 Section I: Analysis of Fluid Milk and Cheese Advert is ing ......................................................... 33 Factors Affect ing the Demand for Fluid Milk and Cheese .......................................................... 33 Price ............................................................................................................................................. 35 Income .......................................................................................................................................... 35 Age Demographics ....................................................................................................................... 36 Race/Ethnici ty Demographics ...................................................................................................... 37 Food Spending Behavior .............................................................................................................. 38 Advert is ing Effects ...................................................................................................................... 39 Factors Affect ing Generic Advert ising Effect iveness .................................................................. 41 Impact of the Dairy and Fluid Milk Advert is ing Programs ......................................................... 43 Benef i t -Cost of Advert is ing by the Dairy Program ...................................................................... 44 Section 1I: Analysis of All Demand-Enhanc ing Activities ......................................................... 46
Chapter 4: Fluid Milk Market and Promotion Assessment ........................................................ 51
Beverage Market ing Corporat ion 's Assessment of the Current Milk Industry Environment ...... 51 Consumer Attention ..................................................................................................................... 57 Product Attributes and Innovation ............................................................................................... 57 Branding ....................................................................................................................................... 58 Distr ibution .................................................................................................................................. 58 Pricing .......................................................................................................................................... 58 Beverage Market ing Corporat ion 's Assessment of Current Milk Market ing Programs .............. 59
Appendix A
National Dairy Promot ion and Research Board: Current and Past M e m b e r Listing .................. 63

Contents, continued
Appendix B
National Fluid Milk Processor Promotion Board: Current and Past Member Listing ................ 73
Appendix C
(C-I) Regions of the National Dairy Promotion and Research Board ......................................... 81 (C-2) Regions of the National Fluid Milk Processor Promotion Board ...................................... 82
Appendix D
(D-l) National Dairy Promotion and Research Board, Actual Income and Expenses, FY 2002-2003 ....................................................................................... 83
(D-2) USDA Oversight Costs for the National Dairy Promotion and Research Board, FY 2002-2003 ................................................................................................ 84
(D-3) National Dairy Promotion and Research Board, Approved Budgets, FY 2003-2004 ....... 85 (D-4) National Fluid Milk Processor Promotion Board, Actual
Income and Expenses, FY 2002-2003 ....................................................................................... 86 (D-5) USDA Oversight Costs for the National Fluid Milk Processor
Promotion Board, FY 2002-2003 .............................................................................................. 87 (D-6) National Fluid Milk Processor Promotion Board, Approved Budgets, FY 2003-2004 .... 88
Appendix E
(E-1) Independent Auditors ' Report - National Dairy Promotion and Research Board ............. 89 (E-2) Independent Auditors ' Report - National Fluid Milk Processor Promotion Board ......... 100
Appendix F
(F-1) National Dairy Promotion and Research Board and Dairy Management Inc. Contracts Reviewed by USDA, 2003 ...................................................................................... 121
(F-2) National Fluid Milk Processor Promotion Board and International Dairy Foods Association Contracts Reviewed by USDA, 2003 ......................... 126
Appendix G
(G-1) Nutrition and Health Research Institutes and Dairy Foods Research Centers, 2003 ....... 127 (G-2) Dairy Foods Competi t ive Research Activities, 2003 ....................................................... 129 (G-3) Nutrition Competi t ive Research Activities, 2003 ............................................................ 131
vi

Contents, continued
Appendix H
Qualified State or Regional Dairy Product Promotion, Research, or Nutrition Education Programs, 2003 ......................................................................................................... 134
vii
Executive Summary
The enabling legislation of both the producer and processor dairy promotion programs (7 U.S.C. 4514 and 7 U.S.C. 6407) requires the U.S. Department of Agriculture (USDA) to submit an annual report to the House Committee on Agriculture and the Senate Committee on Agriculture, Nutrition, and Forestry by July 1. The producer and processor programs are conducted under the Dairy Promotion and Research Order (Dairy Order) (7 CFR §1150) and the Fluid Milk Promotion Order (Fluid Milk Order) (7 CFR § 1160), respectively. This report includes a description of activities for both the producer and processor programs and summarizes activities of the national fluid milk programs. An accounting of funds collected and spent, an independent analysis of the effectiveness of the advertising campaigns of the two programs, and an industry- commissioned review of fluid milk markets and program operations are included. Additionally, this report addresses program activities for the fiscal period January 1- December 31, 2003, of the Dairy Promotion Program and the Fluid Milk Processor Promotion Program, unless otherwise noted.
Producer Dairy Promotion Program
The Dairy Production Stabilization Act of 1983 (Dairy Act) (7 U.S.C. 4501, et seq.) authorized a national producer program for dairy product promotion, research, and nutrition education as part of a comprehensive strategy to increase human consumption of milk and dairy products. Dairy farmers fund this self-help program through a mandatory 15-cent per hundredweight assessment on all milk produced in the contiguous 48 States and marketed commercially. Dairy farmers administer the national program through the National Dairy Promotion and Research Board (Dairy Board). The Dairy Act provides that dairy farmers can direct up to 10 cents per hundredweight of the assessment for contributions to qualified State or regional dairy product promotion, research, or nutrition education programs (Qualified Programs).
The Dairy Order became effective on May I, 1984. The Dairy Act required the Secretary of Agriculture to conduct a referendum among dairy farmers by September 30, 1985, to determine if a majority favored continuation of the program. Nearly 90 percent of the dairy farmers voting in the August-September 1985 referendum favored continuing the program. USDA held a second referendum on the dairy promotion program in August 1993. Approximately 71 percent of the dairy farmers who voted in the referendum favored continuing the program. USDA will hold future referenda at the direction of the Secretary or upon the request of at least 10 percent of the affected dairy farmers.
The Dairy Board portion of the revenue from the 15-cent per hundredweight producer assessment was $86.1 million for 2003, and Qualified Programs revenue from the producer assessment was $174.8 million for the same year. Revenue from assessments for the Dairy Board and many of the Qualified Programs is integrated through a joint process of planning and program implementation so that the programs on the national, regional, State, and local level work together.

Fluid Milk Processor Promotion Program
The Fluid Milk Promotion Act of 1990 (Fluid Milk Act) (7 U.S.C. 6401 et seq.) authorized the establishment of a national processor program for fluid milk promotion and education. The Fluid Milk Order became effective December 10, 1993. The Secretary appointed the initial National Fluid Milk Processor Promotion Board (Fluid Milk Board) on June 6, 1994.
Processors administer the Fluid Milk Processor Promotion Program through the Fluid Milk Board. Processors marketing more than 3 million pounds of fluid milk per month, excluding those fluid milk products delivered to the residence of a consumer, fund this program through a 20-cent per hundredweight assessment on fluid milk processed and marketed in consumer-type packages in the contiguous 48 States and the District of Columbia.
The Fluid Milk Board's revenue for the January 1 through December 31, 2003, period was $106.5 million. Approximately 76 percent of the program expenditures was used for fluid milk advertising, 7 percent for promotions, and about 14 percent for public relations. The remaining funds were used for research and for general and administrative expenses.
The Fluid Milk Act required the Secretary to conduct a referendum among fluid milk processors to determine if a majority favored implementing the program. In the October 1993 referendum, 72 percent of the processors voted to approve the implementation of the fluid milk program. These processors represented 77 percent of the volume of fluid milk products marketed by all processors during May 1993, the representative period set for the referendum. USDA held a continuation referendum in February-March 1996. Of the processors voting in that referendum, nearly 65 percent favored continuation of the program. These processors represented 71 percent of the volume of fluid milk products marketed by all processors during September 1995, the representative period set for the referendum. In November 1998, USDA held another continuation referendum at the request of the Fluid Milk Board. Fluid milk processors voted to continue a national program for fluid milk promotion established by the Fluid Milk Order. Of the processors voting in ths referendum, 54 percent favored continuation of the order. These processors represented 86 percent of the fluid milk products processed and marketed by fluid milk processors voting in the referendum. The Fluid Milk Act and Order state that USDA will hold future referenda upon the request of the Fluid Milk Board, of processors representing 10 percent or more of the volume of the fluid milk products marketed by those processors voting in the last referendum, or when called by the Secretary.
National Fluid Milk Programs
Dairy Management Inc. (DMI) - the staffing organization for the Dairy Board - and the Fluid Milk Board continued to execute national fluid milk programs in 2003. The funding level of the national programs totaled $143 million in 2003, with about $47 million from DMI and State and regional organizations and about $96 million from the Fluid Milk Board. The fluid milk marketing programs are research based, message focused, and separately managed.
2

A summary of the national fluid milk programs for fiscal year 2003 follows the Fluid Milk Board section in Chapter 1 of this report.
USDA Oversight
USDA has oversight responsibility for both dairy promotion programs. The oversight objectives ensure that the Boards and Qualified Programs properly account for all program funds and that they administer the programs in accordance with their respective Acts and Orders. All advertising, promotional, and educational materials are developed under established guidelines. All Board budgets, contracts, and advertising materials are reviewed and approved. USDA employees attend all Board and Board Committee meetings and monitor all Board activities. USDA also has responsibility for obtaining an independent evaluation of the program. Additional USDA responsibilities relate to nominating and appointing Board members, amending the orders, conducting referenda, assisting with noncompliance cases, and conducting periodic program audits. The Boards reimburse the Secretary, as required by the Acts, for USDA's administrative costs of program oversight and for the independent analysis.
Independent Analysis and Fluid Milk Market and Promotion Assessment
Chapter 3 reports the results of the independent analysis, conducted by Comell University, of the effectiveness of the dairy promotion programs. Since 1995, the independent analysis has included an analysis of the effectiveness of the producer promotion program in conjunction with the processor promotion program. Comell has conducted these analyses since 1998.
Chapter 4 presents the industry-commissioned fluid milk market and program operations assessment, representing the fifth year that this assessment has been conducted. The review offers a subjective evaluation of the effectiveness of the fluid milk advertising and promotion programs.
Appendices: Supplemental Information
This report's Appendix section (Appendix A-H) includes a variety of supplemental information related to the dairy promotion programs. Appendix A presents a detailed listing of the current Dairy Board members. To commemorate the program's 20-year anniversary, this year's report also includes a comprehensive listing of all past Dairy Board members. Appendix B similarly includes a detailed listing of all current and past Fluid Milk Board Members.
Appendix C features two maps that display the regions of both the Dairy Board and Fluid Milk Board.
Appendix D presents tables that report the actual income and expenditures, USDA oversight costs, and approved budgets for both the Dairy Board and Fluid Milk Board.
Appendix E-1 includes the financial statements, supplemental schedules, and the independent auditor's report for the Dairy Board. The auditing firm KPMG LLP conducted the 2003 Dairy

Board independent audit. Appendix E-2 includes financial statements and the independent auditor's report for the Fluid Milk Board. Snyder, Cohn, Collyer, Hamilton and Associates P.C. conducted the 2003 Fluid Milk Board independent audit.
Appendix F-1 includes a detailed listing of all 2003 Dairy Board and Dairy Management Inc. contracts (and corresponding initiatives) reviewed by USDA. The Dairy Act and Order require that all contracts expending producer funds be approved by the Secretary of Agriculture (7 CFR § 1150.140). Appendix F-2 includes a detailed listing of all 2003 Fluid Milk Board and International Dairy Foods Association (IDFA) contracts reviewed by USDA. The Fluid Milk Board contracts with IDFA to manage the day-to-day operations of the processor promotion program.
Appendix G-1 includes a listing of the two nutrition institutes and the six dairy foods research centers that provide much of the research that supports the marketing efforts of the dairy promotion programs. Appendix G-2 and G-3 list the new and ongoing dairy foods and nutrition research projects that are funded by DMI.
Appendix H lists the Qualified State or regional dairy product promotion, research, or nutrition education programs (Qualified Programs) for 2003. Qualified Programs are certified annually by the Secretary to determine whether milk producers may continue to receive credit against the 15-cent per hundredweight assessment due to the Dairy Board when contributing to a Qualified Program.
4

Chapter 1 The Dairy Promotion Programs
In 2003, the National Dairy Promotion and Research Board (Dairy Board) and the National Fluid Milk Processor Promotion Board (Fluid Milk Board) continued to develop and implement programs to expand the human consumption of fluid milk and dairy products. While each promotion program has many unique activities, the two programs continued coordination of their fluid milk programs in 2003.
National Dairy Promotion and Research Board
The mission of the Dairy Board is to coordinate a promotion and research program that expands domestic and foreign markets for fluid milk and dairy products produced in the United States. The Dairy Board is responsible for administering the Dairy Promotion and Research Order (Dairy Order), developing plans and programs, and approving budgets. Its dairy farmer board of directors administers these plans and monitors the results of the programs.
The Secretary of Agriculture (Secretary) appoints 36 dairy farmers to administer the Dairy Order. The appointments are made from nominations submitted by producer organizations, general farm organizations, qualified State or regional dairy product promotion, research, or nutrition education programs (Qualified Programs), and by other means as determined by the Secretary (7 CFR § 1150.133(a)). Dairy Board members serve 3-year terms and represent 1 of 13 regions in the contiguous 48 States. Dairy Board members elect four officers: Chair, Vice Chair, Treasurer, and Secretary. Current and past Dairy Board members are listed in Appendix A. A map of the contiguous 48 States depicting the 13 geographic regions is shown in Appendix C.
Total Dairy Board actual revenue for 2003 was $86.2 million (including assessments and interest). This amount was less than the Dairy Board budget of $94.3 million for that period. The Dairy Board amended its budget to $88.3 million to reflect unrecognized revenue and the addition of program development funds. The Dairy Board budget for 2004 projects total revenue of $87.1 million from domestic assessments and interest. The Dairy Board administrative budget continued to be within the 5-percent-of-revenue limitation required by the Dairy Order. A list of actual income and expenses for 2002-2003 is provided in Appendix D-1. USDA's oversight and evaluation expenses for 2002-2003 are listed in Appendix D-2. Appendix D-3 displays the Dairy Board's approved budgets and a comparison of program funding by function for 2003-2004. An independent auditor's report for 2003 is provided in Appendix E-1.
The Dairy Board has two standing committees: the Finance and Administration (F&A) Committee and the Executive Committee. The F&A Committee is made up of the Dairy Board officers and appointees named by the Dairy Board Chair. The Dairy Board Treasurer is the Chair of the F&A Committee, and the full Dairy Board serves as the Executive Committee. The remaining committees for the Dairy Board are joint program committees with the United Dairy Industry Association (UDIA).

In March 1994, the Dairy Board approved the creation of Dairy Management Inc. TM (DMI). DMI is a joint undertaking between the Dairy Board and UDIA. UDIA is a federation of 18 of the 59 active Qualified Programs under the direction of a board of directors. DMI merged the staffs of the Dairy Board and UDIA to manage the Dairy Board programs as well as those of the American Dairy Association ® and National Dairy Council ® throughout the contiguous 48 States. DMI is a merger of the two separate program and administrative staffs into a single staff that serves both boards and is structured into five support groups. The nutrition, public, and corporate affairs group supports nutrition education and consumer affairs, board relations, and program implementation. The industry relations group provides outlets for news about dairy topics through media contacts as well as communications regarding the daily check-off program to producers and the rest of the industry. The strategic operations/finance and administration group handles program planning and communications, information services, membership development, and finance and accounting activities. The marketing and business development group supports retail channel development, marketing communications, advertising, research, analysis of domestic and foreign marketplaces, program effectiveness, consumption patterns, and consumer perceptions for effective program planning, implementation, and measurement. The export marketing group serves as a resource for U.S. dairy processors to improve export capabilities of the U.S. dairy industry.
Since January 1, 1995, the Dairy Board and UDIA have developed their marketing plans and programs through DMI. DMI facilitates the integration of producer promotion funds through a joint process of planning and program implementation so that the programs on the national, regional, State, and local level work together. The goals of DMI are to reduce administrative costs, to have a larger impact on the consumer, and to drive demand, thereby helping to increase human consumption of fluid milk and dairy products.
DMI funds 1- to 3-year research projects that support marketing efforts. Two Nutrition Institutes and six Dairy Foods Research Centers provide much of the research. Their locations and the research objectives are listed in Appendix G-I. Additionally, lists of DMI's dairy foods and nutrition projects can be found in Appendices G-2 and G-3, respectively. Universities and other industry researchers throughout the United States compete for these research contracts.
From its inception, the DMI Board of Directors consisted of 12 dairy farmers from the Dairy Board and 12 dairy farmers from the UDIA Board. An amendment to the articles of incorporation of DMI to expand the DMI Board size took effect January 1, 2001, and the expanded DMI Board (77) now comprises all Dairy Board (36) and all UDIA Board (41) members.
The committees for program activities are comprised of board members from both the Dairy Board and UDIA Board. The Dairy Board and UDIA Board separately must approve the DMI budget and annual plan before they can be implemented. In November 2002, both boards approved the 2003 unified dairy promotion plan budget and national implementation programs. Similar to previous plans, the 2003 unified dairy promotion plan continued to support the
6

underlying theme of investing dollars where consumers are - not where dairy cows are. The unified dairy promotion plan was consistently implemented in the top 150 demand-building consumer markets nationwide.
During 2003, DMI continued to host dairy director regional planning forums across the country to review and develop marketing strategies for development of the unified dairy promotion plan. These forums were originally designed to create o n e unified dairy promotion plan and allow opportunity for State and regional dairy board members to ask questions, raise concerns, and offer their thinking on the direction and development of a unified dairy promotion plan.
At the 2003 forums, dairy directors across the country reviewed and endorsed five strategic platforms to help drive dairy demand in 2004 and beyond. These five platforms included: (1) The Marketing Channels platform, which features key partnerships with retail grocery chains, national restaurant chains, and food manufacturers; (2) the Childhood Nutrition platform, which aims to make more flavors of milk in single-serve, plastic resealable containers available through the school feeding line, ~ la carte line, and vending; (3) the Innovation platform, which includes activities such as creating more extended shelf life dairy products and other emerging technologies for dairy ingredients, including cheese, whey, and dry milk; (4) the Dairy Image platform, which will help maintain and enhance consumer confidence in dairy products and dairy farming; and (5) the Export Marketing platform, which includes demand-building market development and expansion programs in Latin America, the Pacific Rim, Mexico, and other global markets. Dairy producer organizations also endorsed further penetration of the "New Look of School Milk" program into U.S. elementary and secondary schools and full program support and integration of the 3-A-Day TM of Dairy for Stronger Bones marketing and nutrition education program.
The above-mentioned endorsements were all built upon the 2002 forum results, which emphasized programs with less reliance upon television advertising, continuance of successful foodservice and retail activities, the need for heavier focus on kids and school milk problems, more focus on industry partnerships, and stronger, more proactive image protection of dairy products. Combined spending for the unified marketing plan totaled more than $250 million in 2003.
The joint Dairy Board and UDIA Board committee structure provides the framework for DMI program activities. The Dairy Board and UDIA Board Chairs assign their respective board members to the following joint program committees: Cheese, Communications and Technology, Export and Dry Ingredients, and Fluid Milk. Each committee elects a Chair and a Vice-Chair. The joint committees and the DMI staff are responsible for setting program priorities, planning activities and projects, and evaluating results. The Joint Evaluation Committee continued to operate in 2003. The Joint Industry Partnering Committee, created in 2000 to provide ongoing direction and guidance to DMI on industry partnering opportunities, was dissolved. Industry partnering opportunities are now evaluated during the DMI program planning and development process, and the committee is no longer necessary. During 2003, the Dairy Board and UDIA Board met jointly four times.
The following information describes the program activities for each committee along with new programs and initiatives implemented in 2003.
3-A-Day T M of Dairy for Stronger Bones
3-A-Day TM of Dairy for Stronger Bones (3-A-Day T M ) marketing and nutrition education campaign was officially launched on March 3, 2003. The program objectives are to increase total consumption of dairy products and reinforce dairy as the leading source of calcium by providing simple guidance about dairy food selections. The development of the program was a joint dairy industry effort led by DMI. A key component of the 3-A-Day TM program is the logo, which appears on packages and labels of milk, cheese, and yogurt products containing 20 percent or more of the daily value of calcium.
The 3-A-Day TM program also included a substantial print advertising component targeted at both consumers and the health professional media. National full-color print advertisements ran in People and USA Today, in addition to magazine articles, e-newsletters, and advertorials. The combined audience reach for these activities was over 26 million consumers. At retail, Wal- Mart Supercenters held sampling events featuring six different milk, cheese, and yogurt products to kick off 3-A-Day TM of Dairy Week. Wal-Mart also ran 3-A-Day TM of Dairy 30-second in-store radio and television spots.
Another critical component of the 3-A-Day TM campaign was its health professional outreach component. To complement the campaign, the American Academy of Family Physicians, the American Academy of Pediatrics, the American Dietetic Association, and the National Medical Association signed on to partner with DMI and 3-A-Day TM. By working together with these key health professional partners, DMI was able to provide a clear, practical message to the public on the importance of dealing with the Nation's calcium crisis. In addition, leaders from these four organizations, along with other nutrition experts, make up DMI's 3-A-Day TM advisory panel. The panel helps to guide the overall campaign, as well as nutrition philosophy and principles.
Cheese
The DMI cheese campaign "Ahh, the power of cheese ..... continued to promote cheese directly toward "Cheese Lovers," with an emphasis on cheese "Cravers" and cheese "Enhancers." Cheese "Cravers" eat cheese primarily "as is," directly out of the package or off the block, and consume cheese as an important component of their food consumption routine. Cheese "Enhancers" have equally positive attitudes toward cheese but their consumption primarily takes the form of cheese as an ingredient in meal preparation. As in previous years, the DMI cheese television advertising campaign was recognized for creative excellence, winning numerous awards. DMI's 2003 cheese advertising included two television commercials and one print execution. The televison commercials, "Pifiata" and "Closing up Shop," were targeted to reach entertainment, sports, and family-oriented cheese lovers during morning programming, prime time, and late-night talk shows as well as on cable and cable sports. DMI cheese print
8

advertising included a reprint of a previous ad, "Football," which was featured in Sports lllustrated's NFL Football Preview issue and People Magazine.
As in previous years, the cheese marketing effort included major retail co-marketing programs implemented in supermarkets representing more than 60 percent of U.S. retail grocery sales volume. These accounts included large national accounts such as Kroger, Wal-Mart Supercenters, Safeway, and Albertsons. In these efforts, DMI provides retailer-customized media (television, radio, or direct mail) and in-store sampling, which are combined with the retailer's own advertising and merchandising support to drive cheese sales. Research has consistently shown that these co-marketing programs contribute to increased cheese category volume in participating stores.
In September 2003, DMI announced its third annual Cheese Advisory Panel (CAP), comprised of six leading chefs from around the country, to spotlight American cows' milk cheeses. CAP members participated in a series of activities aimed at increasing awareness of high-quality American cheese and cheesemakers. Throughout the year, CAP members created innovative recipes with a variety of artisanal American cheeses that appeared on restaurant menus nationwide.
DMI also worked closely with top national restaurant chains, including Pizza Hut ® and Wendy's ®, to drive cheese volume and ensure that cheese was featured prominently in menu items. For example, Wendy's ® introduced two new sandwiches, the Wild Mountain Chicken sandwich and the Wild Mountain Bacon Cheeseburger, nationwide. Both included a slice of natural Colby-Jack cheese and a smoky Southwestern pepper sauce. These new menu items were developed through a partnership between DMI and Wendy's ® that tested consumer acceptance of these sandwiches in select test markets.
DMI also continued to execute a comprehensive product publicity program for cheese in 2003 that leveraged the "Ahh, the power of Cheese" advertising campaign. The publicity program received three national and two regional awards from industry groups for its excellence in public relations. The DMI public relations campaign won a Publicity Club of Chicago Silver Trumpet Award, the "Cheese Country or Bust" press kit received a Silver Trumpet and MerComm Bronze Mercury Awards, and "Cheese Chatter" received a Communicator Award of Distinction. Popular cheese publicity highlights included the programs "Meltertaining" and "Gift of Cheese." "Meltertaining" garnered its own section on the Web site www.ilovecheese.com, featuring an entire microsite devoted to this new entertaining trend. Also, consumers were able to receive a free "meltertaining" brochure entitled "Tantalizing Tales of Cheese." The brochure highlighted dozens of meltertaining recipes and tips. The publicity program "Gift of Cheese" helped drive retail cheese purchases and consumption by leveraging broadcast advertising. Other strategies for achieving these objectives were to promote easy cheese recipes for holiday entertaining and to promote cheese as the gift of choice for holiday and other gift-giving occasions throughout the year. This successful program also included a partnership with Woodbridge Wines by Robert Mondavi, which featured brochures recommending cheese and wine combinations and pairings for any occasion.
9

Web site www.ilovecheese.com continued to operate in 2003. Mainstay "Cheese Chatter," a free monthly e-newsletter about current cheese news, recipes, and savings for cheese lovers, continued to be sent to all www.ilovecheese.com members and chatter subscribers. New to www.ilovecheese.com was the "Cheese Chatter Test Kitchen Panel," which is a group of cheese lovers who volunteer to create and test new recipes for the Web site. Each panelist comments on ease of preparation and overall taste of the recipes, and the reviews are posted on the Web site. The Web site continued to post high-traffic numbers throughout the entire year. Also, the interactive "Cheese Profiler Survey" and the "Snackulator" continued to assist Web site visitors in determining which cheeses best fit their lifestyle and to suggest appealing meal combinations and recipes.
Communications and Technology
Consumers receive mixed messages through the media about the nutritional value and benefits of food. DMI worked to provide consumers with education and information based on sound nutritional science and communicated the value of dairy products to consumers as well as to health professionals and educators. DMI also worked to inform dairy farmers about how their assessment dollars were being used. The organization continued to communicate to dairy producers and other industry audiences through publications (such as the annual report, joint newsletters with State and regional dairy promotion groups, and dairy cooperative check stuffers), dairy industry events (including major trade shows and producer meetings) and media relations (including press releases, feature placement, and farm broadcast interviews). For the sixth year, DMI continued its "Dairy Ambassadors" program, which uses a group of board members who are also dairy producers to deliver consistent messages about the dairy promotion program to producers and other industry audiences.
DMI continued its support for butter through cooperation and public relations activities with the American Butter Institute, including the Web site www.butterisbest.com, a consumer resource center with current cooking trends and ideas, butter recipes, and links to other butter-related Web sites. DMI also completed its second year of co-funded retail butter promotion activities with the California Milk Advisory Board in 2003. This effort continued to help to drive incremental retail butter sales in ~;everal markets across the Western United States.
Another activity of the Communications and Technology program was the issues management program. The objective of this program was to identify, monitor, and manage key issues that may influence consumer perceptions of dairy products. DMI coordinated its issues management activities with State and regional dairy promotion groupsas well as with other dairy and agricultural groups. The organization worked with these groups to bring forth sound, science- based information to address consumer issues. Dairy Reputation Management, an industrywide effort that interacts with the Issues Management, Industry Relations, and Dairy Image Programs, continued a proactive program to educate consumers and to reinforce the positive attributes of dairy foods, dairy farmers, and dairy farming practices to this audience.
The Dairy Confidence Campaign, designed and initiated in 2001 to enhance existing dairy image and issues management programs, continued in 2003. Important 2003 accomplishments
10

included refinement of its industrywide crisis communications and preparedness plan to address a potential animal disease outbreak in the United States. On December 23, 2003, this plan was implemented nationwide in response to a situation in which a dairy cow in Washington State tested positive for the disease bovine spongiform encephalopathy, or BSE. With a comprehensive preparedness plan already in place, the dairy industry was able to quickly activate its crisis network, assemble industry communicators, and disseminate key messages and other pertinent information. These efforts helped to protect dairy's image by assuring consumers of a continued safe, wholesome supply of milk and dairy products. Other support activities of the Dairy Confidence Campaign included updating a Web site for producers and consumers, which was also used during the BSE crisis. Additional research was conducted to better understand consumer perceptions and concerns regarding animal health and safety issues.
Farmer-funded nutrition research continues to demonstrate that dairy products are a necessary food component in the diet of all people throughout the human life cycle. Research continues to focus on improving childhood nutrition and on identifying diseases that may see decreasing occurrences as a result of consuming dairy foods.
Additionally, ongoing nutrition research continues to validate discoveries about the potential benefits of dairy food consumption in reducing obesity. With continued emergence of research and breakthroughs demonstrating a positive role of dairy in the reduction of obesity and related diseases, DMI launched the Healthy Weight With Dairy Campaign in October 2003. The purpose of the initial roll-out was to increase the public's and health professional community's awareness of the emerging science supporting a connection between weight loss and consumption of dairy products. For the launch, the Web site www.healthyweightwithdairy.com was unveiled, print advertisements began running in national magazines and newspapers, and various public relations activities were executed nationwide. The newly launched Web site gives consumers and health professionals access to medical research and other scientific information supporting dairy's role in healthy weight, commentary from nutrition researchers and dieticians, weight loss tips, recipes, links to easy-to-use weight management tools, and a body mass index calculator. In 2004, the Healthy Weight with Dairy campaign will be supported with national television and print advertisements, national retail promotion activity, public relations, and more online content.
Export and Dry Ingredients
DMI's export enhancement program is implemented by the U.S. Dairy Export Council (USDEC). USDEC receives primary funding from three sources: DMI, USDA's Foreign Agricultural Service (FAS), and membership dues from dairy cooperatives, processors, exporters, and suppliers. In 2003, USDEC received $7.1 million from DMI; $3.4 million from USDA's Market Access Program and the Foreign Market Development Program, which support commodity groups in promotion of their commodities in foreign markets; and $679,000 from membership dues. USDEC is in its eighth year of operation, and its total budget was $11.7 million.
11

USDEC has offices in Mexico City, Tokyo, Seoul, Hong Kong, Shanghai, Bangkok, Taipei, London, and Sao Paulo. In 2003, Mexico and Canada were the largest markets for U.S. dairy products, accounting for nearly half of export sales. Exports to Mexico, the Caribbean, Central America, and the Middle East all posted sizable gains in 2003. Small increases were recorded in sales to Southeast Asia and South Korea. Exports to Japan, China, and South Korea decreased in 2003.
Final 2003 export data confirm that U.S. dairy product exports reached $1.07 billion in 2003, up 4 percent from the prior year and the fourth straight year in which dairy exports exceeded $1 billion. Lactose was a success story in 2003, posting a 21 percent increase in export volume over the previous year. Exports of lactose to New Zealand and Australia, which are used mostly for the protein fortification of skim milk powder, doubled the previous year's volume. Sales of lactose to China, Mexico, South America, and Japan also posted significant gains.
Overall whey exports declined 6 percent on a volume basis, though they increased by 2 percent on a value basis. Exports of whey protein isolate nearly doubled, while whey protein concentrate and dry whey dropped modestly due to economic recession in key markets and a pullback in sales to the livestock sector. Cheese exports also declined 3 percent on a volume basis, with declines in sales to the Far East and South America. Cheese exports to Mexico increased, due in part to exporter commitment and successful USDEC promotional and market development activities.
Specific 2003 promotions included in-store retail promotions and sampling in supermarkets, joint promotions with food service companies, quarterly trade newsletters, exhibits at trade fairs, and seminars about U.S. dairy products presented to the press, end-user, and food distributors. USDEC successfully partnered with retailers and foodservice operators in key markets on programs that showcased a value-added cachet of U.S. cheese. The USDEC logo was printed on pizza boxes for Domino's and Costco in Mexico, alerting consumers to the fact the pizza was topped with high-quality cheese from the United States. Also, in other cheese highlights, a "U.S. Cream Cheese Bakery Contest" in South Korea generated significant response from chefs nationwide and led to the publication of a cookbook of recipes. USDEC also worked with Japanese retailers to resolve supply problems with cup cream cheese and conducted new promotions to recapture previously lost sales.
USDEC continued working to improve the export capabilities of domestic dairy companies. The organization assists U.S. dairy exporters by providing up-to-date information on market conditions, global trade trends, and regulatory requirements for export. Ongoing reverse trade mission activities provide opportunities for domestic dairy product suppliers to meet potential importers visiting the United States.
Nonfat dry milk and whey promotion efforts were conducted via advertising, public relations, trade shows, and the Web site www.doitwithdairy.com. The advertising theme "Do it with Dairy ~'' was utilized throughout all activities. The "Do it with Dairy" ingredient marketing campaign reaches the food manufacturing/processing industry with key market-driven whey research results and usage messages. Several newsletters and other publications support this
12

program. "Dairy Dimensions," a quarterly newsletter, focuses on developments in dairy technology research. "Dairy Ingredients Insider" is a newsletter in which dairy ingredient suppliers are able to track buyer attitudes, behaviors, buying patterns, and product development plans. The latter has become a key planning tool for some suppliers, as it enables them to effectively utilize and leverage market research developed by DMI.
DMI's Product Innovation/Research and Nutrition Research group hosted the 2003 Product Innovation Forum (Forum) in Scottsdale, Arizona. The goal of the Forum was to spur innovation within the dairy industry and to elicit input and feedback from industry on the current and future direction of program planning. The Forum attracted more than 130 participants and included industry representatives such as ingredient suppliers, dairy processors and cooperatives, State and regional representatives, Government officials, food manufacturers, and university researchers. The attendees provided feedback that will be integrated into a variety of strategies as part of the effort to increase awareness and usage of whey and dry milk ingredients. The agenda covered a number of critical topics, including consumer and market trends; product and nutrition research; the 3-A-Day TM of Dairy for Stronger Bones program; and the School Milk Pilot Test results. There was also panel discussion that covered a broad range of current issues in the dairy product and ingredient industry.
Also, for the fifth straight year, DMI sponsored the Discoveries in Dairy Ingredients Contest. The contest allows undergraduate college students to develop an innovative food product formulation using dry milk, whey, or whey derivatives such as whey protein concentrate and whey protein isolate. The contest has a dual purpose - to highlight the versatility and functionality of dairy ingredients while at the same time providing food science students with practical, marketable experience. The three prize categories include the Best Overall Product Award, the Product Marketability Award, and the Product Creativity Award. Winning entries were featured at the 2003 Institute of Food Technologists Food Expo. The winning products included (1) frozen Parmesan cheese rolls, (2) fruit-flavored string cheese, and (3) freeze-dried yogurt cereal.
"Ingredient Insights," a newsletter designed expressly for food formulators and ingredient suppliers, continues to provide news about dairy ingredients, specific applications, and technical support resources. As part of this program, DMI provides ingredient technical support systems for food technologists. The system features four tiers, enabling food technologists to request the level of support they find the most useful. The options range from requesting technical information via FAX-ON-DEMAND to direct dialogue with a researcher.
"Innovations in Dairy," a technical bulletin that details new dairy science and technology information and research, is executed through a series of authoritative, topical updates written from a practical perspective for the lay reader.
Research continues to focus on nonfat dry milk and whey in the areas of functionality, quality, packaging, and new applications. In addition, the application laboratory for nonfat dry milk at California Polytechnic State University and the whey application laboratory at the University of
13

Wisconsin Center for Dairy Research continued to provide technical assistance to both those that produce the ingredients and those that use the ingredients in finished products. The Web site www.extraordinarydairy.com provides a network of resources and information to help the dairy and food industries bring innovative products, formulations, and processes to market.
Researchers are exploring additional health benefits of whey. Preclinical (nonhuman) trials are currently investigating the role of specific whey proteins in reducing the risk of certain types of cancer, including breast and prostate cancer, and research trials are investigating a potential link between whey proteins and reduced risk of hypertension. In addition, specific whey proteins have shown antibacterial properties. In the future, this may lead to whey's use as an ingredient in addressing potential food safety concerns with certain perishable foods such as meats or produce.
Research/National Dairy Council ®
The National Dairy Council ® (NDC), the nutrition marketing arm of DMI, has been the leader in dairy nutrition research, education, and communication since 1915. NDC provides timely, scientifically sound nutrition information to the media, physicians, dieticians, nurses, educators, consumers, and other health professionals.
DMI has continued to work closely with foodservice professionals and milk processors vis-h-vis the benefits of offering an enhanced milk product in the school cafeteria. The foundation of these efforts is comprised of the results of a year-long School Milk Pilot Test conducted in 2002. More than 330 schools, representing more than 300,000 students nationwide, now offer milk in single-serve plastic resealable containers on the school meal line. This number is growing as NDC continues to implement its "New Look of School Milk" initiative. In 2004, the Fluid Milk Board will begin an education program to educate milk processors about the benefits of offering an enhanced milk product in the Nation's elementary and secondary schools.
The National Dairy Council ® also has continued its active support of and participation in the Action For Healthy Kids (AFHK) initiative. Chaired by former U.S. Surgeon General David Satcher, AFHK was created in response to the Healthy Schools Summit in 2002. Its mission is to i inform, motivate, and mobilize schools, school districts, and States to chart a healthier course for the Nation's children and adolescents. In September, National Football League officials announced their intent to provide a multiyear grant to AFHK in the amount of $2 million over the next 4 years. AFHK is comprised of 51 State teams (including all States and the District of Columbia) and a partnership of more than 38 national organizations and Government agencies spanning education, health, fitness, and nutrition arenas. State teams are made up of a diverse base of volunteers, all working to improve nutrition and physical activity in schools at the State and local levels.
A o t l o n rot ~ t h y K i d s ~
14

National Dairy Council®-funded dairy nutrition research highlights in 2003 included:
1. The role of dairy as part of a heart-healthy diet. 2. The role of calcium-rich dairy products in successful weight loss and maintenance. 3. Dairy's role in the prevention and reduction of colon cancer. 4. Dairy's role in weight management.
Fluid Milk
Information on fluid milk advertising, promotions, public relations, school marketing, strategic thinking, and other activities that include DMI, State and regional organizations, and the Fluid Milk Board is detailed in the national fluid milk program summary in this chapter.
Qualified State or Regional Dairy Product Promotion, Research, or Nutrition Education Programs
Qualified Programs are certified annually by the Secretary. To receive certification, the Qualified Program must (1) conduct activities that are intended to increase human consumption of milk and dairy products generally; (2) have been active and ongoing before passage of the Dairy Act, except for programs operated under the laws of the United States or any State; (3) be primarily financed by producers, either individually or through cooperative associations; (4) not use a private brand or trade name in its advertising and promotion of dairy products (unless approved by the Dairy Board and USDA); and (5) not use program funds for the purpose of influencing governmental policy or action (7 CFR § 1150.153). A list of the 59 active programs is provided in Appendix H.
The aggregate revenue from the producers' 15-cent per hundredweight assessment directed to the Qualified programs in 2003 was $174 million (approximately 10 cents out of the 15-cent assessment). The Qualified Programs manage State or regional dairy product promotion, research, or nutrition education programs. See Table 1-1 and Table 1-2 for aggregate income and expenditure data of the Qualified Programs.
Some of these Qualified Programs participate in cooperative efforts conducted and coordinated by other Qualified Programs and/or other organizations such as DMI, the Dairy Board, and UDIA. Their goal in combining funding and coordinating projects is more effective and efficient management of producers' promotion dollars through larger, broad-based projects. For example, UDIA coordinates nationally through DMI the programs and resources of 18 federation members and their affiliated units to support the unified dairy promotion plan.
15

Table 1-1 Aggregate Income and Expenditure Data Reported to USDA
by the 59 Active Qualified Programs
Income Carryover from Previous Years Producer Remittances Transfers from Other Qualified Programs 2 Transfers to Other Qualified Programs 2 Other 3 Total Adjusted Annual Income
2002 2003 (in $000's) (in $000's)
48,553' 46,938' 172,590 174,892 58,056 54,716
- 55,744 - 57,109 4,111 3,910
227,566 223,347
Expenditures General and Administrative Advertising and Sales Promotion Unified Marketing Plan 4 Dairy Foods and Nutrition Research Public and Industry Communications Nutrition Education Market and Economic Research Other 5 Total Annual Expenditures
7,620 [4.4%] 7,641 [4.6%] 78,709 [45.0%] 70,688 [42.6%] 50,974 [29.2%] 50,146 [30.2%]
4,519 [2.5%] 5,980 [3.6%] 13,048 [7.5%] 13,245 [8.0%] 16,727 [9.5%] 12,963 [7.8%]
1,382 [0.8%] 1,568 [0.9%] 1,878 [1.1%] 3,742 [2.3%]
174,857 [100%] 165,973 [100%]
Total Available for Future Year Programs 52,7091 57,374
Differences are due to audit adjustments and varying accounting periods. 2 Payments transferred between Qualified Programs differ due to different accounting methods
and accounting periods. 3 Includes interest, income from processors and handlers, sales of supplies and materials,
contributions, and rental income. 4 Unified Marketing Plan: Reported local spending by United Dairy Industry Association units
participating in the DMI unified marketing plan to fund national implementation programs. 5 Includes capital expenses and contributions to universities and other organizations. Source: Aggregate income and expenditure data reported by the 59 active Qualified Programs.
16
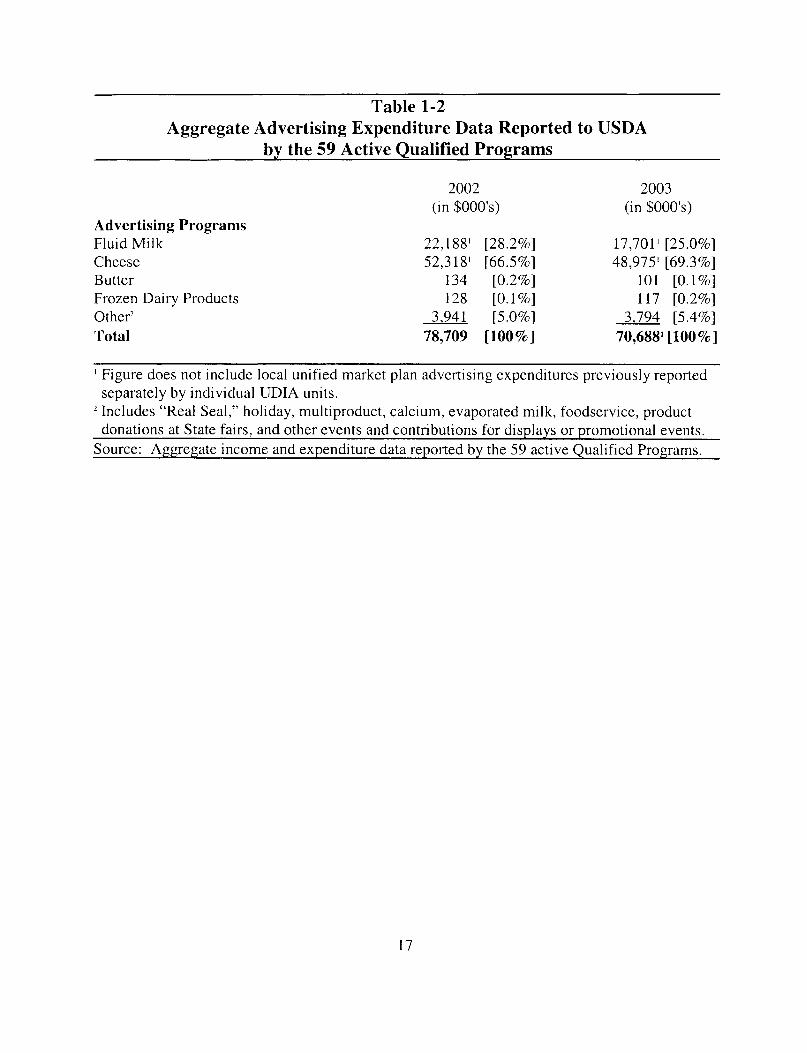
Table 1-2 Aggregate Advertising Expenditure Data Reported to USDA
by the 59 Active Qualified Programs
2002 2003 (in $000's) (in $000's)
Advertising Programs Fluid Milk 22,188 ~ [28.2%] 17,701 ~ [25.0%] Cheese 52,318 ~ [66.5%] 48,975' [69.3%] Butter 134 [0.2%] 101 [0.1%] Frozen Dairy Products 128 [0.1%] 117 [0.2%] Other 2 3 941 [5.0%] 3 794 [5.4%] Total 78,709 [100%] 70,688' [100%]
' Figure does not include local unified market plan advertising expenditures previously reported separately by individual UDIA units.
: Includes "Real Seal," holiday, multiproduct, calcium, evaporated milk, foodservice, product donations at State fairs, and other events and contributions for displays or promotional events.
Source: Aggregate income and expenditure data reported by the 59 active Qualified Programs.
17

National Fluid Milk Processor Promotion Board
The Fluid Milk Board, as authorized in the Fluid Milk Promotion Act of 1990 (Fluid Milk Act), administers a fluid milk promotion and consumer education program that is funded by fluid milk processors. The program is designed to educate Americans about the benefits of milk, increase fluid milk consumption, and maintain and expand markets and uses for fluid milk products in the contiguous 48 States and the District of Columbia.
The Secretary of Agriculture appoints 20 members to the Fluid Milk Board. Fifteen members are fluid milk processors who each represent a separate geographical region, and five are at-large members. Of the five at-large members, at least three must be fluid milk processors and at least one must be from the general public. Three fluid milk processors and two public members serve as at-large members on the current Fluid Milk Board. The members of the Fluid Milk Board serve 3-year terms and are eligible to be appointed to two consecutive terms. The Fluid Milk Promotion Order (Fluid Milk Order) also provides that no company shall be represented on the Board by more than three representatives. Current and past Fluid Milk Board members are listed in Appendix B. A map of the Fluid Milk Board regions is shown in Appendix C-2.
The Fluid Milk Board elects four officers: Chair, Vice-Chair, Secretary, and Treasurer. Fluid Milk Board members are assigned by the Chair to the following committees: Advertising, Finance, Promotions, Public Relations/Medical and Scientific, Research, and Strategic Thinking. The program committees are responsible for setting program priorities, planning activities and projects, and evaluating results. The Finance Committee reviews all program authorization requests for funding sufficiency, the Fluid Milk Board's independent financial audit, and the work of the Board's accounting firm. The Fluid Milk Board met four times during its 2003 fiscal year.
The National Fluid Milk Processor Promotion Program is funded by a 20-cent per hundredweight assessment on fluid milk products processed and marketed commercially in consumer-type packages in the contiguous 48 States and the District of Columbia. The program exempts from assessment those processors who process and market 3 million pounds or less of fluid milk products each month, excluding fluid milk products delivered to the residence of a consumer. Assessments generated $106.5 million in 2003. The Fluid Milk Order requires the Fluid Milk Board to return 80 percent of the funds received from California processors to the California fluid milk processor promotion program. For 2003, the amount returned to California from the assessments was approximately $10.2 million. The California fluid milk processor promotion program uses the funds to conduct its promotion activities, which include the "got milk? ®'' advertising campaign.
The actual income and expenses for 2002-2003 are provided in Appendix D-4. The Fluid Milk Board's administrative expenses continued to be within the 5-percent-of-assessments limitation required by the Fluid Milk Order. USDA's oversight and evaluation expenses for 2002-2003 are detailed in Appendix D-5. Appendix D-6 contains the Fluid Milk Board's approved budgets for 2003-2004. Appendix E-2 contains an independent auditor's reports for the period of January 1, 2003, through December 31, 2003.
18
The following summarizes Fluid Milk Board medical and scientific activities for the period of January 1, 2003, through December 31, 2003. The Fluid Milk Board's sponsorships, advertising, promotions, public relations, school marketing, and strategic thinking activities are incorporated in the National Fluid Milk Programs summary.
Medical and Scientific Activities
The Fluid Milk Board's Medical Advisory Board (MAB), comprised of academic, medical, and health care professionals with expertise relevant to the health benefits of fluid milk, met twice in 2003. The MAB provides guidance to the Fluid Milk Board's development of key nutritional and health messages for consumers and health professionals and also reviews nutrition and health messages for accuracy. MAB members assisted the Fluid Milk Board in forging relationships with health and health professional organizations such as the American Academy of Pediatrics, the American Dietetic Association, the American Heart Association, the National Cancer Institute, and the National Medical Association. They also appeared as medical professionals in the media, providing science-based statements supporting the health benefits of milk.
The medical and scientific activities of the Fluid Milk Board also included preparing press materials and acting as spokespersons on breaking research with relevance to fluid milk. The Fluid Milk Board created consumer and health professional materials to communicate current and emerging research in areas such as bone health, obesity, type-2 diabetes, and heart disease and to communicate the vital role milk plays in the diet of Americans. Also, the MAB worked extensively over the past year to inform others in the scientific community of the new and emerging research showing that three servings of dairy each day as part of a weight loss plan can help people lose weight by burning more fat. Numerous studies in the past 5 years have pointed to similar conclusions--that dairy foods and calcium may be important when addressing the issue of overweight and obesity. These communications and activities all continue to highlight milk's nutritional profile, which includes nine essential vitamins and minerals.
The Fluid Milk Board continued components of its "Good For You" campaign in 2003. The "Good For You" program's primary goal is to promote milk's nutritional benefits. The program continues to leverage breaking research with relevance to milk and is supported with advertising and public relations. Three print advertisements were created under this campaign in 2003. The focus of these advertisements was to inform consumers and the public about emerging research regarding the role dairy products may play in preventing weight gain and maintaining a healthy weight. The MAB was very involved in the development of messages in this area and helped the Fluid Milk Board explore ways to leverage the information in public relations and advertising messages.
The Fluid Milk Board also continued its lactose intolerance initiatives, which focus on educating African Americans and others on the importance of incorporating milk into their diets and why lactose intolerance should not be a barrier to including milk in the diet.
19

National Fluid Milk Programs
The Fluid Milk Board and DMI continued during 2003 to implement fluid milk marketing plans that are research based, message focused, and separately managed. The funding level of the fluid milk marketing efforts totaled approximately $143 million, with $47 million from DMI and State and regional organizations and about $96 million from the Fluid Milk Board.
The purpose of national fluid milk programs is to positively change the attitudes and purchase behavior of the country regarding fluid milk. The 2003 fluid milk marketing plans were designed to continue marketing and promotional activities to promote and increase the consumption of fluid milk and to identify and support growth opportunities for the industry. Many communication media were used to accomplish this objective, including television and print advertising, public relations, promotions, and others. The program's target audiences include kids and young teen girls and boys 6-14; teen girls and boys 15-17; morns 18-52; and two specific ethnic target audiences--Hispanics and African Americans.
In 2003, the got milk?S/Milk Mustache advertising campaign, which provides the basis for advertising activities and other program delivery methods, was continued. A description of the 2003 program activities for the Fluid Milk Board and DMI follows.
Sponsorships
In 2003, the got milk?®/Milk Mustache campaign continued leveraging a multiyear partnership with Walt Disney Corporation. The sponsorship provides a unique opportunity to raise milk's image among teens and young adults by highlighting the message that milk is a great beverage of choice for active teens and for athletes of all ages. As part of the partnership, milk continued to be "the official training fuel" of Disney's Wide World of Sports TM, and the "Milk House," a state-of-the art facility that hosts more than 40 Amateur Athletic Union national championships annually, remained the centerpiece arena of the facility. The "Milk House" has positioned got milk? ® signage and milk mustache posters prominently throughout the complex.
2003 brought the addition of television sports partner ESPN. Leveraging the "Milk House" equity, ESPN created 13 weekly 30-second vignettes featuring news from the "Milk House." The vignettes aired daily on the popular ESPN news show SportsCenter. Additionally, the Fluid Milk Board and ESPN sponsored a "Take it to the Milk House Sweepstakes" consumer contest, which offered the winner a trip to the "Milk House" for the sporting event of his/her choice. Contestants were able to enter online at www.ESPN.com or at ESPN Zone restaurants.
The Fluid Milk Board moved into the third year of its partnership with the National Basketball Association (NBA ®) during 2003 as part of a multiyear sponsorship. Through this sponsorship, the Fluid Milk Board has an additional mechanism to reach teens with sports nutrition and growth messages. During this year's got milk?S/All-Star Rookie Challenge weekend, the winner of the got milk?®/NBA ® "Rookie Reporter" contest received the opportunity to interview an NBA ® player as part of the grand prize. The NBA®/got milk? ® "Rookie of the Month" program,
20

which features monthly print advertisements with popular NBA ® stars, continued to highlight the important nutrients that milk provides for active and growing bodies.
Advertising
The Fluid Milk Board and DMI advertising programs consist of television, print, and radio advertising as well as media-driven promotions. The advertisements highlight specific, relevant health-benefit messages about milk and its nutrient content, while media-driven promotions serve to extend the advertising campaign. DMI advertisements target kids and mothers with young children and focus on making milk "fun" and a "want to have beverage" by kids. 2003 kid television commercials included "Fun," "Tug of War," and "Tumble."
The Fluid Milk Board's chocolate milk "Shake Stuff Up" campaign continued in 2003 and included a new partnership with WB television network. The campaign featured the commercials "Pogo Stick," "Mountain Bike," and "Barcode," all of which were created to communicate the unique taste of chocolate milk and remind teens how much they love the product. The advertisements feature teens shaking chocolate milk in unusual ways and having "fun" with chocolate milk to demonstrate the lengths to which teens will go to get it. The chocolate milk advertising campaign builds on the growing popularity and availability of single- serve flavored milk products.
The national Hispanic advertising campaign continued as part of industry outreach to the growing Hispanic population. The two Hispanic television commercials that were created and televised in 2003 were "Ballet" and "Soccer." These commercials focus on the nutrient package that milk delivers, as both featured active children involved in physical activities as they are growing up, while morn, family, and friends watch them succeed. The advertisements' tagline, "Mds leche, Mds logro" ("More milk, More achievement") reminds moms of milk's nutrients and the benefits of serving milk to their families. Hispanic print advertising featured celebrities and everyday Hispanic morns. These included Freddie Prinze, Jr., Myrka Dellanos and her daughter Olga Tafi6n, and "Star Morn" contest winner Dalia Barraza.
Targeting mothers with young children, the DMI "Celebrity Ode to Morn" radio campaign also continued in 2003. The campaign features celebrity singers giving thanks to their morns for giving them milk as children. New additions to the campaign included LeAnn Rimes and Smash Mouth. Spots featuring Ray Charles, Aretha Franklin, and Carlos Ponce, created in 2002, continued to air in 2003.
In addition, other television and print advertising continued to promote fluid milk. Of note, Nickelodeon and Cartoon Network produced several value-added, milk-focused print and television advertisements featuring several "kid-popular" cartoon characters as part of DMI's overall media purchases. Nickelodeon produced a "SpongeBob Squarepants" television commercial and print advertisement as part of the Nickelodeon Milk Mustache Sweepstakes as well as a "Wild Thornberry's" flavored-milk commercial. Cartoon Network also produced a "Dexter 's Laboratory" television commercial.
21

Various types of other fluid milk advertisements were produced in 2003. These included contest announcements and winners (8), outdoor advertisements (6), NBA ® Rookies of the Month (7), "Moment" print advertisements (6), celebrity print advertisements (11), and "Good For You" print advertisements (3). Additional information regarding these advertisements can be found at www.milkpep.org and at www.whymilk.com.
Promotions
The Fluid Milk Board and DMI conduct promotions to increase fluid milk sales in retail outlets. The promotions work to move more milk out of the grocery store refrigerator and to increase sales in other retail outlets such as convenience stores, independent grocery stores, drug stores, and mass merchandisers. Some of the promotions work with partners to increase the appeal of the program as appropriate. After careful measurement of the results of previous years' promotion strategies, promotion continued to focus on feature incentives, i.e., a promotion vehicle used to increase advertisements, displays of milk, and programs offering prizes directly to consumers to help drive incremental purchases.
The Fluid Milk Board and DMI conducted three national promotions in 2003. Two of the promotions resulted from DMI's Kellogg's/got milk?* Racing Team partnership. The first national promotion was done in cooperation with Pixar's animated movie Finding NEMO, which was released over the Memorial Day weekend. The promotion offer invited consumers to "Buy 2 gallons of milk and 2 packages of specially marked Kellogg's Rice Krispie Treats or select brands of Keebler cookies" and receive a giant inflatable "Bruce the Shark," a character in the film. The second national promotion, "Fueled to the Finish," featured a Kellogg's/National Association of Stock Car Auto Racing (NASCAR) theme. The promotion offer invited consumers to "Buy 2 gallons of milk, 2 boxes of Kellogg's brand cereal, mail in their proofs of purchase," and receive NASCAR merchandise. Both promotions generated significant activity in the category, and retailers hailed the efforts of the industry to bring "excitement" to the dairy case.
The third promotion leveraged the Fluid Milk Board's WB Network/Shake Stuff Up partnership in a 5-week, two-tiered program to promote flavored milk. The first tier of the national promotion invited consumers to "Buy any flavored milk, send in UPC codes plus shipping and handling" and receive a free compact disc featuring music heard on WB network along with other merchandise. The second tier of the promotion featured the "Watch and Win Sweepstakes," where consumers were asked to "Watch the WB network and identify television show characters shaking up flavored milk and enter online" for a chance to win one of three trips to Los Angeles to visit the set of a WB network comedy show. Media support included print and television advertisements, got milk?* television spot tags, and online support at www.TheWBMilk.com, www.TheWB.com, and www.whymilk.com.
Public Relations
The public relations programs continued to focus on the nutritional benefits of milk, emerging scientific studies that highlight milk's benefits, leveraging the high interest generated by the
22

celebrities and the got milk?®/Milk Mustache campaign, and preparing for and responding to misconceptions and negative news about milk or the educational campaign. A wide variety of initiatives were implemented to reach specific target audiences. Similar to previous years, over 1 billion media impressions were garnered through the integrated public relations program. The program also provided support for the three national retail promotions by helping to build public awareness and increase retailer participation.
For a second year, the Fluid Milk Board launched the "got milk?* 3v3 Soccer Shootout Tour" to remind American families about the importance of drinking milk for an active lifestyle and to position milk as nature's sports drink with nine essential vitamins and minerals, including calcium and protein. The 4-month tour visited 50 cities nationwide. Similar to 2002, the theme for this year's tour was another nationwide search for the "Ultimate Soccer Morn." Kids had the opportunity to nominate their morns at each tour stop and at www.whymilk.com. The year's winning morn, Amy Garff, received a new minivan, appeared in a Milk Mustache print advertisement with her two boys, and was given a trip to Walt Disney World along with her entire family.
For the sixth consecutive year, the Milk Mustache Mobile Tour made its way around the United States. This year's program, the "Shake Stuff Up Tour 2003," ran from March through October and again covered more than 100 cities nationwide. This year's theme was again rock music, but the program included several enhancements to that of the previous year. A primary goal of the tour is to educate Americans (especially teens) about the nutritional and taste benefits of chocolate and other flavored milk. Two educational components of the tour were computer- based health assessments to test bone density and appearances by on-site fitness experts conducting health consultations and offering nutrition and fitness advice. Also, continuing a partnership with MTV and Rolling Stone magazine, the tour offered teens the chance to participate in a "battle of the bands" event and win prizes. One of the winning bands received professional studio time and an opportunity to post a song on www.mtv.com. Additionally, the tour karaoke station invited visitors to sport a chocolate milk mustache and sing a verse of their favorite song to be entered into a sweepstakes to win a trip to visit the set of an MTV television show. Robert Rudolph, the 2002 "Be a got milk?* Rock Star" was featured in his own got milk?* print advertisement in Rolling Stone magazine in 2003.
Partnering with Kraft Foods, DMI sponsored the "Mix it With Milk Jell-O" contest. The contest focused on increasing kids' milk consumption by encouraging them to create their own new flavored milk drinks consisting of one glass of milk, any Jell-O Brand Gelatin or Instant Pudding flavors, and any other ingredient such as raspberry jam or marshmallows. The program ran from January through October. The grand prize winner received a $10,000 college scholarship, a trip to the Institute of Culinary Education in New York, and a year's supply of Jell-O Brand Gelatin Powder.
Brochures and other information on milk were made available to consumers through the Web site www.whymilk.com.
23

Strategic Thinking
The Fluid Milk Strategic Thinking Initiative (FMSTI) is a joint effort of the Fluid Milk Board, the Milk Industry Foundation, processors, and suppliers. This ongoing effort was established to address barriers to fluid milk consumption not targeted by the advertising, promotion, and public relations activities of the Fluid Milk Board and DMI.
FMSTI conducted market tests in milk and foodservice industries to develop proven ways to increase milk sales. With input from an advisory board of milk processors, foodservice distributors, and restaurant operators, market tests were commissioned to address a number of questions relating to the marketability of milk on the foodservice channel. In addition, FMSTI conducted a multichannel vending test to show new opportunities for milk to reach teens.
As part of the third and final phase of its foodservice test, FMSTI analyzed the effectiveness of a variety of visual and vocal cues used by each restaurant and its staff to encourage customers to order milk. These strategies included in-market promotions, point-of-sale purchase materials, and servers using verbal or visual reinforcement to encourage increased consumption. During the test, overall average sales increased by 42 percent.
Complete reports, studies, executive summaries, and press releases for FMSTI's ongoing initiatives are available on the Fluid Milk Board's Web site at www.milkplan.org.
School Marketing
The National Dairy Council + (www.nationaldairycouncil.org), whose operations are funded by DMI, works with school foodservice professionals and teachers to raise student awareness of the importance of having milk and dairy products as a part of a healthy lifestyle. As in 2002, several integrated milk programs were extended into schools through school foodservice professionals using posters and other tie-in activities.
A successful 2003 school promotion was "Shake Stuff Up." This promotion was conducted in schools during the same time period as a similar Fluid Milk Board retail promotion was being conducted in major retail chains across the United States. This allowed schools to leverage the excitement generated through retail chains to get the students more excited about flavored milk consumption in the school cafeteria. This promotion was implemented in more than 27,000 schools across the country and included cafeteria kits that featured posters and other exciting tools for foodservice directors to use in actively promoting milk consumption.
Reaching kids through the classroom with various programs continues to be the focus of nutrition education efforts. "Pyramid Caf6" and "Pyramid Explorations, ~'' targeted to the second and fourth grades, reach over 12 million students with messages that milk and dairy products are a key part of a healthy diet. Survey results continue to show a very high utilization rate for these two programs, currently at over 70 percent for the instructors that have the programs.
24
The combined Web sites www.familyfoodzone.com and www.nutritionexplorations.org continue to deliver valuable resources to teachers, school foodservice professionals, and consumers. The Web site includes lesson plans for educators, resources for school foodservice directors, ideas for smart eating for families, and fun activities for kids. In 2003, www.nutritionexplorations.org delivered more than 82,000 lesson plans and 4 million dairy impressions and also received another World Wide Web Health Award. The World Wide Web Health Awards, organized by the Health Information Resource Center, recognize the best health-related Web sites for consumers and professionals each year. This site has won the award every year since 1999.
Other Research
Additional 2003 milk-related nutrition and product research was continued in the following areas:
.
2. 3.
4.
5.
6.
The role of milk and milk products in the prevention of colon cancer and reduction of blood pressure. Establishing the genetic basis for the activity of probiotic cultures. Demonstration of milk consumption by teens to meet their calcium needs without adversely affecting weight. The contribution of dairy's nutrient package in the development and maintenance of strong bones. Investigation of the added value of fortification through the use of probiotics, nutraceuticals, nutrient delivery, and flavor enhancement. The impact of differing milk options and experiences in schools on childhood fluid milk consumption behavior and attitudes.
25

Chapter 2 USDA Activities
The Dairy Programs unit of USDA's Agricultural Marketing Service (AMS) has day-to-day oversight responsibilities for the Dairy Board and the Fluid Milk Board. Dairy Programs oversight activities include reviewing and approving the Dairy and Fluid Milk Board's budgets, budget amendments, contracts, advertising campaigns, and investment plans. Approval of program materials is also a responsibility of Dairy Programs. Program materials are monitored for conformance with provisions of respective Acts and Orders and with other legislation such as the Nutrition Labeling and Education Act.
Dairy Programs continues to ensure that the collection, accounting, auditing, and expenditure of generic promotion funds is consistent with the enabling legislation and orders; to qualify State or regional dairy product promotion, research, or nutrition education programs (Qualified Programs); and to provide for evaluation of the effectiveness of both programs' advertising campaigns. USDA also assists the Boards in their assessment collection, compliance, and enforcement actions. Other USDA responsibilities relate to nominating and appointing Board members, amending the orders, conducting referenda, and conducting periodic program audits. USDA representatives attend full Board and Board committee meetings.
National Dairy Promotion and Research Board Oversight
Nominations and Appointments
The 36 members of the Dairy Board who administer the program serve 3-year terms, with no member serving more than two consecutive terms. Dairy Board members are selected by the Secretary of Agriculture from nominations submitted by producer organizations, general farm organizations representing other producers, Qualified Programs, or other interested parties.
Twenty-nine nominations were received by USDA for the 12 Dairy Board members whose terms expired October 31, 2003. A press release issued on September 30, 2003, announced the appointment of seven new members and five incumbents. All will serve 3-year terms ending October 31, 2006. Newly appointed members were: Elizabeth I. Anderson, Onalaska, Washington (Region 1); Mary E. Cameron, Hartford, California (Region 2); Kimberly K. Clauss, Hilmar, California (Region 2); William C. Stouder, Wendell, Idaho (Region 3); Ronald G. Johnsrud, Gays Mills, Wisconsin (Region 6); James R. Bartelson, Anita, Iowa (Region 7); and Donald E. Gurtner, Fremont, Indiana (Region 9). Reappointed to serve second terms were: Charles W. Bryant, Austin, Arkansas (Region 4); Arlon E. Fritsche, New Ulm, Minnesota (Region 5); Connie M. Seefeldt, Coleman, Wisconsin (Region 6); Lewis Gardner, Galeton, Pennsylvania (Region 11); and Edgar A. King, Schuyterville, New York (Region 12).
Lists of current and former Dairy Board members appear in Appendix A. Appendix C-1 is a map of the contiguous 48 States depicting the 13 geographic regions under the Dairy Promotion and Research Order (Dairy Order).
26

Foreign Agricultural Service
The Secretary of Agriculture has delegated oversight responsibility for all foreign market development activities outside the United States to the Foreign Agricultural Service (FAS) (7 CFR 2.43(a)(24)). FAS reviews the USDEC foreign market development plan and related export contracts. USDEC export contracts also are reviewed by AMS Dairy Programs to ensure conformance with the Dairy Production Stabilization Act of 1983 (Dairy Act) and Dairy Order and with established USDA policies. In 2003, the USDA's Foreign Market Access Program and the Market Promotion Program provided matching funds to USDEC for dairy product promotion and market research in Japan, Mexico, Southeast Asia, South Korea, and Latin America.
Contracts
The Dairy Act and Dairy Order require that all contracts expending assessment funds be approved by the Secretary (7 CFR 1150.140). During 2003, Dairy Programs reviewed and approved 250 Dairy Board and DMI agreements, amendments, and annual plans. Funding approvals were from the 1999, 2000, 2001, 2002, and 2003 fiscal periods. Appendix F-1 lists the contractors and corresponding Board initiatives approved by USDA during 2003.
Contractor Audits
During 2003, DMI retained the certified public accounting firm of KPMG LLP to audit the records of the following contractors: Campbell Mithun (media and advertising); Edelman Public Relations Worldwide (public relations); Information Resources, Inc. (marketing research services); IntNet (export, through USDEC); and Olson Communications (media and advertising). DMI is implementing the audit recommendations for improving management and internal controls over contracts.
Collections
The Dairy Act specifies that persons who pay producers and producers marketing milk directly to consumers, commonly referred to as "responsible persons," shall remit assessments to the Dairy Board or to Qualified Programs for milk produced in the United States and marketed for commercial use.
The Dairy Act provides that dairy farmers can direct up to 10 cents of their 15-cent per hundredweight assessment to Qualified Programs. During 2003, the Dairy Board received about 5.11 cents of the 15-cent assessment.
Compliance
Compliance by responsible persons in filing reports and remitting assessments continues in a timely manner and at a high rate. No significant differences were discovered when comparing the audit results to what was reported by the responsible persons. The Dairy Board also verifies
27
that the credits claimed by responsible persons are actually sent to Qualified Programs. This verification is done by contract with each Qualified Program.
When noncompliance exists, the Dairy Board takes initial action on the matter. If the Dairy Board is unsuccessful in resolving the violation, the matter is referred to USDA for further action. In 2003, USDA assisted the Dairy Board in the resolution of several bankruptcies and in other collection activities related to delinquent assessments.
Qualified Programs
Dairy Programs reviewed applications for continued qualification from 59 Qualified Programs. A list of the 59 active Qualified Programs is provided in Appendix H. In line with its responsibility for monitoring the Qualified Programs, Dairy Programs obtained and reviewed income and expenditure data from each of the programs. The data reported from the Qualified Programs are included in aggregate form for 2002 and 2003 in Chapter 1.
Order Amendments
USDA announced amendments to the Dairy Order on September 2, 2003. Under the amendments, which were proposed by the Dairy Board, member representation in 4 of the 13 geographic regions of the Dairy Board was modified to better reflect current milk production in the specified regions. The implemented changes provided for more accurate representation on the board.
The Dairy Order requires that regional representation be reviewed periodically and changed when necessary to best reflect milk production volume within regions. Based on the Dairy Board's review of 2002 milk production data, Region 1 (Oregon and Washington) and Region 2 (California) each gained one board member, while Region 5 (Minnesota, North Dakota, and South Dakota) and Region 10 (Florida, Georgia, North Carolina, South Carolina, and Virginia) each lost one board member. The amendments were effective September 4, 2003.
Litigation
The Dairy Board and the Secretary of Agriculture were named as defendants in a lawsuit in the U.S. District Court for the Middle District of Pennsylvania by dairy producers seeking a declaration that the Dairy Act violates their First Amendment rights of free speech and association. In March 2003, a Federal trial court in Pennsylvania found that the Dairy Program does not violate the claimants' fight of free speech and association. Upon appeal, a three-judge panel of the U.S. Court of Appeals for the Third Circuit reversed this decision. The panel found that the Dairy Program does violate the claimants' fight of free speech and association rights by compelling them to subsidize speech with which they disagree. The Department of Justice (on behalf of the Secretary of Agriculture and Dairy Board) filed a petition for an En Banc rehearing, but the petition was subsequently denied. The Third Circuit has granted a stay of the decision.
28

National Fluid Milk Processor Promotion Board Oversight
Nominations and Appointments
The 20 members of the Fluid Milk Board serve 3-year terms, with no member serving more than two consecutive terms. The Fluid Milk Promotion Order (Fluid Order) also provides that no company shall be represented on the board by more than three representatives. Fluid Milk Board members who fill vacancies with a term of 18 months or less are permitted to serve two additional 3-year terms. Fluid Milk Board members are selected by the Secretary from nominations submitted by fluid milk processors, interested parties, and eligible organizations. In a news release issued on April 14, 2004, the Secretary of Agriculture announced three reappointments and five new appointments to the Fluid Milk Board. Reappointed to serve a second term were Rachel A. Kyllo, Minneapolis, Minnesota (Region 7); John D. Robinson, Dallas, Texas (Region 12); and James T. Wilcox HI, Roy, Washington (Region 13). Newly appointed to serve their first terms were Michael F. Touhey, Jr., Franklin, Massachusetts (Region 1); R. Bruce Matson, Newport News, Virginia (Region 4); Robert M. McCullough, San Antonio, Texas (Region 10); Randy D. Mooney, Kansas City, Missouri (At-Large Processor); and Patricia C. Romero, Irvine, California (At-Large Public). The reappointed and newly appointed members were seated at the July 15-17, 2004, Fluid Milk Board Meeting. The terms for all appointees except Region 12 will expire on June 30, 2007. The term for Region 12 will expire June 30, 2006.
Four vacancies occurred on the Fluid Milk Board due to resignations. The positions were vacated by Peter M. Ross, Franklin, Massachusetts (Region 1); Lawrence V. Jackson, Pleasanton, California (Region 12); Ronald M. Foster, Modesto, California (Region 14); and Richard Walrack, City of Industry, California (Region 15). The vacancies were filled by Michael F. Touhey, Jr., Franklin, Massachusetts; John D. Robinson, Dallas, Texas; Jerry N. Tidwell, Walnut Creek, California; and Paul W. Bikowitz, City of Industry, California, respectively.
A list of current and past Fluid Milk Board members appears in Appendix B. Appendix C-2 shows a map depicting the 15 geographic regions under the Fluid Milk Order.
Program Development
The Fluid Milk Board contracted with the International Dairy Foods Association (IDFA) to manage the program. IDFA contracted with Lowe Worldwide, Siboney Inc., Weber Shandwick, Inc., and Flair Communications, Inc., to develop the Fluid Milk Board's teen and mom advertising, Hispanic advertising and public relations, consumer education/public relations, and promotion programs, respectively. Additionally, IDFA contracted with Draft Worldwide in late 2003 for promotion activities.
Contractor Audits
The Fluid Milk Board retained the certified public accounting firm of Synder, Cohn, Collyer, Hamilton & Associates P.C. to audit the records of Flair Communications, Inc., in order to
29

determine if the agency had conformed to the financial compliance requirement specified in its agreement with the Board for the period of January 1, 2002, through December 31, 2002. A final audit report had not been issued at the time of printing this report. The Board continues to enhance its internal contract control system in order to ensure that the amounts invoiced to the Board are in compliance with established contracts and procedures.
Compliance
Compliance by fluid milk processors in filing reports and remitting assessments continues in a timely manner and at a high rate. During this fiscal period, no new cases of delinquent accounts have been referred to USDA.
30

Chapter 3 Impact of Generic Fluid Milk and Dairy Advertising and Promotion on
Dairy Markets: An Independent Analysis
The Dairy Production and Stabilization Act of 1983 (Dairy Act; 7 U.S.C. 4514) and the Fluid Milk Promotion Act of 1990 (Fluid Milk Act; 7 U.S.C. 6407) require a yearly independent analysis of the effectiveness of milk industry programs. These promotion programs operate to increase milk awareness and thus the sale of fluid milk and related dairy products. From 1984 through 1994, USDA was responsible for the independent evaluation of the Dairy Program, as authorized by the Dairy Act, and issued an annual Report to Congress on the effectiveness of the Dairy Program. Beginning in 1995, the Congressional report began including third-party analyses of the effectiveness of the Dairy Program in conjunction with the National Fluid Milk Processor Promotion Program (Fluid Program) authorized by the Fluid Milk Act. Since 1998, these independent analyses have been conducted by agricultural economists from Cornell University.
While both programs utilize various types of marketing strategies to increase fluid milk and cheese consumption, the first section of this chapter focuses solely on media advertising impacts since advertising remains an important marketing activity. The effects of fluid milk advertising under both programs are combined because the objectives of both programs are the same, and data cannot be satisfactorily segregated to evaluate the two programs separately. An evaluation of the effectiveness of cheese advertising by the Dairy Program is conducted separately.
The second section of this chapter adopts a new modeling approach to account for both generic advertising and other nonadvertising promotion expenditures in relation to combined fluid milk and cheese demand enhancement. While the available data are more limited, the supplemental modeling work provides a more complete model of all funded promotion activity.
Highlights
Generic fluid milk and dairy product advertising conducted under the Dairy and Fluid Programs had a major impact on dairy markets. Over the period 1999-2003, on average, the following market impacts would have occurred if the advertising under the Fluid Program had not been in effect, and advertising under the Dairy Program had been equal to its level the year prior to the
1 enactment of that national mandatory program:
• Fluid milk consumption would have averaged 4.5 percent lower annually.
• Cheese consumption would have averaged 1.2 percent lower annually.
i It is important to note that some States conducted generic milk and cheese advertising prior to passage of the Dairy Production and Stabilization Act of 1983, which authorized the Dairy Program. As such, to measure the advertising impacts of the Dairy Program, this study simulated and compared market conditions with the Dairy Program versus market conditions reflecting advertising funding levels prior to enactment of the Dairy Program. Throughout this report, any scenario referring to the absence of the Dairy Program reflects advertising funding at levels prior to enactment of the Dairy Program.
31
• Total consumption of milk in all dairy products would have averaged 2.0 percent lower annually, or roughly 3.4 billion pounds on a milkfat equivalent basis.
• The average price received by dairy farmers would have averaged 7.6 percent, or $1.01 per hundredweight, lower annually.
• Commercial milk marketings by dairy farmers would have averaged 2.1 percent lower annually.
Over the same period, the following market impacts would have occurred if the Dairy Program had not been in existence but the Fluid Program had been, and advertising expenditures by dairy farmers were equal to the level that existed the year prior to enactment of the Dairy Program:
• Fluid milk consumption would have averaged 0.6 percent lower annually.
• Cheese consumption would have averaged 1.8 percent lower annually.
• Total milk consumption of all dairy products would have averaged 0.9 percent lower annually, or roughly 1.5 billion pounds on a milkfat equivalent basis.
• The average price received by dairy farmers would have averaged 2.9 percent, or $0.39 per hundredweight, lower annually.
• Commercial milk marketings by dairy farmers would have been 1.0 percent lower annually.
An average benefit-cost ratio (BCR) for the Dairy Program was estimated for the period 1999- 2003 for both advertising and all demand-enhancing marketing activities. The results indicated
that:
• The average BCR for the Dairy Program relative to the generic advertising program was 6.58, i.e., each dollar invested in fluid milk and cheese advertising returned $6.58 in revenue to dairy farmers on average.
• The average BCR for the Dairy Program relative to all marketing activities (advertising and nonadvertising promotion activities) was 4.61, i.e., each dollar invested in the aggregate marketing program returned $4.61 in revenue to dairy farmers on average.
32

Section h Analysis of Fluid Milk and Cheese Advertising
Most economic models used to evaluate the effects of generic advertising programs over time measure the average impacts of various factors on demand. These "constant-parameter" models may be problematic when the time period covered is relatively long and/or the marketing environment has sufficiently changed over time. For example, this report is based on data since 1975; consequently, constant parameter demand models would estimate (among other variables) the effect of generic fluid milk and cheese advertising as an average point estimate over the 29- year period ending in 2003. Depending on the research objectives, mean-response estimates are entirely appropriate; however, a mean-response model may not accurately convey the current degree of advertising effectiveness if sufficient changes have occurred in market environments, population profiles, and eating behavior over time. In addition, advertising messages have changed, two national programs have been instituted more than a decade apart, and State and regional programs have become more coordinated since the inception of the generic advertising programs.
An alternative approach to measuring the impacts of advertising, given a long history of time series data, is to use a "time-varying parameter" model. This type of model measures how the impact of demand factors, including generic advertising, varies over time. Similar to the approach of last year, this year's economic study adopts such a model. Thus, the analysis examines how the general effectiveness of generic fluid milk and cheese advertising has changed over time and identifies important factors that have influenced the changes in advertising effectiveness over time.
In order to simulate the impacts of generic advertising over time, the retail demand impacts must be measured along with other appropriate processor and farm market supply-side responses. The model embodies a significant level of disaggregation of the U.S. dairy industry. For instance, the dairy industry is divided into retail, wholesale (processing), and farm markets, and the retail and wholesale markets include fluid milk and cheese separately. This report emphasizes the results of the demand model. The model simulates market conditions with and without the Dairy and Fluid Programs.
Factors Affecting the Demand for Fluid Milk and Cheese
Because there are many factors that influence the demand for fluid milk and cheese besides advertising, an econometric model was used to identify the effects of individual factors affecting the demand for these products. The following variables were included as factors influencing per capita fluid milk demand: the Consumer Price Index (CPI) for fluid milk, the CPI for nonalcoholic beverages used as a proxy for fluid milk substitutes, per capita disposable income, the percentage of the U.S. population less than 6 years old, the percentage of the U.S. population that is African American, variables to capture seasonality in fluid milk demand, a trend variable to capture changes in consumer tastes for fluid milk over time, expenditures on branded fluid milk advertising, and expenditures on generic fluid milk advertising.
33

The following variables were included as factors influencing per capita cheese demand: the CPI for cheese, the CPI for meat used as a proxy for cheese substitutes, per capita disposable income, per capita food away from home (FAFH) expenditures, the percentage of the U.S. population that is ethnically Hispanic or Asian; the percentage of the U.S. population between 20 and 44 years old, variables to capture seasonality in cheese demand, a trend variable to capture changes in consumer tastes for cheese over time, expenditures on branded cheese advertising, and expenditures on generic cheese advertising.
The model was estimated with national, quarterly data from 1975 through 2003. To account for the effects of inflation, all prices and income were deflated. Branded and generic fluid milk and cheese advertising expenditures were deflated by a media cost index computed from information supplied by DMI on annual changes in advertising costs by media type. Because advertising has a carry-over effect on demand, past advertising expenditures also were included in the model as explanatory variables using a distributed-lag structure.
Unlike constant-parameter models, which measure the average impact of each factor on milk and cheese demand, the time-varying parameter model used in this report measures each demand factor's impact on a quarterly basis. Moreover, the model used here is able to identify the factors that were most important to the variation of advertising response over time. The model not only allows measurement of the magnitude of each demand factor, but also estimates changes in the magnitude and the causes of changes over time. The generic advertising parameter estimates are compared both across time and across products.
The relative impacts of variables affecting demand can be represented with what economists call "elasticities." Elasticities measure the percentage change in per capita demand given a one- percent change in one of the identified demand factors. Table 3-1 provides selected average
Table 3-1. Average Elasticity Values (1999-2003) for Factors Affecting the Retail Demand for
Fluid Milk and Cheese?
Demand Factor Fluid Milk Cheese
Retail price -0.098*
Per capita income 0.536*
Per capita food-away-from-home expenditures n.a.
Percent of population age < 6 0.794*
Percent of population age 20-44 n.a.
Percent of population African American -0.373**
Percent of population Hispanic/Asian n.a.
Generic advertising 0.037*
-0.272*
0.514"
0.118"
n . a .
0.290**
n . a .
0.758*
0.035*
Example: A 1.0 percent increase in the retail price of cheese is estimated to reduce per capita sales of cheese by 0.272 percent. Note: n.a. means not applicable. For more information on the data used to estimate these elasticities, see Table 3-5. *Statistically significant at the 10 percent significance level or less. **Statistically significant at the 15 percent significance level.
34

elasticities over the most recent 5-year period. For example, the price elasticity of demand for cheese equal to -0.272 means that a one-percent increase in the real, inflation-adjusted, cheese price decreases per capita cheese quantity demanded by 0.272 percent.
Based on the computed elasticities, the most important factors influencing per capita fluid milk demand are: (1) the percentage of the population under 6 years of age, (2) per capita disposable income, and (3) the percentage of the population that is African American. Similarly, the most important factors influencing per capita cheese demand include: (1) the percent of the population that is ethnically Hispanic or Asian, (2) per capita disposable income, (3) the retail cheese price, (4) the percent of the population that is 20-44 years of age, and (5) per capita expenditures on FAFH.
The relative amount of variation in these elasticities over time differs by demand factor. While Table 3-1 presents these elasticities evaluated over the most recent 5-year time period, the forthcoming discussion will also elaborate on how these elasticities have varied over time. Although the principal focus of this report is on generic advertising elasticities for fluid milk and cheese, we briefly explore time-varying response levels for selected demand variables as well.
Price
The demand response for fluid milk to changes in real prices has been consistently inelastic; i.e., consumers are relatively insensitive to changes in price. Given the nature of the product as a staple, this is expected. The estimated elasticities have increased from -0.050 early in the sample time period to a peak of around -0.114 in the early 1990s. Modest reductions have occurred since with a current 5-year average of -0.098 (Figure 3-1). The implication of price elasticities at or below -0.114 is that fluid milk demand has consistently been insensitive to real price changes over time, which is a result consistent with the majority of empirical studies of fluid milk demand.
Price elasticities for cheese have shown a modestly declining trend over time, indicating consumers are becoming less responsive to changes in price; however, elasticity estimates are well above those estimated for fluid milk and have been increasing more recently (Figure 3-1). The mean-response estimate o f -0 .272 in Table 3-1 can be compared with levels around -0.360 in the late 1980s, and -0.330 in the late 1970s. The current annual price elasticity of demand for 2003 is -0.289; i.e., a 1.0 percent increase in the real cheese price results in a 0.289 percent decrease in per capita cheese disappearance. As Figure 3-1 demonstrates, the margin between the levels of price response between fluid milk and cheese over time has decreased from around 0.30, early in the sample time period, to around 0.20 currently.
Income
Income elasticities for fluid milk had relatively strong growth early in the sample time period but have been modestly declining over the last few years (Figure 3-2). The current income elasticity estimate for fluid milk is slightly below the 5-year average estimate in Table 3-1. In 2003, a 1.0 percent increase in disposable (inflation-adjusted) income resulted in an average 0.522
35

0.40
,,-, 0.35 e.a
"~ 0.30 > ¢.a *~ 0.25
.~ 0.20
.<
~0.15
0.10
[] 0.05
0.00
Figure 3-1. Annual Price Elasticities for Fluid Milk and Cheese
o o
Year I-'- luid milk - * - Cheese ]
percent increase in per capita fluid milk demand. Five-year response estimates indicate that a 1.0 percent increase in real per capita disposable income will increase per capita cheese demand by 0.514 percent (Table 3-1). Relative to fluid milk, income elasticities for cheese have trended downward and have been less variable (Figure 3-2). In fact, the gradual downward trend in income elasticities for cheese, combined with the increasing trend for fluid milk early in the sample period, has resulted in income elasticity estimates that are roughly equivalent. Stronger levels of income response, compared to that of price, may be indicative of gains in disappearance from purchases of more value-added products, relative to reactions to price changes of products in general. While still inelastic, relatively strong income elasticities for fluid milk and cheese are intuitively attractive to future changes in per capita disappearance as real income levels have continued to rise.
Age Demographics
While the youngest-age cohort in the United States still remains an important factor affecting fluid milk demand, this elasticity has declined from approximately 1.000 in 1994 to a current value of approximately 0.735 (Figure 3-3). The 5-year mean-response estimate of 0.794 in Table 3-1 is indicative of the historically strong demand component from this young age cohort. The current elasticity estimate implies that for every 1.0 percent decline in the proportion of the U.S. population under the age of six, there is a 0.735 percent decrease in per capita fluid milk demand (Figure 3-3). Of all factors included in the model, this was the most important in terms of effects on fluid milk demand.
36

i
1.00 0.90
0.80
0.70
0.60
0.50
0.40
0.30 I 0.20
0.10 j
0.oo r - . . .
G - %
Figure 3-2. Annual Income Elasticities for Fluid Milk and Cheese
I
i i i i i i i J i p i i i i i i i i r i
O
Year
Fluid Milk + C h e e s e I
As hypothesized, the middle-aged population cohort (ages 20 through 44) was shown to be positively correlated with per capita cheese disappearance (0.290), though with a somewhat lower level of statistical significance (TabIe 3-1). 2 However, the time-varying results do demonstrate continued modest gains in this cohort effect over time, albeit relatively stable since 2000 (Figure 3-3).
Race/Ethnicity Demographics
The lower per capita fluid milk demand of African Americans relative to the rest of the population is well recognized. The demand elasticity in Table 3-1 indicates that a 1.0 percent increase in the proportion of the population that is African American has resulted in an average decrease in per capita fluid milk demand of -0 .373 percent; however, the degree of statistical confidence is somewhat lower. Modest reductions in the impact of this factor have occurred since the mid-1990s, offsetting some of the gains in its impact through the 1980s (Figure 3-4). The current demand elasticity of -0 .336 for this cohort proportion is similar to the 5-year mean estimate.
The impact of changes in the Hispanic and Asian populations was strongly correlated with increases in per capita cheese disappearance. On average, a 1.0 percent increase in percent of the population identified as Hispanic or Asian increased per capita cheese disappearance by
a The level of significance can generally be interpreted as a confidence measure. For example, at the 10 percent significance level, we are 90 percent confident (100-10) that the estimate is statistically different from zero. As such, the lower the significance level, the higher the degree of confidence in the empirical estimates.
37

° . N
N
Figure 3-3. Annual Age Composition Elasticities for Fluid Milk and Cheese
1.20
1.00 J
0.80 t
0.60 1
0.40 ? \ \
0 . 0 0 . . . . . . . . . . . . . . . .
-0.20 I ~ O', O ~, C', ~ ~ G', C'~ G', G', C', 0 0
Year
[ + F l u i d Milk, Age < 6 ~ Cheese, Age 20-44 1
0.758 percent over the past 5 years (Table 3-1). The strong growth in elasticity estimates is due in part to the consistently strong growth in this cohort population since 1990 (Figure .3-4). Of all factors considered in the cheese demand model, this was the most important in terms of magnitude of effects on demand.
Food Spending Behavior
Given that approximately two-thirds of national cheese disappearance is consumed in sectors away from home, it is not surprising that per capita expenditures on FAFH are related to commercial per capita cheese disappearance. On average, a 1.0 percent increase in per capita expenditures on FAFH resulted in a 0.118 percent increase in cheese demand over the last 5 years (Table 3-1). The positive contribution to per capita disappearance is largely captured by cheese usage in restaurants, particularly in fast-food businesses with burger, taco, and pizza products. The overall impact of FAFH expenditures to per capita cheese disappearance has been decreasing due, in part, to a flattening of real per capita FAFH expenditures since the early 1990s. This factor may also continue to decrease in importance as fast-food establishments react to negative press about their menus and as cheese prices rise.
38

Figure 3-4. Annual Race Elasticities for Fluid Milk and Cheese
1.00
0.80 j / ' k ~ . . a
0 . 6 0
0.40 -
o. o! . ,
0.00
-0.20
-0.40
_o.6o F
Year
- t ~ Fluid Milk, African American --a--Cheese, Hispanic/Asian
Advertising Effects
Branded advertising expenditures for both fluid milk and cheese did not significantly contribute to total per capita disappearance. While any advertising objective includes increasing sales, branded advertising efforts heavily concentrate their efforts on gaining market share from their competitors. Branded fluid milk advertising expenditures are relatively small compared to their generic counterparts; however, cheese has considerably more branded advertising expenditures. In any event, neither demand model exhibited a response on total per capita disappearance that was significantly different from zero.
While branded advertising efforts did not demonstrate significant impacts on overall demand, generic advertising was positive and significant for both fluid milk and cheese demand (Table 3-1). 3 Five-year average generic advertising elasticities for fluid milk and cheese show only a modest difference of 0.037 for fluid milk and 0.035 for cheese; however, elasticity estimates for both products have shown substantial variation over time (Figure 3-5). Generic advertising elasticities for cheese, in particular, have shown reasonably strong growth over time,
3 It is hypothesized that advertising of pizza and cheeseburgers has a positive effect on the consumption of cheese. Such variables were not included in the model due to a lack of data. Assuming that pizza and cheeseburger advertising has a significantly positive effect on cheese consumption, omission of these variables could result in the impact of generic cheese advertising's being somewhat overstated.
39

0.05
Figure 3-5. Annual Generic Advertising Elasticities for Fluid Milk and Cheese
0.06
i 0.04
0.03
0.02
0.01
0.00
e , 9
i n + i + I I + l c l i + d t c I I n + k ~ n I i
p-- O0 O0 O0 O0 O0 + + ~ ~ ~ + O
Year --1.- Fluid milk + Cheese ]
while strong gains in fluid milk advertising response through the early 1990s have been largely offset by reductions in the latter half of the 1990s. 4
Both products demonstrated significant increases in generic advertising elasticities up to the early to mid-1990s. However, since 1993, fluid milk generic advertising elasticities have shown a decreasing trend, albeit a relatively flat one since 1996 (Figure 3-5). With the exception of two more pronounced spikes in 1994 and 1999, generic cheese advertising elasticities have gradually trended upwards over the entire sample period and ranged from 0.004 to 0.039. While the increase in 1999 (due mostly to an abrupt increase of the population proportion of Hispanic and Asians in the data) was not statistically significant, the increase in 1994 was significant and reflects a sizable decrease in real per capita FAFH expenditures. Currently, the generic advertising elasticity for cheese is 0.034.
Fluid milk genetic advertising elasticities increased from around 0.029 at the beginning of the sample period to 0.051 in 1992. Growth in advertising elasticities over this time was due in large part to strong gains in the population proportion of the youngest age cohort, a strong demand component, and a primary marketing target (including parents of young children) of the
4 Recall that the econometric model hypothesizes that changes in market and demographic environments will affect the level of response to generic advertising. The relative change in generic advertising response then depends on both the signs and relative sizes of the parameter estimates and changes in the levels of the market and demographic variables. We highlight briefly some of the contributing factors here in relation to Figure 3-5, with a further discussion later identifying the important factors affecting changes in generic advertising response over time.
40

advertising programs. Reductions in the mid- to late 1990s reflect, in large part, reductions in this cohort's population proportion over time. Currently, the fluid milk generic advertising elasticity is 0.039.
The historical gap between the generic advertising elasticities for the two products is no longer apparent. Previous constant-parameter studies have consistently shown generic advertising elasticities for cheese demand below that for fluid milk demand. Average estimates of the time- varying response levels here over the entire sample period would be consistent with those results. Statistical tests were performed to see what differences in estimates are significantly different from zero across products and across time since 1990. We summarize those results here.
First, we compare whether the fluid milk and cheese generic advertising elasticities are statistically different. Comparing the differences in elasticities since 1990, the large gap that existed from 1990-1996 statistically holds up, i.e., fluid milk generic advertising elasticities were statistically above those of their cheese counterparts. Since 1997, however, the levels of generic advertising response between fluid milk and cheese have not been statistically different from one another.
Now we compare how significant changes in the levels of elasticities are for both products over time. In general, more recent changes in advertising response (i.e., since 1994 for fluid milk and since 1993 for cheese) are not statistically different from one another. However, clear differences exist between response levels in the early 1990s.
Generic advertising elasticities for fluid milk began to drop significantly after 1994. However, in 1995 real fluid milk advertising expenditures, while offset some by shifts to genetic cheese advertising, increased with the addition of advertising expenditures from the milk processor promotion program. Since that time, the changes in fluid milk advertising response have flattened out considerably, and in fact, the visual decline evident from Figure 3-5 since 1994 is not statistically significant. Generic cheese advertising elasticities have shown strong growth since 1990 and, while changes since 1993 are not statistically significant, there exist significant differences from the beginning of the decade to currently.
Factors Affecting Generic Advertising Effectiveness
Allowing advertising response to vary over time is important, but knowing what factors contributed to that variation, and by how much, provides valuable information for crafting future strategies, changing the advertising focus, or altering preferred target audiences. The model used in this study allows not only for advertising response to vary over time, but also provides information on the relative importance of factor variability that determines changes in advertising response levels.
We can derive these impacts mathematically from the time-varying parameter model specification, and we refer to them as generic advertising response elasticities (GARE). That is, we can derive the percentage change in the long-run generic advertising elasticity with respect to a change in the level of another variable. For example, how are generic advertising elasticities
41
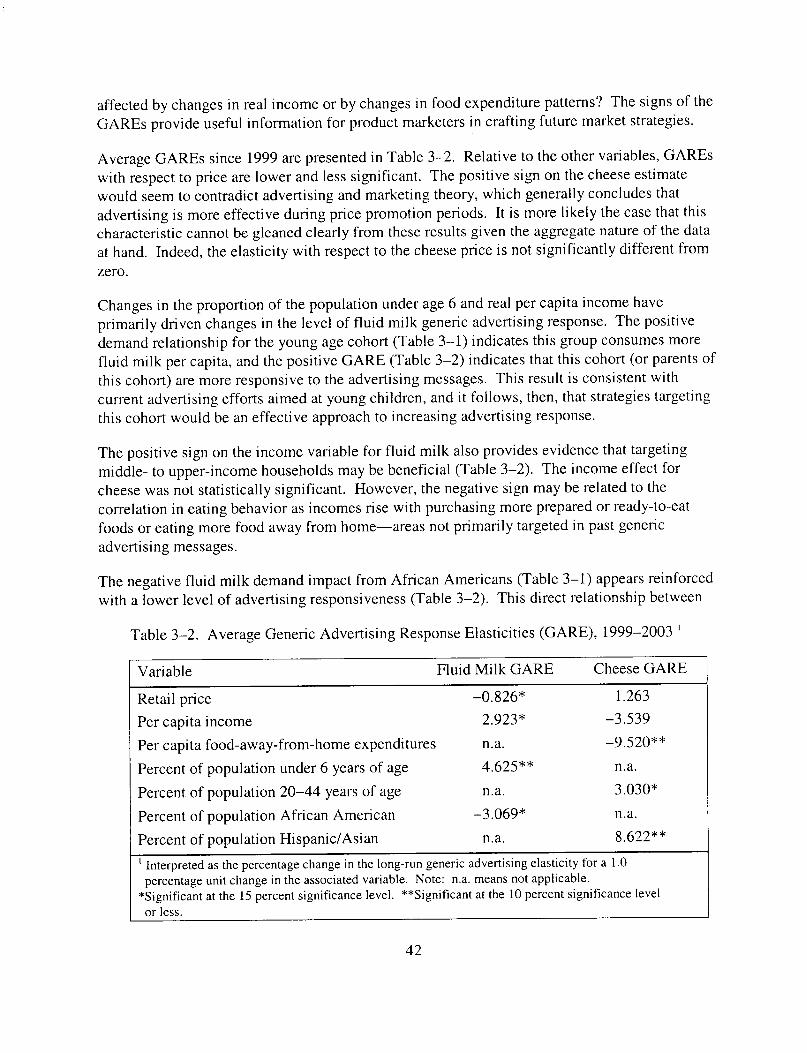
affected by changes in real income or by changes in food expenditure patterns? The signs of the GAREs provide useful information for product marketers in crafting future market strategies.
Average GAREs since 1999 are presented in Table 3-2. Relative to the other variables, GAREs with respect to price are lower and less significant. The positive sign on the cheese estimate would seem to contradict advertising and marketing theory, which generally concludes that advertising is more effective during price promotion periods. It is more likely the case that this characteristic cannot be gleaned clearly from these results given the aggregate nature of the data at hand. Indeed, the elasticity with respect to the cheese price is not significantly different from
zero.
Changes in the proportion of the population under age 6 and real per capita income have primarily driven changes in the level of fluid milk generic advertising response. The positive demand relationship for the young age cohort (Table 3-1) indicates this group consumes more fluid milk per capita, and the positive GARE (Table 3-2) indicates that this cohort (or parents of this cohort) are more responsive to the advertising messages. This result is consistent with current advertising efforts aimed at young children, and it follows, then, that strategies targeting this cohort would be an effective approach to increasing advertising response.
The positive sign on the income variable for fluid milk also provides evidence that targeting middle- to upper-income households may be beneficial (Table 3-2). The income effect for cheese was not statistically significant. However, the negative sign may be related to the correlation in eating behavior as incomes rise with purchasing more prepared or ready-to-eat foods or eating more food away from home--areas not primarily targeted in past generic
advertising messages.
The negative fluid milk demand impact from African Americans (Table 3-1) appears reinforced with a lower level of advertising responsiveness (Table 3-2). This direct relationship between
Table 3-2. Average Generic Advertising Response Elasticities (GARE), 1999-2003
Variable Fluid Milk GARE Cheese GARE
Retail price
Per capita income
Per capita food-away-from-home expenditures
Percent of
Percent of
Percent of
Percent of
population under 6 years of age
population 20-44 years of age
population African American
population Hispanic/Asian
-0.826" 1.263
2.923* -3.539
n.a. -9 .520"*
4.625** n.a.
n.a. 3.030*
-3.069* n.a.
n.a. 8.622**
t Interpreted as the percentage change in the long-run generic advertising elasticity for a 1.0 percentage unit change in the associated variable. Note: n.a. means not applicable.
*Significant at the 15 percent significance level. **Significant at the 10 percent significance level or less.
42

demand and advertising response impacts is also demonstrated by the Hispanic/Asian variable for cheese. The combined Hispanic and Asian population proportion has increased over 9 percent since 1999, and it appears that this segment of the population is more responsive to the advertising message. Targeting these race and ethnic cohorts would seem an effective strategy to increase the level of generic cheese advertising response.
The positive GARE for the middle-aged cohort for cheese indicates this to be a preferred population segment at which to target advertising programs, as with the youngest age cohort for fluid milk. However, the direct relationship between demand response and advertising response does not appear to hold for households consuming cheese away from home, i.e., as consumers spend more on food eaten away from home, generic cheese advertising elasticities fall (Table 3-2). While a large share of cheese disappearance is in the FAFH sector, nearly all generic cheese advertising is focused on at-home consumption. As such, it is reasonable to expect that as consumers spend more of their budget away from home, the current generic cheese advertising message becomes less effective or is at least less correlated with total cheese consumption. If per capita FAFH expenditures are expected to increase in the future, then shifting generic cheese advertising toward the away-from-home market may be appropriate.
Impact of the Dairy and Fluid Milk Advertising Programs
To evaluate market impacts of the Dairy and Fluid advertising programs, the economic model was simulated over a 5-year time period from 1999 through 2003. These two programs are complementary in that they share a common objective--to increase fluid milk sales. To accomplish this objective, both programs invest in generic fluid milk advertising, which is different from brand advertising in that the goal is to increase the total market for fluid milk rather than a specific brand's market share. In the evaluation of the programs, it is assumed that a dollar spent on fluid milk advertising by dairy farmers has the same effect on demand as a dollar spent by processors on fluid milk advertising, since both programs have identical objectives. The Dairy Program additionally has an objective to expand the market for cheese. Accordingly, part of its budget is directed to generic cheese advertising.
To examine the impacts that the two advertising programs had on the markets for fluid milk and cheese over this period, the economic model was initially simulated under two scenarios based on the level of generic advertising expenditures: (1) a baseline scenario, in which generic advertising levels were equal to actual generic advertising expenditures under the two programs, and (2) a no-national programs scenario, where there was no fluid milk processor-sponsored advertising, and dairy farmer-sponsored advertising was reduced to 42 percent of actual levels to reflect the difference in assessment before and after the national programs were enacted. A comparison of these scenarios provides a measure of the combined impacts of the two programs. 5
5 In order to conduct the market simulation, supply equations were estimated at the farm level and retail and wholesale levels for fluid milk and cheese. The supply equations, t ime-varying parameter demand equations for fluid milk and cheese, and identifying restrictions to close the model were included in the market simulation.
43
Table 3-3 presents the annual averages for supply, demand, and price variables over the period 1999-2003 for the two scenarios. Generic advertising by the Dairy and Fluid Programs has had a positive impact on fluid milk consumption over this period. Specifically, fluid milk consumption would have been 4.5 percent lower had the two national advertising programs not been in effect. Likewise, generic cheese advertising under the Dairy Program had a positive impact on cheese consumption, i.e., consumption would have been 1.2 percent lower without generic advertising. Consumption of milk used in all dairy products would have been 2.0 percent lower had these two programs not been in effect.
Generic advertising by dairy farmers and milk processors had an effect on the farm milk price and milk marketings. The simulation results indicate that the all-milk price would have been $1.01 per hundredweight lower without generic advertising provided under the two programs. The farm milk price impacts resulted in an increase in farm milk marketings. That is, had there not been the two advertising programs, farm milk marketings would have been 2.1 percent lower due to the lower milk price.
A third scenario was subsequently simulated to measure the market impacts of the advertising program supported by the 15-cent checkoff program by dairy farmers. This scenario assumes that the advertising program operated by the fluid milk processors is still in effect. As in the earlier scenario, advertising expenditures by dairy farmers were reduced to 42 percent of actual levels to reflect the situation prior to the enactment of the Dairy Program. A comparison of this third scenario with the baseline scenario gives a measure of the advertising market impacts of the current mandatory Dairy Program.
The last two columns of Table 3-3 present the results of this scenario. Had there not been fluid milk and cheese advertising sponsored by dairy farmers, fluid milk demand would have been 0.6 percent lower, cheese demand would have been 1.8 percent lower, and total milk demand would have been 0.9 percent lower than it actually was. Advertising under the Dairy Program also had a significant impact on the farmer milk price. The simulation results indicate that the all-milk price would have been $0.39 per hundredweight lower without generic advertising by the Dairy Program. Finally, farm milk marketings would have been slightly lower (1.0 percent) in the absence of the Dairy Program. Table 3-5 presents a description of variables used in the model.
Benefit-Cost of Advertising by the Dairy Program
One way to measure whether the benefits of a program outweigh the cost is to compute a benefit- cost ratio (BCR). A BCR can be computed as the change in net revenue due to advertising divided by the cost of advertising. While a BCR for producers can be estimated for the Dairy Program, it cannot be computed at this time for milk processors with the Fluid Program because data on packaged fluid milk wholesale prices, which are necessary in calculating processor net revenue, are proprietary information and not available.
The BCR for the Dairy Program was calculated as the change in dairy farmer net revenue (what economists call "producer surplus") due to the demand enhancement from advertising under the
44

Table 3-3. Simulated Impacts of the Dairy and Fluid Milk Programs on Selected Market Variables, Annual Average 1999-2003
4~ t . J l
Baseline Scenario I
Market Variable Unit Level
Bil lbs 55.3
Bil lbs MFE 70.5
Bil lbs 164.1
$/cwt 11.45
$/cwt 13.25
bil lbs 167.2
$ per $1
Fluid Milk Demand
Cheese Demand
Total Dairy Demand
Basic Formula Price
All Milk Price
Milk Marketings
Benefit-Cost Ratio 4
No National Program Scenario 2
Level % Difference
No Dairy Program Scenario 3
Level % Difference
55.0 -0.6
69.2 -1.8
162.6 -0.9
11.07 -3.3
12.86 -2.9
165.6 -1.0
6.58
52.8 -4.5
69.6 -1.2
160.7 -2.O
10.55 -7.8
12.24 -7.6
163.5 -2.1
1 Baseline scenario reflects the current operation of the Dairy and Fluid Milk Programs. 2 No National Program Scenario reflects no Fluid Milk Program and Dairy Program advertising at prenational program spending levels. 3 No Dairy Program Scenario reflects current Fluid Milk Program and Dairy Program advertising at prenational program spending levels. 4 Benefit-cost ratio computed for the Dairy Program only.

Dairy Program divided by the advertising c o s t s . 6 The demand enhancement reflects increases in quantity and price as a result of the advertising program. Direct media advertising expenditures are used in the demand model (i.e., air time, print space, and other direct media costs) as a proxy for advertising exposure to consumers. However, to appropriately reflect the true complete costs of the advertising program and compute a return to producers who fund the advertising efforts, it is necessary to incorporate expenses that reflect general administration, overhead, and advertising production costs. Following conversations with staff at DMI and a review of Dairy Programs budgets, direct media expenditures were prorated upward by a factor of 1.25. The results show that the average BCR for the Dairy Program was 6.58 for the 1999 through 2003 period. This means that each dollar invested in generic fluid milk and cheese advertising by dairy farmers during the period returned $6.58, on average, in revenue to farmers.
Another way to interpret this figure is as follows. The increase in generic advertising expenditures resulting from the Dairy Program cost dairy producers an additional $61 million per year on average (i.e., the difference between $107 million annually under the baseline scenario and $46 million under the no Dairy Program scenario.) The additional fluid milk and cheese advertising resulted in higher demand, prices, and net revenue for dairy producers nationwide. Based on the simulations conducted, it is estimated that the average annual increase in producer surplus (reflecting changes in both revenues and costs) due to the additional advertising under the Dairy Program was $402 million. Dividing $402 million by the additional advertising costs of $61 million results in the BCR estimate of 6.58.
The level of this BCR suggests that the generic advertising program supported by dairy farmers has been a successful investment. Questions often arise with respect to the accuracy of these BCR estimates, especially in relation to recent low commodity prices and financial stresses faced by producers. BCRs are generally large because advertising expenditures in relation to product value are small and, as such, only a small demand effect is needed to generate positive returns. For example, the change in advertising expenditures above is less than 0.5 percent of the value of farm milk marketings. An increase in generic advertising increased producer net revenue by over $400 million per year but still represents only about 2 percent of the value of farm milk production. The advertising activity resulted in modest gains in total milk utilization and a positive effect on milk prices, resulting in positive net revenue to the advertising investment. While the positive price effects were not sizable enough to sufficiently counter low prices recently received by dairy farmers, generic advertising did improve demand and prices to dairy farmers relative to a non-advertising scenario, providing a return on the investment that clearly supports the program.
Section Ih Analysis of All Demand-Enhancing Activities
The above analysis evaluated the generic fluid milk and cheese advertising programs, which have historically been the most important marketing activity invested in by dairy farmers and milk
6 "Net revenue" can be defined as the aggregate revenue gains from price and product disappearance enhancements less the increased supply costs.
46

processors. However, an increasing trend toward investment in nonadvertising promotion activities (NAPA) has occurred over the past 2 years (particularly in the Dairy Program). Thus, it is becoming increasingly important to take NAPA into account when evaluating the Fluid and Dairy Programs. Historically, a lack of adequate data has prevented a more encompassing analysis of promotion efforts. Additional efforts to acquire the needed data were pursued this year, and it is expected that as the length of the time frame of available data continues, the modeling results and analysis will be improved.
To account for both generic advertising and NAPA, a combined fluid milk-cheese demand model was estimated that included all demand-enhancing marketing activities as one of the demand determinants] As was the case before, per capita commercial disappearance of fluid milk and cheese was used to represent dairy demand. Expenditures for the following marketing activities were aggregated into one variable assumed to impact fluid milk and cheese demand: total dairy farmer expenditures for generic milk and cheese advertising, public relations, nutrition education, and the Unified Marketing Plan; and total milk processor expenditures for generic milk advertising, public relations, and promotions, s In addition, the following variables were included as factors influencing combined per capita fluid milk and cheese demand: (CPI) for all dairy products, per capita disposable income, variables to capture seasonality in dairy product demand, and per capita FAFH.
The model was estimated with national, quarterly data from 1990 through 2003. To account for the impact of inflation, all monetary variables were deflated by the CPI for all items. Unlike the time-varying parameter model used to estimate the advertising impacts, a constant-parameter model was used to estimate the aggregate fluid milk and cheese demand equation. The constant- parameter model is appropriate here since a relatively short period of time series data was used in this analysis, unlike the analysis of advertising which used data going back to 1975.
Table 3-4 provides selected elasticities for the combined fluid milk-cheese demand model. The results are similar to those found in the time-varying parameter models for fluid milk and cheese, and all demand elasticities were statistically significantly different from zero. The most important factor in the model impacting per capita disappearance of milk and cheese was the retail price of dairy products. The average price elasticity over the time period of 1990 through 2003 was -0.392, i.e., a 1.0 percent increase in the retail price of dairy products resulted in a 0.392 percent decrease in per capita quantity demanded for fluid milk and cheese products. Per capita FAFH expenditures also had a significant impact on demand. The results indicated that a 1.0 percent increase in per capita FAFH expenditures resulted in a 0.289 percent increase in fluid milk and cheese demand. Thus, the trend toward eating away from home has helped increase total consumption of dairy products. Income had a smaller impact on per capita fluid milk and
7 Well over 90 percent of the combined marketing budgets by dairy farmers and milk processors are spent on fluid milk and cheese advertising and promotion activities. Hence, focusing on these two commodities is sufficient for evaluating the overall marketing effort of the Dairy and Fluid Programs.
s The Unified Marketing Plan represents an advertising and promotion marketing plan coordinated by DMI that receives designated funding from the State, local, and regional dairy product promotion organizations as part of their joint efforts.
47

Table 3-4. Average Elasticity Values (1990-2003) for Factors Affecting the Combined Retail Demand for Fluid Milk and Cheese
Variable Elasticity
Retail price
Per capita income
Per capita food away from home expenditures
Generic advertising and promotion
-0.392"
0.071"*
0.288*
0.046*
*Significant at the 10 percent significance level or less. **Significant at the 15 percent significance level.
cheese demand (its elasticity averaged 0.079), but its positive sign indicates that these dairy products are normal goods, i.e., consumption increases with increases in income.
The major interest here is the combined advertising and promotion (or "marketing") elasticity. The average marketing elasticity for this period was 0.046, i.e., a 1.0 percent increase in expenditures for these combined marketing activities increased fluid milk and cheese demand by 0.046 percent. This result is similar to the advertising elasticities computed earlier in this report. However, this elasticity applies to all demand-enhancing activities by dairy farmers and milk processors. Thus, the total marketing effort by dairy farmers and milk processors has had a positive and statistically significant impact on dairy consumption.
A BCR can be computed as the change in net revenue due to all demand-enhancing marketing activities divided by the cost of the programs. As was the case before, while a BCR for producers can be estimated for the Dairy Program, it cannot be computed for milk processors with the Fluid Program because data on packaged fluid milk wholesale prices, which is necessary in calculating processor net revenue, are proprietary information and not available.
Following the same procedures used in the advertising evaluation, 9 the BCR was calculated by simulating two scenarios: (1) a baseline scenario, in which combined marketing levels were equal to actual marketing expenditures under the two programs, and (2) a no-national Dairy Program scenario in which there was fluid milk processor-sponsored marketing, but dairy farmer-sponsored marketing was reduced to 42 percent of actual levels to reflect the difference in assessment before and after the national program was enacted. A comparison of these two scenarios provides a measure of the impact of the Dairy Program. The benefits of the Dairy Program were calculated as the change in dairy farmer net revenue due to demand enhancement from all marketing activities under the Dairy Program, i.e., the difference in net revenue between Scenarios 1 and 2. The costs of the Dairy Program were calculated as the difference in total assessment revenue before and after the national program was enacted.
9 In order to measure market impacts, a supply equation at the farm-level was also estimated to simulate supply response to any price increase due to a marketing-induced increase in demand.
48

The results show that the average BCR for the Dairy Program was 4.61 from 1999 through 2003. This means that each dollar invested in fluid milk and cheese marketing (advertising and NAPA) by dairy farmers during the period returned $4.61, on average, in net revenue to farmers. While slightly lower than the advertising-only BCR, the level of the marketing BCR suggests that the combined marketing programs supported by dairy farmers have been a successful investment.
49

Table 3-5. Description of Variables Used in Econometr ic Models ~ Variable Description Units Mean 2
Consumption Variables RFDPC Quarterly retail fluid demand per capita Ibs. MFE 48.48
(1.44) RCDPC Quarterly retail cheese demand per capita lbs. MFE 61.88
(2.45) RBDPC Quarterly retail butter demand per capita Ibs. MFE 24.33
(3.23) RFZDPC Quarterly retail frozen demand per capita lbs. MFE 12.26
(1.92) FMS Quarterly fluid milk production bil. lbs. 41.79
(1.20)
Prices and Price Indices RFPBEV Consumer retail price index for fresh milk and cream, deflated by # 1.16
consumer price index for nonalcoholic beverages (1982-84=1) (0.03) RCPMEAT Consumer retail price index for cheese, deflated by consumer retail price # 1.04
index for meats (1982-84=1) (0.03) WFP Wholesale fluid price index ( 1982-84= 1 ) # 1.50
(O.07) WCP Wholesale cheese price S/lb. 1.30
(O.2O) MW Basic formula price $/cwt. 11.45
(1.95) AMP All milk price $/cwt. 13.25
(1.59) DIFF Class I differential $/cwt. 3.59
(1.73) PFE Producer energy index (1982-84=1) # 1.09
(o.l l)
INCPC
BLACK
Demographic Variables Per capita disposable income, deflated by the consumer retail price index for all items (1982-84=1) Percent of the population African American
$000 14.80 (0.39)
# 11.96 (0.19)
# 4.92 (0.15)
# 6.82 (0.08)
# 36.17 (0.52)
$ 244.38 (4.80)
HISPANIC/ASIAN
AGE5
Percent of the population Hispanic/Asian
Percent of the population under age 6
AGE2044 Percent of the population age 20 to 44
FAFHPC Real per capita food away from home expenditures (19885)
GFAD
GFAD_DMI
GFAD_MILKPEP
GCAD
BFAD
BCAD
Advertising Expenditures Quarterly generic fluid milk advertising expenditures, deflated by Media Cost Index (20015) Quarterly generic fluid milk advertising expenditures, Dairy Program, deflated by Media Cost Index (20015) Quarterly generic fluid milk advertising expenditures, Fluid Milk Program, deflated by Media Cost Index (20015) Quarterly generic cheese advertising expenditures, Dairy Program, deflated by Media Cost Index (20015) Quarterly brand fluid milk advertising expenditures, deflated by Media Cost Index (20015) Quarterly brand cheese advertising expenditures, deflated by Media Cost Index (20015)
$mil 28.80 (6.70)
$mil 8.66 (3.93)
$mil 20.09 (5.75)
$mil 12.58 (2.36)
$mil 5.06 (2.51)
5rail 21.88 (9.94)
Quarterly dummy variables (Q1-Q3) are also included in the model to account for seasonality in demand. 2 Computed over most recent 5-year period, 1999-2003. Standard deviation in parentheses.
50

C h a p t e r 4
Flu id M i l k M a r k e t and P r o m o t i o n A s s e s s m e n t
For the fifth consecutive year, Beverage Marketing Corporation (BMC) has been commissioned by Dairy Management Inc. (DMI) and the National Fluid Milk Processor Promotion Board to review the fluid milk advertising and promotion programs. This review offers a subjective evaluation of the effectiveness of those programs and provides a third- party marketing perspective on these efforts. It also evaluatesmilk's position relative to milk's competitive beverage set, including its respective marketing efforts and market performance. BMC believes milk's competitive set includes most nonalcoholic refreshment beverages, specifically carbonated soft drinks, bottled water, fruit beverages, sports beverages, and ready-to-drink teas. This year, BMC examines the overall milk industry's performance as well as the effect that targeted advertising and promotion have had on milk consumption by the crucial demographlc cohorts.. The following summarizes our findings based on the analysis of available data.
Beverage Marketing Corporation's Assessment of the C~rrent Milk Industry Environment
In 2003, fluid milk volume declined by 0.5 percent to 6.25 billion gallons after a slight volume increase in 2002. Over the last 6 years, fluid milk volume has essentially been stable, fluctuating within a narrow band of volume between ~..2 and 6.4 billion gallons.
Figure 4-1
Fluid Milk Sales Volume and Growth 1998-2003
6,380
6,360
6,340
6,320 0
6,300
+0.7%
+0.3% 6,280
6,260 - •
6,240
6,220
6,200
6,180 1998 1999 2000 2001 2002 2003
Source: Beverage Marketing Corp. of New York
51

Milk volume declined by about 30 million gallons in 2003, after increasing by approximately 20 million gallons in 2002. The history of volume changes for fluid milk sales over the past 6 years is shown in Figure 4-1. Milk's compound annual growth rate (CAGR) for the 5-year period of 1998 to 2003 was -0.2 percent, a reflection of the negligible swings in year-over- year milk consumption since 1998.
These narrow consumption swings from year to year actually extend back several decades. Consider that as long ago as 1985, fluid milk consumption was 6.25 billion gallons-- identical to the fluid milk consumption in 2003. Over this span of time, however, the U.S. population has increased, resulting in slight declines in per capita consumption of fluid milk. In 2003, per capita consumption of milk declined by 1.5 percent to 22.1 gallons per person'. (See Figure 4-2.) BMC believes these declines in per capita consumption are not a reflection of the promotional and advertising efforts of the industry, which in fact may have actually been successful at preventing more sizeable declines in consumption.
Industry efforts targeting teens, a critical• demographic target, appears to have had an enduring impact on increasing teen milk consumigtion. For the third consecutive year, teen consumption increased in 2003. (See Figure 4-3.)
Figure 4-2
1.0%-
0.5%-
M - 0 . 5 % ~
-1 .0%
-1 .5% -1.4%
-2.0%-
-2.5% 1998
Per Capita Consumption 123.4
Per Capita Consumption Percentag~ Change • , 1 9 9 8 - 2 0 0 3
-0.2% /[/[ -1.7%
-1.9%
1999 2000 2001 2002 2003 23.4 23.0 22.5 22.4 22.1 I
;ource: Beverage Marketing Corp. of New York
52

Figure 4-3
Change in Per Capita Milk Consumption, 13- to 17-Year-Olds 1998-2003
8.0%
3.0%
-2.0%
-7.0%
-1.6%
-6.1%
2.8%
6.8%
-8.8% -12.o%
1998 1999 2000 2001 2002 2003
Source." Beverage Marketing Corp. of New York, SIP
Figure 4-4
Per Capita Consumption Gallons and Change 2002-2003
Gallons Change
2002 200_.~3 2002/03
CSD 54.2 53.8 -0.7% Milk 22.4 22.1 -1.5% Bottled Water 21.2 22.6 6.3% Fruit Beverages 15.0 14.9 -0.7% Sports Drinks 2.8 3.1 12.1% RTD Tea 1.8 1.8 -0.7%
Source. Beverage Marketing Corp. of New York
53

Within its competitive set, milk is the third-largest beverage category by volume. (See Figure 4-4.) In 2003, milk was surpassed by bottled water, which has shown dramatic growth for more than a decade. Carbonated soft drinks remain by far the largest category within the competitive set, with per capita consumption at 53.8 gallons in 2003, but carbonated soft drink per capita consumption has experienced slight declines in recent years. In 2003, bottled water and sports drinks were the only categories in the competitive set that achieved per capita consumption increases.
In 2003, the combined categories of the competitive set increased by 1.8 percent to 33.5 billion gallons, up from 32.9 billion gallons in 2002. From 1998 to 2003, the competitive set grew at a CAGR of 2.0 percent. (See Figure 4-5.) Without milk, the performance of the competitive set would have been slightly better--increasing at a CAGR of 2.5 percent from 1998 to 2003. Without bottled water, the competitive set grew by a CAGR of just 0.6 percent over the same 5-year time span. Bottled water accounted for approximately 75 percent of the volume increase of the competitive set in 2003. Absent bottled water, milk's performance was only slightly weaker than the performance of the competitive set, a possible indicator of the effectiveness of the advertising and promotional programs.
Beverage Marketing has studied milk's share of the volume increase compared to that of the entire competitive set annually over the last 15 years. This index reveals whether milk has gained or lost competitive share over this time span. This measure of milk's performance is an index based on its share of competitive volume change, divided by milk's market share of the competitive set at the onset of the year. An index greater than 1 indicates that milk is improving its share and thus outperforming the competitive set; an index less than 1 reveals that milk's share of the competitive set is declining. In Figure 4-6, this index is illustrated over a 5-year period for each of the competitive set categories.
Figure 4-5
Volume Growth of Milk and Its Competitive Set 1998-2003
Competitive Set Competitive Set Competitive Set Milk Total Without Milk Without Water
1998 -0.5% 3.2% 4.2% 2.3% 1999 0.7% 2.4% 2.9% 1.1% 2000 -0.8% 1.4% 2.0% 0.5% 2001 -0.9% 1.7% 2.3% 0.2% 2002 0.3% 2.5% 3.0% 0.8% 2003 -0.5% 1.8% 2.3% 0.5% 98/03 CAGR -0.2% 2.0% 2.5% 0.6%
Source: Beverage Marketing Corp. of New York
54

Figure 4-6
M i l k I n d e x e d Share o f Compet i~ve Turnover
1998-2003 ,
Milk ~ Fruit Beverages CSD RTD Tea ~ Bottled Water ---4,-- Sports Drinks
8.0
7.0
6.0
5.0
4.0
2.0
1 . 0 - - - J
0.0
-1.0
-2 .0 '
- 3 . 0 i
1998 1999 2000 2001 2002 2003
Source: Beverage Marketing Corp. of New York
Milk has consistently underperformed the competitive set and has thus lost competitive share each year since 1998, as the diagram illustrates. Conversely, bottled water and sports drinks have consistently outperformed the competitive set and have gained competitive share. Bottled water, in particular, has shown dramatic growth in recent years, driven primarily by heightened consumer demand for healthier beverage alternatives.
While there are many factors associated with these consumption trends, advertising expenditures is one factor that is easily me~{sured. In 2003, all of the competitive set except fruit beverages experienced a decline in media spending per gallon. (See Figure ¢-~7,) Just as in 2002, milk remains the second lowest in media spending per gallon, with b0ttled water last. The milk category spent 2 cents on advertising for every gallon of milk sold whereas the carbonated soft drinks category spent 4 cents for every gallon sold. Bottled water's success has been primarily distribution and consumer driven and has come without significant marketing dollar expenditures in recent years.
55

Figure 4-7
Changes to Competitive Set Media Spending Per Gallon 2002-2003
10.0%
0.0%
-10.0%
-20.0%
-30.0%
-40.0%
-50.0%
-60.0%
9.4%
- i Im -15.1%
Sports Fruit Drinks Beverages
y
-49.3%
RTD Tea
-4.1% , -9.8%
• -40.0%
CSD Bottled Water Milk
$ per Gallon $0.14 $0.08 $0.04 $0.04 $0.01 $0.02 ]
~ource." Beverage Marketing Corp. of New York
Figure 4-8
Competitive Set Advertising Spending 2003
(Millions o f Dollars)
Bottled Water
Tell
~.9 __J%
;ource: Beverage Marketing Corp. of New York
56

In 2003, all categories in the competitive set except for fruit beverages spent less on advertising than they did in 2002. (See Figure 4-8.) Carbonated soft drinks once again accounted for nearly half of all advertising dollars spent within the competitive set at nearly $600 million. At $350 million in spending, fruit beverages accounted for nearly 30 percent. At $120 million in spending in 2003, milk ranked fourth within the competitive set, accounting for nearly 10 percent of spending. The spending is comprised primarily of the national generic campaign as well as regional generic spending and branded product spending. While such spending is significant, milk accounts for nearly 19 percent of the volume within the competitive set and remains significantly underrepresented in share of voice.
Unfortunately, simple measurement of advertising spending does not take into account the effectiveness of the campaigns and does not measure the impact of millions of dollars spent on promotions. Promotional expenditures cannot be measured in an objective manner because companies tend not to divulge this data. Nevertheless, it is known that many millions of dollars are spent on promotional programs within the competitive set. Beverage Marketing believes milk continues to be outspent on promotion programs and that this is a contributory factor to milk's flat volume performance.
Furthermore, the milk category finds itself at a disadvantage to all of the other categories in the competitive set for several other reasons, outlined below. While the category has begun to make progress in many of these areas, for the most part it trails the other categories in the competitive set in all of them.
C o n s u m e r Attention
Beverage product innovation has accelerated in recent years for all categories within the competitive set. This innovation adds news and excitement to categories, bringing more focus and attention to them compared to their less innovative counterparts. While there has been innovation in the milk category, it has lagged behind the others in the competitive set in new product introductions. The net result is that consumers have more choices than ever. This has the effect of increasing the impact of advertising. Many of these new products, such as soymilk or orange juice with calcium, have even co-opted milk's healthy positioning.
In 2003, milk lagged behind the competitive set in its share of advertising expenditures in contrast to its volume share within the set. But this low share of voice has occurred consistently over a number of years and is likely to have a cumulative negative impact on milk consumption.
Product Attributes and Innovat ion
Innovation in the milk category has centered on flavored milk--primari ly chocolate-- in single-serve packaging. While this represents an improvement after years of very little innovation, other categories in the competitive set have been more aggressive, with a wider variety of product innovation and a greater assortment of packaging shapes and sizes.
57

In 2003, new milk product introductions declined by 9.0 percent to 202, compared to 222 in 2002. Milk ranked third in the competitive set for new product introductions in 2003 behind fruit beverages and carbonated soft drinks, its principal competitors. But the category is in need of more innovation rather than less in the coming years.
Branding
One of the more significant disparities in milk versus its competitive set is the distinct lack of big milk brands. In comparison, the competitive set is dominated by megabrands that have been built and honed by world-class marketing organizations.
The milk category is mostly dominated by private label. In 2003, milk lagged behind the competitive set with only 31.5 percent of its volume in the grocery channel accounted for by brand products. No other category in the competitive set has less than half its volume accounted for by brand products like the milk category. Beverage Marketing believes this disparity places milk at a distinct disadvantage with the rest of the competitive set because of the challenges inherent in marketing a category versus brands.
Distribution
Milk is widely available; nevertheless, its availability does continue to have some significant limitations. Availability is concentrated in take-home retail channels such as supermarkets. In other outlets where milk is available, it often does not have the range of packaging and flavor options offered by other products in the competitive set. This places milk at a competitive disadvantage.
As consumer lifestyles become more and more "on-the-go," consumer products manufacturers have been forced to respond by developing products in convenient single- serve packaging distributed in immediate consumption channels such as convenience stores and foodservice. In 2003, only about 18 percent of milk volume was sold for immediate consumption, whereas more than half the volume of carbonated soft drinks, sports drinks, and ready-to-drink tea is purchased for immediate consumption.
A recent audit of 500 convenience stores in 26 markets revealed that flavored single-serve milk was available in 94 percent of the sample. While that result appears strong on the surface, it is notable that most of that availability can be accounted for by national brands such as NesQuik and Hersheys. Local flavored brands are virtually nonexistent in convenience stores. Furthermore, while chocolate and strawberry are widely available, other flavors are not.
Pricing
Price promotion is a key tool that beverage marketers have used to spur sales, and this is true of all categories in the competitive set except for milk.
58

In 2003, milk had the largest consumer price index increase of all the categories in the competitive set tracked by the Bureau of Labor Statistics. In particular, the milk category experienced rising prices in the fourth quarter which have continued into 2004 and which are likely to place milk at a competitive disadvantage in its competitive set.
Beverage Marketing Corporation's Assessment of Current Milk Marketing Programs
Beverage Marketing believes the marketing campaign developed under the Dairy Act and the Fluid Milk Act has served to stem declines in milk consumption in the face of vastly heightened competition. While over the last 5 years there has been a slight decline in milk consumption, Beverage Marketing believes these declines would have been more significant without the campaign.
Even with the campaign, milk remains at a disadvantage against the competitive set in the areas highlighted earlier---consumer attention, product attributes and innovation, branding, distribution, and pricing. Without improvements in these areas, the milk category is likely to remain at a competitive disadvantage even with a strong and effective generic fluid milk marketing campaign.
In particular, Beverage Marketing believes pricing has become a significant issue for the milk category in the last year. An uptick in retail prices in late summer 2003 appears to be continuing in 2004. There are several factors contributing to the pricing environment: a decrease in the overall milk supply based on fewer cows on farms, higher feed prices, and the higher cost of replacement dairy cows. Higher prices that were seen in 2003 and that have continued in 2004 are likely to have an overriding impact on milk sales no matter how effective any of the other programs are. Price increases in the fourth quarter of 2003 may be obscuring some of the impacts of the Healthy Weight With Dairy campaign, which was launched in October 2003. In addition, the Healthy Weight With Dairy campaign displaced some of the focus on teens and flavors during the rest of 2003.
A second issue is the implementation of programs by the processors. While there have been isolated successes, overall processors have not been widely successful in adopting programs. For example, there is exceptionally low availability of local single-serve flavored milk brands in convenience stores. While in many instances the products are being introduced and produced, they are all too often not effectively reaching these essential channels of distribution because processors do not commit the resources necessary to appropriately deliver and merchandise these channels. Vending is another area of weakness. While vending has been identified as a potentially important driver of milk volume, processors have placed very few vendors in their markets or have not made the necessary marketing approach to independent operators.
The last 2 years have seen declines in the fluid milk generic media budget- - f rom $82 million in 2001 to $68.5 million in 2003 (see Figure 4-9). Beverage Marketing believes this decline in spending may have a negative impact on milk consumption in the face of sizeable spending by other categories in the competitive set. All of the categories in the competitive
59

Figure 4-9
$90
$8O
$70
$60
$50
$40
$30
$20
$10
$0
Fluid Milk Generic Media Budget 2000-2003
Millions of DoUars
$81.6 $82.0 $74.0 ~
$68.5
I I I
2000 2001 2002 2003
• Adults
• Teens
[] Kids
• Women/Mom:
ource: Beverage Marketing Corp. of New York and Lowe Advertising
Figure 4-10
Per Capita Consumption Percent Change by Children 6-12 1998-2003
8.0%
6.0%
4.0%
2.0%
0.0%
-2.0%
-4.0%
-6.0%
-8.0 %
-10.0%
- 1 . 6 %
6 . 1 % 6 . 1 %
-8 .3%
1 . 2 % "̧
1999 2000 2061 2002 2003
Source." Beverage Marketing Corp. of New York, SIP
60
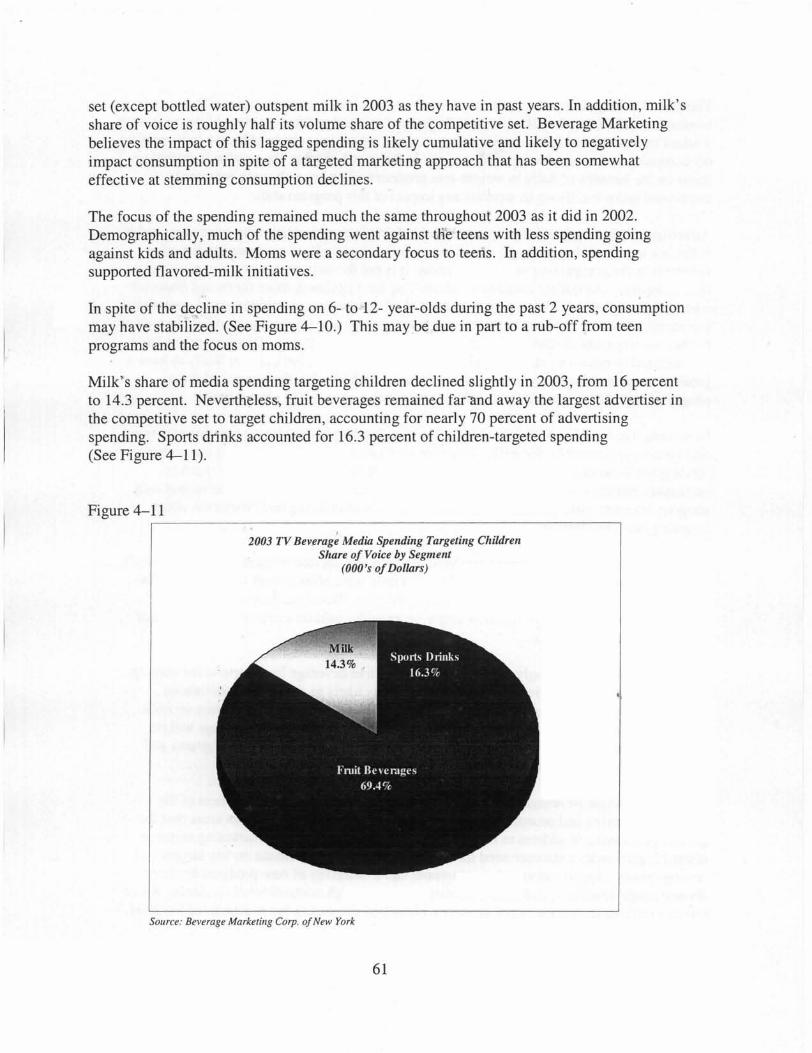
set (except bottled water) outspent milk in 2003 as they have in past years. In addition, milk's share of voice is roughly half its volume share of the competitive set. Beverage Marketing believes the impact of this lagged spending is likely cumulative and likely to negatively impact consumption in spite of a targeted marketing approach that has been somewhat effective at stemming consumption declines.
The focus of the spending remained much the same throughout 2003 as it did in 2002. Demographically, much of the spending went against ttie teens with less spending going against kids and adults. Morns were a secondary focus to teens. In addition, spending supported flavored-milk initiatives.
. k
In spite of the decline in spending on 6- to:12- year-olds during the past 2 years, consumption may have stabilized. (See Figure 4-10.) This may be due in part to a rub-off from teen programs and the focus on moms.
Milk's share of media spending targeting children declined slightly in 2003, from 16 percent to 14.3 percent. Nevertheless, fruit beverages remained far'and away the largest advertiser in the competitive set to target children, accounting for nearly 70 percent of advertising spending. Sports drinks accounted for 16.3 percent of children-targeted spending (See Figure 4-11).
Figure 4-11
2003 TV Beverage Media Spending Targeting Children Share of Voice by Segment
(O00"s of Dollars)
Source: Beverage Marketing Corp. of New York
61

The year 2003 represents the peak of a 3- to 4-year marketing and promotional focus on teen consumers and flavored-milk activities. In particular, the first three quarters of the year were marked by a continued focus on marketing to teens, which has proven effective in increasing consumption in this key demographic target. In the fourth quarter, the emphasis shifted to focus on the benefits of dairy in weight-loss programs. The price changes previously mentioned make it difficult to separate any impact of this program shift.
Advertising spending is a critical piece of the industry's generic marketing campaign, and it is the one aspect of the campaign that is most easily measured and compared to the other segments in the competitive set. Nevertheless, it is not the only aspect of the generic fluid milk campaign. As dollars invested in advertising have declined, more focus and financial resources have been shifted toward promotional efforts and various strategic and operational initiatives, including working with processors to innovate and market their brands, as well as further development of retail, vending, and school-related programs. These programs have the potential to have a significant impact on milk consumption, but they are likely to have a greater cumulative impact over a number of years. Additionally, the success of these programs is greatly impacted by the effectiveness of processors' implementation.
In schools, the New Look of School Milk Program has begun to generate significant interest and volume opportunities for milk. There are now nearly 400 school districts either using or bidding out 8-ounce plastic packages for school lunch lines. This is likely to result in increased consumption among a key demographic cohort, kids and teens. The school milk program interacts synergistically with much of 2003's advertising and promotion effort targeting teens and flavors.
In foodservice, market tests were completed at two quick-service restaurant chains in which attractive plastic bottles of single-serve flavored milk were offered with kids' meals. The result was a spike in flavored milk sales during this test. Based on these results, BMC believes foodservice sales of flavored single-serve milk could be increased if the products were more widely available.
BMC foresees an increasingly complex and competitive beverage landscape in the coming years. Each of the categories in the competitive set is likely to experience continuous innovation, especially in products and packaging. This will place more pressure on milk processors to also become more aggressive. BMC believes that positive change will be based on a dual platform for growth, consisting of strong, targeted generic programs and industry innovation in product availability and branding.
In summary, while Beverage Marketing believes in the continuing effectiveness of the generic advertising and promotion programs, there are several crucial focus areas that the generic programs can address to improve milk's position: evolve the marketing message toward higher-order consumer need states, continue to focus or refocus on key targets and demographics, support increased development and availability of new products for more diverse usage occasions, and maximize distribution through nontraditional channels. All of this can be done in the context of the new weight-loss messaging focus scheduled for 2004.
62

Appendix A National Dairy Promotion and Research Board
Current and Past Member Listing
Region 1 (Oregon and Washington)
Current National Dairy Board Member
Elizabeth I. (Liz) Anderson Onalaska, Washington Term expires 10/31/2006
Past National Dairy Board Members
Elizabeth I. (Liz) Anderson Onalaska, Washington
Alvin J. Sherman Coupeville, Washington
Marlin J. Rasmussen St. Paul, Oregon Term expires 10/31/2004
Fred J. Cockram Baker, Oregon
Region 2 (California)
Current National Dairy Board Members
William R. Ahlem, Jr. Hilmar, California Term expires 10/31/2004
Mary E. Cameron Hanford, California Term expires 10/31/2006
Margaret A. Gambonini Petaluma, California Term expires 10/31/2004
John Zonneveld, Jr. Laton, California Term expires 10/31/2005
Past National Dairy Board Members
Mary E. Cameron Hanford, California
63
Robert R. Bignami Chico, California Term expires i0/31/2004
Kimberly K. Clauss Hilmar, California Term expires 10/31/2006
Patricia M. Van Dam Chino, California Term expires 10/31/2004
Louis R. Calcagno Moss Landing, California

Appendix A, continued
Past National Dairy Board Members, continued
George E. Gambonini Petaluma, California
Robert W. Giacomini Point Reyes, California
Vernal J. Gomes Tulare, California
Steve Hofman Modesto, California
Dennis A. Leonardi Ferndale, California
Beatrice Moons Chino, California
Harvey S. Moranda Orland, California
Mary B. Parente Ontario, California
Ronald B. Quinn Tulare, California
Paul A. Rollin Burrel, California
Manuel Santos, Jr. Tulare, California
Tom Sawyer Waterford, California
Tony M. Souza, Jr. Tulare, California
Pete J. Vander Poel Chino, California
Region 3 (Arizona, Colorado, Idaho, Montana, Nevada, Utah, and Wyoming)
Current National Dairy Board Members
Steve P. Frischknecht Manti, Utah Term expires 10/31/2004
William C. Stouder Wendell, Idaho Term expires 10/31/2006
Past National Dairy Board Members
Barbara B. Curti Reno, Nevada
Lester E. Hardesty Greeley, Colorado Term expires 10/31/2005
Jack S. Davis Kuna, Idaho
64

Appendix A, continued
Past National Dairy Board Members, continued
Francis D. Gregerson Longmont, Colorado
Don L. Meikle Smithfield, Utah
Harry A. Papageorge Ogden, Utah
Pedro R. Lizaso Emmett, Idaho
Ruth E. Miller Kuna, Idaho
Paul E. Rovey Glendale, Arizona
Region 4 (Arkansas, Kansas, New Mexico, Oklahoma, and Texas)
Current National Dairy Board Members
Charles W. Bryant Austin, Arkansas Term expires 10/31/2006
Neil A. Hoff Windthorst, Texas Term expires 10/31/2005
Past National Dairy Board Members
William E. Bugg Hennessey, Oklahoma
Louis Hinders Canyon, Texas
Myron D. Schmidt Newton, Kansas
Bill Thornton Carlisle, Arkansas
Lynda Foster Fort Scott, Kansas Term expires 10/31/2004
Jimmie L. Davis Green Forest, Arkansas
James H. Loper, Jr. Santa Teresa, New Mexico
Ivan K. Strickler Iola, Kansas
65
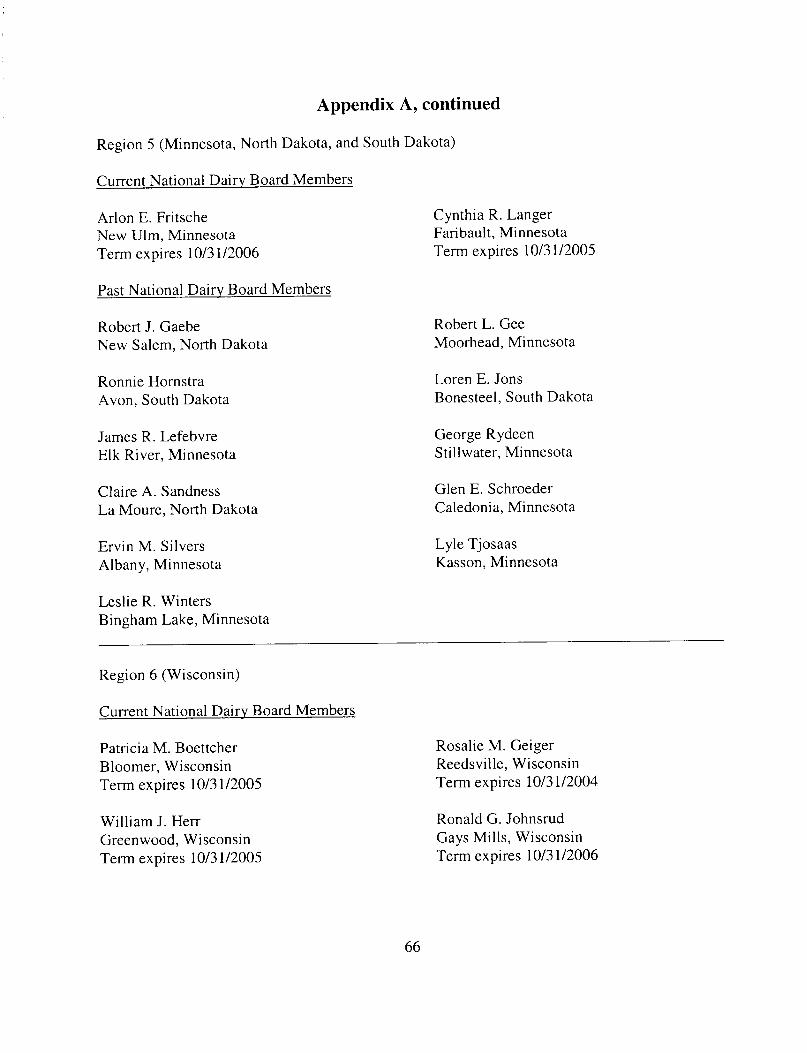
Appendix A, continued
Region 5 (Minnesota, North Dakota, and South Dakota)
Current National Dairy Board Members
Arlon E. Fritsche New Ulm, Minnesota Term expires 10/31/2006
Past National Dairy Board Members
Robert J. Gaebe New Salem, North Dakota
Ronnie Homstra Avon, South Dakota
James R. Lefebvre Elk River, Minnesota
Claire A. Sandness La Moure, North Dakota
Ervin M. Silvers Albany, Minnesota
Leslie R. Winters Bingham Lake, Minnesota
Cynthia R. Langer Faribault, Minnesota Term expires 10/31/2005
Robert L. Gee Moorhead, Minnesota
Loren E. Jons Bonesteel, South Dakota
George Rydeen Stillwater, Minnesota
Glen E. Schroeder Caledonia, Minnesota
Lyle Tjosaas Kasson, Minnesota
Region 6 (Wisconsin)
Current National Dairy Board Members
Patricia M. Boettcher Bloomer, Wisconsin Term expires 10/31/2005
William J. Herr Greenwood, Wisconsin Term expires 10/31/2005
Rosalie M. Geiger Reedsville, Wisconsin Term expires 10/31/2004
Ronald G. Johnsrud Gays Mills, Wisconsin Term expires 10/31/2006
66

Appendix A, continued
Current National Dairy Board Members, continued
Connie M. Seefeldt Coleman, Wisconsin Term expires 10/31/2006
Past National Dairy Board Members
Frederick E. Anding Hudson, Wisconsin
Gregory D. Blaska Sun Prairie, Wisconsin
John H. Christensen Ringle, Wisconsin
Victoria H. Coughlin Watertown, Wisconsin
Wayne L. Danielson Cadott, Wisconsin
Donald R. Haldeman Madison, Wisconsin
Sylvia J. Hemauer Plymouth, Wisconsin
David J. Krug Owen, Wisconsin
John A. Malcheski Pulaski, Wisconsin
Ray A. Mallo Gilman, Wisconsin
Janet M. Nelson Prairie Farm, Wisconsin
Timothy C. O'Harrow Oconto Falls, Wisconsin
Allard L. Peck Chippewa Falls, Wisconsin
Roger O. Rebout Janesville, Wisconsin
Daniel J. Rodenkirch Kewaskum, Wisconsin
Charles Russell Shullsburg, Wisconsin
Jerome G. Servaisw West Salem, Wisconsin
Audrey M. Sickinger Cato, Wisconsin
Gerald R. Sipple Menomonie, Wisconsin
67

Appendix A, continued
Region 7 (Illinois, Iowa, Missouri, and Nebraska)
Current National Dairy Board Members
Pare Bolin Clarksville, Iowa Term expires 10/31/2005
Past National Dairy Board Members
Ardath DeWall Shannon, Illinois
Myron E. Erdman Chenoa, Illinois
W. Eugene Flynn Blair, Nebraska
G. Joe Lyon Toledo, Iowa
William B. Siebenborn Trenton, Missouri
Tim R. Volk Battle Creek, Nebraska
James R. Bartelson Anita, Iowa Term expires 10/31/2006
Wayne E. Dykshom Ireton, Iowa
Lester M. Evans Lebanon, Missouri
Maynard J. Lang Brooklyn, Iowa
Harold E. Rice DuQuoin, Illinois
John L. Sullivan Superior, Nebraska
Region 8 (Alabama, Kentucky, Louisiana, Mississippi, and Tennessee)
Current National Dairy Board Member
Michael M. Ferguson Coldwater, Mississippi Term expires 10/31/2005
Past National Dairy Board Members
Joeseph J. Bavido, Jr. Sharon, Tennessee
James S. Cook Evergreen, Alabama
68

Appendix A, continued
Past National Dairy Board Members, continued
Buckey M. Jones Smithdale, Mississippi
Stephen K. Plenge Shepherdsville, Kentucky
Harry E. Pickering Taylorsville, Mississippi
Ruth M. Robinson Jonesborough, Tennessee
Region 9 (Indiana, Michigan, Ohio, and West Virginia)
Current National Dairy Board Members
Donald E. Gurtner Freemont, Indiana Term expires 10/31/2006
Deanna S. Stamp Marlette, Michigan Term expires 10/31/2005
Past National Dairy Board Members
Herman M. Brubaker West Alexandria, Ohio
Roger D. Crossgrove Archbold, Ohio
Elwood C. Kirkpatrick Kinde, Michigan
Alice S. Moore Frazeyburg, Ohio
Elton R. Smith Caledonia, Michigan
John O. Spreng, Sr. Bucyrus, Ohio
Alice S. Moore Frazeyburg, Ohio Term expires 10/31/2004
Merle L. Chaplin Moundsville, West Virginia
Glenn E. Johnson Hartford City, Indiana
Joseph P. Logan Kinsman, Ohio
Harold E. Reiff Burnettsville, Indiana
Louis F. Smith Fremont, Ohio
69

Appendix A, continued
Region 10 (Florida, Georgia, North Carolina, South Carolina, and Virginia)
Current National Dairy Board Member
Robert K. Herman Taylorsville, North Carolina Term expires 10/31/2004
Past National Dairy Board Members
H. Todd Arant Bowman, South Carolina
John P. DeJong Pinetown, North Carolina
James M. Dora, Jr. Edgefield, South Carolina
Sanford L. Jones, Jr. Quitman, Georgia
John A. Peachey Myakka City, Florida
Gerald L. Aycock Fremont, North Carolina
Charles H. Deputy Harrisonburg, Virginia
William Higginbotham Washington, Georgia
W. Charles McGinnis Kinards, South Carolina
Franklin J. Teague Elon College, North Carolina
Region 11 (Delaware, Maryland, New Jersey, and Pennsylvania)
Current National Dairy Board Members
Deborah A. Benner Mt. Joy, Pennsylvania Term expires 10/31/2004
Rita Kennedy Valencia, Pennsylvania Term expires 10/31/2005
Past National Dairy Board Members
H. Wallace Cook, Jr. Newark, Delaware
Lewis Gardner Galeton, Pennsylvania Term expires 10/31/2006
Keith W. Eckel Clarks Summit, Pennsylvania
70

Appendix A, continued
Past National Dairy Board Members, continued
Earl R. Forwood Hop Bottom, Pennsylvania
Harold L. Lenhart, Sr. Thurmont, Maryland
Ernest O. Miller Hamburg, Pennsylvania
Horace W. Waybright Gettysburg, Pennsylvania
Penrose Hallowell Ottsville, Pennsylvania
Walter A. Martz Frederick, Maryland
David N. Noss Port Royal, Pennsylvania
David Weitzer Poolesville, Maryland
Region 12 (New York)
Current National Dairy Board Members
Audrey G. Donahoe Frankfort, New York Term expires 10/31/2005
Edgar A. King Schuylerville, New York Term expires 10/31/2006
Past National Dairy Board Members
Leon A. Brown Westtown, New York
David M. Dodge Woodville, New York
Raymond E. Johnson Schaghticoke, New York
Ruth I. Laribee Lowville, New York
Thomas L. Snyder Churchville, New York
David E. Hardie Lansing, New York Term expires 10/31/2004
Carl E. Butler Pine Plains, New York
Jane M. Gillette Turin, New York
Paul R. Kirsch Varysburg, New York
Shirley Mower Jordanville, New York
William T. Underwood Tully, New York
71

Appendix A, continued
Past National Dairy Board Members, continued
John N. Widger Ellicottville, New York
P. Kay Zeosky Turin, New York
Region 13 (Connecticut, Maine, Massachusetts, New Hampshire, Rhode Island, and Vermont)
Current National Dairy Board Member
Claude J. Bourbeau Swanton, Vermont Term expires 10/31/2005
Past National Dairy Board Members
Robert P. Davis Harold J. Howrigan Cabot, Vermont Fairfield, Vermont
Leo O'Brien, Jr. South Burlington, Vermont
72

Appendix B National Fluid Milk Processor Promotion Board
Current and Past Member Listing
Region 1 (Connecticut, Maine, Massachusetts, New Hampshire, Rhode Island, and Vermont)
Current National Fluid Milk Board Member
Michael F. Touhey, Jr. Dean Foods Company Franklin, Massachusetts Term expires 6/30/2007
Past National Fluid Milk Board Member
Arthur J. Pappathanasi West Lynn Creamery, Inc. Lynn, Massachusetts
Peter M. Ross Garelick Farms, Inc. Franklin, Massachusetts
Region 2 (New Jersey and New York)
Current National Fluid Milk Board Member
Vacant
Past National Fluid Milk Board Members
Michael L. Marcus Tuscan Dairy Farms, Inc. Union, New Jersey
Jeffrey W. Stephen H.P. Hood, Inc. Chelsea, Massachusetts
Mary Ellen Spencer H.P. Hood, Inc. Chelsea, Massachusetts
73

Appendix B, continued
Region 3 (Delaware, District of Columbia, Maryland, Pennsylvania, and Virginia)
Current National Fluid Milk Board Member
Michael F. Nosewicz The Kroger Company Cincinnati, Ohio Term expires 6/30/2006
Past National Fluid Milk Board Members
Robert W. Allen Lehigh Valley Dairies Lansdale, Pennsylvania
Ronald W. Mong Mong Dairy Company Seneca, Pennsylvania
Sylvia C. Oriatti Dean Foods Company Rosemont, Illinois
Region 4 (Georgia, North Carolina, and South Carolina)
Current National Fluid Milk Board Members
R. Bruce Matson Marva Maid Dairy Newport News, Virginia Term expires 6/30/07
Past National Fluid Milk Board Members
Joseph Cervantes Crowley Foods, L.L.C. Binghamton, New York
Ralph H. Gardner Ingles/Milkco Asheville, North Carolina
C. Scott Mayfield, Jr. Mayfield Dairy Farms, Inc. Athens, Tennessee
Mary F. Williams Mayfield Dairy Farms, Inc. Athens, Tennessee
74

Appendix B, continued
Region 5 (Florida)
Current National Fluid Milk Board Member
James S. Jaskiewicz Publix Supermarkets, Inc. Lakeland, Florida Term expires 6/30/2005
Past National Fluid Milk Board Members
Robert (Scott) Charlton Publix Supermarkets, Inc. Lakeland, Florida
H. Denny Gaultney Skinners' Dairy, Inc. Jacksonville, Florida
Region 6 (Ohio and West Virginia)
Current National Fluid Milk Board Member
William R. McCabe Smith Dairy Products Company Orrville, Ohio Term expires 6/30/2006
Past National Fluid Milk Board Members
Alan L. Faust The Kroger Company Cincinnati, Ohio
John C. Hitchell The Kroger Company Cincinnati, Ohio
Region 7 (Michigan, Minnesota, North Dakota, South Dakota, and Wisconsin)
Current National Fluid Milk Board Member
Rachel A. Kyllo Marigold Foods, Inc. Minneapolis, Minnesota Term expires 6/30/2007
75

Appendix B, continued
Past National Fluid Milk Board Members
Jeffrey L. Koehler Associated Milk Producers, Inc. Morning Glory Farms Region De Pere, Wisconsin
David G. Schwain Land O' Lakes, Inc. Arden Hills, Minnesota
Region 8 (Illinois and Indiana)
Current National Fluid Milk Board Member
Roger D. Capps Prairie Farms Dairy, Inc. Carlinville, Illinois Term expires 6/30/2005
Past National Fluid Milk Board
G. Irwin Gordon Suiza Foods Corporation Dallas, Texas
Phillip A. Littell Maplehurst Farms, Inc. Indianapolis, Indiana
Region 9 (Alabama, Kentucky, Louisiana, Mississippi, and Tennessee)
Current National Fluid Milk Board Member
James W. Turner Turner Holdings, L.L.C. Memphis, Tennessee Term expires 6/30/2006
Past Nationals Fluid Milk Board Member
Mark V. Ezell Purity Dairies, Inc. Nashville, Tennessee
76

Appendix B, continued
Region 10 (Texas)
Current National Fluid Milk Board Member
Robert M. McCullough H. E. Butt Grocery Company San Antonio, Texas Term expires 6/30/2007
Past National Fluid Milk Board Members
Patrick R. Beaman Southern Food Group Oak Farms Dairy Dallas, Texas
Robert L. Fleming Southern Foods Group Schepps Dairy Dallas, Texas
John D. Robinson Dean Foods Company Dallas, Texas
Region 11 (Arkansas, Iowa, Kansas, Missouri, Nebraska, and Oklahoma)
Current National Fluid Milk Board Member
Gary L. Aggus Hiland Dairy Foods Company, L.L.C. Springfield, Missouri Term expires 6/30/2005
Past National Fluid Milk Board Member
Miriam Erickson Brown Anderson Erickson Dairy Company Kansas City, Kansas
77

Appendix B, continued
Region 12 (Arizona, Colorado, New Mexico, Nevada, and Utah)
Current National Fluid Milk Board Member
John D. Robinson Dean Foods Company Dallas, Texas Term expires 6/30/06
Past National Fluid Milk Board Members
Lawrence V. Jackson Safeway, Inc. Pleasanton, California
Michael H. Leb Safeway, Inc. Walnut Creek, California
Richard L. Robinson Robinson Dairy, Inc. Denver, Colorado
Region 13 (Idaho, Montana, Oregon, Washington, and Wyoming)
Current National Fluid Milk Board Member
James T. Wilcox, II/ Wilcox Dairy Farms, L.L.C. Roy, Washington Term expires 6/30/07
Past National Fluid Milk Board Member
James T. Wilcox, Jr. Wilcox Farms, Inc. Roy, Washington
78

Appendix B, Continued
Region 14 (Northern California)
Current National Fluid Milk Board Member
Jerry N. Tidwell Safeway, Inc. Walnut Creek, Californina Term expires 6/30/2005
Past National Fluid Milk Board Members
Ronald M. Foster Foster Dairy Farms Modesto, California
Richard L. Sturgeon Super Stores Industries Stockton, California
Charles R. Hills Crystal Cream and Butter Company Sacramento, California
Region 15 (Southern California)
Current National Fluid Milk Board Member
Paul W. Bikowitz Santee Dairies, Inc. City of Industry, California Term expires 6/30/2006
Past National Fluid Milk Board Members
Thomas P. Dolan Driftwood Dairy E1 Monte, California
Richard Walrack Santee Dairies, Inc. City of Industry, California
Gary J. San Filippo Alta Dena Certified Dairy City of Industry, California
79

Appendix B, continued
Members-At-Large
Current National Fluid Milk Board Members
Robert E. Baker Public Member Highland Park, Illinois Term expires 6/30/06
Susan D. Meadows Dean Foods Company Dallas, Texas Term expires 6/30/06
Randy D. Mooney Hiland Dairy Foods Company, L.L.C. Springfield, Missouri Term expires 6/30/07
Charles D. Price Galliker Dairy Company Johnstown, Pennsylvania Term expires 6/30/05
Patricia C. Romero Public Member Irvine, California Term expires 6/30/07
Past National Fluid Milk Board Members
Robert W. Allen Borden, Inc. Columbus, Ohio
Robert E. Baker Public Member Highland Park, Illinois
David Coates Public Member Germantown, Tennessee
Gary E. Hanman Mid-America Dairymen, Inc. Springfield, Missouri
John R. Jilbert Jilbert Dairy, Inc. Marquette, Michigan
Michael A. Krueger Shamrock Foods Company Phoenix, Arizona
Martin J. Margherio Crowley Foods, Inc. Binghamton, New York
Ann Pelz Ocana Shamrock Food Company Phoenix, Arizona
Leonard J. Southwell Prairie Farms Dairy, Inc. Carlinville, Illinois
Joseph W. Van Treeck Public Member Anchorage, Alaska
Anthony R. Ward Borden/Meadow Gold Dairy Ogden, Utah
80

Region I REGIONS OF THE NATIONAL DAIRY PROMOTION AND RESEARCH BOARD
Region 2 [7]
Region 3 t31
Region 13
[21
Region 4 [31
oo
Region 5 [21
[H
[31
o ,
Region 8 Ill
Region I0
I l l
!
NOTE: The number in brackets below each region indicates the number of members within thai region.

OO b,.)
REGIONS OF THE NATIONAL FLUID MILK PROCESSOR PROMOTION BOARD
Region 7
Region I t
2----
I
Region 15
Region 12
~ Region 8
Region 9
Region I
Region 2
Region
~ on 5
:Z
C3

Appendix D-1 National Dairy Promotion and Research Board
Actual Income and Expenses FY 2002-2003
(in $000's)
Income Assessments Interest Total Income
General Expenditures General and Administrative USDA Oversight Total General Expenditures
Program Expenditures Communications and Member Relations Domestic Marketing Export Enhancement Planning and Research Total Program Expenditures
Excess of Revenue (Under) Over Expenditures
Fund Balance, Beginning of Year
Fund Balance, End of Year
2002 2003
$86,619 $86,149 72 42
$86,691 $86,191
$2,919 $3,068 454 554
$3,373 $3,622
$8,269 $13,007 68,114 60,711
4,934 5,252 3,492 4,952
$84,809 $83,922
(1,491) (1,353)
$7,768 $6,277
$6,277 $4,924
SOURCE: Independent Auditor's Report of the National Dairy Board and USDA records.
83

Appendix D-2 USDA Oversight Costs for the
National Dairy Promotion and Research Board FY 2002-2003
2002 2003
Salaries and Benefits $300,666 $294,051 Travel 24,567 29,400 Miscellaneous ' 41,037 43,437 Equipment 2,053 1,177 Printing (74) 3,336 USDA Oversight Total $368,249 $371,401
Independent Evaluation $83,107 $86,308
Total 2 $451,356 $457,709
I Includes overhead, transportation, rent, communications, utilities, postage, contracts, supplies, photocopying, and Office of the General Counsel costs.
2The totals for USDA expenses differ slightly from those shown in Appendix D-1 because of end-of-year estimates which are adjusted in the followin~ fiscal year.
Source: Monthly billings by Dairy Pr%rams to the National Dairy Board.
84

Appendix D-3 National Dairy Promotion and Research Board
Approved Budgets FY 2003-2004
(in $000's)
Revenues Assessments Interest Total Income
Expenses General and Administrative USDA Oversight Subtotal
Program Budget Domestic Marketing Communications and Member Relations Research and Evaluation Budgeted but Not Allocated Export Enhancement
2003 2004
$94,200 $87,060 100 39
$94,300 $87,099
$3,168 $3,511 525 520
$3,693 $4,031
$64,888 [71.6%] $63,669 7,946 [ 8.8%] 10,791 6,464 [ 7.1%] 3,158 6,000 [ 6.6%] 5 309 [ 5.9%] 5 450
[76.6%] [13.0%] [ 3.8%]
[ 6.6%1
Subtotal $90,607 [100%] $83,068 [100%]
Total Budget $94,300 $87,099
Source: Budgets from the National Dairy Board received and approved by USDA.
85

Appendix D-4 National Fluid Milk Processor Promotion Board
Actual Income and Expenses FY 2002-2003
(in $000's)
Income Assessments Late-Payment Charges Interest Other Total Income
General Expenditures California Refund Administrative Expenses USDA Oversight USDA Assessment Verification Total General Expenditures
2002 2003
$107,816 $105,992 52 40
289 37O 28 142
$108,185 $106,544
$10,218 $10,300 2,412 1,967
333 382 3 49
$12,966 $12,698
Program Expenditures Media $73,275 Public Relations 10,815 Promotions 5,189 Strategic Thinking 979 Medical Advisory Panel 73 American Heart Association 120 Research, Local Markets, and Program Measurement 1,914 Program Management 1 254 Total Program Expenditures $93,619
Excess of Revenue (Under) Over Expenditures Beginning of Year Fund Balance End of Year Fund Balance
$1,600 $16,688 $18,288
$72,322 13,351 6,807 1,360
208 120
1,519
$95,687
($1,841) $18,288 $16,447
Source: Independent Auditor's Report of the National Fluid Milk Board and USDA records.
86
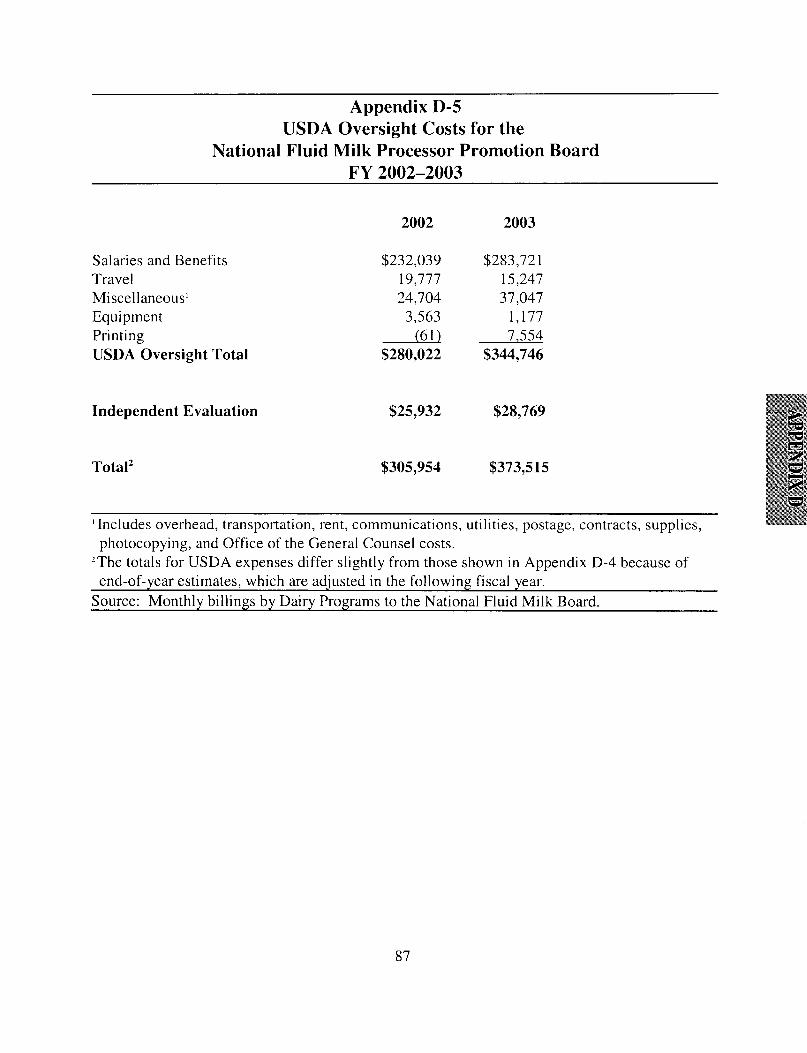
Appendix D-5 USDA Oversight Costs for the
National Fluid Milk Processor Promotion Board FY 2002-2003
2002 2003
Salaries and Benefits $232,039 $283,721 Travel 19,777 15,247 Miscellaneous ' 24,704 37,047 Equipment 3,563 1,177 Printing (61) 7,554 USDA Oversight Total $280,022 $344,746
Independent Evaluation $25,932 $28,769
Total 2 $305,954 $373,515
' Includes overhead, transportation, rent, communications, utilities, postage, contracts, supplies, photocopying, and Office of the General Counsel costs.
2The totals for USDA expenses differ slightly from those shown in Appendix D-4 because of end-of-year estimates, which are adjusted in the following fiscal year.
Source: Monthly billings by Dairy Programs to the National Fluid Milk Board.
87

Appendix D-6 National Fluid Milk Processor Promotion Board
Approved Budgets FY 2003-2004
(in $000's)
Revenues Assessments Interest Total Income
Reserve Fund Carryover from Previous Fiscal Year Total Available Funds
2003 2004
$105,800 $105,800
$105,800 $105,800
3,000 $5,328 $6,844
$111,128 $115,644
Expenses General and Administrative $2,140 USDA Oversight 380
1 Independent Evaluation
2 Processor Compliance Reserve/Contingency 1,000 California Refund 9,991 9,991
Subtotal $12,841 $13,511
$2,500 350
1
2
Program Budget Advertising $71,400 [73.2%] $71,701 Public Relations 13,275 [13.6%] 13,852 Promotions 8,500 [ 8.7%] 11,933 Strategic Thinking 1,400 [ 1.4%] 2,023 Medical Advisory Panel 200 [ 0.2%] 333 Research 1,650 [ 1.7%] 2159 Program Management 1,000 [ 1.0%] - Program Measurement 150 [ 0.2%1 128 Subtotal $97,575 [100%] $102,129 Unallocated 712 4
Total Budget $111,128 $115,644
[70.2%1 [13.6%] [11.7%1 [ 2.0%] [ 0.3%1 [ 2.1%1
[ 0.1%1 [100%1
Independent Evaluation costs are included in Program Measurement Expenses. 2 Processor Compliance is included in General and Administrative Expenses. Source: Budgets from the National Fluid Milk Board received and approved by USDA.
88

KPMG LLP 303 East Wacker Drive Chicago, IL 60601-5212
APPENDIX E-1
Independent Auditors' Report
The Board of Directors National Dairy Promotion and Research Board:
We have audited the accompanying balance sheets of National Dairy Promotion and Research Board (NDB) as of December 31, 2003 and 2002, and the related statements of activities and cash flows for the years then ended. These financial statements are the responsibility of the NDB's management. Our responsibility is to express an opinion on these financial statements based on our audits.
We conducted our audits in accordance with auditing standards generally accepted in the United States of America. Those standards require that we plan and perform the audit to obtain reasonable assurance about whether the financial statements are free of material misstatement. An audit includes examining, on a test basis, evidence supporting the amounts and disclosures in the financial statements. An audit also includes assessing the accounting principles used and significant estimates made by management, as well as evaluating the overall financial statement presentation. We believe that our audits provide a reasonable basis for our opinion.
In our opinion, the financial statements referred to above present fairly, in all material respects, the financial position of National Dairy Promotion and Research Board at December 31, 2003 and 2002, and the changes in its net assets and its cash flows for the years then ended in conformity with accounting principles generally accepted in the United States of America.
Our 2003 audit was made for the purpose of forming an opinion on the basic financial statements taken as a whole. The supplementary information included in the schedule of reconciliation of operations budget is presented for purposes of additional analysis and is not a required part of the basic financial statements. Such information has been subjected to the auditing procedures applied in the audit of the 2003 basic financial statements and, in our opinion, is fairly stated in all material respects in relation to the basic financial statements taken as a whole.
March 26, 2004, except for note 7, as to which the date is April 16, 2004
IIII KPMG LLP, a U.S. limited IiabiIRy partnership, is the U.S. member firm of KPMG Inlernational. a Swiss cooperative.
89
Chicago Office
~ Celebradn g
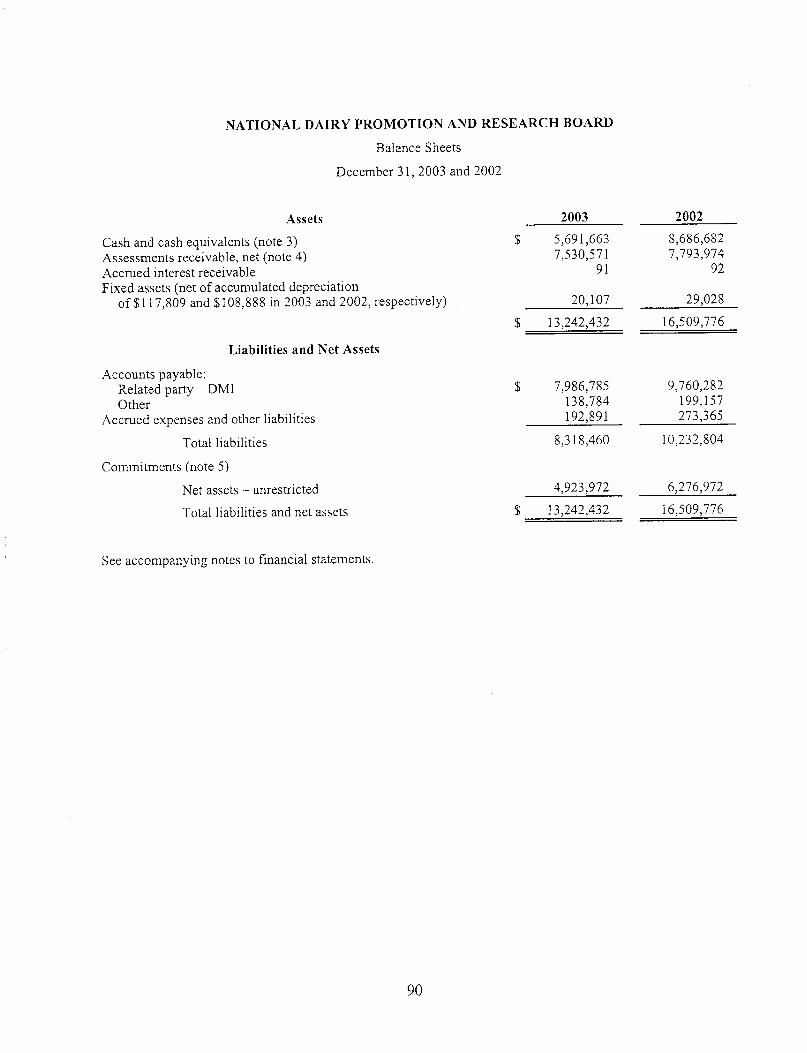
NATIONAL DAIRY PROMOTION AND RESEARCH BOARD
Balance Sheets
December 31, 2003 and 2002
Assets 2003 2002
Cash and cash equivalents (note 3) Assessments receivable, net (note 4) Accrued interest receivable Fixed assets (net of accumulated depreciation
of$117,809 and $108,888 in 2003 and 2002, respectively)
Liabilities and Net Assets
Accounts payable: Related party - DMI Other
Accrued expenses and other liabilities
Total liabilities
Commitments (note 5)
Net assets - unrestricted
Total liabilities and net assets
$ 5,691,663 7,530,571
91
20,107
$ 13,242,432
$ 7,986,785 138,784 192,891
8,318,460
4,923,972
$ 13,242,432
8,686,682 7,793,974
92
29,028
16,509,776
9,760,282 199,157 273,365
10,232,804
6,276,972
16,509,776
See accompanying notes to financial statements.
90

NATIONAL DAIRY PROMOTION AND RESEARCH BOARD
Statements of Activities
Years ended December 31, 2003 and 2002
Revenue: Assessments Interest income
Total revenue
Expenses: Program:
Domestic marketing group Research and evaluation group Communications/member relations group Export group United States Department of Agriculture
Total program
General and administrative: DMI general and administrative General and administrative
Total general and administrative
Total expenses
Decrease in net assets
Net assets at beginning of year
Net assets at end of year
2003
$ 86,148,864 42,161
86,191,025
60,710,527 4,952,087
13,007,120 5,251,770
554,121
84,475,625
2,632,108 436,292
3,068,400
87,544,025
(1,353,0(/0)
6,276,972
4,923,972
2002
86,619,316 71,972
86,691,288
68,113,912 3,491,799 8,269,055 4,933,680
454,482
85,262,928
2,467,207 452,260
2,919,467
88,182,395
(1,491,107)
7,768,079
6,276,972
See accompanying notes to financial statements.
91

N A T I O N A L D A I R Y P R O M O T I O N AND R E S E A R C H B O A R D
Statements of Cash Flows
Years ended December 31, 2003 and 2002
Cash flows from operating activities: Decrease in net assets Adjustments to reconcile decrease in net assets
to net cash provided by (used in) operating activities: Depreciation and amortization Changes in assets and liabilities:
Decrease in assessments receivable Decrease in accrued interest receivable Increase (decrease) in accounts payable Decrease in accrued expenses and other liabilities
Net cash provided by (used in) operating activities
Cash flows used in investing activities: Acquisition of fixed assets
Net increase (decrease) in cash and cash equivalents
Cash and cash equivalents at beginning of year
Cash and cash equivalents at end of year
2003
$ (1,353,000)
8,921
263,403 1
(1.833,870) (80,474)
(2,995:019)
(2,995,019)
8,686,682
$ 5,691,663
2002
( 1.491.1 (/7)
8,609
863,523 4,917
1,537,337 (63.349)
859,930
(3,120)
856,810
7,829,872
8,686,682
See accompanying notes to financial statements.
92

NATIONAL DAIRY PROMOTION AND RESEARCH BOARD
Notes to Financial Statements
December 3 I, 2003 and 2002
(1) Organization
The National Dairy Promotion and Research Board (NDB) was established on May 1, 1984, pursuant to The Dairy and Tobacco Adjustment Act of 1983 (Public Law 98-180), as part of a comprehensive strategy to reduce milk surplus supplies in the United States (U.S.) and increase human consumption of U.S.- produced fluid milk and other dairy products. The purpose of NDB is to establish a coordinated program of promotion and research designed to strengthen the U.S. dairy industry's position in the marketplace and to maintain and expand domestic and international markets' usage of U.S.-produced fluid milk and other dairy products.
The United States Department of Agriculture (USDA) approved a joint venture between NDB and the United Dairy Industry Association (UDIA) to form Dairy Management Inc. (DMI) effective January 1, 1995. The purpose of DMI, a related organization, is to promote greater coordination, efficiency, and effectiveness and avoid incompatibility and duplication in the marketing programs and projects undertaken by NDB and UDIA. NDB and UDIA will jointly plan, develop, and implement their various marketing programs and activities through DMI, subject to the approval of the USDA.
NDB funds DMI on a cost reimbursement basis. Core costs, which include staff salaries and benefits, travel, Board of Directors, and office overhead expenses are primarily funded by NDB, with UDIA funding one-half of Board of Directors and executive office costs. Marketing program costs, which include expenses associated with implementing the marketing programs of NDB and UDIA, are funded by NDB and UDIA based on the annual Unified Marketing Plan budget. NDB has funded DMI core costs of $14,213,094 and $13,862,831 and program costs of $72,340,518 and $73,412,822, for activity related to the years ended December 31, 2003 and 2002, respectively.
The U.S. Dairy Export Council (USDEC) is a related organization that was founded by the boards of both NDB and UDIA and began operations effective January I, 1996. The purpose of USDEC is to improve the marketing conditions for the U.S. dairy industry with respect to the export of U.S. dairy products by promoting the acceptability, consumption, and purchase of U.S. dairy products in international markets. For the years ended December 31, 2003 and 2002, NDB reimbursed DMI $5,251,770 and $4,933,680, respectively, for USDEC's operations.
(2) Summary of Significant Accounting Policies
The financial statements of NDB have been prepared on the accrual basis of accounting in accordance with accounting principles generally accepted in the United States of America. To facilitate the understanding of information included in the financial statements, summarized below are the more significant accounting policies.
(a) Cash Equivalents
NDB considers debt investment instruments with an original maturity of three months or less to be cash equivalents.
93 (Continued)

NATIONAL DAIRY P R O M O T I O N AND RESEARCH BOARD
Notes to Financial Statements
December 31, 2003 and 2002
(c)
(a)
(e)
69
(g)
(h)
,4ssessments
Assessment revenue is generated by a mandatory assessment of 15 cents per hundredweight on all milk produced and marketed in the contiguous United States. Milk handlers and marketers can receive a credit of up to 10 cents per hundredweight for payments to USDA qualified state and regional generic dairy promotion organizations. For the years ended December 31, 2003 and 2002, the net NDB assessment was approximately 5.11 and 5.13 cents per hundredweight of milk marketed, respectively. Assessment revenue is recognized in the month in which milk is marketed.
Fixed Assets
Fixed assets consist of computer equipment and software and are recorded at cost. Depreciation and amortization are provided in amounts sufficient to charge the cost of depreciable assets to operations over estimated service lives of five years using the straight-line method.
;Net Assets
All net assets of the NDB at December 3 l, 2003 and 2002 are unrestricted.
Contract and Grant Expense
Expenses related to contracts are recognized as incurred. Grants for research projects typically require periodic reporting of project status and payments. Such payments are expensed as progress is achieved. In addition, a portion of the fund balance is designated for future payments under existing contracts and grants (see note 5).
Income Taxes
NDB has received a determination letter from the Internal Revenue Service indicating that it is exempt from Fedcral and state income taxes on related income under 501(c)(3) of the Internal Revenue Code. There was no unrelated business taxable income for the years ended December 31, 2003 and 2002; therefore, no provision for income taxes has been reflected in the accompanying financial statements related to activities of NDB.
Use o f Estimates
Management of NDB has made certain estimates and assumptions that affect the reported amounts of assets and liabilities and the disclosure of contingent assets and liabilities at the date of the financial statements, and the reported amounts of revenue and expenses during the period. Actual results could differ from those estimates.
Employee Costs
NDB's operations are staffed by DMI employees, who receive vacation, retirement, health, and other benefits provided by DMI.
94 (Continued)

N A T I O N A L D A I R Y P R O M O T I O N AND RESEARCH B O A R D
Notes to Financial Statements
December 31, 2003 and 2002
(3) Cash and Cash Equivalents
Cash and cash equivalents consist of the following as of December 31 :
Operating cash in banks and on hand Federal agency discounted securities
2003 2002
$ 162,185 2,052,866 5,529,478 6,633,816
$ 5,691,663 8,686,682
(4) Assessments Receivable
(5)
Assessments receivable are recorded at the estimated net amounts to be received based on the amount of milk marketed and the average payment per hundredweight. In accordance with Public Law 98-180, NDB forwards unpaid assessments to the USDA for collection and other legal proceedings. As of December 3t , 2003 and 2002, approximately $80,000 and $367,000, respectively, of cumulative unpaid assessments were at USDA pending further action. Such amounts are not included in assessments receivable as of December 31, 2003 and 2002, and will not be recorded as revenue until such amounts are ultimately received. Civil penalties exist for any persons who do not pay the assessment and/or file required milk production assessment reports with NDB.
Net Assets
During 2003 and 2002, NDB's Board designated a portion of net assets for use in continued funding of programs and for cash reserves. Total designations of net assets are as follows:
Program designation for domestic marketing Cash reserves
Total designated net assets
Undesignated net assets
Total net assets - unrestricted
2003 2002
$ - - 643,132 1,800,000 1,800,000
1,800,000 2,443,132
3,123,972 3,833,840
$ 4,923,972 6,276,972
95 (Continued)

NATIONAL DAIRY PROMOTION AND RESEARCH BOARD
Notes to Financial Statements
December 31, 2003 and 2002
The program designations as of December 31, 2003 and 2002 relate to contract cormnitments made during the following years:
2003 2002
2003 $ - - - - 2002 - - 643,132
Totalcontractcommitments $ - - 643,132
(6)
(7)
Transactions with the United States Department of Agriculture
NDB reimburses the USDA for the cost of administrative oversight and compliance audit activities. These reimbursements amounted to $554,121 and $454,482 for the years ended December 31, 2003 and 2002, respectively.
Litigation
NDB and the United States Department of Agriculture (USDA) are defendants in a lawsuit that claims the Dairy Promotion Program established by the Dairy Promotion Stabilization Act of 1983 (the Dairy Act) violates the First Amendment right to free speech and free association. The lawsuit seeks injunctive relief from the mandatory assessment fees paid to NDB on milk produced and marketed in the contiguous United States. These mandatory assessment fees are the primary revenue source for the National Dairy Board (see note 2b).
In 2003, a federal trial court in Pennsylvania found that the Dairy Promotion Program does not violate the claimants' right of free speech and association. However, in February 24, 2004, a three-judge panel of the U.S. Court of Appeals for the Third Circuit reversed this decision and found that the Dairy Promotion Program does violate the claimants' right of free speech and association rights by compelling them to subsidize speech with which they disagree. Currently, no injunction has been issued against the collection of assessments. If this decision is not reversed, however, the Dairy Promotion Program and NDB may be forced to make significant modifications to its current operations or cease operations.
It has been represented to NDB that the USDA intends to vigorously defend against these claims. To that end, on April 9, 2004, the United States Justice Department (on behalf of NDB and the USDA) filed a petition with the Third Circuit requesting that all of the judges of that court reconsider the February 24 decision of the three-judge panel. That petition argues that the panel's decision conflicts with applicable Supreme Court precedents, a key Third Circuit precedent, and with the decisions of two other Circuits (the Ninth and Sixth Circuits) that each upheld the constitutionality of the Dairy Act and rejected the precise argument that the Third Circuit decided to accept. NDB believes that these are very strong arguments in favor of the constitutionality of the Dairy Promotion Program. However, at this time, it is not possible to predict the outcome of the litigation or whether an injunction will be issued against the collection of the assessments.
96

NATIONAL DAIRY PROMOTION AND R E S E A R C H B O A R D
Schedule of Reconciliation of Operations Budget
Year ended December 3 I, 2003
Organizational group expenses: Domestic marketing groul: Research and evaluation group Communications/member relations grour Export group DMI general and administrative General and administrative United States Department of Agriculture
Total organizational group expenses
2002 2003 2003 Commitments Operations Total expensed Budget
expenses in 2003 Statement
$ 60,710,527 643,132 4,952,087
13,007,120 5,251,770 2,632,108
436,292 554,121
60,067,395 4,952,087
13,007,120 5,251,770 2,632,108
436,292 554,121
$ 87,544,025 643,132 86,900,893
This schedule reconciles the total expenses from the Statement of Activities presented in accordance with accounting principle generally accepted in the United States of America to those reflected in the Operations Budget Statement which is used fo management's internal purposes.
The commitments expensed in 2003 represent management's contract commitments established prior to January 1,2003 which were expensed in the current year.
See accompanying independent auditors' report.
97

L ~ ' ' . Jb . . . . / G U U ~7 " . ~ J
KPMG LLP
303 East Wacker Drive
Chicago, IL 60601-5212
Independent Accountants' Report On Applying Agreed-upon Procedures
The Board of Directors National Dairy" Promotion and Research Board:
We have performed the procedures enumerated below, which were agreed to by the U.S. Department of A~iculture (USDA) and National Dairy Promotion and Research Board (NDB), solely to assist the specified parties in evaluating the entities' compliance with The Dairy and Tobacco Adjustment Act of 1983 (Act), the Dairy Promotion and Research Order (Order), and the A~iculturaI Marketing Services Directive (Directive) entitled [nves tments o f Pub l i c Funds as of and for the year ended December 31, 2003. This agreed-upon procedures engagement was conducted in accordance with attestation standards established by the American Institute of Certified Public Accountants. The sufficiency of these procedures is solely the responsibility of those parties specified in this report. Consequently, we make no representations regarding the sufficiency of the procedures described below either for the purpose for Which this report has been requested or for any other purpose.
Our procedures and findings were as follows:
(a) We obtained NDB's budget for the year ended December 31, 2003 and sighted the si~mture of the Secretary of the USDA.
(b) We selected four investment purchase transactions during the year ended December 31. 2003, compared them against their respective brokers' advices, and noted the following:
[] The investments purchased were in either U.S. Government Securities or Federal Agency Securities;
[] The investments had maturity periods of one year or less; and
[] The U.S. Government Securities and Federal Agency Securities were held in the narne of NDB at the custodial institution.
(c) We obtained the 1997 investment files and sighted various broker's advices noting that the investment records have been maintained for six years.
We were not engaged to, and did not conduct an examination, the objective of which would be the expression of an opinion on compliance. Accordingly, we do not express such an opinion. Had we performed additional procedures, other matters might have come to our attention that would have been reported to you.
This report is intended solely for the information and use of the USDA and NDB and is not intended to be and should not be used anyone other than these specified parties.
Mal-ch 26, 2004
| l | | K~MC: ._~, a U S =imi~ec hr.bi~ W pa;:nsrshl~, ~S :l~e U.~. member fkm ~f KPMG Intema6on~.~ a Swiss ¢c~r~era:~ve
98 C h i c a g o Off, i c e
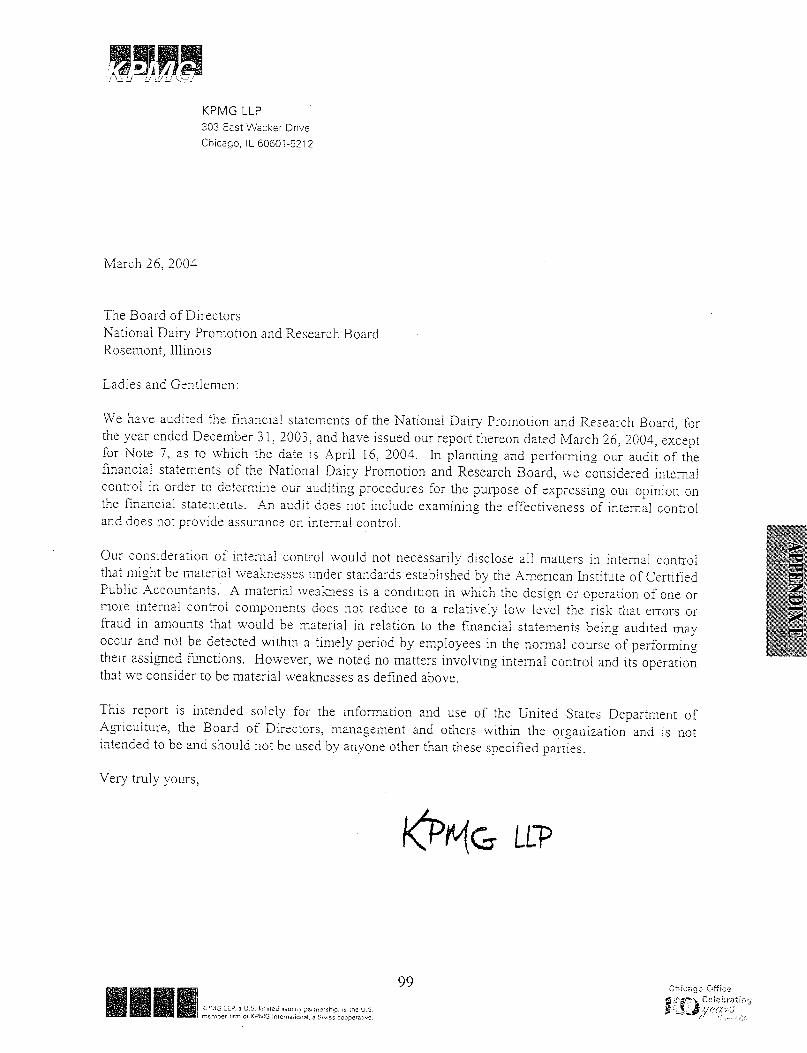
Z/ ' - L/ LI Lf/ LI '~b-2.
KPMG LLP 3 0 3 Eas t W a c k e r D r i v e
C h i c a g o , IL 6 0 6 0 1 - 5 2 1 2
March 26, 2004
The Board of Directors National Dairy Promotion and Research Board Rosemont, Illinois
Ladies and Gentlemen:
We have audited the financial statements of the National Dairy. Promotion and Research Board, for the year ended December 31, 2003, and have issued our report thereon dated March 26, 2004, except for Note 7, as to which the date is April 16, 2004. In planning and performing our audit of the financial statements of the National Dairy Promotion and Research Board, we considered internal control in order to determine our auditing procedures for the puqoose of expressing our opinion on the financial statements. An audit does not include examining the effectiveness of internal control and does not provide assurance on internal control.
Our consideration of intemaI control would not necessarily disclose all matters in internal control that might be material weaknesses under standards established by the American Lnstitute of Certified Public Accountants. A material weaI~ess is a condition in which the design or operation of one or more internal control components does not reduce to a relatively low level the risk that errors or fraud in amounts that would be material in relation to the financial statements bein~ audited may occur and not be detected within a timely period by employees in the normal courseof performing their assigmed functions. However, we noted no matters involving internal control and its operation that we consider to be material weaknesses as defined above.
This report is intended solely for the information and use of the United States Department of A~iculture, the Board of Directors, management and others within the organization and is not intended to be and should not be used by anyone other than these specified parties.
Very truly yours,
| l | l KPDiG LL~ a U.S. Ih:nIed ilabli~t' t, paltn~rsh,o ts the US rn¢n~oer iirm oi KPMG Intema iona, a S, iss cocpe adve
99 Chk:~gc Off ice ~ ~,~v~ ~ Ce lebra t ing

APPENDIX E-2
SNYDER-COHN-COLLYER-HAMILTON &. ASSOCIATES P.C.
Independent Auditor's Report
To the Board of Directors National Fluid Milk Processor
Promotion Board Washington, D.C.
We have audited the accompanying balance sheet of the National Fluid Milk Processor Promotion Board asof December 31,2003, and the related statements of revenues, expenses and changes in net assets and cash flows for the year then ended. These financial statements are the responsibil!ty of the National Fluid Milk Processor Promotion Board's management. Our responsibility is to express an opinion On these financial statements based on our audit.
We conducted our audit in accordance with auditing standards generally accepted in the United States of America and the standards applicable to financial audits contained in Government Auditing Standards, issued by the Comptroller General of the United States. Those standards require that we plan and perform the audit to obtain reasonable assurance about whether the financial statements are free of material misstatement. An audit includes examining, on a test basis, evidence supporting the amounts and disclosures in the financial statements. An audit also includes assessing the accounting principles used and significant estimates made by management, as well as evaluating the overall financial statement presentation. We believe that our audit provides a reasonable basis for our opinion.
In our opinion, thefinancial statements referred to above present fairly, in all material respects, the financial position of the National Fluid Milk Processor Promotion Board as of December 31, 2003, and the results of its operations, changes in its net assets and its cash flows for the year then ended in conformity with accounting principles generally accepted in the United States of America.
In accordance with Government Auditing Standards, we have also issued our report dated March 2, 2004 on our consideration of the National Fluid Milk Processor Promotion Board's internal control over financial reporting and on our tests of its compliance with certain provisions of laws, regulations, contracts, and grants. That report is an integral part of an audit performed in accordance with Government Auditing Standards, and should be read in conjunction with this report in considering the results of our audit.
*- P.
March 2, 2004 Bethesda, Maryland
Certified Public Accountants and Business Advisors
4520 East West Highway, .Suite 520, Bethesda, MD 20814-3338 Phone: 301-652-6700 Fax: 301-986-1028 100 Web: cpahelp.com E-Mail: [email protected]
B K R

National Fluid Milk Processor Promotion Board
Balance Sheet
December 31 ,2003
Assets
Current assets: Cash and cash equivalents Assessments receivable, net of allowance for
uncollectible accounts of $64,751 Interest receivable Other receivables
Total assets
$ I1,398,626
10,970,477 7,752
373 882
$ 22 750 737
Liabilities and net assets
Current liabilities: Accounts payable
Net assets: Designated for contingencies Undesignated
Total net assets
Total liabilities and net assets
6,303,801
1,500,000 14.946,936
16,446,936
22.750,737
See Accompanying Notes
101

National Fluid Milk Pr0cessor .Promotion Board
Statement of Revenues, Expenses and Changes in Net Assets
For the year e n d e d D e c e m b e r 31, 2003
R e v e n u e s :
Assessments California cut-in revenue Late payment charges Interest income Other
Total revenues
E x p e n s e s :
Program expenses: Media Promotions Public relations Strategic thinking Research Medical advisory panel American Heart Association Medical research Program measurement
Total program expenses
Other expenses: California grant Administrative USDA oversight USDA compliance audit
Total other expenses
Totalexpenses
E x c e s s of e x p e n s e s over revenues
Net assets - beginning
$ 105,992,120 132,850 40,036
370,342 8,968
106,544,316
72,321,925 6,807,355
13,350,945 1,360,304 1,349,436
208,373 120,000 20,957
148,223 95,687,518
10,299,826 1,966,747
382,304 48 956
12,697,833
108.385,351
(1,841,035)
18,287,971
Net assets - e n d i n g $ 16,446,936
See Accompanying Notes
102

National Fluid Milk Processor Promotion Board
Statement of Cash Flows
For the },ear ended December 31, 2003
Cash f lows from operating activit ies: Excess of expenses over revenues
Changes in assets and liabilities: Decrease in assessments receivable Increase in interest receivable
Increase in other receivables
Decrease in accounts payable
Net cash used in operating activit ies and net decrease in cash and cash equivalents
Cash and cash equivalents - beginning
(1,841,035)
396,426
(3,945) (173,574)
(1.340,29_5)_
(2,962,423)
14,361,049
Cash and cash equivalents - ending 11.398,626
See Accompanying Notes
103

National Fluid Milk Processor Promotion Board
Notes to Financial Statements
December 31, 2003
Note 1 : Summary of significant accounting policies:
The National Fluid Milk Processor Promotion Board (the Board) was established pursuant to the authority of the Fluid Milk Promotion Act (the Act) of 1990, Subtitle H of the Title XIX of the Food, Agriculture, Conservation and Trade Act of 1990. The purpose of the Board is to administer the provisions of the Fluid Milk Promotion Order (the Order) established pursuant to the Act which establishes an orderly procedure for the development, and the financing through an assessment, of a coordinated program of advertising, promotion, and education for fluid milk products.
The Act requires that a referendum be conducted among processors to determine if a majority favored implementing the fluid milk program. In the October 1993 initial referendum, the majority of processors voted to approve the implementation of the fluid milk program. A continuation referendum was held in February-March 1996. Of the processors voting in that referendum, the majority favored continuation of the fluid milk program. In November 1998, another continuation referendum was held at the request of the Board and processors voted to continue the fluid milk program as established by the Order. The Act and Order state that the United States Department of Agriculture (USDA) will hold future referenda upon the request of the Board, processors representing 10 percent or more of the volume of fluid milk products marketed by those processors voting in the last referendum, or when called by the U.S. Secretary of Agriculture.
For financial reporting purposes, the Board is considered a quasi-governmental agency of the U.S. government. As such, it is exempt from income taxes under the Internal Revenue Code. The USDA and its affiliated agencies operate in an oversight capacity of the Board.
The financial statements of the Board are prepared in conformity with accounting principles generally accepted in the United States of America. To facilitate the understanding of data included in the financial statements, summarized below are the more significant accounting policies.
Assessments - Beginning August 1, 2002, assessments are generated from those processors marketing more than 3,000,000 pounds of fluid milk per month by a 20-cent per hundred weight assessment on fluid milk products processed and marketed commercially in consumer-type packages in the 48 contiguous United States and the District of Columbia. Prior to August 1, 2002, the minimum monthly assessments were generated from processors marketing more than 500,000 pounds of fluid milk per month. Assessment revenue is recognized in the month in which the fluid milk product is processed.
I04

National Fluid Milk Processor Promotion Board
Notes to Financial Statements
December 31, 2003
Note 1: Summary of signif icant accounting policies: (continued)
Late payment charges are assessed, as provided under the Act, to processors who do not remit monthly assessments within 30 days following the month of assessment. The late payment charge is equal to .015% of unpaid assessments and accrues monthly. At no time does the Board stop accruing interest on these assessments. The Board's management has established a policy of reserving 50% of the late fee charges.
California qrant - in accordance with the Act, the Board is required to provide a grant to a third party equal to 80% of the assessments collected from Regions 14 and 15 to implement a fluid milk promotion campaign. Disbursements under these provisions are recorded as "California Grant" in the accompanying financial statements.
Cash equivalents - For purposes of the statement of cash flows, the Board considers investments with an original maturity of three months or less to be cash equivalents.
Use of estimates - The Board has made certain estimates and assumptions that affect the reported amounts of assets and liabilities and the disclosure of contingent assets and liabilities at the date of the financial statements, and the reported amounts of revenue and expenses during the period. Actual results could differ from those estimates.
Advertisinq - In accordance with its mission, the Board has approved the development of direct and nondirect response advertising and promotional activities. All costs related to these activities are charged to expense as incurred.
Note 2: Cash and cash equivalents:
At December 31, 2003, the bank balance of the Board's cash deposits was entirely covered by federal depository insurance or was covered by collateral held by the Board's agent in the Board's name.
Carrying Value
Cash deposits Repurchase agreements investments
$ 2,226,779 1,636,677 7,535,170
$11,398,626
At December 31,2003, the repurchase agreements were secured as to principal plus accrued interest by U.S. government securities held in the respective banks' safekeeping account, in the Board's name, with the Federal Reserve Bank.
105

National Fluid Milk Processor Promotion Board
Notes to Financial Statements
December 31, 2003
Note 2: Cash and cash equivalents: (continued)
The Board is required to follow the Agricultural Marketing Service (AMS) investment policy. Accordingly, the Board is authorized to invest in securities consisting of obligations issued or fully insured or guaranteed by the U.S. or any U.S. government agency, including obligations of government-sponsored corporations, and must mature within one year or less from the date of purchase. At December 31,2003, investments consist entirely of U.S. government agency obligations. Investments are carried at cost, which approximates fair value. The Board's investments are held by the counterparty's trust department or agent in the Board's name.
At December 31,2003, investments consisted of the following:
U.S. Securities: FHLMC discount note FHLMC discount note FHLB discount note FHLMC discount note FNMA discount note
Issue Maturity Interest Carrying Date Date Rate Amount
10/31/03 01/08/04 1.06% $ 999,964 11/07/03 01/29/04 1.07 2,507,798 12/04/03 02/25/04 1.06 500,773 12/10/03 02126/04 1.05 1,022,668 12/19/03 03/24/04 1.05 2,503,967
$7.535,170
At December 31,2003, the Board was owed accrued interest of $7,752.
Included in cash and cash equivalents is $1,500,000 of Board designated cash reserves.
Note 3: Compliance matters:
In accordance with the Act and the Order, effective one year after the date of the establishment of the Board, the Board shall not spend in excess of 5% of the assessments collected for the administration of the Board. For the year ended December 31, 2003, the Board did not exceed this limitation.
106

National Fluid Milk Processor Promot ion Board
Notes to Financial S ta tements
December 31, 2003
Note 4: Program administration:
The Board entered into an agreement with the International Dairy Foods Association (IDFA) to administer the fluid milk program. Under this agreement, IDFA engages outside organizations to develop programs for advertising, promotion, consumer education, and certain minority initiatives. The organizations are:
• Draft (began January 2004) • Bozell Worldwide, Inc./Lowe & Partners Worldwide • Flair Communication, Inc. (ended January 2004) • Weber Shandwick Worldwide • Siboney USA
In 2003, Lowe & Partners Worldwide succeeded Bozell Worldwide, Inc. as a result of their merger.
Under this and related agreements, IDFA also directly provides program management, administrative support and employee benefits management services and leases office space to the Board. During the year ended December 31, 2003, the Board incurred approximately $2,021,000 for directly provided services. At December 31, 2003, the Board owed IDFA $484,080 for costs billed under these agreements.
Note 5: Commitments:
The Board entered into an agreement during fiscal year 2000 with Walt Disney World Hospitality & Recreation Corporation (WDWHRC), whereby the Board will pay WDWHRC $1,800,000 each year for the next six years through 2006 in exchange for the sponsorship and certain promotional rights at the Sports Complex in order to cooperatively develop programs to promote fluid milk products at Walt Disney World Resort. In December 2003, both parties agreed to extend the term of the agreement for another three years through 2009 at the previously agreed rate of $1,800,000 to be increased annually by the change in the Consumer Price Index.
In 2002, the Board entered into a five-year agreement with the American Heart Association. Under the agreement, the Board pays the American Heart Association $120,000 annually from 2002 to 2007 for use of the logo on the processors' milk containers.
107
National Fluid Milk Processor Promotion Board
Notes to Financial Statements
December 31, 2003
Note 6: Operating lease:
The Board incurred $118,800 of rental expense during 2003, under a sublease with an automatic renewal option. For 2004, the annual lease payment under the contract will be $124,800.
Note 7: Transactions with the United States Department of Agriculture:
Under the provisions of the Act and the Order, the Board is required to pay the United States Department of Agriculture certain fees for oversight and evaluation costs. These costs were $431,260 during 2003.
Note 8: Related party activity:
Accounting services for the Board are performed by Rubin, Kasnett & Associates, P.C. (RK&A); the cost of these services was $264,362 during 2003. A principal of RK&A serves as the Chief Financial Officer of the Board and receives compensation for services performed.
The Board has entered into an employment agreement with its Chief Executive Officer (CEO). The agreement runs from January 1,2004 to December 31,2006 and provides for annual compensation, benefits and increases based upon the CEO's annual performance evaluation. The agreement also includes provisions that would require severance payments on early termination of the agreement.
108
NATIONAL FLUID MILK PROCESSOR PROMOTION BOARD AUDIT
SUPPLEMENTARY INFORMATION: PART I
109

%% ~ 4, ̀2 SNYDER.COHN.COLLYER'HAMILTON & ASSOCIATES P,C.
Independent Auditor's Report on Supplementary Information
To the Board of Directors National Fluid Milk Processor
Promotion Board Washington, D.C.
Our report on our audit of the basic financial statements of the National Fluid Milk Processor Promotion Board for 2003 appears on page 1. We conducted our audit for the purpose of forming an opinion on the basic financial statements taken as a whole. The supplemental information presented on pages 12 to 15 for the year ended December 31, 2003 is presented for purposes of additional analysis and is not a required part of the basic financial statements. Such information has been subjected to the auditin 9 procedures applied in the audit of the basic financial statements and, in our opinion, is fairly stated in all material respects in relation to the basic financial statements taken as a whole.
March 2, 2004 Bethesda, Maryland
Certified Public Accountants and Business Advisors
4520 East West Hi c, hway, Suite 520, getl;esda, MD 20814-3338 Pilone: 301-652-6700 Fax: 3,,)1-986-1028
Web: cpahelp.corn E-Mail: [email protected] ] ] 0
B K R

National Fluid Milk Processor Promotion Board
Schedule of Revenues and Expenses Actual Compared to Budget
(Budget Basis)
For the year ended December 31, 2003
Revenues:
Assessments California cut-in revenue Late payment charges Interest income Other Carryover - prior years
Totalrevenues
Expenses:
Program expenses: Program - current year Program - prior years
Total program expenses
Other expenses: California grant Administrative USDA oversight
Total other expenses
Less encumbrances - prior years
Total expenses
Unexpended/ Actual Amended Current Year Over (Under)
Budget Actual Budqet
$ 105,800,000
5.249.500
111.049.500
$ 105,992,120 $ 192,120 132,850 132,850 40,036 40,036
370,342 370,342 8,968 8,968
(5,249,500)
106,544,316 (4,505,184)
98,500,800 93,639,096 (4,861,704) 6,164,045 2,048.422 (4,115,623)
104,664,845 95 687.518 (8,977,327)
9,991,000 10,299,826 308,826 2,117,700 1,966,747 (150,953)
440,000 431 260 (8,740) 12,548,700 12,697,833 149,133
(6,164,045) 6,164,045
111,049,500 108,385,351 (2,664,149)
Excess of expenses over revenues
111

National Fluid Milk Processor Promotion Board
Schedule of Program Expenses Actual Compared to Budget
(Budget Basis)
For the year ended December 31,2003
Expenses-2003 budget
I'O
Current Year Expended Actual Prior Yea r Expended Actual Total Amended Current Year Over (Under) Unexpended Prior Year Over (Under) Program
Budget Actual Budget Bud qet Actual Budget Activity
Media $ 72,272,000 $ 71,712,635 $ (559,365) $ 1,308,661 $ 609,290 $ (699,371) $ 72,321,925 Promotions 8,229,000 6 ,588 ,885 (1,640,115) 1,917,314 218,470 (1,698,844) 6,807,355 Public relations 13,819,000 13,258,798 (560,202) 318,184 92,147 (226,037) 13,350,945 Strategic thinking 1,686,000 1 ,010 ,828 (675,172) 646,295 349,476 (296 ,819 ) 1,360,304 Research 1,930,000 824,300 (1,105,700) 1,047,485 525,136 (522 ,349 ) 1,349,436 Medical advisory panel 340,000 203,593 (136,407) 126,418 4,780 (121,638) 208,373 American Heart Association - 480,000 120,000 (360,000) 120,000 Medical research 62,500 3,427 (59,073) 153,120 17,530 (135,590) 20,957 Program measurement 162,300 _ _ _ ~ 6 3 0 (125,670) 166,568 111,593 (54,975) 148,223
Total programexpenses $ 98,500,800 $ 93,639,096. $ (4,861,70~ $ 6,164,045 $ 2,048,422 ~ $ 95,687,518
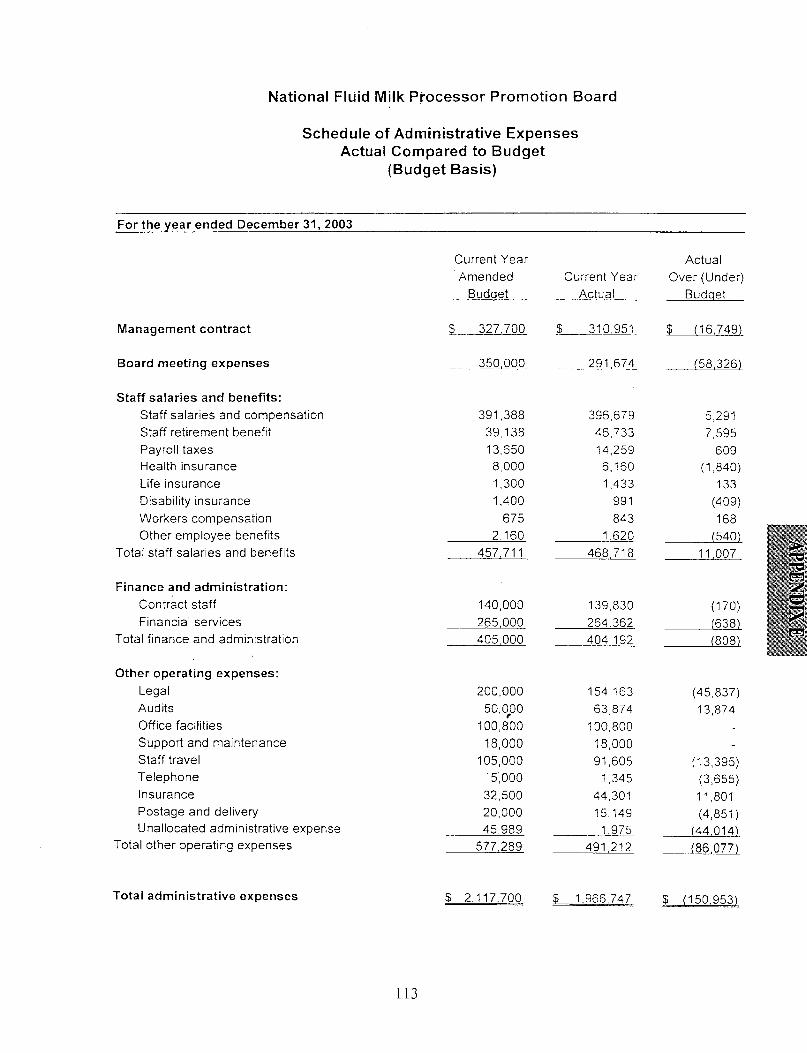
National Fluid Milk Processor Promotion Board
Schedule of Administrative Expenses Actual Compared to Budget
(Budget Basis)
For the year ended December 31, 2003
Management contract
Board meeting expenses
Staff salaries and benefits: Staff salaries and compensation Staff retirement benefit Payroll taxes Health insurance Life insurance Disability insurance Workers compensation Other employee benefits
Total staff salaries and benefits
Finance and administration: Contract '~ ~ St,~fl Financial services
Total finance and administration
Other operating expenses: Legal Audits Office facilities Support and maintenance Staff travel Telephone Insurance Postage and delivery Unallocated administrative expense
Total other operating expenses
Current Year Amended
Budget
$ 327.700
350,000
391,388 39,138 13,650 8,000 1,300 1,400
675 2,160
457.711
140,000 265,000 405,000
200,000 50,~00
100,800 18,000
105,000 5~ooo 32,500 20,000 45 989
577,289
Current Year Actual
$ 310.951
291.674
396,679 46,733 14,259 6,160 1,433
991 843
1.620 468 718
139,830 264.362 404.192
154,163 63,874
100,800 18,000 91,605
1,345 44,301 15,149
1.975 491.212
Actual Over (Under)
Budqet
$ (16,749)
(58,326)_
5,291 7,595
6O9 (1,840)
133 (409) 168
(540) 11,007
(170) (638) (808)
(45,837) 13,874
(13,395) (3,655) 11,801 (4,851)
(44,014) (86,077)
Total administrative expenses $ 2.117,7Q0 $ 1,966,747 $ (150,953)
113

N a t i o n a l F lu id M i l k P r o c e s s o r P r o m o t i o n B o a r d
S c h e d u l e o f C a s h R e c e i p t s a n d D i s b u r s e m e n t s
For the year ended December 31,2003
Cash receipts from operations: Assessments California cut-in revenue Late payment charges Interest income Other
Total revenues
Cash disbursements for operations
Excess of disbursements over operating receipts
Cash and cash equivalents - beginning
106,214,972 132,850 40,036
366,397 8,968
106,763,223
(109,725,646)
(2,962,423)
14,361,049
Cash and cash equivalents - ending $ 11,398,626
114

NATIONAL FLUID MILK PROCESSOR PROMOTION BOARD AUDIT
SUPPLEMENTARY INFORMATION: PART II
115

SNYDER-COHN-COLLYER-HAIV I ILTOhl & ASSOCIATES P.C.
Independent Auditor's Report on Compliance and on Internal Control Over Financial Reporting Based on an Audit of Financial Statements Performed in Accordance with
Government Auditing Standards
To the Board of Directors National Fluid Milk Processor
Promotion Board Washington, D.C.
We have audited the financial statements of the National Fluid Milk Processor Promotion Board as of and for the year ended December 31, 2003, and have issued our report thereon dated March 2, 2004. We conducted our audit in accordance with auditing standards generally accepted in the United States of America and the standards applicable to financial audits
• contained in Government Auditing Standards issued by the Comptroller General of the United States.
Compliance As part of obtaining reasonable assurance about whether the National Fluid Milk Processor Promotion Board's financial statements are free of material misstatement, we performed tests of its compliance with certain provisions of laws, regulations, contracts and grants, noncompliance with which could have a direct and material effect on the determination of financial statement amounts. However, providing an opinion on compliance with those provisions was not an objective of our audit and, accordingly, we do not express such an opinion.
Internal Control Over Financial Reportin.q In planning and performing our audit, we considered the National Fluid Milk Processor Promotion Board's internal control over financial reporting in order to determine our auditing procedures for the purpose of expressing our opinion on the financial statements and not to provide assurance on the internal control over financial reporting. Our consideration of the internal control over financial reporting would not necessarily disclose all matters in the internal control over financial reporting that might be material weaknesses. A material weakness is a condition in which the design or operation of one or more of the internal control components does not reduce to a relatively low level the risk that misstatements in amounts that would be material in relation to the financial statements being audited may occur and not be detected within a timely period by employees in the normal course of performing their assigned functions. We noted no matters involving the internal control over financial reporting and its operation that we consider to be material weaknesses.
Certified Public Accountants and Business Advisors
4520 Eas'c West Highway, Suite 520, Bethesda, MD 20814-3338 Phone: 301-652-6700 Fax: 301-986-1028
Vveb; cpahelp corn E-Mail: [email protected] 1 16
B K R

To the Board of Directors National Fluid Milk Processor
Promot ion Board Page two
This report is intended solely for the information and use of the National Fluid Milk Processor Promotion Board, management of the National Fluid Milk Processor Promotion Board, and the Dairy Programs, Promotion and Research Branch of the Agricultural Marketing Service Agency of the United States Department of Agriculture and is not intended to be and should not be used by anyone other than these specified parties.
March 2, 2004 Bethesda,. Maryland
117

NATIONAL FLUID MILK PROCESSOR PROMOTION BOARD AUDIT
SUPPLEMENTARY INFORMATION: PART III
118

SNYDER'COHN-COLLYER'HAiVllLTON & ASSOCIATES P.C.
To the Board of Directors 'National Fluid Milk Processor
Promotion Board Washington, D.C.
We have audited, in accordance with auditing standards generally accepted in the United States of America and the standards applicable to financial statement audits contained in Government Auditing Standards issued by the Comptroller General of the United States, the balance sheet of the National Fluid Milk Processor Promotion Board as of December 31,2003, and the related statements of revenues, expenses, and changes in net assets and cash flows for the year then ended, and have issued our report thereon dated March 2, 2004. The financial statements were ,prepared in conformity with accounting principles generally accepted in the United States of America.
In connection with our audit, nothing came to our attention, insofar as it relates to accounting matters, that causes us to believe that the National Fluid Milk Processor Promotion Board:
• Failed to comply with laws and regulations applicable to the National Fluid Milk Processor Promotion Board;
Failed to comply with Section 1160.212 of the Fluid Milk Promotion Order, relating to the use of assessment funds for the purpose of influencing governmental policy or action;
Expended assessment funds for purposes other than those authorized by the Fluid Milk Promotion Act and the Fluid Milk Promotion Order;
Expended or obligated assessment funds on any projects prior to the fiscal year in which those funds were authorized to be expended by the National Fluid Milk Processor Promotion Board's approved Budget and Marketing Plan;
• Did not adhere to the original or amended Budget and Marketing Plan for the year ended December 31, 2003;
• Did not obtain a written contract or agreement with any person or entity providing goods or services to the National Fluid Milk Processor Promotion Board;
Certified Public Accountants and Business Advisors
4520 East WescHighway, Suite 520, Bethesda, MD 20814-3338 Phone: 301-652-6700 Fax: 30i-986-1028
Web: cpahelp:corn E-Mail: [email protected] ] 19
g K R

To the Board of Directors National Fluid Milk Processor
Promotion Board Page two
%
Failed to comply with Section 1999H, paragraph (g) of the Fluid Milk Promotion Order, relating to the limitations on the types of investments which may be purchased by the National Fluid Milk Processor Promotion Board and the insurance or collateral that must be obtained for all National Fluid Milk Processor Promotion Board deposits and investments;
• Failed to comply with internal controls;
• Failed to comply with disclosure requirements for lease commitments;
Failed to comply with standards established requiring signed contracts, USDA approval letters (if necessary), contract term documentation within the file, and CFO's signature on the Board approval letter; or
Failed to comply with the By-laws of the National Fluid Milk Processor Promotion Board or any other policy of the National Fluid Milk Processor Promotion Board, specifically as they relate to all financial matters, including time and attendance, and travel.
However, our audit was not directed primarily toward obtaining knowledge of such noncompliance.
This report is intended solely for the information and use of the National Fluid Milk Processor Promotion Board, management of the National Fluid Milk Processor Promotion Board, and the Dairy Programs, Promotion and Research Branch of the Agricultural Marketing Service Agency of the United States Department of Agriculture and is not intended to be and should not be used by anyone other than these specified parties.
March 2, 2004 Bethesda, Maryland
120

Appendix F-1 National Dairy Promotion and Research Board
and Dairy Management Inc. Contracts Reviewed by USDA, 2003
Advertising and Marketing Services
Affina Corporation-Real Seal ® Certification Program American School Food Service Association-School Foodservice Publications; School Milk Pilot Consulting Services Broadcast Traffic and Residuals, Inc.-Fluid Milk and Cheese Broadcast Materials and Talent Activities California Milk Advisory Board-Retail Butter Promotion Activities Campbell Mithun (Lowe Worldwide)-Advertising Services; National Accounts-Milk and Cheese Foodservice Activities DDB Worldwide Communications Group-Cheese Creative Advertising; Media Planning Services; 3-A-Day of Dairy Creative Advertising Flair Communications Agency-Fluid Milk Sales Promotion Activities General Mills Marketing-41st Pillsbury Bake-off Contest; Print Media Buying Inland Printing Company, Inc.-Milk Merchandise Material Production and Distribution; Warehousing and Production of Creative Materials; and DMI Materials Website Maintenance J. Brown and Associates-DMI Cheese Co-Marketing Program Keliogg's USA, Inc.-NASCAR Sponsorship; Joint Milk and Cereal Promotion Activities Media Management Services-School Marketing Strategic Planning; International School Milk Conference Planning Media Vest Worldwide-Print Planning and Buying Services Midwest Dairy Association-National Retail Account Services NFL Properties, LLC-Promotional Activities; Logo Usage Rights Olson Communications-School Foodservice Merchandising Materials; Mealtime Sampler Activities; Milk Vending Promotion Kits; School Cafeteria Promotion Activities; Foodservice Program Activities School Foodservice and Nutrition-Nutrition Magazine Inserts Slack Barshinger and Partners-Integrated Marketing Communications Wendy's International-Plastic Milk Container Tests
Public Relations and Nutrition Education
Association Partners Plus-Communications and Cooperative Education Projects Cardan Company-Grade 2 Nutrition Education Programs Child Nutrition Foundation-School Foodservice Program Activities Cleveland Dovington Partners, Inc.-Information Technology Services and Consulting
121

Appendix F- l , continued
Public Relations and Nutrition Education, continued
Dairy Farmers, Inc.-Communication Activities, NASCAR Public Relations Destination Imagination, Inc.-Destination Imagination Sponsorship Edelman Public Relations Worldwide-Web site www.dairynutrition.com Maintenance; Health Professional Outreach and Key Leader Retreat; Dairy First Program; Dairy Spokesperson Network, Nutrition Communications Program; 5-A-Day Strategic Counsel; Food Guide Pyramid/Dietary Guidelines Counsel; Cheese and Butter Publicity; Food Marketing Institute Project; 3-A-Day Web Marketing Program; NASCAR Publicity Program Fleishman Hillard-Reputation Management Program Food, Research, and Action Center-After School Feeding Program Brochure Development The Fratelli Group-Healthy School Environment Initiative; Food Guide Pyramid/Dietary Guidelines Support; Dairy Image Protection Health and Nutrition Network-Public Relations Activities I-Site Web Design-www.familyfoodzone.com and www.nationaldairycouncil.org Image Base Corporation-Video News Release Production Integer Group-Dairy Industry Communications Program Jack Morton Worldwide-www.3aday.org and www.ilovecheese.com Web site Design Jerry Dryer Group-Dairy Issues Management Media Management Services-Pyramid Cafr/Pyramid Explorations Newsletter National Dairy Shrine-Dairy Scholarship Program Results Direct-DMI Website Activities Tucker-Knapp-DMI Customer Service Technical Liaison; Extraordinary Dairy ® Marketing (Innovation); Nonfat Milk/Whey Program-Do it With Dairy ® (Ingredients) Weber Shandwick, Inc.-Reputation and Issues Management; Fluid Milk Public Relations; Crisis Preparedness Program; Responsible Production Program; Dairy Image/Dairy Confidence Program Activities; Retail Service Team Activities Willard Bishop-Expanding the Reach of Dairy Educational Series
E_~.port
American-Mexican Marketing-Mexican Market Representation and Program Activities; Mexican Trade Show and Cheese Promotion Activities Another Color, Inc.-Development and Design of USDEC Publications Arab Marketing Finance-Middle East Market Representation and Program Activities Arc Group, Ltd.-USDEC Corporate Identity Program Contacts International Consulting, Ltd.-South American Market Representation and Program Activities Dairymark.com-Whey Permeate Product Supplier Study Functional Ingredients Research, Inc.- Korean Whey Nutrient-Marketing Conference and Trade Mission
122

Appendix F-l, continued
Export, continued
Global Trade Information Services-Purchase of World Trade Atlas International Dairy Foods Association-Update of USDEC Export Manuals International Trade Services-Update of USDEC's International Reference Manuals IntNet-Korean Market Representation and Program Activities; Cheese Seminar Activities J.J. Keller and Associates-Addition of CODEX Milk Standards to Export Manual CD-ROM Jerry Dryer Group-USDEC International Communications Activities Landell Mills-Update of Global Dairy Blends Study; Central America Dairy Market Study; Canada/USA Dairy Trade Analysis; Market Study for Dairy Products in Korea; Opportunities Study for Dairy Nutraceuticals; Multinational Ingredient User Dossier Levitt Communication-International Consulting Services Mistral Group, Ltd.-European Market Representation and Program Activities National Milk Producers Federation-Global Research Activities; Farm to Consumer Program Activities PR Consultants-Chinese Market Representation and Program Activities Pacrim Associates-Southeast Asian Market Representation and Program Activities Patricia R. Fuchs & Associates-USDEC Print Project Management Results Direct-USDEC Web site Activities Uniflex Marketing-Japanese Market Representation and Program Activities; Japanese Dry Ingredients Program
Market and Economic Research
A.C. Neilson-Butter Data Access Academic Network-Food Guide Pyramid Strategic Counseling ARS Group-Print Advertising Evaluation Beverage Marketing Corporation of New York-Evaluation of the Effectiveness of Generic Milk Programs; School Milk Promotional Test Consulting Services Burelle's Newsclip Analysis Service-Media Monitoring and Analysis CFE Solutions, Inc.-School Milk Pilot Consulting/Milk Consumption Research Activities; Healthy Schools, Inc., Consulting Services CY Research, Inc.-Milk and Cheese Creative Testing; Dairy Weight Loss Research Awareness Custom Research, Inc.-Cheese and 3-A-Day Advertising Campaign Impact Assessment; Health Professional Dairy Nutrition Tracking Study Datacore Marketing-Database Management and Consulting Doyle Research Associates-Web Site Usability Qualitative Research; Business to Business Qualitative Research; Chocolate/White Milk Qualitative Research Eirick and Lavidge-Cheese Advertising Tracking Activities; Milk Advertising Tracking Activities
123

Appendix F-l, continued
Market and Economic Research, continued
Focus Management Services-U.S. Milk Industry School Audit Information Resources, Inc.-Milk and Cheese Category Volume Reports K.A. Enterprise-African American Usage, Attitudes, and Associations with Dairy Products KRC Research-3-A-Day Tracking Survey Knowledge Networks-NASCAR Promotion Awareness Research; Fluid Milk Advertising Tracking Research/Mom's Tracking Study MSW-Chocolate Milk Advertising Evaluation/Cheese Advertising Tests; Milk Televison Advertising Focus Group Analysis; Cheese Copy Testing MangoLogic-Online Consumer Surveys Market Facts-Attitudes and Usage Trends Study Marketecture-Attitudes and Usage Trends Study Analysis; Tracking Activities of Public Opinion Toward Dairy Products and the Dairy Industry (Issues Tracker) Marketing Concepts-Product Innovation and Research Program Marva Maid Dairy-New Look of School Milk Implementation Maskowitz-Jacobs-Consumer Interviews on Milk and Soy Preferences Mintel International Group-New Products Database and Market Intelligence Reports National Medical Association-Role of Dairy in the African American Diet National Milk Producers Federation-Domestic Research Program Activities/Animal Health and Welfare Issues Activities NFO Research-Purchase and Analysis of Marketing Data; Consumer Interest Assessment in Dairy Products Enhanced with Nutraceuticals NPD Group-Cheese Consumption Tracking Activity; CREST Foodservice Data; Eating Patterns Data Report; Food Safety and Dieting Monitor Report; Eating Trends and Beverage Study; Breakfast in America Report; Lactose Intolerance Survey; Food World Subscription Prime Consulting Group-Retail Innovation Study Results Workshop Promar International-School Milk Analysis and Consultation Promata-Leemiss Services-Online Advertising Activity Data Pursuant, Inc.-Milk-Producing Livestock Cloning/Dairy Consumption Research; Obesity and Healthcare Research; Dairy Production Practices Attitude Research RSC-The Quality Measurement Co.-3-A-Day Testing Activities; Milk Print Advertising Tests; Cheese Advertising Creative Persuasion Tests Roper ASW-Plate Waste Study; Student Surveys Sachs Marketing and Research-Dairy Weight Loss Claims Study Spectra Marketing Systems-Marketing Research Activities Strategic Marketing-Kids Milk Advertising Evaluation Summit Research, Inc.-NFL After School Program Talent Partners-Broadcast Traffic Services
124
Appendix F-l, continued
Market and Economic Research, continued
TDI Management-Development and Implementation of DMI Strategic and Annual Planning Technomic-Understanding Obesity and its Foodservice Impact Teri Gacek Associates-Qualitative Market Research Assignments; 3-A-Day Advertising Focus Group Analysis The Travis Company-NDC Promotional Kit Evaluation Research Turover Straus Group-Strategic Blueprint Development; Concept Development: Dairy-Based Salad Dressing and Spreads Upshot Corporation-Sales Force Outreach and Data Delivery System Widener-Burrows and Associates-Qualitative Research for Chocolate Milk Program Analysis Wirthlin Worldwide-Producer Communications Survey; Pyramid Education Program Research
125

Appendix F-2 National Fluid Milk Processor Promotion Board
and International Dairy Foods Association Contracts Reviewed by USDA, 2003
Contractor and Initiatives
Susan Baker, M.D.-Medical Advisory Board Member Services Susan Barr, Ph.D.-Medical Advisory Board Member Services Robert P. Heaney, M.D.-Creighton University-Medical Advisory Board Member Services James O. Hill, Ph.D.-Medical Advisory Board Member Services Rachel Johnson, Ph.D., R.D.-Medical Advisory Board Member Services Jeanette M. Newton-Keith, M.D.-Medical Advisory Board Member Services Ronald M. Krauss, M.D.-Medical Advisory Board Member Services American Heart Association-Certification Mark Licensing Agreement; Product Nomenclature Bachtelle and Associates-Consulting Services and Vending Seminars Beverage Marketing Corporation of New York-Consulting/Competitive Strategy Development Blueprint Communications-Radio and Television Buy Analysis Diagonostic Research-Market Research: Chocolate Milk Television Advertisements ECI Communications-Marketing Video, Presentation, and Brochure Environ International Corporation-Consulting Services and Research Flair Communications, Inc.-Promotional Marketing Services Forecasting and Business Analytics, LLC-Literature Review - Fluid Milk Products by Region and Size Herbein Company-Analysis of School Milk Pilot Test Report J. Heimbach, LLC-Development of Nutrition Marketing Manual Look Look-On-line Surveys Menendez International-Hispanic Market Research Outlond-Marketing Communications Potomac Digitek-www.Milkplan.org Web site Services Prime Consulting Group-Consulting Services, Survey Analysis; Promotion Assessments Snyder, Cohn, Collyer, Hamilton & Associates, P.C.-Audit Services Taylor Nelson Sofres-Hispanic Consumer Market Research Weber Shandwick, Inc.-Public Relations Activities and Sponsorships; MilkSplash Web Template Widner Burrows-Assessment of Dairy Attitudes on Weight Loss Wirthlin Worldwide-Assessment of Print and Television Milk Advertisements
126

Appendix G-1 Nutrition and Health Research Institutes and Dairy Foods Research Centers, 2003
Nutrition and Health Research Institutes
Diet, Genetics, and Heart Disease Institute Louisiana State University, Pennington Biomedical Research Center: Diets to Heart Disease
Relationship of Low-Fat
Genetics and Nutrition Institute Children's Hospital, Oakland Research Institute: Relationship of Genetics, Dietary Fat (Especially Dairy Fat), and Heart Disease
Dairy Foods Research Centers
California Dairy Research Center (University of California-Davis and California Polytechnic State University-San Luis Obispo) Specializes in product technology development, ingredient technology, product health enhancement properties, food safety, and quality assurance.
Minnesota/South Dakota Dairy Food Research Center (University of Minnesota-St. Paul and South Dakota State University-Brookings) Concentrates on natural and processed cheese functionality and flavor, fluid milk flavor and shelf life, genomics of probiotic bacteria, and utilization of acid and salt whey.
Northeast Dairy Foods Research Center (Cornell University-Ithaca and University of Vermont-Burlington) Focuses attention on developing and improving processing technologies to enhance dairy product quality, safety, and functionality, improving the safety of foods and processing systems, and modifying dairy product composition to ensure that dairy foods and ingredients remain a part of a healthy diet.
Southeast Dairy Foods Research Center (North Carolina State University-Raleigh and Mississippi State University-Starkville) Specializes in milk and whey ingredient functionality, thermal and biological processing, sensory properties of cheese and dairy ingredients, dairy food safety, and microbial technologies for starter cultures and probiotics.
Western Dairy Center (Utah State University-Logan, Oregon State University-Corvalis, Washington State University-Pullman, and University of Idaho-Moscow) Specializes in cheese flavor and functionality, fluid milk processing, whey and milk utilization, and microbial genetics and physiology.
127

Appendix G-l, continued
Wisconsin Center for Dairy Research (University of Wisconsin-Madison) Explores functional flavor and physical properties of cheese and cheese products, whey and whey components, and milk components used as ingredients and as finished products, cheese making and whey processing and separation procedures, use of milkfat, and food safety and quality technology.
128

Appendix G-2 Dairy Foods Competitive Research Activities, 2003
Principal Investigator, Institution, and Project Title
William R. Aimutis, Ph.D. (Land O' Lakes): Physical and Biochemical Changes Associated with Shredded Cheese During Ripening [continued in 2003]
Valente B. Alvarez, Ph.D. (Ohio State University Research Foundation): Flavor Changes During Extended Shelf Life of PET Bottled Ultrapasteurized Milk [began in 2003]
Polly Dinsmore-Courtney, Ph.D. (Ohio State University Research Foundation): Control of Cheddar Cheese Ripening Via High Pressure Treatment [continued in 2003]; 5'-Nucleotide Monophosphate Flavor Enhancer Content in Aged Cheddar Cheese [began and completed in 2003]
Susan E. Duncan, Ph.D. (Virginia Polytechnic Institute): Controlled Release of Antioxidants Polymer Films into Milk [continued in 2003]; Polymeric Inhibition of Photosensitive Reactions of Milk Components [completed in 2003]
Robert W. Hutkins, Ph.D. (Virginia Polytechnic Institute): Utilization of Fructooligosaccharides by Probiotic Bacteria [continued in 2003]
Michael E. Mangino, Ph.D. (Ohio State University Research Foundation): Partial Denaturation to Improve Heat Stability of Whey Protein - Part II [continued in 2003]
Joseph E. Marcy, Ph.D. (Virginia Polytechnic Institute): Improved Uses of Natamycin to Prevent Mold Spoilage of Cheese [continued in 2003]; Active Packaging to Improve the Quality of UHT Milk [continued in 2003]; Ensuring Stability of Natamycin on Shredded Cheese to Prevent Mold Growth [began in 2003]
John U. McGregor, Ph.D. (Clemson University): Fluid Dairy Products as Ingredients in Freshly Prepared Coffee House [continued in 2003]; Enhancing the Shelf Life of Whole Milk Powder [continued in 2003]
C. Morr (Independent): Development of a Membrane Fractionation Scheme for Producing Lactose-Reduced Milk [began and completed in 2003]
Ronaid L. Richter, Ph.D. (Texas A&M University): Effects of Formulation and Processing on the Emulsion Stability and Sedimentation of Retort Sterilized Dairy-Based Nutritional Products- Part II [continued in 2003]; Control of Properties/Stability of High Whey Protein Concentration Retorted Beverages [began in 2003]
129

Appendix G-2, continued
K. Schmidt, Ph.D. (Kansas State University): Ingredient Technology and Interactions for Stable, Nutritionally Designed Milk-Based Beverages [began in 2003]
Richard L. Stroshine, Ph.D. (Purdue Research Foundation): Low Field Proton Magnetic Resonance for On-Line Monitoring of the Moisture Content of Processed Cheese and Other Dairy Products [continued in 2003]
Margaret Swearingen, Ph.D. (Land O' Lakes): Calcium Lactate Levels and Incidence of Crystals on Cheddar Cheese [continued in 2003]
130

Appendix G-3 Nutrition Competitive Research Activities, 2003
Principal Investigator, Institution, and Project Title
Dale E. Bauman, Ph.D. (Cornell University): Effect of Milkfat Derived Trans Fatty Acids on Changes in Plasma Lipoproteins Related to the Development of CHD [began in 2003]
Jean Harvey-Berino, Ph.D. (University of Vermont): Can Dairy Enhance Weight Loss? [continued in 2003]
Leann L. Birch, Ph.D. (Pennsylvania State University): Parental Influence on Girls' Calcium Intake and Bone Mineral Content and Weight Status [continued in 2003]; Parental Influence on Girls' Calcium Intake and Bone Mineral Content and Weight Status-Phase II [began in 2003]
Terri D. Boyston, Ph.D. (Iowa State University): Development of a Yogurt with Increased CLA Content Produced with Probiotic Bacteria-Part H [completed in 2003]
Gary M. Chan, M.D. (Children's Medical Center Foundation): The Effects of Dairy Foods on Adolescent Pregnant Mothers and Their Newborns [continued in 2003]
Joseph Donnelly, Ph.D. (University of Kansas Center for Research, Inc.): The Effects of Dairy Intake on Weight Management and Metabolic Profile [began in 2003]
Adam Drewnowski, Ph.D. (University of Washington): New Measures of Nutrient Density and Nutrient Content Cost [began in 2003]
Penny Kris-Eatherton, Ph.D. (Pennsylvania State University): Effects of a Dairy-Rich Diet on Blood Pressure and Vascular Reactivity [continued in 2003]; Role of LDL and HDL Particle Size in Response to Diet Susceptibility to Oxidative Modification [began in 2003]
Christine Eonomos, Ph.D. (Tufts University): What Predicts Dairy Intake, Bone Mass, and Body Composition in Early Children [began in 2003]
Rafael Jiminez-Florez, Ph.D. (California Polytechnic State University Foundation): Isolation of Milk Membrane Components from Buttermilk and their Impact on Health [completed in 2003]
Steve Heymsfield, Ph.D. (St. Luke's-Roosevelt Hospital): The Effect of a Mixed Nutrient Versus a Single Nutrient Beverage on Energy Metabolism, Substrate Oxidation, and Indices of Satiety and Food Intake in Children [began in 2003]
Steve Hertzler, Ph.D. (Ohio State University): Colonic Bacterial Adaptation to Lactose in African-American Maldigesters [continued in 2003]
131

Appendix G-3, continued
James Hill, Ph.D. (University of Colorado): Role of Dairy Products in Promoting Fat Oxidation in Humans [continued in 2003]
Bess Dawson-Hughes, Ph.D. (Tufts University): Dietary Protein and Calcium Homeostasis: Impact of Aromatic Versus Branched-Chain Amino Acids on Urinary Calcium Excretion [began in 2003]
Clement Ip, Ph.D. (Roswell Park Cancer Institute): Mammary Cancer Prevention by CLA- Butter [continued in 2003]
Jeanette Newton-Keith, M.D. (University of Chicago): Misperceptions of Lactose Intolerance in African Americans [began in 2003]
Teresa A. Marshall, Ph.D. (University of Iowa): Assessment of Associations Between Consumption of Milk and Milk Products and Growth and Body Composition in the Young Child [continued in 2003]
Velmir Matkovic, Ph.D. (Ohio State Research Foundation): pQCT of the Forearm in Children with Fractures [continued in 2003]; Traits in Body Composition in Young Females Consuming Dairy Products [began and completed in 2003]
J. Metz, Ph.D. (Oregon Health Sciences University): Lowfat Dairy Products Reduce Anti- hypertensive Drug Therapy-Phase II [began in 2003]
Vikram V. Mistry, Ph.D. (South Dakota State University): Effect of Processed Cheese With and Without Vitamin D 3 o n Vitamin D Status, Parathyroid Hormone, and Bone Turnover in the Elderly [continued in 2003]
Lynn L. Moore, Ph.D. (Boston University School of Medicine): Effects of Milk and Milk Products on Changes in Body Fat and Risk of Obesity Throughout Childhood [continued in 2003]; The Effect of Dietary Calcium on Body Fat Levels in Children and Adults [began in 2003]; and Dairy Intake: Its Determinants and Relation to a Healthy Diet Throughout Childhood [began in 2003]
Aviva Must, Ph.D. (Tufts University): Influence of Milk and Milk Products Consumption on Incident Obesity and Changes in Children, Adolescents, and Young Adults [completed in 2003]; 3-A-Day of Dairy: Related Dietary and Behavioral Factors in Adolescent Girls [began in 2003]
132

Appendix G-3, continued
Theresa A. Nicklas, Ph.D. (Baylor College of Medicine): Environmental Influences on Children's Consumption of Dairy Products-Family Environment [continued in 2003]; Dietary Calcium Intake and Dairy Product Consumption by Children and Young Adults-Nutritional Impact and Health Outcomes [began in 2003]; and Environmental Influences on Children's Food Consumption, Specifically Dairy Products-Day Care Environment [began in 2003]
Stuart Phillips, Ph.D. (McMaster University): Effectiveness of Milk and Soy in the Promotion of an Anabolic Environment to Maximize Increase in Exercise-induced Muscle Protein Balance [completed in 2003]; The Effectiveness of Milk Consumption in the Promotion of Resistance Training-induced Lean Mass Gains in Novice Weightlifters [continued in 2003]
J. Story, Ph.D. (Purdue Research Foundation): Regulation of Cholesterol Metabolism by CLA- Rich Milkfat [began and completed in 2003]
Debra Sullivan, Ph.D. (University of Kansas Medical Center): Effects of Increased Dairy Product Consumption on Blood Pressure in Multi-Ethnic Population of Elementary School Children [continued in 2003]; Synergistic Effect of Dairy Foods on Metabolism-A Mechanistic Study [began in 2003]
Dorothy Teegarden, Ph.D. (Purdue Research Foundation): Effect of Calcium Education Intervention on Body Fat Mass in Adolescents [continued in 2003]
Warren Thompson, M.D. (The Mayo Clinic): Effects of High Dairy, High Fiber, Low Glycemic Index, Low Energy Density Diet on Weight, Body Fat, and Glucose Tolerance [continued in 2003]
Kevin Tipton, Ph.D. (University of Texas): Stimulation of Muscle Anabolism by Milk Following Resistance Exercise [began and completed in 2003]; The Effectiveness of Milk Consumption in Promotion of Training-induced Lean Mass Gains in Novice Weightlifters [began in 2003]
John P. Vanden Heuvel, Ph.D. (Pennsylvania State University): Modulation of Diabetes by Conjugated Linoleic Acid [completed in 2003]
Michael B. Zemel, Ph.D. (University of Tennessee Research Foundation): Role of Whey Proteins in Enhancing the Anti-obesity Effects of Calcium [completed in 2003]; Role of Dairy Foods in Reducing Body Fat and Enhancing Weight Loss in African-American Adults [continued in 2003]; Role of Dairy Products in Weight Loss: A Multi-Center Trial [continued in 2003]; Role of Dairy Products in Weight Maintenance [began in 2003]; and Effects of Calcium-Rich Dairy Products on Body Composition and Weight Loss in African-American Adults [began in 2003]
133

Appendix H Qualified State or Regional Dairy Product Promotion,
Research, or Nutrition Education Programs, 2003
Allied Milk Producers' Cooperative, Inc. 495 Blough Road Hooversville, PA 15936-8207
American Dairy Association and Dairy Council Mid East 5950 Sharon Woods Boulevard Columbus, OH 43229
American Dairy Association and Dairy Council, Inc. 219 South West Street, Suite 100 Syracuse, NY 13202
American Dairy Association of North Carolina 9201 Bunsen Parkway, Suite 100 Louisville, KY 40220
American Dairy Association of South Carolina 9201 Bunsen Parkway, Suite 100 Louisville, KY 40220
American Dairy Association of South Dakota 2015 Rice Street St. Paul, MN 55113
American Dairy Association of Alabama 5340 West Fayetteville Road Atlanta, GA 30349-5416
American Dairy Association of Virginia 9201 Bunsen Parkway, Suite 100 Louisville, KY 40220
American Dairy Association of Georgia 5340 West Fayetteville Road Atlanta, GA 30349-5416
American Dairy Association of Kentucky 9201 Bunsen Parkway, Suite 100 Louisville, KY 40220
American Dairy Association of Michigan, Inc. 2163 Jolly Road Okemos, MI 48864
American Dairy Association of Mississippi 5340 West Fayetteville Road Atlanta, GA 30349-5416
American Dairy Association of Nebraska, Inc. 8205 F Street Omaha, NE 68127-1779
California Manufacturing Milk Producers Advisory Board 3800 Cornucopia Way, Suite D Modesto, CA 95358-9492
California Milk Producers Advisory Board 3800 Cornucopia Way, Suite D Modesto, CA 95358-9492
Dairy Council of California 1101 National Drive, Suite B Sacramento, CA 95834-1945
Dairy Council of Michigan, Inc. 2163 Jolly Road Okemos, MI 48864
Dairy Council of Nebraska, Inc. 8205 F Street Omaha, NE 68127-1779
134

Appendix H, continued
Dairy Farmers, Inc. 166 Lookout Place, Suite 100 Maitland, FL 32751-4496
Dairy MAX, Inc. 2415 Avenue J, Suite 111 Arlington, TX 76006-6119
Dairy Promotion, Inc. Dairy Farmers of America P.O. Box 909700 Kansas City, MO 64190-9700
Georgia Agricultural Commodity Commission for Milk 19 Martin Luther King Jr., S.W., Room 328 Atlanta, GA 30334
Granite State Dairy Promotion c/o New Hampshire Department of Agriculture 25 Capitol Street, Box 2042 Concord, NH 03302-2042
Idaho Dairy Products Commission 1365 North Orchard, Suite 203 Boise, ID 83706
Illinois Milk Promotion Board 1701 N. Towanda Avenue P.O. Box 2901 Bloomington, IL 61702-2901
Indiana Dairy Industry Development Board ISTA Center 150 W. Market Street, Suite 414 Indianapolis, IN 46204
Kansas Dairy Commission 301 Broadway Belvue, KS 66407
Louisiana Dairy Industry Promotion Board c/o Louisiana Department of Agriculture and
Forestry P.O. Box 3334 Baton Rouge, LA 70821-3334
Maine Dairy and Nutrition Council 333 Cony Road Augusta, ME 04330
Maine Dairy Promotion Board 333 Cony Road Augusta, ME 04330
Michigan Dairy Market Program P.O. Box 8002 Novi, MI 48376-8002
Mid-Atlantic Dairy Association 325 Chestnut Street, Suite 600 Philadelphia, PA 19106
Midwest Dairy Association 2015 Rice Street St. Paul, MN 55113
Midwest Dairy Council 2015 Rice Street St. Paul, MN 55113
Milk for Health on the Niagara Frontier, Inc. 4185 Seneca Street West Seneca, NY 14224
Milk Promotion Services of Indiana, Inc. 9360 Castlegate Drive Indianapolis, IN 46256
135

Appendix H, continued
Minnesota Dairy Research and Promotion Council 2015 Rice Street St. Paul, MN 55113
Pennsylvania Dairy Promotion Program c/o Pennsylvania Department of Agriculture 2301 North Cameron Street Harrisburg, PA 17110-9408
Nebraska Dairy Industry Development Board 8205 F Street Omaha, NE 68127-1779
Promotion Services, Inc. 5340 West Fayetteville Road Atlanta, GA 30349-5416
Nevada Farm Bureau Dairy Producers' Committee 2165 Green Vista Drive, Suite 205 Sparks, NV 89431
New England Dairy and Food Council 1034 Commonwealth Avenue Boston, MA 02215
New England Dairy Promotion Board, Inc. 1 Kennedy Drive, Suite L7 South Burlington, VT 05403
New Jersey Dairy Industry Advisory Council c/o New Jersey Department of Agriculture P.O. Box 330 Trenton, NJ 08625-0330
New York State Department of Agriculture and Markets Division of Milk Control and Dairy Services 10 B Airline Drive Albany, NY 12235
North Dakota Dairy Promotion Commission 2015 Rice Street St. Paul, MN 55113
Oregon Dairy Products Commission 10505 Southwest Barbur Boulevard Portland, OR 97219
Rochester Health Foundation, Inc. c/o American Dairy Association and Dairy Council, Inc. 219 South West Street, Suite 100 Syracuse, NY 13202
St. Louis District Dairy Council 1254 Hanley Industrial Court St. Louis, MO 63144-1912
Southeast United Dairy Industry Association, Inc. 5340 West Fayetteville Road Atlanta, GA 30349-5416
Southwest Dairy Museum, Inc. P.O. Box 936 Sulphur Springs, TX 75483
Tennessee Dairy Promotion Committee 9201 Bunsen Parkway, Suite 100 Louisville, KY 40220
United Dairymen of Arizona 2008 South Hardy Drive Tempe, AZ 85282
Utah Dairy Commission-Dairy Council of Utah/Nevada 1213 East 2100 South Salt Lake City, UT 84106
136

Appendix H, continued
Vermont Dairy Promotion Council 116 State Street, Drawer 20 Montpelier, VT 05620-2901
Washington State Dairy Council 4201 198th Street, S.W., Suite 102 Lynnwood, WA 98036-6757
Washington State Dairy Products Commission 4201 198th Street, S.W., Suite 101 Lynnwood, WA 98036
Western Dairy Farmers' Promotion Association 12000 North Washington Street, Suite 200 Thornton, CO 80241
Wisconsin Milk Marketing Board, Inc. 8418 Excelsior Drive Madison, W! 53717
137