Report to Congress on Dual Language Learners in Head Start ...
202
REPORT TO CONGRESS ON DUAL LANGUAGE LEARNERS IN HEAD START AND EARLY HEAD START PROGRAMS Administration for Children and Families U.S. Department of Health and Human Services Washington, D.C. 20447
Transcript of Report to Congress on Dual Language Learners in Head Start ...
REPORT TO CONGRESS ON DUAL LANGUAGE LEARNERS IN HEAD START AND EARLY HEAD START PROGRAMS
Administration for Children and Families US Department of Health and Human Services
Washington DC 20447
TABLE OF CONTENTS
EXECUTIVE SUMMARY 3
CHAPTER I INTRODUCTION 23 DEFINITION OF DUAL LANGUAGE LEARNERS 23 REQUIREMENT IN THE HEAD START ACT FOR THE REPORT (SECTION 649(H)) 25 RESEARCH QUESTIONS 26 DATA SOURCES 27
Head Start Program Information Report (PIR) 27 Head Start Family and Child Experiences Survey (FACES) 29 Early Head Start Family and Child Experiences Survey (Baby FACES) 31 Limitations of Data for this Population 32
ANALYSES 34 ORGANIZATION OF THE REPORT 35
CHAPTER II CHARACTERISTICS OF DLLS 36 METHODOLOGY 36 CHARACTERISTICS OF DLLS AND THEIR FAMILIES 36 DIFFERENCES BETWEEN DLLS AND CHILDREN FROM MONOLINGUAL ENGLISH HOMES 45
CHAPTER III HEAD START AND EARLY HEAD START SERVICES PROVIDED TO DLLS 50 METHODOLOGY 50 SERVICES PROVIDED TO DLLS AND THEIR FAMILIES 52
Service Approaches 52 Classroom Features and Quality 53 Characteristics and Quality of Home Visits in Early Head Start 55 Other Services 56 Parent Satisfaction 58
DIFFERENCES BETWEEN DLLS AND CHILDREN FROM MONOLINGUAL ENGLISH HOMES 58
CHAPTER IV QUALIFICATIONS AND TRAINING OF STAFF WHO SERVE DLLS 62 METHODOLOGY 62 CHARACTERISTICS AND QUALIFICATIONS OF STAFF SERVING DLLS 62
Teachers Caring for DLLs in Early Head Start Head Start and MSHS 63 Home Visitors Caring for DLLs in Early Head Start 65 Managers Overseeing Teachers and Home Visitors Caring for DLLs in Early Head Start and Head Start 66
DIFFERENCES BETWEEN DLLS AND CHILDREN FROM MONOLINGUAL ENGLISH HOMES 68
CHAPTER V LANGUAGES USED BY STAFF WHO SERVE DLLS 73 METHODOLOGY 73 LANGUAGES USED BY STAFF SERVING DLLS 73
CHAPTER VI DEVELOPMENTAL PROGRESS MADE BY DLLS IN EARLY HEAD START AND HEAD START 76 METHODOLOGY 76 DEVELOPMENTAL PROGRESS OF DLLS IN EARLY HEAD START 79 DEVELOPMENTAL PROGRESS OF DLLS IN HEAD START 80 DEVELOPMENTAL PROGRESS OF DLLS COMPARED WITH CHILDREN FROM MONOLINGUAL ENGLISH HOMES 88
CHAPTER VII DISCUSSION 92 WHAT THE DATA TELL US ABOUT DLLS IN EARLY HEAD START AND HEAD START 92 LIMITATIONS OF THE DATA 93 DIRECTIONS FOR THE FUTURE 100
APPENDIX TABLES 105
Report to Congress on DLLs in Head Start Page | 2
EXECUTIVE SUMMARY
INTRODUCTION
The Improving Head Start for School Readiness Act of 2007 (PL 110-134 hereafter the Head Start Act) requires the Secretary of the Department of Health and Human Services (HHS) to conduct a study on the status of limited English proficient children and their families participating in Head Start programs (including Early Head Start Migrant and Seasonal Head Start and tribal programs) The Office of Head Start has long required programs to support children who speak languages other than English at home in ways that are culturally and linguistically responsive including promoting both their home language and English language development and providing comprehensive services in ways that are culturally responsive These requirements are consistent with provisions of the Head Start Act) which emphasizes improving outreach enrollment and quality of services to children with limited English proficiency
The use of varying terms and definitions by different researchers and policy makers can complicate learning about children and families who are not native English speakers Thus this introduction starts by defining the group that is the focus of this report After establishing terminology we present the research questions addressed in the report and the data sources and analytic methods used to address the research questions Finally we summarize the key findings from the report
Definition of Dual Language Learners (DLLs) In this study we use the term dual language learners (DLLs) to encompass limited English proficient (LEP) as defined in the Head Start Act This term is recognized in the Early Childhood Field as one used for a child who comes from a home where a language other than English is spoken A DLL is a child learning two (or more) languages at the same time or a child learning a second language while continuing to develop their first (or home) language DLL also includes key groups of children served in American IndianAlaska Native (AIAN) and Migrant and Seasonal Head Start (MSHS) programs AIAN or MSHS children served in programs located in federal regions not under the auspices of AIAN Head Start or MSHS and children served in programs in Puerto Rico and US territories
Research Questions The Head Start Act put forward several questions about this sizeable group of children and the services provided to them (the actual text from the legislation is included in the report) In response the report addresses the following questions
1 What are the characteristics of children who are dual language learners (DLLs) and their families receiving Head StartEarly Head Start services
2 What is the nature of the Head StartEarly Head Start services provided to children who are DLLs and their families
3 What are the qualifications and training of Head Start and Early Head Start teachersstaff that serve children who are DLLs and their families
4 What are the languages that Head Start and Early Head Start teachersstaff use in relation to the children and families they serve
Report to Congress on DLLs in Head Start Page | 3
5 What developmental progress is observed in children who are DLLs in Head StartEarly Head Start programs
To provide important context for interpreting the answers to these questions the report also highlights differences in each area between DLLs and children from homes where English is the primary language spoken
The report makes use of three existing datasets designed to describe the experiences of children in Head Start programs to address as many of the questions posed by Congress as possible The report also discusses the limitations of current data and current research methodologies to address many of the questions that are of critical interest to policy makers and practitioners Some of these questions can be thoroughly answered such as describing the demographics of DLLs who are served by Head Start and Early Head Start Other questions can only be answered partially For example available data can describe the range and nature of services offered to children and families however the content duration and intensity of all types of services cannot be described in as much detail as desired (eg quality or intensity of instructional supports for language and literacy development) The report provides as much of a response as the available data and existing methods can reliably address For example reporting the rate of progress made by children who are dual language learners and their families enrolled in Head Start programs is limited by the state of the field more broadly in the area of assessment of young dual language learners (discussed more in the report) For some questions important information is available beyond that specified in the Act such as in the area of qualifications and training provided to teachers While data do not exist to answer some of the questions posed by Congress at this time several efforts are underway to build capacity in this area in order to improve the state of knowledge about the children and families served by Head Start as well as those served by other early childhood programs Such efforts funded by ACF are discussed in the final chapter of the report
Data Sources The current report utilizes three datasets to describe the children and families enrolled in Head Start programs and their experiences in the programs the Head Start Program Information Report (PIR) the Head Start Family and Child Experiences Survey (FACES) the Early Head Start Family and Child Experiences Survey (Baby FACES) In this section we present a brief overview of each of the data sources analyzed for this report and we briefly explain the limitations of the data for the purposes of this report Please refer to the full report and to the supporting documentation for each data source for more information regarding the respective research designs samples and data limitations
Head Start Program Information Report (PIR) The Office of Head Start Program Information Report (PIR) provides comprehensive descriptive data on the services and staff of Head Start and Early Head Start programs nationwide1 All grantees and delegate agencies are required to submit Program Information Reports annually The report presents data from the 2007-2008 program year which were the most current PIR data available at the time that data analyses began
1 For more information on the Office of Head Start Program Information Report (PIR) see descriptions and survey
forms on the ACF website at httpeclkcohsacfhhsgovhslcHead percent20Start percent20Programpir
Report to Congress on DLLs in Head Start Page | 4
Information from the PIR is aggregated at the program or grantee level and therefore it is not possible to break down and examine the data by subsets of children such as children who are dual language learners Primarily we use PIR data in the report to describe program characteristics including enrollment regional distribution program options qualifications of staff and services available to and received by childrenfamilies at the grantee- regional- and national-level These data permit us to look at the staff and services provided by grantees with different concentrations of children and families speaking languages other than English at home For example where are grantees with higher concentrations of children and families speaking languages other than English located
The PIR is the only data source that provides information about the universe of Head Start programs including Migrant and Seasonal Head Start (MSHS) programs American Indian and Alaska Native (AIAN) programs and programs in Puerto Rico and other US territories This permits us to describe limited demographic characteristics of children and families enrolled in MSHS and AIAN-HS and the program options and types of services available to and utilized by families enrolled in these programs
Head Start Family and Child Experiences Survey (FACES) The Head Start Family and Child Experiences Survey (FACES) is a nationally representative cohort study of 3- and 4-year-old children enrolled in Head Start2 The report uses data from the 2006 cohort which includes 3shyand 4-year-old children who entered Head Start in the fall of 2006 their families and local program staff
FACES complements PIR data by bringing analyses down to the child and family level We present FACES data from interviews with parents at Head Start entry and exit interviews with teachers education coordinators and center directors teacher reports of each child at Head Start entry and exit observations of Head Start classrooms in the spring of 2007 and direct child assessments at Head Start entry and exit FACES data are used in the report to describe at the individual level (1) characteristics and experiences of children and families enrolled in Head Start (2) staff qualifications credentials and beliefs (3) classroom practices and quality and (4) developmental progress of children
FACES data permit us to describe the characteristics and experiences of children and their families by varying degrees of exposure to languages other than English (ie children whose parents primarily use a language other than English to speak with them children with low English proficiency at Head Start entry) Due to the small sample sizes among groups of children speaking languages other than English or Spanish and limited assessment tools in these other languages FACES has far more data on Spanish-speaking children in Head Start than on children speaking any other non-English languages Children were not assessed directly if they could not be assessed in English and they spoke a language other than Spanish
For multiple reasons FACES has not sampled from programs operated by federally recognized AIAN tribes consortia or corporations MSHS programs or programs located in Puerto Rico and the Pacific Islands Therefore FACES data cannot be used to describe children
2 For more information on the Head Start Family and Child Experiences Survey (FACES) see technical reports on
the ACF website httpwwwacfhhsgovprogramsoprehsfaces
Report to Congress on DLLs in Head Start Page | 5
and families served by these programs These limitations are discussed in greater depth in the full report and in the FACES technical reports
Early Head Start Family and Child Experiences Survey (Baby FACES) The Early Head Start Family and Child Experiences Survey (Baby FACES) is a nationally representative sample of infants who enrolled in Early Head Start in 20093 We use data from the 1-year-old cohort which includes children who were between 10 and 15 months of age at the time of data collection in the spring of 2009 their families and local program staff
Baby FACES supplements PIR and FACES data with a focus on infants served by the Early Head Start programs and by bringing analyses down to the child- and family-level for this group The report presents analyses of Baby FACES baseline data collected in spring of 2009 from interviews with parents interviews with home visitors and caregivers interviews and self-administered surveys with program directors home visit observations and direct classroom observations These data are used to describe at the individual level (1) characteristics and developmental status of 1 year old children in Early Head Start (2) program services including quality of home visits and classrooms (3) staff qualifications and credentials and (4) family well being parent-child interactions and aspects of the home environment
aby FES data provide a snapshot of infants developmental status and family experiences when children are 1 (and eventually will depict these children at 2- and 3-years old) Baby FACES data permit analyses of children by DLL status However as described above due to the small sample sizes of families speaking non-Spanish LOTEs and the lack of reliable instruments in languages other than English and Spanish we are unable to present as much information about infants in families where non-Spanish LOTEs are spoken
Limitations of Research for this Population The limitations of extant research and methodology concerning young children who are dual language learners (DLLs) restrict the quality of data that are available on DLLs in Head Start and Early Head Start programs Both FACES and Baby FACES utilized the best and most feasible methods available at the time of data collection for nationally representative comprehensive large-scale studies to represent the experiences of young children who are dual language learners These two studies represent th e cutting-edge of national surveys in assessing development of young children who are dual language learners (DLLs) but they had to balance the need to represent the experiences of all children in Head Start and Early Head Start respectively with a commitment to accurately reflect the experiences of DLLs As discussed more fully in the report data on developmental progress of DLLs is generally limited for Head Start as for other early childhood programs by lack of widely recognized reliable measurements in the field at this point in time
Operational Definitions The report operationally defines DLLs as children for whom a language other than English (LOTE) was spoken at home as reported by parents Most of the findings reported reflect children who match this definition Analyses of PIR data distinguish children who live in homes where a LOTE was spoken regardless of which language was dominant in the home Children for whom English was the primary or only language that
3 For more information on the Early Head Start Family and Child Experiences Survey (Baby FACES) see technical reports on the ACF website at httpwwwacfhhsgovprogramsopreehsdescriptive_studyindexhtml
Report to Congress on DLLs in Head Start Page | 6
parents reported speaking at home are referred to throughout the report as children from monolingual English homes There is diversity in the language experiences of children in both of these groups nearly one out of four DLLs live in homes where English is also spoken and nearly one out of four children from monolingual English homes hear other languages at home Clearly distinguishing home language experiences in dichotomous or simple terms is not fully accurate or completely satisfactory However as with the vast majority of research studies investigating the implications of home language experiences this report must present analyses and findings in somewhat simple terms due to limited subgroup sizes and for the sake of clarity of discussion Within the findings presented on childrens developmental progress DLLs are distinguished into two groups DLLs who passed an English language screener and were administered an assessment battery in English) and DLLs who did not pass the screener and completed an assessment battery in Spanish In general the data described do not include children in AIAN or MSHS programs except where noted Also the data do not include children and programs in Puerto Rico and other US territories as speaking a language other than English in these contexts where English is not the dominant language does not have the same meaning
This executive summary provides a synopsis of the major findings regarding children who are dual language learners their families and the services they receive
KEY FINDINGS
A CHARACTERISTICS OF DLLs What are the characteristics of children who are dual language learners (DLLs) and their families receiving Head StartEarly Head Start services
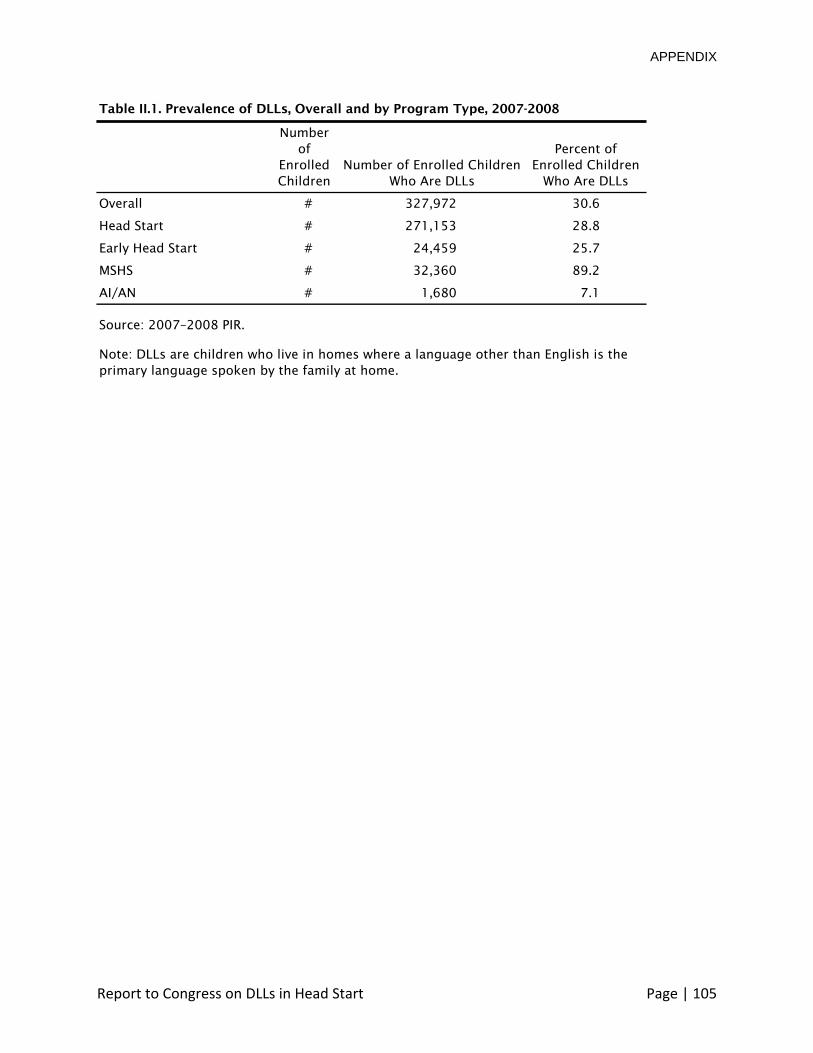
Slightly more than a quarter of children enrolled in Head Start and Early Head Start come from homes in which a language other than English is spoken According to the 2007-2008 PIR 29 percent of children enrolled in Head Start and 26 percent of children enrolled in Early Head Start are DLLs Most children enrolled in MSHS programs are DLLs (89 percent) while only 7 percent of children enrolled in AIAN programs are DLLs
DLLs are most heavily concentrated in the West and South regions of the US but there are DLLs in all regions and US territories In 2007-2008 over a third (37 percent) of DLLs in Head Start Early Head Start MSHS and AIAN programs were located in the West while 23 percent attended programs in the South The remaining DLLs were almost evenly distributed across programs in the Northeast (15 percent) Midwest (13 percent) and US Territories (13 percent) MSHS programs are concentrated in the South (42 percent) and West (45 percent) with far fewer in the Midwest (9 percent) and Northeast (4 percent)4
For most DLLs in Head Start and Early Head Start Spanish is the primary language spoken at home More than four-fifths of DLLs enrolled in Head Start and Early Head Start are from Spanish-speaking homes Within Head Start 84 percent of DLLs were from Spanishshy
4 Data from the 2007-2008 Office of Head Start Program Information Report (PIR) All subsequent statements reflecting PIR 2007-2008 data will be identified with superscript P
Report to Congress on DLLs in Head Start Page | 7
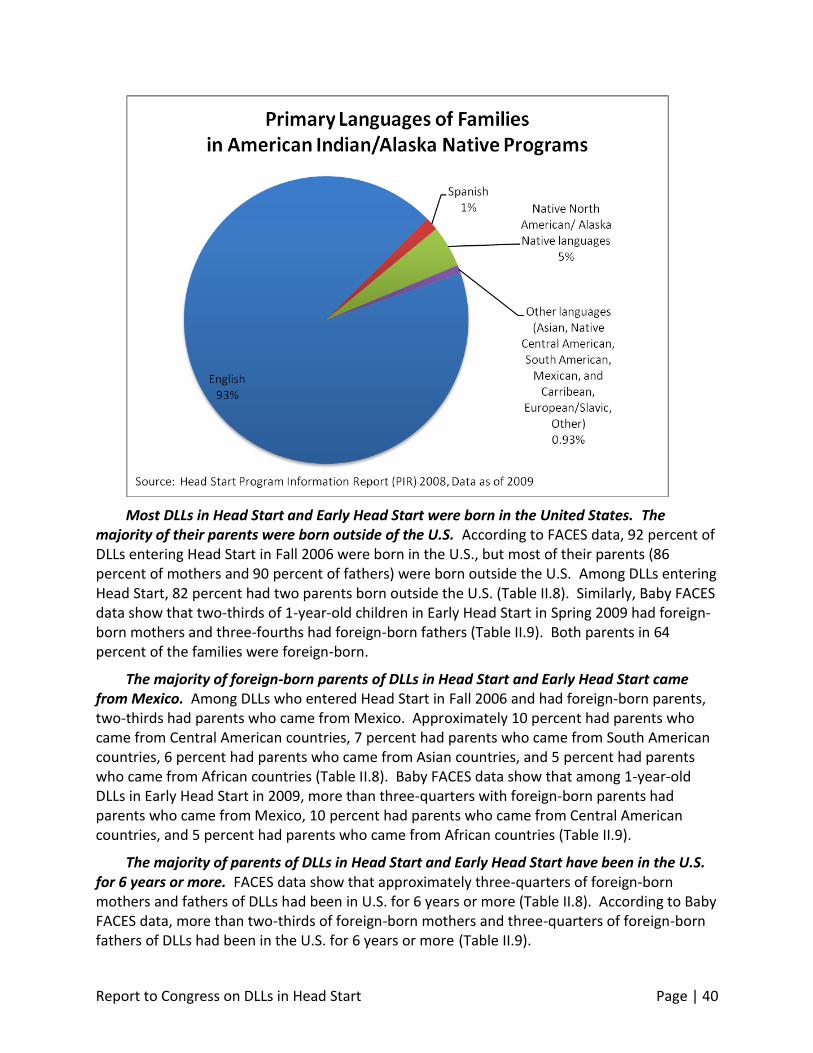
speaking homes 5 percent were from homes where an Asian language is spoken 3 percent were from homes where an African language was spoken and the remaining DLLs came from homes where other languages were spoken including EuropeanSlavic languages Pacific Island languages and Native North AmericanAlaska Native languagesF Within Early Head Start 91 percent of DLLs were from Spanish-speaking homes (the remaining 9 percent reflecting all other LOTEs)B Among the children enrolled in MSHS programs approximately 9 out of 10 speak a language other than English at home and Spanish is the most common language spoken (85 percent) Only approximately 4 percent of MSHS families primarily speak one of the native Central American South American Mexican or Caribbean languagesP
Few children enrolled in tribal programs speak a language other than English at home The most common non-English language spoken among families in tribal programs is a native language (Native North AmericanAlaska Native language) spoken by 5 percent of families in AIAN programsP
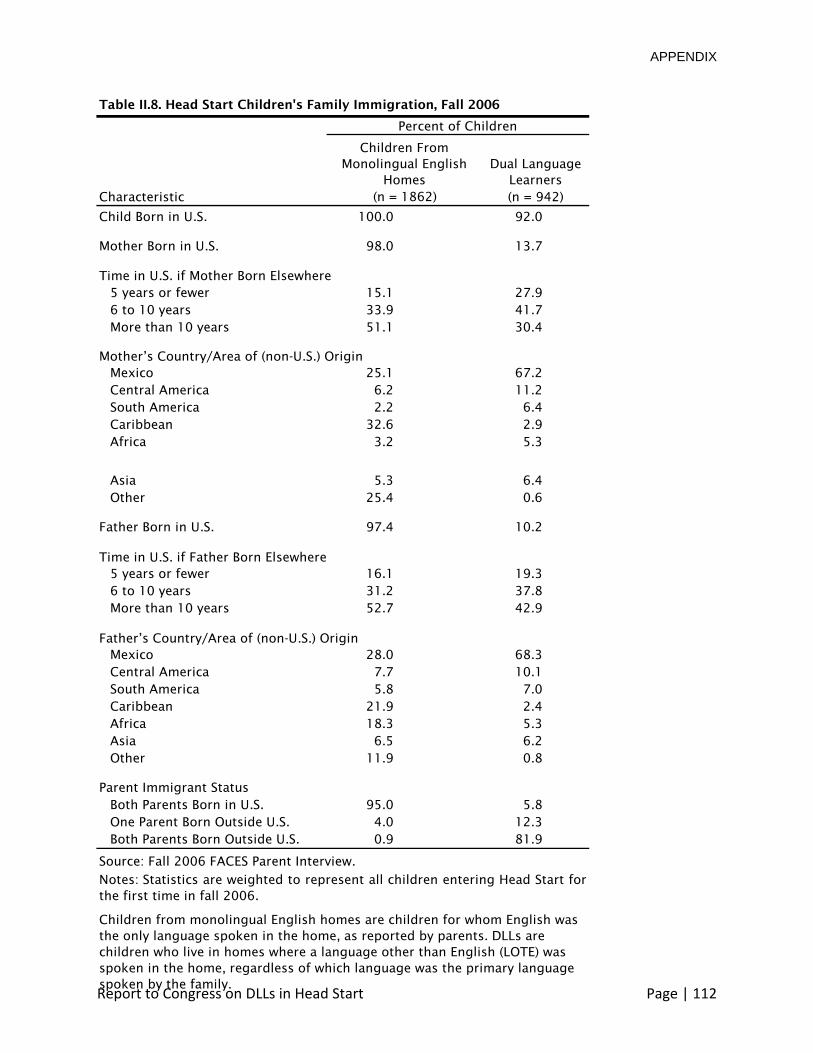
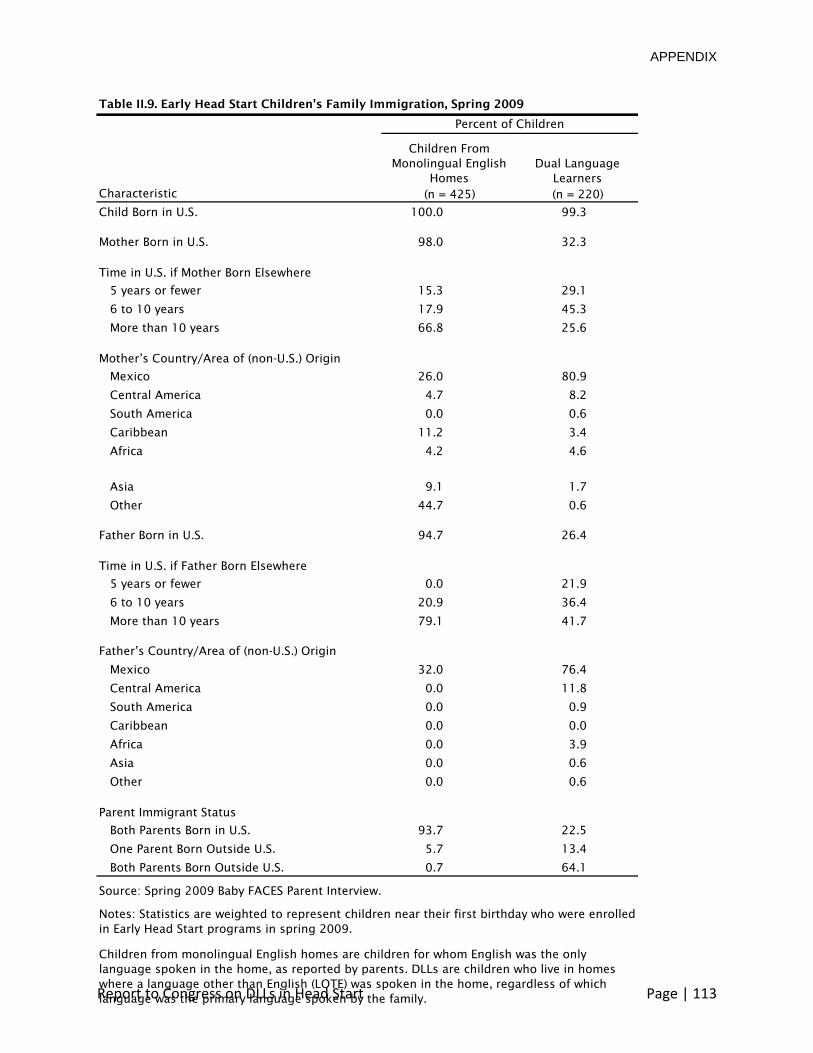
Most DLLs in Head Start and Early Head Start were born in the United States The majority of their parents were born outside of the US 92 percent of DLLs entering Head Start in fall 2006 were born in the US but most of their parents (86 percent of mothers and 90 percent of fathers) were born outside the USF Eighty-two percent of DLLs entering Head Start had two parents born outside the US Two-thirds of 1-year-old DLLS in Early Head Start in spring 2009 had foreign-born mothers and three-fourths had foreign-born fathers Both parents were foreign-born in 64 percent of DLLs familiesB The majority of foreign-born parents of DLLs in Head Start and Early Head Start came from Mexico
The majority of parents of DLLs in Head Start and Early Head Start have been in the US for 6 years or more In fall 2006 approximately three-quarters of foreign-born mothers and fathers of DLLs had been in US for 6 years or moreF Similarly in Early Head Start more than two-thirds of foreign-born mothers and three-quarters of foreign-born fathers of DLLs had been in the US for 6 years or more B
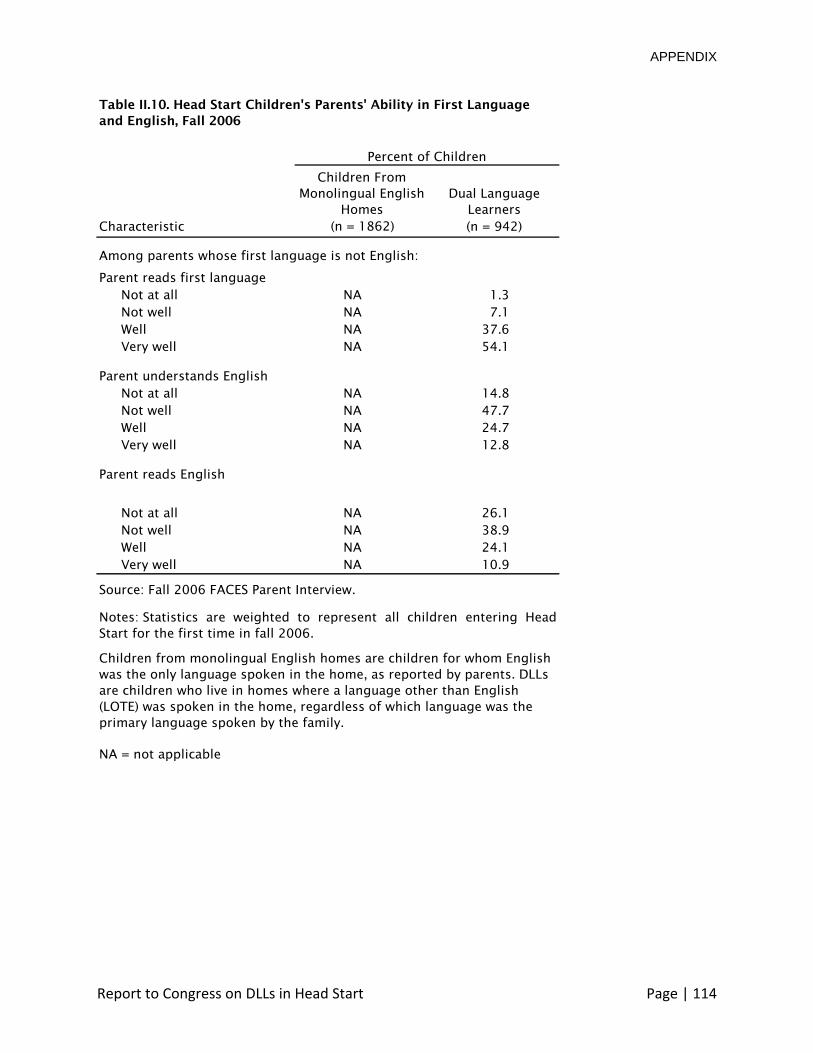
More than half of parents of DLLs in Head Start and Early Head Start report that they donrsquot understand English well or donrsquot understand it at all Among DLLs in Head Start 48 percent of their parents reported that they did not understand English well and an additional 15 percent did not understand it at allF In Early Head Start 47 percent of parents of DLLs did not understand English well and an additional 10 percent did not understand English at allB
However nearly all parents of DLLs entering Head Start in 2006 were literate in their first language and the parents of 1-year-old DLLs in Early Head Start reported reading very well (60 percent) or well (34 percent) in their native language
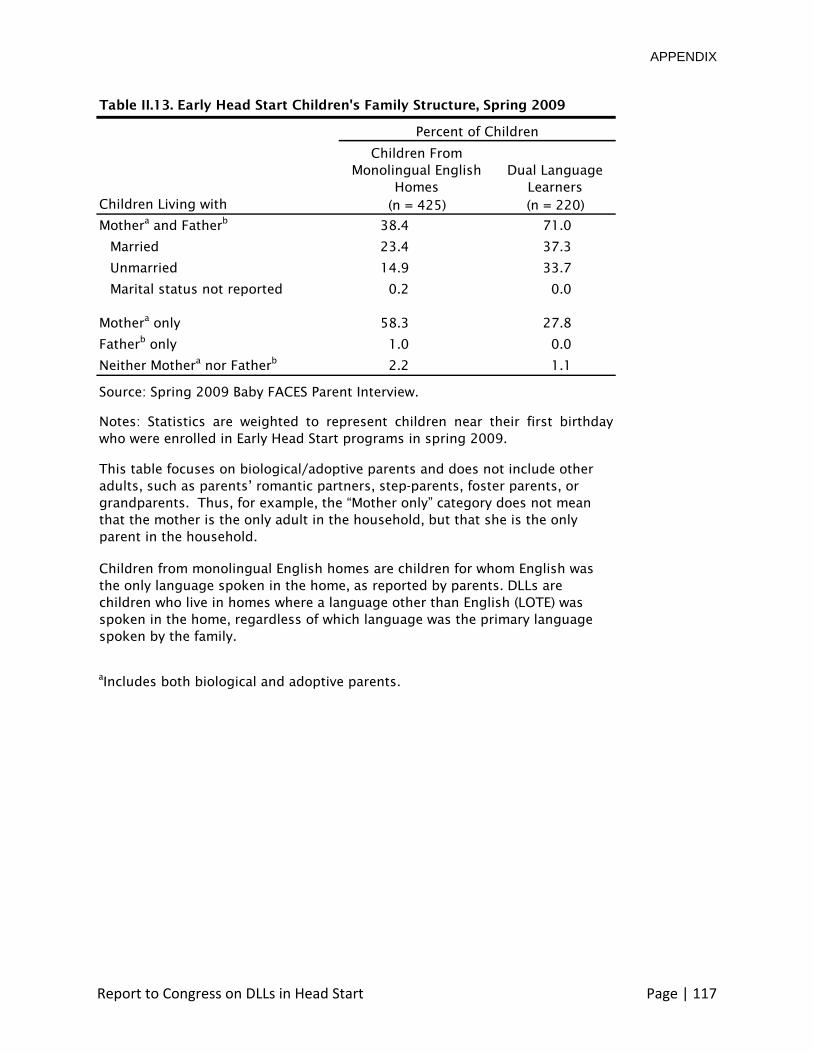
The majority of DLLs in Head Start and Early Head Start live with both their mother and
their father Among DLLs in Head Start 72 percent lived with both their mother and their
father (biological or adoptive)F Similarly 71 percent of 1-year-old DLLs in Early Head Start
lived with both their mother and their father (biological or adoptive)B 75 percent of children
enrolled in MSHS programs most of whom are DLLs lived in two-parent families Among DLLs
in Head Start who live with two parents their parents are more likely to be married (49
percent) than unmarried (23 percent) Among DLLs in Early Head Start 37 percent were living
Report to Congress on DLLs in Head Start Page | 8
with two parents who were married DLLs in Early Head Start and in Head Start are more likely
than their peers from monolingual English homes to live with two parents and with parents
who are married
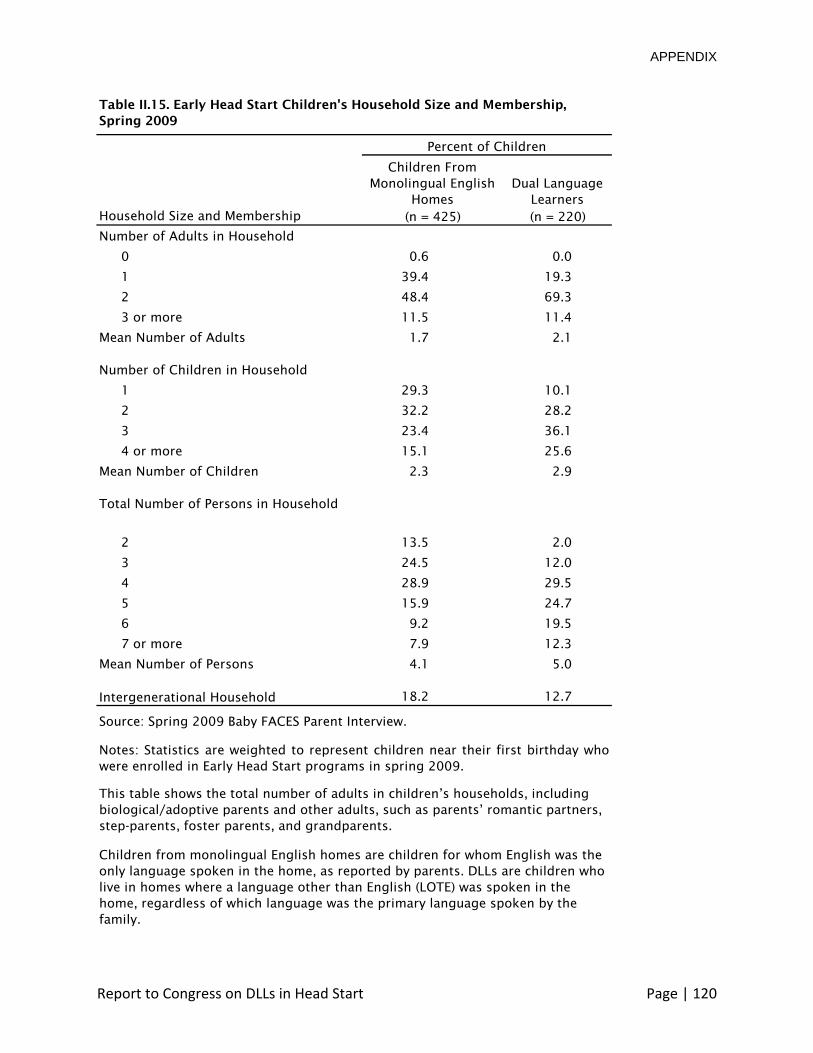
On average DLLs in Head Start and Early Head Start live in households of 5 people DLLs in Head Start lived with an average of 24 adults and 27 childrenF About 13 percent of DLLs lived in intergenerational households (ie with at least one biological or adoptive parent and at least one grand- or great-grandparent) In Early Head Start DLLs lived with an average of 21 adults and 29 children and about 13 percent lived in an intergenerational householdB On average DLLs live in larger households than children from monolingual English homes
A small proportion of DLLs in Head Start and Early Head Start were born to a teenage mother Nine percent of DLLs in Head Start were born to a teenage motherF Sixteen percent of 1-year-old DLLs in Early Head Start were born to teenage mothersB DLLs were less likely than children from monolingual English homes to have been born to a teenage mother (in Head Start 9 percent vs 19 percent in Early Head Start 16 percent vs 25 percent)
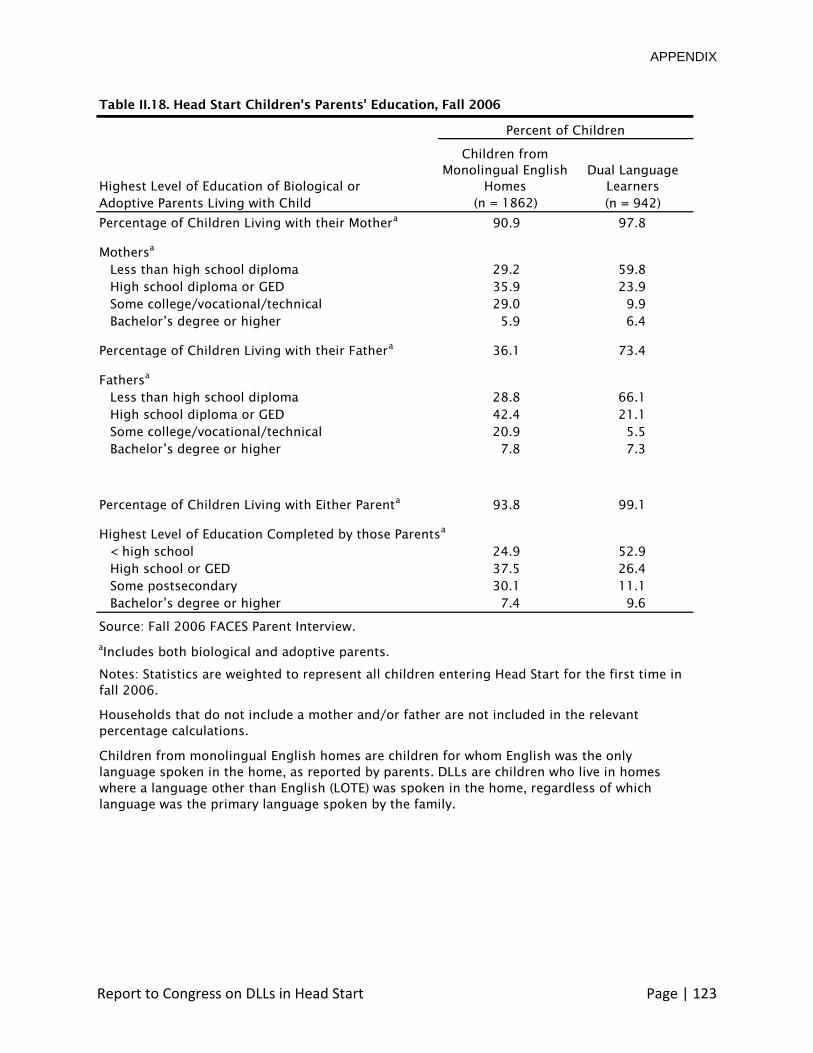
The majority of DLLs in Head Start and Early Head Start are living with parents who have not earned a high school diploma or GED Approximately half of DLLs in Head Start were living with at least one parent who had earned at least a high school diploma or GED 22 percent of DLLs were living with at least one parent with education beyond high schoolF Approximately 62 percent of DLLs in Early Head Start were living with at least one parent who had earned a high school diploma or GED 29 percent were living with at least one parent with education beyond high schoolB Over three-quarters of children enrolled in MSHS programs most of whom are DLLs were living with parents who had not completed a high school diploma or GEDP On average DLLs parents have lower educational attainment than parents from monolingual English homes
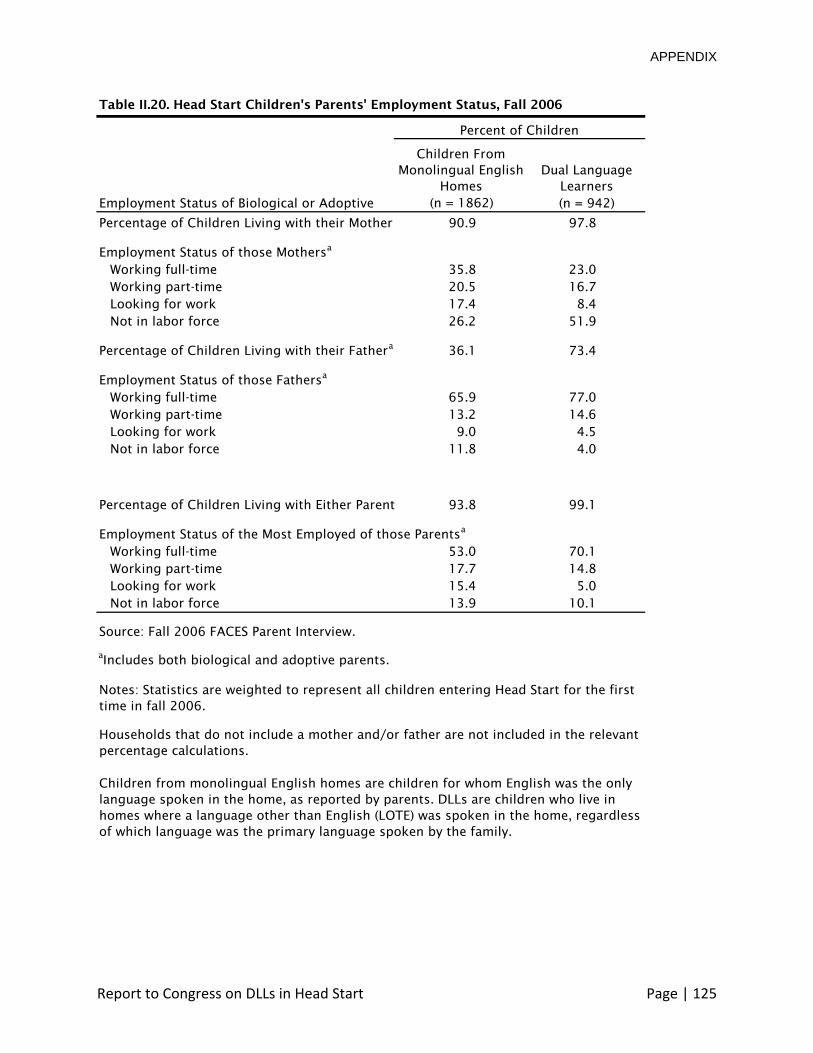
Most DLLs come from working families Among DLLs in Head Start programs 85 percent lived with at least one parent who was employed and 70 percent lived with at least one parent who was employed full-timeF Among parents of DLLs in Early Head Start 80 percent lived with at least one employed parent and 64 percent lived with at least one parent who was employed full-timeB In MSHS programs at least one parent is employed in 90 percent of two-parent families and 76 percent of single parent familiesP DLLs were more likely than children from monolingual English homes to live with a parent who was working and less likely to live with a parent who was unemployed and looking for work
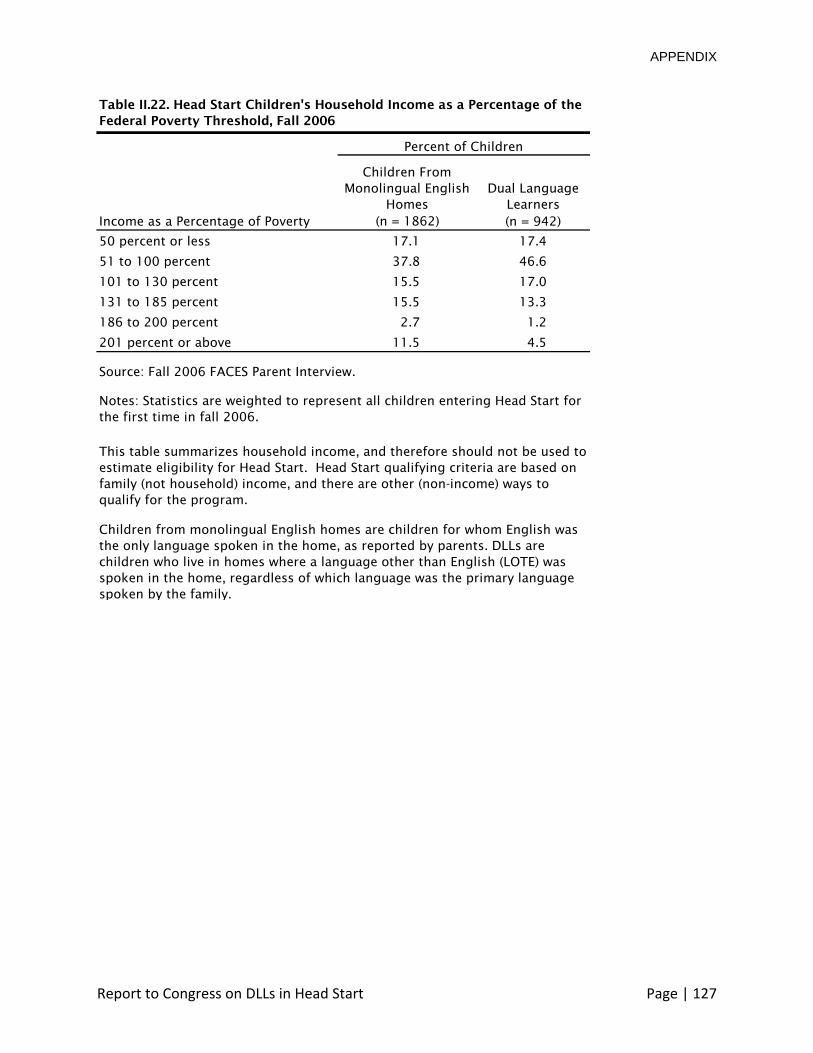
Most DLLs in Head Start and Early Head Start are living in poverty Among DLLs in Head Start 64 percent lived in a household with income at or below the poverty threshold 81 percent lived in a household with income at or below 130 percent of the poverty threshold5 F
Among 1-year-old DLLs in Early Head Start 76 percent lived in a household with income at or
5 The federal poverty threshold for a family of four was $20000 in 2006 Head Start qualifying criteria are based on
family income not household income and there are other circumstances not dependent on family income that may qualify a child or family for the program regardless of income Other qualifying criteria include children in foster care and children with special needs Individual grantees may also propose qualifying criteria to target special populations within the communities they serve (eg families in transitional housing)
Report to Congress on DLLs in Head Start Page | 9
below the poverty threshold 90 percent lived in a household with income at or below 130 percent of the poverty thresholdB Even though DLLs are more likely than children from monolingual English homes to live with a parent who is employed their households income is more likely to fall at or below the poverty threshold
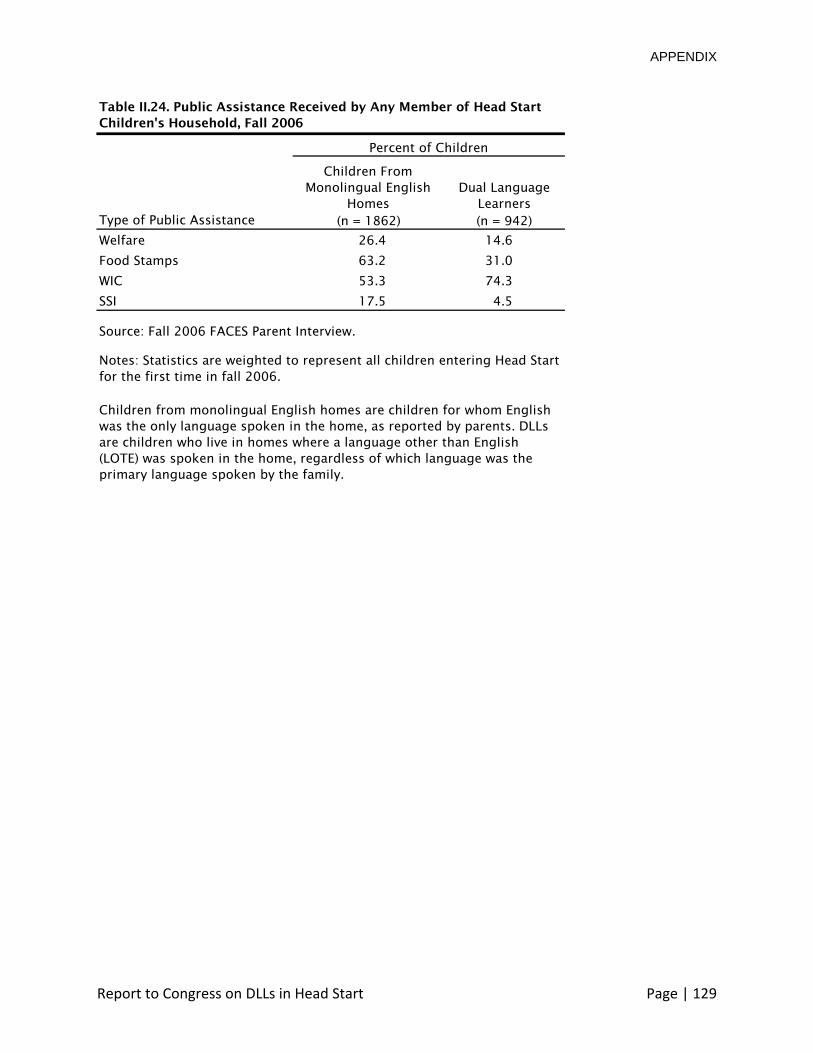
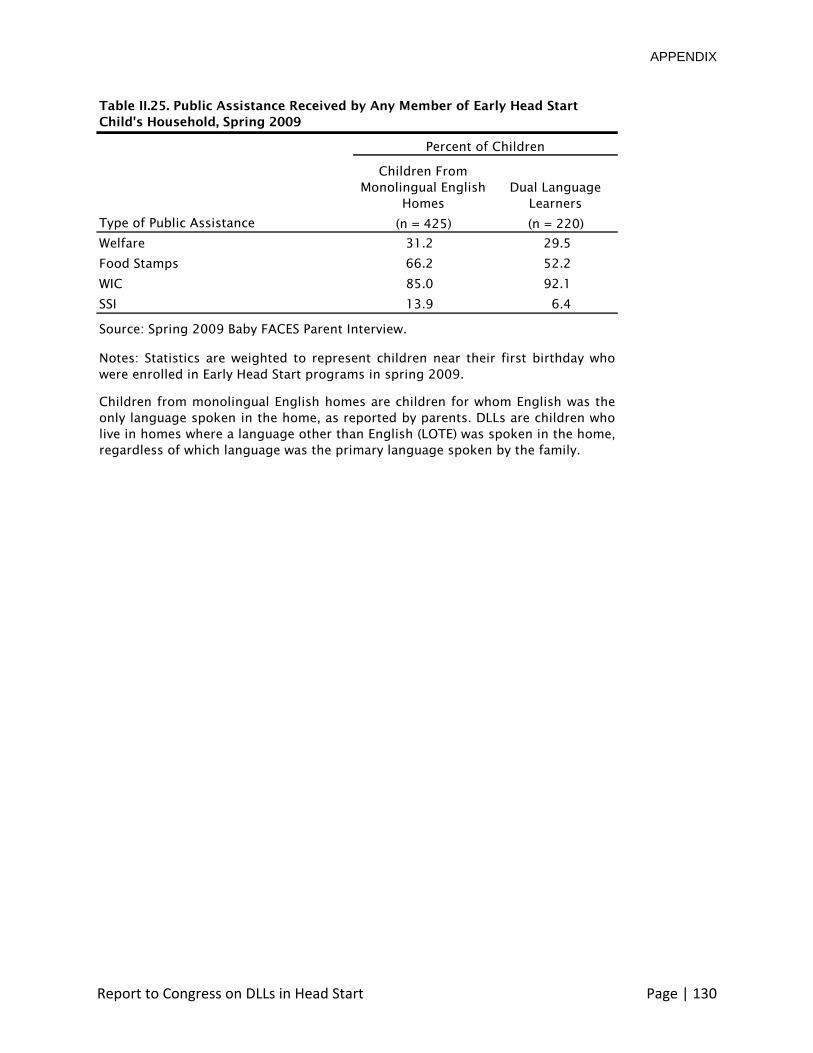
Most parents of DLLs in Head Start and Early Head Start are not receiving welfare cash assistance but many are receiving food stamps and most participate in WIC Among DLLs who entered Head Start in fall 2006 15 percent lived in households that received federal cash assistance 31 percent lived in households that received food stamps and 74 percent participated in WIC at the timeF Thirty percent of 1-year-old DLLs in Early Head Start lived in households that received federal cash assistance while 52 percent lived in households that received food stamps and 92 percent participated in WICB Only 3 percent of families in MSHS programs were receiving federal cash assistance in 2007-08 but 57 percent were receiving WIC benefitsP DLLs parents especially in Head Start are less likely than parents who reported English was the primary or only language spoken at home to be receiving public assistance but they are more likely to participate in the WIC program
Financial struggles are common in families of DLLs in Early Head Start Among DLLs in
Early Head Start 48 percent of their parents reported having at least one out of five financial
security difficulties they were asked about including paying the full amount of their rent or
mortgage or their utility billsB Half of the parents of DLLs also reported having at least one out
of five food security difficulties they were asked about Parents of DLLs in Early Head Start
were more likely than their primarily English-speaking counterparts to report more than one
food security difficulty (51 percent vs 26 percent) and twice as likely to report difficulty
affording balanced meals (39 percent vs 19 percent)
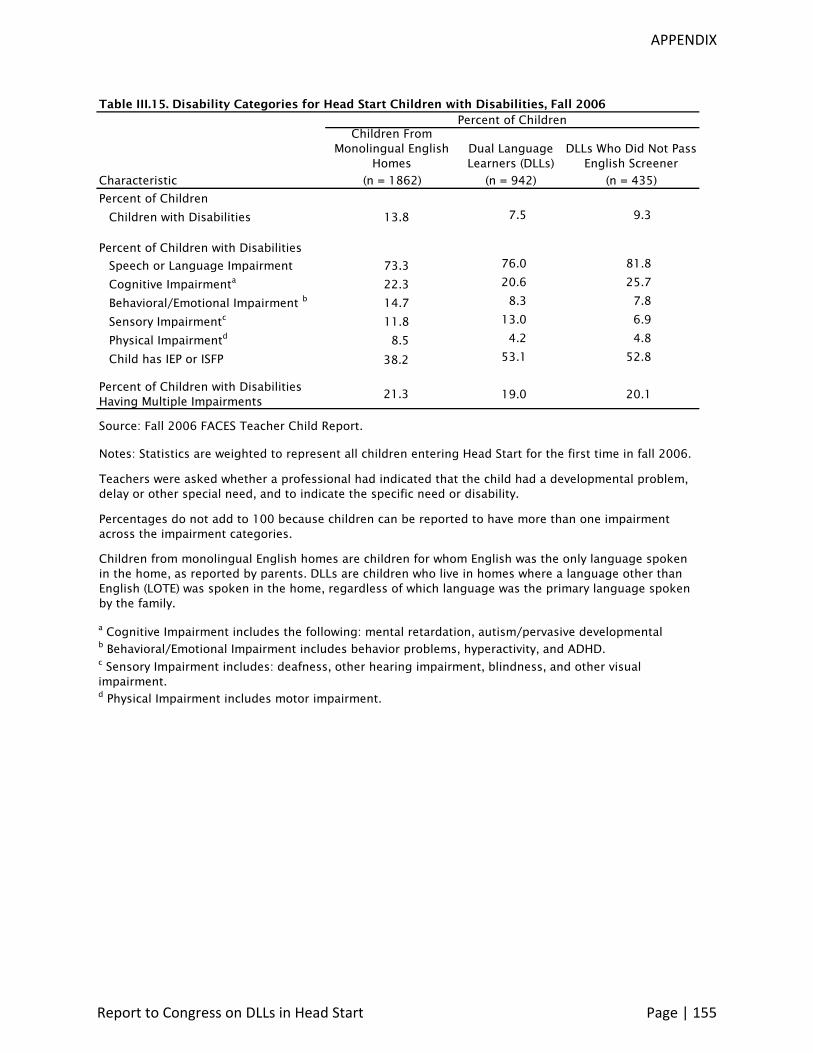
Relatively few DLLs in Head Start have had a disability identified by a professional Teachers reported that approximately 8 percent of DLLs who entered Head Start in fall 2006 had a developmental problem delay or special need indicated by a professionalF Programs reported that 41 percent of children enrolled in MSHS programs had a disabilityP DLLs in Head Start were less likely than children from homes where English is the primary or only language spoken to have been identified by a professional as having a disability (8 vs 14 percent)F
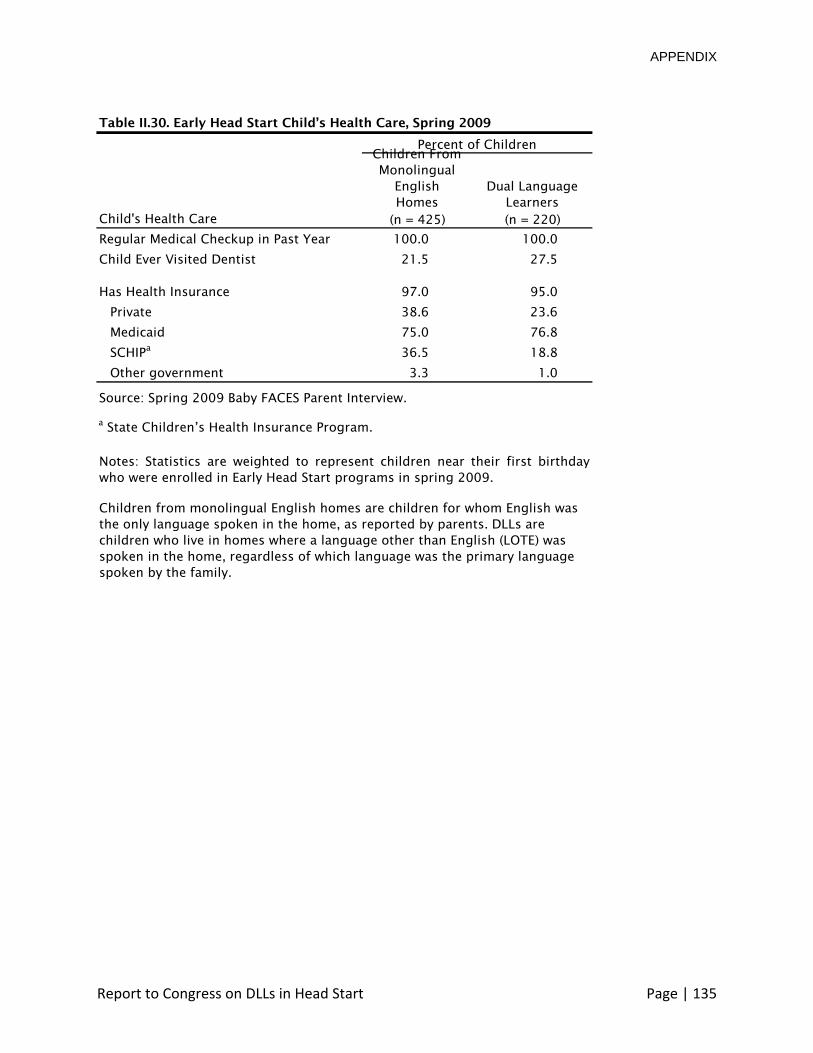
Nearly all DLLs in Head Start and Early Head Start receive regular medical and dental checkups appropriate for their age Among DLLs in Head Start 99 percent had received a regular medical checkup in the past year and 92 percent had received a regular dental checkup in the past yearF Among 1-year-old DLLs in Early Head Start all were reported to have received a regular medical checkup in the past year and 28 percent had ever visited the dentistB
Nearly all DLLs in Head Start and Early Head Start have some health insurance coverage Among DLLs entering Head Start in 2006 91 percent were covered by health insurancemdash approximately 57 percent had private health insurance coverage 66 percent had Medicaid coverage and 6 percent were enrolled in the State hildrens Health Insurance Program (SCHIP)F Among DLLs in Early Head Start in 2009 95 percent were covered by health insurancemdash24 percent were covered by private insurance 77 percent through Medicaid
Report to Congress on DLLs in Head Start Page | 10
coverage and 19 percent through SCHIPB In MSHS programs 97 percent of children were covered by health insurance by the end of the enrollment year most by Medicaid (72 percent) SCHIP (3 percent) or both (5 percent)P DLLs in Head Start were less likely than children from homes where English was the primary or only language spoken to have Medicaid coverage (66 percent vs 75 percent)F
Many DLLs in Head Start and Early Head Start receive child care in other settings most
often in home-based care by relatives Among DLLs in Head Start 26 percent were in some
child care arrangement outside of Head StartF mainly provided by relatives or by nonrelative
family child care providers Over half of 1-year-old DLLs in Early Head Start were in some kind of
child care arrangement outside of Early Head StartB again mainly through relatives or
nonrelative family child care providers DLLs in Head Start were more likely than children from
homes where English was the primary or only language spoken to be in a child care
arrangement outside Head Start (26 percent vs 12 percent) but in Early Head Start DLLs were
less likely to be in a child care arrangement outside Early Head Start (58 percent vs 72 percent)
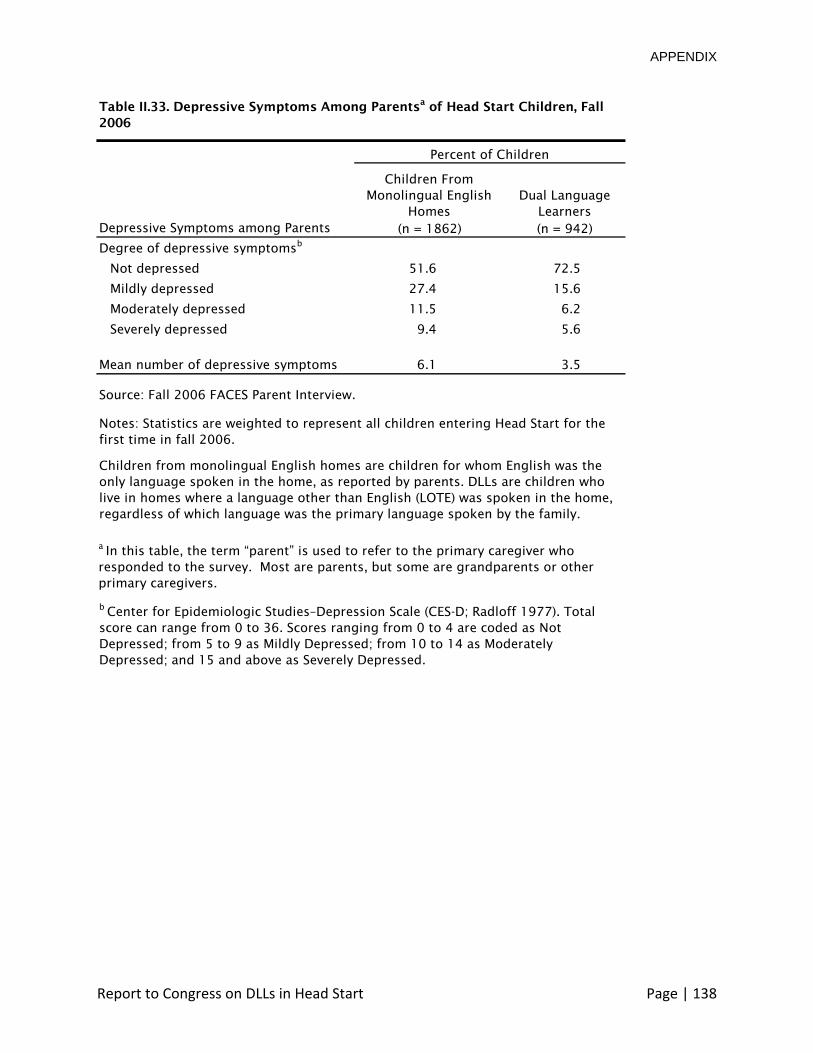
Some parents of DLLs report symptoms of psychological distress Among DLLs in Head
Start 12 percent of their parents reported symptoms indicating they may have had moderate
to severe depressionF In Early Head Start 13 percent of DLLs parents reported symptoms
indicating that they were moderately or severely depressedB Parents of DLLs in Head Start and
Early Head Start were less likely than parents from homes where English was the primary or
only language spoken to report symptoms indicating moderate to severe depression
Primary caregivers of DLLs in Early Head Start report a mix of parenting beliefs They
report relatively high levels of both traditional authoritarian parental beliefs (mean of 20 out of
25 possible points) and progressive democratic beliefs (mean of 19 out of 25 points)B DLLs in
Early Head Start were less likely than children from homes where English was the primary or
only language spoken to have parents who reported that they spanked their child in the past
week (6 percent vs 15 percent)
B HEAD START AND EARLY HEAD START SERVICES PROVIDED TO DLLs What is the nature of the Head StartEarly Head Start services provided to children who are DLLs and their families
1 Service Approaches
The majority of DLLs in Early Head Start are in the home-based option Slightly more than one-half of DLLs in Early Head Start were enrolled in home-based programs while one-third were enrolled in center-based programsB Nine percent were enrolled in a combination program and 2 percent were enrolled in a family child care program
Center-based care for DLLs was most likely full-time in Early Head Start and part-time in Head Start Three-fourths of DLLs in Early Head Start were enrolled in a full-day program
Report to Congress on DLLs in Head Start Page | 11
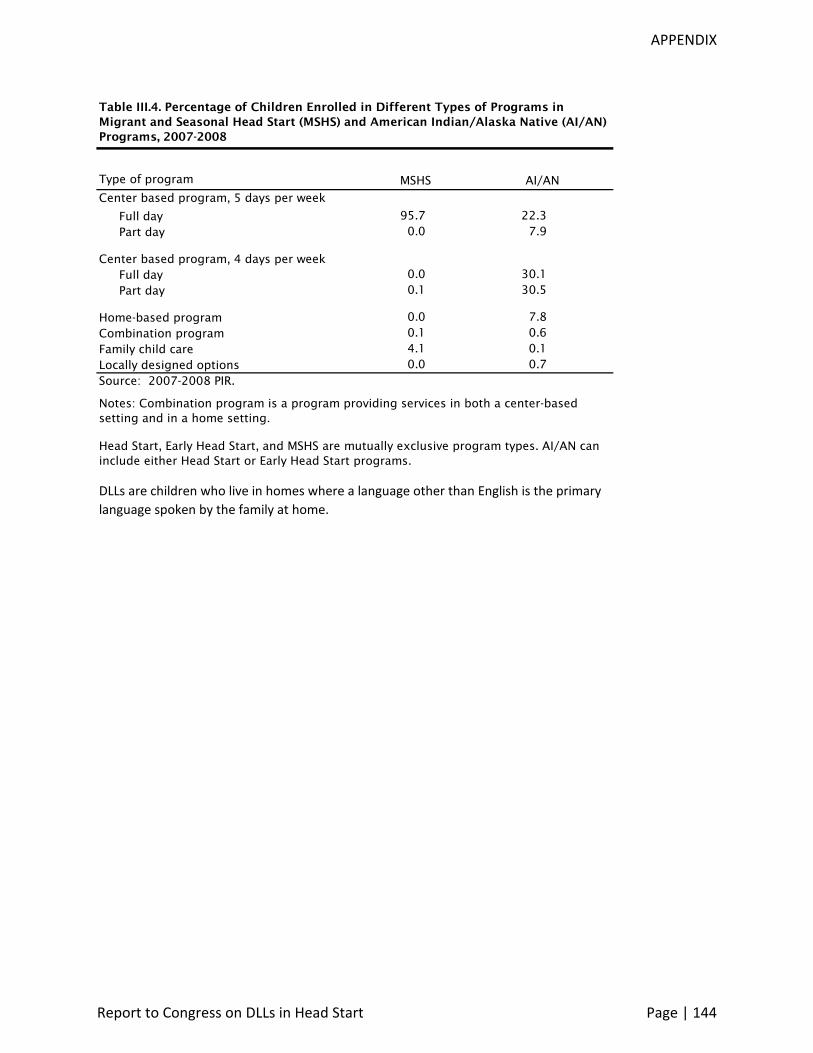
(according to program directors definitions 65 percent in a year-round full-day program and 14 percent in a part-year full-day program)B In contrast two-thirds of DLLs in Head Start were enrolled in a part-day programF Nearly all children enrolled in MSHS programs in 2007-2008 were in full-day center-based programsP Compared to children from monolingual English homes DLLs were less likely to be enrolled in programs that offered full-day center-based early education and care
2 Classroom Features and Quality
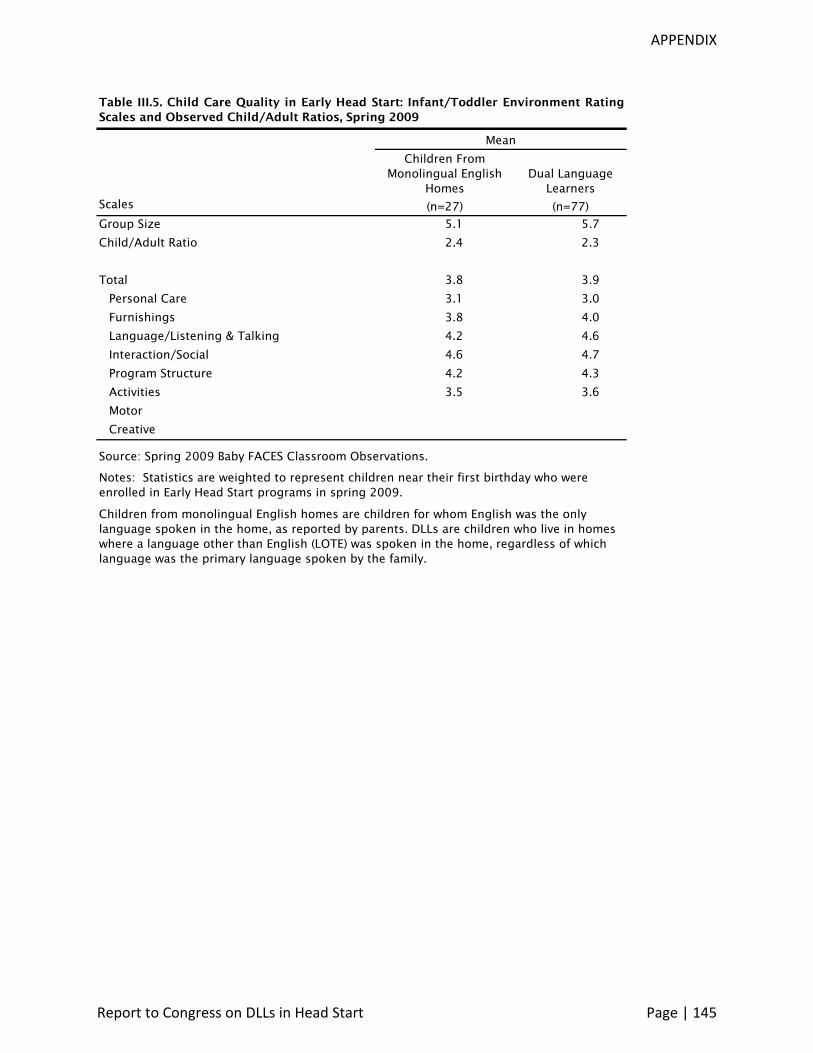
In Head Start the average classrooms of DLLs who entered in fall 2006 exceed standards for group size and child-adult ratio and in their interactions with children the lead teachers demonstrated sensitivity responsiveness and encouragement The average classroom environment however was rated in the minimal to good range and the teachers instructional support was rated low Similarly in Early Head Start the group size and child-staff ratio in the average classroom of 1-year-old DLLs in spring 2009 exceed standards but the quality of the average classroom was rated in the minimal to good range
Average child-adult ratios and group sizes in Early Head Start and Head Start exceed recommended levels On average the classrooms of 1-year-old DLLs in Early Head Start classrooms in spring 2009 included 57 children and 25 adults for a child-adult ratio of 23 to 1 (well within the maximum group size and ratio recommended by the American Academy of Pediatricians American Public Health Association and the National Resource Center for Health and Safety in Child Care and Early Education)B On average DLLs who entered Head Start in fall 2006 were in classrooms that included 152 children and 22 adults (a ratio of 69 children per adult) within the levels recommended by the NAEYCF
Global ratings of classroom quality indicate that on average Early Head Start and Head Start classrooms provide minimal to good quality care The average ITERS score for the classrooms of 1-year-old DLLs in Early Head Start in spring 2009 was 39 in the minimal to good range B According to the ECERS-R data the average quality of the classrooms of DLLs who entered Head Start in fall 2006 was between minimal and goodF DLLs and their counterparts from monolingual English homes experienced similar quality of care in home visits and Early Head Start centers
On average the quality of interactions between children and lead teachers in Head Start is good The Arnett Caregiver Interaction Scale scores show that the average quality of interactions between lead teachers and children in classrooms of DLLs was goodF The average Arnett score for lead teachers in the classrooms of DLLs was 678 suggesting high levels of teacher sensitivity responsiveness and encouragement of childrens independence and self-help skills
The average quality of instructional support in Head Start is low The average CLASS Instructional Support score in the classrooms of DLLs was 19 with average subscores ranging from 17 for concept development to 21 for language modeling F
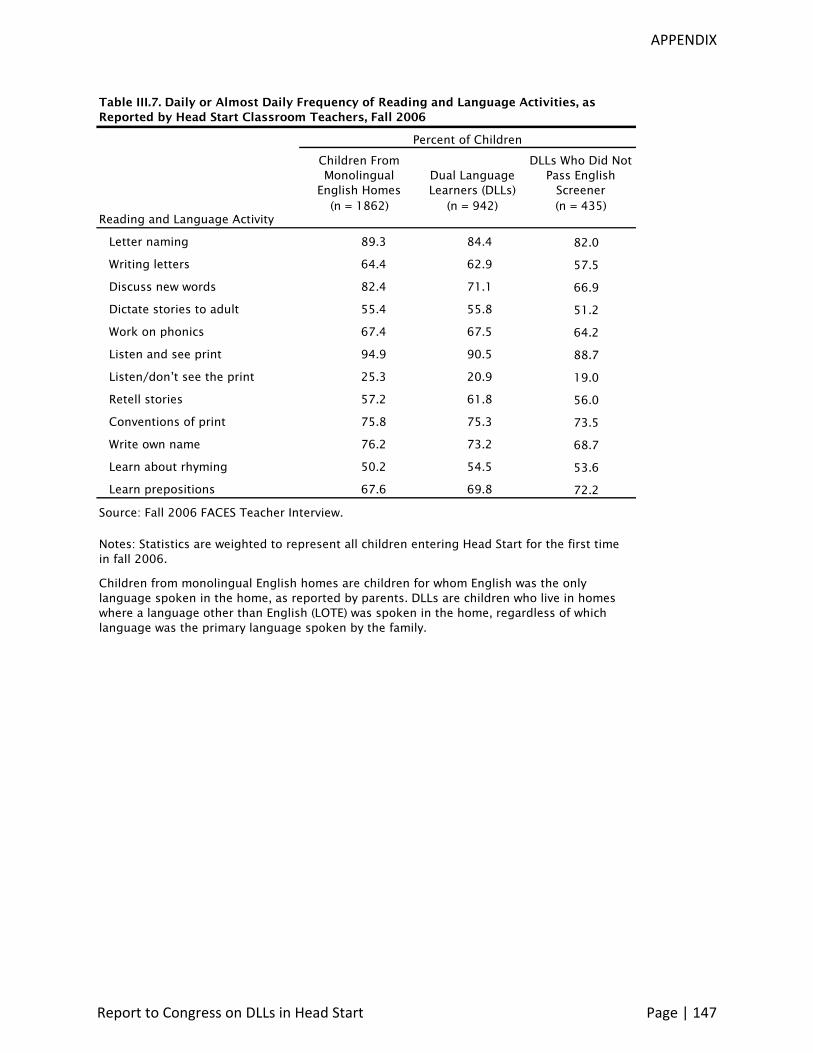
Most DLLs in Head Start were in classrooms that provided reading and language activities as well as math activities on a daily or nearly daily basis More than half of DLLs who entered Head Start in fall 2006 were in classrooms in which teachers reported each of 11
Report to Congress on DLLs in Head Start Page | 12
reading and language activities took place daily or almost daily F The extent to which Head Start teachers reported reading and language activities and math activities was very similar for DLLs and children from monolingual English homes However DLLs were less likely to be in classrooms in which daily activities included discussing new words (71 percent vs 82 percent)
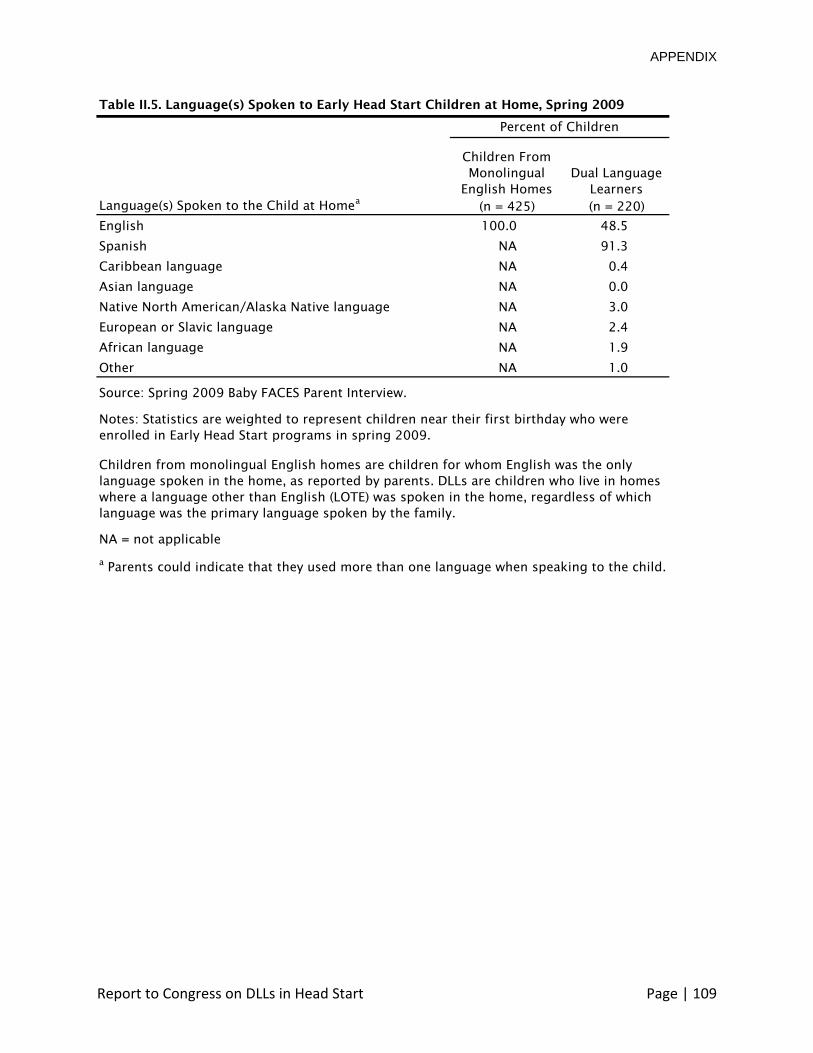
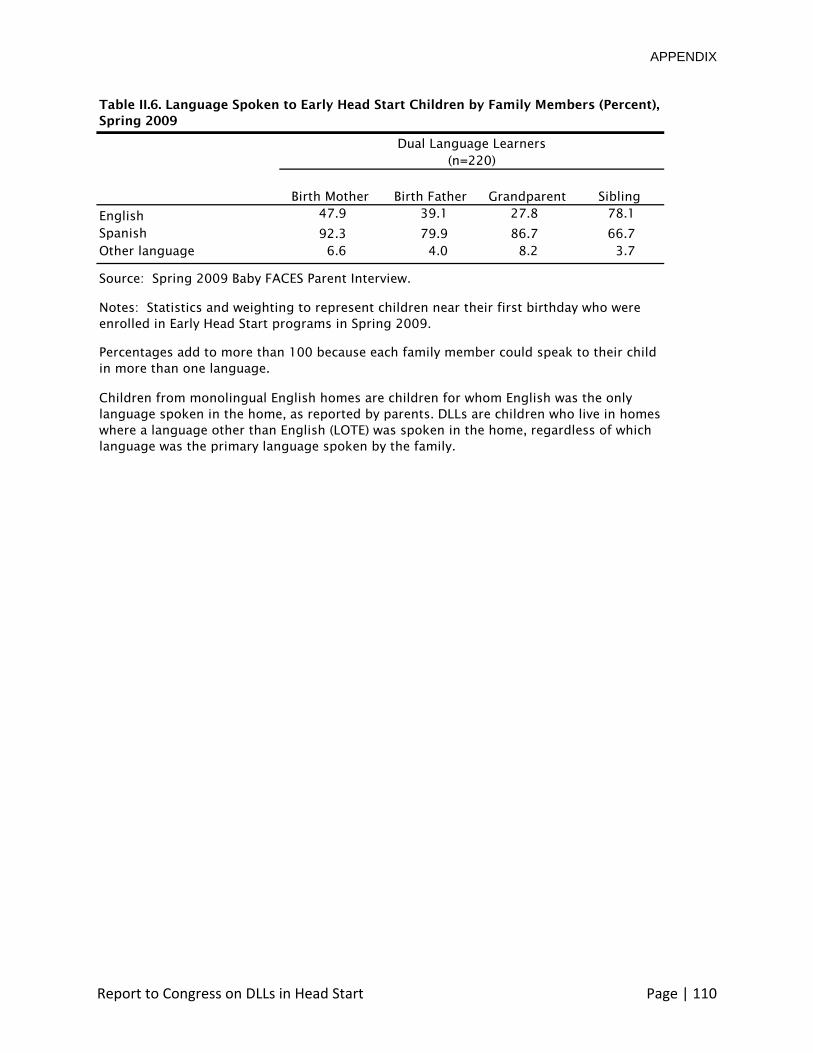
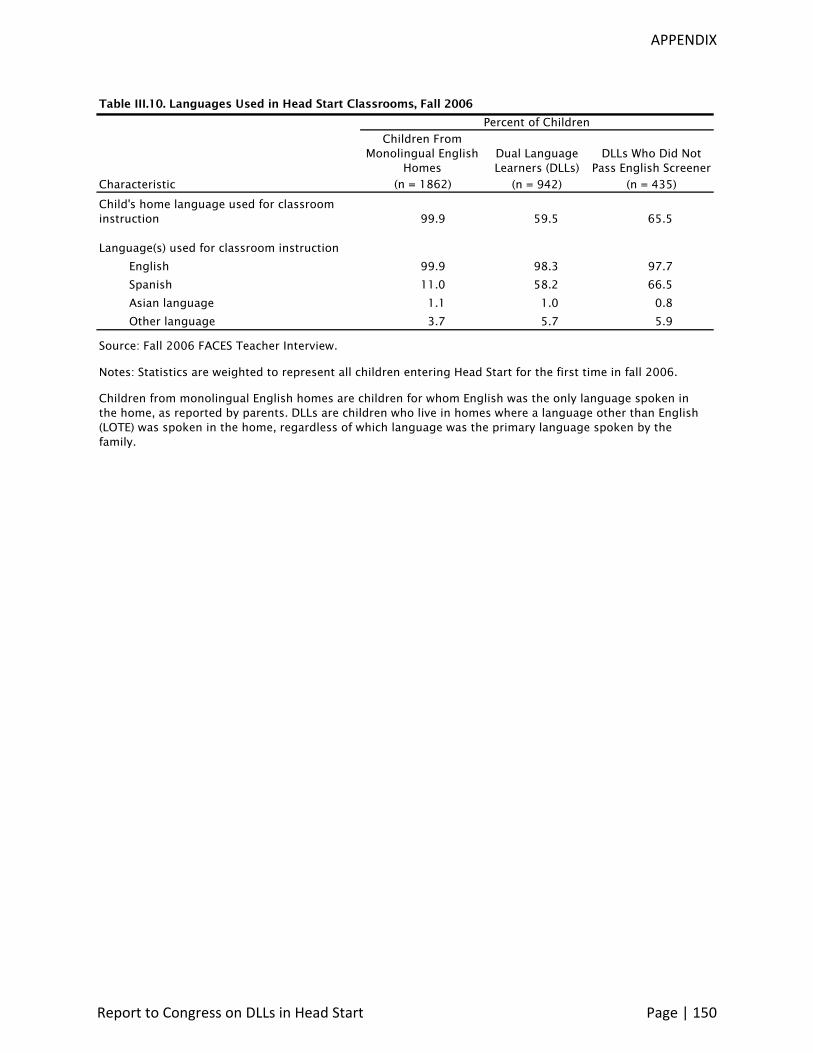
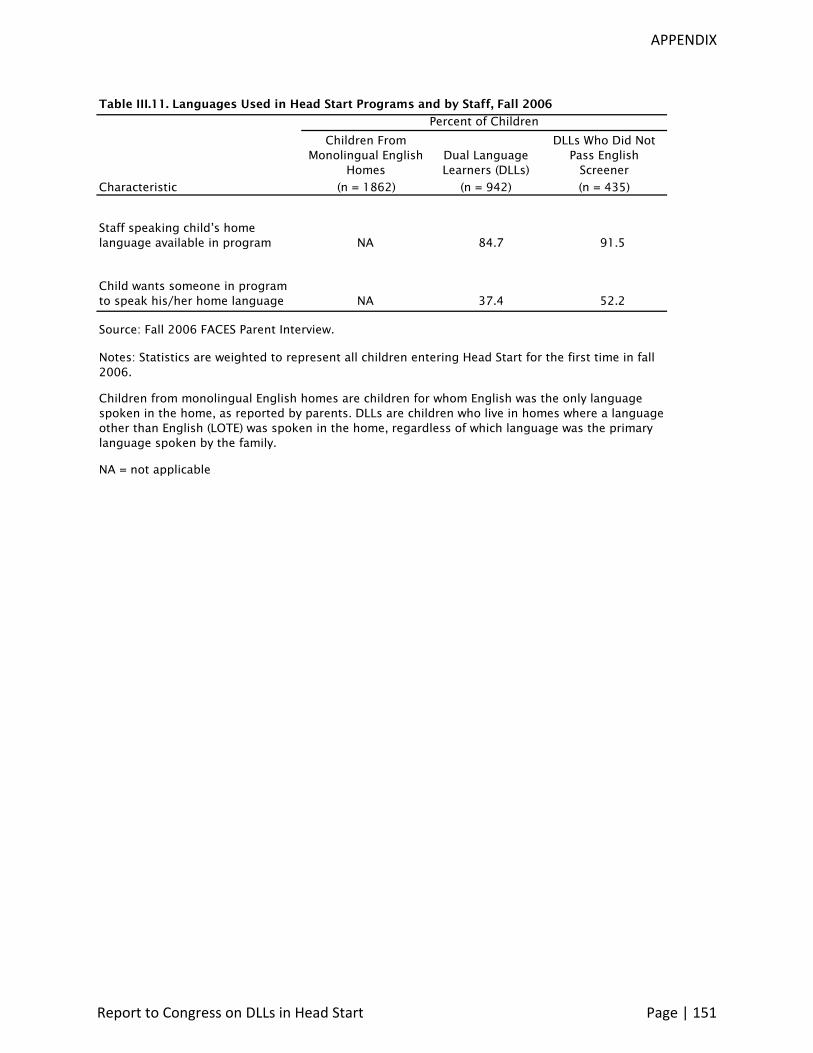
Almost all DLLs in Early Head Start and Head Start were exposed to adults speaking English and the majority of DLLs were exposed to adults speaking Spanish Nearly all (98 percent) of 1-year-old DLLs receiving center-based Early Head Start services in 2009 were exposed to adults speaking English in their classroom and 81 percent were exposed to adults speaking Spanish in their classroomB Similarly in Head Start 98 percent of DLLs who entered in fall 2006 were in classrooms in which English was used for instruction while 58 percent were in classrooms in which Spanish was used for instructionF The majority of DLLs in Early Head Start and Head Start were in classrooms that used their home language for some instruction (85 percent in Early Head Start centers 60 percent in Head Start) According to parents 85 percent of DLLs in Head Start were in a program in which staff members speaking their childs home language were available in the program In MSHS programs PIR data indicate that 71 percent of non-supervisory staff members including teachers assistant teachers and family child care providers were proficient in a language other than English
3 Characteristics and Quality of Home Visits in Early Head Start
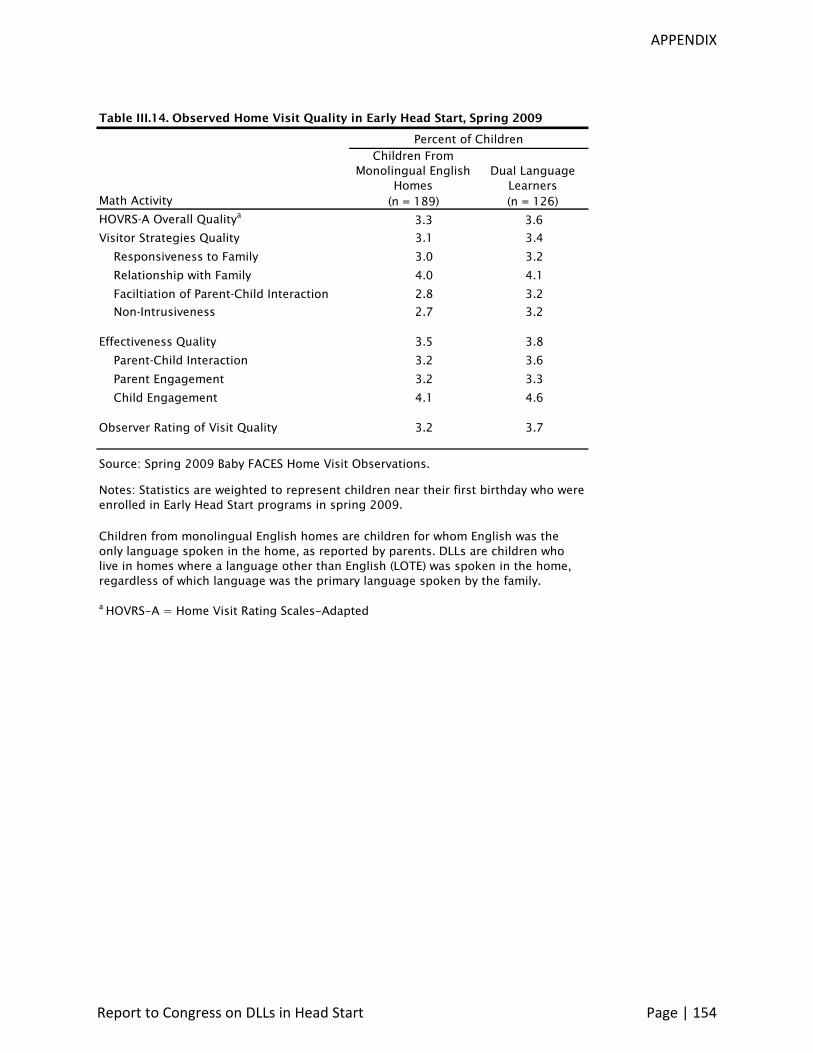
Early Head Start home visits with 1-year-old DLLs typically lasted more than an hour (82 minutes on average) and involved an average of one adult the 1-year-old and often a sibling Nearly three-quarters of home visits with DLLs were conducted in SpanishB
On average the observed quality of home visits (using the HOVRS) was rated as slightly above adequate
There were some differences in activities observed during home visits with DLLs compared to visits to monolingual English homesB Activities during home visits with DLLs were less likely to include provision of education or information (61 percent vs 75 percent) evaluationfeedback on parent-child interactions (35 percent vs 49 percent) or childparent observationassessment (59 percent vs 68 percent)
4 Other Services
In Head Start about half of DLLs with a disability had an IEP Eight percent of DLLs had a teacher-reported disability and 53 percent of these children had an individualized education program (IEP) or individualized family service plan (IFSP)F
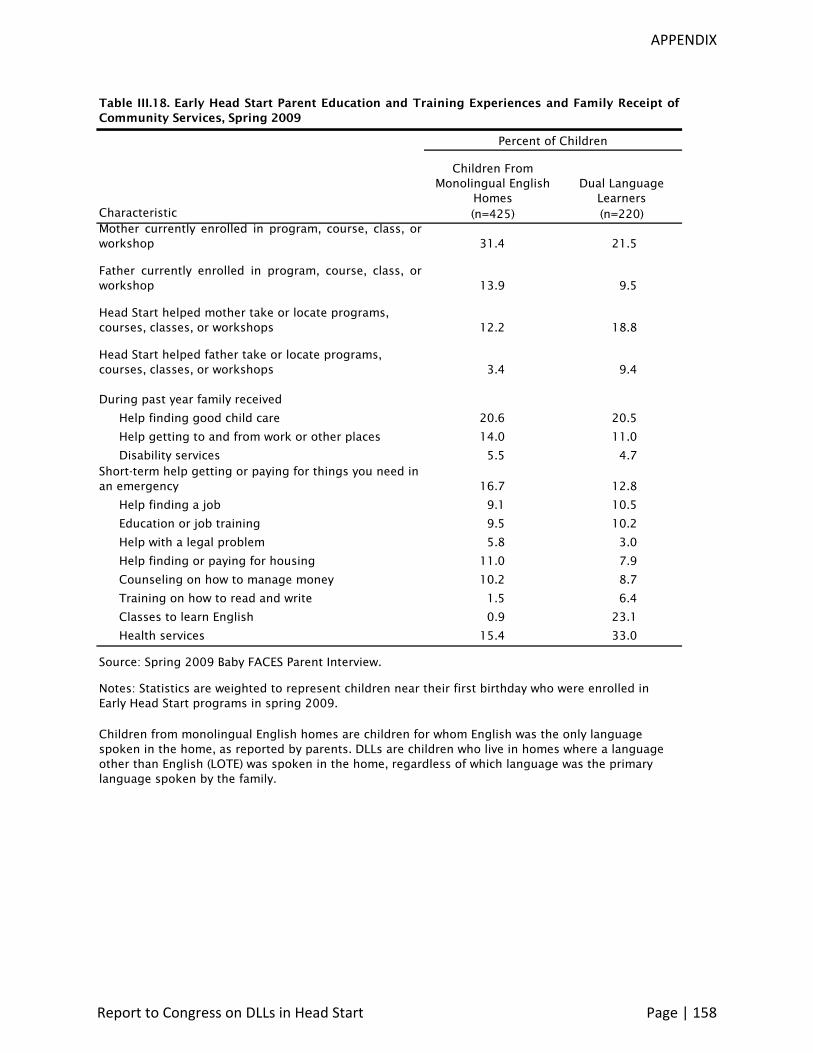
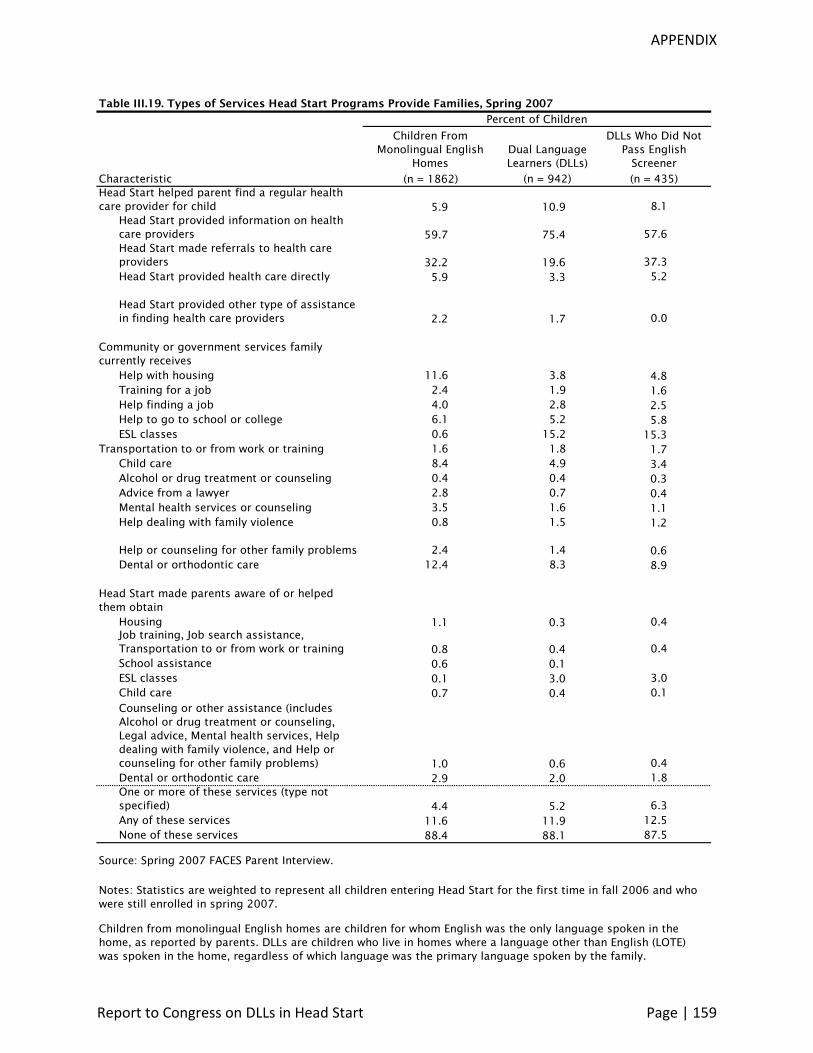
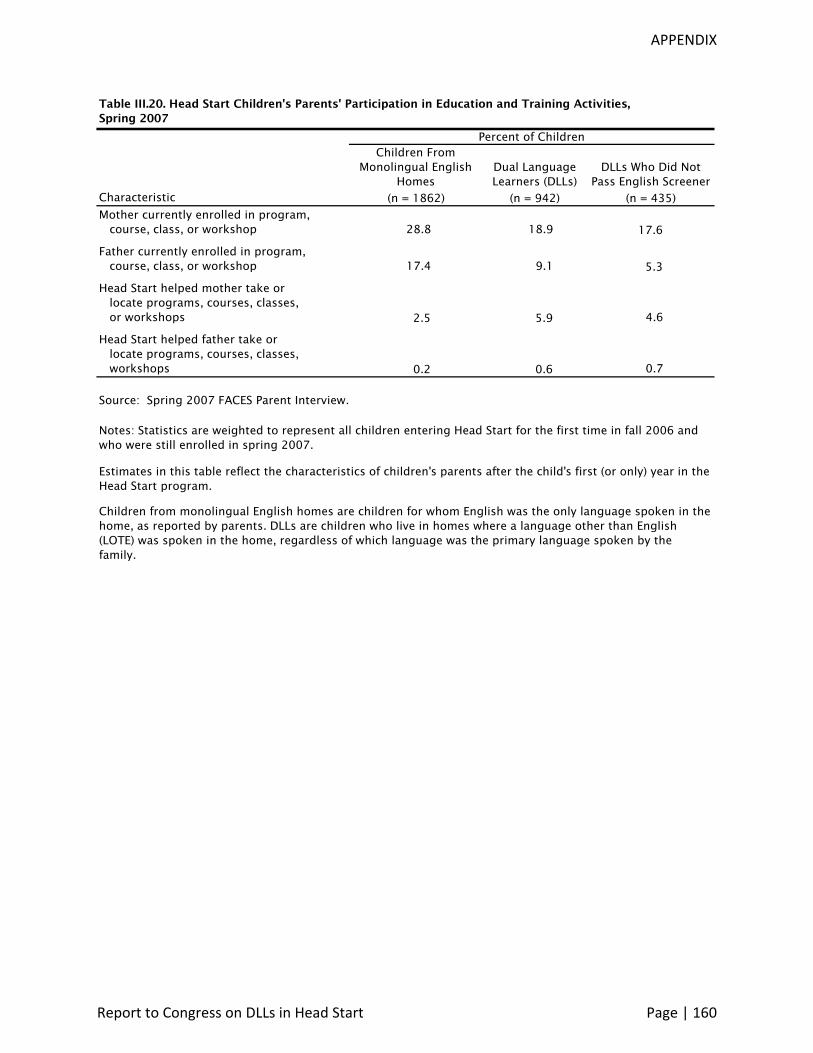
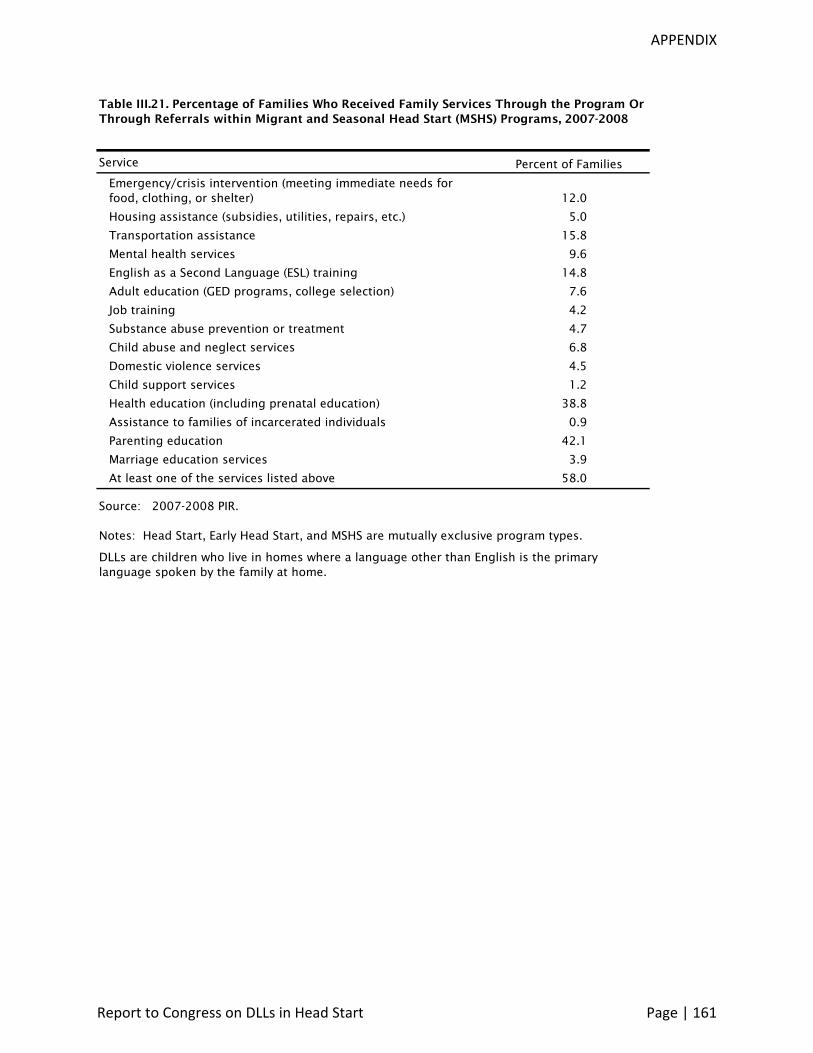
A wide range of services are offered to families of DLLs in Early Head Start Virtually all 1shyyear-old DLLs in Early Head Start were in programs that offered a wide range of family services either directly by referral or through a community partner on- or off-siteB These services included employment assistance and job training assistance in obtaining health and mental health services information about Head Start and information about community resources Two-thirds of programs provided activities and workshops targeting parents of DLLs However many families of DLLs in Early Head Start and Head Start do not report receiving family services A minority of families in Early Head Start reported receiving these types of services
Report to Congress on DLLs in Head Start Page | 13
from any source during the past year In Head Start only 12 percent of parents of DLLs reported that Head Start made them aware of or helped them obtain one or more of these types of servicesF Parent reports about services received from or with the assistance of Head Start were similar across DLLs and children from monolingual English homes
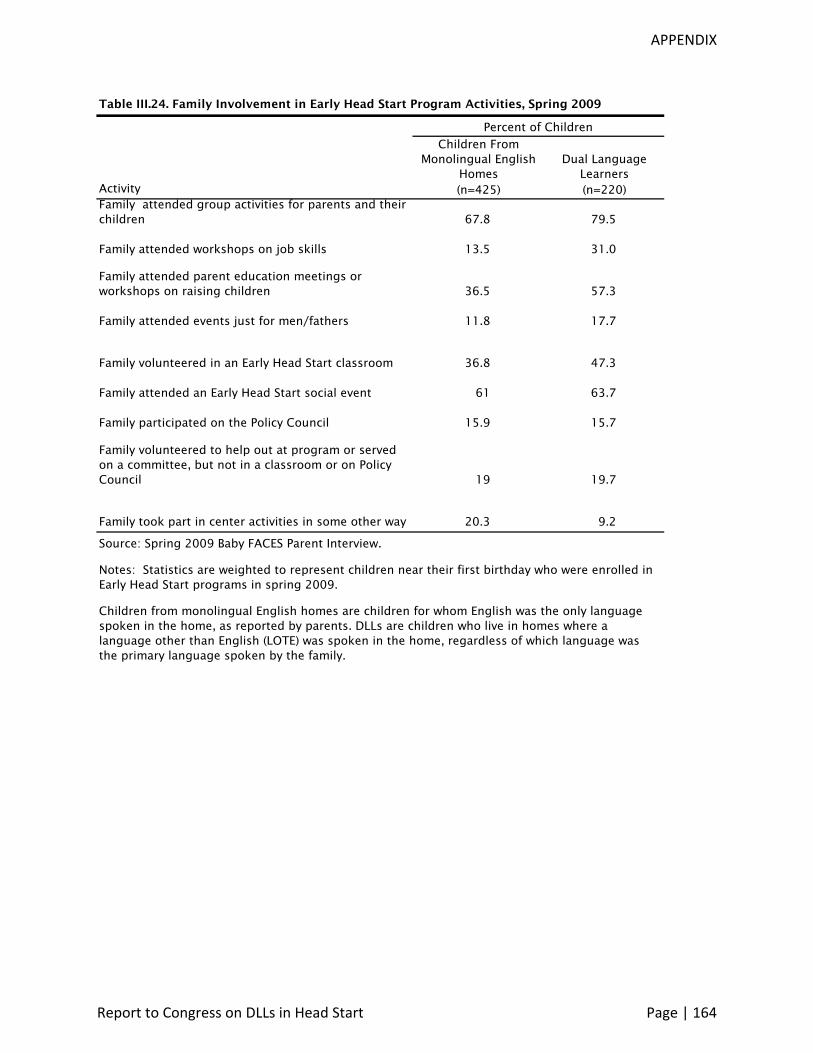
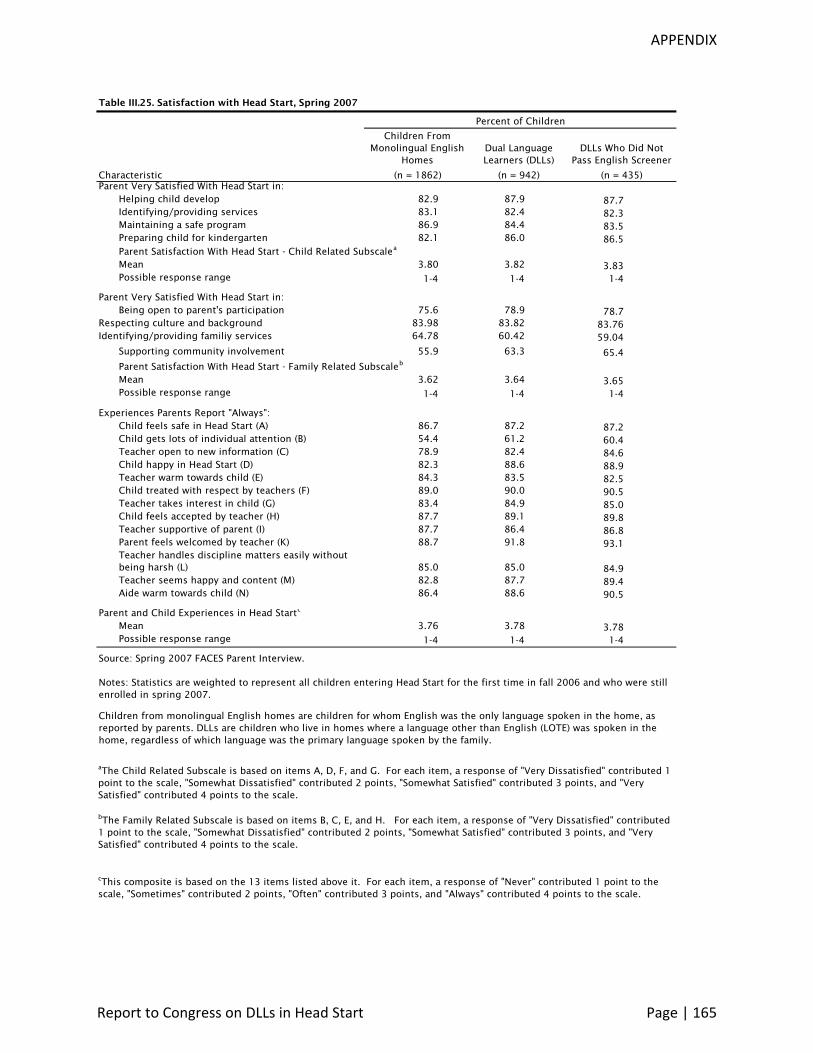
Family involvement in Early Head Start activities varies widely Nearly 80 percent of parents of DLLs in Early Head Start reported that they attended group activities for parents and their children during the past yearB Nearly two-thirds of parents of DLLs reported that they attended an Early Head Start social event and 57 percent attended parent education meetings or workshops related to children Nearly half reported volunteering in an Early Head Start classroom In 18 percent of families of DLLs the father or father-figure attended events just for menfathers
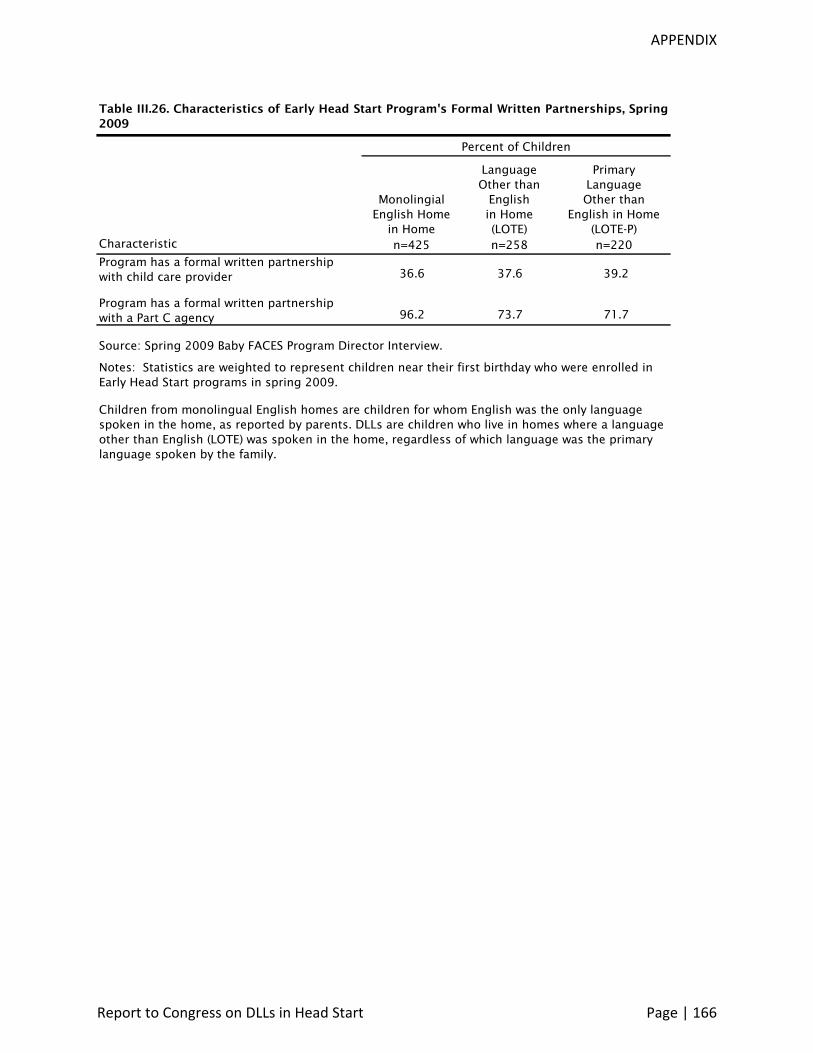
In Early Head Start DLLs were more likely than children from monolingual English homes to be in programs offering English language and literacy-related services their parents were more likely to have received several literacy and language-related services and health services and their parents reported higher involvement in many program activitiesB The Early Head Start programs attended by DLLs were less likely to have formal connections with Part C agencies (ie agencies that provide early intervention (EI) services to children aged birth to three with developmental delays or a medical condition likely to lead to a developmental delay)
C QUALIFICATIONS AND TRAINING OF STAFF WHO SERVE DLLS What are the qualifications and training of Head Start and Early Head Start teachersstaff that serve children who are DLLs and their families
The teachers and home visitors caring for DLLs and their managers provide the care that shapes the experiences of DLLs in Early Head Start and Head Start The report examines the characteristics and employment experiences of the teachers home visitors and managers caring for DLLs in Early Head Start and Head Start
1 Teachers Caring for DLLs in Early Head Start Head Start and MSHS
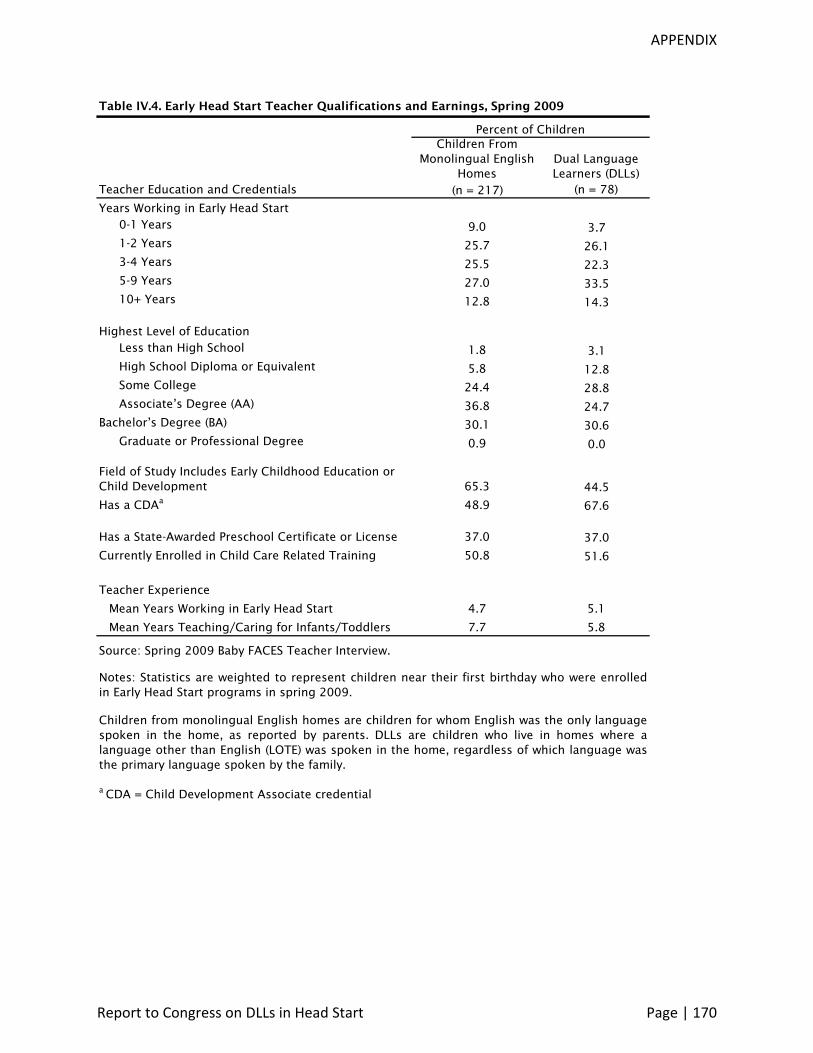
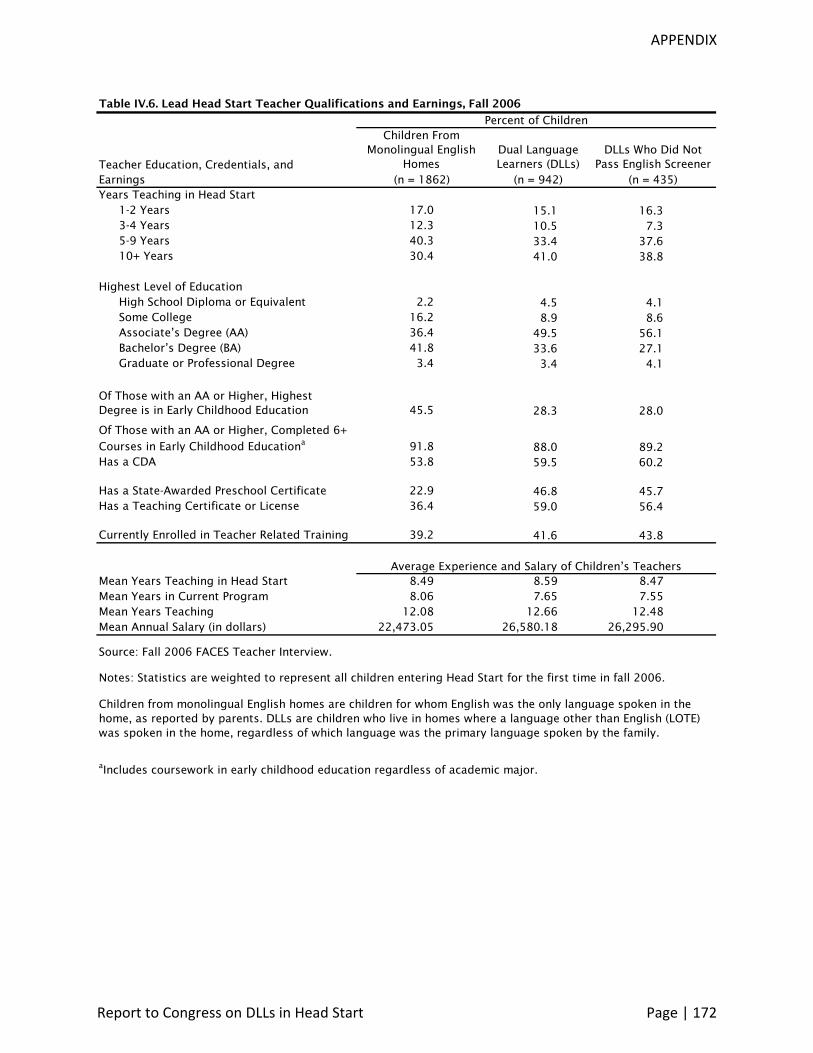
More than half of teachers of DLLs are Hispanic A substantial proportion of DLLs in Early Head Start and Head Start are cared for by teachers who are also Hispanic Half of 1-year-old DLLs in Early Head Start classrooms had teachers who were Hispanic B Similarly nearly half of DLLs in Head Start in fall 2006 had lead teachers who were HispanicF
The majority of DLLs in Early Head Start and Head Start centers have teachers who have a college degree although there is variability In Early Head Start 55 percent of DLLs in center-based care had a teacher with an associates or bachelors degreeB Only 15 percent were cared for by a teacher with only a high school diploma or less Most DLLs (87 percent) in Head Start were cared for by a lead teacher who had an associates or bachelors degreeF Only 5 percent of teachers serving DLL children had only a high school diploma or GED In MSHS programs in 2007-2008 54 percent of teachers had an associates or bachelors degreeP DLLs in Early Head Start were less likely to have teachers with a college or graduateprofessional degree than children from monolingual English homes (55 percent vs 68 percent)B
Report to Congress on DLLs in Head Start Page | 14
One-fourth to one-half of teachers of DLLs had a degree in early childhood education The education and training of teachers may have greater impact on their practices if it includes some focus or specialized preparation in child development and early childhood education Among teachers of DLLs in Early Head Start with a college degree nearly half (45 percent) had early childhood education included in their field of studyB Among DLLs in Head Start 28 percent had a teacher with a degree in early childhood educationF Two-thirds of teachers of DLLs in Early Head Start and 60 percent of lead teachers of DLLs in Head Start had earned a CDA More than half (57 percent) of teachers in MSHS programs in 2007-2008 had a CDA credentialP Fewer teachers have a state-awarded preschool certificate or license One-third of DLLs in Early Head Start have a teacher with such certification and nearly half (47 percent) of DLLs in Head Start had one BF DLLs in Head Start were more likely than their peers from monolingual English homes to have a lead teacher who had a state-awarded preschool certificate (47 percent vs 23 percent) or a teaching certificate or license (59 percent vs 36 percent)
Many teachers of DLLs have more than 5 years of experience in Early Head Start and Head Start Nearly half (48 percent) of DLLs in Early Head Start and three-quarters of DLLs in Head Start had teachers who had worked in Early Head Start for 5 or more yearsBF In Head Start the lead teachers of DLLs had been teaching for an average of 13 years DLLs and children from monolingual English homes have teachers with similar years of teaching years of teaching in Head Start and teaching in the current program However in Early Head Start teachers of DLLs had fewer years of experience caring for infant or toddlers than teachers of children from monolingual English homes
Average turnover of Early Head Start and MSHS teachers is moderate Teacher turnover during the past 12 months in programs of 1-year-old DLLs in center-based Early Head Start care in 2009 was 14 percentB About one-fifth of Early Head Start programs offering center-based care experienced a teacher turnover rate greater than 25 percent Similarly the average teacher turnover rate in MSHS programs in 2007-2008 was 15 percentP
2 Home Visitors Caring for DLLs in Early Head Start
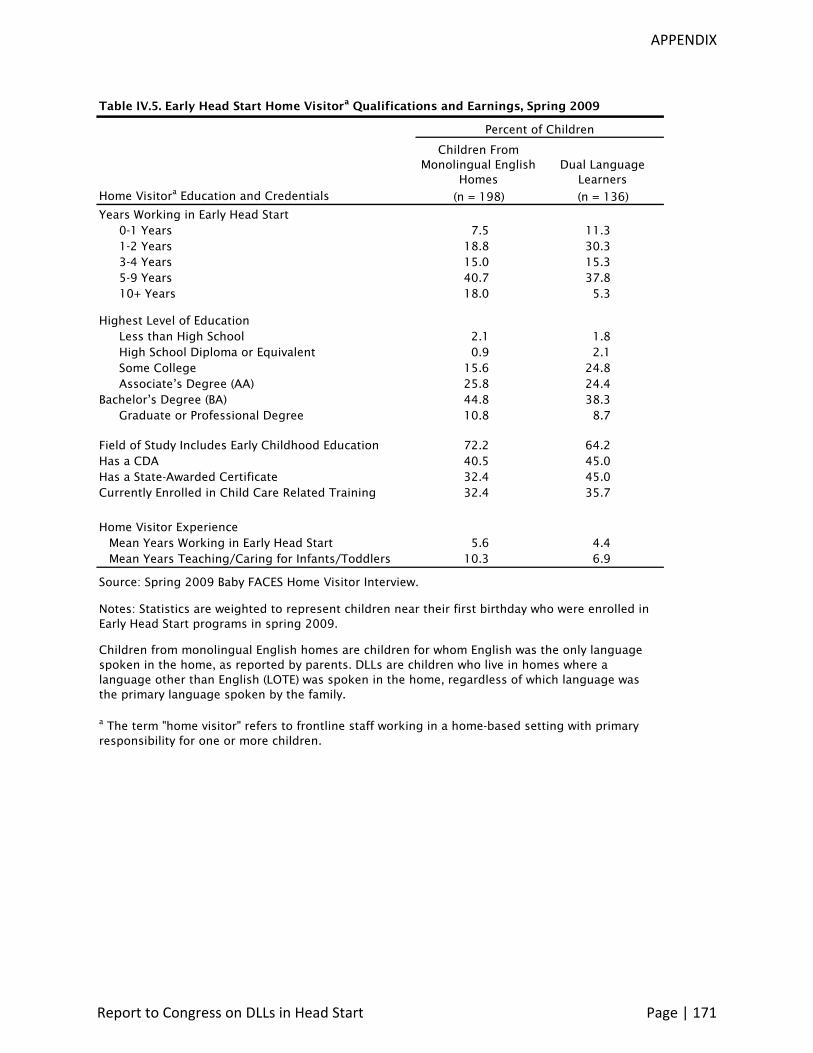
More than half of home visitors serving DLLs are Hispanic Three-quarters of 1-year-old DLLs in Early Head Start who were receiving home visits had home visitors who were HispanicB
Depression may afflict some home visitors Most home visitors serving DLLs in Early Head Start did not report elevated symptoms of psychological distressB However for a small proportion (4 percent) moderate or severe depression may be a problem
Nearly all DLLs receiving home-based Early Head Start services have home visitors with education beyond high school and many had home visitors with specialized training in early childhood development andor education Nearly two-thirds (62 percent) of 1-year old DLLs in Early Head Start who were receiving home-based services had a home visitor with an associates or bachelors degree and nearly two-thirds (64 percent) had home visitors whose field of study included early childhood educationB Almost half (45 percent) of DLLs had a home visitor with a CDA credential and similarly 45 percent had home visitors with state-awarded preschool certification DLLs in home-based Early Head Start services were less likely than
Report to Congress on DLLs in Head Start Page | 15
children from monolingual English homes to have a home visitor who had completed college but more likely to have a home visitor who had either received some college education or a state-awarded preschool certificate
More than a third (43 percent) of DLLs in Early Head Start had home visitors who had worked in Early Head Start 5 or more yearsB DLLs had home visitors who had less experience caring for infants and toddlers on average than home visitors of children from monolingual English homes (7 vs 10 years)
Average turnover of Early Head Start home visitors is moderate Home visitor turnover during the past 12 months in programs of 1-year-old Early Head Start DLLs in home-based care in 2009 was 15 percent on averageB About one-fifth of programs offering home-based services experienced a home visitor turnover rate higher than 25 percent
3 Managers Overseeing Teachers and Home Visitors Caring for DLLs in Early Head Start and Head Start
Although supervisors coordinators and directors do not normally care for children in Early Head Start and Head Start directly they can have an impact on the care children receive through their monitoring of teachers and home visitors and the policies and practices they set and model for frontline staff
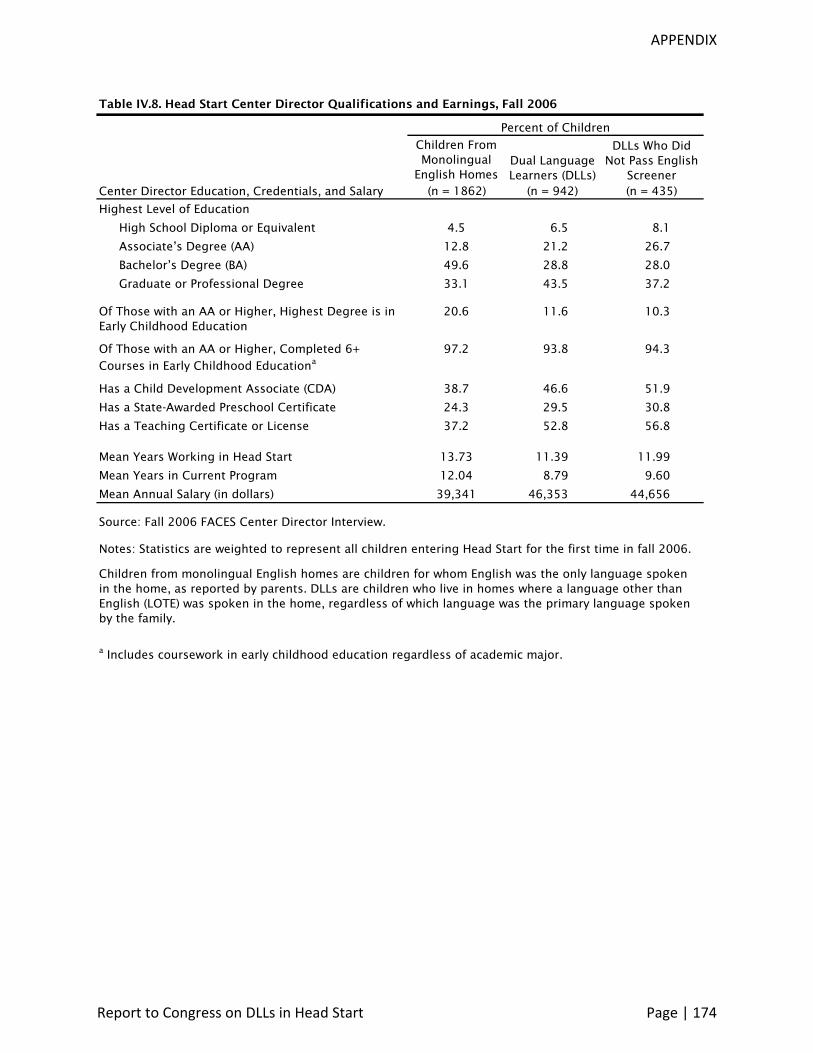
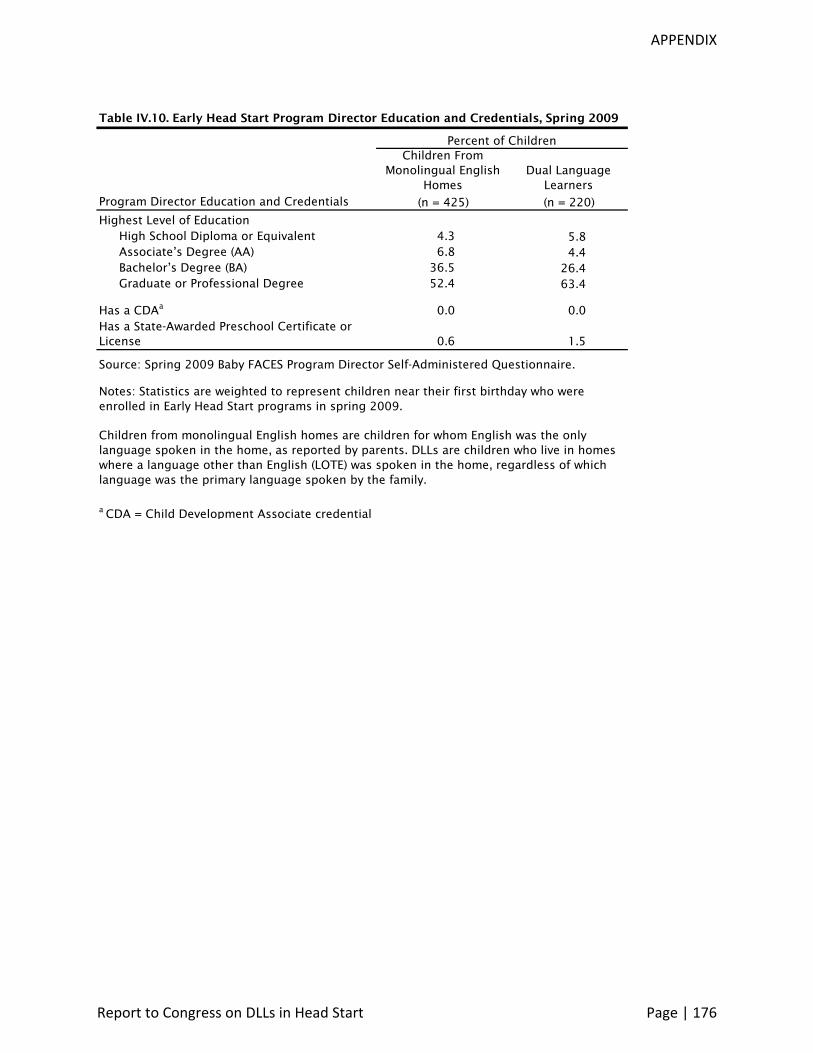
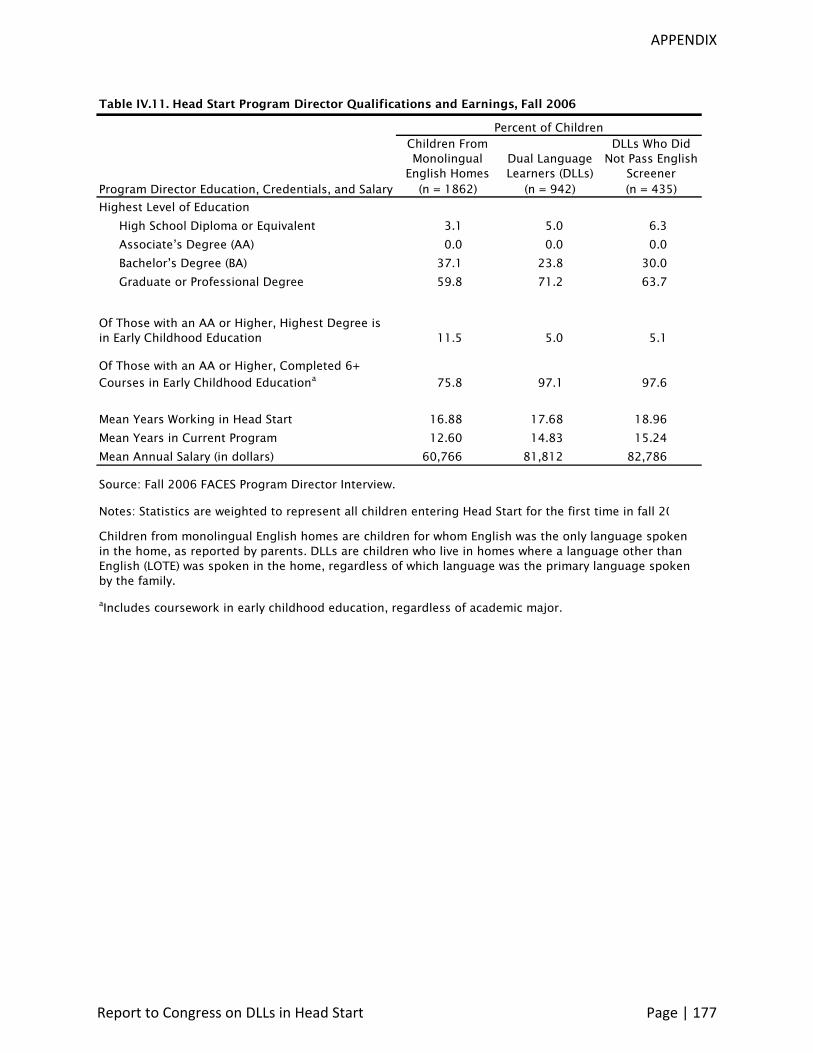
Managers in programs serving DLLs have high levels of education Three-quarters of DLLs were enrolled in programs in which mid-level managers (program managersupervisor in Early Head Start and center director in Head Start) had a bachelors degree or higher (75 percent in Early Head Start and 72 percent in Head Start) and notable proportions of DLLs were enrolled in programs with mid-level managers who had a graduate or professional degree (27 percent in Early Head Start and 43 percent in Head Start)BF Most DLLs in Early Head Start and Head Start were in programs led by a director with a bachelors degree or higher and two-thirds to three-quarters were in programs in which the director had a graduate or professional degree
Many managers in Head Start (but not in Early Head Start) have a child development or early education credential or certification Very few of DLLs in Early Head Start were in programs in which program managerssupervisors or directors had a CDA credential (less than 1 percent) or state-awarded preschool certificate (3 percent)B In contrast one-third of DLLs in Head Start were in programs in which the center director had a state-awarded preschool certificate and nearly half (47 percent) were in programs in which the education coordinator had a state-awarded preschool certificateF
A majority of DLLs in Head Start are in programs in which center directors and education coordinators have a teaching certificate or license More than half of DLLs in Head Start had center directors (53 percent) with a teaching certificateF Nearly two thirds (63 percent) of DLLs in Head Start were in programs in which the education coordinator had a teaching certificate
Head Start managers have more than a decade of experience working in Head Start On average DLLs had center directors with 11 years of experience in Head Start 9 of those in their current programF On average DLLs were in programs with education coordinators who had
Report to Congress on DLLs in Head Start Page | 16
worked in Head Start for 14 years all in their current program They also had program directors who had worked in Head Start for an average of 18 years 15 of those in their current program
D LANGUAGES USED BY STAFF WHO SERVE DLLS What are the languages in which Head Start and Early Head Start teachersstaff are fluent in relation to the children and families they serve
The available data provide information that indirectly informs the question posed by Congress about the languages used in providing services to children who are DLLs and their families However there are no data that speak directly to the question of the fluency of Head Start staff in particular languages
Multiple languages are often used in classrooms and home visits Among DLLs in Early Head Start home-based services adults speak English during 70 percent of home visits and Spanish during 77 percent of home visits reflecting that teachers and home visitors use both languages within many visitsB
English is the language most often used to read to children in the classroom however childrenrsquos home language is used in most home visits and classrooms In Early Head Start the childs home language was used during 89 percent of home visitsB The childs home language was used in the Early Head Start classrooms of 85 percent of DLLs In Head Start classrooms the childs home language was used for at least some instruction in the classrooms of 60 percent of DLLsF In Early Head Start classrooms DLLs were most likely to have a lead teacher who spoke a language other than English in the classroom (69 percent) followed by an assistant teacher (47 percent) classroom aide (30 percent) and volunteer or other non-staff person (19 percent) Most DLLs in Head Start (85 percent) were in programs in which staff members speaking the childs home language were available as reported by parents
Teachers and home visitors use a variety of strategies to communicate with the families of DLLs Half (52 percent) of the families of DLLs in Early Head Start had teachers or home visitors who spoke to them only in EnglishB Two-thirds (67 percent) had teachers or home visitors who used an informal interpreter Three-fourths had teachers or home visitors who used physical cues or hand gestures to communicate with families speaking languages other than English
E DEVELOPMENTAL PROGRESS MADE BY DLLS IN EARLY HEAD START AND HEAD START What developmental progress is made by children who are DLLs in Head StartEarly Head Start programs
The data addressing this question are limited due to the overall state of the field to reliably or accurately describe the developmental progress of young children who are dual language learners The research field lacks consensus regarding a variety of methodological issues in the assessment of development among DLLs For instance the norms established for the most common measures of child development have not been shown to be valid for children who are dual language learners In addition it is unclear what the best approaches are for
Report to Congress on DLLs in Head Start Page | 17
assessing comprehensive development over time as childrens proficiency in one or more languages and perhaps their dominant language changes In this context the information presented regarding the developmental progress of DLLs in Early Head Start and Head Start reflects data collected utilizing the best methods available at the time the respective studies were designed
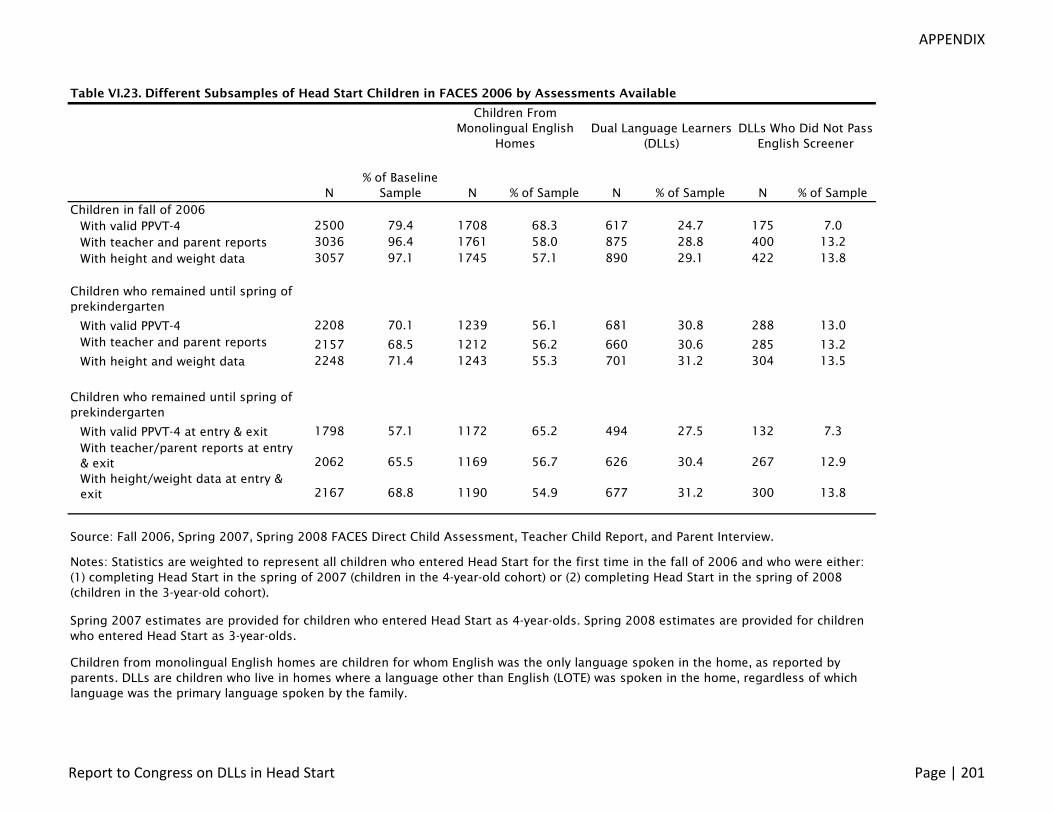
The data available for DLLs in Early Head Start provides a single snapshot of their developmental status during their first year in the program The data regarding children in Head Start provides three snapshots of DLLs one of all DLLs at Head Start entry another of the DLLs who were still enrolled in the spring of their Head Start exit year and finally another of DLLs who were still enrolled in the spring and have valid comparable data at Head Start entry and exit
First here is what Baby FACES data show about the developmental status of 1-year old DLLs in Early Head Start
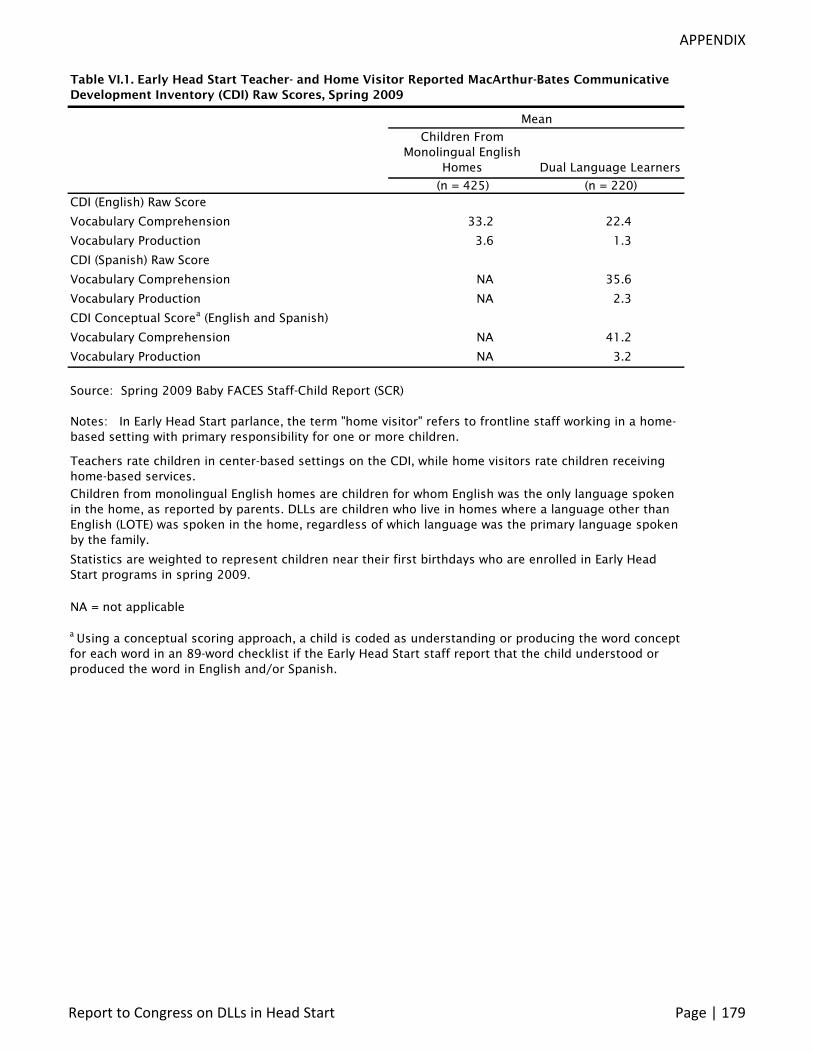
DLLs in Early Head Start are just beginning to develop their vocabulary On average 1shyyear old DLLs understood 22 English words and spoke 1 English word while DLLs identified as understanding Spanish and whose Early Head Start teacher or home visitor also spoke Spanish understood 36 Spanish words and spoke 2 Spanish words On average DLLs understand and use fewer English words than children from monolingual English homes DLLs have a larger vocabulary when both English and Spanish words are considered (41 words in English or Spanish while children from monolingual English homes understood 33 words in English)
Parents and staff reports about the social-emotional development of DLLs differ According to staff (teachers and home visitors) 10 percent of 1-year-old DLLs in Early Head Start had high levels of problem behaviors indicating a delay in social-emotional development In contrast according to parents more than three times as many DLLs (34 percent) were reported to have high levels of problem behaviors indicating a social-emotional delay Teachershome visitors rated similar proportions of DLLs and children from monolingual English homes as having high problem behaviors or low social-emotional competence (25 percent) In contrast parents provided more divergent ratings (43 percent of DLLs compared with 29 percent of children from monolingual English homes)
In brief here is what the FACES 2006 data show regarding developmental status of DLLs during Head Start
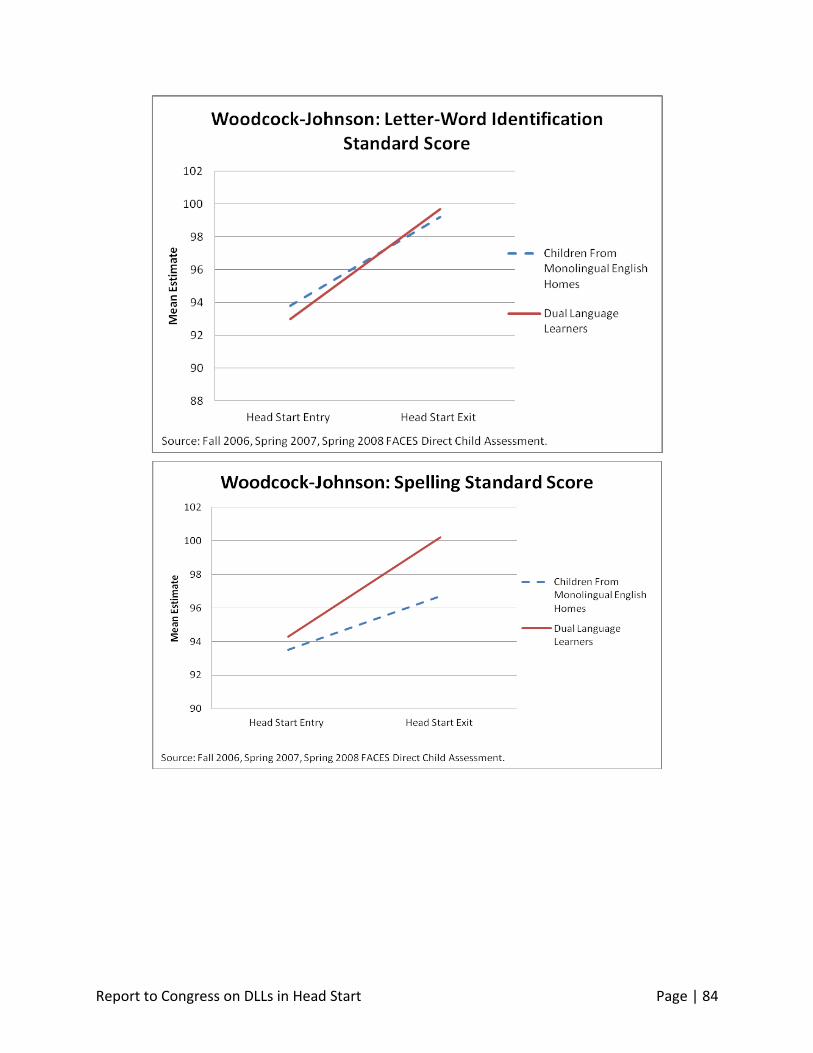
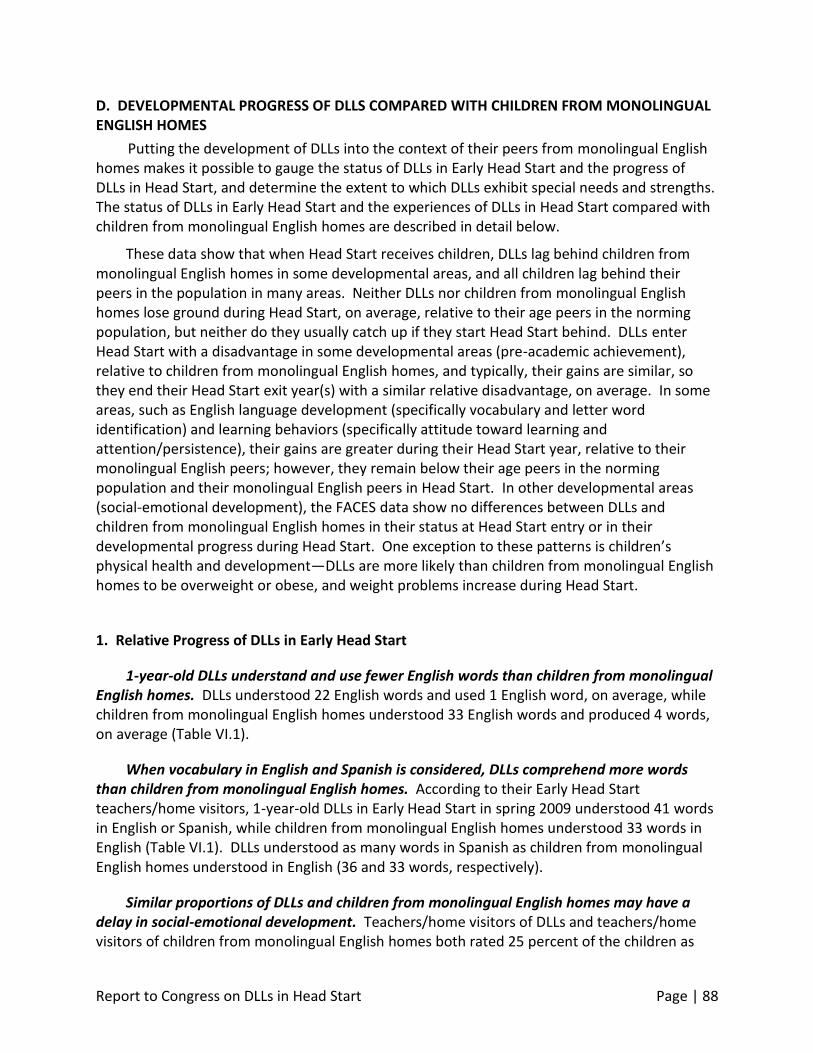
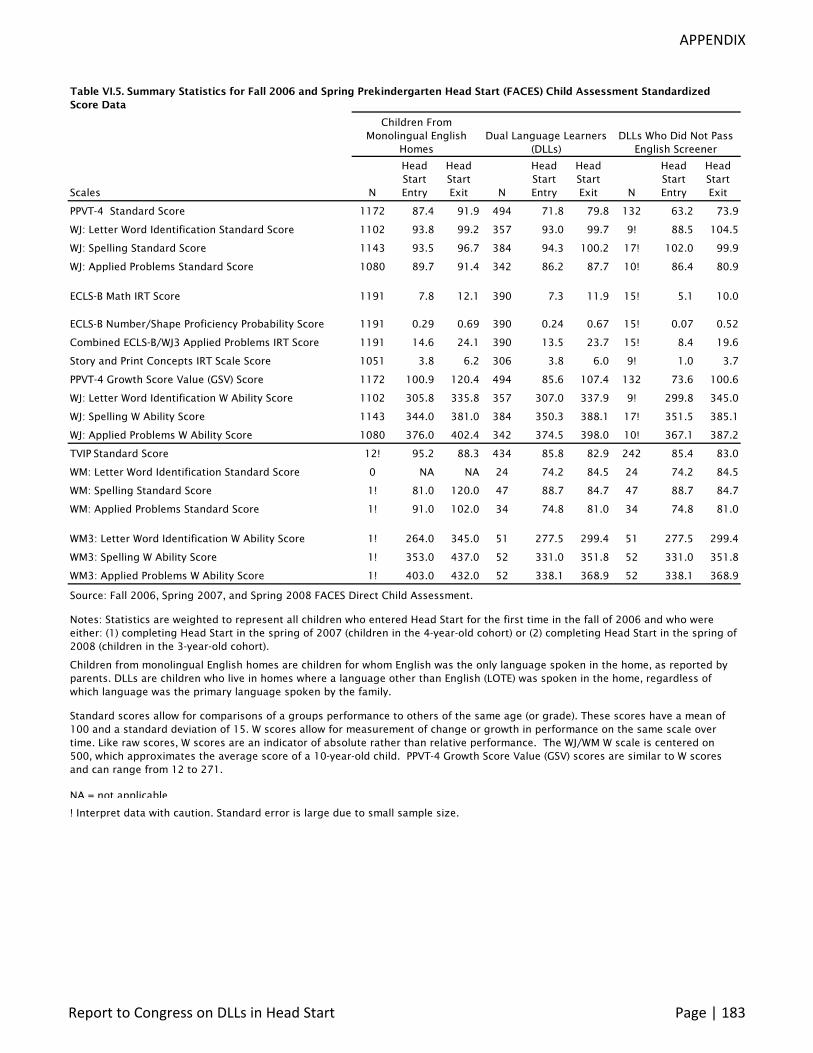
DLLs in Head Start increase their receptive English vocabulary during Head Start but they begin and end their Head Start year(s) with receptive English vocabulary well below national norms Average Peabody Picture Vocabulary Test (PPVT-4) scores of both DLLs and children from monolingual English homes increased slightly by spring of childrens Head Start exit year indicating that all children made slight gains relative to their age peers in English vocabulary development Among children with valid data at both time points however it appears that DLLs made greater gains during the Head Start year relative to their peers from monolingual English homes (DLLs increase from 718 to 798 English dominant increase from 874 to 919)
By the end of Head Start DLLs assessed in English demonstrated English letter-word knowledge and spelling skills near the norm for their age DLLs with adequate English
Report to Congress on DLLs in Head Start Page | 18
language skills to pass the English screener and take the English assessment battery at Head Start entry resembled their peers from monolingual English homes in their English letter-word knowledge and spelling skills at Head Start exit and they experienced similar gains over time
On average Spanish-speaking DLLs did not show gains in their Spanish language skills over time They began and ended Head Start with receptive Spanish vocabulary below national norms Moreover among Spanish-speaking DLLs with valid scores at Head Start entry and exit TVIP scores (measuring receptive Spanish vocabulary) decreased slightly from 86 to 83 about one standard deviation below the (monolingual Spanish speaking) norm
By the end of Head Start DLLs assessed in English demonstrate math skills similar to their Head Start peers DLLs regardless of language of assessment improved their math skills beginning and ending Head Start similarly behind their peers in the population as other Head Start children from monolingual English homes Those assessed in Spanish demonstrated math skills a half standard deviation below the norm
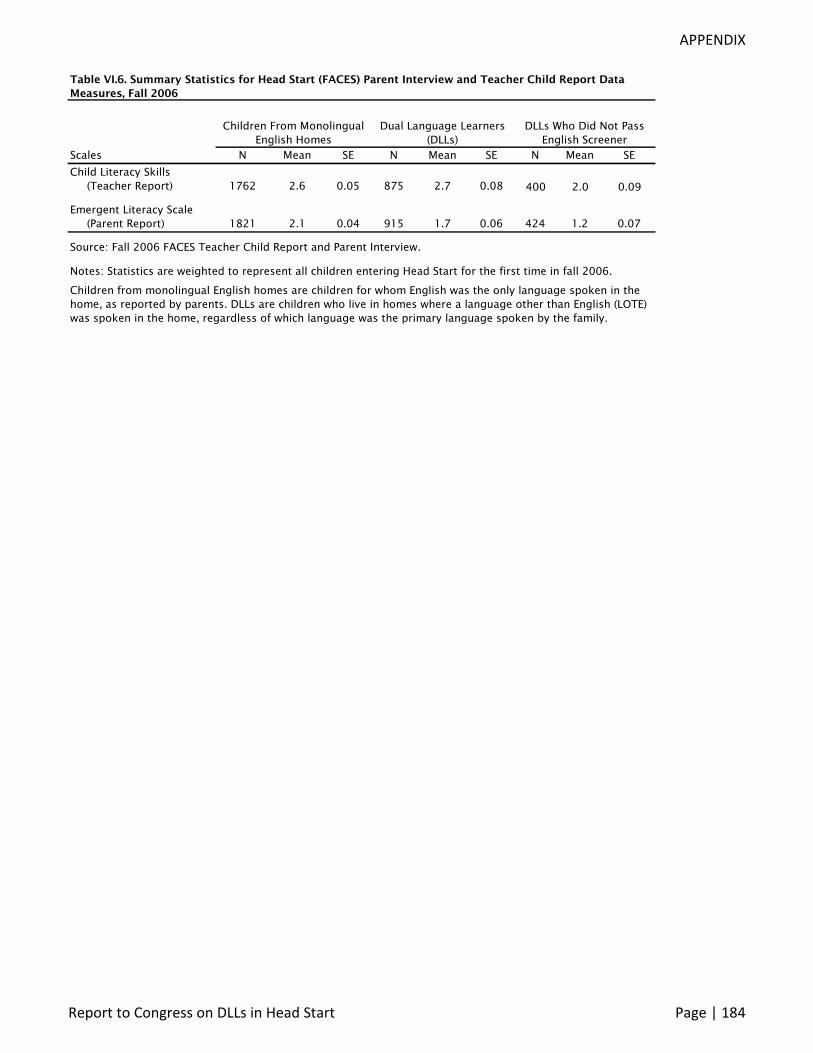
In literacy skills and approaches to learning DLLs and children from monolingual English homes look similar According to teachers and parents DLLs and children from monolingual English homes have similar literacy skills both at the beginning and at the end of Head Start Similarly the approaches to learning of DLLs and children from monolingual English homes are the same on average
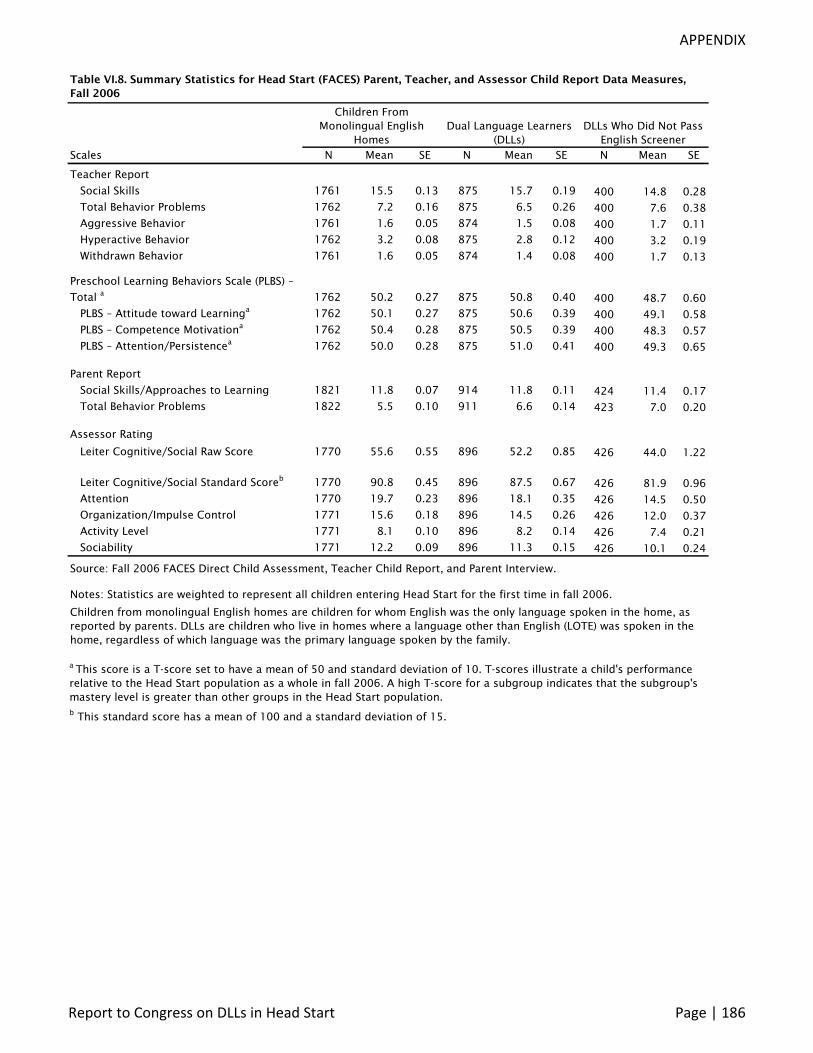
Teacher reports suggest that DLLsrsquo behavior problems may decline during Head Start-however parent reports remain the same At Head Start entry total numbers of behavior problems reported by parents and teachers of DLLs were similar on average At the end of Head Start the average number of behavior problems reported by parents remained similar while teachers reported fewer problems on average According to teachers DLLs exhibit fewer behavior problems than children from monolingual English homes on average both when they enter Head Start and at the end of their Head Start exit year(s) However parents of DLLs perceive greater problem behaviors in their children than parents from monolingual English homes at both time points
The cognitive-social skills of DLLs and children from monolingual English homes are similar between groups and over time lagging behind their age peers in the norming population Leiter-R Rating Scales (completed by assessors) of childrens cognitive-social development (ie attention organization and impulse control activity level and sociability) show that both DLLs and children from monolingual English homes demonstrated cognitive-social skills below their age peers by between one-half and one standard deviation both when they entered Head Start and in the spring of the Head Start exit year(s)
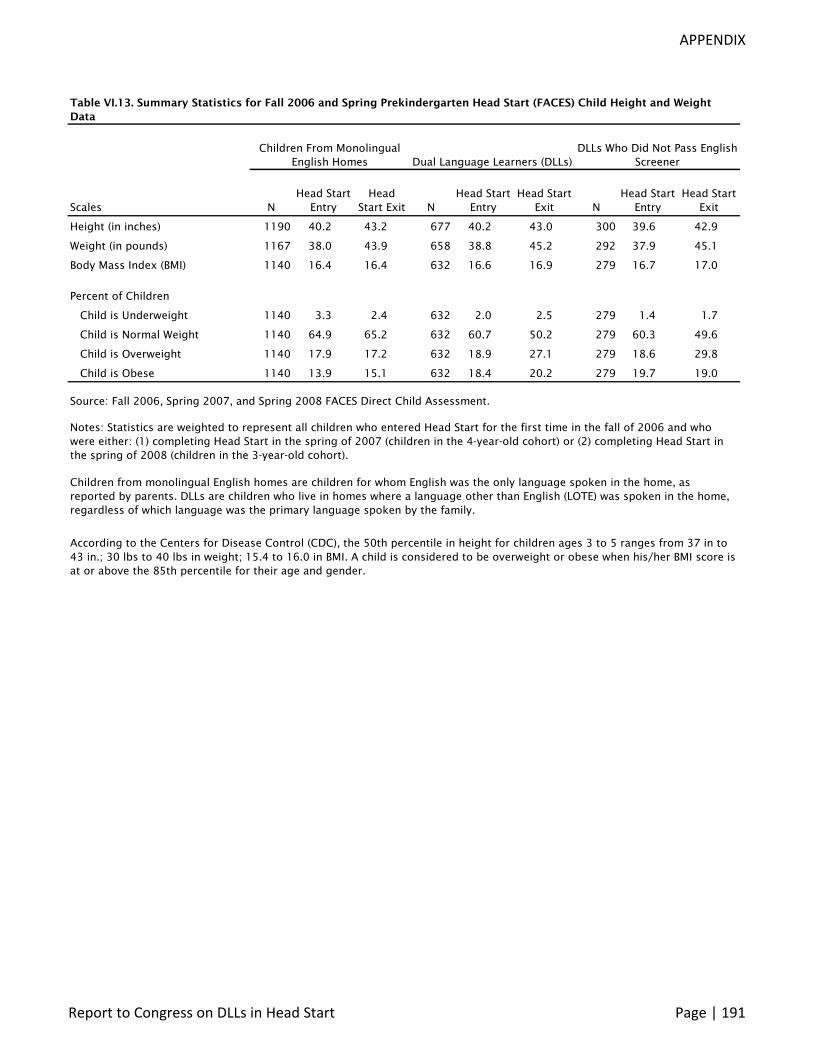
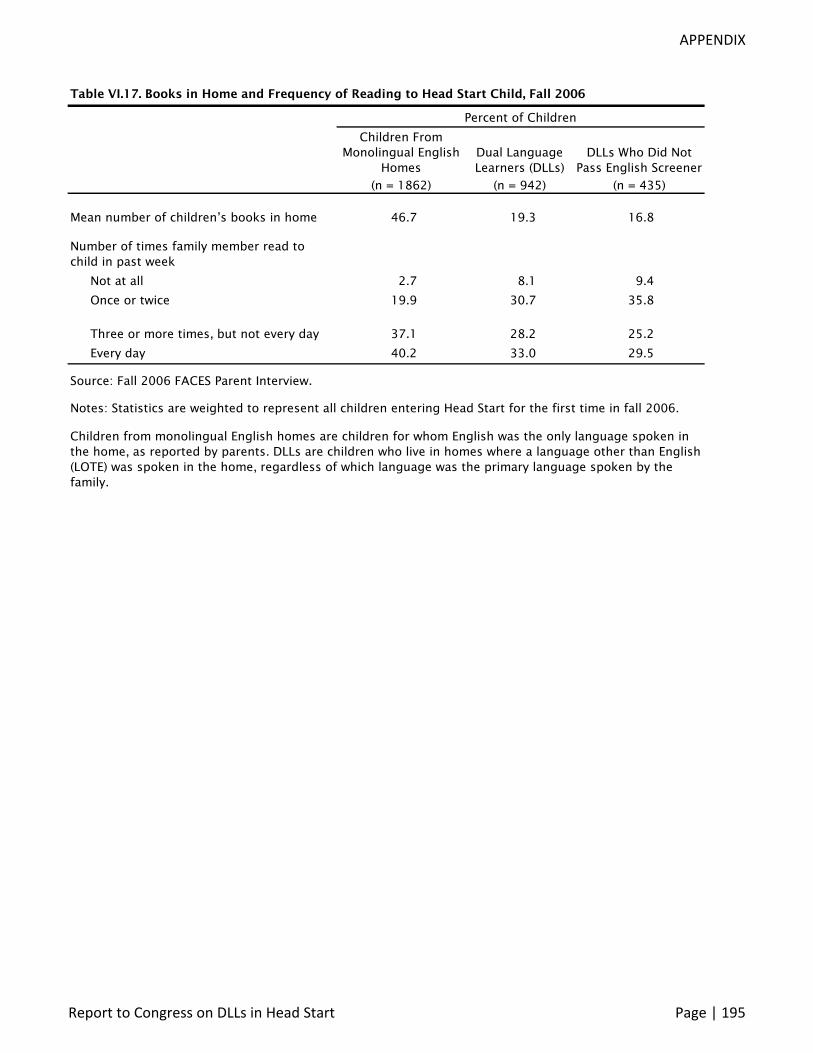
DLLs come from less literacy-rich home environments When they entered Head Start DLLs came from homes with 19 childrens books on average less than half as many books as in the homes of children from monolingual English homes (47 childrens books on average)
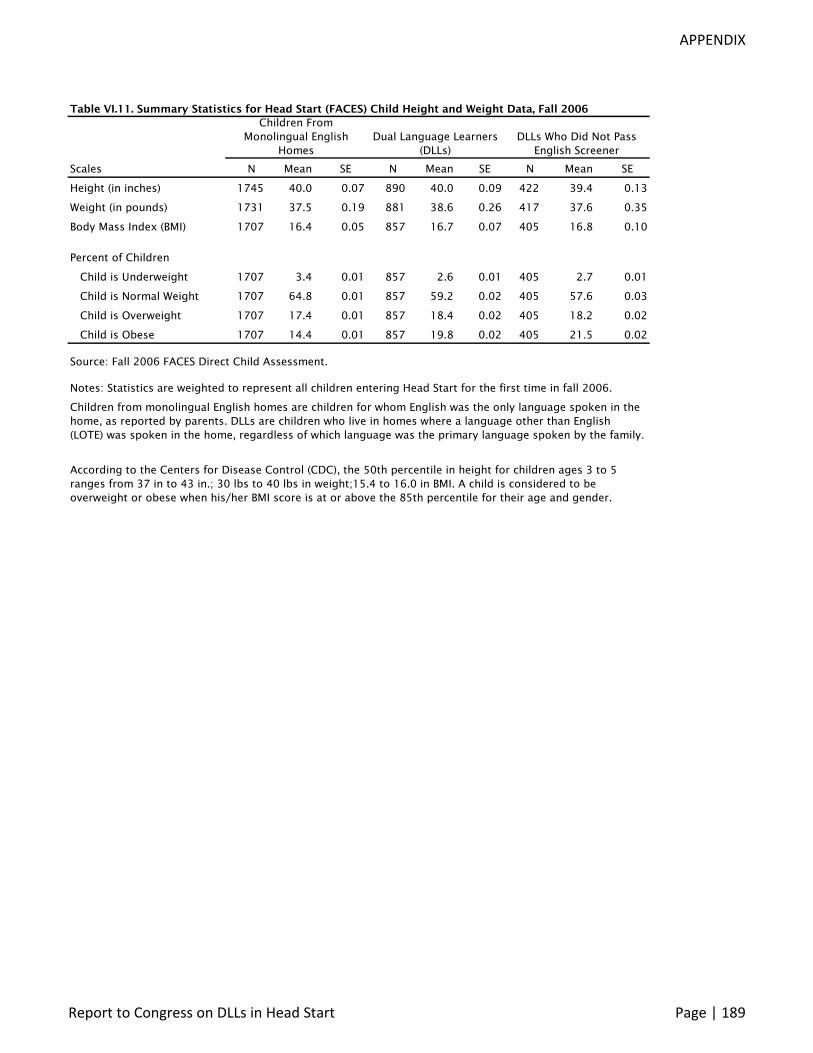
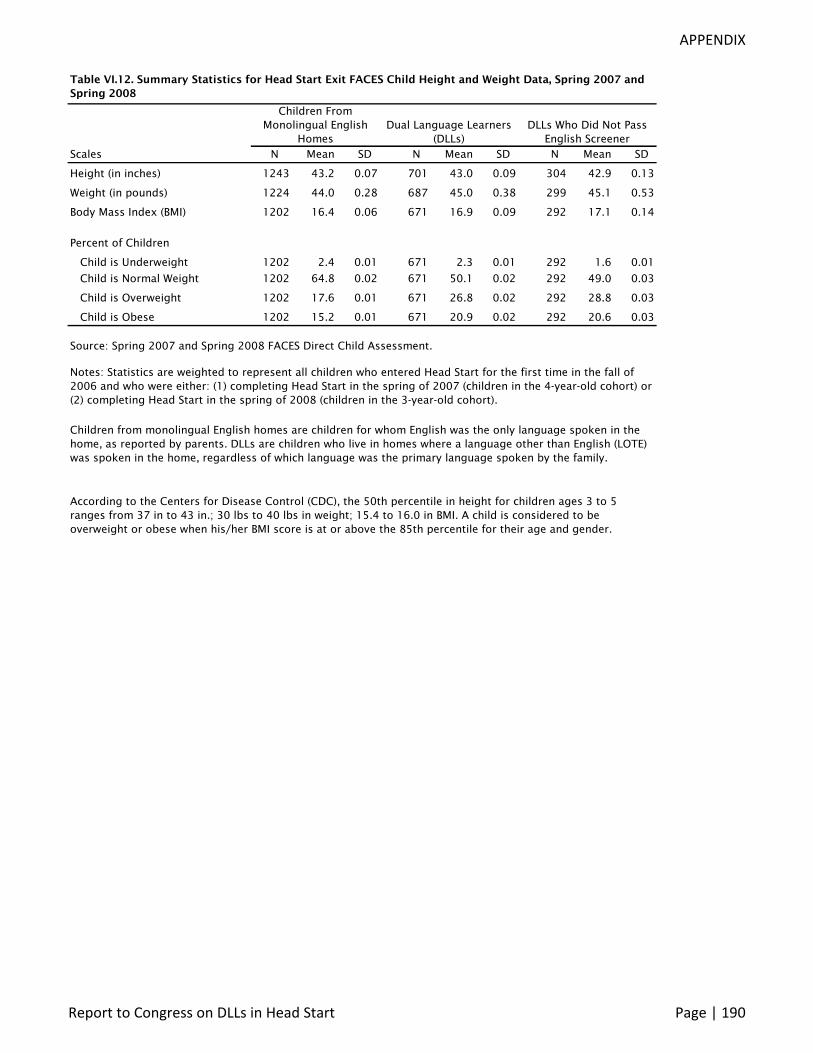
Weight problems increase dramatically among DLLs during Head Start Among DLLs with valid data at both time points the percentage overweight or obese increased from 37 percent at entry to Head Start to 47 percent at the end of Head Start The extent of weight problems increases among DLLs but not children from monolingual English homes during Head Start
Report to Congress on DLLs in Head Start Page | 19
In sum the available data show that on average children served by Head Start lag behind their peers in the population in many areas when they first enter Head Start For DLLs the lag is even greater Neither DLLs nor children from monolingual English homes lose ground during Head Start on average relative to their same age peers in the norming population but neither do they catch up On average DLLs enter Head Start with a disadvantage in some developmental areas (pre-academic achievement) relative to their peers in Head Start from monolingual English homes and typically their gains are similar so they leave Head Start with a similar relative disadvantage In other developmental areas (social-emotional development) the data show no differences between DLLs and children from monolingual English homes in their status at Head Start entry or in their developmental progress during Head Start In some areas (English vocabulary development approaches to learning cognitive-social skills) DLLs appear to make greater gains than their peers during their time in Head Start and this parallels findings in other recent studies of at-scale preschool education programs that have found that DLLs benefit more than their native English-speaking peers (Gormley Gayer Phillips amp Dawson 2005 Horm 2010 Weiland amp Yoshikawa 2011) One area of particular concern is childrens physical health and developmentmdashDLLs are more likely than children from monolingual English homes to be overweight or obese and the prevalence of weight problems increases during their time in Head Start
FINAL THOUGHTS
The substantial and rapidly growing population of young DLLs in the United States presents unique challenges as well as unique strengths to Head Start programs and other early education programs poised to serve them While research capacity builds to improve our understanding and methods for promoting DLLs development there are opportunities to strengthen the services offered to young DLLs and their families The findings in this report rely on descriptive data therefore we cannot draw causal inferences regarding relationships between the services received and experiences or outcomes among DLLs or their families In some areas such as in program services the implications of the data are stronger and suggest areas for renewed focus or effort in engaging families of DLLS targeting services in culturally sensitive ways improving efforts to address health and nutrition issues such as food insecurity and obesity and developing individual family plans) program activities and workshops and links to community resources in ways that are responsive to familys needs and preferences
Improving research capacity to understand DLLsrsquo development and experiences in Head Start While data do not exist to answer some of the questions posed by Congress at this time several efforts are underway to build research capacity in this area in order to improve the state of knowledge about the children and families served by Head Start as well as those served by other early childhood programs As discussed more fully in the report many of the limitations and challenges found in national research studies on Head Start programs reflect gaps in the field of research on early childhood more generally as well as challenges specific to national studies of young children Several ACF-funded research efforts are addressing the gaps in research on this population and the questions posed in the Head Start Act The efforts undertaken by ACF to improve information on children who are dual language learners incl ude
Report to Congress on DLLs in Head Start Page | 20
a combination of adjustments to the instruments and methods used in national surveys and ndash more substantially ndash efforts to launch supplemental research projects to gather more detailed information on key populations of dual language learners in Head Start to build capacity in the research field to provide better information regarding the development needs and strengths of young DLLs and to develop new curricula and assessment tools for young DLLs and their families These activities are discussed in the final chapter of the report
Current programmatic initiatives While research activities are in progress to address the limitations and gaps in existing data concerning young children who are dual language learners ACF is also implementing several programmatic initiatives to improve services to DLLs and their families In addition to the requirement for this report to Congress there were many implications for DLLs in the Improving School Readiness Act of 2007 that helped frame and promote several initiatives to increase support for centers and staff to better serve children who are dual language learners and their families Starting in early 2008 the Office of Head Start has developed a variety of publications conferences and online resources to improve staff access to the most current information regarding how to promote growth and school readiness among DLLs and how to better support their families Most recently as part of revisions to the Head Start Training and Technical Assistance System a National Center on Cultural and Linguistic Responsiveness was established in 2010 to provide the Head Start community with research-based information practices and strategies to ensure optimal academic and social progress for linguistically and culturally diverse children and their families In addition the Head Start Child Development and Early Learning Framework (Revised Child Outcomes Framework) gives staff clear information regarding the importance of gaining an understanding of what children who are dual language learners know and can do across all domains of the framework regardless of language spoken as well as an emphasis on progress towards English Language Development In combination these activities and resources serve as a model of strengthening infrastructure to promote the well-being of diverse children and families responsively and comprehensively
In conclusion many efforts are currently underway to strengthen programs staff and the knowledge base to better serve all children and families in Head Start and Early Head Start programs including those who speak languages other than English at home Activities that are building research capacity to answer questions concerning young dual language learners and their families go hand in hand with programmatic efforts to improve services
Report to Congress on DLLs in Head Start Page | 21
Report to Congress on DLLs in Head Start Page | 22
CHAPTER I INTRODUCTION
The Office of Head Start has long required programs to provide comprehensive services in ways that are culturally appropriate and respectful (45 CFR 130421(a)(1)(i amp iii)) As an extension of this programs are required to support children from homes where a language other than English is spoken in ways that are culturally and linguistically responsive including promoting both their home language and English language development These requirements are consistent with provisions of the Improving Head Start for School Readiness Act of 2007 (PL 110-134 hereafter the Head Start Act) which emphasizes improving outreach enrollment and quality of services to children with limited English proficiency Both the Head Start Act and Head Start program requirements reflect research that demonstrates the importance of supporting acquisition of both languages and the ways that loss of home language can interfere with important aspects of child development and family relations (Administration for Children and Families 2008)
The Head Start Act requires the Secretary to conduct a study on the status of limited English proficient children and their families participating in Head Start programs (including Early Head Start programs) This report presents the results of this study
The use of varying terms and definitions by different researchers and policy makers can complicate learning about children and families who are not native English speakers Thus this introduction starts by examining the terminology in the Head Start Act and introducing the terminology and definitions used in this report After establishing the terminology we review the requirement for this report in the Head Start Act and define the research questions addressed in subsequent chapters Next we summarize the data sources and analytic methods we used to address the research questions and finally we provide a guide to the remainder of the report
A DEFINITION OF lsquoDUL LNGUGE LERNERSrsquo
The Head Start ct uses the term limited English proficient and defines the population broadly to encompass a wide range of children including those exposed to a language other than English those whose native language is not English and those with limited skills in English Specifically section 637 of the law defines the child who is limited English proficient as one
Report to Congress on DLLs in Head Start Page | 23
(A) (i) who was not born in the United States or whose native language is a language other than English
(ii) (I) who is a Native American (as defined in section 9101 of the Elementary and Secondary Education Act of 1965 (20 USC 7801)) an Alaska Native or a native resident of an outlying area (as defined in such section 9101) and
(II) who comes from an environment where a language other than English has had a significant impact on the childs level of English language proficiency or
(iii) who is migratory whose native language is a language other than English and who comes from an environment where a language other than English is dominant and
(B) whose difficulties in speaking or understanding the English language may be sufficient to deny such childmdash
(i) the ability to successfully achieve in a classroom in which the language of instruction is English or
(ii) the opportunity to participate fully in society
In this study we use the term dual language learners (DLLs) to encompass limited English proficient (LEP) as defined in the Head Start ct This term is recognized in the Early Childhood Field as one used for a child who comes from a home where a language other than English is spoken A DLL is a child learning two (or more) languages at the same time or a child learning a second language while continuing to develop their first (or home) language DLL also includes key groups of children served in American IndianAlaska Native (AIAN) and Migrant and Seasonal Head Start (MSHS) programs AIAN or MSHS children served in programs located in federal regions not under the auspices of AIAN Head Start or MSHS and children served in programs in Puerto Rico and US territories
In this report DLLs are defined operationally as children for whom a language other than English (LOTE) was the primary language that parents reported speaking to them Most of the findings reported reflect children who match this definition of DLL Analyses of Program Information Report (PIR)6 data distinguish children who live in homes where a LOTE was the primary language spoken by the family at home Analyses of data from the Head Start Family and Child Experiences Survey (FACES) and the Early Head Start Family and Child Experiences Survey (Baby FACES) distinguish children who live in homes where a LOTE was spoken in the home regardless of which language was the primary language spoken by the family Children for whom English was the only language that parents reported speaking in the home are referred to throughout the report as children from monolingual English homes There is diversity in the language experiences of children in both of these groups nearly one out of four DLLs in Head Start live in homes where English is also spoken and it is likely that some children from monolingual English homes hear other languages at home learly distinguishing home language experiences in dichotomous or simple terms is not fully accurate or completely satisfactory However as with the vast majority of research studies investigating the implications of home language experiences this report must present analyses and findings in somewhat simple terms due to limited sample sizes within some subgroups and for ease of presentation Whenever possible (when distinctions could be made based on the data) analyses examined various groupings of children within this broader definition of DLLs and data tables in the Appendix report these However most of the findings reported in the narrative of
6 The Office of Head Start Program Information Report (PIR) provides comprehensive data on the services staff children and families served by Head Start and Early Head Start programs nationwide All grantees and delegates are required to submit Program Information Reports for Head Start and Early Head Start programs Go to httpeclkcohsacfhhsgovhslcmrpir for additional information about the PIR
Report to Congress on DLLs in Head Start Page | 24
the report reflect children for whom a LOTE was the primary language that parents use when speaking to them as reported by parents Exceptions are noted
B REQUIREMENT IN THE HEAD START ACT FOR THE REPORT (SECTION 649(H)(2))
The Head Start Act requires preparation of a report to Congress addressing questions about the characteristics of and services provided by Early Head Start and Head Start programs to LEPs (as noted in section A LEP has been included within the definition of DLL) More specifically the Act calls for information about
(A) the demographics of limited English proficient children from birth through age 5 including the number of such children receiving Head Start services and Early Head Start services and the geographic distribution of children described in this subparagraph
(B) the nature of the Head Start services and of the Early Head Start services provided to limited English proficient children and their families including the types content duration intensity and costs of family services language assistance and educational services
(C) procedures in Head Start programs and Early Head Start programs for the assessment of language needs and the transition of limited English proficient children to kindergarten including the extent to which such programs meet the requirements of section 642A for limited English proficient children
(D) the qualifications and training provided to Head Start teachers and Early Head Start teachers who serve limited English proficient children and their families
(E) the languages in which Head Start teachers and Early Head Start teachers are fluent in relation to the population and instructional needs of the children served
(F) the rate of progress made by limited English proficient children and their families in Head Start programs and in Early Head Start programs includingmdash
(i) the rate of progress0 toward meeting the additional educational standards described in section 641A(a)(1)(B)(ii) (ie literacy knowledge and skills including phonological awareness print awareness and skills and alphabetic knowledge) while enrolled in such programs
(ii) a description of the type of assessment or assessments used to determine the rate of progress made by limited English proficient children
(iii) the correlation between such progress and the type and quality of instruction and educational programs provided to limited English proficient children and
(iv) the correlation between such progress and the health and family services provided by such programs to limited English proficient children and their families and
(G) the extent to which Head Start programs and Early Head Start programs make use of funds under section 640(a)(2)(D) to improve the quality of such services provided to limited English proficient children and their families
Report to Congress on DLLs in Head Start Page | 25
This report makes use of data available from the Head Start Program Information Report (PIR) the Head Start Family and Child Experiences Survey (FACES) and the Early Head Start Family and Child Experiences Survey (Baby FACES) to address as many of these questions as possible as described in the next section The report also will discuss the limitations of current data and current research methodologies to address many of the questions that are of critical interest to policy makers and practitioners Some of these questions can be answered completely such as describing the demographics of children from families with limited English proficiency (LEP) who are served by Head Start and Early Head Start Other questions can only be answered partially For example data are available to describe the range and nature of services offered to children and families as well as to address aspects of the language assistance provided however the content duration and intensity of all types of services cannot be described in as much detail as desired (eg quality or intensity of instructional supports for language and literacy development) This report provides as much of a response as the available data and existing methods can reliably address For example reporting the rate of progress made by children who are dual language learners and their families enrolled in Head Start programs is limited by the state of the field more broadly in the area of assessment of young dual language learners (discussed more below) and in the area of identification and measurement of family processes for these families For some questions important information is available beyond that specified in the Act such as in the area of qualifications and training provided to teachers Related to this question the report also describes qualifications of other critical staff in Head Start programs such as home visitors education coordinators and program directors as well as other important factors such as the mental health of teaching staff While d ata do not exist to answer some of the questions posed by Congress at this time several efforts are underway to collect additional data in the future and to build capacity in this area in order to improve the state of knowledge about the children and families served by Head Start as well as those served by other early childhood programs Efforts funded by ACF to address these gaps will be discussed in the final chapter of the report
In addition requirement G above references the extent to which grantees directly make use of funds under 640(a)(2)(D) These funds support research demonstrations and evaluations sponsored by the Administration for Children and Families and carried out through competitively awarded grants and contracts The research efforts supported by these funds inform and improve the services provided by Head Start grantees to DLL children and their families OHS technical assistance activities such as the Early Childhood Learning and Knowledge Center (ECLKC) and the National Center for Cultural and Linguistic Responsiveness incorporate the findings of these efforts
C RESEARCH QUESTIONS
This report addresses the following questions presented in the Head Start Act
6 What are the characteristics of children who are dual language learners (DLLs) and their families receiving Head StartEarly Head Start services
Report to Congress on DLLs in Head Start Page | 26
7 What is the nature of the Head StartEarly Head Start services provided to children who are DLLs and their families
8 What are the qualifications and training of Head Start and Early Head Start teachersstaff that serve children who are DLLs and their families
9 What are the languages that Head Start and Early Head Start teachersstaff use in relation to the children and families they serve
10 What developmental progress is observed in children who are DLLs in Head StartEarly Head Start programs
To provide important context for interpreting the answers to these questions the report also highlights differences in each area between DLLs and children from homes where only English is spoken
D DATA SOURCES
In this section we describe the specific data sources analyzed for this report including the purpose methodology and nature of each We present an overview of the information provided by each source for this report with illustrative examples of questions that each data source can address We explain the limitations of the data for the purposes of this report both those specific to each source and those that reflect challenges in the current state of research on young children who are dual language learners
The current report utilizes three datasets to describe the children and families enrolled in Head Start programs and their experiences in the programs the Head Start Program Information Report (PIR) the Head Start Family and Child Experiences Survey (FACES) the Early Head Start Family and Child Experiences Survey (Baby FACES)
Head Start Program Information Report (PIR) The Office of Head Start Program Information Report (PIR) provides comprehensive descriptive data on the services and staff of Head Start and Early Head Start programs nationwide (For more information see descriptions and survey forms at httpeclkcohsacfhhsgovhslcHead percent20Start percent20Programpir) All grantees and delegate agencies are required to submit Program Information Reports annually This administrative dataset provides the most current data available on children and families served by Head Start Early Head Start Migrant and Seasonal Head Start and American Indian and Alaska Native grantees and the services and activities that are provided The data presented here (2007-2008 program year) are not the most current PIR data available at the time of releasing this report they are what was available at the time that data analyses began
The PIR survey is completed by individual programs using a common self-report protocol Surveys are completed by a variety of program staff ranging from program directors (more likely in smaller programs) or Family and Community Partnerships staff to administrative staff in larger programs with multiple centers (Elkin Augustin and Thomas 2007i) PIR data are compiled for analysis at the national regional state and grantee levels Information from the
Report to Congress on DLLs in Head Start Page | 27
PIR is aggregated at the program or grantee level and therefore it is not possible to break down and examine the data by subsets of children such as children who are dual language learners
Primarily we use PIR data in this report to describe program characteristics including enrollment regional distribution program options qualifications of staff and services available to and received by childrenfamilies at the national regional and grantee levels These data permit us to look at the staff and services provided by grantees with different concentrations of children and families speaking languages other than English at home For example where are grantees with higher concentrations of children and families speaking languages other than English located Are there any appreciable differences in the staffing program options or services provided among programs with greater or lesser concentrations of DLL children
The PIR is the only dataset that provides information about the universe of Head Start programs including Migrant and Seasonal Head Start (MSHS) programs American Indian and Alaska Native (AIAN) programs and programs in Puerto Rico and other US territories At this time all of our national data on MSHS programs and AIAN programs come from PIR This permits us to describe limited demographic characteristics of children and families enrolled in MSHS and AIAN programs and the program options and types of services available to and utilized by families enrolled in these programs Also PIR data permit us to describe characteristics of programs with varied concentrations of children who are dual language learners For example we can use PIR data to explore how the type of program or services provided may vary by concentration of DLLs enrolled
The aggregated nature of PIR data poses limitations on the capacity of this dataset to illustrate the experiences of children and families served by Head Start programs PIRs are collected at the grantee-level and grantees correspond to as few as one to as many as over 200 actual program sites centers or settings (PIR 2007-2008) Head Start grantees range from small non-profit agencies that directly operate programs have no delegate agencies and operate as few as one classroom (approximately 1500) to super grantees Super Grantees such as Chicago Los Angeles and New York City include as many as 74 delegate agencies many with multiple program sites and serve over 20000 children in as many as 1000 classrooms across an entire city In some grantees there is wide variation in distribution of DLLs across sites Therefore when describing characteristics or services of grantees serving various concentrations of DLLs findings represent the range of grantees and do not necessarily portray what a child or family typically experiences at a program site or center Furthermore the aggregated nature of PIR data does not allow for analyses looking at experiences of individual children or families in classrooms centers or program sites or the services they received or the relationships between child- classroom- center- or program-level characteristics
There is considerable grantee-specific variability in how reporting categories are assessed Although guidelines and training are available for programs there is no standardization of how programs assess or count instances of the services experiences and characteristics reported in the PIR For some categories such as family home language or staff proficiency in a language other than English the absence of standard assessment protocols used by all grantees to
Report to Congress on DLLs in Head Start Page | 28
determine these in a common way likely leads to considerable variability For other categories such as number of children who completed oral health examinations or number of children with Individualized Education Plans inconsistency in countingassessment methods and reporting is less likely Nonetheless recent validation studies have found some inconsistencies between PIR data and validation study estimates based on program records for PIR items regarding staff credentials and child and family services (Elkin Augustin and Thomas 2007 GAO-08-221 2008ii) Current efforts are underway to strengthen guidelines for data collection and reporting by programs and for verification of data Since PIR data are collected annually from all Head Start programs the dataset provides a unique and informative window into the range of services offered and the children and families enrolled nationwide especially in areas that other data collection efforts have not been able to represent
Head Start Family and Child Experiences Survey (FACES) The Head Start Family and Child Experiences Survey (FACES) is a nationally representative cohort study of three- and four-yearshyold children newly enrolled in Head Start (For more information see technical reports on ACF website httpwwwacfhhsgovprogramsoprehsfaces) FACES data have been collected every three years since 1997 This report uses data from the 2006 cohort which includes three-and four-year-old children who entered Head Start in the fall of 2006 their families and local program staff (West Tarullo Aikens Sprachman Ross amp Carlon 2007)
FACES complements PIR data by bringing analyses down to the child level We present FACES data from (1) interviews with parents at Head Start entry (Fall 2006) and exit (2) interviews with teachers education coordinators and center directors in the fall of 2006 (3) teacher reports of each child at Head Start entry (Fall 2006) and in the spring until Head Start exit (4) observations of Head Start classrooms in the spring of 2007 and (5) direct child assessments at Head Start entry (Fall 2006) and in the spring until Head Start exit (West et al 2010 West et al 2008 Tarullo et al 2008) FACES data are used here to describe at the individual level (1) characteristics and experiences of children and families enrolled in Head Start (2) staff qualifications credentials and beliefs (3) classroom practices and quality and (4) developmental progress of children
FACES data permit us to describe the characteristics and experiences of children and their families by varying degrees of exposure to languages other than English (ie children whose parents primarily use a language other than English to speak with them children with low English proficiency at Head Start entry) We can present the developmental progress of children with different home language experiences from entry into Head Start until exit from Head Start In addition we can link individual children and families with classroom teacher and center-level characteristics Therefore we are able to describe the classroom experiences of children who are primarily hearing a language other than English at home including the languages of instruction in their classrooms In descriptions of teacher classroom or center-level characteristics only the focal child is DLL however since monolingual English children could be and likely are in classrooms with DLL children these data do not only portray experiences of LOTE children
Although FACES is designed to be nationally representative the dataset has several limitations that restrict our ability to generalize to all children enrolled in Head Start programs
Report to Congress on DLLs in Head Start Page | 29
First the sample only includes children who entered Head Start in the fall of 2006 and who were attending Head Start at the different points of data collection Therefore children who enrolled but never attended or who stopped attending prior to data collection in the spring of 2007 are not represented in these analyses Second FACES did not assess childrens development in other languages besides Spanish and English and assessment in Spanish is limited Due to the small sample sizes among groups of children speaking languages other than English or Spanish and limited assessment tools in these other languages FACES has far more data on Spanish-speaking children in Head Start than on children speaking any other languages other than English (LOTEs) As reported in Chapter II the most common LOTE among children in Head Start programs is Spanish accounting for 26 percent of all children enrolled or 84 percent of children from homes where a language other than English is spoken Children in FACES 2006 who speak a language other than English or Spanish total 6 percent of the sample and represent several languages The next most common LOTEs after Spanish are Asian languages accounting for 2 percent of children enrolled We can report on development in a LOTE for Spanish-speaking children only Children were not assessed directly if they could not be assessed in English and they spoke a language other than Spanish
For multiple reasons FACES has not sampled from programs operated by federally recognized American IndianAlaska Native (AIAN) tribes consortia or corporations Migrant and Seasonal Head Start (MSHS) programs or programs located in Puerto Rico and the Pacific Islands Therefore FACES data cannot be used to describe children and families served by these programs MSHS (Region 12) programs have more flexibility than other Head Start programs to structure services differently to serve the families in their communities resulting in a much wider range of program variations For example MSHS programs coordinate enrollment periods and length of program year with the local agricultural seasons hence the pre-post design of FACES (ie fall and spring of a traditional academic year) would not capture the services MSHS programs provide AIAN programs (Region 11) reflect the diversity of languages and traditions that exist in AIAN cultures vary greatly in size and are geographically dispersed In order to acquire a sample that would be large enough to be nationally representative of these programs any national survey would require a massive sample collected from many geographically remote areas and the costs would be prohibitive Despite the inability to include AIAN programs FACES does include AIAN children accounting for approximately 2 percent of the sample Moreover it is not clear what measures are appropriate for use with the populations served by MSHS AIAN programs programs in Puerto Rico or the Pacific Islands as there has not been adequate testing and validation of existing measures ACF-funded efforts that are underway to improve research in these communities are discussed below For these reasons FACES as well as other national studies of Head Start programs to date have not been able to produce comparable data for these Regions and populations (For more information regarding the program regulationsperformance standards and distinguishing characteristics of MSHS and AIAN programs see httpeclkcohsacfhhsgovhslc and related research efforts at httpwwwacfhhsgovprogramsopreprojectheadStartProjectsjsp)
Finally FACES 2006 used the best developmental assessments and procedures available at the time of data collection FACES represents the cutting-edge of national surveys in assessing
Report to Congress on DLLs in Head Start Page | 30
development of young children who are dual language learners (DLLs) but it had to balance the need to represent the experiences of all children in Head Start with a commitment to accurately reflect the experiences of DLLs As discussed more fully below data on developmental progress of DLLs is generally limited by lack of widely recognized reliable measurements in the field at this point in time
Early Head Start Family and Child Experiences Survey (Baby FACES) The Early Head Start Family and Child Experiences Survey (Baby FACES) is a nationally representative sample of infants who enrolled in Early Head Start in 2009 (For more information see Baby FACES technical reports at httpwwwacfhhsgovprogramsopreehsdescriptive_studyindexhtml) We use data from the 1-year-old cohort which includes children who were between 10 and 15 months of age at the time of data collection in the spring of 2009 their families and local program staff
Baby FACES supplements PIR and FACES data by focusing on infants served by the Early Head Start programs and by bringing analyses down to the child- and family-level for this group We present Baby FACES baseline data collected in spring of 2009 from (1) interviews with parents (2) interviews with home visitors and teachers (3) interviews and self-administered surveys with program directors (4) home visit observations and (5) direct classroom observations These data are used here to describe at the individual level (1) characteristics and developmental status of 1-year-old children in Early Head Start (2) program services including quality of home visits and classrooms (3) staff qualifications and credentials and (4) family well being parent-child interactions and aspects of the home environment
Baby FACES data provide a snapshot of infants developmental status and family experiences when children are 1 (and eventually will depict these children at 2- and 3-years old) Baby FACES data permit analyses of children by varying degrees of exposure to languages other than English (ie children from homes in which a language other than English is spoken children whose parents primarily use a language other than English to speak with them) Hence we can present the developmental status of children with different home language experiences at or soon after entry into Early Head Start In addition we can link individual children and families with home visitors teacher classroom and center-level characteristics Therefore we are able to describe the care experiences of infants who are primarily hearing a language other than English at home including the languages spoken by home visitors teachers or other adults in their classrooms
Although Baby FACES provides us with nationally representative data regarding infants in Early Head Start (EHS) programs there are several limitations that constrain our ability to generalize to all infants and toddlers enrolled in EHS programs First the Baby FACES sample only includes children around the target age at the time of the first data collection Thus the study does not address children of different ages
Second the Baby FACES data that was available at the time of preparing this reportmdash baseline data collected in Spring 2009mdashdoes not permit analyses of developmental progress once infants and families have been enrolled in Early Head Start for a period of time In addition as described above due to the small sample sizes of non-Spanish speaking young DLLs and the lack of reliable instruments in languages other than English and Spanish we are unable
Report to Congress on DLLs in Head Start Page | 31
to present as much information about infants in families where non-Spanish LOTEs are spoken Finally the Baby FACES sample does not include children and families served by MSHS or AIAN programs for the reasons described above pertaining to differences in the structure of programs and consequently the constraints on acquiring a representative sample Most important although Baby FACES used the best developmental assessments and procedures available at the time of data collection measurement of language development for infants and toddlers is not as robust as for preschoolers This is especially true for assessments of children experiencing LOTEs
E LIMITATIONS OF RESEARCH FOR THIS POPULATION
The limitations of extant research and methodology concerning young children who are dual language learners (DLLs) restrict the quality of data that are available on DLLs in Head Start programs Both FACES and Baby FACES utilized the best and most feasible methods available for nationally representative comprehensive large-scale studies to represent the experiences of young children who are dual language learners After consultation with leaders in the field both program and research experts FACES and Baby FACES used state of the art methods to assess development among young dual language learners For example FACES utilized a language screener to route Spanish-speaking children to the appropriate language for assessment In addition childrens language development (receptive vocabulary) was assessed in both English and Spanish if they lived in a home where Spanish was spoken regardless of their proficiency in either language In Baby FACES the study team worked with the Preschool Language Scale (PLS) measure developer to use a version of PLS 4 that assesses Spanish and English ability in the same testing (conceptual scoring) before this innovation had been published Also Baby FACES asked parents and staff to report on both English and Spanish vocabulary as well as many details of the language environment in the home It is unusual in a survey of this nature to employ such methods Nonetheless the state of research methodology for young DLLs is inadequate in many areas including but not limited to developmental assessments (National Research Council 2008iii)
First the research field lacks consensus or clear standards for determining if a child is a dual language learner Recent reviews of the published research literature on young DLLs have found substantial inconsistency in how DLL status is determined (CECER-DLL 2011aiv) The literature presents a range of operational definitions and within individual studies the methods for classifying children are often unclear or unspecified Parent or teacher reported language proficiency is most common Direct assessment or screening for language dominance is least common When DLL determination is more than a dichotomous variable there is lack of consensus about how to analyze data to examine differences by language exposure meaningfully or comprehensibly Discussions with state-level administrators of Child Care Development Block Grants and early childhood systems suggest that administrative data across early childhood systems also vary in how DLL status is determined (CECER-DLL 2011b v)
Second the research field lacks consensus regarding reliable developmental assessment instruments for young children who are dual language learners as well as the appropriate methods for assessing development over time as their language skills in one or both languages
Report to Congress on DLLs in Head Start Page | 32
change Most currently available measures of the developmental progress of young DLLs are problematic and cannot yet provide information regarding comprehensive developmental status or the effectiveness of interventions in early childhood for young DLLs (ACF 2008a ACF 2008b Espinosa amp Lopez 2007vi) Challenges in the availability of valid assessments for DLLs and standards for implementation or accommodations are not limited to early childhood as recent reports have documented the inadequacy of academic assessments for students in grades K-12 with limited English proficiency (GAO-06-815 2006 Rabinowitz amp Sato 2005 Sato et al 2007vii) However the lack of valid instruments to assess the breadth of developmental domains in the preschool years is especially pronounced The measures that are available are primarily for DLL children whose LOTE is Spanish offering virtually nothing for children with other languages spoken at home (ACF 2008c Espinosa amp Lopez 2007viii) Again this same limitation exists for children in the preschool years and in grades K-12 Furthermore many of the most widely used measures with documented evidence of validity for use with young DLLs who speak Spanish have been validated with samples of Spanish-speaking monolinguals or with homogeneous samples that do not reflect the diversity of cultures and dialects present in the Spanish-speaking population in this US Finally it is unclear what the best approaches are for assessing comprehensive development as childrens proficiency in one or more languages and perhaps their dominant language changes What approaches would yield the most comparable data across groups of children with different language experiences For example once children pass an English language screener do they understand enough English for instruments delivered in English to adequately and reliably assess their knowledge and skills in other developmental domains For how long should dual language learners be assessed in multiple languages in order to observe a complete picture of their abilities The limitations in existing research methods that are described above are more pronounced for infants and toddlers from homes where a LOTE is spoken (Fernald 2006ix)
Many advances and promising methodological approaches and solutions are being developed or utilized in smaller scale studies for research with young children who are dual language learners (for a review see Barrueco Loacutepez Ong amp Lozano 2012 as example see Bedore Pentildea Garcia amp Cortez 2005x) For example elaborate language screeners that rely on multiple reporters or detailed accounts of language exposure in the focal childs life are being used currently in some ACF-funded research projects that have been developed in partnership with local Head Start centers (ACF 2011 Lopez Arango amp Feron 2012 Melzi McWayne amp Schick 2012 xi) However these are not yet validated for a variety of Spanish-speaking populations and are difficult to apply in large-scale studies with samples that are more diverse and with interview protocols that are more extensive In addition the comprehensive nature of national studies such as FACES and Baby FACES limits the ability to utilize and implement some of the most advanced methods for assessing child development that are currently employed in more focused studies such as investigations centered on language development However conceptual scoring an analytic approach that accounts for unique and overlapping responses produced by multilingual children in each of their languages is being implemented in the most recent waves of Baby FACES (ACF 2009xii)
Currently ACF has several efforts underway to address to address the limitations and gaps in data about young dual language learners including activities to advance the capacity of the
Report to Congress on DLLs in Head Start Page | 33
research field overall to answer questions concerning DLLs These efforts are described in the final chapter of this report
F ANALYSES
To answer the research questions we compiled data from the multiple sources described above the 2007-2008 Program Information Report (PIR) the Baby FACES 2009 Cohort and the FACES 2006 Cohort Even together the data sources do not provide a complete picture of DLLs and their families served by Head Start and Early Head Start Nevertheless taken together these data sources offer important insights into the characteristics of DLLs in Head Start and Early Head Start that will be useful to policy makers and program leaders
In the current report the operational definition of children who are dual language learners has been selected to be inclusive of children across various levels of exposure to languages other than English whenever the data permit Depending on the data source more or less distinction regarding the level of exposure to English or a LOTE is possible in analyses For example PIR data report on the languages spoken by families but there is no standard definition or questions used by programs to guide which families are counted or how languages are identified As explained above for ease of reading most findings reported in the text will highlight children for whom a LOTE is the primary language spoken at home unless differences were identified between the groups of DLL children in analyses that could examine different groupings In general no significant differences were found across LOTE groups (ie children for whom LOTE is primary language spoken versus children from homes in which LOTE is spoken)
Descriptive analyses using each data source were conducted The analyses used analytic weights provided with the survey datasets to take into account the sampling design and data collection non-response All estimates pertaining to Head Start children obtained using FACES 2006 data are weighted to represent the population of children entering Head Start for the first time in Fall 2006 or those entering for the first time in 2006 who are still enrolled after one or two years as indicated when specific findings are presented Estimates using Baby FACES data are weighted to represent the population of 1-year-old children enrolled in Early Head Start in Spring 2009 PIR data include information on the universe of Head Start Early Head Start and Migrant and Seasonal Head Start (MSHS) programs so no analytic weights are needed
The FACES and Baby FACES data do not include children and families in MSHS programs in American IndianAlaska Native (AIAN) programs or who are native residents of a US territory Because MSHS programs serve mostly DLLs and their families information about MSHS programs is obtained from the PIR data and reported when it is available Data for MSHS programs pertain to all children and families enrolled in these programs however nearly 90 percent of these children are DLLs (see the next chapter)
AIAN programs serve mostly children from homes in which only English is spoken so we do not include these programs in most analyses Although many AIAN programs have language preservation and revitalization efforts the majority of children enrolled come from homes where English is the only language spoken at home Only 7 percent of children enrolled
Report to Congress on DLLs in Head Start Page | 34
in AIAN programs are reported to come from families that speak a LOTE and 13 percent of AIAN programs report serving families who speak a native language
In the case of children who reside in US territories such as Puerto Rico we considered including information obtained from the PIR when available but concluded that being from a home in which English is not the primary language spoken has a very different meaning when the prevailing language spoken in society is not English Therefore we do not include these children in analyses using PIR data
As discussed above the findings reported in the text focus on children for whom a language other than English is the primary language spoken to them at home (DLLs) unless noted otherwise
G ORGANIZATION OF THE REPORT
The following chapters address each research question in turn Each chapter begins with a brief summary of the data and methodology used to address the research question with a focus on the specific measures and methods used to address that question Then the chapter presents a summary of the key findings pertaining to DLLs followed by a discussion of the key differences between DLLs and children from homes where only English is spoken Each chapter ends with a brief conclusion Tables presenting the detailed findings underlying the summary in each chapter are contained in Appendices to the report The final chapter discusses crossshycutting themes
Report to Congress on DLLs in Head Start Page | 35
CHAPTER II CHARACTERISTICS OF DLLS
In this chapter we address the first research question posed in the Head Start Act
What are the characteristics of children who are dual language learners (DLLs) and their families receiving Head StartEarly Head Start services
In the next section we summarize the data sources and analytic methods used to address this question The following section examines the characteristics of DLLs and their families These findings are put into context in the final section which highlights differences between DLLs and children from monolingual English homes
A METHODOLOGY
To answer this research question we compiled data from multiple sources These include the 2007-2008 Program Information Report (PIR) the 2009 Baby FACES Parent Interview and the 2006 FACES Parent Interview and the Teacher Child Report
Descriptive analyses of each data source were conducted The analyses used analytic weights provided with the survey datasets to take into account the sampling design and data collection non-response All estimates pertaining to Head Start children obtained using FACES 2006 data are weighted to represent the population of children entering Head Start for the first time in Fall 2006 or those entering for the first time in 2006 who are still enrolled after one year if they entered at age four or two years if they entered at age three Estimates using Baby FACES data are weighted to represent the population of 1-year-old children enrolled in Early Head Start in Spring 2009 PIR data include information on the universe of Head Start Early Head Start and Migrant and Seasonal Head Start (MSHS) programs so no analytic weights are needed
The FACES and Baby FACES data do not include children and families in MSHS programs or children and families in American IndianAlaska Native (AIAN) programs Because MSHS programs serve mostly DLLs and their families information about MSHS programs is obtained from the PIR data and reported when it is available
As discussed in Chapter I the findings reported focus on children for whom a language other than English is the primary language spoken to them at home (DLLs) unless noted otherwise Data for MSHS programs pertain to all children and families enrolled in these programs
B CHARACTERISTICS OF DLLS AND THEIR FAMILIES
Slightly more than one-fourth of children enrolled in Head Start and Early Head Start come from homes in which a language other than English is the primary language spoken According to the 2007-2008 PIR 29 percent of children enrolled in Head Start and 26 percent of children enrolled in Early Head Start are DLLs (Table II1) Most children enrolled in MSHS programs are DLLs (89 percent) while only 7 percent of children enrolled in AIAN programs are DLLs (Table II1)
Report to Congress on DLLs in Head Start Page | 36
DLLs are most heavily concentrated in the West and South regions of the US but there are DLLs in all regions and US territories According to 2007-2008 PIR data 37 percent of DLLs in Head Start Early Head Start MSHS and AIAN programs are located in the West and 23 percent attend programs in the South The remaining DLLs are almost evenly distributed across programs in the Northeast (15 percent) Midwest (13 percent) and US Territories (13 percent) (Table II2)
The geographic distributions of Head Start and Early Head Start programs are similar In both programs the highest proportion of programs is located in the West (35 percent and 41 percent respectively) Approximately one-fifth of programs are located in the South (21 percent and 19 percent respectively) DLLs in Early Head Start are less likely than those in Head Start to be in programs located in US Territories (9 percent compared with 15 percent) Similar proportions of children enrolled in Head Start and Early Head Start are in programs located in the Northeast (16 percent and 17 percent respectively) and Midwest (13 percent and 14 percent respectively) (Table II2)
MSHS programs are concentrated in the South (42 percent) and West (45 percent) with far fewer in the Midwest (9 percent) and Northeast (4 percent) (Table II2)
For most DLLs in Head Start and Early Head Start Spanish is the primary language spoken at home The data consistently show that more than four-fifths of DLLs enrolled in Head Start and Early Head Start are from Spanish-speaking homes According to the 2007-2008 PIR 84 percent of DLLs are from Spanish-speaking homes 6 percent are from homes where an Asian language is spoken and the remaining DLLs come from homes where other languages are spoken including EuropeanSlavic languages African languages Pacific Island languages and Native North AmericanAlaska Native languages (Table II3)
FACES data also show that among DLLs entering Head Start in Fall 2006 84 percent were from homes where Spanish was spoken 5 percent were from homes where an Asian language was spoken and 3 percent were from homes where an African language was spoken (Table II4) Baby FACES data show that among the 1-year-old Early Head Start enrollees in Spring 2009 who were DLLs 91 percent were from Spanish-speaking homes (Table II5)
Although 91 percent of mothers of DLLs in Baby FACES reported speaking to their child in Spanish (the remaining 9 percent reflecting all other LOTEs) 49 percent of mothers of DLLs also reported speaking to their child in English (Table II5) The data show a similar pattern among birth fathers and grandparents although these family members were less likely to also speak to the child in English (Table II6) Mothers reported that siblings were more likely to speak to their child in English (78 percent) than to speak a LOTE
Among the children enrolled in MSHS programs approximately 9 out of 10 speak a language other than English at home Spanish-speaking families are the most common non-English speaking group in MSHS programs (85 percent) (Table II7) Only approximately 4 percent of MSHS families primarily speak one of the Native Central American South American Mexican or Caribbean languages Less than 1 percent primarily speaks an Asian Pacific Island Native North AmericanAlaska Native or other language at home No families served by these programs speak African languages or EuropeanSlavic languages (Table II7)
Report to Congress on DLLs in Head Start Page | 37
Few children enrolled in tribal programs speak a language other than English at home The most common non-English language spoken at home by children in tribal programs is a native language (Native North AmericanAlaska Native language) spoken by 5 percent of all children in AIAN programs (Table II7) Less than 2 percent of children in tribal programs speak Spanish and less than 1 percent speaks other languages
Report to Congress on DLLs in Head Start Page | 38
Report to Congress on DLLs in Head Start Page | 39
Most DLLs in Head Start and Early Head Start were born in the United States The majority of their parents were born outside of the US According to FACES data 92 percent of DLLs entering Head Start in Fall 2006 were born in the US but most of their parents (86 percent of mothers and 90 percent of fathers) were born outside the US Among DLLs entering Head Start 82 percent had two parents born outside the US (Table II8) Similarly Baby FACES data show that two-thirds of 1-year-old children in Early Head Start in Spring 2009 had foreign-born mothers and three-fourths had foreign-born fathers (Table II9) Both parents in 64 percent of the families were foreign-born
The majority of foreign-born parents of DLLs in Head Start and Early Head Start came from Mexico Among DLLs who entered Head Start in Fall 2006 and had foreign-born parents two-thirds had parents who came from Mexico Approximately 10 percent had parents who came from Central American countries 7 percent had parents who came from South American countries 6 percent had parents who came from Asian countries and 5 percent had parents who came from African countries (Table II8) Baby FACES data show that among 1-year-old DLLs in Early Head Start in 2009 more than three-quarters with foreign-born parents had parents who came from Mexico 10 percent had parents who came from Central American countries and 5 percent had parents who came from African countries (Table II9)
The majority of parents of DLLs in Head Start and Early Head Start have been in the US for 6 years or more FACES data show that approximately three-quarters of foreign-born mothers and fathers of DLLs had been in US for 6 years or more (Table II8) According to Baby FACES data more than two-thirds of foreign-born mothers and three-quarters of foreign-born fathers of DLLs had been in the US for 6 years or more (Table II9)
Report to Congress on DLLs in Head Start Page | 40
Among parents of DLLs in Head Start and Early Head Start whose first language is not English more than half report that they donrsquot understand English well or donrsquot understand it at all According to FACES data 48 percent of parents of DLLs who entered Head Start in Fall 2006 did not understand English well and an additional 15 percent did not understand it at all (Table II10) Baby FACES data show that 47 percent of parents of DLLs did not understand English well and an additional 10 percent did not understand English at all (Table II11)
Most parents of DLLs in Head Start and Early Head Start report that they are literate in their native language but approximately two-thirds have difficulty reading English Nearly all parents of DLLs entering Head Start in 2006 were literate in their first language but the parents of 63 percent of these children reported reading English not at all or not well Thirty-eight percent reported understanding English well or very well while 35 percent reported reading English well or very well (Table II10) Similarly the parents of about two-thirds of 1-year-old DLLs in Early Head Start reported reading very well (60 percent) or well (34 percent) in their first language while 60 percent reported difficulty with reading English Approximately 18 percent reported reading English very well and an additional 22 percent read English well (Table II11)
The majority of DLLs in Head Start and Early Head Start live with both their mother and their father According to FACES data 72 percent of DLLs who entered Head Start in Fall 2006 lived with both their mother and their father (biological or adoptive) (Table II12) Baby FACES data show that 71 percent of 1-year-old DLLs in Early Head Start in Spring 2009 lived with both their mother and their father (biological or adoptive) (Table II13) The 2007-2008 PIR data indicate that 75 percent of children enrolled in MSHS programs most of whom are DLLs lived in two-parent families (Table II13a)
Among DLLs in Head Start who live with two parents their parents are more likely to be married (49 percent) than unmarried (23 percent) (Table II12) According to Baby FACES data 37 percent of 1-year-old DLLs were living with two parents who were married (Table II13)
On average DLLs in Head Start and Early Head Start live in households of 5 people DLLs who entered Head Start in Fall 2006 lived with an average of 24 adults and 27 children About 13 percent of DLLs who entered Head Start in 2006 lived in intergenerational households (Table II14)7 One-year-old DLLs in Early Head Start in Spring 2009 lived with an average of 21 adults and 29 children About 13 percent lived in an intergenerational household (Table II15)
Only a small proportion of DLLs in Head Start and Early Head Start were born to a teenage mother Among those DLLs entering Head Start in 2006 9 percent were born to a teenage mother On average DLLs were born to mothers who were 267 years old (Table II16) Of the 1-year-old DLLs in Early Head Start in Spring 2009 16 percent were born to teenage mothers Like mothers of DLLs entering Head Start the mothers of 1-year-old DLLs in Early Head Start in Spring 2009 were 262 years old on average when their child was born (Table II17)
7 Intergenerational households are defined as those in which the child lives with at least one biological or adoptive
parent and at least one grand- or great-grandparent
Report to Congress on DLLs in Head Start Page | 41
The majority of DLLs in Head Start and Early Head Start are living with parents who have not earned a high school diploma or GED Less than one-third of DLLs live with a parent who has education beyond high school FACES data show that 60 percent of mothers and 66 percent of fathers with whom DLLs were living had not earned a high school diploma or GED Approximately half of DLLs who entered Head Start in 2006 were living with at least one parent who had earned a high school diploma or GED 22 percent of DLLs were living with at least one parent with education beyond high school (Table II18)
Baby FACES data reveal that 54 percent of mothers and 59 percent of fathers with whom 1-year-old Early Head Start DLLs were living had not earned a high school diploma or GED Approximately 62 percent of 1-year-old Early Head Start DLLs in 2009 were living with at least one parent who had earned a high school diploma or GED 29 percent were living with at least one parent with education beyond high school (Table II19)
The 2007-2008 PIR data show that 76 percent of children enrolled in MSHS programs most of whom are DLLs were living with parents who had not completed a high school diploma or GED (Table II13a)
Most DLLs come from working families Among DLLs entering Head Start in Fall 2006 85 percent lived with at least one parent who was employed and 70 percent lived with at least one parent who was employed full-time (Table II20) Among parents of 1-year-old DLLs in Early Head Start in Spring 2009 80 percent lived with at least one employed parent and 64 percent lived with at least one parent who was employed full-time (Table II21) In MSHS programs according to the 2007-2008 PIR in 90 percent of two-parent families and 76 percent of single parent families at least one parent is employed (Table II13a)
Fathers of DLLs are more likely to be employed than mothers According to FACES 67 percent of DLLs entering Head Start in Fall 2006 lived with an employed father and 39 percent lived with an employed mother (Table II20) In Spring 2009 54 percent of 1-year-old DLLs in Early Head Start lived with an employed father and 31 percent lived with an employed mother (Table II21)
Small percentages of DLLs live with a parent who is unemployed and looking for work Among DLLs entering Head Start in 2006 8 percent lived with a mother who was unemployed and looking for work and 3 percent lived with a father who was unemployed and looking for work (Table II20) Among 1-year-old DLLs in Early Head Start in Spring 2009 20 percent had a mother who was unemployed and looking for work and 8 percent had a father who was unemployed and looking for work (Table II21)
Most DLLs in Head Start and Early Head Start are living in poverty FACES data show that 64 percent of DLLs who entered Head Start in Fall 2006 lived in a household with income at or below the poverty threshold 81 percent lived in a household with income at or below 130 percent of the poverty threshold (Table II22)8 Among 1-year-old DLLs in Early Head Start in
8 The federal poverty threshold for a family of four was $20000 in 2006 Head Start qualifying criteria are based
on family income not household income and there are other circumstances not dependent on family income that may qualify a child or family for the program regardless of income Other qualifying criteria include children in
Report to Congress on DLLs in Head Start Page | 42
Spring 2009 76 percent lived in a household with income at or below the poverty threshold 90 percent lived in a household with income at or below 130 percent of the poverty threshold (Table II23)
Most parents of DLLs in Head Start and Early Head Start are not receiving welfare cash assistance but many are receiving food stamps and most participate in WIC Among DLLs who entered Head Start in Fall 2006 15 percent lived in households that received federal cash assistance 31 percent lived in households that received food stamps and 74 percent participated in WIC (Table II24) Baby FACES data show that 30 percent of 1-year-old DLLs in Early Head Start lived in households that received federal cash assistance while 52 percent lived in households that received food stamps and 92 percent participated in WIC (Table II25) Only 3 percent of families in MSHS programs were receiving federal cash assistance in 2007-08 but 57 percent were receiving WIC benefits (PIR 2007-2008)
Financial struggles are common in families of DLLs in Early Head Start According to Baby FACES data 48 percent of parents of 1-year-old DLLs in Spring 2009 reported having at least one out of five financial security difficulties they were asked about9 Nearly one-third could not pay the full amount of their rent or mortgage and 31 percent could not pay the full amount of their utility bills Nearly one-quarter reported that their telephone service had been disconnected because payments were not made (Table II26)
These financial struggles were reflected in food security issues reported by the families of DLLs in Early Head Start Half of the parents of DLLs reported having at least one out of five food security difficulties they were asked about10 Approximately 48 percent were worried that food would run out and 42 percent reported that they relied on only a few kinds of low-cost food to feed their children In addition 30 percent reported that they could not feed their children a balanced meal for financial reasons (Table II27)
Relatively few DLLs in Head Start have had a disability identified by a professional Teachers reported that approximately 8 percent of DLLs who entered Head Start in Fall 2006 had a developmental problem delay or special need indicated by a professional Teachers reported that of those DLLs with a disability 76 percent had a speech or language impairment 21 percent had a cognitive impairment and 13 percent had a sensory impairment (Table II28) According to the 2007-2008 PIR 41 percent of children enrolled in MSHS programs had a disability
foster care and children with special needs Individual grantees may also propose qualifying criteria to target special populations within the communities they serve (eg families in transitional housing) 9
The financial difficulties asked about included the following experiences (1) could not pay the full amount of gas oil or electricity bills (2) could not pay the full amount of rent or mortgage (3) had service disconnected by the telephone company because payments were not made (4) had services turned off by the gas or electric company or oil company would not deliver oil (5) was evicted from home or apartment 10
The food security difficulties asked about included the following experiences (1) worried food may run out (2) food didnt last and didnt have money to get more- (3) relied on only a few kinds of low-cost food to feed children because of financial reasons- (4) couldnt afford to eat balanced meals- (5) couldnt feed children a balanced meal for financial reasons
Report to Congress on DLLs in Head Start Page | 43
Nearly all DLLs in Head Start and Early Head Start receive regular medical and dental checkups appropriate for their age According to FACES data 99 percent of DLLs who entered Head Start in 2006 had received a regular medical checkup in the past year and 92 percent had received a regular dental checkup in the past year (Table II29) Among 1-year-old DLLs in Early Head Start in Spring 2009 all were reported to have received a regular medical checkup in the past year and 28 percent had ever visited the dentist (Table II30) Given the program requirements pertaining to medical and dental screenings within 45 days of enrollment and the timing of data collections it is likely that many of these children received services provided by or secured with assistance from the Head Start and Early Head Start programs
Nearly all DLLs in Head Start and Early Head Start have some health insurance coverage Among DLLs entering Head Start in 2006 91 percent were covered by health insurance Approximately 57 percent had private health insurance coverage 66 percent had Medicaid coverage and 6 percent were enrolled in the State hildrens Health Insurance Program (SHIP) (Table II29) Among 1-year-old DLLs in Early Head Start 95 percent were covered by health insurance Nearly one-fourth (24 percent) were covered by private insurance 77 percent had Medicaid coverage and 19 percent were enrolled in SCHIP (Table II30) According to the 2007shy2008 PIR 97 percent of children in MSHS programs were covered by health insurance by the end of the enrollment year Most were covered by Medicaid (72 percent) SCHIP (3 percent) or both (5 percent)
Many DLLs in Head Start and Early Head Start receive child care in other settings most often in home-based care by relatives Among DLLs entering Head Start in 2006 26 percent were in some child care arrangement outside of Head Start 60 percent of these children were cared for by relatives and 23 percent were cared for by nonrelative family child care providers (Table II31) According to Baby FACES data 58 percent of 1-year-old DLLs in Early Head Start in Spring 2009 were in some kind of child care arrangement outside of Early Head Start Three-fourths of these children were cared for by relatives and 13 percent were cared for by nonrelative family child care providers (Table II32)
Some parents of DLLs report symptoms of depression The primary caregivers of DLLs in Head Start reported an average of 35 symptoms of depression (out of 12 they were asked about) and 12 percent reported symptoms indicating they may have had moderate to severe depression (Table II33)11 In Early Head Start primary caregivers of DLLs reported an average of 4 symptoms of depression and 13 percent of DLLs had primary caregivers who reported symptoms indicating that they were moderately or severely depressed (Table II34)
The parenting beliefs reported by primary caregivers of DLLs in Early Head Start reveal a mix of traditional and progressive beliefs They report relatively high levels of both traditional authoritarian parental beliefs (mean of 20 out of 25 possible points) and progressive
11 Both Baby FACES and FACES used the Center for Epidemiologic Studies Depression Scale (CES-D) short form to
measure depressive symptoms (Ross Mirowsky and Humber 1983) The short form consists of 12 items asking parents to rate on a 4-point scale how often in the past week they experienced the symptom Parent responses are summed to create a total score that can range from 0 to 36 Scores of 5 to 9 indicate mild depressive symptoms scores of 10 to 14 indicate moderate depressive symptoms and scores of 15 or higher indicate severe depressive symptoms
Report to Congress on DLLs in Head Start Page | 44
democratic beliefs (mean of 19 out of 25 points) (Table II35)12 Of the 1-year-old Early Head Start DLLs 6 percent have parents who reported spanking their child in the previous week (Table II35)
C DIFFERENCES BETWEEN DLLS AND CHILDREN FROM MONOLINGUAL ENGLISH HOMES
DLLs in Head Start and Early Head Start differ from children from monolingual English homes beyond the differences in language raceethnicity and immigrant background that define them These differences likely reflect both the very different paths that may have brought them to Head Start and Early Head Start and the challenges that lack of proficiency in English presents for families of DLLs
DLLs are more likely than children from monolingual English homes to live in larger households with two parents
DLLs entering Head Start in Fall 2006 were much more likely than children from monolingual English homes to live with two parents (72 percent vs 33 percent) and to live with two parents who are married (49 percent vs 23 percent) (Table II12) In Early Head Start 1-year-old DLLs in Spring 2009 were more likely than their counterparts from monolingual English homes to live with two parents (71 percent vs 38 percent) and to live with two parents who are married (37 percent vs 23 percent) (Table II13)
DLLs who entered Head Start in Fall 2006 lived in larger households than children from monolingual English homes (an average of 5 vs 4 persons and more than twice as likely to live in household with 3 or more adults) (Table II14) Similarly 1-year-old DLLs in Early Head Start in Spring 2009 lived in larger households than 1-year-olds from monolingual English homes (an average of 5 vs 4 persons) (Table II15)
DLLs who entered Head Start in Fall 2006 were less likely than children from monolingual English homes to have been born to a teenage mother (9 percent vs 19 percent) (Table II16) Similarly in Early Head Start in Spring 2009 16 percent of 1-yearshyold DLLs vs 25 percent of 1-year-old children from monolingual English homes were born to a teenage mother (Table II17)
DLLsrsquo parents have lower educational attainment and even though DLLs are more likely than children from monolingual English homes to live with a parent who is employed their householdrsquos income is more likely to fall at or below the poverty threshold
12 Baby FACES uses items from the Parental Modernity Scale (Schaefer and Edgerton 1985) to measure parents
attitudes toward children and child-rearing practices (traditional authoritarian parental beliefs and progressive democratic beliefs) Parents responded to items on a 5-point scale ranging from strongly disagree to strongly agree Baby FACES includes 10 of the 30 items in the original scale that yield two subscales (1) Traditional Beliefs and (2) Progressive Beliefs Raw scores range from 5 to 25 for each scale with higher scores indicating more traditional beliefs and more progressive beliefs respectively Traditional authoritarian beliefs are associated with negative outcomes in children whereas progressive democratic beliefs are associated with favorable child outcomes
Report to Congress on DLLs in Head Start Page | 45
DLLs who entered Head Start in Fall 2006 were much less likely than their peers from monolingual English homes to have parents with a high school diploma or GED (47 percent vs 75 percent) (Table II18) In Early Head Start in Spring 2009 62 percent of 1shyyear-old DLLs vs 82 percent of 1-year-old children from monolingual English homes had a parent with a high school diploma or GED (Table II19)
DLLs who entered Head Start in Fall 2006 were more likely than children from monolingual English homes to live with a parent who was working (84 percent vs 71 percent) and less likely to live with a parent who was unemployed and looking for work (5 percent vs 15 percent) (Table II20) In Early Head Start in Spring 2009 10 percent of 1-year-old DLLs vs 16 percent of 1-year-olds from monolingual English homes lived with a parent who was unemployed and looking for work (Table II21)
DLLs who entered Head Start in Fall 2006 were more likely than enrollees from monolingual English homes to live in a household with income at or below the poverty threshold (64 percent vs 55 percent (Table II22) Among 1-year-olds in Early Head Start in Spring 2009 76 percent of DLLs vs 65 percent of children from monolingual English homes lived in a household with income at or below the poverty threshold (Table II23)
Report to Congress on DLLs in Head Start Page | 46
DLLsrsquo parents especially in Head Start are less likely to be receiving public assistance but they are more likely to participate in the WIC program
DLLs who entered Head Start in Fall 2006 were less likely than enrollees from monolingual English homes to be receiving welfare cash assistance (15 percent vs 26 percent) food stamps (31 percent vs 63 percent) and Supplemental Security Income (SSI) (5 percent vs 18 percent) but more likely to be participating in WIC (74 percent vs 53 percent) (Table II24) In Early Head Start in Spring 2009 DLLs were less likely than children from monolingual English homes to be receiving food stamps (52 percent vs 66 percent) and SSI (6 percent vs 14 percent) but more likely to be participating in WIC (92 percent vs 85 percent) (Table II25)
In Early Head Start in Spring 2009 1-year-old DLLs were more likely than 1-year-olds from monolingual English homes to have parents who reported more than one food security difficulty (51 percent vs 26 percent) and reported difficulty affording balanced meals (39 percent vs 19 percent) (Table II27)
DLLs who entered Head Start in Fall 2006 were less likely than enrollees from monolingual English homes to have Medicaid coverage (66 percent vs 75 percent) (Table II29)
Report to Congress on DLLs in Head Start Page | 47
A few other differences also are apparent in the data
According to teacher reports DLLs who entered Head Start in Fall 2006 were less likely than children from monolingual English homes to have been identified by a professional as having a disability (8 percent vs 14 percent)
Report to Congress on DLLs in Head Start Page | 48
DLLs who entered Head Start in Fall 2006 were more likely than children from monolingual English homes to be in a child care arrangement outside Head Start (26 percent vs 12 percent) (Table II31) but in Early Head Start in Spring 2009 1-year-old DLLs were less likely than 1-year-olds from monolingual English homes to be in a child care arrangement outside Early Head Start (58 percent vs 72 percent) (Table II32)
DLLs who entered Head Start in Fall 2006 were less likely than children from monolingual English homes to have parents who reported symptoms that indicated they may have been moderately to severely depressed (12 percent vs 21 percent) (Table II33) In Early Head Start in Spring 2009 1-year-old DLLs were less likely than 1-yearshyolds from monolingual English homes to have parents who reported symptoms that indicated they may have been moderately to severely depressed (13 percent vs 18 percent)
One-year-old DLLs in Early Head Start in Spring 2009 were less likely than 1-year-olds from monolingual English homes to have parents who reported that they spanked their child in the past week (6 percent vs 15 percent) (Table II35)
These differences between the families of DLLs and children from monolingual English homes suggest that they may have different strengths and needs beyond just the language differences that define DLLs Both language differences and the other differences in social and economic characteristics are important to consider when individualizing services for DLLs and their families
Report to Congress on DLLs in Head Start Page | 49
CHAPTER III HEAD START AND EARLY HEAD START SERVICES PROVIDED TO DLLS
In this chapter we address the second research question
What is the nature of the Head StartEarly Head Start services provided to children who are DLLs and their families
In the next section we summarize the data sources and analytic methods used to address this question The following section describes the services provided to DLLs and their families These findings are put into context through comparisons with services provided to children from monolingual English homes in the final section
A METHODOLOGY
The 2006 FACES surveys of Head Start teachers and parents and the 2009 Baby FACES surveys of Early Head Start program directors teachers home visitors and parents provide data on the nature of the programs and services received by families and children enrolled in Head Start and Early Head Start In addition FACES classroom observations in Spring 2007 yield information about various dimensions of quality in Head Start classrooms Observations of home visits collected within Baby FACES also provide information regarding the quality of home visits in Early Head Start Taken together these data sources offer important insights into the nature of services offered and received by DLLs in Head Start and Early Head Start
An important aspect of the child development services provided to DLLs in Early Head Start and Head Start is their quality Both the Baby FACES study and the FACES study devoted considerable resources to observing and measuring key dimensions of the quality of key child development services including
Classroom structure Observations of the group size and child-adult ratio in childrens classrooms were recorded in both the FACES and Baby FACES studies
Quality of the classroom environment As part of the FACES observers used the Early Childhood Environment Rating Scale-Revised (ECERS-R Harms Clifford amp Cryer 2005xiii) to assess quality based on structural features and interactions in the classroom As part of Baby FACES observers used the corresponding tool for classrooms with infants and toddlers the Infant-Toddler Environment Rating Scale (ITERS Harms Cryer and Clifford 2002xiv) The ECERS-R and ITERS rate quality in key domains and overall on a scale of 1 to 7 (1=inadequate 3=minimal 5=good and 7=excellent)
Quality of caregiver-child interactions in the classroom The FACES observers also used the Arnett Caregiver Interaction Scale (Arnett 1989xv) to assess interactions between the lead teacher and the children With this scale the observers rated on a four-point scale (0 = not at all 1 = somewhat 2 = quite a bit 3 = very much) the extent to which each of 30 statements in the scale was characteristic of the lead teacher Higher scores
Report to Congress on DLLs in Head Start Page | 50
indicate a more sensitive responsive teacher who encourages childrens independent and self-help skills and avoids punishment and detachment
Quality of instructional practices in the classroom The FACES observers also used the Instructional Support portion of the Classroom Assessment Scoring System (CLASS) to measure the quality of instructional practices in the classroom including language modeling and encouragement to children to practice expressing themselves verbally quality of feedback on childrens ideas and understanding that helps them take their learning to a higher level and concept development which goes beyond presenting information about a topic to encouraging children to engage in higher-order thinking analyses and reasoning and to apply what is learned in the classroom to their daily lives (Pianta et al 2008xvi) CLASS scores range from 1 to 7 with scores of 1 and 2 indicating low quality scores of 3 to 5 indicating mid-level quality and scores of 6 and 7 indicating high quality
Quality of home visits The Baby FACES study included observations of home visits in which observers used the Home Visit Rating Scales-Adapted (HOVRS-A Roggman et al 2010xvii) to rate the quality of the home visit The HOVRS-A yields a rating of overall quality and ratings of visitor strategies responsiveness to the family relationship with the family facilitation of parent-child interaction and nonintrusiveness Ratings range from 1 to 5 with three anchor points at 1 (inadequate) 3 (adequate) and 5 (good)
Descriptive analyses of each data source were conducted The analyses used analytic weights provided with the survey datasets to take into account the sampling design and data collection nonresponse All estimates pertaining to Head Start children and families obtained using FACES 2006 data are weighted to represent the population of children entering Head Start for the first time in Fall 2006 ormdashfor data from the spring before kindergartenmdashthose entering for the first time in 2006 who are still enrolled after one or two years Estimates using Baby FACES data are weighted to represent the population of 1-year-old children enrolled in Early Head Start in Spring 2009
While the available data concerning the quality of interactions and practices in Head Start and Early Head Start settings is informative it does not identify the languages spoken the amount or the quality of language in these interactions More broadly the existing data for Head Start does not identify program- or classroom-level approaches to language support and instruction for dual language learners These limitations reflect gaps in the research field in the areas of quality assessment and effective practices for young dual language learners (Castro Paez amp Espinosa 2011)
All of the analyses focus on children for whom a language other than English is the primary language spoken to them at home (DLLs) The FACES and Baby FACES data do not include children and families in Migrant and Seasonal Head Start (MSHS) programs or children and families in American IndianAlaska Native (AIAN) programs
Report to Congress on DLLs in Head Start Page | 51
B SERVICES PROVIDED TO DLLS AND THEIR FAMILIES
Head Start and Early Head Start programs provide comprehensive services to enrolled children and families In this section we begin by describing the basic approaches programs take to providing services We then focus on the key features and quality of child development services that children who are DLLs receive in classrooms and home visits This section ends with a description of other important services that the programs offer to DLLs and their families
1 Service Approaches
The majority of DLLs in Early Head Start are in the home-based option Early Head Start programs have flexibility to provide services in the following ways (1) home-based option where child and family development services in weekly home visits (2) center-based option child development services in classrooms and family development services in less-frequent home visits (3) combined approach including both center-based care and home visits at proportions stipulated in the Head Start Program Performance Standards (4) family child care option with at least twice yearly home visits and (5) locally determined option requiring prior approval Slightly more than one-half of DLLs in Early Head Start were enrolled in home-based programs while one-third were enrolled in center-based programs 9 percent were enrolled in a combination program and 2 percent were enrolled in a family child care program (Table III1)
Center-based care for DLLs was most likely full-time in Early Head Start and part-time in Head Start Children enrolled in center-based Early Head Start programs and children enrolled in Head Start may receive full-day or part-day care Two-thirds of DLLs in Head Start were enrolled in a part-day program (according to program directors definitions) (Table III2) In contrast according to program directors three-fourths of DLLs in Early Head Start were enrolled in a full-day program (65 percent in a year-round full-day program and 14 percent in a part-year full-day program) (Table III3) In contrast according to program directors three-fourths of DLLs in center-based Early Head Start were enrolled in a program that operated full-day centers (65 percent in a program operating a year-round full-day center and 14 percent in a program operating a part-year full-day center) (Table III3) Although no data are available DLLs in programs operating only part-day centers may receive additional care in centers operating in partnership with the Early Head Start program if they need full-time care
Nearly all children enrolled in MSHS programs in 2007-2008 were in full-day center-based programs Most of the remaining children were in family child care programs (Table III4)
Report to Congress on DLLs in Head Start Page | 52
2 Classroom Features and Quality
The Baby FACES data show that on average the group size and child-staff ratio in the average Early Head Start classroom of 1-year-old DLLs in Spring 2009 met standards but the quality of the average classroom was rated in the minimal to good range
The FACES data paint a similar picture of quality in the Head Start classrooms of DLLs On average the classrooms of DLLs who entered Head Start in Fall 2006 and were still enrolled in Spring 2007 met standards for group size and child-adult ratio and in their interactions with children the lead teachers demonstrated sensitivity responsiveness and encouragement The average classroom environment however was rated in the minimal to good range and the teachers instructional support was rated low The remainder of this section details these findings
Average child-adult ratios and group sizes in Early Head Start and Head Start are well below recommended levels On average the classrooms of 1-year-old DLLs in Early Head Start classrooms in Spring 2009 included 57 children and 25 adults for a child-adult ratio of 23 to 1 (Table III5 ratio reflects the number of children and adult caregivers in the classroom including staff and volunteers) The average group size and child-adult ratio are well within the maximum group size and ratio recommended by the American Academy of Pediatricians American Public Health Association and the National Resource Center for Health and Safety in Child Care and Early Education and required in the Head Start Program Performance Standards (a group size of 8 children and a child-adult ratio of 4 or fewer infants and toddlers per adult in a classroom) (American Academy of Pediatrics American Public Health Association National Resource Center for Health and Safety in Child Care and Early Education 2011 Administration for Children and Families 1996)
On average DLLs who entered Head Start in Fall 2006 were in classrooms in Spring 2007 that included 152 children and 22 adults (a ratio of 69 children per adult) (Table III6) The average group size and child-adult ratio observed in the Head Start classrooms of DLLs were within the levels recommended by the NAEYC (which recommends a maximum group size of 18 children and ratio of 8 or fewer 3-year-olds for each adult in a classroom and a maximum group size of 20 and ratio of 10 or fewer 4-year-olds per adult in a classroom) and required in the Head Start Program Performance Standards (which require a maximum of 85 or fewer 3-yearshyolds per adult and 10 or fewer 4-year-olds per adult) (NAEYC 2007 Administration for Children and Families 1996)
Global ratings indicate that on average Early Head Start and Head Start classrooms provide minimal to good quality care The average ITERS score for the classrooms of 1-yearshyold DLLs in Early Head Start classrooms in Spring 2009 was 39 in the minimal to good range Average scores on the ITERS subscales ranged from 30 (personal care subscale) to 47 (interactionsocial subscale) (Table III5)
Report to Congress on DLLs in Head Start Page | 53
According to the ECERS-R data the average quality of the Spring 2007 classrooms of DLLs who entered Head Start in Fall 2006 was between minimal and good The average ECERS-R total score was 35 (Table III6) One-fifth of DLLs were in classrooms rated on the high end of the minimal-good range (between 4 and 499) and 3 percent of DLLs were in classrooms that were rated as good (5 or above) Average scores on the ECERS-R subscales ranged from 22 (personal care subscale) to 44 (social subscale) (Table III6) The average ECERS-R total score observed in the FACES study is very similar to the average score for 4-year-old classrooms reported in a study of publicly supported prekindergarten programs in 11 states (385 Mashburn et al 2008xviii)
On average the quality of interactions between children and lead teachers in Head Start is good The Arnett Caregiver Interaction Scale scores show that the average quality of interactions between lead teachers and children in the Spring 2007 classrooms of DLLs who entered Head Start in Fall 2006 was good The average Arnett score for lead teachers in these classrooms was 678 (out of a possible 90 an average of 23 across items) suggesting high levels of teacher sensitivity responsiveness and encouragement of childrens independence and self-help skills (Table III6)
The average quality of instructional support in Head Start is low The CLASS Instructional Support ratings show that on average instructional support in the Spring 2007 classrooms of DLLs who entered Head Start in Fall 2006 was low The average CLASS Instructional Support score was 19 with average subscores ranging from 17 for concept development to 21 for language modeling (Table III6) Approximately 7 percent of DLLs were in classrooms in which the quality of instructional support was moderate (in the 3 to 5 range) The average CLASS instructional support score observed in the FACES study also is very similar to the average score for 4-year-old classrooms reported in a study of publicly supported prekindergarten programs in 11 states (208 Mashburn et al 2008)
Most DLLs in Head Start were in classrooms that provided reading and language activities as well as math activities on a daily or nearly daily basis More than half of DLLs who entered Head Start in Fall 2006 were in classrooms in which teachers reported each of 11 reading and language activities took place daily or almost daily The most widely conducted daily and near-daily reading and language activities in the classrooms of DLLs included listening to teachers read stories while seeing the print (90 percent) working on letter naming (84 percent) learning about conventions of print (75 percent) writing their own name (73 percent) and discussing new words (71 percent) The least common activities reported daily or near-daily included listening to the teacher read stories without seeing print (21 percent) learning about rhyming words and word families (54 percent) and dictating stories to an adult (56 percent) (Table III7)
All ten math activities asked about also were conducted daily or near-daily in the classrooms of the majority of DLLs entering Head Start in Fall 2006 The most widely conducted daily and near-daily activities were counting out loud (96 percent) working with geometric manipulatives (85 percent) engaging in calendar-related activities (83 percent) engaging in
Report to Congress on DLLs in Head Start Page | 54
activities that involve shapes and patterns (83 percent) and working with counting manipulatives (80 percent) The activities least likely to be reported daily or near-daily were working with rulers or other measuring instruments (52 percent) activities related to telling time (55 percent) and using creative movement or drama to understand math concepts (62 percent) (Table III8)
Almost all DLLs in Early Head Start and Head Start were exposed to adults speaking English and the majority of DLLs were exposed to adults speaking Spanish Nearly all (98 percent) of 1-year-old DLLs receiving center-based Early Head Start services in 2009 were exposed to adults speaking English in their classroom and 81 percent were exposed to adults speaking Spanish in their classroom A few (7 percent) were exposed to adults speaking another language (Table III9) Similarly in Head Start 98 percent of DLLs who entered in Fall 2006 were in classrooms in which English was used for instruction while 58 percent were in classrooms in which Spanish was used for instruction (Table III10) The data do not ind icate the extent to which children were spoken to in their home language
The majority of DLLs in Early Head Start and Head Start were in classrooms that used their home language for some instruction For 85 percent of the 1-year-old DLLs in Early Head Start centers their home language was used in the classroom (Table III9) Nearly two-thirds (60 percent) of DLLs entering Head Start in 2006 were in classrooms in which their home language was used at least some of the time for instruction (Table III10) According to parents 85 percent of DLLs in Head Start were in a program in which staff members speaking their childs home language were available in the program (Table III11)
In Early Head Start classrooms of 1-year-old DLLs the majority of DLLs were most often read to in English but 8 percent were most often read to in Spanish (Table III9)
Among classroom staff in Early Head Start classrooms lead teachers were most likely to speak to DLLs in a language other than English (69 percent) followed by assistant teachers (47 percent) classroom aides (30 percent) and volunteers (19 percent) (Table III9) 13
In MSHS programs most of which are center-based 2007-2008 PIR data indicate that 71 percent of non-supervisory staff members including teachers assistant teachers and family child care providers were proficient in a language other than English
3 Characteristics and Quality of Home Visits in Early Head Start
Early Head Start home visits with 1-year-old DLLs in Spring 2009 typically lasted more than an hour (82 minutes on average) and involved an average of one adult the 1-year-old and often a sibling Nearly three-quarters of home visits with DLLs were conducted in Spanish (Table III13)
13 In Early Head Start classrooms classroom staff members have differentiated responsibilities that are recognized by program directors however each child is assigned a primary caregiver The primary caregiver of each focal child in Baby FACES completed a Teacher Interview
Report to Congress on DLLs in Head Start Page | 55
The home visits observed by Baby FACES research staff included many different kinds of activities some that occurred simultaneously The most prevalent activity was play (82 percent of home visits) and at least half of home visits included provision of education andor information (61 percent) child or parent observation or assessment (59 percent) goal setting and planning (52 percent) and modeling or demonstrating interaction with the child (ie facilitating parentchild interaction) (50 percent) On average two-thirds (69 percent) of the home visit time was spent on child-focused activities and parent-child-focused activities An additional 18 percent of home visit time was spent on parent or family-focused activities and 12 percent of the time was spent on staff-family relationship-building activities (Table III13)
On average the observed quality of home visits with 1-year-old DLLs in Early Head Start was rated as slightly above adequate The average HOVRS overall quality score was 36 (Table III14) Average scores on HOVRS subscales indicate that quality of visitor strategies overall was slightly lower (34) with the highest quality observed in the relationship with family (41) In comparison quality in terms of effectiveness of the visit was slightly higher (38) with the highest average rating in home visitors engagement with the focal child during the visit (46)
4 Other Services
In Head Start about half of DLLs with a disability had an IEP Eight percent of DLLs had a teacher-reported disability and 53 percent of these children had an individualized education program (IEP) or individualized family service plan (IFSP) (Table III15)
A wide range of services are offered to families of DLLs in Early Head Start Virtually all 1shyyear-old DLLs in Early Head Start in Spring 2009 were in programs that offered a wide range of family services either directly by referral or through a community partner on- or off-site These services ranged from employment assistance and job training to health and mental health services to other support services although some services were offered more commonly than others Less than 20 percent of programs offered training or support groups for families or mental health services beyond screenings assessments or therapy (Table III16)
Nearly all Early Head Start programs serving families of DLLs offered key services including assistance in obtaining health services information about Head Start information about community resources and assistance in applying for medical insurance Many programs offered assistance in scheduling appointments for prekindergarten screening Two-thirds of programs provided activities and workshops targeting parents of DLLs and slightly more than half offered assessment of English language skills and assessment of basic reading and writing skills (Table III17)
Many families of DLLs in Early Head Start and Head Start do not report receiving family services Although programs offered a wide range of services either directly or by referral a minority of families of 1-year-old DLLs in Early Head Start in Spring 2009 reported receiving these types of services from any source during the past year One-third reported receiving health services and nearly one-fourth attended classes to learn English One-fifth (21 percent)
Report to Congress on DLLs in Head Start Page | 56
received help finding good child care and 13 percent received short-term help getting or paying for things they needed in an emergency (Table III18)
According to parents of DLLs who entered Head Start in Fall 2006 Head Start provided information on health care providers to the parents of three-quarters of DLLs and made referrals to health care providers for parents of 20 percent of DLLs (Table III19) Head Start did not make most parents aware of or help them obtain other services ranging from employment-related services to child care to mental health services to other support services (Table III19) Parents of 12 percent of DLLs reported that Head Start made them aware of or helped them obtain one or more of these types of services
In both Early Head Start and Head Start approximately one-fifth of mothers of DLLs and nearly 10 percent of fathers of DLLs were currently participating in education or training activities Most parents of 1-year-old DLLs enrolled in Early Head Start in Spring 2009 who were enrolled in a course program class or workshop reported that Early Head Start helped them take or locate it (Table III18) Among the parents of DLLs who entered Head Start in Fall 2006 however less than one-third of the mothers and one-tenth of the fathers who were enrolled in a program course class or workshop reported that Head Start helped them take or locate it (Table III20)
Although many families of DLLs do not report receiving any of the survey-specified family services from the programs program data suggest that most families in these programs do receive at least one service The 2007-2008 PIR data indicate that most families in Early Head Start (84 percent) Head Start (73 percent) and MSHS programs (58 percent) received at least one family service The most frequently received services in MSHS programs were parenting education (42 percent) and health education (39 percent) Among other types of services received transportation assistance (16 percent) ESL training (15 percent) and emergencycrisis intervention (12 percent) were the most prevalent services received by families in MSHS programs (Table III21) A mental health professional consulted with program staff about the childs behavior or mental health for 6 percent of children and facilitated a referral for mental health services for 1 percent of children (Table III22)
All Early Head Start programs serving DLLs held events for the entire family Nearly all (97 percent) programs reported offering materials or workshops on child sleep practices to families of 1-year-old DLLs in Spring 2009 Eleven percent offered literacy activities and small percentages offered other types of family activities and events (Table III23) Two thirds of DLLS were in Early Head Start programs that reported offering activities or events specifically for fathers while 39 percent attended programs that offered employment or job training services specifically designed for fathers (Table III23)
Family involvement in Early Head Start activities varies widely Early Head Start programs offer a variety of activities and events in which individual family members and entire families can participate Nearly 80 percent of parents of 1-year-old DLLs in Early Head Start in Spring 2009 reported that they attended group activities for parents and their children during the past year Nearly two-thirds of parents reported that they attended an Early Head Start social event
Report to Congress on DLLs in Head Start Page | 57
and 57 percent attended parent education meetings or workshops related to children Nearly half reported volunteering in an Early Head Start classroom Smaller percentages were involved in other types of activities Notably in 18 percent of families of DLLs the father or father-figure attended events just for menfathers (Table III24)
5 Parent Satisfaction
Parents of DLLs in Head Start reported high levels of satisfaction with Head Start More than three quarters of parents of DLLs who entered Head Start in Fall 2006 and were still enrolled in Spring 2007 were very satisfied with most aspects of their experiences and their childrens experiences in Head Start Parents were especially likely to be very satisfied with Head Start in helping their child to grow and develop (88 percent) and preparing their child to go to kindergarten (86 percent) (Table III25) Fewer parents were very satisfied with Head Start in identifying and providing services for the family (60 percent) and in helping parents become more involved in the community (63 percent)
In Spring 2007 the parents of more than three-quarters of DLLs who entered Head Start in Fall 2006 reported that they and their child always had a variety of positive experiences in Head Start They were most likely to report that they always felt welcomed by their childs teacher (92 percent) and that their child was always treated with respect by teachers (90 percent) Fewer parents (61 percent) said that their child always got lots of individual attention (Table III25)
C DIFFERENCES AND SIMILARITIES IN THE SERVICES PROVIDED TO DLLS AND CHILDREN FROM MONOLINGUAL ENGLISH HOMES
As shown in Question 1 DLLs in Head Start and Early Head Start differ from children from monolingual English homes beyond the differences in language raceethnicity and immigrant background that define them They are more likely to be from families with two parents and to have at least one parent who is employed yet they are also more likely to be living in poverty These differences are likely to lead to different service needs and use and indeed the available data indicate some clear differences as the following summary shows However the data show that DLLs and their counterparts from monolingual English homes experienced similar quality of care in home visits and Early Head Start centers These differences and similarities are described below
DLLs were less likely than children from monolingual English homes to be enrolled in programs that offered full-day center-based early education and care
DLLs in Early Head Start were less likely to be receiving center-based services (32 percent vs 49 percent of monolingual English children) and more likely to be receiving home-based services or combination services (9 percent vs 1 percent) (Table III1)
Report to Congress on DLLs in Head Start Page | 58
DLLs in center-based Early Head Start programs and in Head Start were less likely than children from monolingual English homes to be enrolled in a program with a center that operated more than 10 hours per day (40 percent vs 55 percent in Early Head Start which most likely reflects programs offering combination services) and less likely to be in a full-day program (79 percent vs 98 percent in Early Head Start and 32 percent vs 57 percent in Head Start) (Tables III3 and III2)
Based on observations conducted by research staff the quality of classrooms in which DLLs were enrolled was very similar to the quality of classrooms in which children from monolingual English homes were enrolled
All observational measures of classroom quality were very similar for the classrooms of DLLs and classrooms of children from monolingual English homes both in Early Head Start and Head Start (Tables III5 and III6)
The extent to which Head Start teachers reported reading and language activities and math activities was very similar for DLLs and children from monolingual English homes However DLLs were less likely to be in classrooms in which daily activities included discussing new words (71 percent vs 82 percent) (Table III7) and precisely which language new words were in is not known
Among Early Head Start children in home-based programs the key features of the home visits observed with DLLs and children from monolingual English homes were similar however there were some differences in activities
Activities during home visits with DLLs were less likely to include provision of education or information (61 percent vs 75 percent) evaluationfeedback on parent-child interactions (35 percent vs 49 percent) or childparent observationassessment (59 percent vs 68 percent) (Table III13)
Most families of DLLs and children from monolingual English homes in Head Start did not report receiving services ranging from employment assistance and job training to health and mental health services to other support services
The available data show that most parents of both DLLs and children from monolingual English homes who entered Head Start in Fall 2006 (88 percent of both groups) reported that Head Start did not make them aware of or help them obtain any of a wide range of services (Table III19)
In Early Head Start DLLs were more likely than children from monolingual English homes to be in programs offering English language and literacy-related services their parents were more likely to have received several literacy and language-related services and health services and their parents reported higher involvement in many program activities
Report to Congress on DLLs in Head Start Page | 59
DLLs were more likely than children from monolingual English homes to be in programs that offered specific services for DLLs including activities and workshops for parents (64 percent vs 49 percent) information about adult ESL or education (98 percent vs 91 percent) information about community resources (996 percent vs 93 percent) and assistance in obtaining health services (100 percent vs 94 percent) (Table III17)
Parents of DLLs were less likely than parents of children from monolingual English homes to be currently enrolled in a program course class or workshop (mothers 22 percent vs 31 percent fathers 95 percent vs 139 percent) However DLLs parents were more likely to report that Early Head Start helped them to take or locate programs courses classes or workshops (mothers 19 percent vs 12 percent fathers 9 percent vs 3 percent) (Table III18)
Despite being more likely to report that Early Head Start helped them find such programs fathers of DLLs were less likely than fathers of children from monolingual English homes to be enrolled in a program offering events (67 percent vs 76 percent) or employmentjob training services specific to fathers (385 percent vs 466 percent) (Table III23)
Parents of DLLs were more likely than parents of children from monolingual English homes to report receiving classes to learn English (23 percent vs 1 percent) and health services (33 percent vs 15 percent) in the past year (Table III18)
DLLs were more likely than children from monolingual English homes to be enrolled in programs that offered family literacy activities (11 percent vs 5 percent) but less likely to be in programs that offered transition activities (1 percent vs 8 percent) (Table III23)
Parents of DLLs were more likely than parents of children from monolingual English homes to report that they attended group activities for parents and children (80 percent vs 68 percent) workshops on job skills (31 percent vs 14 percent) parent education meetings or workshops on raising children (57 percent vs 37 percent) or events just for fathers (18 percent vs 12 percent) They also were more likely to report that they volunteered in an Early Head Start classroom (47 percent vs 37 percent) (Table III24)
The Early Head Start programs attended by DLLs were less likely to have formal connections with Part C agencies
DLLs in Early Head Start were less likely than their counterparts from English-speaking homes to be in a program with a formal written partnership with a Part C agency14 (72 percent vs 96 percent) (Table III26)
14 Part C of the Individuals with Disabilities Education Act (IDEA) provides early intervention (EI) services to children aged birth to three with developmental delays or a medical condition likely to lead to a developmental delay Some states also serve infants and toddlers who are at heightened risk for developmental delay due to
Report to Congress on DLLs in Head Start Page | 60
Report to Congress on DLLs in Head Start Page | 61
biologicalmedical factors or their environmentalcaregiving circumstances (NECTAC httpwwwnectacorg~pdfspubseifactsheet_2pgpdf) A formal written partnership with the agency providing Part C early intervention services is likely to facilitate the identification of children with disabilities and referrals to early intervention services
CHAPTER IV QUALIFICATIONS AND TRAINING OF STAFF WHO SERVE DLLS
In this chapter we address the third research question
What are the qualifications and training of Head Start and Early Head Start teachersstaff that serve children who are DLLs and their families
In the next section we summarize the data sources and analytic methods used to address this question The following section investigates the qualifications and training of staff serving DLLs and their families These findings are put into context in the final section of this chapter through comparisons with the qualifications and training of staff serving children from monolingual English homes
A METHODOLOGY
The 2006 FACES surveys of Head Start program directors education coordinators center directors and teachers and the 2009 Baby FACES surveys of Early Head Start program directors teachers and home visitors provide data on the characteristics and education training and work experiences of staff in Head Start and Early Head Start These data sources offer important insights into the characteristics preparation and tenure of staff
Descriptive analyses of each data source were conducted The analyses used analytic weights provided with the survey datasets to take into account the sampling design and data collection non-response All estimates pertaining to Head Start children and families obtained using FACES 2006 data are weighted to represent the population of children entering Head Start for the first time in Fall 2006 or ndash for data from the spring before kindergarten ndash those entering for the first time in 2006 who are still enrolled after one or two years Estimates using Baby FACES data are weighted to represent the population of 1-year-old children enrolled in Early Head Start in Spring 2009
The FACES and Baby FACES data do not include children and families in Migrant and Seasonal Head Start (MSHS) programs or children and families in American IndianAlaska Native (AIAN) programs
All of the analyses focus on children for whom a language other than English is the primary language spoken to them at home (DLLs)
B CHARACTERISTICS AND QUALIFICATIONS OF STAFF SERVING DLLS
The teachers and home visitors caring for DLLs and their managers provide the care that shapes the experiences of DLLs in Early Head Start and Head Start In the following sections we examine the characteristics and employment experiences of the teachers home visitors and managers caring for DLLs in Early Head Start and Head Start
1 Teachers Caring for DLLs in Early Head Start Head Start and MSHS
Report to Congress on DLLs in Head Start Page | 62
Teachers are virtually all female All of the teachers serving 1-year-old DLLs in Early Head Start in Spring 2009 were female (Table IV1) Almost all of the lead teachers in classrooms of DLLs who entered Head Start in Fall 2006 were female (Table IV3)
Like enrolled children more than half of teachers are Hispanic As noted in Chapter II 91 percent of DLLs in Early Head Start and 84 percent of DLLs in Head Start come from homes in which the primary language spoken is Spanish A substantial proportion of DLLs in Early Head Start and Head Start are cared for by teachers who are also Hispanic Half of 1-year-old DLLs in Early Head Start classrooms in Spring 2009 had teachers who were Hispanic (Table IV1) Similarly nearly half of DLLs who entered Head Start in Fall 2006 had lead teachers who were Hispanic (Table IV3)
Depression may afflict some teachers Most teachers caring for DLLs in Early Head Start and Head Start did not report elevated symptoms of depression which would indicate a high probability that they were depressed however for a small proportion of teachers and home visitors moderate or severe depression may be a problem In Early Head Start teachers caring for 16 percent of 1-year-old DLLs reported symptoms of moderate or severe depression (Table IV1) In Head Start teachers of 12 percent of teachers of DLLs reported symptoms of moderate or severe depression (Table IV3)
The majority of DLLs in Early Head Start and Head Start centers have teachers who have a college degree although there is variability In Early Head Start 55 percent of DLLs in center-based care had a teacher with an associates or bachelors degree (Table IV4) Only 15 percent were cared for by a teacher with only a high school diploma or less Most DLLs (87 percent) who entered Head Start in Fall 2006 were cared for by a lead teacher who had an associates or bachelors degree (Table IV6) Only 5 percent of teachers serving DLL children had only a high school diploma or GED In MSHS programs in 2007-2008 54 percent of teachers had an associates or bachelors degree
One-fourth to one-half of teachers of DLLs had a degree in early childhood education The educational attainment of teachers may have a greater impact on their work if it includes a focus on child development and early education Nearly half (45 percent) of 1-year-old DLLs in Early Head Start center-based care in 2009 were cared for by teachers whose field of study included early childhood education (Table IV4) Among DLLs entering Head Start in Fall 2006 whose teacher had an associates or bachelors degree 28 percent had a teacher with a degree in early childhood education (24 percent overall) (Table IV6)
Many teachers have a Child Development Associate (CDA) credential15 The teachers of two-thirds of 1-year-old DLLs in Early Head Start in Spring 2009 and 60 percent of lead teachers
15 Earning a CDA credential requires 120 hours of formal early childhood education training in 8 content areas and 480 hours of professional experience in a group setting with infants and toddlers or 3-5 year old children or 480 hours working with families in home visits in addition to a minimum of 3 hours of direct observation by a CDA
Report to Congress on DLLs in Head Start Page | 63
Report to Congress on DLLs in Head Start Page | 64
of DLLs who entered Head Start in Fall 2006 had earned a CDA (Tables IV4 and IV6) More than half (57 percent) of teachers in MSHS programs in 2007-2008 had a CDA credential
Some teachers have a state-awarded preschool certificate One-third of 1-year-old DLLs in Early Head Start centers in 2009 had a teacher with a state-awarded preschool certificate or license (Table IV4) Nearly half (47 percent) of DLLs who entered Head Start in Fall 2006 had a lead teacher with a state-awarded certificate (Table IV6)
Many DLLs in Head Start are in programs in which lead teachers have a teaching certificate or license More than half of the lead teachers (59 percent) of DLLs who entered Head Start in Fall 2006 had a teaching certificate (Table IV6)
Current participation in training is common among teachers in Early Head Start and Head Start At the time of the FACES and Baby FACES surveys one-third to one-half of the teachers of DLLs was enrolled in training (ie educational course apart from any training provided by their program) About half (52 percent) of 1-year-old DLLs in Early Head Start centers had a teacher currently enrolled in child care-related training (Table IV4) Similarly 42 percent of DLLs who entered Head Start in Fall 2006 had a teacher who was currently enrolled in teacher-related training (Table IV6)
Many teachers have more than 5 years of experience in Early Head Start and Head Start DLLs in Early Head Start had teachers with less experience than DLLs in Head Start possibly reflecting the younger age of the Early Head Start program On average teachers serving 1shyyear-old Early Head Start DLLs in center-based programs in 2009 had worked in Early Head Start for 5 years (Table IV4) Nearly half (48 percent) of DLLs in Early Head Start had teachers who had worked in Early Head Start 5 or more years On average DLLs entering Head Start in Fall 2006 had lead teachers who had worked in Head Start for 9 years with 8 years in their current program (Table IV6) Three-quarters (74 percent) of DLLs entering Head Start had lead teachers who had worked in Head Start 5 or more years
Teachers and home visitors in Early Head Start had more than 5 years of experience caring for infants and toddlers On average 1-year-old DLLs in Early Head Start centers in 2009 had teachers (58 percent) and home visitors (69 percent) who had been teaching or caring for infants and toddlers for several years (Tables IV4 and IV5)
Teachers in Head Start have more than a decade of teaching experience DLLs entering Head Start in Fall 2006 had lead teachers who had been teaching for 13 years on average (Table IV6)
The average annual salaries of lead teachers in Head Start and MSHS are modest The average annual salary received by the lead teachers of DLLs entering Head Start in Fall 2006 was
Advisor submission of a Professional Resource File and submission of questionnaires completed by parents of children in the care of the CDA candidate (see httpwwwcdacouncilorgthe-cda-credential)
$26580 (Table IV6) The 2007-2008 PIR data indicate that the average teacher in MSHS programs earned $18304 annually
Average turnover of Early Head Start and MSHS teachers is moderate Teacher turnover during the past 12 months in programs of 1-year-old DLLs in center-based Early Head Start care in 2009 was 14 percent (Table IV12) About one-fifth of Early Head Start programs offering center-based care experienced a teacher turnover rate greater than 25 percent Similarly the average teacher turnover rate in MSHS programs in 2007-2008 was 15 percent
2 Home Visitors Caring for DLLs in Early Head Start
Home visitors are virtually all female All of the home visitors serving 1-year-old DLLs in Early Head Start in Spring 2009 were female (Table IV2)
Like enrolled children more than half of home visitors are Hispanic A substantial proportion DLLs in Early Head Start are served by home visitors from a similar background Three-quarters of 1-year-old DLLs in Early Head Start who were receiving home visits had home visitors who were Hispanic (Table IV2)
Depression may afflict some home visitors Most home visitors serving DLLs in Early Head Start did not report elevated symptoms of depression indicating a high probability that they were depressed However for a small proportion moderate or severe depression may be a problem Home visitors caring for 4 percent of 1-year-old DLLs in Early Head Start reported symptoms of moderate or severe depression (Table IV2)
Nearly all DLLs receiving home-based Early Head Start services have home visitors with education beyond high school Nearly two-thirds (62 percent) of DLLs in Early Head Start who were receiving home-based services had a home visitor with an associates or bachelors degree (Table IV5) Only 4 percent of DLLs in home-based Early Head Start had a home visitor with a high school diploma GED or less
Two-thirds of home visitors of DLLs had a degree in early childhood education The educational attainment of teachers and home visitors may have a greater impact on their work if it includes a focus on child development and early education Nearly two-thirds (64 percent) of all 1-year-old DLLs in home-based Early Head Start services were cared for by home visitors whose field of study included early childhood education (Table IV5)
Many home visitors have a Child Development Associate (CDA) credential Nearly half of DLLs receiving home-based Early Head Start services in Spring 2009 had a home visitor with a CDA credential (45 percent) (Table IV5)
Report to Congress on DLLs in Head Start Page | 65
Some home visitors have a state-awarded certificate Nearly half (45 percent) of 1-yearshyold DLLs receiving home-based Early Head Start services in Spring 2009 had a home visitor with a state-awarded certificate (Table IV5)
Many Early Head Start home visitors participate in training About one-third (36 percent) of the 1-year-old DLLs receiving Early Head Start home-based services in Spring 2009 had a home visitor who was currently enrolled in child care related training (ie courseclass apart from any provided by their program) (Table IV5)
Many home visitors have more than 5 years of experience in Early Head Start On average 1-year-old Early Head Start DLLs in home-based services in 2009 had home visitors who had worked in Early Head Start for 4 years and more than a third (43 percent) of DLLs in Early Head Start had home visitors who had worked in Early Head Start 5 or more years (Table IV5)
Home visitors in Early Head Start have more than five years of experience on average caring for infants and toddlers On average 1-year-old DLLs in home-based Early Head Start services had home visitors who had been teaching or caring for infants and toddlers for 7 years (Table IV5)
Average turnover of Early Head Start home visitors is moderate Home visitor turnover during the past 12 months in programs of 1-year-old Early Head Start DLLs in home-based care in 2009 was 15 percent (Table IV12) About one-fifth of programs offering home-based services experienced a home visitor turnover rate higher than 25 percent
3 Managers Overseeing Teachers and Home Visitors Caring for DLLs in Early Head Start and Head Start
Although supervisors coordinators and directors do not normally care for children in Early Head Start and Head Start directly they can have an impact on the care children receive through their monitoring of teachers and home visitors and the policies and practices they set and model for frontline staff
Managers in programs serving DLLs have high levels of education Three-quarters of DLLs were enrolled in programs in which mid-level managers (program managersupervisor in Early Head Start and center director in Head Start) had a bachelors degree or higher (75 percent in Early Head Start and 72 percent in Head Start) and notable proportions of DLLs were enrolled in programs with mid-level managers who had a graduate or professional degree (27 percent in Early Head Start and 43 percent in Head Start) (Tables IV7 and IV8) Two-thirds (63 percent) of DLLs who entered Head Start in Fall 2006 were in programs in which the education coordinator had a graduate degree and nearly all were in a program in which the education coordinator had a bachelors degree or higher (97 percent) (Table IV9) Most DLLs in Early Head Start and Head Start were in programs led by a director with a bachelors degree or higher and two-
Report to Congress on DLLs in Head Start Page | 66
thirds to three-quarters were in programs in which the director had a graduate or professional degree (Tables IV10 and IV11)
Many managers in Head Start (but not in Early Head Start) have a CDA credential Nearly none of the DLLs in Early Head Start were in programs in which the mid-level staff and director had only a CDA credential In contrast nearly half of DLLs entering Head Start in Fall 2006 were in programs in which mid-level managers and directors had a CDA credential Only 3 percent of 1-year-old DLLs in Early Head Start in 2009 were in programs in which the program managersupervisor had a CDA and less than 1 percent was in a program in which the director had a CDA (Tables IV7 and IV10) More than one-third (43 percent) of DLLs who entered Head Start in Fall 2006 were in a program in which the education coordinator had a CDA and about half were in a program in which the center-director had a CDA (Tables IV8 and IV9)
Many directors and managers in Head Start (but not in Early Head Start) also have a state-awarded preschool certificate Less than 5 percent of 1-year-old DLLs in Early Head Start in 2009 were in programs in which program managerssupervisors or directors had a state-awarded preschool certificate or license (Tables IV7 and IV10) In contrast one-third of DLLs who entered Head Start in Fall 2006 were in programs in which the center director had a state-awarded preschool certificate and nearly half (47 percent) were in programs in which the education coordinator had a state-awarded certificate (Tables IV8 and IV9)
Many DLLs in Head Start are in programs in which center directors and education coordinators have a teaching certificate or license More than half of DLLs who entered Head Start in Fall 2006 were in centers with directors (53 percent) who had a teaching certificate (Table IV8) Nearly two thirds (63 percent) of DLLs in Head Start were in programs in which the education coordinator had a teaching certificate (Table IV9)
Head Start managers have more than a decade of experience working in Head Start DLLs in Head Start were in programs with mid-level managers and directors who had slightly more experience than lead teachers working in Head Start (11 to 15 years compared with 9 years) Most of this Head Start experience was in the current program On average DLLs who entered Head Start in Fall 2006 were in centers with directors who had worked in Head Start for 11 years 9 of those in their current program (Table IV8) On average they were in programs with education coordinators who had worked in Head Start for 14 years all in their current program (Table IV9) And on average they were in programs with directors who had worked in Head Start for 18 years 15 of those in their current program (Table IV11)
Average salaries increase with responsibility In Head Start center directors receive an average annual salary that is almost twice as large as that received by lead teachers and program directors receive an average annual salary that is almost three times as large as that received by lead teachers In the programs of DLLs who entered Head Start in Fall 2006 the average annual salaries received by the center directors education coordinators and program directors were $46353 $56071 and $81812 respectively (Tables IV8 IV9 and IV11)
Report to Congress on DLLs in Head Start Page | 67
Turnover in managers is common in Early Head Start programs serving DLLs More than half (56 percent) of 1-year-old DLLs in Early Head Start in 2009 were in a program that lost a director coordinator or manager in the past year (Table IV12) Those children who experienced this turnover experienced the loss of 16 such staff Among the children who experienced program management turnover nearly half were in programs where managers left due to personal reasons (46 percent) while approximately one-quarter were in programs where managers left for higher compensation or benefits (29 percent) or to change careers (26 percent) Ten percent of DLLs who experience program management turnover were in programs in which managers left on maternity leave and 10 percent were in programs where managers left for other reasons (Table IV12)
C DIFFERENCES BETWEEN STAFF CARING FOR DLLS AND MONOLINGUAL ENGLISH CHILDREN
As shown in Chapter II DLLs in Head Start and Early Head Start differ from children from monolingual English homes beyond the differences in language raceethnicity and immigrant background that define them DLLs are more likely to live in the West and South and programs there may face different labor markets and select staff with different demographic educational and work backgrounds The data from Baby FACES and FACES show there are differences in the staff who serve DLLs and the staff who serve children from monolingual English homes as highlighted below
Differences in raceethnicity of frontline staff reflect differences in DLLs and monolingual English children Efforts to match DLLs with teachers and home visitors from the same ethnic and linguistic background may be leading to differences in the backgrounds of Early Head Start and Head Start staff caring for DLLs and children from monolingual English homes
Compared with their peers from monolingual English homes 1-year-old DLLs in Early Head Start in 2009 were more likely to have a Hispanic teacher (50 percent vs 9 percent) or home visitor (73 percent vs 4 percent) and less likely to have a White teacher (26 percent vs 60 percent) or home visitor (17 percent vs 82 percent) or an African-American teacher (14 percent vs 24 percent) or home visitor (3 percent vs 9 percent) (Tables IV1 and IV2)
Similarly compared with their peers from monolingual English homes DLLs who entered Head Start in Fall 2006 were more likely to have lead teachers who were Hispanic (47 percent vs 6 percent) and less likely to be White (29 percent vs 47 percent) or African American (15 percent vs 45 percent) (Table IV3)
Data show systematic differences in exposure to teachers and home visitors with symptoms of depression While most teachers and home visitors of DLLs and children from monolingual English homes in Early Head Start and Head Start did not report symptoms indicating they were depressed differences were apparent in the percentages of children with teachers or home visitors reporting symptoms of moderate or severe depression
Report to Congress on DLLs in Head Start Page | 68
16 percent of 1-year-old DLLs in Early Head Start were cared for by a teacher who reported moderate or severe symptoms of depression compared with 4 percent of teachers of children from monolingual English homes (Table IV1)
In contrast 4 percent of DLLs compared with 12 percent of children from monolingual English homes who were in Early Head Start home-based services had a home visitor who reported symptoms indicating moderate or severe depression (Table IV2)
Among children who entered Head Start in Fall 2006 DLLs were just as likely as children from monolingual English homes to have a lead teacher who reported symptoms indicating moderate or severe depression (12 to 14 percent Table IV3)
Some teachers and home visitors serving DLLs followed a different education path In Early Head Start teachers of DLLs were less likely to have education beyond high school than teachers of children from monolingual English homes resulting in fewer teachers who had earned an associates degree or higher The teachers of DLLs however were more likely than teachers of children from monolingual English homes to have a CDA credential
DLLs in Early Head Start centers were more likely than their peers from monolingual English homes to have a teacher with no education beyond high school (16 percent vs 8 percent) and less likely to have a teacher with an associates degree (25 percent vs 37 percent) (Table IV4)
DLLs in Early Head Start centers were more likely than their peers from monolingual English homes to have a teacher with a CDA credential (68 percent vs 49 percent) (Table IV4)
A similar pattern of differences is evident for Early Head Start home visitors DLLs in home-based Early Head Start services were less likely than children from monolingual English homes to have a home visitor who had completed college but more likely to have a home visitor who had either received some college education or a state-awarded preschool certificate
DLLs in home-based Early Head Start programs had home visitors who were less likely than home visitors for children from monolingual English homes to have received any college degree (714 percent vs 814 percent for AA BA or graduateprofessional degree) (Table IV5)
DLLs in home-based Early Head Start programs had home visitors who were more likely than home visitors caring for children from monolingual English homes to have received some college education (25 percent vs 16 percent) (Table IV5)
Report to Congress on DLLs in Head Start Page | 69
1-year-old DLLs receiving home-based Early Head Start services in Spring 2009 were more likely than their peers from monolingual English homes to have a home visitor with a state-awarded preschool certificate (45 percent vs 32 percent) (Table IV5)
FACES data show a similar pattern DLLs in Head Start also were less likely than their peers from monolingual English homes to have a lead teacher who had completed college but more likely to have a lead teacher who had a state-awarded preschool certificate or a teaching certificate or license
The lead teachers of DLLs in Head Start were more likely than the lead teachers of children from monolingual English homes to have an associates degree (50 percent vs 36 percent) (Table IV6)
DLLs who entered Head Start in Fall 2006 were twice as likely as their peers from monolingual English homes to have a lead teacher with a state-awarded preschool certificate (47 percent vs 23 percent) or a teaching certificate or license (59 percent vs 36 percent) (Table IV6)
Levels of current participation in training are similar Both Baby FACES and FACES data show that current levels of participation in training are similar among the staff serving DLLs and those serving children from monolingual English homes
DLLs in Early Head Start centers and DLLs receiving home-based Early Head Start services were just as likely as their peers from monolingual English homes to have teachers or home visitors who were currently enrolled in training (Tables IV4 IV5 and IV6)
In Early Head Start DLLs have teachers and home visitors with less experience caring for infants and toddlers In Head Start DLLs and children from monolingual English homes have teachers with similar years of work experience but in Early Head Start DLLs have teachers and home visitors who have fewer years of experience than the teachers and home visitors of children from monolingual English homes
DLLs and children from monolingual English homes who entered Head Start in Fall 2006 had lead teachers with similar years of experience teaching in Head Start teaching in the current program and years of teaching (Table IV6)
The teachers of DLLs in Early Head Start in Spring 2009 had cared for infant or toddlers for an average of 6 years compared to 8 years for teachers of children from monolingual English homes (Table IV4)
Report to Congress on DLLs in Head Start Page | 70
DLLs receiving home-based Early Head Start services had home visitors who had less experience caring for infants and toddlers on average than home visitors of children from monolingual English homes (7 vs 10 years Table IV5)
In Early Head Start managers of programs serving DLLs are more likely to leave Annual rates of turnover in teachers and home visitors are similar in the programs attended by DLLs and the programs attended by children from monolingual English homes The programs attended by DLLs however are more likely to experience turnover in management positions
Rates of turnover of frontline staff (teachers and home visitors) in the Early Head Start programs attended by 1-year-old DLLs were similar to the rates of turnover in the programs attended by their peers from monolingual English homes (Table IV12)
The percentage of children in programs in which a director coordinator or manager left in the past 12 months was higher among DLLs than their peers from monolingual English homes (56 percent vs 46 percent) (Table IV12)
Data from FACES show that lead teachers and managers in programs attended by DLLs earn higher annual salaries This could reflect differences in the geographic distribution of DLLs and children from monolingual English homes and associated differences in cost of living
The lead teachers of DLLs who entered Head Start in Fall 2006 reported annual salaries that were larger than the salaries of lead teachers of children from monolingual English homes ($26580 vs $22473) (Table IV6)
The center directors of DLLs who entered Head Start in Fall 2006 reported annual salaries that were larger than the salaries of center directors of children from monolingual English homes ($46353 vs 39341 Table IV8)
DLLs who entered Head Start in Fall 2006 were in programs with education coordinators who earned considerably more per year than education coordinators in the programs attended by children from monolingual English homes ($56071 vs $41178 Table IV9)
DLLs who entered Head Start in Fall 2006 were in programs with directors who earned considerably more per year than directors in the programs attended by children from monolingual English homes ($81812 vs $60767) (Table IV11)
These differences show that compared with children from monolingual English homes DLLs in Early Head Start were served by teachers and home visitors who had less education and experience but were more likely to have earned a CDA Their teachers were more likely to be Hispanic than their colleagues serving children from monolingual English homes like the DLLs for whom they cared
Report to Congress on DLLs in Head Start Page | 71
In Head Start DLLs were served by lead teachers who had less education and earned higher annual salaries than the lead teachers of children from monolingual English homes but the lead teachers of DLLs were more likely to have earned a state-awarded certificate or teaching certificate or license In Head Start as in Early Head Start the lead teachers of DLLs in Head Start were more likely than those teaching children from monolingual English homes to be Hispanic
Report to Congress on DLLs in Head Start Page | 72
CHAPTER V LANGUAGES USED BY STAFF WHO SERVE DLLS
In this chapter we address the fourth research question
What are the languages in which Head Start and Early Head Start teachersstaff are fluent in relation to the children and families they serve
In the next section we summarize the data sources and analytic methods used to address this question The following section investigates the languages used by staff serving DLLs and their families While some information is available the data addressing this question are particularly limited as there are no formal assessments of staff language proficiency in use Unlike previous chapters these findings will not be compared to experiences of children from monolingual English homes as the fluency of staff in LOTEs does not have the same relevance for these children
A METHODOLOGY
To answer this question we compiled data from multiple sources These include the 2009 Baby FACES surveys of Early Head Start teachers and home visitors and the 2006 FACES surveys of Head Start teachers and parents
Descriptive analyses of each data source were conducted The analyses used analytic weights provided with the survey datasets to take into account the sampling design and data collection non-response All estimates pertaining to Head Start children obtained using FACES 2006 data are weighted to represent the population of children entering Head Start for the first time in Fall 2006 Estimates using Baby FACES data are weighted to represent the population of 1-year-old children enrolled in Early Head Start in Spring 2009
The FACES and Baby FACES data do not include children and families in MSHS programs or children and families in American IndianAlaska Native (AIAN) programs
All of the analyses focus on children for whom a language other than English is the primary language spoken to them at home (DLLs)
B LANGUAGES USED BY STAFF SERVING DLLS
The available data provide information that indirectly informs the question posed by Congress shining light on the languages used in providing services to children who are DLLs and their families However there are no data that speak directly to the question of the fluency of Head Start staff in particular languages Further data on the languages used in various settings are not detailed enough to examine with what frequency and for what purposes different languages are used
Multiple languages are often spoken in classrooms and home visits Among 1-year-old DLLs in Early Head Start home-based services adults speak English during 70 percent of home visits and Spanish during 77 percent of home visits reflecting that teachers and home visitors
Report to Congress on DLLs in Head Start Page | 73
use both languages within many visits Other languages are spoken by adults during 4 percent of visits (Table III9)
Childrenrsquos home language is used in most home visits and classrooms In Early Head Start the childs home language was used during 89 percent of home visits with 1-year-old DLLs in Spring 2009 (Table III9) The childs home language was used in the Early Head Start classrooms of 85 percent of 1-year-old DLLs (Table III9) In Head Start classrooms the childs home language was used for at least some instruction in the classrooms of 60 percent of DLLs (Table III10)
In Early Head Start classrooms in Spring 2009 1-year-old DLLs were most likely to have a lead teacher who spoke a language other than English in the classroom (69 percent) and nearly half (47 percent) had an assistant teacher who spoke another language 30 percent had a classroom aide who spoke another language and 19 percent had a volunteer or other non-staff person who spoke another language in the classroom (Table III9)
In Head Start even if the childs home language is not used for instruction in the classroom most DLLs are in programs where there is someone in their program available to speak to them in their home language FACES data show that 85 percent of DLLs who entered Head Start in Fall 2006 were in programs in which staff members speaking the childs home language were available as reported by parents (Table III11)
English is the language most often used to read to children in the classroom In Early Head Start centers most (92 percent) of 1-year-old DLLs were in classrooms in which the language most often used to read to children was English (Table III9)
Teachers and home visitors use a variety of strategies to communicate with the families of DLLs when they do not speak the same language When they did not share a common language half (52 percent) of the families of 1-year-old DLLs in Early Head Start in 2009 had teachers or home visitors who spoke to them only in English Two-thirds (67 percent) had teachers or home visitors who used an informal interpreter Three-fourths of DLLs had teachers or home visitors who used physical cues or hand gestures to communicate with their families (Table III9)
The available data provide a window into the language match between teachers home visitors and other adults in Head Start and Early Head Start programs and the children and families served Most DLLs in Early Head Start as in Head Start are hearing their home languages spoken by adults in their classrooms In Head Start LOTEs are used by teaching staff for some portion of classroom instruction for a majority of DLLs The vast majority of DLLs in Early Head Start are in classrooms in which the language most often used in reading to children is English however Spanish is most often used for reading in the classrooms of a small proportion of DLLs However the picture is incomplete Unfortunately these data are not detailed enough to portray the frequency quality or purposes for which different languages are used in classrooms These aspects of language use are critical to consider but here again
Report to Congress on DLLs in Head Start Page | 74
the state of research methodology to assess these and many other dimensions of the quality of early care and education settings is inadequate
Report to Congress on DLLs in Head Start Page | 75
CHAPTER VI DEVELOPMENTAL PROGRESS MADE BY DLLS IN EARLY HEAD START AND HEAD START
In this chapter we address the fifth research question
What developmental progress is made by children who are DLLs in Head StartEarly Head Start programs
In the next section we summarize the data sources and analytic methods used to address this question For this question we are especially limited by the state of research methodology The following section describes the developmental progress of DLLs in Early Head Start and Head Start These findings are put into context in the final section of this chapter through comparisons with the developmental progress of children from monolingual English homes in Early Head Start and Head Start First we begin by outlining the issues plaguing the field that limit capacity to provide a complete picture of the developmental progress of young DLLs
The data addressing this question are limited due to the overall state of the field to reliably or accurately describe the developmental progress of young children who are dual language learners As discussed in Chapter I the research field lacks consensus regarding a variety of methodological issues in the assessment of development among DLLs For one there is not definitive guidance about the most appropriate instruments or procedures for screening language abilities or routing young children based on language proficiency into assessments delivered in English or LOTEs In addition the norms established for the most common measures of child development have not been shown to be valid for children who are dual language learners Most widely available measures of vocabulary one of the most common indices of language development for young children assess only English vocabulary skills offering few or no options for observing language ability in languages other than English Of particular significance for this question it is unclear what the best approaches are for assessing comprehensive development over time as childrens proficiency in one or more languages and perhaps their dominant language changes
Large-scale national studies examining child development holistically are challenged to collect the most comparable data across groups of children with different language experiences In this context the information presented below regarding the developmental progress of DLLs in Early Head Start and Head Start reflects data collected utilizing the best methods available at the time the respective studies were designed
A METHODOLOGY
To answer this question we compiled data from multiple sources These include the 2009 Baby FACES staff reports about childrens development and parent interviews and the 2006 FACES parent interviews teacher reports of childrens development and direct assessments of children
Report to Congress on DLLs in Head Start Page | 76
Fair and accurate assessment of the language development of DLLs should reflect the characteristics of DLLs (including their stage of English acquisition and their home literacy environment) and capture overall language competence with attention to both the first and second languages (Espinosa 2008xix) In Baby FACES information on language development of 1-year-old children was obtained from Early Head Start home visitors and teachers using the Short Form Level I (for infants) of the MacArthur-Bates Communicative Development Inventories (CDI) (Fenson et al 2000xx) Children identified as understanding Spanish and whose teachers or home visitors also spoke Spanish were also rated using the direct Spanish translation of the English infant form
Information on Early Head Start childrens social-emotional development was obtained from both parents and Early Head Start teachers and home visitors using the Brief Infant Toddler Social Emotional Assessment (BITSEA Briggs-Gowan amp Carter 2006xxi) The BITSEA measures childrens emerging social-emotional competence and problems with forms for staff and parents Scores at or above the 75th percentile in the national standardization sample for problems or scores at or below the 15th percentile for competence indicate developmental problems and children who score in the problem range for competence or problems are considered to have screened positive for developmental problems As described in Chapter 1 available data only permit us to report how children in Early Head Start were doing at 1 year of age and rely on reports with no direct assessments of childrens development at this age
In Head Start a direct child assessment battery was administered to assess childrens vocabulary early literacy and early math skills social-emotional development and height and weight In addition parents provided ratings of their childrens early literacy social-emotional development and health The direct assessment began with a language screener to determine whether children should receive the assessment battery in English or Spanish or receive only the test of vocabulary and be weighed and measured The screener included the Art Show and Simon Says subtests of the Preschool Language Assessment Survey (PreLAS 2000 Duncan amp DeAvila 1998xxii) To assess their English receptive vocabulary assessors administered the Peabody Picture Vocabulary Test (PPVT-4) to all children regardless of their home language or performance on the language screener (Dunn et al 2006xxiii)
In other words DLLs or the Head Start children whose parents reported that a language other than English was primarily spoken to them at home (27 percent of all 3- and 4-year olds in FACES sample) received both the PreLAS as a language screener and the PPVT-4 as an assessment of their English skills in the fall of 2006 Any child whose primary language at home was not English but who passed the screener by demonstrating a minimum level of English comprehension received the cognitive assessment battery entirely in English If a child did not pass the screener (ie child made five consecutive errors on both the Simon Says and Art Show subtests) and primarily spoke Spanish at home he or she was administered the PPVT-4 and then routed to the Spanish-language cognitive assessment battery If a child did not pass the screener and did not primarily speak English or Spanish he or she was administered only the PPVT-4 and was weighed and measured Among children from monolingual English homes (ie children whose parents reported no LOTEs spoken in the home or who reported that they spoke primarily in English to the child) approximately 1 percent did not pass the English language screener and were administered the cognitive assessment battery in Spanish At
Report to Congress on DLLs in Head Start Page | 77
Head Start entry less than half of children whose primary language at home was not English passed the English language screener (12 percent of entire sample) In subsequent waves (spring of 2007 and 2008) the language screener was used to route only children who had not passed the language screener in the previous round All other children were administered the Simon Says task and then automatically routed into the English version of the assessments
For Head Start children who passed the screener for minimum ability in English emergent and early literacy skills were assessed in English using the Letter-Word and Spelling subtests of the Woodcock-Johnson (WJ-III) Tests of Achievement (Woodcock et al 2001) as well as the Story and Print Concepts task developed for FACES (modified from the Story and Print Concepts tasks in Mason and Stewart (1989)xxiv) Early math skills were assessed in English using the Applied Problems subtest of the WJ-III Tests of Achievement and the Early Childhood Longitudinal Study (ECLS) math and numbershape proficiency tasks
For Head Start children who were routed into the Spanish cognitive assessment battery assessors used Spanish versions of the tests to assess childrens literacy and math skills Children who spoke Spanish were assessed using the Letter-Word and Spelling subtests of the Bateriacutea III Woodcock-Muntildeoz (WM-III) Tests of Achievement (Woodcock Muntildeoz-Sandoval McGrew Mather and Schrank 2004xxv) as well as the Spanish translation of the Story Print Concepts task developed for FACES Early math skills were assessed using the Applied Problems subtest of the WM-III Tests of Achievement and Spanish translation of the Early Childhood Longitudinal Study (ECLS) math and numbershape proficiency tasks In addition assessors administered the Test de Vocabulario Imaacutegenes de Peabody (TVIP Dunn et al 1986xxvi) to Spanish speaking Head Start children to assess their receptive vocabulary in Spanish Thus the data offer a picture of Spanish-speaking childrens vocabulary in two languages FACES 2006 did not use conceptually scored measures of childrens language development so no picture of childrens overall vocabulary development independent of language can be derived from the current data
All children were then assessed in the spring preceding their Head Start exit (ie 2007 for children who entered as 4-year olds and 2008 for children who entered as 3-year olds) It is important to note that about half of Spanish-speaking DLLs in Head Start were assessed in English in Fall 2006 but by the end of Head Start (approximately 6-8 months later for 4-year olds 16-18 months later for 3-year olds) nearly all DLLs were assessed in English because they passed the English language screener (approximately 11 percent of DLLs completed the cognitive assessment battery in Spanish) That means that the samples for describing language development in English and Spanish are very different at the beginning and end of Head Start In addition this reflects progress in English language development among Spanish-speaking DLLs in Head Start
ased on childrens behavior during the assessment assessors rated all childrens attention organization and impulse control activity level and sociability using the Leiter International Performance Scale Revised (Leiter-R) Examiner Rating Scales (Roid and Miller 1997xxvii)
Other measures of development were obtained from teachers and parents Teachers of children who entered Head Start in Fall 2006 rated childrens literacy and social skills as well as
Report to Congress on DLLs in Head Start Page | 78
their attitudes toward learning competence and motivation and their attention and persistence using the Preschool Learning Behavior Scale (PLBS McDermott et al 2000xxviii) Parents rated their childrens literacy social skills and attitudes toward learning
Descriptive analyses of each data source were conducted The analyses used analytic weights provided with the survey datasets to take into account the sampling design and data collection nonresponse All estimates pertaining to Head Start children obtained using FACES 2006 data are weighted to represent the population of children entering Head Start for the first time in fall of 2006 In other words estimates using baseline data are weighted to represent all children nationwide who enrolled in Head Start in the fall of 2006 Estimates using subsequent waves of data are weighted to represent all children nationwide who remained enrolled and completed Head Start In other words for data from spring 2007 children entering Head Start in 2006 who are still enrolled after one year for data from spring of 2008 children entering in 2006 who are still enrolled after two years Estimates using Baby FACES data are weighted to represent the population of 1-year-old children enrolled in Early Head Start in spring of 2009
The FACES and Baby FACES data do not include children and families in MSHS programs or children and families in American IndianAlaska Native (AIAN) programs
As discussed in Chapter I all of the data reported focus on children for whom a language other than English is the primary language spoken to them at home (DLLs) unless noted otherwise
B DEVELOPMENTAL PROGRESS OF DLLS IN EARLY HEAD START
Baby FACES data for 1-year-old children in the spring of 2009 provide a single snapshot of the developmental status of Early Head Start children summarized below
1-year-old DLLs in Early Head Start are just beginning to develop their vocabulary ccording to Early Head Start teachers and home visitors assessments using the DI 1-yearshyold DLLs in Spring 2009 understood 22 English words and spoke 1 English word on average (Table VI1) The 1-year-old DLLs who were identified as understanding Spanish and whose Early Head Start teacher or home visitor also spoke Spanish understood 36 Spanish words and spoke 2 Spanish words on average
DLLs have a larger vocabulary when both English and Spanish words are considered When the CDI assessments in English and Spanish are combined to assess the number of words that the child understands or says in English or Spanish the Baby FACES data show that DLLs understood 41 words in English or Spanish and spoke 3 words in English or Spanish on average (Table VI1)
Many DLLs in Early Head Start may have delays in social-emotional development According to staff (teachers and home visitors) 10 percent of 1-year-old DLLs in Early Head Start in Spring 2009 had high levels of problem behaviors indicating a delay in social-emotional development (Table VI2) According to parents more than three times as many DLLs (34 percent) had high levels of problem behaviors indicating a delay in social-emotional competence
Report to Congress on DLLs in Head Start Page | 79
Parent and staff ratings of social-emotional competence are more similar According to teachers and home visitors 20 percent of DLLs had low social-emotional competence indicating a delay in social-emotional development (Table VI2) According to parents 15 percent had low social emotional competence
When the two domains are combined the data show that according to parents 43 percent of DLLs screened positive (had high problem behaviors or low social-emotional competence) indicating a delay in social-emotional development According to teachers and home visitors however 25 percent of 1-year-old DLLs in Early Head Start screened positive (Table VI2)
C DEVELOPMENTAL PROGRESS OF DLLS IN HEAD START
FACES data provide three snapshots of DLLs one of all DLLs entering Head Start in Fall 2006 another of the DLLs who were still enrolled in the spring of their Head Start exit year and finally another of DLLs who were still enrolled in the spring and have valid comparable data at Head Start entry and exit In the snapshot of children at Head Start entry we can describe developmental status in several areas but aspects requiring direct child assessments (eg letter word identification vocabulary math skills) are limited to children who could achieve basal scores on English or Spanish assessments (after routing based on the language screener) Descriptions of children who remained enrolled (spring 2007 for the children who enrolled as 4shyyear-olds and Spring 2008 for those who enrolled as 3-year-olds) reflect developmental status at Head Start exit of children who achieved basal scores on direct assessments in the spring Most of the children who stayed until the spring and had not achieved basal at Head Start entry did achieve basal scores by Head Start exit The final snapshot portrays growth across developmental domains from Head Start entry to exit among the subset of children who completed the entire assessment battery in the same language at both time points However we can describe growth in childrens accomplishments social skills and problem behaviors based on parent and teacher reports regardless of home language routing or basal scores on direct assessments Key findings describing the progress of DLLs in Head Start are summarized below
DLLs increase their receptive English vocabulary during Head Start but they begin and end their Head Start year(s) with receptive English vocabulary well below national norms The PPVT-4 scores of DLLs who entered Head Start in fall 2006 averaged 72 (nearly two standard deviations below the norm) (Table VI3) The average PPVT-4 score of DLLs remaining in Head Start in the spring of their exit year was about the same relative to their same -age peers (Table VI4) Among children with comparable data at entry and exit however PPVT-4 scores increased from 72 to 80 (Table VI5) PPVT-4 Growth Score Values which are absolute scores that are comparable over time show that average receptive English vocabulary among DLLs was 85 among new Head Start entrants and 103 among all DLLs who remained in Head Start in spring of their exit year (Tables VI3 VI4) Among children with comparable data at entry and exit scores increased from 86 to 107 (Table VI5)
DLLs begin and end Head Start with receptive Spanish vocabulary below national norms DLLs who were assessed in Spanish using the TVIP in fall of 2006 received an average score of
Report to Congress on DLLs in Head Start Page | 80
85 about one standard deviation below the norm (Table VI3) The average score on the TVIP among DLLs who were assessed in Spanish in spring of their Head Start exit year was approximately the same (82) indicating that DLLs receptive Spanish vocabulary did not change relative to children their age (Table VI4) Among children with valid scores at Head Start entry and exit (ie all Spanish speakers who achieved basal score regardless of which language they were routed to for the cognitive assessment battery) TVIP scores decreased slightly from 86 to 83 (Table VI5)
By the end of Head Start DLLs assessed in English demonstrate English letter-word knowledge and spelling skills near the norm for their age Those assessed in Spanish demonstrate Spanish letter-word knowledge and spelling skills that are about one standard deviation below the (monolingual Spanish-speaking) norm DLLs who entered Head Start in Fall 2006 and were assessed in English using the WJ-III Tests of Achievement received an average score on the Letter-Word Identification subtest of 93 and an average score on the Spelling subtest of 94 approximately half of a standard deviation below the norm (among monolingual Spanish-speaking children their age) (Table VI3) The average scores on the WJ-III Letter-Word Identification subtest and Spelling subtest among DLLs who were assessed in English at the end of Head Start were 98 and 99 indicating that DLLs letter-word knowledge and spelling skills improved relative to children their age (Table VI4) Among DLLs with comparable data at entry and exit the WJ-III Letter-Word Identification and Spelling subtest scores increased from 93 or 94 to 100 reflecting the norm for their age (Table VI5)
DLLs entering Head Start in fall 2006 who were assessed in Spanish using the WM-III Tests of Achievement received average scores on the Letter-Word Identification and Spelling subtests of 79 and 88 just below and above one standard deviation below the norm (Table VI3) Among DLLs who were assessed in Spanish at the end of Head Start the average score on the Spanish WM-III Letter-Word Identification subtest increased (83) indicating that DLLs Spanish letter-word knowledge improved relative to monolingual Spanish-speaking children their age to about one standard deviation below the norm (Table VI4) However the average score on the WM-III Spelling subtest was somewhat lower (85) indicating that DLLs Spanish spelling skills declined slightly relative to children their age (Table VI4) Among DLLs who completed the Spanish assessments at entry and exit the WM-III Letter-Word Identification subtest scores increased from 74 to 85 and Spelling subtest scores decreased from 89 to 85 reflecting progress in letter-word knowledge and a slight decline in spelling relative to same-age peers (Table VI5)
By the end of Head Start DLLs assessed in English demonstrate math skills near the norm for their age Those assessed in Spanish demonstrate math skills a half standard deviation below the norm DLLs who entered Head Start in Fall 2006 and were assessed in English scored about one standard deviation below the mean of the norming population on the WJ-III Applied Problems subtest (Table VI3) DLLs assessed in English at the end of Head Start received an average score of 85 indicating that DLLs kept up with their monolingual English-speaking same age peers but did not improve beyond that (Table VI4) Among DLLs with valid English test scores at both time points the average WJ-III Applied Problems subtest score remained about the same (86 in Fall 2006 and 88 in spring of the Head Start exit year Table VI5)
Report to Congress on DLLs in Head Start Page | 81
DLLs who were assessed in Spanish in fall 2006 received an average score on the WM-III Applied Problems subtest of 82 slightly more than one standard deviation below the mean in the norming population (Table VI3) t the end of Head Start DLLs average score on the WM shyIII Applied Problems subtest was 75 about one-and-a-half standard deviations below the norm indicating that DLLs who entered Head Start in Fall 2006 and were assessed in Spanish in the spring of their exit year did not keep up with their same age peers in the norming sample (Table VI4) Among the small number of DLLs with valid Spanish test scores at both time points the average WM-III Applied Problems subtest score increased from 75 to 81 (Table VI5)
ECLS-B Math IRT scores and NumberShape Proficiency Probability scores show that DLLs math skills improved by the end of their Head Start exit year The average ECLS-B Math IRT score 16 increased from 72 (out of 44) in fall 2006 to 111 in the spring of 2007 or 2008 (Tables VI3 and VI4) Among DLLs with valid scores at both time points the average score increased from 73 to 119 (Table VI5) The average ECLS-B NumberShape Proficiency probability score increased from 023 in fall 2006 to 060 in the spring of 2007 or 2008 meaning that 23 percent of DLLs demonstrated mastery of number and shape recognition at Head Start entry while 60 percent of DLLs were able to do so by Head Start exit (Tables VI3 and VI4) Among DLLs with valid scores at both time points the average score increased such that 24 percent had mastered number and shape recognition at entry and 67 percent did so by Head Start exit (Table VI5)
DLLsrsquo pre-reading skills increase during Head Start The average Story and Print Concepts IRT score among DLLs entering Head Start in Fall 2006 was 33 (out of 9 possible) (Table VI3)17
Among DLLs remaining in their program the average score at Head Start exit was 55 (Table VI4) Among DLLs with valid scores at entry and exit the Story and Print Concepts IRT score increased from 38 to 60 (Table VI5)
DLLsrsquo literacy skills increase during Head Start According to parents when they entered Head Start in fall of 2006 DLLs had mastered an average of 2 out of 5 skills specified (recognizing letters counting writing or pretending to write writing their own name and identifying colors by name) (Table VI6) By the end of Head Start they had mastered 4 out of these 5 skills (Table VI7) According to teachers when they entered Head Start in fall 2006 DLLs had mastered 27 out of 7 literacy skills (Table VI6) At the end of Head Start DLL had mastered 55 of those skills (Table VI7)
16 The ECLS-B math IRT scores represent estimates of the number of items children would have answered correctly
if they had taken all 44 items of the ECLS-B preschool national scorable questions 17
The Story and Print IRT scores represent estimates of the number of items children would have answered correctly if they had taken all 9 items of the Story and Print Concepts measure
Report to Congress on DLLs in Head Start Page | 82
Report to Congress on DLLs in Head Start Page | 83
Report to Congress on DLLs in Head Start Page | 84
DLLsrsquo approaches to learning are comparable to their peers in Head Start According to teachers DLLs attitudes toward learning competence and motivation and attention and persistence were similar to those of other children entering Head Start in Fall 2006 and at the end of Head Start with average T-scores on the Preschool Learning Behavior Scale (PLBS) of approximately 51 in Fall 2006 and 54 in spring of their exit year (Tables VI8 and VI9) Similarly parents ratings of DLLs approaches to learning were stable over time (118-126 out of a possible 16 Tables VI8 and VI9)
Teacher reports suggest that DLLsrsquo behavior problems may decline during Head Start however parent reports remain the same Total numbers of behavior problems reported by parents and teachers of DLLs were similar on average in fall of 2006 (66 reported by parents [out of 24 possible] and 65 reported by teachers [out of 36 possible]) (Table VI8) At the end of Head Start the average number of behavior problems reported by parents remained similar (61) while teachers reported fewer problems on average (41) declined to 61 reported by parents and 41 reported by teachers (Table VI9) Among DLLs with data at both time points parent reports were similar at both time points (65 and 62) but teacher reports indicated fewer behavior problems on average at the end of Head Start (42 vs 62) (Table VI10)
DLLsrsquo cognitive-social skills remain more than half a standard deviation below the norm at the end of Head Start According to the Leiter-R Examiner Rating Scales of childrens cognitive-social development (attention organization and impulse control activity level and sociability) completed by assessors DLLs received an average score of approximately 88 in the fall of 2006 and 91 when they completed Head Start (Tables VI8 and VI9) suggesting that DLLs remained behind their peers in these areas Similarly among DLLs with valid data at both time points average scores increased slightly from 89 to 91 remaining more than half a standard deviation below the norm (Table VI10)
Report to Congress on DLLs in Head Start Page | 85
Report to Congress on DLLs in Head Start Page | 86
Weight problems increase dramatically among DLLs during Head Start Based on the Body Mass Index (BMI) calculated from their height and weight more than one-third of DLLs are overweight or obese at Head Start entry and by the spring of their Head Start exit year nearly half are overweight or obese BMI values were at or above the 85th percentile for age and gender (indicating overweight or obesity) for 38 percent of DLLs at the time of Head Start entry in fall 2006 and 48 percent of DLLs when they completed Head Start (Tables VI11 and
VI12) Similarly among DLLs with valid data at both time points the percentage overweight or obese increased from 37 percent in fall 2006 to 47 percent at the end of Head Start (Table VI13)
Despite increased weight problems most parents of DLLs report that their child is in excellent health At the beginning of Head Start 65 percent of parents of DLLs rated their childs health as excellent while 9 percent rated their childs health as fair or poor (Table VI14) By the spring of their exit year 70 percent of parents of DLLs rated their childs health as excellent and 7 percent rated their childs health as fair (Table VI15) mong DLLs with valid data at entry and exit the percentage of DLLs reported by their parents to be in excellent health was stable (67 to 69 percent Table VI16)
DLLs often come from homes in which the literacy environment is not rich At the beginning of Head Start DLLs lived in homes with an average of 19 childrens books and one-third of DLLs had a family member who read to them daily (Table VI17) By the end of Head Start DLLs lived in homes with an average of 25 childrens books and 35 percent of DLLs had a family member who read to them daily (Table VI18) At the end of Head Start 22 percent of their parents reported that they read themselves every day down from 27 percent at the beginning of Head Start (Tables VI19 and VI20) At the end of Head Start parents of DLLs reported doing 94 out of 11 learning activities with their child on average up from an average of 87 at the beginning of Head Start (Tables VI21 and VI22)
Report to Congress on DLLs in Head Start Page | 87
D DEVELOPMENTAL PROGRESS OF DLLS COMPARED WITH CHILDREN FROM MONOLINGUAL ENGLISH HOMES
Putting the development of DLLs into the context of their peers from monolingual English homes makes it possible to gauge the status of DLLs in Early Head Start and the progress of DLLs in Head Start and determine the extent to which DLLs exhibit special needs and strengths The status of DLLs in Early Head Start and the experiences of DLLs in Head Start compared with children from monolingual English homes are described in detail below
These data show that when Head Start receives children DLLs lag behind children from monolingual English homes in some developmental areas and all children lag behind their peers in the population in many areas Neither DLLs nor children from monolingual English homes lose ground during Head Start on average relative to their age peers in the norming population but neither do they usually catch up if they start Head Start behind DLLs enter Head Start with a disadvantage in some developmental areas (pre-academic achievement) relative to children from monolingual English homes and typically their gains are similar so they end their Head Start exit year(s) with a similar relative disadvantage on average In some areas such as English language development (specifically vocabulary and letter word identification) and learning behaviors (specifically attitude toward learning and attentionpersistence) their gains are greater during their Head Start year relative to their monolingual English peers however they remain below their age peers in the norming population and their monolingual English peers in Head Start In other developmental areas (social-emotional development) the FACES data show no differences between DLLs and children from monolingual English homes in their status at Head Start entry or in their developmental progress during Head Start One exception to these patterns is childrens physical health and developmentmdashDLLs are more likely than children from monolingual English homes to be overweight or obese and weight problems increase during Head Start
1 Relative Progress of DLLs in Early Head Start
1-year-old DLLs understand and use fewer English words than children from monolingual English homes DLLs understood 22 English words and used 1 English word on average while children from monolingual English homes understood 33 English words and produced 4 words on average (Table VI1)
When vocabulary in English and Spanish is considered DLLs comprehend more words than children from monolingual English homes According to their Early Head Start teachershome visitors 1-year-old DLLs in Early Head Start in spring 2009 understood 41 words in English or Spanish while children from monolingual English homes understood 33 words in English (Table VI1) DLLs understood as many words in Spanish as children from monolingual English homes understood in English (36 and 33 words respectively)
Similar proportions of DLLs and children from monolingual English homes may have a delay in social-emotional development Teachershome visitors of DLLs and teachershome visitors of children from monolingual English homes both rated 25 percent of the children as
Report to Congress on DLLs in Head Start Page | 88
having high problem behaviors or low social-emotional competence (Table VI2) Parents of DLLs and parents of children from monolingual English homes provided less consistent ratings Parents of DLLs were more likely than parents of children from monolingual English homes to give ratings indicating their child had a delay in social-emotional development (43 percent compared with 29 percent Table VI2)
2 Relative Progress of DLLs in Head Start
DLLs and children from monolingual English homes gain receptive English vocabulary during Head Start but they enter and leave Head Start with receptive English vocabulary below national norms regardless of home language PPVT-4 growth scores show that DLLs and children from monolingual English homes increased their receptive English vocabulary by similar amounts between fall of 2006 and the spring of their Head Start exit year Yet when they entered Head Start the PPVT-4 scores of children from monolingual English homes averaged nearly one standard deviation below the norm (88) and the scores of DLLs averaged 72 (nearly two standard deviations below the norm) (Table VI3) Average PPVT-4 scores of both DLLs and children from monolingual English homes increased slightly by spring of childrens Head Start exit year (92 for children from monolingual English homes and 77 for DLLs) indicating that the children made slight gains relative to their age peers in English vocabulary development (Table VI4) Among children with valid data at both time points however it appears that DLLs made greater gains during the Head Start year relative to their peers from monolingual English homes (DLLs increase from 718 to 798 monolingual English increase from 874 to 919) (Table VI5)
DLLs with adequate English language skills resemble their peers from monolingual English homes in their English letter-word knowledge and spelling skills and they experience similar gains over time DLLs with adequate English language skills to pass the English language screener started Head Start approximately one-half of a deviation behind their age peers in the norming population and by the spring of their Head Start exit year had letter-word knowledge similar to their age peers (Tables VI3 and VI4)
DLLs regardless of language improved their math skills beginning and ending Head Start similarly behind their age peers as children from monolingual English homes According to the WJ-III Applied Problems subtest neither DLLs nor children from monolingual English homes gained relative to their age peers in the norming population However similarly substantial gains were made in the ECLS-B Math IRT and NumberShape Proficiency probability scores among both DLLs and children from monolingual English homes (Tables VI3 and VI4)
According to teachers and parents DLLs and children from monolingual English homes have similar literacy skills at the beginning and end of Head Start Teachers reported on average that DLLs and children from monolingual English homes entering Head Start in fall 2006 had mastered 26 to 27 out of 7 literacy skills and both groups ended their Head Start year(s) with 55 literacy skills (Tables VI6 and VI7) Parents reported on average that DLLs and children from monolingual English homes entering Head Start in fall 2006 had mastered
Report to Congress on DLLs in Head Start Page | 89
about 2 out of 5 literacy skills and both groups ended their Head Start year(s) with about 4 out of the 5 literacy skills (Tables VI6 and VI7) A similar pattern is evident in the Story and Print Concepts Scale IRT scores which describe childrens pre-reading skills (average scores increased from 33 to 55 [out of 9 possible] among DLLs and 36 to 61 among children from monolingual English homes between Fall 2006 and the spring of the Head Start exit year) (Tables VI3 and VI4)
The approaches to learning of DLLs and children from monolingual English homes are the same on average Average PLBS scores reported by teachers at the beginning and end of the Head Start year(s) are very near the mean of the Head Start population in both groups and over time (Tables VI8 and VI9) Similarly parent ratings of their childs approaches to learning are similar on average across groups and over time ranging from 118 to 126 out of 16 possible (Tables VI8 and VI9)
Compared with children from monolingual English homes DLLs come from less literacy-rich home environments When they entered Head Start in Fall 2006 DLLs came from homes with 19 childrens books on average less than half as many books as in the homes of children from monolingual English homes (47 childrens books on average) (Table VI17) Moreover 33 percent of DLLs were read to daily by a family member compared with 40 percent of children from monolingual English homes (Table VI17) During the Head Start year(s) the average number of books increased in all homes but remained much higher in monolingual English homes (54 compared with 25 books Table VI18) The percentage of children from homes in which a family member read to them daily was similar among DLLs and children from monolingual English homes in the spring of the Head Start exit year (35 percent to 37 percent Table VI18) Some activities with family members that might contribute to literacy and numeracy skills were less prevalent in the homes of DLLs than monolingual English homes in the spring of the Head Start exit year(s) including working with the child on arts and crafts (59 percent vs 72 percent respectively) involving the child in household chores (86 percent vs 97 percent) and talking about TV programs or videos (74 percent vs 83 percent) (Table VI22)
According to teachers DLLs exhibit fewer behavior problems than children from monolingual English homes on average both when they enter Head Start and at the end of their Head Start exit year(s) However according to parents DLLs exhibit more behavior problems On average teachers report fewer behavior problems among DLLs than among children from monolingual English homes especially at Head Start exit (65 for DLLs vs 72 at the beginning of Head Start and 41 vs 63 in the spring) In contrast parents of DLLs on average perceive greater problem behaviors in their children than parents from monolingual English homes at both time points (66 vs 55 out of 24 possible at the beginning of Head Start and 61 vs 51 in the spring) (Tables VI8 and VI9)
The cognitive-social skills of DLLs and children from monolingual English homes are similar between groups and over time ssessor ratings of childrens cognitive-social development (attention organization and impulse control activity level and sociability) using the Leiter-R show that both DLLs and children from monolingual English homes demonstrated
Report to Congress on DLLs in Head Start Page | 90
cognitive-social skills that lagged behind their age peers in the norming population by between one-half and one standard deviation both when they entered Head Start and in the spring of the Head Start exit year(s) (Tables VI8 and VI9)
The extent of weight problems increases among DLLs but not children from monolingual English homes during Head Start Approximately one-third of children from monolingual English homes who entered Head Start in Fall 2006 were overweight or obese based on their Body Mass Index (BMI) and a similar proportion of those who completed Head Start were overweight or obese In contrast 38 percent of DLLs entered Head Start with a BMI that put them in the overweight or obese category and nearly half of those who completed Head Start were in that category (Tables VI11 and VI12)
Although among DLLs who were stayers more DLLs were overweight at the end of Head Start than at the beginning (189 percent at entry vs 271 percent at exit) a similar percentage was obese (20-21 percent) at the beginning and end of Head Start The percentage who were overweight or obese among children from monolingual English homes was also constant over time (179 percent to 172 percent overweight 14 percent to 15 percent obese) (Table VI13)
Parents of DLLs rate their childrenrsquos overall health less positively than parents from monolingual English homes Parents of DLLs who entered Head Start in Fall 2006 were less likely than parents from monolingual English homes to rate their childs health as excellent or very good in Fall 2006 (65 percent compared with 81 percent) and in the spring of their childs Head Start exit year (70 percent compared with 82 percent) (Table VI14 and VI15)
Report to Congress on DLLs in Head Start Page | 91
CHAPTER VII DISCUSSION
The analyses conducted to answer the questions posed by Congress in the Head Start Act together provide an important picture of DLLs the services they receive in Early Head Start and Head Start and their developmental progress during their enrollment This picture is not perfect and it is important to remain aware of the limitations of the data These limitatio ns point to directions for future research to refine the picture
A WHAT THE DATA TELL US ABOUT DLLS IN EARLY HEAD START AND HEAD START
DLLs have different strengths and needs than children from monolingual English homes and some available data on services reflect these differences Most DLLs have parents who were born outside the US (mostly in Mexico) the majority of whom have been in the US for less than 10 years and do not understand English well or at all In Early Head Start DLLs were more likely than children from monolingual English homes to be in programs offering English language services (such as assessment of English ability information about adult ESL) their parents were more likely to have received several literacy and language-related services (eg literacy training English classes) and health services in the past year and their parents reported higher involvement in many program activities In Head Start DLLs were more likely to belong to a family in which a family member attended ESL classes
DLLs are more likely than children from monolingual English homes to live with two parents The majority of children live with parents who have not completed high school or a GED Most live with at least one employed parent yet most are living in poverty In contrast children from monolingual English homes are more likely to have parents who have completed high school or a GED less likely to have parents who are working more likely to have parents who are receiving public assistance and more likely to have parents who report symptoms of depression Children from monolingual English homes are more likely than DLLs to have a mother who is currently enrolled in a program course class or workshop
As for children from monolingual English homes the data paint a mixed picture of classroom features and quality for DLLs in Early Head Start and Head Start Average group sizes and child-adult ratios are well below the maximum specified in the Head Start Program Performance Standards and in Head Start classroom observations showed that lead teachers typically demonstrate sensitivity responsiveness and encouragement in their interactions with children The average classroom environment in both Early Head Start and Head Start however was rated in the minimal to good range and in Head Start teachers instructional support was rated low The average features and quality of classrooms of children from monolingual English homes are very similar to those of DLLs
Early Head Start home visits with DLLs include many different kinds of activities and on average two-thirds of home visit time are spent on child-focused and parent-child-focused activities The quality of observed home visits was rated as slightly above adequate on average Although the pattern of activities during the home visits with DLLs and children from monolingual English homes vary the quality of the home visits that were observed was very similar DLLs are more likely to receive home-based services (including family child care) than
Report to Congress on DLLs in Head Start Page | 92
the other options and it is unclear what drives this pattern Are the programs serving DLLs more likely to offer home-based services If so is this pattern a response to the interest and needs expressed by families in these service areas are families of DLLs more likely to select this option or does this reflect the resources available in these areas The higher prevalence of home-based services among DLLs warrants attention and at the very least additional exploration
DLLs in Head Start like their peers from monolingual English homes demonstrate developmental progress during Head Start DLLs in Head Start lag behind children from monolingual English homes in some developmental areas and all Head Start children lag behind their age peers in the population in many areas DLLs enter Head Start with a disadvantage in some developmental areas (pre-academic achievement) relative to children from monolingual English homes and typically their gains are similar so they end their Head Start exit year(s) with a similar relative disadvantage on average In other developmental areas (social-emotional development) the data show no differences between DLLs and children from monolingual English homes in their status at Head Start entry or in their developmental progress during Head Start However in some areas (English vocabulary development approaches to learning cognitive-social skills) DLLs appear to make greater gains during their time in Head Start than their peers from monolingual English homes One concerning exception to these patterns is childrens physical health and developmentmdashDLLs are more likely than children from monolingual English homes to be overweight or obese and their weight problems increase during Head Start
B LIMITATIONS OF THE DATA
As discussed at length in Chapter I the data available for addressing questions posed by Congress have some important limitations First children in MSHS and Head Start programs in US territories are not included in available data sources that include assessments of developmental status or progress The children enrolled in MSHS programs represent approximately 3 percent of all enrolled children but nearly 10 percent of all DLLs Second the available data for Early Head Start children provide only a snapshot of their developmental status and do not yet permit an examination of the progress children make during Early Head Start
Third because of limitations in the state of the field the assessments of children in Head Start may not fully or accurately capture their competencies or progress in language or other domains of development Focusing on one domain as an example fair and accurate assessment of the language development of DLLs should reflect the characteristics of DLLs (including their stage of English acquisition and their home literacy environment) and capture overall language competence with attention to both the first and second languages (Espinosa 2008) In FACES children were assessed in English if they passed a screener indicating minimum ability in English otherwise if they were Spanish-speakers they were assessed in Spanish Thus for DLLs who were not Spanish-speakers and did not show minimum ability in English their language skills were assessed in only one languagemdashEnglish and comparisons with children from monolingual English homes may be unfair
Report to Congress on DLLs in Head Start Page | 93
About half of Spanish-speaking DLLs in Head Start were assessed with the English cognitive battery in Fall 2006 but by the end of Head Start nearly all were assessed in English Thus the samples for describing cognitive abilities (including readingliteracy skills and ability to solve math problems) are different at the beginning and end of Head Start and the descriptions of developmental progress confound progress of individual children with changes in the composition of children assessed in each language at the beginning and end of Head Start
Finally data were not available to answer some of the questions posed in the Head Start Act On the nature of services offered to children and families we are not able at this time to describe the content duration and intensity of all types of services in as much detail as desired Moreover the discussion of progress among children who are dual language learners and their families enrolled in Head Start programs is limited by the state of the field more broadly in the area of assessment of young dual language learners and in the area of identification and measurement of family processes for these families This report provides as much information as the available data and existing methods can reliably address
Several ACF-funded research efforts are addressing the gaps in research on this population and the questions posed in the Head Start Act As discussed in Chapter I many of the limitations and challenges found in national research studies on Head Start programs reflect gaps in the field of research on early childhood more generally as well as challenges specific to national studies of young children The level of information necessary to answer questions about the unique experiences and development of young dual language learners is difficult to capture in a study that must address the experiences of all children regardless of their language background Further solid measures of many of the constructs identified as important for understanding young childrens development and their experiences in early childhood programs have not been developed assessed andor shown to be valid and reliable for young DLLs
The efforts undertaken by ACF to improve information on children who are dual language learners include a combination of adjustments to the instruments and methods used in national surveys but ndash more substantially ndash efforts to launch supplemental research projects to gather more detailed information on key populations of dual language learners in Head Start and to build capacity in the research field to provide better information regarding the development needs and strengths of young DLLs The activities that ACF has undertaken to increase and improve its data on children who are dual language learners are described briefly below These include efforts to improve the data collected in existing studies launching new studies to gather information about key populations of dual language learners not included in previous studies and supporting the development of new curricula and assessment tools for dual language learners and their families These efforts include
Roundtable meeting titled Supporting Positive Language and Literacy Development in Young Language Minority Children Research Policy and Practice This research roundtable held in Washington DC in April 2008 was a working meeting where invited speakers and participants engaged in critical dialogue regarding how research can support efforts of policy makers and practitioners to serve the language and literacy needs of young language minority children1 The
Report to Congress on DLLs in Head Start Page | 94
1
2
central goal of the meeting was to gain a better understanding of how available research can or cannot presently inform policy and practitioner concerns The roundtable discussions were unique in that they highlighted research issues specific to the needs of programming and policy audiences Several federal agencies and prominent researchers in the field assisted in planning the content of the meeting The roundtable culminated in a report highlighting key research issues and questions that arose from the roundtable meeting on the topic of how research can support positive language and literacy outcomes for young language minority children
Revisions to national surveys to improve the data collected about young children who are dual language learners and the programs that serve them Advances in approaches to data collection are being implemented in the 2009 FACES cohort and in Baby FACES in order to enhance our understanding of dual language learners development
a Head Start Family and Child Experiences Survey (FACES) For the first time FES 2009 is assessing childrens expressive vocabulary using a bilingual (English and Spanish) conceptually scored measure in order to understand the totality of childrens expressive vocabulary (regardless of which language) The study has expanded its assessment battery to include a direct measure of executive functioning that does not rely on English language proficiency and can be administered in any language In FACES 2009 for the first time executive function is being assessed directly among children who can speak English or Spanish The parent and staff interviews in FACES 2009 which completed baseline data collection in Fall 2009 and the first follow-up of the sample in Spring 2010 will increase our knowledge of the home languages classroom language experiences and program services of children who are DLLs
Questions added to the FACES parent interview gather much more detail on the childrens exposure to multiple languages in the home including the degree of exposure to various languages in the home and literacy materials and media in different languages The interview also asks parents about such topics as their satisfaction with the support the program provides for their childrens development both in English and their home language
Likewise interviews with Head Start staff in the FACES study have been enhanced in 2009 in order to gather more information about the language experience children have in their classrooms the services programs offer to DLLs and the representation of multiple languages in the classroom Head Start teachers are asked about the number of children who are DLLs in the classroom the languages spoken by these children and the languages the teachers use when reading books to and talking with groups of children Additional items to capture teachers proficiency in languages other than English have also been included in the FACES 2009 teacher survey Items have also been added to the program director survey regarding services in support of the transition to kindergarten
Report to Congress on DLLs in Head Start Page | 95
In addition FACES is undergoing an extensive redesign in order to permit deeper examinations of specific topics of interest in a nationally representative sample of Head Start programs Beginning in 2014 it is expected that FACES will collect general descriptive information about families and children enrolled in Head Start and about programs and staff and it will utilize topically focused survey modules to collect more detailed information in areas of particular interest such as the services provided by Head Start programs This survey design is similar to that of other national datasets such as the National Household Education Surveys Program (NHES) and the Survey of Income and Program Participation (SIPP)
b Early Head Start Family and Child Experiences Survey (Baby FACES) Future waves of data collection from Baby FACES will provide information on the developmental progress of infants and toddlers in Early Head Start including their cognitive language social-emotional and health outcomes Conceptual scoring will be used to better assess young childrens total vocabulary development Later waves of the study will provide more comprehensive information on the program experiences of children (including children who are DLLs) who entered Early Head Start before 1 year of age
3 A research center focused on improving our knowledge and understanding of how best to support the development of dual language learners in early childhood care and education programs The Center for Early Care and Education Research Dual Language Learners (CECER-DLL) is a cooperative agreement awarded in 2009 to the University of North Carolina-Chapel Hill The primary goal of the Center is to advance the research field to improve assessment child care and education for children who are dual language learners (DLLs) from birth through five years of age This center is pursuing a focused agenda of research and national leadership activities that aim to (a) improve the state of knowledge and measurement in early childhood research on young DLLs and the needs of their families as these relate to childrens development and (b) identify and advance the evidence base for the best practices and strategies in early care and education programming to support the overall development of young DLLs and to effectively support their families In addition to building capacity in the field to reach long-term goals of improving assessment and programming CECER-DLL collaborates with OHS to support professional development initiatives including working with the National Center on Cultural and Linguistic Responsiveness to communicate research reviews to trainingtechnical assistance and program staff
4 University Partnership grants designed to improve understanding of efforts to support dual language learners in Head Start programs The Head Start University Partnerships grant program funds research projects that are planned in close collaboration with Head Start programs Previous rounds of University Partnership grants have focused on topics such as interventions and child assessment With this round of grants awarded in fiscal year 2007 ACF required a focus on dual language learners Eight university-based research teams have been working with Head Start
Report to Congress on DLLs in Head Start Page | 96
and Early Head Start programs to develop and examine interventions and assessments and to expand the knowledge base regarding the culture and school readiness of children from homes where a language other than English is spoken For example one project developed a new language assessment instrument for toddlers exposed to multiple languages and created a tool to facilitate teachers ongoing assessment of toddlers language development nother project developed a culturally-informed home-based early literacy intervention to support Latino parents in fostering their DLL childrens language and literacy
5 A design is under consideration for a new study of Migrant and Seasonal Head Start The Migrant and Seasonal Head Start Survey Design Project field tested and developed recommendations for a survey of Migrant and Seasonal Head Start programs and the children and families they serve The Design for Migrant and Seasonal Head Start Survey Final Design Report is published and ACF anticipates that this will provide the basis for future studies of MSHS programs18
6 Compendium of assessments and developmental screeners for children ages 3-5 To support programs use of reliable and valid early childhood assessments and developmental screeners that are appropriate for the populations they serve ACF developed a technical summary of 8 commonly used child assessments and 10 developmental screening tools The compendium is designed as a resource for managers and staff who work in different types of early childhood education programs and who are responsible for selecting and evaluating assessment or screening instruments More generally this resource also aims to increase awareness about reliability and validity and how to evaluate whether an instrument is appropriate for the population and purpose for which it will be used The volume includes information regarding the appropriateness of the measures for young DLLs
7 Research center focused on children and families in tribal Head Start programs Through a cooperative agreement with the University of Colorado at Denver Health Sciences Center ACF funds a Head Start American Indian Alaska Native Research Center The purpose of the Center is to provide leadership and offer support in the development and facilitation of local Head Start research and to strengthen the ability of local researchers to conduct model research projects in collaboration with Head Start American Indian and Alaska Native program staff and members of tribal communities
The Center engages in a variety of activities designed to promote excellence in early childhood research make a significant contribution to the knowledge base improve research capacity and provide leadership and support for research on the early development of American Indian and Alaska Native children Activities currently include the support of three local research partnerships between universities and tribal Head Start programs Michigan State University and the Intertribal Council of Michigan Arizona State University and Gila River and Oregon State University and
18 The final report is available online at httpwwwacfhhsgovprogramsoprehsmigrant_mshsindexhtml
Report to Congress on DLLs in Head Start Page | 97
the Confederated Tribes of Warm Springs The Center also supports training fellowships that assist in the professional development of researchers who are interested or have worked on Head Start and early childhood Native American research
In addition the Center is currently conducting a cross-site study of American Indian Alaskan Native Head Start programs The goal of the cross-site study is to determine how well research measures and methods used in Fs large national studies (such as FACES and Baby FACES) work with AIAN Head Start and Early Head Start children families and classrooms This effort will also examine measures that were missing from these studies that would allow for a full understanding of how IN childrens development proceeds within the context of family and Head StartEarly Head Start Another goal of the study is to work through the logistical challenges of working in diverse tribal communities with a common set of measures in order to provide guidance to future studies in navigating these complexities From the beginning of the study a community-based participatory approach has been implemented A steering committee comprised of tribal Head Start directors from across the country has guided the overall selection of measures and study design while detailed work with representatives from the participating communities has informed the site-specific details needed to make the work a success on the ground In all 5 tribal communities from across the country are participating in the study representing a diverse sampling of tribal cultures and geographies
While research activities are in progress to address the limitations and gaps in existing data concerning young children who are dual language learners ACF is also implementing several programmatic initiatives to improve services to DLLs and their families In addition to the requirement of this report there were many implications for DLLs in the Improving School Readiness Act of 2007 that helped frame and promote the following efforts to increase support for centers and staff to better serve children who are dual language learners and their families
1 In early 2008 the Office of Head Start published Dual Language Learning What Does it Take Head Start Dual Language Report Based on an assessment of program needs opportunities and barriers this report provides suggestions and recommendations for programs to better serve culturally and linguistically diverse children and families The report includes description of existing resources for programs and innovative approaches among Head Start agencies for ensuring positive outcomes enhancing family involvement strengthening program and professional development and building community resources
2 The urgent needs of programs and the requirements of the Head Start Act paved the way for the Office of Head Start National Dual Language Institute A Time for Action in Washington DC October 28-31 2008 Over 1500 program directors and managers teacher and parent leaders and other staff from Head Start Early Head Start Migrant and Seasonal Head Start and American IndianAlaska Native Head Start programs attended the Institute where 94 sessions showcased practice
Report to Congress on DLLs in Head Start Page | 98
strategies applied research innovative collaborations and responsive policies The goals of the Institute were to
Emphasize sections of the Head Start Act as well as existing Head Start Program Performance Standards in the area of dual language learning
Highlight research on dual language acquisition in children birth to five and its implications for practice
Discuss the importance of dual language learning including the acquisition of English language revitalization and cultural responsiveness as they relate to school readiness and positive outcomes for children
Provide tools and resources for programs to effectively support dual language learners and their families
Demonstrate and disseminate methods approaches and instructional practices for programs to effectively serve DLL children families and their communities
The Institute was designed with the intent that participants would return to their programs ready to take action to better serve dual language learners and their families
3 Ready for Success Supporting Dual Language Learners in Head Start and Early Head Start is a professional development series intended to help programs support the healthy development and learning of DLLs The series addresses OHS priorities as well as recommendations from attendees at the 2008 Dual Language Institute Throughout 2009-2010 webcasts and webinars were released monthly focusing on strengthening the continuous quality improvement of program systems and services to support and respond to DLLs ages birth to five The first webcast was viewed in 813 different sites with over 2000 individual viewers (Available at httpeclkcohsacfhhsgovhslctta-systemcultural-linguisticDual percent20Language percent20Learnersprof_devconferencesReadyforSuccesshtm)
4 The Multicultural Principles for Head Start Programs Serving Children Ages Birth to Five were updated and enhanced and translated into Spanish The publication describes 10 principles related to individualized services for both children and families Created for grantee program directors staff and the general public the guidelines presented can be incorporated into daily activities to ensure that every member of the Head Start community is respected and able to grow in an environment which is appreciative of individual differences (Available at httpeclkcohsacfhhsgovhslcresourcesECLKC_BookstoreMulticultural percent20Principles percent20for percent20Head percent20Start percent20Programshtm)
5 s part of the dministrations revisions to the Head Start Training and Technical Assistance System a National Center on Cultural and Linguistic Responsiveness
Report to Congress on DLLs in Head Start Page | 99
6
(NCCLR) was awarded in 2010 This center was established to provide the Head Start community with research-based information practices and strategies to ensure optimal academic and social progress for linguistically and culturally diverse children and their families Through user-friendly materials and training the center promotes strong language and literacy skills in childrens home language and in English local program planning that is culturally responsive and development of family resources that are linguistically and culturally appropriate In particular NLR has promoted the importance of supporting childrens home languages by developing tools and guidance to help staff identify and address the language needs of DLLs and their families For example NCCLR has created a guide to assist staff in gathering information from family members regarding a childs language background and guides presenting strategies for teachers to support childrens home and second language development (More information available at httpeclkcohsacfhhsgovhslctta-systemcultural-linguistic)
The Head Start Child Development and Early Learning Framework (Revised Child Outcomes Framework) was revised and published in 2010 Within the revised version there is clear information regarding the importance of gaining an understanding of what children who are dual language learners know and can do across all domains of the framework regardless of language spoken as well as an emphasis on English language development (More information available at httpeclkcohsacfhhsgovhslctta-systemteachingeecdAssessmentChild percent20OutcomesHS_Revised_Child_Outcomes_Frameworkpdf)
C DIRECTIONS FOR THE FUTURE
As the discussions above have highlighted more work is needed to develop improved more accurate assessments of the development of DLLs with stronger psychometric properties culturally validated and normed for the current DLL population in the US (Espinosa and Lopez 2007) The needed work includes at the very least improved assessment strategies and instruments to provide a better picture of DLLs language development across two languages but also basic research to ensure that we understand the development of DLLs in all domains The work to improve assessment and refine definitions among other necessary advances in methodology are ongoing not just under the auspices of ACF but also with support from a variety of federal and private sources and promise to enable research that more clearly describes developmental trajectories and outcomes for DLLs
The research activities discussed above along with the many current efforts in the field should help to enhance our understanding of young children who are dual language learners more generally not only those children served by Head Start programs By helping to establish standards and to make widely available valid tools and methods that support better data about young DLLs these projects ultimately aim to improve the state of knowledge about the best practices and environments to promote the development of young DLLs including children attending MSHS programs and programs in US Territories As these new projects unfold and as additional waves of Baby FACES and FACES data are collected and analyzed a fuller
Report to Congress on DLLs in Head Start Page | 100
assessment of the developmental progress of children in Early Head Start and Head Start both DLLs and children from monolingual English homes will be possible
While research capacity builds to improve our understanding and methods for promoting their development there are opportunities to strengthen the services offered to young DLLs and their families The findings in this report rely on descriptive data therefore we cannot draw causal inferences regarding relationships between the services received and experiences or outcomes among DLLs or their families In some areas such as in program services the implications of the data are stronger and suggest areas for renewed focus or effort in engaging families of DLLS targeting services in culturally sensitive ways improving efforts to address health and nutrition issues such as food insecurity and obesity and developing individual family plans) program activities and workshops and links to community resources in ways that are responsive to familys needs and preferences
In conclusion many efforts are currently underway to strengthen programs staff and the knowledge base to better serve all children and families in Head Start and Early Head Start programs including those who speak languages other than English at home Research activities that are building capacity to answer questions concerning young dual language learners and their families go hand in hand with programmatic efforts to improve services This report explores descriptive data from three current sources to present a comprehensive portrait of the experiences of children who are dual language learners and their families who are being served by Head Start and Early Head Start programs The nature of the data does not permit causal inferences but the data do draw our attention to important disparities and various opportunities to improve services for the substantial and rapidly expanding population of DLLs and their families who have turned to Head Start during this critical period of childrens lives
Head Starts guidance for programs emphasizes the importance of respecting and responding to the individual differences in needs and strengths among children and their families making comprehensive services available to all yet individualizing teaching and family support to promote growth foster new skills and strengthen goals and resources Just as in the definition provided in the Head Start Act this report sheds light on the heterogeneity within a group of families distinguished by their use of language Clearly DLLs and their families share many similar needs with children and families in the linguistic majority however they also tend to bring several meaningfully different needs and strengths that programs should be aware of in order to responsively and more effectively serve
Report to Congress on DLLs in Head Start Page | 101
i Elkin S Augustin R and Thomas D (2007) Findings from the PIR Validation Study Prepared for Department of
Health and Human Services Office of Head Start ii
Elkin S Augustin R and Thomas D (2007) Findings from the PIR Validation Study Prepared for Department of Health and Human Services Office of Head Start
Government Accountability Office (2008) Head Start A More Comprehensive Risk Management Strategy and Data Improvements Could Further Strengthen Program Oversight (GAO-08-221) Washington DC
iii National Research Council (2008) Early Childhood Assessment Why What and How Committee on Developmental Outcomes and Assessments for Young Children CE Snow and SB Van Hemel Editors Board on Children Youth and Families Board on Testing and Assessment Division of Behavioral and Social Sciences and Education Washington DC The National Academies Press
iv Center for Early Care and Education ResearchmdashDual Language Learners (CECER-DLL 2011) Research brief 3 Considerations for future research with young dual language learners Chapel Hill The University of North Carolina FPG Child Development Institute Author
v Center for Early Care and Education ResearchmdashDual Language Learners (CECER-DLL 2011) Research brief 2 Policy and practice issues related to serving dual language learners Summary from listening sessions Chapel Hill The University of North Carolina FPG Child Development Institute Author
vi Administration for Children and Families US Department of Health and Human Services (2008a) Supporting Positive Language and Literacy Development in Young Language Minority Children Research Policy and Practice Summary of Roundtable Meeting April 16-17 2008 Washington DC
Administration for Children and Families US Department of Health and Human Services (2008b) A Working Meeting on Recent School Readiness Research Guiding the Synthesis of Early Childhood Research October 21shy22 2008 Washington DC Meeting sponsored by the US Department of Health and Human Services Office of the Assistant Secretary for Planning and Evaluation and the Administration for Children and Families Office of Planning Research and Evaluation
Espinosa LM amp Lopez ML (2007) Assessment Considerations for Young English Language Learners Across Different Levels of Accountability Report prepared for Pew Task Force on Early Childhood Accountability amp First 5 LA Retrieved from httpwwwpewtrustsorgour_work_report_detailaspxid=31164
vii Government Accountability Office (2006) NO CHILD LEFT BEHIND ACT Assistance from Education Could Help States Better Measure Progress of Students with Limited English Proficiency GAO-06-815 Washington DC
Rabinowitz S amp Sato E (2005) Evidence-Based Plan Technical Adequacy of Assessments for Alternate Student Populations A Technical Review of High-Stakes Assessments for English Language Learners San Francisco CA WestEd
Sato E Rabinowitz S Worth P Gallagher C Lagunoff R amp Crane E (2007) Evaluation of the Technical Evidence of Assessments for Special Student Populations (Assessment and Accountability Comprehensive Center report) San Francisco WestEd
viii Espinosa LM amp Lopez ML (2007) Assessment Considerations for Young English Language Learners Across Different Levels of Accountability Report prepared for Pew Task Force on Early Childhood Accountability amp First 5 LA Retrieved from httpwwwpewtrustsorgour_work_report_detailaspxid=31164
Administration for Children and Families US Department of Health and Human Services (2008c) Supporting Positive Language and Literacy Development in Young Language Minority Children Research Policy and Practice Summary of Roundtable Meeting April 16-17 2008 Washington DC Meeting sponsored by the Administration for Children and Families US Department of Health and Human Services Retrieved from httpwwwacfhhsgovprogramsopreother_resrchlang_minorityindexhtml
ix Fernald A (2006) When Infants Hear Two Languages Interpreting Research on Early Speech Perception by Bilingual Children In McCardle P and Hoff E (Eds) Childhood Bilingualism Research on Infancy through School Age Multilingual Matters Ltd Buffalo
Report to Congress on DLLs in Head Start Page | 102
x Barrueco S Loacutepez ML Ong CA amp Lozano P (2012) Assessing SpanishndashEnglish Bilingual Preschoolers A Guide to Best Approaches and Measures Baltimore MD Brookes Publishing
Bedore LM Pentildea ED Garciacutea M amp Cortez C (2005) Conceptual versus monolingual scoring when does it make a difference Language Speech and Hearing Services in Schools 36(3)188-200
xi Administration for Children and Families (2011) Head Start University Partnerships-English Language Learners httpwwwacfhhsgovprogramsoprehsuniv_ptnerships_engindexhtml For more information view descriptions for two research projects in particular at New York University and University of South Florida
Lopez L Arango L and Feron John (2012) Positive Effects of Home and Classroom Variables on the Development of Bilingual Language Skills in Preschool Latino Children Paper presented at 2012 SRCD Themed Meeting Positive Development of Minority Children in Tampa FL
Melzi G McWayne C and Schick A (2012) Family Involvement and the Emergent Literacy Skills of Dual-Language Latino Children Poster presented at 2012 SRCD Themed Meeting Positive Development of Minority Children in Tampa FL
xii Administration for Children and Families (2009) Baby FACES Summary of Data Collection By Mode All Measures Washington DC US Department of Health and Human Services
xiii Harms T Clifford RM and Cryer D (2005) Early Childhood Environment Rating Scale Revised Edition New York Teachers College Press
xiv Harms T Cryer D and Clifford RM (2002) InfantToddler Environment Rating Scale Revised Edition New York Columbia University Teachers College Press 2002
xv Arnett J (1989) Caregivers in day-care centers Does training matter Journal of Applied Developmental Psychology 10541ndash552
xvi Pianta Robert LaParo K and Hamre B (2008) The Classroom Assessment Scoring System Pre-K Manual Charlottesville VA University of Virginia
xvii Roggman L A Cook G A Jump Norman V K Christiansen K Boyce L K Innocenti M S Aikens N Boller K Paulsell D amp Hallgren K (2010) Home Visit Rating Scales-Adapted (HOVRS-A) Unpublished document Princeton NJ Mathematica Policy Research
xviii Mashburn AJ Pianta RC Hamre BK Downer JT Barbarin OA Bryant D Burchinal M and Early DM
(2008) Measures of classroom quality in prekindergarten and childrens development of academic language and social skills Child Development 79(3)732-749
xix Espinosa L (2008) Challenging common myths about English language learners Alexandria VA National Association of State Boards of Education
xx Fenson L Pethick S Renda ox JL Dale PS and Reznick JS (2000) Short form versions of the Macrthur ommunicative Development Inventories Applied Psycholinguistics 2195-115
xxi Briggs-Gowan M and Carter A (2006) BITSEA Brief Infant-Toddler Social and Emotional Assessment examinerrsquos manual San Antonio Harcourt Assessment
xxii Duncan SE and DeAvila D (1998) Preschool Language ssessment Survey 2000 examinerrsquos manual English forms C and D Monterey CA CTBMcGraw-Hill
xxiii Dunn LM Dunn LL and Dunn DM (2006) Peabody Picture Vocabulary Test Fourth Edition examinerrsquos
manual and norms booklet Circle Pines MN American Guidance Service xxiv
Mason JM and Stewart J (1989) The CAP Early Childhood Diagnostic Instrument (prepublication edition) Iowa City IA American Testronics
xxv Woodcock RW Muntildeoz-Sandoval AF McGrew K Mather N and Schrank F (2004) Bateria III Woodcock-Munoz Itasca IL Riverside Publishing
xxvi Dunn LM Padilla ER Lugo DE and Dunn LM (1986) Test de Vocabulario en Imagenes Peabody Circle
Pines MN American Guidance Service xxvii
Roid GH and Miller LJ (1997) Examinerrsquos manual Leiter International Performance Scale-Revised Chicago Stoelting Co
Report to Congress on DLLs in Head Start Page | 103
xxviii McDermott PA Green LF Francis JM and Stott DH (2000) Preschool Learning Behaviors Scale
Philadelphia Edumetric and Clinical Science
Report to Congress on DLLs in Head Start Page | 104
Report to Congress on DLLs in Head Start Page | 105
Total
APPENDIX
Table II1 Prevalence of DLLs Overall and by Program Type 2007-2008
Number
of
Enrolled
Children
Percent of
Enrolled Children
Who Are DLLs
Number of Enrolled Children
Who Are DLLs
Overall 327972 306
Head Start 271153 288
Early Head Start 24459 257
MSHS 32360 892
AIAN 1680 71
Source 2007ndash2008 PIR
Note DLLs are children who live in homes where a language other than English is the
primary language spoken by the family at home
Table II2 Percentage of Dual Language Learners (DLLs) Served in Different Regions by Program Type 2007-2008
1
Report to Congress on DLLs in Head Start Page | 106
APPENDIX
Total Head Start Early Head Start MSHS AIAN
Number
of DLLs
Percent of
the Total
DLL
Enrollment in
Regiona
Number
of DLLs
Percent of
the Total
DLL
Enrollment in
Regionb
Number
of DLLs
Percent of
the Total
DLL
Enrollment in
Regionc
Number
of DLLs
Percent of
the Total
DLL
Enrollment in
Regiond
Number
of DLLs
Percent of
the Total
DLL
Enrollment in
Regione
Northeast 47816 145 42451 157 4132 169 1233 38 - 00
Midwest 41218 125 34643 128 3479 142 3038 94 58 35
South 75953 230 57523 212 4576 187 13553 419 301 179
West 21734 369 95752 353 10125 414 14536 449 1321 786
US Territories 42931 130 40784 150 2147 88 - 00 - 00
Source 2007-2008 PIR
Note DLLs are children who live in homes where a language other than English is the primary language spoken by the family at home
a
Total DLL enrollment = 329652
b
Total DLL enrollment = 271153
c
Total DLL enrollment = 24459
d
Total DLL enrollment = 32360
e
Total DLL enrollment = 1680
Total Number
of DLLs From Homes
Speaking Language
in Group
Percent of
Total
a
Enrollment
Percent of
DLL
b
EnrollmentLanguage Groups
Spanish 276824 258 844
Native Central American South American
Mexican and Caribbean Languages 7268 07 22
c
Asian Languages 18785 18 57
Pacific Island Languages 4829 05 15
Native North AmericanAlaska Native Languages 1526 01 05
European and Slavic Languages 6026 06 18
African Languages 5589 05 17
Other Languages 7125 07 22
Table II3 Prevalence of Various Language Groups Among Dual Language Learners (DLLs)
Across All Head Start Programs 2007-2008
Report to Congress on DLLs in Head Start Page | 107
APPENDIX
Source 2007ndash2008 PIR
Note DLLs are children who live in homes where a language other than English is the primary language spoken by the
family at home
a
Total enrollment = 1071734
b
DLL enrollment = 327972
c
Asian languages include Middle Eastern and South Asian languages (for example Arabic Hebrew
Hindi Urdu Bengali) as well as East Asian languages (for example Chinese Vietnamese Tagalog)
English 1000 00
Spanish NA 841
Native Central American South American Mexican or
Caribbean language NA 13
Asian language NA 51
Native North AmericanAlaska Native language NA 17
European or Slavic language NA 03
African language NA 28
Other NA 47
Table II4 Primary Language Spoken to Head Start Child at Home Fall 2006
Percent of Children
Children From
Monolingual
English Homes
(n = 1862)
Dual Language
Learners
(n = 942) Primary Language Spoken to the Child at Home
Report to Congress on DLLs in Head Start Page | 108
APPENDIX
Source Fall 2006 FACES Parent Interview
Notes Statistics are weighted to represent all children entering Head Start for the first
time in fall 2006
Children from monolingual English homes are children for whom English was the only
language spoken in the home as reported by parents DLLs are children who live in
homes where a language other than English (LOTE) was spoken in the home regardless of
which language was the primary language spoken by the family
NA = not applicable
Report to Congress on DLLs in Head Start Page | 109
Native Central American South American Mexican or
APPENDIX
Table II5 Language(s) Spoken to Early Head Start Children at Home Spring 2009
Percent of Children
Children From
Monolingual
English Homes
(n = 425)
Dual Language
Learners
(n = 220) Language(s) Spoken to the Child at Homea
English 1000 485
Spanish NA 913
Caribbean language NA 04
Asian language NA 00
Native North AmericanAlaska Native language NA 30
European or Slavic language NA 24
African language NA 19
Other NA 10
Source Spring 2009 Baby FACES Parent Interview
Notes Statistics are weighted to represent children near their first birthday who were
enrolled in Early Head Start programs in spring 2009
Children from monolingual English homes are children for whom English was the only
language spoken in the home as reported by parents DLLs are children who live in homes
where a language other than English (LOTE) was spoken in the home regardless of which
language was the primary language spoken by the family
NA = not applicable
a
Parents could indicate that they used more than one language when speaking to the child
Table II6 Language Spoken to Early Head Start Children by Family Members (Percent)
Spring 2009
Dual Language Learners
(n=220)
English 479 391 278 781
Spanish 923 799 867 667
Other language 66 40 82 37
Birth Mother Birth Father Grandparent Sibling
Report to Congress on DLLs in Head Start Page | 110
APPENDIX
Source Spring 2009 Baby FACES Parent Interview
Notes Statistics and weighting to represent children near their first birthday who were
enrolled in Early Head Start programs in Spring 2009
Percentages add to more than 100 because each family member could speak to their child
in more than one language
Children from monolingual English homes are children for whom English was the only
language spoken in the home as reported by parents DLLs are children who live in homes
where a language other than English (LOTE) was spoken in the home regardless of which
language was the primary language spoken by the family
Report to Congress on DLLs in Head Start Page | 111
languages
APPENDIX
Table II7 Prevalence of Various Non-English Language Groups by Program Type 2007-2008
Total Head Start Early Head Startb
MSHS AIAN
Number of
Children
Enrolled
Percent
of Total
a
Enrollment
Number of
Children
Enrolled
Percent
of Total
b
Enrollment
Number of
Children
Enrolled
Percent
of Total
c
Enrollment
Number of
Children
Enrolled
Percent
of Total
d
Enrollment
Number of
Children
Enrolled
Percent
of Total
e
EnrollmentLanguage Group
Spanish 276824 2527 225617 2400 20477 2148 30730 8472 352 149
Native Central American
South American Mexican and
Caribbean languages 7268 066 5351 057 371 039 1546 426 47 020
Asian languages 18785 172 17574 187 1205 126 6 002 9 004
Pacific Island languages 4829 044 4704 050 112 012 13 004 - 000
Native North American
Alaska Native languages 1526 014 1333 014 187 020 6 002 1110 470
European and Slavic 6026 055 5496 058 527 055 3 000 5 002
African languages 5589 051 4978 053 611 064 0 000 - 000
Other languages 7125 065 6100 065 969 102 56 015 157 067
Source 2007-2008 PIR
Note DLLs are children who live in homes where a language other than English is the primary language spoken by the family at home
a
Total enrollment=1095313
a
Total enrollment=940138
b
Total enrollment=95325
c
Total enrollment=36271
d
Total enrollment=23579
1000 920
Mother Born in US 980 137
Time in US if Mother Born Elsewhere
5 years or fewer 151 279
6 to 10 years 339 417
More than 10 years 511 304
Motherrsquos CountryArea of (non-US) Origin
Mexico 251 672
Central America 62 112
South America 22 64
Caribbean 326 29
Africa 32 53
Asia 53 64
Other 254 06
Father Born in US 974 102
Time in US if Father Born Elsewhere
5 years or fewer 161 193
6 to 10 years 312 378
More than 10 years 527 429
Fatherrsquos CountryArea of (non-US) Origin
Mexico 280 683
Central America 77 101
South America 58 70
Caribbean 219 24
Africa 183 53
Asia 65 62
Other 119 08
Parent Immigrant Status
Both Parents Born in US 950 58
One Parent Born Outside US 40 123
Both Parents Born Outside US 09 819
Table II8 Head Start Childrens Family Immigration Fall 2006
Percent of Children
Children From
Monolingual English
Homes
(n = 1862)
Dual Language
Learners
(n = 942) Characteristic
Child Born in US
Report to Congress on DLLs in Head Start Page | 112
APPENDIX
Source Fall 2006 FACES Parent Interview
Notes Statistics are weighted to represent all children entering Head Start for the first time in fall 2006
Children from monolingual English homes are children for whom English was the only language spoken in the home as reported by parents DLLs are children who live in homes where a language other than English (LOTE) was spoken in the home regardless of which language was the primary language spoken by the family
Child Born in US 1000 993
Mother Born in US 980 323
Time in US if Mother Born Elsewhere
5 years or fewer 153 291
6 to 10 years 179 453
More than 10 years 668 256
Motherrsquos CountryArea of (non-US) Origin
Mexico 260 809
Central America 47 82
South America 00 06
Caribbean 112 34
Africa 42 46
Asia 91 17
Other 447 06
Father Born in US 947 264
Time in US if Father Born Elsewhere
5 years or fewer 00 219
6 to 10 years 209 364
More than 10 years 791 417
Fatherrsquos CountryArea of (non-US) Origin
Mexico 320 764
Central America 00 118
South America 00 09
Caribbean 00 00
Africa 00 39
Asia 00 06
Other 00 06
Parent Immigrant Status
Both Parents Born in US 937 225
One Parent Born Outside US 57 134
Both Parents Born Outside US 07 641
Table II9 Early Head Start Childrens Family Immigration Spring 2009
Percent of Children
Children From
Monolingual English
Homes
(n = 425)
Dual Language
Learners
(n = 220) Characteristic
Page | 113
language was the primary language spoken by the family
APPENDIX
Source Spring 2009 Baby FACES Parent Interview
Notes Statistics are weighted to represent children near their first birthday who were enrolled
in Early Head Start programs in spring 2009
Children from monolingual English homes are children for whom English was the only
language spoken in the home as reported by parents DLLs are children who live in homes
where a language other than English (LOTE) was spoken in the home regardless of which
Report to Congress on DLLs in Head Start
Among parents whose first language is not English
Parent reads first language
Not at all NA 13
Not well NA 71
Well NA 376
Very well NA 541
Parent understands English
Not at all NA 148
Not well NA 477
Well NA 247
Very well NA 128
Parent reads English
Not at all NA 261
Not well NA 389
Well NA 241
Very well NA 109
Table II10 Head Start Childrens Parents Ability in First Language
and English Fall 2006
Percent of Children
Children From
Monolingual English
Homes
(n = 1862)
Dual Language
Learners
(n = 942) Characteristic
Report to Congress on DLLs in Head Start Page | 114
APPENDIX
Source Fall 2006 FACES Parent Interview
Notes Statistics are weighted to represent all children entering Head
Start for the first time in fall 2006
Children from monolingual English homes are children for whom English
was the only language spoken in the home as reported by parents DLLs
are children who live in homes where a language other than English
(LOTE) was spoken in the home regardless of which language was the
primary language spoken by the family
NA = not applicable
Among parents whose first language is not English
Parent Reads First Language
Not at all NA 33
Not well NA 33
Well NA 336
Very well NA 598
Parent Understands English
Not at all NA 102
Not well NA 468
Well NA 242
Very well NA 188
Parent Reads English
Not at all NA 222
Not well NA 374
Well NA 222
Very well NA 182
NA
Language Staff Usually Uses When Speaking to
a
Parent
English NA 178
Spanish NA 822
If English is Usually Used Someone Translated for
a
Parent So Parent Could Speak with Staff NA 665
If A Translator Was Not Used Parent Had Trouble
a
Understanding Staffs English NA 270
If A Translator Was Not Used Staff Had Trouble
a
Understanding Parent NA 203
Table II11 Early Head Start Childrens Parents Ability in First Language and English
Spring 2009
Characteristic
Children From
Monolingual
English Homes
(n = 425)
Percent of Children
Dual Language
Learners
(n = 220)
Report to Congress on DLLs in Head Start Page | 115
APPENDIX
Source Spring 2009 Baby FACES Parent Interview
Notes Statistics are weighted to represent children near their first birthday who were
enrolled in Early Head Start programs in spring 2009
Children from monolingual English homes are children for whom English was the only
language spoken in the home as reported by parents DLLs are children who live in homes
where a language other than English (LOTE) was spoken in the home regardless of which
language was the primary language spoken by the family
NA = not applicable
a
Among parents indicating they speak English not at all or not well
a a
Mother and Father 331 721
Married 234 489
Unmarried 95 230
Marital status not reported
a
Mother Only
a
Father Only
a a
Neither Mother Nor Father
03
577
30
62
02
257
13
09
Table II12 Head Start Childrens Family Structure Fall 2006
Percent of Children
Children From
Monolingual English
Homes
(n = 1862)
Dual Language
Learners
(n = 942) Children Living with
Report to Congress on DLLs in Head Start Page | 116
APPENDIX
Source Fall 2006 FACES Parent Interview
Notes Statistics are weighted to represent all children entering Head Start
for the first time in fall 2006
Children from monolingual English homes are children for whom English was
the only language spoken in the home as reported by parents DLLs are
children who live in homes where a language other than English (LOTE) was
spoken in the home regardless of which language was the primary language
spoken by the family
This table focuses on biologicaladoptive parents and does not include other
adults such as parentsrsquo romantic partners step-parents foster parents or
grandparents Thus for example the ldquoMother onlyrdquo category does not mean
that the mother is the only adult in the household but that she is the only
parent in the household
a
Includes both biological and adoptive parents
a b
Mother and Father 384 710
Married 234 373
Unmarried 149 337
Marital status not reported 02 00
a
Mother only 583 278
b
Father only 10 00
a b
Neither Mother nor Father 22 11
Table II13 Early Head Start Childrens Family Structure Spring 2009
Percent of Children
Children From
Monolingual English
Homes
(n = 425)
Dual Language
Learners
(n = 220) Children Living with
Report to Congress on DLLs in Head Start Page | 117
APPENDIX
Source Spring 2009 Baby FACES Parent Interview
Notes Statistics are weighted to represent children near their first birthday
who were enrolled in Early Head Start programs in spring 2009
This table focuses on biologicaladoptive parents and does not include other
adults such as parentsrsquo romantic partners step-parents foster parents or
grandparents Thus for example the ldquoMother onlyrdquo category does not mean
that the mother is the only adult in the household but that she is the only
parent in the household
Children from monolingual English homes are children for whom English was
the only language spoken in the home as reported by parents DLLs are
children who live in homes where a language other than English (LOTE) was
spoken in the home regardless of which language was the primary language
spoken by the family
a
Includes both biological and adoptive parents
Ethnicity
HispanicLatino 336 322 980 30
Non-HispanicLatino 664 678 20 970
Race
White 381 410 608 80
African American 310 249 05 07
American Indian or Alaska Native 38 55 48 851
Asian or Pacific Islander 28 19 00 06
Multi-RacialBi-Racial 65 85 22 30
Other 02 02 00 00
Unspecified 176 180 316 27
Family structure
Two-parent 422 407 750 588
Single-parent 578 594 251 412
Employment two-parent families
Both parents employed 250 276 673 375
One parent employed 610 559 224 412
Both parents not working 140 165 104 213
Employment single-parent families
Parent employed 580 535 757 571
Parent not working 420 465 243 429
Highest level of education completed by parents
Less than high school diploma 314 332 759 184
High school diploma or GED 436 397 184 486
degree 209 228 52 264
Bachelorrsquos degree or higher 41 04 05 57
Table II13a Demographic and Risk Factors of ChildrenFamilies By Program Type (Percent of
Children and Families) 2007-2008
Head Start Early Head Start MSHS AIAN
Report to Congress on DLLs in Head Start Page | 118
Some collegevocationalan Associate
APPENDIX
Source 2007-2008 PIR Data as of May 2009
Note DLLs are children who live in homes where a language other than English is the primary language spoken by the family at home
Number of Adults in Household
1 384 118
2 477 589
3 or more 139 293
Mean Number of Adults 18 24
Number of Children in Household
1 195 150
2 368 361
3 256 262
4 or more 181 228
Mean Number of Children 25 27
Mean Number of Siblings 14 15
Younger Sibling(s) in Household 248 247
Older Sibling(s) in Household 725 735
Total Number of Persons in Household
2 77 20
3 213 99
4 289 283
5 221 266
6 123 152
7 or more 78 180
Mean Number of Persons 44 51
Intergenerational Household 151 131
Table II14 Head Start Childrens Household Size and Membership Fall 2006
Percent of Children
Children From
Monolingual English
Homes
(n = 1862)
Dual Language
Learners
(n = 942) Household Size and Membership
Report to Congress on DLLs in Head Start Page | 119
APPENDIX
Source Fall 2006 FACES Parent Interview
Note Statistics are weighted to represent all children entering Head Start for the
first time in fall 2006
This table shows the total number of adults in childrenrsquos households including
biologicaladoptive parents and other adults such as parentsrsquo romantic partners
step-parents foster parents and grandparents
Children from monolingual English homes are children for whom English was the
only language spoken in the home as reported by parents DLLs are children who
live in homes where a language other than English (LOTE) was spoken in the
home regardless of which language was the primary language spoken by the
family
Number of Adults in Household
0 06 00
1 394 193
2 484 693
3 or more 115 114
Mean Number of Adults 17 21
Number of Children in Household
1 293 101
2 322 282
3 234 361
4 or more 151 256
Mean Number of Children 23 29
Total Number of Persons in Household
2 135 20
3 245 120
4 289 295
5 159 247
6 92 195
7 or more 79 123
Mean Number of Persons 41 50
Intergenerational Household 182 127
Table II15 Early Head Start Childrens Household Size and Membership
Spring 2009
Percent of Children
Children From
Monolingual English
Homes
(n = 425)
Dual Language
Learners
(n = 220) Household Size and Membership
Report to Congress on DLLs in Head Start Page | 120
APPENDIX
Source Spring 2009 Baby FACES Parent Interview
Notes Statistics are weighted to represent children near their first birthday who
were enrolled in Early Head Start programs in spring 2009
This table shows the total number of adults in childrenrsquos households including
biologicaladoptive parents and other adults such as parentsrsquo romantic partners
step-parents foster parents and grandparents
Children from monolingual English homes are children for whom English was the
only language spoken in the home as reported by parents DLLs are children who
live in homes where a language other than English (LOTE) was spoken in the
home regardless of which language was the primary language spoken by the
family
Report to Congress on DLLs in Head Start Page | 121
APPENDIX
Table II16 Motherrsquos Age at Head Start Childrsquos Birth Fall 2006
Percent of Children
Children From
Monolingual English
Homes
(n = 1862)
Dual Language
Learners
(n = 942) Mothers Age in Years
17 or under 56 21
18-19 129 73
20-24 404 339
25-29 221 269
30 or older 190 298
Mean Age 245 267
Source Fall 2006 FACES Parent Interview
Notes Statistics are weighted to represent all children entering Head
Start for the first time in fall 2006
Children from monolingual English homes are children for whom
English was the only language spoken in the home as reported by
parents DLLs are children who live in homes where a language other
than English (LOTE) was spoken in the home regardless of which
language was the primary language spoken by the family
Report to Congress on DLLs in Head Start Page | 122
APPENDIX
Table II17 Motherrsquos Age at Early Head Start Childs Birth Spring
2009
Percent of Children
Children From
Monolingual English
Homes
(n = 425)
Dual Language
Learners
(n = 220) Age in Years
Mean Age 239 262
17 or under 113 99
18-19 140 63
20-24 352 253
25-29 234 268
30 or older 161 318
Source Spring 2009 Baby FACES Parent Interview
Notes Statistics are weighted to represent children near their first
birthday who were enrolled in Early Head Start programs in spring 2009
Children from monolingual English homes are children for whom
English was the only language spoken in the home as reported by
parents DLLs are children who live in homes where a language other
than English (LOTE) was spoken in the home regardless of which
language was the primary language spoken by the family
Table II18 Head Start Childrens Parents Education Fall 2006
Percent of Children
Highest Level of Education of Biological or
Adoptive Parents Living with Child
Children from
Monolingual English
Homes
(n = 1862)
Dual Language
Learners
(n = 942)
a
Percentage of Children Living with their Mother 909 978
a
Mothers
Less than high school diploma 292 598
High school diploma or GED 359 239
Some collegevocationaltechnical 290 99
Bachelorrsquos degree or higher 59 64
a
Percentage of Children Living with their Father 361 734
a
Fathers
Less than high school diploma 288 661
High school diploma or GED 424 211
Some collegevocationaltechnical 209 55
Bachelorrsquos degree or higher 78 73
a
Percentage of Children Living with Either Parent 938 991
a
Highest Level of Education Completed by those Parents
lt high school 249 529
High school or GED 375 264
Some postsecondary 301 111
Bachelorrsquos degree or higher 74 96
Report to Congress on DLLs in Head Start Page | 123
Highest Level of Education Completed by those
Highest Level of Education Completed by those
APPENDIX
Source Fall 2006 FACES Parent Interview
a
Includes both biological and adoptive parents
Notes Statistics are weighted to represent all children entering Head Start for the first time in
fall 2006
Households that do not include a mother andor father are not included in the relevant
percentage calculations
Children from monolingual English homes are children for whom English was the only
language spoken in the home as reported by parents DLLs are children who live in homes
where a language other than English (LOTE) was spoken in the home regardless of which
language was the primary language spoken by the family
Table II19 Early Head Start Childrens Parents Education Spring 2009
Percent of Children
Children From
Monolingual
nglish Homes
(n = 425)
Dual Language
Learners
(n = 220)
Highest Level of Education of Biological or Adoptive Paren
Living with Child
E
a
Percent of Children Living with their Mother 968 989
a
Highest Level of Education Completed by those Mothers
Less than high school diploma 315 536
High school diploma or GED 358 252
Some collegevocationaltechnical 289 157
Bachelorrsquos degree or higher 38 54
a
Percent of Children Living with their Father 394 710
a
Highest Level of Education Completed by those Fathers
Less than high school diploma 320 594
High school diploma or GED 481 268
Some collegevocationaltechnical 137 93
Bachelorrsquos degree or higher 61 45
a
Percent of Children Living with Either Parent 978 989
a
Highest Level of Education Completed by those Parents
Less than high school diploma 181 381
High school diploma or GED 437 325
Some collegevocationaltechnical 302 213
Bachelorrsquos degree or higher 80 81
Report to Congress on DLLs in Head Start Page | 124
ts
APPENDIX
Source Spring 2009 Baby FACES Parent Interview
a
Includes both biological and adoptive parents
Notes Statistics are weighted to represent children near their first birthday who were
enrolled in Early Head Start programs in spring 2009
Households that do not include a mother andor father are not included in the relevant
percent calculations
Children from monolingual English homes are children for whom English was the only
language spoken in the home as reported by parents DLLs are children who live in homes
where a language other than English (LOTE) was spoken in the home regardless of which
language was the primary language spoken by the family
a
Percentage of Children Living with their Mother 909 978
a
Employment Status of those Mothers
Working full-time 358 230
Working part-time 205 167
Looking for work 174 84
Not in labor force 262 519
a
Percentage of Children Living with their Father 361 734
a
Employment Status of those Fathers
Working full-time 659 770
Working part-time 132 146
Looking for work 90 45
Not in labor force 118 40
Percentage of Children Living with Either Parent 938 991
a
Employment Status of the Most Employed of those Parents
Working full-time 530 701
Working part-time 177 148
Looking for work 154 50
Not in labor force 139 101
Table II20 Head Start Childrens Parents Employment Status Fall 2006
Percent of Children
Children From
Monolingual English
Homes
(n = 1862)
Dual Language
Learners
(n = 942) Employment Status of Biological or Adoptive
eport to CoR ngress on DLLs in Head Start Page | 125
Parents Living with Child
a
APPENDIX
Source Fall 2006 FACES Parent Interview
a
Includes both biological and adoptive parents
Notes Statistics are weighted to represent all children entering Head Start for the first
time in fall 2006
Households that do not include a mother andor father are not included in the relevant
percentage calculations
Children from monolingual English homes are children for whom English was the only
language spoken in the home as reported by parents DLLs are children who live in
homes where a language other than English (LOTE) was spoken in the home regardless
of which language was the primary language spoken by the family
Report to Congress on DLLs in Head Start Page | 126
APPENDIX
Table II21 Early Head Start Childrens Parents Employment Status Spring 2009
Percent of Children
Children From
Monolingual English
Homes
(n = 425)
Dual Language
Learners
(n = 220)
Employment Status of Biological or Adoptive Parents
Living with Child
Percent of Children Living with their Mothera
968 989
Employment Status of those Mothersa
Working full-time 218 127
Working part-time 240 181
Looking for work 209 204
Not in labor force 334 487
Percent of Children Living with their Fathera
394 710
Employment Status of those Fathersa
Working full-time 465 612
Working part-time 133 148
Looking for work 165 105
Not in labor force 236 135
Percent of Children Living with Either Parenta
978 989
Employment Status of the Most Employed of
those Parentsa
Working full-time 571 639
Working part-time 196 163
Looking for work 157 101
Not in labor force 76 97
Source Spring 2009 Baby FACES Parent Interview
a
Includes both biological and adoptive parents
Notes Statistics are weighted to represent children near their first birthday who were
enrolled in Early Head Start programs in spring 2009
Households that do not include a mother andor father are not included in the relevant
percent calculations
Only parents of children in the Age 1 Cohort were asked about the language(s) used when
speaking to the child at home Reported estimates in these tables represent children in
this cohort only
Children from monolingual English homes are children for whom English was the only
language spoken in the home as reported by parents DLLs are children who live in homes
where a language other than English (LOTE) was spoken in the home regardless of which
language was the primary language spoken by the family
Table II22 Head Start Childrens Household Income as a Percentage of the
Federal Poverty Threshold Fall 2006
Percent of Children
Children From
Monolingual English
Homes
(n = 1862)
Dual Language
Learners
(n = 942) Income as a Percentage of Poverty
50 percent or less 171 174
51 to 100 percent 378 466
101 to 130 percent 155 170
131 to 185 percent 155 133
186 to 200 percent 27 12
201 percent or above 115 45
Report to Congress on DLLs in Head Start Page | 127
APPENDIX
Source Fall 2006 FACES Parent Interview
Notes Statistics are weighted to represent all children entering Head Start for
the first time in fall 2006
This table summarizes household income and therefore should not be used to
estimate eligibility for Head Start Head Start qualifying criteria are based on
family (not household) income and there are other (non-income) ways to
qualify for the program
Children from monolingual English homes are children for whom English was
the only language spoken in the home as reported by parents DLLs are
children who live in homes where a language other than English (LOTE) was
spoken in the home regardless of which language was the primary language
spoken by the family
Report to Congress on DLLs in Head Start Page | 128
APPENDIX
Table II23 Early Head Start Childrens Household Income as a Percent of the
Federal Poverty Threshold Spring 2009
Percent of Children
Children From
Monolingual English
Homes
(n = 425)
Dual Language
Learners
(n = 220) Income as a Percent of Poverty
50 percent or less 270 269
51 to 100 percent 381 492
101 to 130 percent 105 143
131 to 185 percent 103 70
186 to 200 percent 40 02
201 percent or above 101 25
Source Spring 2009 Baby FACES Parent Interview
Notes Statistics are weighted to represent children near their first birthday who
were enrolled in Early Head Start programs in spring 2009
This table summarizes household income and therefore should not be used to
estimate eligibility for Head Start Head Start qualifying criteria are based on family
(not household) income and there are other (non-income) ways to qualify for the
program
Children from monolingual English homes are children for whom English was the
only language spoken in the home as reported by parents DLLs are children who
live in homes where a language other than English (LOTE) was spoken in the home
regardless of which language was the primary language spoken by the family
Table II24 Public Assistance Received by Any Member of Head Start
Childrens Household Fall 2006
Percent of Children
Children From
Monolingual English
Homes
(n = 1862)
Dual Language
Learners
(n = 942) Type of Public Assistance
Welfare 264 146
Food Stamps 632 310
WIC 533 743
SSI 175 45
Report to Congress on DLLs in Head Start Page | 129
APPENDIX
Source Fall 2006 FACES Parent Interview
Notes Statistics are weighted to represent all children entering Head Start
for the first time in fall 2006
Children from monolingual English homes are children for whom English
was the only language spoken in the home as reported by parents DLLs
are children who live in homes where a language other than English
(LOTE) was spoken in the home regardless of which language was the
primary language spoken by the family
Table II25 Public Assistance Received by Any Member of Early Head Start
Childs Household Spring 2009
Percent of Children
Children From
Monolingual English
Homes
(n = 425)
Dual Language
Learners
(n = 220) Type of Public Assistance
Welfare 312 295
Food Stamps 662 522
WIC 850 921
SSI 139 64
Report to Congress on DLLs in Head Start Page | 130
APPENDIX
Source Spring 2009 Baby FACES Parent Interview
Notes Statistics are weighted to represent children near their first birthday who
were enrolled in Early Head Start programs in spring 2009
Children from monolingual English homes are children for whom English was the
only language spoken in the home as reported by parents DLLs are children who
live in homes where a language other than English (LOTE) was spoken in the home
regardless of which language was the primary language spoken by the family
Could not pay the full amount of gas oil or electricity
bills 330 310
Could not pay the full amount of rent or mortgage 291 319
Had service disconnected by the telephone company
because payments were not made 174 235
Had services turned off by the gas or electric company
or oil company would not deliver oil 87 98
Was evicted from home or apartment 76 38
Parent has
Zero financial security difficulty 541 520
One financial security difficulty 170 123
Two financial security difficulties 151 242
Three financial security difficulties 76 69
Four financial security difficulties 51 44
Five financial security difficulties 11 02
Table II26 Early Head Start Childrens Family Financial Difficulties Spring 2009
Percent of Children
Chidren From
Monolingual
English Homes
(n = 425)
Dual Language
Learners
(n = 220) Financial Security Areas of Difficulty
Report to Congress on DLLs in Head Start Page | 131
APPENDIX
Source Spring 2009 Baby FACES Parent Interview
Notes Statistics are weighted to represent children near their first birthday who were
enrolled in Early Head Start programs in spring 2009
Children from monolingual English homes are children for whom English was the only
language spoken in the home as reported by parents DLLs are children who live in homes
where a language other than English (LOTE) was spoken in the home regardless of which
language was the primary language spoken by the family
Report to Congress on DLLs in Head Start Page | 132
APPENDIX
Table II27 Early Head Start Childrens Food Security Difficulties Spring 2009
Percent of Children
Children From
Monolingual
English Homes
(n = 425)
Dual Language
Learners
(n = 220) Food Security Difficulties
Worried food may run out 314 484
Food didnt last and didnt have money to get more 214 380
Relied on only a few kinds of low-cost food to feed
children because of financial reasons 176 417
Couldnt afford to eat balanced meals 191 389
Couldnt feed children a balanced meal for financial
reasons 125 307
Parent has
Zero or one food security difficulty 735 486
Two or three food security difficulties 144 221
Four or five food security difficulties 12 293
Source Spring 2009 Baby FACES Parent Interview
Notes Statistics are weighted to represent children near their first birthday who were
enrolled in Early Head Start programs in spring 2009
Children from monolingual English homes are children for whom English was the only
language spoken in the home as reported by parents DLLs are children who live in homes
where a language other than English (LOTE) was spoken in the home regardless of which
language was the primary language spoken by the family
Report to Congress on DLLs in Head Start Page | 133
BehavioralEmotional Impairment
Percent of Children with
al impairment
APPENDIX
Table II28 Disability Categories for Head Start Children with Disabilities Fall 2006
Percent of Children
Children From
Monolingual
English Homes
(n = 1862)
Dual Language
Learners (DLLs)
(n = 942)
DLLs without
English Proficiency
(n = 435) Characteristic
Percent of Children
Children with Disabilities 1384 750 934
Percent of Children with Disabilities
Speech or Language Impairment 7334 7602 8185
Cognitive Impairmenta
2231 2060 2571
b
1472 832 784
Sensory Impairmentc
1177 1304 689
Physical Impairmentd
852 423 478
Child has IEP or ISFP 3824 5308 5278
Disabilities Having Multiple
Impairments 2130 1902 2006
Source Fall 2006 FACES Teacher Child Report
Notes Statistics are weighted to represent all children entering Head Start for the first time
in fall 2006
Teachers were asked whether a professional had indicated that the child had a
developmental problem delay or other special need and to indicate the specific need or
disability
Percentages do not add to 100 because children can be reported to have more than one
impairment across the impairment categories
Children from monolingual English homes are children for whom English was the only
language spoken in the home as reported by parents DLLs are children who live in homes
where a language other than English (LOTE) was spoken in the home regardless of which
language was the primary language spoken by the family
a
Cognitive Impairment includes the following mental retardation autismpervasive
b
BehavioralEmotional Impairment includes behavior problems hyperactivity and ADHD
c
Sensory Impairment includes deafness other hearing impairment blindness and other visu
d
Physical Impairment includes motor impairment
Report to Congress on DLLs in Head Start Page | 134
APPENDIX
Table II29 Head Start Childrsquos Health Care Fall 2006
Percent of Children
Children From
Monolingual English
Homes
(n = 1862)
Dual Language
Learners
(n = 942) Childs Health Care
Regular medical checkup in past year 987 990
Regular dental checkup in past year 860 919
Has health insurance 963 908
Private 432 569
Medicaid 752 661
SCHIPa
97 64
Other government 37 35
Source Fall 2006 FACES Parent Interview
a
State Childrenrsquos Health Insurance Program
Notes Statistics are weighted to represent all children entering Head Start for
the first time in fall 2006
Children from monolingual English homes are children for whom English was
the only language spoken in the home as reported by parents DLLs are
children who live in homes where a language other than English (LOTE) was
spoken in the home regardless of which language was the primary language
spoken by the family
Report to Congress on DLLs in Head Start Page | 135
APPENDIX
Table II30 Early Head Start Childrsquos Health Care Spring 2009
Percent of Children
Children From
Monolingual
English
Homes
(n = 425)
Dual Language
Learners
(n = 220) Childs Health Care
Regular Medical Checkup in Past Year 1000 1000
Child Ever Visited Dentist 215 275
Has Health Insurance 970 950
Private 386 236
Medicaid 750 768
SCHIPa
365 188
Other government 33 10
Source Spring 2009 Baby FACES Parent Interview
a
State Childrenrsquos Health Insurance Program
Notes Statistics are weighted to represent children near their first birthday
who were enrolled in Early Head Start programs in spring 2009
Children from monolingual English homes are children for whom English was
the only language spoken in the home as reported by parents DLLs are
children who live in homes where a language other than English (LOTE) was
spoken in the home regardless of which language was the primary language
spoken by the family
Table II31 Child Care Arrangements in Addition to Head Start Fall 2006
Report to Congress on DLLs in Head Start Page | 136
APPENDIX
Percent of Children
Children From
Monolingual English
Homes
(n = 1862)
Dual Language
Learners
(n = 942) Child Care Arrangements
Any child care 115 260
Type of primary child care arrangement
Center-based care 245 43
Relative 39 156
Non-relative 03 60
Equal time in multiple types of care 402 01
Source Fall 2006 FACES Parent Interview
Notes Statistics are weighted to represent all children entering Head Start for
the first time in fall 2006
Percentages do not sum to 100 Estimates reflect prevalence across all children
including those who are not in child care outside of Head Start
Children from monolingual English homes are children for whom English was
the only language spoken in the home as reported by parents DLLs are children
who live in homes where a language other than English (LOTE) was spoken in the
home regardless of which language was the primary language spoken by the
family
Table II32 Child Care Arrangements in Addition to Early Head Start Spring 2009
Report to Congress on DLLs in Head Start Page | 137
APPENDIX
Percent of Children
Children From
Monolingual English
Homes
(n = 425)
Dual Language
Learners
(n = 220) Child Care Arrangements
Any Child Care 724 578
Type of Primary Child Care Arrangement
Center-based care 75 38
Relative 662 766
Non-relative 139 126
Equal time in multiple types of care 124 69
Source Spring 2009 Baby FACES Parent Interview
Notes Statistics are weighted to represent children near their first birthday who were
enrolled in Early Head Start programs in spring 2009
Children from monolingual English homes are children for whom English was the
only language spoken in the home as reported by parents DLLs are children who live
in homes where a language other than English (LOTE) was spoken in the home
regardless of which language was the primary language spoken by the family
a
Table II33 Depressive Symptoms Among Parents of Head Start Children Fall
2006
Percent of Children
Children From
Monolingual English
Homes
(n = 1862)
Dual Language
Learners
(n = 942) Depressive Symptoms among Parents
b
Degree of depressive symptoms
Not depressed 516 725
Mildly depressed 274 156
Moderately depressed 115 62
Severely depressed 94 56
Mean number of depressive symptoms 61 35
Report to Congress on DLLs in Head Start Page | 138
APPENDIX
Source Fall 2006 FACES Parent Interview
Notes Statistics are weighted to represent all children entering Head Start for the
first time in fall 2006
Children from monolingual English homes are children for whom English was the
only language spoken in the home as reported by parents DLLs are children who
live in homes where a language other than English (LOTE) was spoken in the home
regardless of which language was the primary language spoken by the family
a
In this table the term ldquoparentrdquo is used to refer to the primary caregiver who
responded to the survey Most are parents but some are grandparents or other
primary caregivers
b
Center for Epidemiologic StudiesndashDepression Scale (CES-D Radloff 1977) Total
score can range from 0 to 36 Scores ranging from 0 to 4 are coded as Not
Depressed from 5 to 9 as Mildly Depressed from 10 to 14 as Moderately
Depressed and 15 and above as Severely Depressed
a
Table II34 Depressive Symptoms Among Parents of Early Head Start Children
Spring 2009
Percent of Children
Children From
Monolingual English
Homes
(n = 425)
Dual Language
Learners
(n = 220) Depressive Symptoms among Parents
b
Degree of Depressive Symptoms
Not depressed 552 704
Mildly depressed 266 167
Moderately depressed 111 99
Severely depressed 71 30
Mean Number of Depressive Symptoms 57 41
Report to Congress on DLLs in Head Start Page | 139
APPENDIX
Source Spring 2009 Baby FACES Parent Interview
Notes Statistics are weighted to represent children near their first birthday who
were enrolled in Early Head Start programs in spring 2009
Children from monolingual English homes are children for whom English was the
only language spoken in the home as reported by parents DLLs are children who
live in homes where a language other than English (LOTE) was spoken in the home
regardless of which language was the primary language spoken by the family
a
In this table the term ldquoparentrdquo is used to refer to the primary caregiver who
responded to the survey Most are parents but some are grandparents or other
primary caregivers
b
Center for Epidemiologic StudiesndashDepression Scale (CES-D Radloff 1977) Total
score can range from 0 to 36 Scores ranging from 0 to 4 are coded as Not
Depressed from 5 to 9 as Mildly Depressed from 10 to 14 as Moderately Depressed
and 15 and above as Severely Depressed
Table II35 Early Head Start Childrens Parental Modernity and Use of Spanking
Spring 2009
Report to Congress on DLLs in Head Start Page | 140
APPENDIX
Parental Modernity and Child Spanking
Percent of Children
Children From
Monolingual
English
Homes
(n=542)
Dual Language
Learners
(n=171)
Parental Modernity Scale
Traditional Attitudes 197 199
Progressive Attitudes 206 193
Parent spanked the child in the past week 145 64
Source Spring 2009 Baby FACES Parent Interview
Notes Statistics are weighted to represent children and pregnant women enrolled in
sampled Early Head Start programs in spring 2009 and whose birthdates or due dates
fell within study-eligible windows
Children from monolingual English homes are children for whom English was the only
language spoken in the home as reported by parents DLLs are children who live in
homes where a language other than English (LOTE) was spoken in the home regardless
of which language was the primary language spoken by the family
Table III1 Program Approach for Receipt of Early Head Start Services Spring
2009
Percent of Children
Children From
Monolingual English
Homes
(n=425)
Dual Language
Learners
(n=220) Program Approach
Center-based 485 323 Home-based 501 568 Family child care 00 20 Combination
a
14 89
APPENDIX
Source Spring 2009 Baby FACES Program Director Interview
a
Combination programs refer to programs offering both center-based and home-based
services to all enrolled families Specifically these programs provide center-based care
plus home visits monthly or more often
Notes Statistics are weighted to represent children near their first birthday who were
enrolled in Early Head Start programs in spring 2009
Children from monolingual English homes are children for whom English was the only
language spoken in the home as reported by parents DLLs are children who live in
homes where a language other than English (LOTE) was spoken in the home regardless
of which language was the primary language spoken by the family
Report to Congress on DLLs in Head Start Page | 141
APPENDIX
Table III2 Head Start Program Type and Prior Enrollment in Early Head Start Fall
2006
Percent of Children
Children From
Monolingual English
Homes
(n = 1862)
Dual Language
Learners
(n = 942) Characteristic
Head Start Program Type
Full-day 572 317
Part-day 422 668
Enrolled in Early Head Start 122 178
Mean months enrolled in Early Head Start 121 60
Source Fall 2006 FACES Parent Interview
Notes Statistics are weighted to represent all children entering Head Start for the first
time in fall 2006
Children from monolingual English homes are children for whom English was the only
language spoken in the home as reported by parents DLLs are children who live in
homes where a language other than English (LOTE) was spoken in the home regardless
of which language was the primary language spoken by the family
Report to Congress on DLLs in Head Start Page | 142
APPENDIX
Table III3 Typical Early Head Start Center Operation Hours and Schedule Spring
2009
Percent of Children
Children From
Monolingual English
Homes
n=425
Dual Language
Learners
n=220 Operation Hours and Schedule
Up to 6 hours per day 43 89
More than 6 up to 8 hours per day 144 225
More than 8 up to 10 hours per day 267 290
More than 10 hours per day 546 397
Full day year round 819 650
Part day year round 16 214
Full day part of year 165 136
Part day part of year 00 00
Source Spring 2009 Baby FACES Program Director Interview
Notes Statistics are weighted to represent children near their first birthday who were
enrolled in Early Head Start programs in spring 2009
Children from monolingual English homes are children for whom English was the only
language spoken in the home as reported by parents DLLs are children who live in
homes where a language other than English (LOTE) was spoken in the home
regardless of which language was the primary language spoken by the family
Report to Congress on DLLs in Head Start Page | 143
Table III4 Percentage of Children Enrolled in Different Types of Programs in
Migrant and Seasonal Head Start (MSHS) and American IndianAlaska Native (AIAN)
Programs 2007-2008
APPENDIX
Type of program MSHS AIAN
Center based program 5 days per week
Full day 957 223
Part day 00 79
Center based program 4 days per week
Full day 00 301
Part day 01 305
Home-based program 00 78
Combination program 01 06
Family child care 41 01
Locally designed options 00 07
Source 2007-2008 PIR
Notes Combination program is a program providing services in both a center-based
setting and in a home setting
Head Start Early Head Start and MSHS are mutually exclusive program types AIAN can
include either Head Start or Early Head Start programs
DLLs are children who live in homes where a language other than English is the primary
language spoken by the family at home
Report to Congress on DLLs in Head Start Page | 144
Table III5 Child Care Quality in Early Head Start InfantToddler Environment Rating
Scales and Observed ChildAdult Ratios Spring 2009
Mean
Children From
Monolingual English
Homes
(n=27)
Dual Language
Learners
(n=77) Scales
Group Size 51 57
ChildAdult Ratio 24 23
Total 38 39
Personal Care 31 30
Furnishings 38 40
LanguageListening amp Talking 42 46
InteractionSocial 46 47
Program Structure 42 43
Activities 35 36
Motor
Creative
APPENDIX
Source Spring 2009 Baby FACES Classroom Observations
Notes Statistics are weighted to represent children near their first birthday who were
enrolled in Early Head Start programs in spring 2009
Children from monolingual English homes are children for whom English was the only
language spoken in the home as reported by parents DLLs are children who live in homes
where a language other than English (LOTE) was spoken in the home regardless of which
language was the primary language spoken by the family
Report to Congress on DLLs in Head Start Page | 145
ECERS-R Totala
360 350 350 1 ndash 7
Personal Care 240 220 220 1 ndash 7
Furnishings 442 437 437 1 ndash 7
Language 378 380 377 1 ndash 7
Motor Skills 347 339 337 1 ndash 7
Creative 350 340 340 1 ndash 7
Social 440 444 441 1 ndash 7
Program Structure 393 374 369 1 ndash 7
b
ECERS-R Teaching and Interactions 408 404 402 1 ndash 7
b
ECERS-R Provisions for Learning 361 344 340 1 ndash 7
Arnett Lead Teacher Total 6646 6736 6779 0 ndash 90
Sensitivity 1804 1718 1709 0 ndash 30
Harshness 2341 2402 2425 0 ndash 27
Detachment 1022 1056 1060 0 ndash 12
Permissiveness 710 711 724 0 ndash 9
Independence 767 849 856 0 ndash 12
CLASS Instructional Support 200 190 190 1 ndash 7
Concept Development 182 175 171 1 ndash 7
Quality of Feedback 202 197 196 1 ndash 7
Language Modeling 214 205 208 1 ndash 7
ChildAdult Ratio 637 688 676 NA
Group Size 1497 1518 1479 NA
Table III6 Classroom Quality in Head Start Spring 2007
Mean
DLLs Who Did
Not Pass
English
Screener
(n = 435)
Children From
Monolingual
English Homes
(n = 1862)
Possible
Response
Range
Dual Language
Learners (DLLs)
(n = 942) Scales
APPENDIX
Source Spring 2007 FACES Classroom Observation
Notes Statistics are weighted to represent all children entering Head Start for the first time in fall
2006 and who were still enrolled in spring 2007
Children from monolingual English homes are children for whom English was the only language spoken
in the home as reported by parents DLLs are children who live in homes where a language other than
English (LOTE) was spoken in the home regardless of which language was the primary language spoken
by the family
a
Construction of ECERS-R subscale scores is similar to prior FACES and may not be consistent with the
publishers specifications for scoring
b
The Provisions for Learning and Teaching and Interactions subscales are two factors reported in the
Multi-State Study of Prekindergarten as representing the key dimensions of quality tapped by the full
ECERS-R Scores are alternative dimensions of quality using the ECERS-R
Report to Congress on DLLs in Head Start Page | 146
APPENDIX
Table III7 Daily or Almost Daily Frequency of Reading and Language Activities as
Reported by Head Start Classroom Teachers Fall 2006
Percent of Children
Children From
Monolingual
English Homes
(n = 1862)
DLLs Who Did Not
Pass English
Screener
(n = 435)
Dual Language
Learners (DLLs)
(n = 942)
Reading and Language Activity
Letter naming 893 844 820
Writing letters 644 629 575
Discuss new words 824 711 669
Dictate stories to adult 554 558 512
Work on phonics 674 675 642
Listen and see print 949 905 887
Listendonrsquot see the print 253 209 190
Retell stories 572 618 560
Conventions of print 758 753 735
Write own name 762 732 687
Learn about rhyming 502 545 536
Learn prepositions 676 698 722
Source Fall 2006 FACES Teacher Interview
Notes Statistics are weighted to represent all children entering Head Start for the first time
in fall 2006
Children from monolingual English homes are children for whom English was the only
language spoken in the home as reported by parents DLLs are children who live in homes
where a language other than English (LOTE) was spoken in the home regardless of which
language was the primary language spoken by the family
Report to Congress on DLLs in Head Start Page | 147
Table III8 Daily or Almost Daily Frequency of Math Activities as Reported by Head Start Classroom
Teachers Fall 2006
APPENDIX
Percent of Children
Children From
Monolingual English
Homes
(n = 1862)
Dual Language
Learners (DLLs)
(n = 942)
DLLs Who Did Not
Pass English Screener
(n = 435) Math Activity
Count out loud 977 957 962
Geometric manipulatives 818 849 835
Counting manipulatives 836 801 783
Math-related games 622 704 679
Music to understand math 622 668 676
Movementdrama 542 624 648
Measuring instruments 519 522 561
Calendar-related activities 876 833 832
Telling time 488 546 532
Shapes and patterns 791 828 832
Source Fall 2006 FACES Teacher Interview
Notes Statistics are weighted to represent all children entering Head Start for the first time in fall 2006
Children from monolingual English homes are children for whom English was the only language spoken in
the home as reported by parents DLLs are children who live in homes where a language other than English
(LOTE) was spoken in the home regardless of which language was the primary language spoken by the
family
Report to Congress on DLLs in Head Start Page | 148
Languages Spoken by Adults During Home Visits
English 1000 702
Spanish 135 765
Other 14 41
Childs Home Language Used During Home Visits 1000 893
Languages Spoken by Adults in Classroom
English 998 984
Spanish 274 814
Other 41 74
Childs Home Language Used in Classroom 998 852
Non-English Language Spoken in Classroom By
Lead teacher 216 691
Assistant teacher 150 472
Classroom aide 49 303
VolunteerNon staff 23 192
Language Used Most Often to Read to Children in
Classroom
English 996 918
Spanish 04 82
Other language 00 00
How TeacherHome Visitor Communicates with
Families Who Speak a Language They Do Not Speak
Use only English 752 516
Informal interpreter 667 667
Physical cuesgestures 664 744
Bilingual documents 59 75
Booksdictionaries 30 28
Draw pictures 32 67
Any other ways 136 143
Table III9 Languages Used in Early Head Start Classrooms and Home Visits Spring 2009
Percentage of Children
Children From
Monolingual English
Homes
(n = 425)
Dual Language
Learners
(n = 220) Characteristic
APPENDIX
Source Spring 2009 Baby FACES Home Visitor Program Director Teacher Interviews
Notes Statistics are weighted to represent children near their first birthday who were enrolled in
Early Head Start programs in spring 2009
Children from monolingual English homes are children for whom English was the only language
spoken in the home as reported by parents DLLs are children who live in homes where a
language other than English (LOTE) was spoken in the home regardless of which language was
the primary language spoken by the family
Report to Congress on DLLs in Head Start Page | 149
Childs home language used for classroom
instruction 999 595 655
Language(s) used for classroom instruction
English 999 983 977
Spanish 110 582 665
Asian language 11 10 08
Other language 37 57 59
Table III10 Languages Used in Head Start Classrooms Fall 2006
Percent of Children
Children From
Monolingual E nglish
Homes
(n = 1862)
Dual La nguage
Learners (DLLs)
(n = 942)
DLLs Who Did Not
Pass English Screener
(n = 435) Characteristic
APPENDIX
Source Fall 2006 FACES Teacher Interview
Notes Statistics are weighted to represent all children entering Head Start for the first time in fall 2006
Children from monolingual English homes are children for whom English was the only language spoken in
the home as reported by parents DLLs are children who live in homes where a language other than English
(LOTE) was spoken in the home regardless of which language was the primary language spoken by the
family
Report to Congress on DLLs in Head Start Page | 150
Staff speaking childrsquos home
language available in program NA 847 915
Child wants someone in program
to speak hisher home language NA 374 522
Table III11 Languages Used in Head Start Programs and by Staff Fall 2006
Percent of Children
Children From
Monolingual English
Homes
(n = 1862)
DLLs Who Did Not
Pass English
Screener
(n = 435)
Dual Language
Learners (DLLs)
(n = 942) Characteristic
APPENDIX
Source Fall 2006 FACES Parent Interview
Notes Statistics are weighted to represent all children entering Head Start for the first time in fall
2006
Children from monolingual English homes are children for whom English was the only language
spoken in the home as reported by parents DLLs are children who live in homes where a language
other than English (LOTE) was spoken in the home regardless of which language was the primary
language spoken by the family
NA = not applicable
Report to Congress on DLLs in Head Start Page | 151
APPENDIX
Table III12 Language of Non-Supervisory Child Development Staff in Migrant and Seasonal Head
Start (MSHS) and American IndianAlaska Native (AIAN) Programs (Percent of Staff) 2007-2008
Mean
(SD) Range
MSHS
Proficient in a language other than English 570
(292)
0-100
AIAN
Proficient in a language other than English 206
(299)
0-100
Source 2007-2008 PIR
Notes Non-supervisory child development staff includes teachers assistant teachers home-based
visitors and family child care teachers
DLLs are children who live in homes where a language other than English is the primary language
spoken by the family at home
Report to Congress on DLLs in Head Start Page | 152
Mean Number of Non-Focus Children
Participating in Visit 08 07
Mean Number of Adults Participating in Visit 16 10
Home Visit Conducted in (Percent)
English 994 371
Spanish 32 734
Other Language 12 00
If Home Visit Conducted in Language Other than
English Interpreter Used (Percent) 00 36
Length of Home Visit (minutes) 848 817
Home Visit Activities (Percent)
ChildParent ObservationAssessment 682 585
Feedback on Parent-Child Interactions 487 346
Provision of Education andor Information 752 605
Problem Solving 408 350
Goal SettingPlanning 500 524
Crisis Intervention 97 33
Facilitate Parent-Child Interaction 425 500
Observation of Parent-Child Interactions 406 394
Provision of Emotional Support to Parent 338 292
Play 796 820
Other 51 28
Home Visit Time per Topic (Percent)
Child-Focused Activities 476 501
ParentFamily-Focused Activities 177 184
Parent-Child-Focused Activities 135 157
Staff-Family Relationship-Building Activities 155 120
Crisis Management Activities 52 40
Alignment of Home Visit Activities with Planned
Activities 43 43
Table III13 Home Visit Characteristics in Early Head Start Spring 2009
Mean or Percent
Children From
Monolingual English
Homes
(n=189)
Dual Language
Learners
(n=126) Characteristics
APPENDIX
Source Spring 2009 Baby FACES Home Visit Observations
Notes Statistics are weighted to represent children near their first birthday who were
enrolled in Early Head Start programs in spring 2009
Children from monolingual English homes are children for whom English was the only
language spoken in the home as reported by parents DLLs are children who live in homes
where a language other than English (LOTE) was spoken in the home regardless of which
language was the primary language spoken by the family
Report to Congress on DLLs in Head Start Page | 153
HOVRS-A Overall Quality 33 36
Visitor Strategies Quality 31 34
Responsiveness to Family 30 32
Relationship with Family 40 41
Faciltiation of Parent-Child Interaction 28 32
Non-Intrusiveness 27 32
Effectiveness Quality 35 38
Parent-Child Interaction 32 36
Parent Engagement 32 33
Child Engagement 41 46
Observer Rating of Visit Quality 32 37
Table III14 Observed Home Visit Quality in Early Head Start Spring 2009
Percent of Children
Children From
Monolingual English
Homes
(n = 189)
Dual Language
Learners
(n = 126) Math Activity
a
APPENDIX
Source Spring 2009 Baby FACES Home Visit Observations
Notes Statistics are weighted to represent children near their first birthday who were
enrolled in Early Head Start programs in spring 2009
Children from monolingual English homes are children for whom English was the
only language spoken in the home as reported by parents DLLs are children who
live in homes where a language other than English (LOTE) was spoken in the home
regardless of which language was the primary language spoken by the family
a HOVRS-A = Home Visit Rating Scales-Adapted
Report to Congress on DLLs in Head Start Page | 154
Percent of Children
Children with Disabilities 138 75 93
Percent of Children with Disabilities
Speech or Language Impairment 733 760 818
a
Cognitive Impairment 223 206 257
b
BehavioralEmotional Impairment 147 83 78
c
Sensory Impairment 118 130 69
d
Physical Impairment 85 42 48
Child has IEP or ISFP 382 531 528
Percent of Children with Disabilities
Having Multiple Impairments 213 190 201
Table III15 Disability Categories for Head Start Children with Disabilities Fall 2006
Percent of Children
Children From
Monolingual English
Homes
(n = 1862)
Dual Language
Learners (DLLs)
(n = 942)
DLLs Who Did Not Pass
English Screener
(n = 435) Characteristic
APPENDIX
Source Fall 2006 FACES Teacher Child Report
Notes Statistics are weighted to represent all children entering Head Start for the first time in fall 2006
Teachers were asked whether a professional had indicated that the child had a developmental problem delay or other special need and to indicate the specific need or disability
Percentages do not add to 100 because children can be reported to have more than one impairment across the impairment categories
Children from monolingual English homes are children for whom English was the only language spoken in the home as reported by parents DLLs are children who live in homes where a language other than English (LOTE) was spoken in the home regardless of which language was the primary language spoken by the family
a
Cognitive Impairment includes the following mental retardation autismpervasive developmental b
BehavioralEmotional Impairment includes behavior problems hyperactivity and ADHD c
Sensory Impairment includes deafness other hearing impairment blindness and other visual impairment d
Physical Impairment includes motor impairment
Report to Congress on DLLs in Head Start Page | 155
Percent of Children
Children From Monolingual
English Homes
(n=425)
Dual Language
Learners
(n=220) Type of Service
a
Table III16 Services Provided by Early Head Start Programs Referral or Community Partners
Spring 2009
Employment assistance 973 994
Education or job training 989 994
Legal assistance 970 996
Housing assistance 1000 1000
Financial counseling 1000 1000
Family literacy services 1000 1000
Pediatrician services 976 989
Adult health care 954 987
Disability services for parents 936 981
Dental care 983 989
Substance abuse services 984 1000
Mental health screenings 989 994
Mental health assessments 1000 1000
Therapy 1000 1000
Care coordination 945 982
Staff consultationfollow-up 1000 1000
TrainingTechnical assistanceSupport for staff 85 94
TrainingAwarenessSupport groups for families
Other mental health service
131 199
81 155
APPENDIX
Source Spring 2009 Baby FACES Program Director Interview
Notes Statistics are weighted to represent children near their first birthday who were enrolled in
Early Head Start programs in spring 2009
Children from monolingual English homes are children for whom English was the only language
spoken in the home as reported by parents DLLs are children who live in homes where a language
other than English (LOTE) was spoken in the home regardless of which language was the primary
language spoken by the family
a
For each service program directors were asked to indicate whether the service was provided
directly by Early Head Start staff by a referral or by a community partner on- or off-site
Report to Congress on DLLs in Head Start Page | 156
Program offers or makes available any of the
following services for DLLs 791 984
Services offered among programs offering services for DLLs
Assessment of English 500 557
Assessment of readingwriting 481 537
Activitiesworkshops for parents 493 643
Help applying for medical insurance 900 989
Help scheduling pre-k screening 818 896
Information about Head Start 941 1000
Information about adult ESL 908 981
Information on community resources 927 996
Help obtaining health services 941 1000
Table III17 Early Head Start Program Services Offered for Dual Language Learners
(DLLs) Spring 2009
Percent of Children
Children From
Monolingual English
Homes
(n=425)
Dual Language
Learners
(n=220) Services for DLLs
APPENDIX
Source Spring 2009 Baby FACES Program Director Interview
Notes Statistics are weighted to represent children near their first birthday who were enrolled
in Early Head Start programs in spring 2009
Children from monolingual English homes are children for whom English was the only
language spoken in the home as reported by parents DLLs are children who live in homes
where a language other than English (LOTE) was spoken in the home regardless of which
language was the primary language spoken by the family
Report to Congress on DLLs in Head Start Page | 157
Mother currently enrolled in program course class or
workshop 314 215
Father currently enrolled in program course class or workshop 139 95
Head Start helped mother take or locate programs courses classes or workshops 122 188
Head Start helped father take or locate programs courses classes or workshops 34 94
During past year family received
Help finding good child care 206 205
Help getting to and from work or other places 140 110
Disability services 55 47
Short-term help getting or paying for things you need in
an emergency 167 128
Help finding a job 91 105
Education or job training 95 102
Help with a legal problem 58 30
Help finding or paying for housing 110 79
Counseling on how to manage money 102 87
Training on how to read and write 15 64
Classes to learn English 09 231
Health services 154 330
Table III18 Early Head Start Parent Education and Training Experiences and Family Receipt of
Community Services Spring 2009
Percent of Children
Children From
Monolingual English
Homes
(n=425)
Dual Language
Learners
(n=220) Characteristic
APPENDIX
Source Spring 2009 Baby FACES Parent Interview
Notes Statistics are weighted to represent children near their first birthday who were enrolled in
Early Head Start programs in spring 2009
Children from monolingual English homes are children for whom English was the only language
spoken in the home as reported by parents DLLs are children who live in homes where a language
other than English (LOTE) was spoken in the home regardless of which language was the primary
language spoken by the family
Report to Congress on DLLs in Head Start Page | 158
Head Start helped parent find a regular health
care provider for child 59 109 81
Head Start provided information on health
care providers 597 754 576
Head Start made referrals to health care
providers 322 196 373
Head Start provided health care directly 59 33 52
Head Start provided other type of assistance
in finding health care providers 22 17 00
Community or government services family
currently receives
Help with housing 116 38 48
Training for a job 24 19 16
Help finding a job 40 28 25
Help to go to school or college 61 52 58
ESL classes 06 152 153
Transportation to or from work or training 16 18 17
Child care 84 49 34
Alcohol or drug treatment or counseling 04 04 03
Advice from a lawyer 28 07 04
Mental health services or counseling 35 16 11
Help dealing with family violence 08 15 12
Help or counseling for other family problems 24 14 06
Dental or orthodontic care 124 83 89
Head Start made parents aware of or helped
them obtain
Housing 11 03 04
Job training Job search assistance
Transportation to or from work or training 08 04 04
School assistance 06 01
ESL classes 01 30 30
Child care 07 04 01
Counseling or other assistance (includes
Alcohol or drug treatment or counseling
Legal advice Mental health services Help
dealing with family violence and Help or
counseling for other family problems) 10 06 04
Dental or orthodontic care 29 20 18
One or more of these services (type not
specified) 44 52 63
Any of these services 116 119 125
None of these services 884 881 875
Table III19 Types of Services H ead Start Programs Provide Families Spring 2007
Percent of Children
Children From
Monolingual English
Homes
(n = 1862)
DLLs Who Did Not
Pass English
Screener
(n = 435)
Dual Language
Learners (DLLs)
(n = 942) Characteristic
Report to Congress on DLLs in Head Start Page | 159
APPENDIX
Source Spring 2007 FACES Parent Interview
Notes Statistics are weighted to represent all children entering Head Start for the first time in fall 2006 and who
were still enrolled in spring 2007
Children from monolingual English homes are children for whom English was the only language spoken in the
home as reported by parents DLLs are children who live in homes where a language other than English (LOTE)
was spoken in the home regardless of which language was the primary language spoken by the family
APPENDIX
Table III20 Head Start Childrens Parents Participation in Education and Training Activities
Spring 2007
Percent of Children
Characteristic
Children From
Monolingual English
Homes
(n = 1862)
Dual La nguage
Learners (DLLs)
(n = 942)
DLLs Who Did Not
Pass English Screener
(n = 435)
Mother currently enrolled in program
course class or workshop 288 189 176
Father currently enrolled in program
course class or workshop 174 91 53
Head Start helped mother take or
locate programs courses classes
or workshops 25 59 46
Head Start helped father take or
locate programs courses classes
workshops 02 06 07
Source Spring 2007 FACES Parent Interview
Notes Statistics are weighted to represent all children entering Head Start for the first time in fall 2006 and
who were still enrolled in spring 2007
Estimates in this table reflect the characteristics of childrens parents after the childs first (or only) year in the
Head Start program
Children from monolingual English homes are children for whom English was the only language spoken in the
home as reported by parents DLLs are children who live in homes where a language other than English
(LOTE) was spoken in the home regardless of which language was the primary language spoken by the
family
Report to Congress on DLLs in Head Start Page | 160
APPENDIX
Table III21 Percentage of Families Who Received Family Services Through the Program Or
Through Referrals within Migrant and Seasonal Head Start (MSHS) Programs 2007-2008
Service Percent of Families
Emergencycrisis intervention (meeting immediate needs for
food clothing or shelter) 120
Housing assistance (subsidies utilities repairs etc) 50
Transportation assistance 158
Mental health services 96
English as a Second Language (ESL) training 148
Adult education (GED programs college selection) 76
Job training 42
Substance abuse prevention or treatment 47
Child abuse and neglect services 68
Domestic violence services 45
Child support services 12
Health education (including prenatal education) 388
Assistance to families of incarcerated individuals 09
Parenting education 421
Marriage education services 39
At least one of the services listed above 580
Source 2007-2008 PIR
Notes Head Start Early Head Start and MSHS are mutually exclusive program types
DLLs are children who live in homes where a language other than English is the primary
language spoken by the family at home
Report to Congress on DLLs in Head Start Page | 161
APPENDIX
Table III22 Percentage of Children Who Were Served by the Mental Health (MH)
Professional(s) within Migrant and Seasonal Head Start (MSHS) Programs 2007-2008
Mental Health Service Percent of Children
MH professional consulted with program staff about the
childrsquos behaviormental health 55
MH professionals provided three or more consultations with
program staff 13
MH professional consulted with parent(s) about the childrsquos
behaviormental health 14
MH professionals provided three or more consultations with
parent(s) 07
MH professional provided an individual mental health
assessment
MH professional facilitated a referral for MH services
Referred for MH services outside of the program
11
09
08
of children who received MH services 04
Source 2007-2008 PIR
Note DLLs are children who live in homes where a language other than English is the
primary language spoken by the family at home
Report to Congress on DLLs in Head Start Page | 162
Table III23 Early Head Start Family Activities and Events Spring 2009
Percent of Children
Children From
Monolingual English
Homes
(n=425)
Dual Language
Learners
(n=220) Type of Activity
a
Group socializations 1000 1000
Events for the entire family 1000 1000
Workshops on parenting 993 1000
Materials or workshops on child sleep practices 971 966
Literacy activities 50 109
Transition activities 75 06
Other activities 96 88
Activities to involve fathers or father figures
Events or activities specifically for fathers 763 671
Efforts to include fathers in home visits or group
socializations 968 974
Employment or job training services for fathers 466 385
APPENDIX
Source Spring 2009 Baby FACES Program Director Interview
Notes Statistics are weighted to represent children near their first birthday who were enrolled in
Early Head Start programs in spring 2009
Children from monolingual English homes are children for whom English was the only language
spoken in the home as reported by parents DLLs are children who live in homes where a
language other than English (LOTE) was spoken in the home regardless of which language was
the primary language spoken by the family
a
Among home-based or combination programs
Report to Congress on DLLs in Head Start Page | 163
Family attended group activities for parents and their
children 678 795
Family attended workshops on job skills 135 310
Family attended parent education meetings or
workshops on raising children 365 573
Family attended events just for menfathers 118 177
Family volunteered in an Early Head Start classroom 368 473
Family attended an Early Head Start social event 61 637
Family participated on the Policy Council 159 157
Family volunteered to help out at program or served
on a committee but not in a classroom or on Policy
Council 19 197
Family took part in center activities in some other way 203 92
APPENDIX
Table III24 Family Involvement in Early Head Start Program Activities Spring 2009
Activity
Percent of Children
Children From
Monolingual English
Homes
(n=425)
Dual Language
Learners
(n=220)
Source Spring 2009 Baby FACES Parent Interview
Notes Statistics are weighted to represent children near their first birthday who were enrolled in
Early Head Start programs in spring 2009
Children from monolingual English homes are children for whom English was the only language
spoken in the home as reported by parents DLLs are children who live in homes where a
language other than English (LOTE) was spoken in the home regardless of which language was
the primary language spoken by the family
Report to Congress on DLLs in Head Start Page | 164
Report to Congress on DLLs in Head Start Page | 165
APPENDIX
Table III25 Satisfaction with Head Start Spring 2007
Percent of Children
Children From
Monolingual English
Homes
(n = 1 862)
Dual Language
Learners (DLLs)
(n = 9 42)
DLLs Who Did Not
Pass English Screener
(n = 4 35) Characteristic
Parent Very Satisfied With Head Start in
Helping child develop 829 879 877
Identifyingproviding services 831 824 823
Maintaining a safe program 869 844 835
Preparing child for kindergarten 821 860 865
Parent Satisfaction With Head Start - Child Related Subscalea
Mean 380 382 383
Possible response range 1-4 1-4 1-4
Parent Very Satisfied With Head Start in
Being open to parents participation 756 789 787
Respecting culture and background 8398 8382 8376
Identifyingproviding familiy services 6478 6042 5904
Supporting community involvement 559 633 654
Parent Satisfaction With Head Start - Family Related Subscaleb
Mean 362 364 365
Possible response range 1-4 1-4 1-4
Experiences Parents Report Always
Child feels safe in Head Start (A) 867 872 872
Child gets lots of individual attention (B) 544 612 604
Teacher open to new information (C) 789 824 846
Child happy in Head Start (D) 823 886 889
Teacher warm towards child (E) 843 835 825
Child treated with respect by teachers (F) 890 900 905
Teacher takes interest in child (G) 834 849 850
Child feels accepted by teacher (H) 877 891 898
Teacher supportive of parent (I) 877 864 868
Parent feels welcomed by teacher (K) 887 918 931
Teacher handles discipline matters easily without
being harsh (L) 850 850 849
Teacher seems happy and content (M) 828 877 894
Aide warm towards child (N) 864 886 905
Parent and Child Experiences in Head Startc
Mean 376 378 378
Possible response range 1-4 1-4 1-4
Source Spring 2007 FACES Parent Interview
Notes Statistics are weighted to represent all children entering Head Start for the first time in fall 2006 and who were still
enrolled in spring 2007
Children from monolingual English homes are children for whom English was the only language spoken in the home as
reported by parents DLLs are children who live in homes where a language other than English (LOTE) was spoken in the
home regardless of which language was the primary language spoken by the family
a
The Child Related Subscale is based on items A D F and G For each item a response of Very Dissatisfied contributed 1
point to the scale Somewhat Dissatisfied contributed 2 points Somewhat Satisfied contributed 3 points and Very
Satisfied contributed 4 points to the scale
b
The Family Related Subscale is based on items B C E and H For each item a response of Very Dissatisfied contributed
1 point to the scale Somewhat Dissatisfied contributed 2 points Somewhat Satisfied contributed 3 points and Very
Satisfied contributed 4 points to the scale
c
This composite is based on the 13 items listed above it For each item a response of Never contributed 1 point to the
scale Sometimes contributed 2 points Often contributed 3 points and Always contributed 4 points to the scale
APPENDIX
Table III26 Characteristics of Early Head Start Programs Formal Written Partnerships Spring
2009
Language
Other than
English
in Home
(LOTE)
n=258
Primary
Language
Other than
English in Home
(LOTE-P)
n=220
Monolingial
English Home
in Home
n=425
Percent of Children
Characteristic
Program has a formal written partnership
with child care provider 366 376 392
Program has a formal written partnership
with a Part C agency 962 737 717
Source Spring 2009 Baby FACES Program Director Interview
Notes Statistics are weighted to represent children near their first birthday who were enrolled in
Early Head Start programs in spring 2009
Children from monolingual English homes are children for whom English was the only language
spoken in the home as reported by parents DLLs are children who live in homes where a language
other than English (LOTE) was spoken in the home regardless of which language was the primary
language spoken by the family
Report to Congress on DLLs in Head Start Page | 166
Gender
Female 1000 1000
Male 00 00
RaceEthnicity
White 603 821 260
African-American 244 90 143
HispanicLatino 93 42 502
AIAN 07 06 00
Asian or Pacific Islander 09 06 11
Multi-RacialBi-Racial 35 30 68
Other 07 05 16
a
Mean CES-D Short Form Scale Score 29 41
CES-D Short Form Categories
Not depressed 803 751
Mildly depressed 161 85
Moderately depressed 09 108
Severely depressed 26 56
APPENDIX
Table IV1 Early Head Start Teacher Demographic and Background Characteristics Spring
2009
Percent of Children
Children From
Monolingual English
Homes
(n = 217)
Dual Language
Learners
(n = 78) Teacher Background
Source Spring 2009 Baby FACES Caregiver Interview
Notes Statistics are weighted to represent children near their first birthday who were enrolled in
Early Head Start programs in spring 2009
Children from monolingual English homes are children for whom English was the only language
spoken in the home as reported by parents DLLs are children who live in homes where a
language other than English (LOTE) was spoken in the home regardless of which language was
the primary language spoken by the family
a
The Center for Center for Epidemiologic Studies Depression Scale (CES-D Radloff 1977) Total
score can range from 0 to 36 Scores ranging from 0 to 4 are coded as Not Depressed from 5 to
9 as Mildly Depressed from 10 to 14 as Moderately Depressed and 15 and above as Severely
Depressed
Report to Congress on DLLs in Head Start Page | 167
Gender
Female 991 1000
Male 09 00
RaceEthnicity
White non-Hispanic 821 167
African-American non-Hispanic 90 30
HispanicLatino 42 730
American Indian or Alaska Native non-Hispanic 06 18
Asian or Pacific Islander 06 18
Multi-RacialBi-Racial non-Hispanic 30 29
Other 05 08
b
Mean CES-D Short Form Scale Score 37 26
CES-D Short Form Categories
Not depressed 661 785
Mildly depressed 221 174
Moderately depressed 108 41
Severely depressed 10 00
APPENDIX
a
Table IV2 Early Head Start Home Visitor Demographic and Background Characteristics
Spring 2009
Percent of Children
Children From
Monolingual English
Homes
(n = 198)
Dual Language
Learners
(n = 136) a
Home Visitor Background
Source Spring 2009 Baby FACES Home Visitor Interview
Note Statistics are weighted to represent children near their first birthday who were enrolled in
Early Head Start programs in spring 2009
Children from monolingual English homes are children for whom English was the only language
spoken in the home as reported by parents DLLs are children who live in homes where a
language other than English (LOTE) was spoken in the home regardless of which language was
the primary language spoken by the family
a
The term home visitor refers to frontline staff working in a home-based setting with primary
responsibility for one or more children
b
The Center for Center for Epidemiologic Studies Depression Scale (CES-D Radloff 1977) Total
score can range from 0 to 36 Scores ranging from 0 to 4 are coded as Not Depressed from 5 to
9 as Mildly Depressed from 10 to 14 as Moderately Depressed and 15 and above as Severely
Depressed
Report to Congress on DLLs in Head Start Page | 168
Gender
Female 971 996 997
Male 29 04 03
Age
18 ndash 29 177 163 182
30 ndash 39 247 287 373
40 - 49 338 310 220
50 - 59 198 210 195
60 or Older 40 31 30
RaceEthnicity
White non-Hispanic 472 294 267
African-American non-Hispanic 446 149 122
HispanicLatino 59 471 538
American Indian or Alaska Native
non-Hispanic 01 21 28
Asian or Pacific Islander 09 33 25
Multi-RacialBi-Racial non-Hispanic 04 11 09
Other 09 20 11
a
Mean CES-D Short Form Scale Score 46 39 41
CES-D Short Form Categories
Not depressed 609 710 718
Mildly depressed 255 173 148
Moderately depressed 94 66 74
Severely depressed 42 51 60
Table IV3 Lead Head Start Teacher Demographic Characteristics and Depressive Symptoms Fall
2006
APPENDIX
Percent of Children
Children From
Monolingual English
Homes
(n = 1862)
DLLs Who Did Not
Pass English
Screener
(n = 435)
Dual Language
Learners (DLLs)
(n = 942) Teacher Background
Source Fall 2006 FACES Teacher Interview
Notes Statistics are weighted to represent all children entering Head Start for the first time in fall 2006
Children from monolingual English homes are children for whom English was the only language spoken in
the home as reported by parents DLLs are children who live in homes where a language other than
English (LOTE) was spoken in the home regardless of which language was the primary language spoken by
the family
a
The Center for Center for Epidemiologic Studies Depression Scale (CES-D Radloff 1977) Total score can
range from 0 to 36 Scores ranging from 0 to 4 are coded as Not Depressed from 5 to 9 as Mildly
Depressed from 10 to 14 as Moderately Depressed and 15 and above as Severely Depressed
Report to Congress on DLLs in Head Start Page | 169
Years Working in Early Head Start
0-1 Years 90 37
1-2 Years 257 261
3-4 Years 255 223
5-9 Years 270 335
10+ Years 128 143
Highest Level of Education
Less than High School 18 31
High School Diploma or Equivalent 58 128
Some College 244 288
Associatersquos Degree (AA) 368 247
Bachelorrsquos Degree (BA) 301 306
Graduate or Professional Degree 09 00
Field of Study Includes Early Childhood Education or
Child Development 653 445
Has a CDAa
489 676
Has a State-Awarded Preschool Certificate or License 370 370
Currently Enrolled in Child Care Related Training 508 516
Teacher Experience
Mean Years Working in Early Head Start 47 51
Mean Years TeachingCaring for InfantsToddlers 77 58
APPENDIX
Table IV4 Early Head Start Teacher Qualifications and Earnings Spring 2009
Percent of Children
Children From
Monolingual English
Homes
(n = 217)
Dual Language
Learners (DLLs)
(n = 78) Teacher Education and Credentials
Source Spring 2009 Baby FACES Teacher Interview
Notes Statistics are weighted to represent children near their first birthday who were enrolled
in Early Head Start programs in spring 2009
Children from monolingual English homes are children for whom English was the only language
spoken in the home as reported by parents DLLs are children who live in homes where a
language other than English (LOTE) was spoken in the home regardless of which language was
the primary language spoken by the family
a
CDA = Child Development Associate credential
Report to Congress on DLLs in Head Start Page | 170
Years Working in Early Head Start
0-1 Years 75 113
1-2 Years 188 303
3-4 Years 150 153
5-9 Years 407 378
10+ Years 180 53
Highest Level of Education
Less than High School 21 18
High School Diploma or Equivalent 09 21
Some College 156 248
Associatersquos Degree (AA) 258 244
Bachelorrsquos Degree (BA) 448 383
Graduate or Professional Degree 108 87
Field of Study Includes Early Childhood Education 722 642
Has a CDA 405 450
Has a State-Awarded Certificate 324 450
Currently Enrolled in Child Care Related Training 324 357
Home Visitor Experience
Mean Years Working in Early Head Start 56 44
Mean Years TeachingCaring for InfantsToddlers 103 69
a
Table IV5 Early Head Start Home Visitor Qualifications and Earnings Spring 2009
Percent of Children
Children From
Monolingual English
Homes
(n = 198)
Dual Language
Learners
(n = 136) a
Home Visitor Education and Credentials
APPENDIX
Source Spring 2009 Baby FACES Home Visitor Interview
Notes Statistics are weighted to represent children near their first birthday who were enrolled in
Early Head Start programs in spring 2009
Children from monolingual English homes are children for whom English was the only language
spoken in the home as reported by parents DLLs are children who live in homes where a
language other than English (LOTE) was spoken in the home regardless of which language was
the primary language spoken by the family
a
The term home visitor refers to frontline staff working in a home-based setting with primary
responsibility for one or more children
Report to Congress on DLLs in Head Start Page | 171
Years Teaching in Head Start
1-2 Years 170 151 163
3-4 Years 123 105 73
5-9 Years 403 334 376
10+ Years 304 410 388
Highest Level of Education
High School Diploma or Equivalent 22 45 41
Some College 162 89 86
Associatersquos Degree (AA) 364 495 561
Bachelorrsquos Degree (BA) 418 336 271
Graduate or Professional Degree 34 34 41
Of Those with an AA or Higher Highest
Degree is in Early Childhood Education 455 283 280
Of Those with an AA or Higher Completed 6+
a
Courses in Early Childhood Education 918 880 892
Has a CDA 538 595 602
Has a State-Awarded Preschool Certificate 229 468 457
Has a Teaching Certificate or License 364 590 564
Currently Enrolled in Teacher Related Training 392 416 438
Average Experience and Salary of Childrenrsquos Teachers
Mean Years Teaching in Head Start 849 859 847
Mean Years in Current Program 806 765 755
Mean Years Teaching 1208 1266 1248
Mean Annual Salary (in dollars) 2247305 2658018 2629590
APPENDIX
Table IV6 Lead Head Start Teacher Qualifications and Earnings Fall 2006
Percent of Children
Children From
Monolingual English
Homes
(n = 1862)
Dual Language
Learners (DLLs)
(n = 942)
DLLs Who Did Not
Pass English Screener
(n = 435)
Teacher Education Credentials and
Earnings
Source Fall 2006 FACES Teacher Interview
Notes Statistics are weighted to represent all children entering Head Start for the first time in fall 2006
Children from monolingual English homes are children for whom English was the only language spoken in the
home as reported by parents DLLs are children who live in homes where a language other than English (LOTE)
was spoken in the home regardless of which language was the primary language spoken by the family
a
Includes coursework in early childhood education regardless of academic major
Report to Congress on DLLs in Head Start Page | 172
Highest Level of Education
High School or GED 84 111
AA Degree 108 139
BA Degree 561 476
Postgraduate Degree 254 274
Has a CDA 08 25
Has a State-Awarded Preschool Certificate or License 30 43
Table IV7 Early Head Start Program ManagerSupervisor Education and Credentials Spring
2009
APPENDIX
Percent of Children
Children From
Monolingual English
Homes
(n = 425)
Dual Language
Learners
(n = 220) Program ManagerSupervisor Education and Credentials
Source Spring 2009 Baby FACES Program Director Self-Administered Questionnaire
Notes Statistics are weighted to represent children near their first birthday who were enrolled in
Early Head Start programs in spring 2009
Children from monolingual English homes are children for whom English was the only language
spoken in the home as reported by parents DLLs are children who live in homes where a language
other than English (LOTE) was spoken in the home regardless of which language was the primary
language spoken by the family
Report to Congress on DLLs in Head Start Page | 173
Highest Level of Education
High School Diploma or Equivalent 45 65 81
Associatersquos Degree (AA) 128 212 267
Bachelorrsquos Degree (BA) 496 288 280
Graduate or Professional Degree 331 435 372
Of Those with an AA or Higher Highest Degree is in 206 116 103
Early Childhood Education
Of Those with an AA or Higher Completed 6+ 972 938 943
Courses in Early Childhood Educationa
Has a Child Development Associate (CDA) 387 466 519
Has a State-Awarded Preschool Certificate 243 295 308
Has a Teaching Certificate or License 372 528 568
Mean Years Working in Head Start 1373 1139 1199
Mean Years in Current Program 1204 879 960
Mean Annual Salary (in dollars) 39341 46353 44656
APPENDIX
Table IV8 Head Start Center Director Qualifications and Earnings Fall 2006
Percent of Children
Children From
Monolingual
English Homes
(n = 1862)
DLLs Who Did
Not Pass English
Screener
(n = 435)
Dual Language
Learners (DLLs)
(n = 942) Center Director Education Credentials and Salary
Source Fall 2006 FACES Center Director Interview
Notes Statistics are weighted to represent all children entering Head Start for the first time in fall 2006
Children from monolingual English homes are children for whom English was the only language spoken
in the home as reported by parents DLLs are children who live in homes where a language other than
English (LOTE) was spoken in the home regardless of which language was the primary language spoken
by the family
a
Includes coursework in early childhood education regardless of academic major
Report to Congress on DLLs in Head Start Page | 174
Highest Level of Education
High School Diploma or Equivalent 09 08 15
Associatersquos Degree (AA) 57 22 10
Bachelorrsquos Degree (BA) 460 344 359
Graduate or Professional Degree 474 626 615
Of Those with an AA or Higher Highest
Degree is in Early Childhood Education 479 168 202
Of Those with an AA or Higher Completed 6+
a
Courses in Early Childhood Education 976 979 977
Has a Child Development Associate (CDA) 373 429 372
Has a State-Awarded Preschool Certificate 429 472 485
Has a Teaching Certificate or License 537 632 649
Mean Years Working in Head Start 1525 1432 1540
Mean Years in Current Program 1299 1433 1601
Mean Annual Salary (in dollars) 41178 56071 57219
APPENDIX
Table IV9 Head Start Education Coordinator Qualifications and Earnings Fall 2006
Percent of Children
Children From
Monolingual English
Homes
(n = 1862)
Dual Language
Learners (DLLs)
(n = 942)
DLLs Who Did Not
Pass English Screener
(n = 435)
Education Coordinator Education
Credentials and Earnings
Source Fall 2006 FACES Education Coordinator Interview
Notes Statistics are weighted to represent all children entering Head Start for the first time in fall 2006
Children from monolingual English homes are children for whom English was the only language spoken in the
home as reported by parents DLLs are children who live in homes where a language other than English (LOTE)
was spoken in the home regardless of which language was the primary language spoken by the family
a
Includes coursework in early childhood education regardless of academic major
Report to Congress on DLLs in Head Start Page | 175
Highest Level of Education
High School Diploma or Equivalent 43 58
Associatersquos Degree (AA) 68 44
Bachelorrsquos Degree (BA) 365 264
Graduate or Professional Degree 524 634
Has a CDAa
00 00
Has a State-Awarded Preschool Certificate or
License 06 15
Table IV10 Early Head Start Program Director Education and Credentials Spring 2009
APPENDIX
Percent of Children
Children From
Monolingual English
Homes
(n = 425)
Dual Language
Learners
(n = 220) Program Director Education and Credentials
Source Spring 2009 Baby FACES Program Director Self-Administered Questionnaire
Notes Statistics are weighted to represent children near their first birthday who were
enrolled in Early Head Start programs in spring 2009
Children from monolingual English homes are children for whom English was the only
language spoken in the home as reported by parents DLLs are children who live in homes
where a language other than English (LOTE) was spoken in the home regardless of which
language was the primary language spoken by the family
a
CDA = Child Development Associate credential
Report to Congress on DLLs in Head Start Page | 176
Highest Level of Education
High School Diploma or Equivalent 31 50 63
Associatersquos Degree (AA) 00 00 00
Bachelorrsquos Degree (BA) 371 238 300
Graduate or Professional Degree 598 712 637
Of Those with an AA or Higher Highest Degree is in Early Childhood Education 115 50 51
Of Those with an AA or Higher Completed 6+
Courses in Early Childhood Educationa
758 971 976
Mean Years Working in Head Start 1688 1768 1896
Mean Years in Current Program 1260 1483 1524
Mean Annual Salary (in dollars) 60766 81812 82786
APPENDIX
Table IV11 Head Start Program Director Qualifications and Earnings Fall 2006
Percent of Children
Children From
Monolingual
English Homes
(n = 1862)
DLLs Who Did
Not Pass English
Screener
(n = 435)
Dual Language
Learners (DLLs)
(n = 942) Program Director Education Credentials and Salary
06
Source Fall 2006 FACES Program Director Interview
Notes Statistics are weighted to represent all children entering Head Start for the first time in fall 20
Children from monolingual English homes are children for whom English was the only language spoken
in the home as reported by parents DLLs are children who live in homes where a language other than
English (LOTE) was spoken in the home regardless of which language was the primary language spoken
by the family
a
Includes coursework in early childhood education regardless of academic major
Report to Congress on DLLs in Head Start Page | 177
Turnover rate among frontline staff (Percent of staff who
left program in past 12 months)
Teachers 168 136 Home visitors 156 149
Percent of programs in which a director coordinator or
manager left in the past 12 months 462 557
Mean number of directors coordinators or managers
a
who left in the past 12 months 15 16
Reasons directorscoordinators left (Percent of
a
programs)
Change in careers 224 255 Higher compensationbetter benefits 287 289 Firinglayoff 218 162
Maternity leave 62 97 Personal reasons 487 457 Other 68 104
Range in seniority among teachers
Low end of range (mean) 07 08 High end of range (mean) 105 101
Range in seniority among home visitors
Low end of range (mean) 16 11 High end of range (mean) 85 72
Range in seniority among directorsassistant directors
Low end of range (mean) 88 71 High end of range (mean) 115 98
Range in seniority among coordinators
Low end of range (mean) 42 24 High end of range (mean) 122 10
APPENDIX
Table IV12 Early Head Start Staff Turnover and Seniority Spring 2009
Percent or Mean
Children From
Monolingual English
Homes
(n=425)
Dual Language
Learners
(n=220) Characteristic
Source Spring 2009 Program Director interview
Notes Statistics are weighted to represent children near their first birthday who were
enrolled in Early Head Start programs in spring 2009
Children from monolingual English homes are children for whom English was the only language
spoken in the home as reported by parents DLLs are children who live in homes where a
language other than English (LOTE) was spoken in the home regardless of which language was
the primary language spoken by the family
a
Among programs in which directorscoordinatorsmanagers left
Report to Congress on DLLs in Head Start Page | 178
CDI (English) Raw Score
Vocabulary Comprehension 332 224
Vocabulary Production 36 13
CDI (Spanish) Raw Score
Vocabulary Comprehension NA 356
Vocabulary Production NA 23
a
CDI Conceptual Score (English and Spanish)
Vocabulary Comprehension NA 412
Vocabulary Production NA 32
APPENDIX
Table VI1 Early Head Start Teacher- and Home Visitor Reported MacArthur-Bates Communicative
Development Inventory (CDI) Raw Scores Spring 2009
Mean
Children From
Monolingual English
Homes
(n = 425)
Dual Language Learners
(n = 220)
Source Spring 2009 Baby FACES Staff-Child Report (SCR)
Notes In Early Head Start parlance the term home visitor refers to frontline staff working in a home-
based setting with primary responsibility for one or more children
Teachers rate children in center-based settings on the CDI while home visitors rate children receiving
home-based services
Children from monolingual English homes are children for whom English was the only language spoken
in the home as reported by parents DLLs are children who live in homes where a language other than
English (LOTE) was spoken in the home regardless of which language was the primary language spoken
by the family
Statistics are weighted to represent children near their first birthdays who are enrolled in Early Head
Start programs in spring 2009
NA = not applicable
a
Using a conceptual scoring approach a child is coded as understanding or producing the word concept
for each word in an 89-word checklist if the Early Head Start staff report that the child understood or
produced the word in English andor Spanish
Report to Congress on DLLs in Head Start Page | 179
Parent-Reported BITSEA Raw Score
Problem Domain
Competence Domain
96
163
118
159
Staff-Reported BITSEA Raw Score
Problem Domain
Competence Domain
64
127
57
128
Parent-Reported BITSEA Cut-Off Score
Problem Domain
Competence Domain
230
76
342
153
Staff-Reported BITSEA Cut-Off Score
Problem Domain
Competence Domain
153
136
98
201
a
Parent-Reported BITSEA Screen Positive 285 430
a
Staff-Reported BITSEA Screen Positive 249 246
Table VI2 Early Head Start Parent- and Staff- Reported Brief Infant Toddler Social and
Emotional Assessment (BITSEA) Scores Spring 2009
APPENDIX
Mean
Children From Monolingual
English Homes
(n = 425)
DLLs
(n = 220)
Source Spring 2009 Baby FACES Parent Interview and Staff-Child Report (SCR)
Notes Statistics are weighted to represent children near their first birthday who were
enrolled in Early Head Start programs in spring 2009
Children from monolingual English homes are children for whom English was the only
language spoken in the home as reported by parents DLLs are children who live in homes
where a language other than English (LOTE) was spoken in the home regardless of which
language was the primary language spoken by the family
a
The Screen Positive indicator for the BITSEA combines cutoffs for the Problem Domain
(that is scores in the 75th percentile or higher in the national standardization sample) and
Competence Domain (that is scores lower than the 15th percentile in the national
standardization sample) These cutoffs indicate high levels of problems andor low
competence and may suggest delays in social-emotional competence
Report to Congress on DLLs in Head Start Page | 180
SD SD SD
PPVT-4 Standard Score 1708 876 1338 617 721 1446 175 637 1101
WJ Letter Word Identification Standard Score 1591 943 1745 437 928 1575 9 910 1439
WJ Spelling Standard Score 1661 948 1544 476 944 1580 19 996 1212
WJ Applied Problems Standard Score 1562 902 1727 417 867 1738 11 884 1759
ECLS-B Math IRT Score 1731 74 280 480 72 260 15 53 180
ECLS-B NumberShape Proficiency Probability
Score 1731 026 028 480 023 026 15 008 010
Combined ECLS-BWJ3 Applied Problems IRT
Score 1731 139 670 480 133 610 15 89 450
Story and Print Concepts IRT Scale Score 1565 36 237 666 33 224 293 29 202
PPVT-4 Growth Score Value (GSV) Score 1708 997 1677 617 848 1642 175 728 1074
WJ Letter Word Identification W Ability Score 1591 3046 2079 437 3061 2124 9 3030 1944
WJ Spelling W Ability Score 1661 3436 2815 476 3484 2942 19 3463 2924
WJ Applied Problems W Ability Score 1562 3747 2492 417 3741 2466 11 3700 2529
TVIP Standard Score 19 872 216 643 852 126 353 850 111
WM Letter Word Identification Standard
Score 6 799 695 180 794 1075 180 794 1075
WM Spelling Standard Score 12 915 863 353 884 1113 353 884 1113
WM Applied Problems Standard Score 10 832 1147 289 824 1285 289 824 1285
WM3 Letter Word Identification W Ability
Score 12 2779 1264 380 2781 1487 380 2781 1487
WM3 Spelling W Ability Score 12 3340 2143 386 3240 2669 386 3240 2669
WM3 Applied Problems W Ability Score 12 3538 2870 384 3500 2521 384 3500 2521
Table VI3 Summary Statistics for Head Start (FACES) Child Assessment Standardized Score Data Fall 2006
Children Fr om Monolingual
English Homes
Dual Language Learners
(DLLs)
DLLs Who Did Not Pass
English Screener
Scales N Mean N Mean N Mean
Report to Congress on DLLs in Head Start Page | 181
APPENDIX
Source Fall 2006 FACES Direct Child Assessment
Note Statistics are weighted to represent all children entering Head Start for the first time in fall 2006
Standard scores allow for comparisons of a groups performance to others of the same age (or grade) These scores have a mean of
100 and a standard deviation of 15 W scores allow for measurement of change or growth in performance on the same scale over
time Like raw scores W scores are an indicator of absolute rather than relative performance The WJWM W scale is centered on
500 which approximates the average score of a 10-year-old child PPVT-4 Growth Score Value (GSV) scores are similar to W scores
and can range from 12 to 271
The numbershape proficiency probability scores indicate the probability that a child would have passed the proficiency level and
can be interpreted as the percent of the population who have mastered this skill or skill set (eg 25 x 100 = 25 of Head Start
children are able to demonstrate these skills at the start of the program year) These scores can take on any value from zero to one
Children from monolingual English homes are children for whom English was the only language spoken in the home as reported by
parents DLLs are children who live in homes where a language other than English (LOTE) was spoken in the home regardless of
which language was the primary language spoken by the family
NA = not applicable
Interpret data with caution Standard error is large due to small sample size
Report to Congress on DLLs in Head Start Page | 182
APPENDIX
Table VI4 Summary Statistics for Head Start Exit FACES Child Assessment Standardized Score Data Spring 2007 and Spring 2008
Children From Monolingual
English Homes
Dual Language Learners
(DLLs)
DLLs Who Did Not Pass
English Screener
Scales N Mean SD N Mean SD N Mean SD
PPVT-4 Standard Score 1239 915 1314 681 766 1467 288 700 1388
WJ Letter Word Identification Standard Score 1239 988 1402 636 975 1494 247 948 1419
WJ Spelling Standard Score 1244 963 1558 641 989 1373 247 969 1355
WJ Applied Problems Standard Score 1233 903 1345 614 854 1362 230 823 1298
ECLS-B Math IRT Score 1248 120 351 644 111 361 250 100 331
ECLS-B NumberShape Proficiency Probability Score 1248 069 029 644 060 032 250 051 032
Combined ECLS-BWJ3 Applied Problems IRT Score 1248 239 717 644 221 745 250 197 703
Story and Print Concepts IRT Scale Score 1223 61 222 621 55 233 237 49 240
PPVT-4 Growth Score Value (GSV) Score 1239 1199 1463 681 1033 1731 288 954 1650
WJ Letter Word Identification W Ability Score 1239 3347 2688 636 3330 2971 247 3272 2792
WJ Spelling W Ability Score 1244 3798 2953 641 3852 2633 247 3805 2610
WJ Applied Problems W Ability Score 1233 4005 2011 614 3941 2112 230 3888 1980
TVIP Standard Score 12 883 143 485 820 149 261 825 145
WM Letter Word Identification Standard Score 1 950 000 52 826 1205 49 829 1212
WM Spelling Standard Score 1 1200 000 55 847 1182 52 844 1206
WM Applied Problems Standard Score 1 1020 000 51 753 1775 48 750 1762
WM3 Letter Word Identification W Ability Score 1 3450 000 57 2995 2391 54 2999 2408
WM3 Spelling W Ability Score 1 4370 000 57 3522 2668 54 3516 2715
WM3 Applied Problems W Ability Score 1 4320 000 57 3683 3102 54 3678 3074
Source Spring 2007 and Spring 2008 FACES Direct Child Assessment
Notes Statistics are weighted to represent all children who entered Head Start for the first time in the fall of 2006 and who were either (1)
completing Head Start in the spring of 2007 (children in the 4-year-old cohort) or (2) completing Head Start in the spring of 2008 (children in the
3-year-old cohort)
Standard scores allow for comparisons of a groups performance to others of the same age (or grade) These scores have a mean of 100 and a
standard deviation of 15 W scores allow for measurement of change or growth in performance on the same scale over time Like raw scores W
scores are an indicator of absolute rather than relative performance The WJWM W scale is centered on 500 which approximates the average
score of a 10-year-old child PPVT-4 Growth Score Value (GSV) scores are similar to W scores and can range from 12 to 271
The numbershape proficiency probability scores indicate the probability that a child would have passed the proficiency level and can be
interpreted as the percent of the population who have mastered this skill or skill set (eg 25 x 100 = 25 of Head Start children are able to
demonstrate these skills at the start of the program year) These scores can take on any value from zero to one
Children from monolingual English homes are children for whom English was the only language spoken in the home as reported by parents
DLLs are children who live in homes where a language other than English (LOTE) was spoken in the home regardless of which language was the
primary language spoken by the family
NA = not applicable
Interpret data with caution Standard error is large due to small sample size
Table VI5 Summary Statistics for Fall 2006 and Spring Prekindergarten Head Start (FACES) Child Assessment Standardized
Score Data
Report to Congress on DLLs in Head Start Page | 183
APPENDIX
Children F rom
Monolingual English
Homes
Dual Language Learners
(DLLs)
DLLs Who Did Not Pass
English S creener
Head
Start
Entry
Head
Start
Exit
Head
Start
Entry
Head
Start
Exit
Head
Start
Entry
Head
Start
Exit Scales N N N
PPVT-4 Standard Score 1172 874 919 494 718 798 132 632 739
WJ Letter Word Identification Standard Score 1102 938 992 357 930 997 9 885 1045
WJ Spelling Standard Score 1143 935 967 384 943 1002 17 1020 999
WJ Applied Problems Standard Score 1080 897 914 342 862 877 10 864 809
ECLS-B Math IRT Score 1191 78 121 390 73 119 15 51 100
ECLS-B NumberShape Proficiency Probability Score 1191 029 069 390 024 067 15 007 052
Combined ECLS-BWJ3 Applied Problems IRT Score 1191 146 241 390 135 237 15 84 196
Story and Print Concepts IRT Scale Score 1051 38 62 306 38 60 9 10 37
PPVT-4 Growth Score Value (GSV) Score 1172 1009 1204 494 856 1074 132 736 1006
WJ Letter Word Identification W Ability Score 1102 3058 3358 357 3070 3379 9 2998 3450
WJ Spelling W Ability Score 1143 3440 3810 384 3503 3881 17 3515 3851
WJ Applied Problems W Ability Score 1080 3760 4024 342 3745 3980 10 3671 3872
TVIP Standard Score 12 952 883 434 858 829 242 854 830
WM Letter Word Identification Standard Score 0 NA NA 24 742 845 24 742 845
WM Spelling Standard Score 1 810 1200 47 887 847 47 887 847
WM Applied Problems Standard Score 1 910 1020 34 748 810 34 748 810
WM3 Letter Word Identification W Ability Score 1 2640 3450 51 2775 2994 51 2775 2994
WM3 Spelling W Ability Score 1 3530 4370 52 3310 3518 52 3310 3518
WM3 Applied Problems W Ability Score 1 4030 4320 52 3381 3689 52 3381 3689
Source Fall 2006 Spring 2007 and Spring 2008 FACES Direct Child Assessment
Notes Statistics are weighted to represent all children who entered Head Start for the first time in the fall of 2006 and who were
either (1) completing Head Start in the spring of 2007 (children in the 4-year-old cohort) or (2) completing Head Start in the spring of
2008 (children in the 3-year-old cohort)
Children from monolingual English homes are children for whom English was the only language spoken in the home as reported by
parents DLLs are children who live in homes where a language other than English (LOTE) was spoken in the home regardless of
which language was the primary language spoken by the family
Standard scores allow for comparisons of a groups performance to others of the same age (or grade) These scores have a mean of
100 and a standard deviation of 15 W scores allow for measurement of change or growth in performance on the same scale over
time Like raw scores W scores are an indicator of absolute rather than relative performance The WJWM W scale is centered on
500 which approximates the average score of a 10-year-old child PPVT-4 Growth Score Value (GSV) scores are similar to W scores
and can range from 12 to 271
NA = not applicable
Interpret data with caution Standard error is large due to small sample size
Child Literacy Skills
(Teacher Report) 1762 26 005 875 27 008 400 20 009
Emergent Literacy Scale
(Parent Report) 1821 21 004 915 17 006 424 12 007
APPENDIX
Table VI6 Summary Statistics for Head Start (FACES) Parent Interview and Teacher Child Report Data
Measures Fall 2006
Children From Monolingual
English Homes
Dual Language Learners
(DLLs)
DLLs Who Did Not Pass
English Screener
Scales N Mean SE N Mean SE N Mean SE
Source Fall 2006 FACES Teacher Child Report and Parent Interview
Notes Statistics are weighted to represent all children entering Head Start for the first time in fall 2006
Children from monolingual English homes are children for whom English was the only language spoken in the
home as reported by parents DLLs are children who live in homes where a language other than English (LOTE)
was spoken in the home regardless of which language was the primary language spoken by the family
Report to Congress on DLLs in Head Start Page | 184
Child Literacy Skills
(Teacher Report) 1169 55 005 636 55 006 278 52 010
Emergent Literacy Scale
(Parent Report) 1136 42 004 637 37 006 286 35 010
APPENDIX
Table VI7 Summary Statistics for Head Start Exit FACES Parent Interview and Teacher Child Report Data
Spring 2007 and Spring 2008
Children From
Monolingual English
Homes
Dual Language Learners
(DLLs)
DLLs Who Did Not Pass
English Screener
Scales N Mean SD N Mean SD N Mean SD
Source Spring 2007 and Spring 2008 FACES Teacher Child Report and Parent Interview
Notes Statistics are weighted to represent all children who entered Head Start for the first time in the fall of 2006
and who were either (1) completing Head Start in the spring of 2007 (children in the 4-year-old cohort) or (2)
completing Head Start in the spring of 2008 (children in the 3-year-old cohort)
Children from monolingual English homes are children for whom English was the only language spoken in the home
as reported by parents DLLs are children who live in homes where a language other than English (LOTE) was spoken
in the home regardless of which language was the primary language spoken by the family
Report to Congress on DLLs in Head Start Page | 185
Teacher Report
Social Skills 1761 155 013 875 157 019 400 148 028
Total Behavior Problems 1762 72 016 875 65 026 400 76 038
Aggressive Behavior 1761 16 005 874 15 008 400 17 011
Hyperactive Behavior 1762 32 008 875 28 012 400 32 019
Withdrawn Behavior 1761 16 005 874 14 008 400 17 013
Preschool Learning Behaviors Scale (PLBS) ndash
Total a
1762 502 027 875 508 040 400 487 060
a
PLBS ndash Attitude toward Learning 1762 501 027 875 506 039 400 491 058
a
PLBS ndash Competence Motivation 1762 504 028 875 505 039 400 483 057
a
PLBS ndash AttentionPersistence 1762 500 028 875 510 041 400 493 065
Parent Report
Social SkillsApproaches to Learning 1821 118 007 914 118 011 424 114 017
Total Behavior Problems 1822 55 010 911 66 014 423 70 020
Assessor Rating
Leiter CognitiveSocial Raw Score 1770 556 055 896 522 085 426 440 122
b
Leiter CognitiveSocial Standard Score 1770 908 045 896 875 067 426 819 096
Attention 1770 197 023 896 181 035 426 145 050
OrganizationImpulse Control 1771 156 018 896 145 026 426 120 037
Activity Level 1771 81 010 896 82 014 426 74 021
Sociability 1771 122 009 896 113 015 426 101 024
APPENDIX
Table VI8 Summary Statistics for Head Start (FACES) Parent Teacher and Assessor Child Report Data Measures
Fall 2006
Scales
Children From
Monolingual English
Homes
N Mean SE
Dual Language Learners
(DLLs)
N Mean SE
DLLs Who Did Not Pass
English Screener
N Mean SE
Source Fall 2006 FACES Direct Child Assessment Teacher Child Report and Parent Interview
Notes Statistics are weighted to represent all children entering Head Start for the first time in fall 2006
Children from monolingual English homes are children for whom English was the only language spoken in the home as reported by parents DLLs are children who live in homes where a language other than English (LOTE) was spoken in the home regardless of which language was the primary language spoken by the family
a
This score is a T-score set to have a mean of 50 and standard deviation of 10 T-scores illustrate a childs performance relative to the Head Start population as a whole in fall 2006 A high T-score for a subgroup indicates that the subgroups mastery level is greater than other groups in the Head Start population b
This standard score has a mean of 100 and a standard deviation of 15
Report to Congress on DLLs in Head Start Page | 186
Teacher Report
Social Skills 1212 181 015 660 190 017 285 184 028
Total Behavior Problems 1212 63 021 660 41 022 285 45 033
Aggressive Behavior 1211 15 006 660 08 006 285 10 010
Hyperactive Behavior 1212 26 009 660 17 010 285 18 014
Withdrawn Behavior 1211 16 007 660 11 007 285 12 012
Preschool Learning Behaviors Scale (PLBS) ndash
Total a
1212 520 032 660 544 036 285 537 058
a
PLBS ndash Attitude toward Learning 1212 515 032 660 534 034 285 530 054
a
PLBS ndash Competence Motivation 1212 521 033 660 536 039 285 528 063
a
PLBS ndash AttentionPersistence 1212 520 032 660 548 033 285 543 053
Parent Report
Social SkillsApproaches to Learning 1194 123 008 670 126 012 295 124 016
Total Behavior Problems 1195 51 012 668 61 015 294 65 023
Assessor Rating
Leiter Cognitive Social Raw Score 1250 596 063 703 598 075 305 572 115
b
Leiter Cognitive Social Standard Score 1250 915 053 703 908 064 305 886 094
Attention 1250 215 025 703 212 032 305 198 050
OrganizationImpulse Control 1250 172 020 703 169 024 305 160 036
Activity Level 1250 86 011 703 91 012 305 90 019
Sociability 1250 123 011 703 125 013 305 124 020
APPENDIX
Table VI9 Summary Statistics for Head Start Exit FACES Parent Teacher and Assessor Child Report Data Measures
Spring 2007 and Spring 2008
Scales
Children From
Monolingual English
Homes
Dual Language Learners
(DLLs)
N Mean SD N Mean SD
DLLs Who Did Not Pass
English Screener
N Mean SD
Source Spring 2007 and Spring 2008 FACES Direct Child Assessment Teacher Child Report and Parent Interview
Notes Statistics are weighted to represent all children who entered Head Start for the first time in the fall of 2006 and who
were either (1) completing Head Start in the spring of 2007 (children in the 4-year-old cohort) or (2) completing Head Start in
the spring of 2008 (children in the 3-year-old cohort)
Children from monolingual English homes are children for whom English was the only language spoken in the home as
reported by parents DLLs are children who live in homes where a language other than English (LOTE) was spoken in the
home regardless of which language was the primary language spoken by the family
a
This score is a T-score set to have a mean of 50 and standard deviation of 10 T-scores illustrate a childs performance
relative to the Head Start population as a whole in fall 2006 A high T-score for a subgroup indicates that the subgroups
mastery level is greater than other groups in the Head Start population
b
This standard score has a mean of 100 and a standard deviation of 15
Report to Congress on DLLs in Head Start Page | 187
Teacher Report
Social Skills 1169 157 181 626 160 190 267 153 185
Total Behavior Problems 1169 70 63 626 62 42 267 73 43
Aggressive Behavior 1168 15 15 625 14 08 267 17 09
Hyperactive Behavior 1169 31 26 626 26 17 267 30 17
Withdrawn Behavior 1168 16 16 625 14 11 267 18 12
Preschool Learning Behaviors Scale (PLBS) ndash
Total a
1169 506 520 626 515 544 267 496 540
a
PLBS ndash Attitude toward Learning 1169 506 515 626 513 535 267 501 533
a
PLBS ndash Competence Motivation 1169 506 521 626 511 536 267 489 530
a
PLBS ndash AttentionPersistence 1169 505 521 626 517 549 267 502 546
Parent Report
Social SkillsApproaches to Learning 1164 118 123 645 119 127 286 115 124
Total Behavior Problems 1166 55 51 641 65 62 284 69 65
Assessor Rating
Leiter Cognitive Social Raw Score 1215 566 595 684 539 601 304 462 574
b
Leiter Cognitive Social Standard Score 1215 911 914 684 886 911 304 833 887
Attention 1215 202 215 684 188 213 304 154 199
OrganizationImpulse Control 1215 160 172 684 151 170 304 127 160
Activity Level 1215 82 85 684 84 92 304 77 90
Sociability 1215 122 123 684 116 126 304 104 124
APPENDIX
Table VI10 Summary Statistics for Fall 2006 and Spring Prekindergarten Head Start (FACES) Parent Teacher and
Assessor Child Report Data Measures
Children From
Monolingual English
Homes
Dual Language Learners
(DLLs)
DLLs Who Did Not Pass
English Screener
Head
Start
Entry
Head
Start
Exit
Head
Start
Entry
Head
Start
Exit
Head
Start
Entry
Head
Start
Exit Scales N N N
Source Fall 2006 Spring 2007 and Spring 2008 FACES Direct Child Assessment Parent Interview and Teacher Child Report
Notes Statistics are weighted to represent all children who entered Head Start for the first time in the fall of 2006 and who
were either (1) completing Head Start in the spring of 2007 (children in the 4-year-old cohort) or (2) completing Head Start in
the spring of 2008 (children in the 3-year-old cohort)
Children from monolingual English homes are children for whom English was the only language spoken in the home as
reported by parents DLLs are children who live in homes where a language other than English (LOTE) was spoken in the
home regardless of which language was the primary language spoken by the family
a
This score is a T-score set to have a mean of 50 and standard deviation of 10 T-scores illustrate a childs performance
relative to the Head Start population as a whole in fall 2006 A high T-score for a subgroup indicates that the subgroups
mastery level is greater than other groups in the Head Start population
b
This standard score has a mean of 100 and a standard deviation of 15
Report to Congress on DLLs in Head Start Page | 188
Height (in inches) 1745 400 007 890 400 009 422 394 013
Weight (in pounds) 1731 375 019 881 386 026 417 376 035
Body Mass Index (BMI) 1707 164 005 857 167 007 405 168 010
Percent of Children
Child is Underweight 1707 34 001 857 26 001 405 27 001
Child is Normal Weight 1707 648 001 857 592 002 405 576 003
Child is Overweight 1707 174 001 857 184 002 405 182 002
Child is Obese 1707 144 001 857 198 002 405 215 002
APPENDIX
Table VI11 Summary Statistics for Head Start (FACES) Child Height and Weight Data Fall 2006
Children From
Monolingual English
Homes
Dual Language Learners
(DLLs)
DLLs Who Did Not Pass
English Screener
Scales N Mean SE N Mean SE N Mean SE
Source Fall 2006 FACES Direct Child Assessment
Notes Statistics are weighted to represent all children entering Head Start for the first time in fall 2006
Children from monolingual English homes are children for whom English was the only language spoken in the
home as reported by parents DLLs are children who live in homes where a language other than English
(LOTE) was spoken in the home regardless of which language was the primary language spoken by the family
According to the Centers for Disease Control (CDC) the 50th percentile in height for children ages 3 to 5
ranges from 37 in to 43 in 30 lbs to 40 lbs in weight154 to 160 in BMI A child is considered to be
overweight or obese when hisher BMI score is at or above the 85th percentile for their age and gender
Report to Congress on DLLs in Head Start Page | 189
Height (in inches) 1243 432 007 701 430 009 304 429 013
Weight (in pounds) 1224 440 028 687 450 038 299 451 053
Body Mass Index (BMI) 1202 164 006 671 169 009 292 171 014
Percent of Children
Child is Underweight 1202 24 001 671 23 001 292 16 001
Child is Normal Weight 1202 648 002 671 501 002 292 490 003
Child is Overweight 1202 176 001 671 268 002 292 288 003
Child is Obese 1202 152 001 671 209 002 292 206 003
Table VI12 Summary Statistics for Head Start Exit FACES Child Height and Weight Data Spring 2007 and
Spring 2008
APPENDIX
Children From
Monolingual English
Homes
Dual Language Learners
(DLLs)
DLLs Who Did Not Pass
English Screener
Scales N Mean SD N Mean SD N Mean SD
Source Spring 2007 and Spring 2008 FACES Direct Child Assessment
Notes Statistics are weighted to represent all children who entered Head Start for the first time in the fall of
2006 and who were either (1) completing Head Start in the spring of 2007 (children in the 4-year-old cohort) or
(2) completing Head Start in the spring of 2008 (children in the 3-year-old cohort)
Children from monolingual English homes are children for whom English was the only language spoken in the
home as reported by parents DLLs are children who live in homes where a language other than English (LOTE)
was spoken in the home regardless of which language was the primary language spoken by the family
According to the Centers for Disease Control (CDC) the 50th percentile in height for children ages 3 to 5
ranges from 37 in to 43 in 30 lbs to 40 lbs in weight 154 to 160 in BMI A child is considered to be
overweight or obese when hisher BMI score is at or above the 85th percentile for their age and gender
Report to Congress on DLLs in Head Start Page | 190
Height (in inches) 1190 402 432 677 402 430 300 396 429
Weight (in pounds) 1167 380 439 658 388 452 292 379 451
Body Mass Index (BMI) 1140 164 164 632 166 169 279 167 170
Percent of Children
Child is Underweight 1140 33 24 632 20 25 279 14 17
Child is Normal Weight 1140 649 652 632 607 502 279 603 496
Child is Overweight 1140 179 172 632 189 271 279 186 298
Child is Obese 1140 139 151 632 184 202 279 197 190
APPENDIX
Table VI13 Summary Statistics for Fall 2006 and Spring Prekindergarten Head Start (FACES) Child Height and Weight
Data
Children From Monolingual
English Homes
DLLs Who Did Not Pass English
Screener Dual Language Learners (DLLs)
Head Start
Entry
Head
Start Exit
Head Start
Entry
Head Start
Exit
Head Start
Entry
Head Start
Exit Scales N N N
Source Fall 2006 Spring 2007 and Spring 2008 FACES Direct Child Assessment
Notes Statistics are weighted to represent all children who entered Head Start for the first time in the fall of 2006 and who
were either (1) completing Head Start in the spring of 2007 (children in the 4-year-old cohort) or (2) completing Head Start in
the spring of 2008 (children in the 3-year-old cohort)
Children from monolingual English homes are children for whom English was the only language spoken in the home as
reported by parents DLLs are children who live in homes where a language other than English (LOTE) was spoken in the home
regardless of which language was the primary language spoken by the family
According to the Centers for Disease Control (CDC) the 50th percentile in height for children ages 3 to 5 ranges from 37 in to
43 in 30 lbs to 40 lbs in weight 154 to 160 in BMI A child is considered to be overweight or obese when hisher BMI score is
at or above the 85th percentile for their age and gender
Report to Congress on DLLs in Head Start Page | 191
APPENDIX
Table VI14 Head Start Child Health Status as Reported by Parents Fall 2006
Children From Monolingual
English Homes
Dual Language Learners
(DLLs)
DLLs Who Did Not Pass
English Screener
Scales
ExcellentVery Good 1822 809 001 915 645 002 424 561 003
Good 1822 142 001 915 265 002 424 305 003
FairPoor 1822 49 001 915 90 001 424 134 002
N Percent SE N Percent SE N Percent SE
Source Fall 2006 FACES Parent Interview
Notes Statistics are weighted to represent all children entering Head Start for the first time in fall 2006
Children from monolingual English homes are children for whom English was the only language spoken in the home
as reported by parents DLLs are children who live in homes where a language other than English (LOTE) was spoken
in the home regardless of which language was the primary language spoken by the family
Report to Congress on DLLs in Head Start Page | 192
APPENDIX
Table VI15 Head Start Child Health Status as Reported by Parents Head Start Exit Spring 2007 and Spring 2008
Chidlren From Monolingual
English Homes
Dual Language Learners
(DLLs)
DLLs Who Did Not Pass
English Screener
Scales N Mean SD N Mean SD N Mean SD
ExcellentVery Good 1195 824 001 668 696 002 294 641 003
Good 1195 125 001 668 237 002 294 262 003
FairPoor 1195 51 001 668 67 001 294 97 002
Source Spring 2007 and Spring 2008 FACES Parent Interview
Notes Statistics are weighted to represent all children who entered Head Start for the first time in the fall of 2006 and
who were either (1) completing Head Start in the spring of 2007 (children in the 4-year-old cohort) or (2) completing
Head Start in the spring of 2008 (children in the 3-year-old cohort)
Children from monolingual English homes are children for whom English was the only language spoken in the home as
reported by parents DLLs are children who live in homes where a language other than English (LOTE) was spoken in the
home regardless of which language was the primary language spoken by the family
Report to Congress on DLLs in Head Start Page | 193
APPENDIX
Table VI16 Head Start Child Health Status as Reported by Parents Fall 2006 and Spring Prekindergarten
Percent of Children
Children From Monolingual
English Homes Dual Language Learners (DLLs)
DLLs Who Did Not Pass English
Screener
Scales N
Head Start
Entry
Head Start
Exit
N
Head Start
Entry
Head Start
Exit
N
Head Start
Entry
Head Start
Exit
ExcellentVery Good 1166 807 823 644 665 693 286 597 637
Good 1166 145 126 644 247 243 286 277 271
FairPoor 1166 48 51 644 88 64 286 126 92
Source Fall 2006 Spring 2007 and Spring 2008 FACES Parent Interview
Notes Statistics are weighted to represent all children who entered Head Start for the first time in the fall of 2006 and
who were either (1) completing Head Start in the spring of 2007 (children in the 4-year-old cohort) or (2) completing
Head Start in the spring of 2008 (children in the 3-year-old cohort)
Children from monolingual English homes are children for whom English was the only language spoken in the home as
reported by parents DLLs are children who live in homes where a language other than English (LOTE) was spoken in the
home regardless of which language was the primary language spoken by the family
Report to Congress on DLLs in Head Start Page | 194
Mean number of childrenrsquos books in home 467 193 168
Number of times family member read to
child in past week
Not at all 27 81 94
Once or twice 199 307 358
Three or more times but not every day 371 282 252
Every day 402 330 295
APPENDIX
Table VI17 Books in Home and Frequency of Reading to Head Start Child Fall 2006
Percent of Children
Children From
Monolingual English
Homes
(n = 1862)
Dual Language
Learners (DLLs)
(n = 942)
DLLs Who Did Not
Pass English Screener
(n = 435)
Source Fall 2006 FACES Parent Interview
Notes Statistics are weighted to represent all children entering Head Start for the first time in fall 2006
Children from monolingual English homes are children for whom English was the only language spoken in
the home as reported by parents DLLs are children who live in homes where a language other than English
(LOTE) was spoken in the home regardless of which language was the primary language spoken by the
family
Report to Congress on DLLs in Head Start Page | 195
Mean number of childrenrsquos books in home 541 245 212
Number of times family member read to child in past
week
Not at all 21 27 28
Once or twice 207 246 306
Three or more times but not every day 399 374 347
Every day 374 354 320
APPENDIX
Table VI18 Books in Home and Frequency of Reading to Head Start Child Spring Prekindergarten
Percent of Children
Children From
Monolingual English
Homes
(n = 1862)
DLLs Who Did Not
Pass English
Screener
(n = 435)
Dual Language
Learners (DLLs)
(n = 942)
Source Spring 2007 and Spring 2008 FACES Parent Interview
Notes Statistics are weighted to represent all children who entered Head Start for the first time in the fall of 2006
and who were either (1) completing Head Start in the spring of 2007 (children in the 4-year-old cohort) or (2)
completing Head Start in the spring of 2008 (children in the 3-year-old cohort)
Spring 2007 estimates are provided for children who entered Head Start as 4-year-olds Spring 2008 estimates are
provided for children who entered Head Start as 3-year-olds
Children from monolingual English homes are children for whom English was the only language spoken in the home
as reported by parents DLLs are children who live in homes where a language other than English (LOTE) was spoken
in the home regardless of which language was the primary language spoken by the family
Report to Congress on DLLs in Head Start Page | 196
Parent reading frequency in past week
Not at all 43 114 151
Once or twice 213 365 415
Three or more Times but not daily 268 252 221
Everyday 477 268 213
APPENDIX
Table VI19 Head Start Parent Reading Patterns Fall 2006
Percent of Children
Children From
Monolingual English
Homes
(n = 1862)
DLLs Who Did Not
Pass English
Screener
(n = 435)
Dual Language
Learners (DLLs)
(n = 942) Parents own reading habits
Source Fall 2006 FACES Parent Interview
Notes Statistics are weighted to represent all children entering Head Start for the first time in fall 2006
Children from monolingual English homes are children for whom English was the only language spoken in
the home as reported by parents DLLs are children who live in homes where a language other than
English (LOTE) was spoken in the home regardless of which language was the primary language spoken
by the family
Report to Congress on DLLs in Head Start Page | 197
APPENDIX
Table VI20 Parent Reading Patterns Head Start Exit Spring 2007 and Spring 2008
Percent of Children
Children From
Monolingual English
Homes
(n = 1862)
DLLs Who Did Not
Pass English
Screener
(n = 435)
Dual Language
Learners (DLLs)
(n = 942) Parents own reading habits
Parent reading frequency in past week
Not at all 42 64 56
Once or twice 200 362 409
Three or more times but not daily 286 352 337
Everyday 472 222 197
Source Spring 2007 and Spring 2008 FACES Parent Interview
Notes Statistics are weighted to represent all children who entered Head Start for the first time in the
fall of 2006 and who were either (1) completing Head Start in the spring of 2007 (children in the 4-year-
old cohort) or (2) completing Head Start in the spring of 2008 (children in the 3-year-old cohort)
Spring 2007 estimates are provided for children who entered Head Start as 4-year-olds Spring 2008
estimates are provided for children who entered Head Start as 3-year-olds
Report to Congress on DLLs in Head Start Page | 198
APPENDIX
Table VI21 Family Membersrsquo Activities with Head Start Child in Past Week Fall 2006
Percent of Children
Children From
Monolingual English
Homes
(n = 1862)
DLLs Who Did Not
Pass English
Screener
(n = 435)
Dual Language
Learners (DLLs)
(n = 942) Type of Activity
Told child a story 716 726 672
Taught child letters words or numbers 950 908 888
Taught child songs or music 826 737 739
Worked with child on arts and crafts 694 457 385
Played with toys or games indoors 973 959 962
Played a game sport or exercised
together 857 826 778
Took child along on errands 967 943 951
Involved child in household chores 952 843 826
Talked about what happened in
Head Start 972 882 881
Talked about TV programs or videos 765 631 571
Played counting games 874 749 703
Mean number of activities 95 87 84
Source Fall 2006 FACES Parent Interview
Notes Statistics are weighted to represent all children entering Head Start for the first time in fall 2006
Children from monolingual English homes are children for whom English was the only language
spoken in the home as reported by parents DLLs are children who live in homes where a
language other than English (LOTE) was spoken in the home regardless of which language was the
primary language spoken by the family
Report to Congress on DLLs in Head Start Page | 199
Table VI22 Family Membersrsquo Activities with Child in Past Week Head Start Exit Spring 2007 and Spring
2008
APPENDIX
Percent of Children
Children From
Monolingual English
Homes
(n = 1862)
DLLs Who Did Not
Pass English
Screener
(n = 435)
Dual Language
Learners (DLLs)
(n = 942) Type of Activity
Told child a story 840 835 844
Taught child letters words or numbers 963 960 962
Taught child songs or music 855 805 803
Worked with child on arts and crafts 719 585 550
Played with toys or games indoors 981 964 988
Played a game sport or exercised together 903 900 906
Took child along on errands 966 939 949
Involved child in household chores 966 861 848
Talked about what happened in Head Start 987 944 917
Talked about TV programs or videos 832 735 714
Played counting games 892 830 825
Mean number of activities 99 94 93
Source Spring 2007 and Spring 2008 FACES Parent Interview
Notes Statistics are weighted to represent all children who entered Head Start for the first time in the fall of
2006 and who were either (1) completing Head Start in the spring of 2007 (children in the 4-year-old cohort)
or (2) completing Head Start in the spring of 2008 (children in the 3-year-old cohort)
Spring 2007 estimates are provided for children who entered Head Start as 4-year-olds Spring 2008
estimates are provided for children who entered Head Start as 3-year-olds
Children from monolingual English homes are children for whom English was the only language spoken in
the home as reported by parents DLLs are children who live in homes where a language other than English
(LOTE) was spoken in the home regardless of which language was the primary language spoken by the
family
Report to Congress on DLLs in Head Start Page | 200
Children in fall of 2006
With valid PPVT-4 2500 794 1708 683 617 247 175 70
With teacher and parent reports 3036 964 1761 580 875 288 400 132
With height and weight data 3057 971 1745 571 890 291 422 138
Children who remained until spring of
prekindergarten
With valid PPVT-4 2208 701 1239 561 681 308 288 130
With teacher and parent reports 2157 685 1212 562 660 306 285 132
With height and weight data 2248 714 1243 553 701 312 304 135
Children who remained until spring of
prekindergarten
With valid PPVT-4 at entry amp exit 1798 571 1172 652 494 275 132 73
With teacherparent reports at entry
amp exit 2062 655 1169 567 626 304 267 129
With heightweight data at entry amp
exit 2167 688 1190 549 677 312 300 138
APPENDIX
Table VI23 Different Subsamples of Head Start Children in FACES 2006 by Assessments Available
Children From
Monolingual English
Homes
Dual Language Learners
(DLLs)
DLLs Who Did Not Pass
English Screener
N
of Baseline
Sample N of Sample N of Sample N of Sample
Report to Congress on DLLs in Head Start Page | 201
Source Fall 2006 Spring 2007 Spring 2008 FACES Direct Child Assessment Teacher Child Report and Parent Interview
Notes Statistics are weighted to represent all children who entered Head Start for the first time in the fall of 2006 and who were either
(1) completing Head Start in the spring of 2007 (children in the 4-year-old cohort) or (2) completing Head Start in the spring of 2008
(children in the 3-year-old cohort)
Spring 2007 estimates are provided for children who entered Head Start as 4-year-olds Spring 2008 estimates are provided for children
who entered Head Start as 3-year-olds
Children from monolingual English homes are children for whom English was the only language spoken in the home as reported by
parents DLLs are children who live in homes where a language other than English (LOTE) was spoken in the home regardless of which
language was the primary language spoken by the family
Report to Congress on DLLs in Head Start Page | 202
APPENDIX
Table VI24 Percent of Children by Home Language and Beginning Proficiency
Percent of Children
1 2 3 4 5 6
Children from
Monolingual
English Homes
Language Other
Than English
(LOTE) in
HomeDLLs
Primary LOTE in
Home (LOTE-P)
Primary LOTE in
Home (LOTE-P)
Who Did Not Pass
English Screener
LOTE in Home But
Not Primary (LOTE-
NP)
Primary LOTE in
Home (LOTE-P)
Who Did Not Pass
English Screener
Early Head Start
Head Start
638
592
362
408
312
271
NA
146
NA
138
NA
12
Source Spring 2009 Baby FACES Parent Interview Fall 2006 FACES Parent Interview and Direct Child Assessment
Note Baby FACES statistics are weighted to represent children near their first birthdays who were enrolled in Early Head Start programs in
spring 2009 FACES 2006 statistics are weighted to represent all children entering Head Start for the first time in fall 2006
NA = not applicable
Children from monolingual English homes are children for whom English was the only language spoken in the home as reported by
parents DLLs are children who live in homes where a language other than English (LOTE) was spoken in the home regardless of which
language was the primary language spoken by the family
- Report to Congress on Dual Language Learners in Head Start and Early Head Start Programs13
-
- REPORT TO CONGRESS ON DUAL LANGUAGE LEAR
- EXECUTIVE SUMMARY
- CHAPTER I INTRODUCTION
- CHAPTER II CHARACTERISTICS OF DLLS
- CHAPTER III HEAD START AND EARLY HEAD S
- CHAPTER IV QUALIFICATIONS AND TRAINING
- CHAPTER V LANGUAGES USED BY STAFF WHO S
- CHAPTER VI DEVELOPMENTAL PROGRESS MADE
- CHAPTER VII DISCUSSION
- APPENDIX
-

TABLE OF CONTENTS
EXECUTIVE SUMMARY 3
CHAPTER I INTRODUCTION 23 DEFINITION OF DUAL LANGUAGE LEARNERS 23 REQUIREMENT IN THE HEAD START ACT FOR THE REPORT (SECTION 649(H)) 25 RESEARCH QUESTIONS 26 DATA SOURCES 27
Head Start Program Information Report (PIR) 27 Head Start Family and Child Experiences Survey (FACES) 29 Early Head Start Family and Child Experiences Survey (Baby FACES) 31 Limitations of Data for this Population 32
ANALYSES 34 ORGANIZATION OF THE REPORT 35
CHAPTER II CHARACTERISTICS OF DLLS 36 METHODOLOGY 36 CHARACTERISTICS OF DLLS AND THEIR FAMILIES 36 DIFFERENCES BETWEEN DLLS AND CHILDREN FROM MONOLINGUAL ENGLISH HOMES 45
CHAPTER III HEAD START AND EARLY HEAD START SERVICES PROVIDED TO DLLS 50 METHODOLOGY 50 SERVICES PROVIDED TO DLLS AND THEIR FAMILIES 52
Service Approaches 52 Classroom Features and Quality 53 Characteristics and Quality of Home Visits in Early Head Start 55 Other Services 56 Parent Satisfaction 58
DIFFERENCES BETWEEN DLLS AND CHILDREN FROM MONOLINGUAL ENGLISH HOMES 58
CHAPTER IV QUALIFICATIONS AND TRAINING OF STAFF WHO SERVE DLLS 62 METHODOLOGY 62 CHARACTERISTICS AND QUALIFICATIONS OF STAFF SERVING DLLS 62
Teachers Caring for DLLs in Early Head Start Head Start and MSHS 63 Home Visitors Caring for DLLs in Early Head Start 65 Managers Overseeing Teachers and Home Visitors Caring for DLLs in Early Head Start and Head Start 66
DIFFERENCES BETWEEN DLLS AND CHILDREN FROM MONOLINGUAL ENGLISH HOMES 68
CHAPTER V LANGUAGES USED BY STAFF WHO SERVE DLLS 73 METHODOLOGY 73 LANGUAGES USED BY STAFF SERVING DLLS 73
CHAPTER VI DEVELOPMENTAL PROGRESS MADE BY DLLS IN EARLY HEAD START AND HEAD START 76 METHODOLOGY 76 DEVELOPMENTAL PROGRESS OF DLLS IN EARLY HEAD START 79 DEVELOPMENTAL PROGRESS OF DLLS IN HEAD START 80 DEVELOPMENTAL PROGRESS OF DLLS COMPARED WITH CHILDREN FROM MONOLINGUAL ENGLISH HOMES 88
CHAPTER VII DISCUSSION 92 WHAT THE DATA TELL US ABOUT DLLS IN EARLY HEAD START AND HEAD START 92 LIMITATIONS OF THE DATA 93 DIRECTIONS FOR THE FUTURE 100
APPENDIX TABLES 105
Report to Congress on DLLs in Head Start Page | 2
EXECUTIVE SUMMARY
INTRODUCTION
The Improving Head Start for School Readiness Act of 2007 (PL 110-134 hereafter the Head Start Act) requires the Secretary of the Department of Health and Human Services (HHS) to conduct a study on the status of limited English proficient children and their families participating in Head Start programs (including Early Head Start Migrant and Seasonal Head Start and tribal programs) The Office of Head Start has long required programs to support children who speak languages other than English at home in ways that are culturally and linguistically responsive including promoting both their home language and English language development and providing comprehensive services in ways that are culturally responsive These requirements are consistent with provisions of the Head Start Act) which emphasizes improving outreach enrollment and quality of services to children with limited English proficiency
The use of varying terms and definitions by different researchers and policy makers can complicate learning about children and families who are not native English speakers Thus this introduction starts by defining the group that is the focus of this report After establishing terminology we present the research questions addressed in the report and the data sources and analytic methods used to address the research questions Finally we summarize the key findings from the report
Definition of Dual Language Learners (DLLs) In this study we use the term dual language learners (DLLs) to encompass limited English proficient (LEP) as defined in the Head Start Act This term is recognized in the Early Childhood Field as one used for a child who comes from a home where a language other than English is spoken A DLL is a child learning two (or more) languages at the same time or a child learning a second language while continuing to develop their first (or home) language DLL also includes key groups of children served in American IndianAlaska Native (AIAN) and Migrant and Seasonal Head Start (MSHS) programs AIAN or MSHS children served in programs located in federal regions not under the auspices of AIAN Head Start or MSHS and children served in programs in Puerto Rico and US territories
Research Questions The Head Start Act put forward several questions about this sizeable group of children and the services provided to them (the actual text from the legislation is included in the report) In response the report addresses the following questions
1 What are the characteristics of children who are dual language learners (DLLs) and their families receiving Head StartEarly Head Start services
2 What is the nature of the Head StartEarly Head Start services provided to children who are DLLs and their families
3 What are the qualifications and training of Head Start and Early Head Start teachersstaff that serve children who are DLLs and their families
4 What are the languages that Head Start and Early Head Start teachersstaff use in relation to the children and families they serve
Report to Congress on DLLs in Head Start Page | 3
5 What developmental progress is observed in children who are DLLs in Head StartEarly Head Start programs
To provide important context for interpreting the answers to these questions the report also highlights differences in each area between DLLs and children from homes where English is the primary language spoken
The report makes use of three existing datasets designed to describe the experiences of children in Head Start programs to address as many of the questions posed by Congress as possible The report also discusses the limitations of current data and current research methodologies to address many of the questions that are of critical interest to policy makers and practitioners Some of these questions can be thoroughly answered such as describing the demographics of DLLs who are served by Head Start and Early Head Start Other questions can only be answered partially For example available data can describe the range and nature of services offered to children and families however the content duration and intensity of all types of services cannot be described in as much detail as desired (eg quality or intensity of instructional supports for language and literacy development) The report provides as much of a response as the available data and existing methods can reliably address For example reporting the rate of progress made by children who are dual language learners and their families enrolled in Head Start programs is limited by the state of the field more broadly in the area of assessment of young dual language learners (discussed more in the report) For some questions important information is available beyond that specified in the Act such as in the area of qualifications and training provided to teachers While data do not exist to answer some of the questions posed by Congress at this time several efforts are underway to build capacity in this area in order to improve the state of knowledge about the children and families served by Head Start as well as those served by other early childhood programs Such efforts funded by ACF are discussed in the final chapter of the report
Data Sources The current report utilizes three datasets to describe the children and families enrolled in Head Start programs and their experiences in the programs the Head Start Program Information Report (PIR) the Head Start Family and Child Experiences Survey (FACES) the Early Head Start Family and Child Experiences Survey (Baby FACES) In this section we present a brief overview of each of the data sources analyzed for this report and we briefly explain the limitations of the data for the purposes of this report Please refer to the full report and to the supporting documentation for each data source for more information regarding the respective research designs samples and data limitations
Head Start Program Information Report (PIR) The Office of Head Start Program Information Report (PIR) provides comprehensive descriptive data on the services and staff of Head Start and Early Head Start programs nationwide1 All grantees and delegate agencies are required to submit Program Information Reports annually The report presents data from the 2007-2008 program year which were the most current PIR data available at the time that data analyses began
1 For more information on the Office of Head Start Program Information Report (PIR) see descriptions and survey
forms on the ACF website at httpeclkcohsacfhhsgovhslcHead percent20Start percent20Programpir
Report to Congress on DLLs in Head Start Page | 4
Information from the PIR is aggregated at the program or grantee level and therefore it is not possible to break down and examine the data by subsets of children such as children who are dual language learners Primarily we use PIR data in the report to describe program characteristics including enrollment regional distribution program options qualifications of staff and services available to and received by childrenfamilies at the grantee- regional- and national-level These data permit us to look at the staff and services provided by grantees with different concentrations of children and families speaking languages other than English at home For example where are grantees with higher concentrations of children and families speaking languages other than English located
The PIR is the only data source that provides information about the universe of Head Start programs including Migrant and Seasonal Head Start (MSHS) programs American Indian and Alaska Native (AIAN) programs and programs in Puerto Rico and other US territories This permits us to describe limited demographic characteristics of children and families enrolled in MSHS and AIAN-HS and the program options and types of services available to and utilized by families enrolled in these programs
Head Start Family and Child Experiences Survey (FACES) The Head Start Family and Child Experiences Survey (FACES) is a nationally representative cohort study of 3- and 4-year-old children enrolled in Head Start2 The report uses data from the 2006 cohort which includes 3shyand 4-year-old children who entered Head Start in the fall of 2006 their families and local program staff
FACES complements PIR data by bringing analyses down to the child and family level We present FACES data from interviews with parents at Head Start entry and exit interviews with teachers education coordinators and center directors teacher reports of each child at Head Start entry and exit observations of Head Start classrooms in the spring of 2007 and direct child assessments at Head Start entry and exit FACES data are used in the report to describe at the individual level (1) characteristics and experiences of children and families enrolled in Head Start (2) staff qualifications credentials and beliefs (3) classroom practices and quality and (4) developmental progress of children
FACES data permit us to describe the characteristics and experiences of children and their families by varying degrees of exposure to languages other than English (ie children whose parents primarily use a language other than English to speak with them children with low English proficiency at Head Start entry) Due to the small sample sizes among groups of children speaking languages other than English or Spanish and limited assessment tools in these other languages FACES has far more data on Spanish-speaking children in Head Start than on children speaking any other non-English languages Children were not assessed directly if they could not be assessed in English and they spoke a language other than Spanish
For multiple reasons FACES has not sampled from programs operated by federally recognized AIAN tribes consortia or corporations MSHS programs or programs located in Puerto Rico and the Pacific Islands Therefore FACES data cannot be used to describe children
2 For more information on the Head Start Family and Child Experiences Survey (FACES) see technical reports on
the ACF website httpwwwacfhhsgovprogramsoprehsfaces
Report to Congress on DLLs in Head Start Page | 5
and families served by these programs These limitations are discussed in greater depth in the full report and in the FACES technical reports
Early Head Start Family and Child Experiences Survey (Baby FACES) The Early Head Start Family and Child Experiences Survey (Baby FACES) is a nationally representative sample of infants who enrolled in Early Head Start in 20093 We use data from the 1-year-old cohort which includes children who were between 10 and 15 months of age at the time of data collection in the spring of 2009 their families and local program staff
Baby FACES supplements PIR and FACES data with a focus on infants served by the Early Head Start programs and by bringing analyses down to the child- and family-level for this group The report presents analyses of Baby FACES baseline data collected in spring of 2009 from interviews with parents interviews with home visitors and caregivers interviews and self-administered surveys with program directors home visit observations and direct classroom observations These data are used to describe at the individual level (1) characteristics and developmental status of 1 year old children in Early Head Start (2) program services including quality of home visits and classrooms (3) staff qualifications and credentials and (4) family well being parent-child interactions and aspects of the home environment
aby FES data provide a snapshot of infants developmental status and family experiences when children are 1 (and eventually will depict these children at 2- and 3-years old) Baby FACES data permit analyses of children by DLL status However as described above due to the small sample sizes of families speaking non-Spanish LOTEs and the lack of reliable instruments in languages other than English and Spanish we are unable to present as much information about infants in families where non-Spanish LOTEs are spoken
Limitations of Research for this Population The limitations of extant research and methodology concerning young children who are dual language learners (DLLs) restrict the quality of data that are available on DLLs in Head Start and Early Head Start programs Both FACES and Baby FACES utilized the best and most feasible methods available at the time of data collection for nationally representative comprehensive large-scale studies to represent the experiences of young children who are dual language learners These two studies represent th e cutting-edge of national surveys in assessing development of young children who are dual language learners (DLLs) but they had to balance the need to represent the experiences of all children in Head Start and Early Head Start respectively with a commitment to accurately reflect the experiences of DLLs As discussed more fully in the report data on developmental progress of DLLs is generally limited for Head Start as for other early childhood programs by lack of widely recognized reliable measurements in the field at this point in time
Operational Definitions The report operationally defines DLLs as children for whom a language other than English (LOTE) was spoken at home as reported by parents Most of the findings reported reflect children who match this definition Analyses of PIR data distinguish children who live in homes where a LOTE was spoken regardless of which language was dominant in the home Children for whom English was the primary or only language that
3 For more information on the Early Head Start Family and Child Experiences Survey (Baby FACES) see technical reports on the ACF website at httpwwwacfhhsgovprogramsopreehsdescriptive_studyindexhtml
Report to Congress on DLLs in Head Start Page | 6
parents reported speaking at home are referred to throughout the report as children from monolingual English homes There is diversity in the language experiences of children in both of these groups nearly one out of four DLLs live in homes where English is also spoken and nearly one out of four children from monolingual English homes hear other languages at home Clearly distinguishing home language experiences in dichotomous or simple terms is not fully accurate or completely satisfactory However as with the vast majority of research studies investigating the implications of home language experiences this report must present analyses and findings in somewhat simple terms due to limited subgroup sizes and for the sake of clarity of discussion Within the findings presented on childrens developmental progress DLLs are distinguished into two groups DLLs who passed an English language screener and were administered an assessment battery in English) and DLLs who did not pass the screener and completed an assessment battery in Spanish In general the data described do not include children in AIAN or MSHS programs except where noted Also the data do not include children and programs in Puerto Rico and other US territories as speaking a language other than English in these contexts where English is not the dominant language does not have the same meaning
This executive summary provides a synopsis of the major findings regarding children who are dual language learners their families and the services they receive
KEY FINDINGS
A CHARACTERISTICS OF DLLs What are the characteristics of children who are dual language learners (DLLs) and their families receiving Head StartEarly Head Start services
Slightly more than a quarter of children enrolled in Head Start and Early Head Start come from homes in which a language other than English is spoken According to the 2007-2008 PIR 29 percent of children enrolled in Head Start and 26 percent of children enrolled in Early Head Start are DLLs Most children enrolled in MSHS programs are DLLs (89 percent) while only 7 percent of children enrolled in AIAN programs are DLLs
DLLs are most heavily concentrated in the West and South regions of the US but there are DLLs in all regions and US territories In 2007-2008 over a third (37 percent) of DLLs in Head Start Early Head Start MSHS and AIAN programs were located in the West while 23 percent attended programs in the South The remaining DLLs were almost evenly distributed across programs in the Northeast (15 percent) Midwest (13 percent) and US Territories (13 percent) MSHS programs are concentrated in the South (42 percent) and West (45 percent) with far fewer in the Midwest (9 percent) and Northeast (4 percent)4
For most DLLs in Head Start and Early Head Start Spanish is the primary language spoken at home More than four-fifths of DLLs enrolled in Head Start and Early Head Start are from Spanish-speaking homes Within Head Start 84 percent of DLLs were from Spanishshy
4 Data from the 2007-2008 Office of Head Start Program Information Report (PIR) All subsequent statements reflecting PIR 2007-2008 data will be identified with superscript P
Report to Congress on DLLs in Head Start Page | 7
speaking homes 5 percent were from homes where an Asian language is spoken 3 percent were from homes where an African language was spoken and the remaining DLLs came from homes where other languages were spoken including EuropeanSlavic languages Pacific Island languages and Native North AmericanAlaska Native languagesF Within Early Head Start 91 percent of DLLs were from Spanish-speaking homes (the remaining 9 percent reflecting all other LOTEs)B Among the children enrolled in MSHS programs approximately 9 out of 10 speak a language other than English at home and Spanish is the most common language spoken (85 percent) Only approximately 4 percent of MSHS families primarily speak one of the native Central American South American Mexican or Caribbean languagesP
Few children enrolled in tribal programs speak a language other than English at home The most common non-English language spoken among families in tribal programs is a native language (Native North AmericanAlaska Native language) spoken by 5 percent of families in AIAN programsP
Most DLLs in Head Start and Early Head Start were born in the United States The majority of their parents were born outside of the US 92 percent of DLLs entering Head Start in fall 2006 were born in the US but most of their parents (86 percent of mothers and 90 percent of fathers) were born outside the USF Eighty-two percent of DLLs entering Head Start had two parents born outside the US Two-thirds of 1-year-old DLLS in Early Head Start in spring 2009 had foreign-born mothers and three-fourths had foreign-born fathers Both parents were foreign-born in 64 percent of DLLs familiesB The majority of foreign-born parents of DLLs in Head Start and Early Head Start came from Mexico
The majority of parents of DLLs in Head Start and Early Head Start have been in the US for 6 years or more In fall 2006 approximately three-quarters of foreign-born mothers and fathers of DLLs had been in US for 6 years or moreF Similarly in Early Head Start more than two-thirds of foreign-born mothers and three-quarters of foreign-born fathers of DLLs had been in the US for 6 years or more B
More than half of parents of DLLs in Head Start and Early Head Start report that they donrsquot understand English well or donrsquot understand it at all Among DLLs in Head Start 48 percent of their parents reported that they did not understand English well and an additional 15 percent did not understand it at allF In Early Head Start 47 percent of parents of DLLs did not understand English well and an additional 10 percent did not understand English at allB
However nearly all parents of DLLs entering Head Start in 2006 were literate in their first language and the parents of 1-year-old DLLs in Early Head Start reported reading very well (60 percent) or well (34 percent) in their native language
The majority of DLLs in Head Start and Early Head Start live with both their mother and
their father Among DLLs in Head Start 72 percent lived with both their mother and their
father (biological or adoptive)F Similarly 71 percent of 1-year-old DLLs in Early Head Start
lived with both their mother and their father (biological or adoptive)B 75 percent of children
enrolled in MSHS programs most of whom are DLLs lived in two-parent families Among DLLs
in Head Start who live with two parents their parents are more likely to be married (49
percent) than unmarried (23 percent) Among DLLs in Early Head Start 37 percent were living
Report to Congress on DLLs in Head Start Page | 8
with two parents who were married DLLs in Early Head Start and in Head Start are more likely
than their peers from monolingual English homes to live with two parents and with parents
who are married
On average DLLs in Head Start and Early Head Start live in households of 5 people DLLs in Head Start lived with an average of 24 adults and 27 childrenF About 13 percent of DLLs lived in intergenerational households (ie with at least one biological or adoptive parent and at least one grand- or great-grandparent) In Early Head Start DLLs lived with an average of 21 adults and 29 children and about 13 percent lived in an intergenerational householdB On average DLLs live in larger households than children from monolingual English homes
A small proportion of DLLs in Head Start and Early Head Start were born to a teenage mother Nine percent of DLLs in Head Start were born to a teenage motherF Sixteen percent of 1-year-old DLLs in Early Head Start were born to teenage mothersB DLLs were less likely than children from monolingual English homes to have been born to a teenage mother (in Head Start 9 percent vs 19 percent in Early Head Start 16 percent vs 25 percent)
The majority of DLLs in Head Start and Early Head Start are living with parents who have not earned a high school diploma or GED Approximately half of DLLs in Head Start were living with at least one parent who had earned at least a high school diploma or GED 22 percent of DLLs were living with at least one parent with education beyond high schoolF Approximately 62 percent of DLLs in Early Head Start were living with at least one parent who had earned a high school diploma or GED 29 percent were living with at least one parent with education beyond high schoolB Over three-quarters of children enrolled in MSHS programs most of whom are DLLs were living with parents who had not completed a high school diploma or GEDP On average DLLs parents have lower educational attainment than parents from monolingual English homes
Most DLLs come from working families Among DLLs in Head Start programs 85 percent lived with at least one parent who was employed and 70 percent lived with at least one parent who was employed full-timeF Among parents of DLLs in Early Head Start 80 percent lived with at least one employed parent and 64 percent lived with at least one parent who was employed full-timeB In MSHS programs at least one parent is employed in 90 percent of two-parent families and 76 percent of single parent familiesP DLLs were more likely than children from monolingual English homes to live with a parent who was working and less likely to live with a parent who was unemployed and looking for work
Most DLLs in Head Start and Early Head Start are living in poverty Among DLLs in Head Start 64 percent lived in a household with income at or below the poverty threshold 81 percent lived in a household with income at or below 130 percent of the poverty threshold5 F
Among 1-year-old DLLs in Early Head Start 76 percent lived in a household with income at or
5 The federal poverty threshold for a family of four was $20000 in 2006 Head Start qualifying criteria are based on
family income not household income and there are other circumstances not dependent on family income that may qualify a child or family for the program regardless of income Other qualifying criteria include children in foster care and children with special needs Individual grantees may also propose qualifying criteria to target special populations within the communities they serve (eg families in transitional housing)
Report to Congress on DLLs in Head Start Page | 9
below the poverty threshold 90 percent lived in a household with income at or below 130 percent of the poverty thresholdB Even though DLLs are more likely than children from monolingual English homes to live with a parent who is employed their households income is more likely to fall at or below the poverty threshold
Most parents of DLLs in Head Start and Early Head Start are not receiving welfare cash assistance but many are receiving food stamps and most participate in WIC Among DLLs who entered Head Start in fall 2006 15 percent lived in households that received federal cash assistance 31 percent lived in households that received food stamps and 74 percent participated in WIC at the timeF Thirty percent of 1-year-old DLLs in Early Head Start lived in households that received federal cash assistance while 52 percent lived in households that received food stamps and 92 percent participated in WICB Only 3 percent of families in MSHS programs were receiving federal cash assistance in 2007-08 but 57 percent were receiving WIC benefitsP DLLs parents especially in Head Start are less likely than parents who reported English was the primary or only language spoken at home to be receiving public assistance but they are more likely to participate in the WIC program
Financial struggles are common in families of DLLs in Early Head Start Among DLLs in
Early Head Start 48 percent of their parents reported having at least one out of five financial
security difficulties they were asked about including paying the full amount of their rent or
mortgage or their utility billsB Half of the parents of DLLs also reported having at least one out
of five food security difficulties they were asked about Parents of DLLs in Early Head Start
were more likely than their primarily English-speaking counterparts to report more than one
food security difficulty (51 percent vs 26 percent) and twice as likely to report difficulty
affording balanced meals (39 percent vs 19 percent)
Relatively few DLLs in Head Start have had a disability identified by a professional Teachers reported that approximately 8 percent of DLLs who entered Head Start in fall 2006 had a developmental problem delay or special need indicated by a professionalF Programs reported that 41 percent of children enrolled in MSHS programs had a disabilityP DLLs in Head Start were less likely than children from homes where English is the primary or only language spoken to have been identified by a professional as having a disability (8 vs 14 percent)F
Nearly all DLLs in Head Start and Early Head Start receive regular medical and dental checkups appropriate for their age Among DLLs in Head Start 99 percent had received a regular medical checkup in the past year and 92 percent had received a regular dental checkup in the past yearF Among 1-year-old DLLs in Early Head Start all were reported to have received a regular medical checkup in the past year and 28 percent had ever visited the dentistB
Nearly all DLLs in Head Start and Early Head Start have some health insurance coverage Among DLLs entering Head Start in 2006 91 percent were covered by health insurancemdash approximately 57 percent had private health insurance coverage 66 percent had Medicaid coverage and 6 percent were enrolled in the State hildrens Health Insurance Program (SCHIP)F Among DLLs in Early Head Start in 2009 95 percent were covered by health insurancemdash24 percent were covered by private insurance 77 percent through Medicaid
Report to Congress on DLLs in Head Start Page | 10
coverage and 19 percent through SCHIPB In MSHS programs 97 percent of children were covered by health insurance by the end of the enrollment year most by Medicaid (72 percent) SCHIP (3 percent) or both (5 percent)P DLLs in Head Start were less likely than children from homes where English was the primary or only language spoken to have Medicaid coverage (66 percent vs 75 percent)F
Many DLLs in Head Start and Early Head Start receive child care in other settings most
often in home-based care by relatives Among DLLs in Head Start 26 percent were in some
child care arrangement outside of Head StartF mainly provided by relatives or by nonrelative
family child care providers Over half of 1-year-old DLLs in Early Head Start were in some kind of
child care arrangement outside of Early Head StartB again mainly through relatives or
nonrelative family child care providers DLLs in Head Start were more likely than children from
homes where English was the primary or only language spoken to be in a child care
arrangement outside Head Start (26 percent vs 12 percent) but in Early Head Start DLLs were
less likely to be in a child care arrangement outside Early Head Start (58 percent vs 72 percent)
Some parents of DLLs report symptoms of psychological distress Among DLLs in Head
Start 12 percent of their parents reported symptoms indicating they may have had moderate
to severe depressionF In Early Head Start 13 percent of DLLs parents reported symptoms
indicating that they were moderately or severely depressedB Parents of DLLs in Head Start and
Early Head Start were less likely than parents from homes where English was the primary or
only language spoken to report symptoms indicating moderate to severe depression
Primary caregivers of DLLs in Early Head Start report a mix of parenting beliefs They
report relatively high levels of both traditional authoritarian parental beliefs (mean of 20 out of
25 possible points) and progressive democratic beliefs (mean of 19 out of 25 points)B DLLs in
Early Head Start were less likely than children from homes where English was the primary or
only language spoken to have parents who reported that they spanked their child in the past
week (6 percent vs 15 percent)
B HEAD START AND EARLY HEAD START SERVICES PROVIDED TO DLLs What is the nature of the Head StartEarly Head Start services provided to children who are DLLs and their families
1 Service Approaches
The majority of DLLs in Early Head Start are in the home-based option Slightly more than one-half of DLLs in Early Head Start were enrolled in home-based programs while one-third were enrolled in center-based programsB Nine percent were enrolled in a combination program and 2 percent were enrolled in a family child care program
Center-based care for DLLs was most likely full-time in Early Head Start and part-time in Head Start Three-fourths of DLLs in Early Head Start were enrolled in a full-day program
Report to Congress on DLLs in Head Start Page | 11
(according to program directors definitions 65 percent in a year-round full-day program and 14 percent in a part-year full-day program)B In contrast two-thirds of DLLs in Head Start were enrolled in a part-day programF Nearly all children enrolled in MSHS programs in 2007-2008 were in full-day center-based programsP Compared to children from monolingual English homes DLLs were less likely to be enrolled in programs that offered full-day center-based early education and care
2 Classroom Features and Quality
In Head Start the average classrooms of DLLs who entered in fall 2006 exceed standards for group size and child-adult ratio and in their interactions with children the lead teachers demonstrated sensitivity responsiveness and encouragement The average classroom environment however was rated in the minimal to good range and the teachers instructional support was rated low Similarly in Early Head Start the group size and child-staff ratio in the average classroom of 1-year-old DLLs in spring 2009 exceed standards but the quality of the average classroom was rated in the minimal to good range
Average child-adult ratios and group sizes in Early Head Start and Head Start exceed recommended levels On average the classrooms of 1-year-old DLLs in Early Head Start classrooms in spring 2009 included 57 children and 25 adults for a child-adult ratio of 23 to 1 (well within the maximum group size and ratio recommended by the American Academy of Pediatricians American Public Health Association and the National Resource Center for Health and Safety in Child Care and Early Education)B On average DLLs who entered Head Start in fall 2006 were in classrooms that included 152 children and 22 adults (a ratio of 69 children per adult) within the levels recommended by the NAEYCF
Global ratings of classroom quality indicate that on average Early Head Start and Head Start classrooms provide minimal to good quality care The average ITERS score for the classrooms of 1-year-old DLLs in Early Head Start in spring 2009 was 39 in the minimal to good range B According to the ECERS-R data the average quality of the classrooms of DLLs who entered Head Start in fall 2006 was between minimal and goodF DLLs and their counterparts from monolingual English homes experienced similar quality of care in home visits and Early Head Start centers
On average the quality of interactions between children and lead teachers in Head Start is good The Arnett Caregiver Interaction Scale scores show that the average quality of interactions between lead teachers and children in classrooms of DLLs was goodF The average Arnett score for lead teachers in the classrooms of DLLs was 678 suggesting high levels of teacher sensitivity responsiveness and encouragement of childrens independence and self-help skills
The average quality of instructional support in Head Start is low The average CLASS Instructional Support score in the classrooms of DLLs was 19 with average subscores ranging from 17 for concept development to 21 for language modeling F
Most DLLs in Head Start were in classrooms that provided reading and language activities as well as math activities on a daily or nearly daily basis More than half of DLLs who entered Head Start in fall 2006 were in classrooms in which teachers reported each of 11
Report to Congress on DLLs in Head Start Page | 12
reading and language activities took place daily or almost daily F The extent to which Head Start teachers reported reading and language activities and math activities was very similar for DLLs and children from monolingual English homes However DLLs were less likely to be in classrooms in which daily activities included discussing new words (71 percent vs 82 percent)
Almost all DLLs in Early Head Start and Head Start were exposed to adults speaking English and the majority of DLLs were exposed to adults speaking Spanish Nearly all (98 percent) of 1-year-old DLLs receiving center-based Early Head Start services in 2009 were exposed to adults speaking English in their classroom and 81 percent were exposed to adults speaking Spanish in their classroomB Similarly in Head Start 98 percent of DLLs who entered in fall 2006 were in classrooms in which English was used for instruction while 58 percent were in classrooms in which Spanish was used for instructionF The majority of DLLs in Early Head Start and Head Start were in classrooms that used their home language for some instruction (85 percent in Early Head Start centers 60 percent in Head Start) According to parents 85 percent of DLLs in Head Start were in a program in which staff members speaking their childs home language were available in the program In MSHS programs PIR data indicate that 71 percent of non-supervisory staff members including teachers assistant teachers and family child care providers were proficient in a language other than English
3 Characteristics and Quality of Home Visits in Early Head Start
Early Head Start home visits with 1-year-old DLLs typically lasted more than an hour (82 minutes on average) and involved an average of one adult the 1-year-old and often a sibling Nearly three-quarters of home visits with DLLs were conducted in SpanishB
On average the observed quality of home visits (using the HOVRS) was rated as slightly above adequate
There were some differences in activities observed during home visits with DLLs compared to visits to monolingual English homesB Activities during home visits with DLLs were less likely to include provision of education or information (61 percent vs 75 percent) evaluationfeedback on parent-child interactions (35 percent vs 49 percent) or childparent observationassessment (59 percent vs 68 percent)
4 Other Services
In Head Start about half of DLLs with a disability had an IEP Eight percent of DLLs had a teacher-reported disability and 53 percent of these children had an individualized education program (IEP) or individualized family service plan (IFSP)F
A wide range of services are offered to families of DLLs in Early Head Start Virtually all 1shyyear-old DLLs in Early Head Start were in programs that offered a wide range of family services either directly by referral or through a community partner on- or off-siteB These services included employment assistance and job training assistance in obtaining health and mental health services information about Head Start and information about community resources Two-thirds of programs provided activities and workshops targeting parents of DLLs However many families of DLLs in Early Head Start and Head Start do not report receiving family services A minority of families in Early Head Start reported receiving these types of services
Report to Congress on DLLs in Head Start Page | 13
from any source during the past year In Head Start only 12 percent of parents of DLLs reported that Head Start made them aware of or helped them obtain one or more of these types of servicesF Parent reports about services received from or with the assistance of Head Start were similar across DLLs and children from monolingual English homes
Family involvement in Early Head Start activities varies widely Nearly 80 percent of parents of DLLs in Early Head Start reported that they attended group activities for parents and their children during the past yearB Nearly two-thirds of parents of DLLs reported that they attended an Early Head Start social event and 57 percent attended parent education meetings or workshops related to children Nearly half reported volunteering in an Early Head Start classroom In 18 percent of families of DLLs the father or father-figure attended events just for menfathers
In Early Head Start DLLs were more likely than children from monolingual English homes to be in programs offering English language and literacy-related services their parents were more likely to have received several literacy and language-related services and health services and their parents reported higher involvement in many program activitiesB The Early Head Start programs attended by DLLs were less likely to have formal connections with Part C agencies (ie agencies that provide early intervention (EI) services to children aged birth to three with developmental delays or a medical condition likely to lead to a developmental delay)
C QUALIFICATIONS AND TRAINING OF STAFF WHO SERVE DLLS What are the qualifications and training of Head Start and Early Head Start teachersstaff that serve children who are DLLs and their families
The teachers and home visitors caring for DLLs and their managers provide the care that shapes the experiences of DLLs in Early Head Start and Head Start The report examines the characteristics and employment experiences of the teachers home visitors and managers caring for DLLs in Early Head Start and Head Start
1 Teachers Caring for DLLs in Early Head Start Head Start and MSHS
More than half of teachers of DLLs are Hispanic A substantial proportion of DLLs in Early Head Start and Head Start are cared for by teachers who are also Hispanic Half of 1-year-old DLLs in Early Head Start classrooms had teachers who were Hispanic B Similarly nearly half of DLLs in Head Start in fall 2006 had lead teachers who were HispanicF
The majority of DLLs in Early Head Start and Head Start centers have teachers who have a college degree although there is variability In Early Head Start 55 percent of DLLs in center-based care had a teacher with an associates or bachelors degreeB Only 15 percent were cared for by a teacher with only a high school diploma or less Most DLLs (87 percent) in Head Start were cared for by a lead teacher who had an associates or bachelors degreeF Only 5 percent of teachers serving DLL children had only a high school diploma or GED In MSHS programs in 2007-2008 54 percent of teachers had an associates or bachelors degreeP DLLs in Early Head Start were less likely to have teachers with a college or graduateprofessional degree than children from monolingual English homes (55 percent vs 68 percent)B
Report to Congress on DLLs in Head Start Page | 14
One-fourth to one-half of teachers of DLLs had a degree in early childhood education The education and training of teachers may have greater impact on their practices if it includes some focus or specialized preparation in child development and early childhood education Among teachers of DLLs in Early Head Start with a college degree nearly half (45 percent) had early childhood education included in their field of studyB Among DLLs in Head Start 28 percent had a teacher with a degree in early childhood educationF Two-thirds of teachers of DLLs in Early Head Start and 60 percent of lead teachers of DLLs in Head Start had earned a CDA More than half (57 percent) of teachers in MSHS programs in 2007-2008 had a CDA credentialP Fewer teachers have a state-awarded preschool certificate or license One-third of DLLs in Early Head Start have a teacher with such certification and nearly half (47 percent) of DLLs in Head Start had one BF DLLs in Head Start were more likely than their peers from monolingual English homes to have a lead teacher who had a state-awarded preschool certificate (47 percent vs 23 percent) or a teaching certificate or license (59 percent vs 36 percent)
Many teachers of DLLs have more than 5 years of experience in Early Head Start and Head Start Nearly half (48 percent) of DLLs in Early Head Start and three-quarters of DLLs in Head Start had teachers who had worked in Early Head Start for 5 or more yearsBF In Head Start the lead teachers of DLLs had been teaching for an average of 13 years DLLs and children from monolingual English homes have teachers with similar years of teaching years of teaching in Head Start and teaching in the current program However in Early Head Start teachers of DLLs had fewer years of experience caring for infant or toddlers than teachers of children from monolingual English homes
Average turnover of Early Head Start and MSHS teachers is moderate Teacher turnover during the past 12 months in programs of 1-year-old DLLs in center-based Early Head Start care in 2009 was 14 percentB About one-fifth of Early Head Start programs offering center-based care experienced a teacher turnover rate greater than 25 percent Similarly the average teacher turnover rate in MSHS programs in 2007-2008 was 15 percentP
2 Home Visitors Caring for DLLs in Early Head Start
More than half of home visitors serving DLLs are Hispanic Three-quarters of 1-year-old DLLs in Early Head Start who were receiving home visits had home visitors who were HispanicB
Depression may afflict some home visitors Most home visitors serving DLLs in Early Head Start did not report elevated symptoms of psychological distressB However for a small proportion (4 percent) moderate or severe depression may be a problem
Nearly all DLLs receiving home-based Early Head Start services have home visitors with education beyond high school and many had home visitors with specialized training in early childhood development andor education Nearly two-thirds (62 percent) of 1-year old DLLs in Early Head Start who were receiving home-based services had a home visitor with an associates or bachelors degree and nearly two-thirds (64 percent) had home visitors whose field of study included early childhood educationB Almost half (45 percent) of DLLs had a home visitor with a CDA credential and similarly 45 percent had home visitors with state-awarded preschool certification DLLs in home-based Early Head Start services were less likely than
Report to Congress on DLLs in Head Start Page | 15
children from monolingual English homes to have a home visitor who had completed college but more likely to have a home visitor who had either received some college education or a state-awarded preschool certificate
More than a third (43 percent) of DLLs in Early Head Start had home visitors who had worked in Early Head Start 5 or more yearsB DLLs had home visitors who had less experience caring for infants and toddlers on average than home visitors of children from monolingual English homes (7 vs 10 years)
Average turnover of Early Head Start home visitors is moderate Home visitor turnover during the past 12 months in programs of 1-year-old Early Head Start DLLs in home-based care in 2009 was 15 percent on averageB About one-fifth of programs offering home-based services experienced a home visitor turnover rate higher than 25 percent
3 Managers Overseeing Teachers and Home Visitors Caring for DLLs in Early Head Start and Head Start
Although supervisors coordinators and directors do not normally care for children in Early Head Start and Head Start directly they can have an impact on the care children receive through their monitoring of teachers and home visitors and the policies and practices they set and model for frontline staff
Managers in programs serving DLLs have high levels of education Three-quarters of DLLs were enrolled in programs in which mid-level managers (program managersupervisor in Early Head Start and center director in Head Start) had a bachelors degree or higher (75 percent in Early Head Start and 72 percent in Head Start) and notable proportions of DLLs were enrolled in programs with mid-level managers who had a graduate or professional degree (27 percent in Early Head Start and 43 percent in Head Start)BF Most DLLs in Early Head Start and Head Start were in programs led by a director with a bachelors degree or higher and two-thirds to three-quarters were in programs in which the director had a graduate or professional degree
Many managers in Head Start (but not in Early Head Start) have a child development or early education credential or certification Very few of DLLs in Early Head Start were in programs in which program managerssupervisors or directors had a CDA credential (less than 1 percent) or state-awarded preschool certificate (3 percent)B In contrast one-third of DLLs in Head Start were in programs in which the center director had a state-awarded preschool certificate and nearly half (47 percent) were in programs in which the education coordinator had a state-awarded preschool certificateF
A majority of DLLs in Head Start are in programs in which center directors and education coordinators have a teaching certificate or license More than half of DLLs in Head Start had center directors (53 percent) with a teaching certificateF Nearly two thirds (63 percent) of DLLs in Head Start were in programs in which the education coordinator had a teaching certificate
Head Start managers have more than a decade of experience working in Head Start On average DLLs had center directors with 11 years of experience in Head Start 9 of those in their current programF On average DLLs were in programs with education coordinators who had
Report to Congress on DLLs in Head Start Page | 16
worked in Head Start for 14 years all in their current program They also had program directors who had worked in Head Start for an average of 18 years 15 of those in their current program
D LANGUAGES USED BY STAFF WHO SERVE DLLS What are the languages in which Head Start and Early Head Start teachersstaff are fluent in relation to the children and families they serve
The available data provide information that indirectly informs the question posed by Congress about the languages used in providing services to children who are DLLs and their families However there are no data that speak directly to the question of the fluency of Head Start staff in particular languages
Multiple languages are often used in classrooms and home visits Among DLLs in Early Head Start home-based services adults speak English during 70 percent of home visits and Spanish during 77 percent of home visits reflecting that teachers and home visitors use both languages within many visitsB
English is the language most often used to read to children in the classroom however childrenrsquos home language is used in most home visits and classrooms In Early Head Start the childs home language was used during 89 percent of home visitsB The childs home language was used in the Early Head Start classrooms of 85 percent of DLLs In Head Start classrooms the childs home language was used for at least some instruction in the classrooms of 60 percent of DLLsF In Early Head Start classrooms DLLs were most likely to have a lead teacher who spoke a language other than English in the classroom (69 percent) followed by an assistant teacher (47 percent) classroom aide (30 percent) and volunteer or other non-staff person (19 percent) Most DLLs in Head Start (85 percent) were in programs in which staff members speaking the childs home language were available as reported by parents
Teachers and home visitors use a variety of strategies to communicate with the families of DLLs Half (52 percent) of the families of DLLs in Early Head Start had teachers or home visitors who spoke to them only in EnglishB Two-thirds (67 percent) had teachers or home visitors who used an informal interpreter Three-fourths had teachers or home visitors who used physical cues or hand gestures to communicate with families speaking languages other than English
E DEVELOPMENTAL PROGRESS MADE BY DLLS IN EARLY HEAD START AND HEAD START What developmental progress is made by children who are DLLs in Head StartEarly Head Start programs
The data addressing this question are limited due to the overall state of the field to reliably or accurately describe the developmental progress of young children who are dual language learners The research field lacks consensus regarding a variety of methodological issues in the assessment of development among DLLs For instance the norms established for the most common measures of child development have not been shown to be valid for children who are dual language learners In addition it is unclear what the best approaches are for
Report to Congress on DLLs in Head Start Page | 17
assessing comprehensive development over time as childrens proficiency in one or more languages and perhaps their dominant language changes In this context the information presented regarding the developmental progress of DLLs in Early Head Start and Head Start reflects data collected utilizing the best methods available at the time the respective studies were designed
The data available for DLLs in Early Head Start provides a single snapshot of their developmental status during their first year in the program The data regarding children in Head Start provides three snapshots of DLLs one of all DLLs at Head Start entry another of the DLLs who were still enrolled in the spring of their Head Start exit year and finally another of DLLs who were still enrolled in the spring and have valid comparable data at Head Start entry and exit
First here is what Baby FACES data show about the developmental status of 1-year old DLLs in Early Head Start
DLLs in Early Head Start are just beginning to develop their vocabulary On average 1shyyear old DLLs understood 22 English words and spoke 1 English word while DLLs identified as understanding Spanish and whose Early Head Start teacher or home visitor also spoke Spanish understood 36 Spanish words and spoke 2 Spanish words On average DLLs understand and use fewer English words than children from monolingual English homes DLLs have a larger vocabulary when both English and Spanish words are considered (41 words in English or Spanish while children from monolingual English homes understood 33 words in English)
Parents and staff reports about the social-emotional development of DLLs differ According to staff (teachers and home visitors) 10 percent of 1-year-old DLLs in Early Head Start had high levels of problem behaviors indicating a delay in social-emotional development In contrast according to parents more than three times as many DLLs (34 percent) were reported to have high levels of problem behaviors indicating a social-emotional delay Teachershome visitors rated similar proportions of DLLs and children from monolingual English homes as having high problem behaviors or low social-emotional competence (25 percent) In contrast parents provided more divergent ratings (43 percent of DLLs compared with 29 percent of children from monolingual English homes)
In brief here is what the FACES 2006 data show regarding developmental status of DLLs during Head Start
DLLs in Head Start increase their receptive English vocabulary during Head Start but they begin and end their Head Start year(s) with receptive English vocabulary well below national norms Average Peabody Picture Vocabulary Test (PPVT-4) scores of both DLLs and children from monolingual English homes increased slightly by spring of childrens Head Start exit year indicating that all children made slight gains relative to their age peers in English vocabulary development Among children with valid data at both time points however it appears that DLLs made greater gains during the Head Start year relative to their peers from monolingual English homes (DLLs increase from 718 to 798 English dominant increase from 874 to 919)
By the end of Head Start DLLs assessed in English demonstrated English letter-word knowledge and spelling skills near the norm for their age DLLs with adequate English
Report to Congress on DLLs in Head Start Page | 18
language skills to pass the English screener and take the English assessment battery at Head Start entry resembled their peers from monolingual English homes in their English letter-word knowledge and spelling skills at Head Start exit and they experienced similar gains over time
On average Spanish-speaking DLLs did not show gains in their Spanish language skills over time They began and ended Head Start with receptive Spanish vocabulary below national norms Moreover among Spanish-speaking DLLs with valid scores at Head Start entry and exit TVIP scores (measuring receptive Spanish vocabulary) decreased slightly from 86 to 83 about one standard deviation below the (monolingual Spanish speaking) norm
By the end of Head Start DLLs assessed in English demonstrate math skills similar to their Head Start peers DLLs regardless of language of assessment improved their math skills beginning and ending Head Start similarly behind their peers in the population as other Head Start children from monolingual English homes Those assessed in Spanish demonstrated math skills a half standard deviation below the norm
In literacy skills and approaches to learning DLLs and children from monolingual English homes look similar According to teachers and parents DLLs and children from monolingual English homes have similar literacy skills both at the beginning and at the end of Head Start Similarly the approaches to learning of DLLs and children from monolingual English homes are the same on average
Teacher reports suggest that DLLsrsquo behavior problems may decline during Head Start-however parent reports remain the same At Head Start entry total numbers of behavior problems reported by parents and teachers of DLLs were similar on average At the end of Head Start the average number of behavior problems reported by parents remained similar while teachers reported fewer problems on average According to teachers DLLs exhibit fewer behavior problems than children from monolingual English homes on average both when they enter Head Start and at the end of their Head Start exit year(s) However parents of DLLs perceive greater problem behaviors in their children than parents from monolingual English homes at both time points
The cognitive-social skills of DLLs and children from monolingual English homes are similar between groups and over time lagging behind their age peers in the norming population Leiter-R Rating Scales (completed by assessors) of childrens cognitive-social development (ie attention organization and impulse control activity level and sociability) show that both DLLs and children from monolingual English homes demonstrated cognitive-social skills below their age peers by between one-half and one standard deviation both when they entered Head Start and in the spring of the Head Start exit year(s)
DLLs come from less literacy-rich home environments When they entered Head Start DLLs came from homes with 19 childrens books on average less than half as many books as in the homes of children from monolingual English homes (47 childrens books on average)
Weight problems increase dramatically among DLLs during Head Start Among DLLs with valid data at both time points the percentage overweight or obese increased from 37 percent at entry to Head Start to 47 percent at the end of Head Start The extent of weight problems increases among DLLs but not children from monolingual English homes during Head Start
Report to Congress on DLLs in Head Start Page | 19
In sum the available data show that on average children served by Head Start lag behind their peers in the population in many areas when they first enter Head Start For DLLs the lag is even greater Neither DLLs nor children from monolingual English homes lose ground during Head Start on average relative to their same age peers in the norming population but neither do they catch up On average DLLs enter Head Start with a disadvantage in some developmental areas (pre-academic achievement) relative to their peers in Head Start from monolingual English homes and typically their gains are similar so they leave Head Start with a similar relative disadvantage In other developmental areas (social-emotional development) the data show no differences between DLLs and children from monolingual English homes in their status at Head Start entry or in their developmental progress during Head Start In some areas (English vocabulary development approaches to learning cognitive-social skills) DLLs appear to make greater gains than their peers during their time in Head Start and this parallels findings in other recent studies of at-scale preschool education programs that have found that DLLs benefit more than their native English-speaking peers (Gormley Gayer Phillips amp Dawson 2005 Horm 2010 Weiland amp Yoshikawa 2011) One area of particular concern is childrens physical health and developmentmdashDLLs are more likely than children from monolingual English homes to be overweight or obese and the prevalence of weight problems increases during their time in Head Start
FINAL THOUGHTS
The substantial and rapidly growing population of young DLLs in the United States presents unique challenges as well as unique strengths to Head Start programs and other early education programs poised to serve them While research capacity builds to improve our understanding and methods for promoting DLLs development there are opportunities to strengthen the services offered to young DLLs and their families The findings in this report rely on descriptive data therefore we cannot draw causal inferences regarding relationships between the services received and experiences or outcomes among DLLs or their families In some areas such as in program services the implications of the data are stronger and suggest areas for renewed focus or effort in engaging families of DLLS targeting services in culturally sensitive ways improving efforts to address health and nutrition issues such as food insecurity and obesity and developing individual family plans) program activities and workshops and links to community resources in ways that are responsive to familys needs and preferences
Improving research capacity to understand DLLsrsquo development and experiences in Head Start While data do not exist to answer some of the questions posed by Congress at this time several efforts are underway to build research capacity in this area in order to improve the state of knowledge about the children and families served by Head Start as well as those served by other early childhood programs As discussed more fully in the report many of the limitations and challenges found in national research studies on Head Start programs reflect gaps in the field of research on early childhood more generally as well as challenges specific to national studies of young children Several ACF-funded research efforts are addressing the gaps in research on this population and the questions posed in the Head Start Act The efforts undertaken by ACF to improve information on children who are dual language learners incl ude
Report to Congress on DLLs in Head Start Page | 20
a combination of adjustments to the instruments and methods used in national surveys and ndash more substantially ndash efforts to launch supplemental research projects to gather more detailed information on key populations of dual language learners in Head Start to build capacity in the research field to provide better information regarding the development needs and strengths of young DLLs and to develop new curricula and assessment tools for young DLLs and their families These activities are discussed in the final chapter of the report
Current programmatic initiatives While research activities are in progress to address the limitations and gaps in existing data concerning young children who are dual language learners ACF is also implementing several programmatic initiatives to improve services to DLLs and their families In addition to the requirement for this report to Congress there were many implications for DLLs in the Improving School Readiness Act of 2007 that helped frame and promote several initiatives to increase support for centers and staff to better serve children who are dual language learners and their families Starting in early 2008 the Office of Head Start has developed a variety of publications conferences and online resources to improve staff access to the most current information regarding how to promote growth and school readiness among DLLs and how to better support their families Most recently as part of revisions to the Head Start Training and Technical Assistance System a National Center on Cultural and Linguistic Responsiveness was established in 2010 to provide the Head Start community with research-based information practices and strategies to ensure optimal academic and social progress for linguistically and culturally diverse children and their families In addition the Head Start Child Development and Early Learning Framework (Revised Child Outcomes Framework) gives staff clear information regarding the importance of gaining an understanding of what children who are dual language learners know and can do across all domains of the framework regardless of language spoken as well as an emphasis on progress towards English Language Development In combination these activities and resources serve as a model of strengthening infrastructure to promote the well-being of diverse children and families responsively and comprehensively
In conclusion many efforts are currently underway to strengthen programs staff and the knowledge base to better serve all children and families in Head Start and Early Head Start programs including those who speak languages other than English at home Activities that are building research capacity to answer questions concerning young dual language learners and their families go hand in hand with programmatic efforts to improve services
Report to Congress on DLLs in Head Start Page | 21
Report to Congress on DLLs in Head Start Page | 22
CHAPTER I INTRODUCTION
The Office of Head Start has long required programs to provide comprehensive services in ways that are culturally appropriate and respectful (45 CFR 130421(a)(1)(i amp iii)) As an extension of this programs are required to support children from homes where a language other than English is spoken in ways that are culturally and linguistically responsive including promoting both their home language and English language development These requirements are consistent with provisions of the Improving Head Start for School Readiness Act of 2007 (PL 110-134 hereafter the Head Start Act) which emphasizes improving outreach enrollment and quality of services to children with limited English proficiency Both the Head Start Act and Head Start program requirements reflect research that demonstrates the importance of supporting acquisition of both languages and the ways that loss of home language can interfere with important aspects of child development and family relations (Administration for Children and Families 2008)
The Head Start Act requires the Secretary to conduct a study on the status of limited English proficient children and their families participating in Head Start programs (including Early Head Start programs) This report presents the results of this study
The use of varying terms and definitions by different researchers and policy makers can complicate learning about children and families who are not native English speakers Thus this introduction starts by examining the terminology in the Head Start Act and introducing the terminology and definitions used in this report After establishing the terminology we review the requirement for this report in the Head Start Act and define the research questions addressed in subsequent chapters Next we summarize the data sources and analytic methods we used to address the research questions and finally we provide a guide to the remainder of the report
A DEFINITION OF lsquoDUL LNGUGE LERNERSrsquo
The Head Start ct uses the term limited English proficient and defines the population broadly to encompass a wide range of children including those exposed to a language other than English those whose native language is not English and those with limited skills in English Specifically section 637 of the law defines the child who is limited English proficient as one
Report to Congress on DLLs in Head Start Page | 23
(A) (i) who was not born in the United States or whose native language is a language other than English
(ii) (I) who is a Native American (as defined in section 9101 of the Elementary and Secondary Education Act of 1965 (20 USC 7801)) an Alaska Native or a native resident of an outlying area (as defined in such section 9101) and
(II) who comes from an environment where a language other than English has had a significant impact on the childs level of English language proficiency or
(iii) who is migratory whose native language is a language other than English and who comes from an environment where a language other than English is dominant and
(B) whose difficulties in speaking or understanding the English language may be sufficient to deny such childmdash
(i) the ability to successfully achieve in a classroom in which the language of instruction is English or
(ii) the opportunity to participate fully in society
In this study we use the term dual language learners (DLLs) to encompass limited English proficient (LEP) as defined in the Head Start ct This term is recognized in the Early Childhood Field as one used for a child who comes from a home where a language other than English is spoken A DLL is a child learning two (or more) languages at the same time or a child learning a second language while continuing to develop their first (or home) language DLL also includes key groups of children served in American IndianAlaska Native (AIAN) and Migrant and Seasonal Head Start (MSHS) programs AIAN or MSHS children served in programs located in federal regions not under the auspices of AIAN Head Start or MSHS and children served in programs in Puerto Rico and US territories
In this report DLLs are defined operationally as children for whom a language other than English (LOTE) was the primary language that parents reported speaking to them Most of the findings reported reflect children who match this definition of DLL Analyses of Program Information Report (PIR)6 data distinguish children who live in homes where a LOTE was the primary language spoken by the family at home Analyses of data from the Head Start Family and Child Experiences Survey (FACES) and the Early Head Start Family and Child Experiences Survey (Baby FACES) distinguish children who live in homes where a LOTE was spoken in the home regardless of which language was the primary language spoken by the family Children for whom English was the only language that parents reported speaking in the home are referred to throughout the report as children from monolingual English homes There is diversity in the language experiences of children in both of these groups nearly one out of four DLLs in Head Start live in homes where English is also spoken and it is likely that some children from monolingual English homes hear other languages at home learly distinguishing home language experiences in dichotomous or simple terms is not fully accurate or completely satisfactory However as with the vast majority of research studies investigating the implications of home language experiences this report must present analyses and findings in somewhat simple terms due to limited sample sizes within some subgroups and for ease of presentation Whenever possible (when distinctions could be made based on the data) analyses examined various groupings of children within this broader definition of DLLs and data tables in the Appendix report these However most of the findings reported in the narrative of
6 The Office of Head Start Program Information Report (PIR) provides comprehensive data on the services staff children and families served by Head Start and Early Head Start programs nationwide All grantees and delegates are required to submit Program Information Reports for Head Start and Early Head Start programs Go to httpeclkcohsacfhhsgovhslcmrpir for additional information about the PIR
Report to Congress on DLLs in Head Start Page | 24
the report reflect children for whom a LOTE was the primary language that parents use when speaking to them as reported by parents Exceptions are noted
B REQUIREMENT IN THE HEAD START ACT FOR THE REPORT (SECTION 649(H)(2))
The Head Start Act requires preparation of a report to Congress addressing questions about the characteristics of and services provided by Early Head Start and Head Start programs to LEPs (as noted in section A LEP has been included within the definition of DLL) More specifically the Act calls for information about
(A) the demographics of limited English proficient children from birth through age 5 including the number of such children receiving Head Start services and Early Head Start services and the geographic distribution of children described in this subparagraph
(B) the nature of the Head Start services and of the Early Head Start services provided to limited English proficient children and their families including the types content duration intensity and costs of family services language assistance and educational services
(C) procedures in Head Start programs and Early Head Start programs for the assessment of language needs and the transition of limited English proficient children to kindergarten including the extent to which such programs meet the requirements of section 642A for limited English proficient children
(D) the qualifications and training provided to Head Start teachers and Early Head Start teachers who serve limited English proficient children and their families
(E) the languages in which Head Start teachers and Early Head Start teachers are fluent in relation to the population and instructional needs of the children served
(F) the rate of progress made by limited English proficient children and their families in Head Start programs and in Early Head Start programs includingmdash
(i) the rate of progress0 toward meeting the additional educational standards described in section 641A(a)(1)(B)(ii) (ie literacy knowledge and skills including phonological awareness print awareness and skills and alphabetic knowledge) while enrolled in such programs
(ii) a description of the type of assessment or assessments used to determine the rate of progress made by limited English proficient children
(iii) the correlation between such progress and the type and quality of instruction and educational programs provided to limited English proficient children and
(iv) the correlation between such progress and the health and family services provided by such programs to limited English proficient children and their families and
(G) the extent to which Head Start programs and Early Head Start programs make use of funds under section 640(a)(2)(D) to improve the quality of such services provided to limited English proficient children and their families
Report to Congress on DLLs in Head Start Page | 25
This report makes use of data available from the Head Start Program Information Report (PIR) the Head Start Family and Child Experiences Survey (FACES) and the Early Head Start Family and Child Experiences Survey (Baby FACES) to address as many of these questions as possible as described in the next section The report also will discuss the limitations of current data and current research methodologies to address many of the questions that are of critical interest to policy makers and practitioners Some of these questions can be answered completely such as describing the demographics of children from families with limited English proficiency (LEP) who are served by Head Start and Early Head Start Other questions can only be answered partially For example data are available to describe the range and nature of services offered to children and families as well as to address aspects of the language assistance provided however the content duration and intensity of all types of services cannot be described in as much detail as desired (eg quality or intensity of instructional supports for language and literacy development) This report provides as much of a response as the available data and existing methods can reliably address For example reporting the rate of progress made by children who are dual language learners and their families enrolled in Head Start programs is limited by the state of the field more broadly in the area of assessment of young dual language learners (discussed more below) and in the area of identification and measurement of family processes for these families For some questions important information is available beyond that specified in the Act such as in the area of qualifications and training provided to teachers Related to this question the report also describes qualifications of other critical staff in Head Start programs such as home visitors education coordinators and program directors as well as other important factors such as the mental health of teaching staff While d ata do not exist to answer some of the questions posed by Congress at this time several efforts are underway to collect additional data in the future and to build capacity in this area in order to improve the state of knowledge about the children and families served by Head Start as well as those served by other early childhood programs Efforts funded by ACF to address these gaps will be discussed in the final chapter of the report
In addition requirement G above references the extent to which grantees directly make use of funds under 640(a)(2)(D) These funds support research demonstrations and evaluations sponsored by the Administration for Children and Families and carried out through competitively awarded grants and contracts The research efforts supported by these funds inform and improve the services provided by Head Start grantees to DLL children and their families OHS technical assistance activities such as the Early Childhood Learning and Knowledge Center (ECLKC) and the National Center for Cultural and Linguistic Responsiveness incorporate the findings of these efforts
C RESEARCH QUESTIONS
This report addresses the following questions presented in the Head Start Act
6 What are the characteristics of children who are dual language learners (DLLs) and their families receiving Head StartEarly Head Start services
Report to Congress on DLLs in Head Start Page | 26
7 What is the nature of the Head StartEarly Head Start services provided to children who are DLLs and their families
8 What are the qualifications and training of Head Start and Early Head Start teachersstaff that serve children who are DLLs and their families
9 What are the languages that Head Start and Early Head Start teachersstaff use in relation to the children and families they serve
10 What developmental progress is observed in children who are DLLs in Head StartEarly Head Start programs
To provide important context for interpreting the answers to these questions the report also highlights differences in each area between DLLs and children from homes where only English is spoken
D DATA SOURCES
In this section we describe the specific data sources analyzed for this report including the purpose methodology and nature of each We present an overview of the information provided by each source for this report with illustrative examples of questions that each data source can address We explain the limitations of the data for the purposes of this report both those specific to each source and those that reflect challenges in the current state of research on young children who are dual language learners
The current report utilizes three datasets to describe the children and families enrolled in Head Start programs and their experiences in the programs the Head Start Program Information Report (PIR) the Head Start Family and Child Experiences Survey (FACES) the Early Head Start Family and Child Experiences Survey (Baby FACES)
Head Start Program Information Report (PIR) The Office of Head Start Program Information Report (PIR) provides comprehensive descriptive data on the services and staff of Head Start and Early Head Start programs nationwide (For more information see descriptions and survey forms at httpeclkcohsacfhhsgovhslcHead percent20Start percent20Programpir) All grantees and delegate agencies are required to submit Program Information Reports annually This administrative dataset provides the most current data available on children and families served by Head Start Early Head Start Migrant and Seasonal Head Start and American Indian and Alaska Native grantees and the services and activities that are provided The data presented here (2007-2008 program year) are not the most current PIR data available at the time of releasing this report they are what was available at the time that data analyses began
The PIR survey is completed by individual programs using a common self-report protocol Surveys are completed by a variety of program staff ranging from program directors (more likely in smaller programs) or Family and Community Partnerships staff to administrative staff in larger programs with multiple centers (Elkin Augustin and Thomas 2007i) PIR data are compiled for analysis at the national regional state and grantee levels Information from the
Report to Congress on DLLs in Head Start Page | 27
PIR is aggregated at the program or grantee level and therefore it is not possible to break down and examine the data by subsets of children such as children who are dual language learners
Primarily we use PIR data in this report to describe program characteristics including enrollment regional distribution program options qualifications of staff and services available to and received by childrenfamilies at the national regional and grantee levels These data permit us to look at the staff and services provided by grantees with different concentrations of children and families speaking languages other than English at home For example where are grantees with higher concentrations of children and families speaking languages other than English located Are there any appreciable differences in the staffing program options or services provided among programs with greater or lesser concentrations of DLL children
The PIR is the only dataset that provides information about the universe of Head Start programs including Migrant and Seasonal Head Start (MSHS) programs American Indian and Alaska Native (AIAN) programs and programs in Puerto Rico and other US territories At this time all of our national data on MSHS programs and AIAN programs come from PIR This permits us to describe limited demographic characteristics of children and families enrolled in MSHS and AIAN programs and the program options and types of services available to and utilized by families enrolled in these programs Also PIR data permit us to describe characteristics of programs with varied concentrations of children who are dual language learners For example we can use PIR data to explore how the type of program or services provided may vary by concentration of DLLs enrolled
The aggregated nature of PIR data poses limitations on the capacity of this dataset to illustrate the experiences of children and families served by Head Start programs PIRs are collected at the grantee-level and grantees correspond to as few as one to as many as over 200 actual program sites centers or settings (PIR 2007-2008) Head Start grantees range from small non-profit agencies that directly operate programs have no delegate agencies and operate as few as one classroom (approximately 1500) to super grantees Super Grantees such as Chicago Los Angeles and New York City include as many as 74 delegate agencies many with multiple program sites and serve over 20000 children in as many as 1000 classrooms across an entire city In some grantees there is wide variation in distribution of DLLs across sites Therefore when describing characteristics or services of grantees serving various concentrations of DLLs findings represent the range of grantees and do not necessarily portray what a child or family typically experiences at a program site or center Furthermore the aggregated nature of PIR data does not allow for analyses looking at experiences of individual children or families in classrooms centers or program sites or the services they received or the relationships between child- classroom- center- or program-level characteristics
There is considerable grantee-specific variability in how reporting categories are assessed Although guidelines and training are available for programs there is no standardization of how programs assess or count instances of the services experiences and characteristics reported in the PIR For some categories such as family home language or staff proficiency in a language other than English the absence of standard assessment protocols used by all grantees to
Report to Congress on DLLs in Head Start Page | 28
determine these in a common way likely leads to considerable variability For other categories such as number of children who completed oral health examinations or number of children with Individualized Education Plans inconsistency in countingassessment methods and reporting is less likely Nonetheless recent validation studies have found some inconsistencies between PIR data and validation study estimates based on program records for PIR items regarding staff credentials and child and family services (Elkin Augustin and Thomas 2007 GAO-08-221 2008ii) Current efforts are underway to strengthen guidelines for data collection and reporting by programs and for verification of data Since PIR data are collected annually from all Head Start programs the dataset provides a unique and informative window into the range of services offered and the children and families enrolled nationwide especially in areas that other data collection efforts have not been able to represent
Head Start Family and Child Experiences Survey (FACES) The Head Start Family and Child Experiences Survey (FACES) is a nationally representative cohort study of three- and four-yearshyold children newly enrolled in Head Start (For more information see technical reports on ACF website httpwwwacfhhsgovprogramsoprehsfaces) FACES data have been collected every three years since 1997 This report uses data from the 2006 cohort which includes three-and four-year-old children who entered Head Start in the fall of 2006 their families and local program staff (West Tarullo Aikens Sprachman Ross amp Carlon 2007)
FACES complements PIR data by bringing analyses down to the child level We present FACES data from (1) interviews with parents at Head Start entry (Fall 2006) and exit (2) interviews with teachers education coordinators and center directors in the fall of 2006 (3) teacher reports of each child at Head Start entry (Fall 2006) and in the spring until Head Start exit (4) observations of Head Start classrooms in the spring of 2007 and (5) direct child assessments at Head Start entry (Fall 2006) and in the spring until Head Start exit (West et al 2010 West et al 2008 Tarullo et al 2008) FACES data are used here to describe at the individual level (1) characteristics and experiences of children and families enrolled in Head Start (2) staff qualifications credentials and beliefs (3) classroom practices and quality and (4) developmental progress of children
FACES data permit us to describe the characteristics and experiences of children and their families by varying degrees of exposure to languages other than English (ie children whose parents primarily use a language other than English to speak with them children with low English proficiency at Head Start entry) We can present the developmental progress of children with different home language experiences from entry into Head Start until exit from Head Start In addition we can link individual children and families with classroom teacher and center-level characteristics Therefore we are able to describe the classroom experiences of children who are primarily hearing a language other than English at home including the languages of instruction in their classrooms In descriptions of teacher classroom or center-level characteristics only the focal child is DLL however since monolingual English children could be and likely are in classrooms with DLL children these data do not only portray experiences of LOTE children
Although FACES is designed to be nationally representative the dataset has several limitations that restrict our ability to generalize to all children enrolled in Head Start programs
Report to Congress on DLLs in Head Start Page | 29
First the sample only includes children who entered Head Start in the fall of 2006 and who were attending Head Start at the different points of data collection Therefore children who enrolled but never attended or who stopped attending prior to data collection in the spring of 2007 are not represented in these analyses Second FACES did not assess childrens development in other languages besides Spanish and English and assessment in Spanish is limited Due to the small sample sizes among groups of children speaking languages other than English or Spanish and limited assessment tools in these other languages FACES has far more data on Spanish-speaking children in Head Start than on children speaking any other languages other than English (LOTEs) As reported in Chapter II the most common LOTE among children in Head Start programs is Spanish accounting for 26 percent of all children enrolled or 84 percent of children from homes where a language other than English is spoken Children in FACES 2006 who speak a language other than English or Spanish total 6 percent of the sample and represent several languages The next most common LOTEs after Spanish are Asian languages accounting for 2 percent of children enrolled We can report on development in a LOTE for Spanish-speaking children only Children were not assessed directly if they could not be assessed in English and they spoke a language other than Spanish
For multiple reasons FACES has not sampled from programs operated by federally recognized American IndianAlaska Native (AIAN) tribes consortia or corporations Migrant and Seasonal Head Start (MSHS) programs or programs located in Puerto Rico and the Pacific Islands Therefore FACES data cannot be used to describe children and families served by these programs MSHS (Region 12) programs have more flexibility than other Head Start programs to structure services differently to serve the families in their communities resulting in a much wider range of program variations For example MSHS programs coordinate enrollment periods and length of program year with the local agricultural seasons hence the pre-post design of FACES (ie fall and spring of a traditional academic year) would not capture the services MSHS programs provide AIAN programs (Region 11) reflect the diversity of languages and traditions that exist in AIAN cultures vary greatly in size and are geographically dispersed In order to acquire a sample that would be large enough to be nationally representative of these programs any national survey would require a massive sample collected from many geographically remote areas and the costs would be prohibitive Despite the inability to include AIAN programs FACES does include AIAN children accounting for approximately 2 percent of the sample Moreover it is not clear what measures are appropriate for use with the populations served by MSHS AIAN programs programs in Puerto Rico or the Pacific Islands as there has not been adequate testing and validation of existing measures ACF-funded efforts that are underway to improve research in these communities are discussed below For these reasons FACES as well as other national studies of Head Start programs to date have not been able to produce comparable data for these Regions and populations (For more information regarding the program regulationsperformance standards and distinguishing characteristics of MSHS and AIAN programs see httpeclkcohsacfhhsgovhslc and related research efforts at httpwwwacfhhsgovprogramsopreprojectheadStartProjectsjsp)
Finally FACES 2006 used the best developmental assessments and procedures available at the time of data collection FACES represents the cutting-edge of national surveys in assessing
Report to Congress on DLLs in Head Start Page | 30
development of young children who are dual language learners (DLLs) but it had to balance the need to represent the experiences of all children in Head Start with a commitment to accurately reflect the experiences of DLLs As discussed more fully below data on developmental progress of DLLs is generally limited by lack of widely recognized reliable measurements in the field at this point in time
Early Head Start Family and Child Experiences Survey (Baby FACES) The Early Head Start Family and Child Experiences Survey (Baby FACES) is a nationally representative sample of infants who enrolled in Early Head Start in 2009 (For more information see Baby FACES technical reports at httpwwwacfhhsgovprogramsopreehsdescriptive_studyindexhtml) We use data from the 1-year-old cohort which includes children who were between 10 and 15 months of age at the time of data collection in the spring of 2009 their families and local program staff
Baby FACES supplements PIR and FACES data by focusing on infants served by the Early Head Start programs and by bringing analyses down to the child- and family-level for this group We present Baby FACES baseline data collected in spring of 2009 from (1) interviews with parents (2) interviews with home visitors and teachers (3) interviews and self-administered surveys with program directors (4) home visit observations and (5) direct classroom observations These data are used here to describe at the individual level (1) characteristics and developmental status of 1-year-old children in Early Head Start (2) program services including quality of home visits and classrooms (3) staff qualifications and credentials and (4) family well being parent-child interactions and aspects of the home environment
Baby FACES data provide a snapshot of infants developmental status and family experiences when children are 1 (and eventually will depict these children at 2- and 3-years old) Baby FACES data permit analyses of children by varying degrees of exposure to languages other than English (ie children from homes in which a language other than English is spoken children whose parents primarily use a language other than English to speak with them) Hence we can present the developmental status of children with different home language experiences at or soon after entry into Early Head Start In addition we can link individual children and families with home visitors teacher classroom and center-level characteristics Therefore we are able to describe the care experiences of infants who are primarily hearing a language other than English at home including the languages spoken by home visitors teachers or other adults in their classrooms
Although Baby FACES provides us with nationally representative data regarding infants in Early Head Start (EHS) programs there are several limitations that constrain our ability to generalize to all infants and toddlers enrolled in EHS programs First the Baby FACES sample only includes children around the target age at the time of the first data collection Thus the study does not address children of different ages
Second the Baby FACES data that was available at the time of preparing this reportmdash baseline data collected in Spring 2009mdashdoes not permit analyses of developmental progress once infants and families have been enrolled in Early Head Start for a period of time In addition as described above due to the small sample sizes of non-Spanish speaking young DLLs and the lack of reliable instruments in languages other than English and Spanish we are unable
Report to Congress on DLLs in Head Start Page | 31
to present as much information about infants in families where non-Spanish LOTEs are spoken Finally the Baby FACES sample does not include children and families served by MSHS or AIAN programs for the reasons described above pertaining to differences in the structure of programs and consequently the constraints on acquiring a representative sample Most important although Baby FACES used the best developmental assessments and procedures available at the time of data collection measurement of language development for infants and toddlers is not as robust as for preschoolers This is especially true for assessments of children experiencing LOTEs
E LIMITATIONS OF RESEARCH FOR THIS POPULATION
The limitations of extant research and methodology concerning young children who are dual language learners (DLLs) restrict the quality of data that are available on DLLs in Head Start programs Both FACES and Baby FACES utilized the best and most feasible methods available for nationally representative comprehensive large-scale studies to represent the experiences of young children who are dual language learners After consultation with leaders in the field both program and research experts FACES and Baby FACES used state of the art methods to assess development among young dual language learners For example FACES utilized a language screener to route Spanish-speaking children to the appropriate language for assessment In addition childrens language development (receptive vocabulary) was assessed in both English and Spanish if they lived in a home where Spanish was spoken regardless of their proficiency in either language In Baby FACES the study team worked with the Preschool Language Scale (PLS) measure developer to use a version of PLS 4 that assesses Spanish and English ability in the same testing (conceptual scoring) before this innovation had been published Also Baby FACES asked parents and staff to report on both English and Spanish vocabulary as well as many details of the language environment in the home It is unusual in a survey of this nature to employ such methods Nonetheless the state of research methodology for young DLLs is inadequate in many areas including but not limited to developmental assessments (National Research Council 2008iii)
First the research field lacks consensus or clear standards for determining if a child is a dual language learner Recent reviews of the published research literature on young DLLs have found substantial inconsistency in how DLL status is determined (CECER-DLL 2011aiv) The literature presents a range of operational definitions and within individual studies the methods for classifying children are often unclear or unspecified Parent or teacher reported language proficiency is most common Direct assessment or screening for language dominance is least common When DLL determination is more than a dichotomous variable there is lack of consensus about how to analyze data to examine differences by language exposure meaningfully or comprehensibly Discussions with state-level administrators of Child Care Development Block Grants and early childhood systems suggest that administrative data across early childhood systems also vary in how DLL status is determined (CECER-DLL 2011b v)
Second the research field lacks consensus regarding reliable developmental assessment instruments for young children who are dual language learners as well as the appropriate methods for assessing development over time as their language skills in one or both languages
Report to Congress on DLLs in Head Start Page | 32
change Most currently available measures of the developmental progress of young DLLs are problematic and cannot yet provide information regarding comprehensive developmental status or the effectiveness of interventions in early childhood for young DLLs (ACF 2008a ACF 2008b Espinosa amp Lopez 2007vi) Challenges in the availability of valid assessments for DLLs and standards for implementation or accommodations are not limited to early childhood as recent reports have documented the inadequacy of academic assessments for students in grades K-12 with limited English proficiency (GAO-06-815 2006 Rabinowitz amp Sato 2005 Sato et al 2007vii) However the lack of valid instruments to assess the breadth of developmental domains in the preschool years is especially pronounced The measures that are available are primarily for DLL children whose LOTE is Spanish offering virtually nothing for children with other languages spoken at home (ACF 2008c Espinosa amp Lopez 2007viii) Again this same limitation exists for children in the preschool years and in grades K-12 Furthermore many of the most widely used measures with documented evidence of validity for use with young DLLs who speak Spanish have been validated with samples of Spanish-speaking monolinguals or with homogeneous samples that do not reflect the diversity of cultures and dialects present in the Spanish-speaking population in this US Finally it is unclear what the best approaches are for assessing comprehensive development as childrens proficiency in one or more languages and perhaps their dominant language changes What approaches would yield the most comparable data across groups of children with different language experiences For example once children pass an English language screener do they understand enough English for instruments delivered in English to adequately and reliably assess their knowledge and skills in other developmental domains For how long should dual language learners be assessed in multiple languages in order to observe a complete picture of their abilities The limitations in existing research methods that are described above are more pronounced for infants and toddlers from homes where a LOTE is spoken (Fernald 2006ix)
Many advances and promising methodological approaches and solutions are being developed or utilized in smaller scale studies for research with young children who are dual language learners (for a review see Barrueco Loacutepez Ong amp Lozano 2012 as example see Bedore Pentildea Garcia amp Cortez 2005x) For example elaborate language screeners that rely on multiple reporters or detailed accounts of language exposure in the focal childs life are being used currently in some ACF-funded research projects that have been developed in partnership with local Head Start centers (ACF 2011 Lopez Arango amp Feron 2012 Melzi McWayne amp Schick 2012 xi) However these are not yet validated for a variety of Spanish-speaking populations and are difficult to apply in large-scale studies with samples that are more diverse and with interview protocols that are more extensive In addition the comprehensive nature of national studies such as FACES and Baby FACES limits the ability to utilize and implement some of the most advanced methods for assessing child development that are currently employed in more focused studies such as investigations centered on language development However conceptual scoring an analytic approach that accounts for unique and overlapping responses produced by multilingual children in each of their languages is being implemented in the most recent waves of Baby FACES (ACF 2009xii)
Currently ACF has several efforts underway to address to address the limitations and gaps in data about young dual language learners including activities to advance the capacity of the
Report to Congress on DLLs in Head Start Page | 33
research field overall to answer questions concerning DLLs These efforts are described in the final chapter of this report
F ANALYSES
To answer the research questions we compiled data from the multiple sources described above the 2007-2008 Program Information Report (PIR) the Baby FACES 2009 Cohort and the FACES 2006 Cohort Even together the data sources do not provide a complete picture of DLLs and their families served by Head Start and Early Head Start Nevertheless taken together these data sources offer important insights into the characteristics of DLLs in Head Start and Early Head Start that will be useful to policy makers and program leaders
In the current report the operational definition of children who are dual language learners has been selected to be inclusive of children across various levels of exposure to languages other than English whenever the data permit Depending on the data source more or less distinction regarding the level of exposure to English or a LOTE is possible in analyses For example PIR data report on the languages spoken by families but there is no standard definition or questions used by programs to guide which families are counted or how languages are identified As explained above for ease of reading most findings reported in the text will highlight children for whom a LOTE is the primary language spoken at home unless differences were identified between the groups of DLL children in analyses that could examine different groupings In general no significant differences were found across LOTE groups (ie children for whom LOTE is primary language spoken versus children from homes in which LOTE is spoken)
Descriptive analyses using each data source were conducted The analyses used analytic weights provided with the survey datasets to take into account the sampling design and data collection non-response All estimates pertaining to Head Start children obtained using FACES 2006 data are weighted to represent the population of children entering Head Start for the first time in Fall 2006 or those entering for the first time in 2006 who are still enrolled after one or two years as indicated when specific findings are presented Estimates using Baby FACES data are weighted to represent the population of 1-year-old children enrolled in Early Head Start in Spring 2009 PIR data include information on the universe of Head Start Early Head Start and Migrant and Seasonal Head Start (MSHS) programs so no analytic weights are needed
The FACES and Baby FACES data do not include children and families in MSHS programs in American IndianAlaska Native (AIAN) programs or who are native residents of a US territory Because MSHS programs serve mostly DLLs and their families information about MSHS programs is obtained from the PIR data and reported when it is available Data for MSHS programs pertain to all children and families enrolled in these programs however nearly 90 percent of these children are DLLs (see the next chapter)
AIAN programs serve mostly children from homes in which only English is spoken so we do not include these programs in most analyses Although many AIAN programs have language preservation and revitalization efforts the majority of children enrolled come from homes where English is the only language spoken at home Only 7 percent of children enrolled
Report to Congress on DLLs in Head Start Page | 34
in AIAN programs are reported to come from families that speak a LOTE and 13 percent of AIAN programs report serving families who speak a native language
In the case of children who reside in US territories such as Puerto Rico we considered including information obtained from the PIR when available but concluded that being from a home in which English is not the primary language spoken has a very different meaning when the prevailing language spoken in society is not English Therefore we do not include these children in analyses using PIR data
As discussed above the findings reported in the text focus on children for whom a language other than English is the primary language spoken to them at home (DLLs) unless noted otherwise
G ORGANIZATION OF THE REPORT
The following chapters address each research question in turn Each chapter begins with a brief summary of the data and methodology used to address the research question with a focus on the specific measures and methods used to address that question Then the chapter presents a summary of the key findings pertaining to DLLs followed by a discussion of the key differences between DLLs and children from homes where only English is spoken Each chapter ends with a brief conclusion Tables presenting the detailed findings underlying the summary in each chapter are contained in Appendices to the report The final chapter discusses crossshycutting themes
Report to Congress on DLLs in Head Start Page | 35
CHAPTER II CHARACTERISTICS OF DLLS
In this chapter we address the first research question posed in the Head Start Act
What are the characteristics of children who are dual language learners (DLLs) and their families receiving Head StartEarly Head Start services
In the next section we summarize the data sources and analytic methods used to address this question The following section examines the characteristics of DLLs and their families These findings are put into context in the final section which highlights differences between DLLs and children from monolingual English homes
A METHODOLOGY
To answer this research question we compiled data from multiple sources These include the 2007-2008 Program Information Report (PIR) the 2009 Baby FACES Parent Interview and the 2006 FACES Parent Interview and the Teacher Child Report
Descriptive analyses of each data source were conducted The analyses used analytic weights provided with the survey datasets to take into account the sampling design and data collection non-response All estimates pertaining to Head Start children obtained using FACES 2006 data are weighted to represent the population of children entering Head Start for the first time in Fall 2006 or those entering for the first time in 2006 who are still enrolled after one year if they entered at age four or two years if they entered at age three Estimates using Baby FACES data are weighted to represent the population of 1-year-old children enrolled in Early Head Start in Spring 2009 PIR data include information on the universe of Head Start Early Head Start and Migrant and Seasonal Head Start (MSHS) programs so no analytic weights are needed
The FACES and Baby FACES data do not include children and families in MSHS programs or children and families in American IndianAlaska Native (AIAN) programs Because MSHS programs serve mostly DLLs and their families information about MSHS programs is obtained from the PIR data and reported when it is available
As discussed in Chapter I the findings reported focus on children for whom a language other than English is the primary language spoken to them at home (DLLs) unless noted otherwise Data for MSHS programs pertain to all children and families enrolled in these programs
B CHARACTERISTICS OF DLLS AND THEIR FAMILIES
Slightly more than one-fourth of children enrolled in Head Start and Early Head Start come from homes in which a language other than English is the primary language spoken According to the 2007-2008 PIR 29 percent of children enrolled in Head Start and 26 percent of children enrolled in Early Head Start are DLLs (Table II1) Most children enrolled in MSHS programs are DLLs (89 percent) while only 7 percent of children enrolled in AIAN programs are DLLs (Table II1)
Report to Congress on DLLs in Head Start Page | 36
DLLs are most heavily concentrated in the West and South regions of the US but there are DLLs in all regions and US territories According to 2007-2008 PIR data 37 percent of DLLs in Head Start Early Head Start MSHS and AIAN programs are located in the West and 23 percent attend programs in the South The remaining DLLs are almost evenly distributed across programs in the Northeast (15 percent) Midwest (13 percent) and US Territories (13 percent) (Table II2)
The geographic distributions of Head Start and Early Head Start programs are similar In both programs the highest proportion of programs is located in the West (35 percent and 41 percent respectively) Approximately one-fifth of programs are located in the South (21 percent and 19 percent respectively) DLLs in Early Head Start are less likely than those in Head Start to be in programs located in US Territories (9 percent compared with 15 percent) Similar proportions of children enrolled in Head Start and Early Head Start are in programs located in the Northeast (16 percent and 17 percent respectively) and Midwest (13 percent and 14 percent respectively) (Table II2)
MSHS programs are concentrated in the South (42 percent) and West (45 percent) with far fewer in the Midwest (9 percent) and Northeast (4 percent) (Table II2)
For most DLLs in Head Start and Early Head Start Spanish is the primary language spoken at home The data consistently show that more than four-fifths of DLLs enrolled in Head Start and Early Head Start are from Spanish-speaking homes According to the 2007-2008 PIR 84 percent of DLLs are from Spanish-speaking homes 6 percent are from homes where an Asian language is spoken and the remaining DLLs come from homes where other languages are spoken including EuropeanSlavic languages African languages Pacific Island languages and Native North AmericanAlaska Native languages (Table II3)
FACES data also show that among DLLs entering Head Start in Fall 2006 84 percent were from homes where Spanish was spoken 5 percent were from homes where an Asian language was spoken and 3 percent were from homes where an African language was spoken (Table II4) Baby FACES data show that among the 1-year-old Early Head Start enrollees in Spring 2009 who were DLLs 91 percent were from Spanish-speaking homes (Table II5)
Although 91 percent of mothers of DLLs in Baby FACES reported speaking to their child in Spanish (the remaining 9 percent reflecting all other LOTEs) 49 percent of mothers of DLLs also reported speaking to their child in English (Table II5) The data show a similar pattern among birth fathers and grandparents although these family members were less likely to also speak to the child in English (Table II6) Mothers reported that siblings were more likely to speak to their child in English (78 percent) than to speak a LOTE
Among the children enrolled in MSHS programs approximately 9 out of 10 speak a language other than English at home Spanish-speaking families are the most common non-English speaking group in MSHS programs (85 percent) (Table II7) Only approximately 4 percent of MSHS families primarily speak one of the Native Central American South American Mexican or Caribbean languages Less than 1 percent primarily speaks an Asian Pacific Island Native North AmericanAlaska Native or other language at home No families served by these programs speak African languages or EuropeanSlavic languages (Table II7)
Report to Congress on DLLs in Head Start Page | 37
Few children enrolled in tribal programs speak a language other than English at home The most common non-English language spoken at home by children in tribal programs is a native language (Native North AmericanAlaska Native language) spoken by 5 percent of all children in AIAN programs (Table II7) Less than 2 percent of children in tribal programs speak Spanish and less than 1 percent speaks other languages
Report to Congress on DLLs in Head Start Page | 38
Report to Congress on DLLs in Head Start Page | 39
Most DLLs in Head Start and Early Head Start were born in the United States The majority of their parents were born outside of the US According to FACES data 92 percent of DLLs entering Head Start in Fall 2006 were born in the US but most of their parents (86 percent of mothers and 90 percent of fathers) were born outside the US Among DLLs entering Head Start 82 percent had two parents born outside the US (Table II8) Similarly Baby FACES data show that two-thirds of 1-year-old children in Early Head Start in Spring 2009 had foreign-born mothers and three-fourths had foreign-born fathers (Table II9) Both parents in 64 percent of the families were foreign-born
The majority of foreign-born parents of DLLs in Head Start and Early Head Start came from Mexico Among DLLs who entered Head Start in Fall 2006 and had foreign-born parents two-thirds had parents who came from Mexico Approximately 10 percent had parents who came from Central American countries 7 percent had parents who came from South American countries 6 percent had parents who came from Asian countries and 5 percent had parents who came from African countries (Table II8) Baby FACES data show that among 1-year-old DLLs in Early Head Start in 2009 more than three-quarters with foreign-born parents had parents who came from Mexico 10 percent had parents who came from Central American countries and 5 percent had parents who came from African countries (Table II9)
The majority of parents of DLLs in Head Start and Early Head Start have been in the US for 6 years or more FACES data show that approximately three-quarters of foreign-born mothers and fathers of DLLs had been in US for 6 years or more (Table II8) According to Baby FACES data more than two-thirds of foreign-born mothers and three-quarters of foreign-born fathers of DLLs had been in the US for 6 years or more (Table II9)
Report to Congress on DLLs in Head Start Page | 40
Among parents of DLLs in Head Start and Early Head Start whose first language is not English more than half report that they donrsquot understand English well or donrsquot understand it at all According to FACES data 48 percent of parents of DLLs who entered Head Start in Fall 2006 did not understand English well and an additional 15 percent did not understand it at all (Table II10) Baby FACES data show that 47 percent of parents of DLLs did not understand English well and an additional 10 percent did not understand English at all (Table II11)
Most parents of DLLs in Head Start and Early Head Start report that they are literate in their native language but approximately two-thirds have difficulty reading English Nearly all parents of DLLs entering Head Start in 2006 were literate in their first language but the parents of 63 percent of these children reported reading English not at all or not well Thirty-eight percent reported understanding English well or very well while 35 percent reported reading English well or very well (Table II10) Similarly the parents of about two-thirds of 1-year-old DLLs in Early Head Start reported reading very well (60 percent) or well (34 percent) in their first language while 60 percent reported difficulty with reading English Approximately 18 percent reported reading English very well and an additional 22 percent read English well (Table II11)
The majority of DLLs in Head Start and Early Head Start live with both their mother and their father According to FACES data 72 percent of DLLs who entered Head Start in Fall 2006 lived with both their mother and their father (biological or adoptive) (Table II12) Baby FACES data show that 71 percent of 1-year-old DLLs in Early Head Start in Spring 2009 lived with both their mother and their father (biological or adoptive) (Table II13) The 2007-2008 PIR data indicate that 75 percent of children enrolled in MSHS programs most of whom are DLLs lived in two-parent families (Table II13a)
Among DLLs in Head Start who live with two parents their parents are more likely to be married (49 percent) than unmarried (23 percent) (Table II12) According to Baby FACES data 37 percent of 1-year-old DLLs were living with two parents who were married (Table II13)
On average DLLs in Head Start and Early Head Start live in households of 5 people DLLs who entered Head Start in Fall 2006 lived with an average of 24 adults and 27 children About 13 percent of DLLs who entered Head Start in 2006 lived in intergenerational households (Table II14)7 One-year-old DLLs in Early Head Start in Spring 2009 lived with an average of 21 adults and 29 children About 13 percent lived in an intergenerational household (Table II15)
Only a small proportion of DLLs in Head Start and Early Head Start were born to a teenage mother Among those DLLs entering Head Start in 2006 9 percent were born to a teenage mother On average DLLs were born to mothers who were 267 years old (Table II16) Of the 1-year-old DLLs in Early Head Start in Spring 2009 16 percent were born to teenage mothers Like mothers of DLLs entering Head Start the mothers of 1-year-old DLLs in Early Head Start in Spring 2009 were 262 years old on average when their child was born (Table II17)
7 Intergenerational households are defined as those in which the child lives with at least one biological or adoptive
parent and at least one grand- or great-grandparent
Report to Congress on DLLs in Head Start Page | 41
The majority of DLLs in Head Start and Early Head Start are living with parents who have not earned a high school diploma or GED Less than one-third of DLLs live with a parent who has education beyond high school FACES data show that 60 percent of mothers and 66 percent of fathers with whom DLLs were living had not earned a high school diploma or GED Approximately half of DLLs who entered Head Start in 2006 were living with at least one parent who had earned a high school diploma or GED 22 percent of DLLs were living with at least one parent with education beyond high school (Table II18)
Baby FACES data reveal that 54 percent of mothers and 59 percent of fathers with whom 1-year-old Early Head Start DLLs were living had not earned a high school diploma or GED Approximately 62 percent of 1-year-old Early Head Start DLLs in 2009 were living with at least one parent who had earned a high school diploma or GED 29 percent were living with at least one parent with education beyond high school (Table II19)
The 2007-2008 PIR data show that 76 percent of children enrolled in MSHS programs most of whom are DLLs were living with parents who had not completed a high school diploma or GED (Table II13a)
Most DLLs come from working families Among DLLs entering Head Start in Fall 2006 85 percent lived with at least one parent who was employed and 70 percent lived with at least one parent who was employed full-time (Table II20) Among parents of 1-year-old DLLs in Early Head Start in Spring 2009 80 percent lived with at least one employed parent and 64 percent lived with at least one parent who was employed full-time (Table II21) In MSHS programs according to the 2007-2008 PIR in 90 percent of two-parent families and 76 percent of single parent families at least one parent is employed (Table II13a)
Fathers of DLLs are more likely to be employed than mothers According to FACES 67 percent of DLLs entering Head Start in Fall 2006 lived with an employed father and 39 percent lived with an employed mother (Table II20) In Spring 2009 54 percent of 1-year-old DLLs in Early Head Start lived with an employed father and 31 percent lived with an employed mother (Table II21)
Small percentages of DLLs live with a parent who is unemployed and looking for work Among DLLs entering Head Start in 2006 8 percent lived with a mother who was unemployed and looking for work and 3 percent lived with a father who was unemployed and looking for work (Table II20) Among 1-year-old DLLs in Early Head Start in Spring 2009 20 percent had a mother who was unemployed and looking for work and 8 percent had a father who was unemployed and looking for work (Table II21)
Most DLLs in Head Start and Early Head Start are living in poverty FACES data show that 64 percent of DLLs who entered Head Start in Fall 2006 lived in a household with income at or below the poverty threshold 81 percent lived in a household with income at or below 130 percent of the poverty threshold (Table II22)8 Among 1-year-old DLLs in Early Head Start in
8 The federal poverty threshold for a family of four was $20000 in 2006 Head Start qualifying criteria are based
on family income not household income and there are other circumstances not dependent on family income that may qualify a child or family for the program regardless of income Other qualifying criteria include children in
Report to Congress on DLLs in Head Start Page | 42
Spring 2009 76 percent lived in a household with income at or below the poverty threshold 90 percent lived in a household with income at or below 130 percent of the poverty threshold (Table II23)
Most parents of DLLs in Head Start and Early Head Start are not receiving welfare cash assistance but many are receiving food stamps and most participate in WIC Among DLLs who entered Head Start in Fall 2006 15 percent lived in households that received federal cash assistance 31 percent lived in households that received food stamps and 74 percent participated in WIC (Table II24) Baby FACES data show that 30 percent of 1-year-old DLLs in Early Head Start lived in households that received federal cash assistance while 52 percent lived in households that received food stamps and 92 percent participated in WIC (Table II25) Only 3 percent of families in MSHS programs were receiving federal cash assistance in 2007-08 but 57 percent were receiving WIC benefits (PIR 2007-2008)
Financial struggles are common in families of DLLs in Early Head Start According to Baby FACES data 48 percent of parents of 1-year-old DLLs in Spring 2009 reported having at least one out of five financial security difficulties they were asked about9 Nearly one-third could not pay the full amount of their rent or mortgage and 31 percent could not pay the full amount of their utility bills Nearly one-quarter reported that their telephone service had been disconnected because payments were not made (Table II26)
These financial struggles were reflected in food security issues reported by the families of DLLs in Early Head Start Half of the parents of DLLs reported having at least one out of five food security difficulties they were asked about10 Approximately 48 percent were worried that food would run out and 42 percent reported that they relied on only a few kinds of low-cost food to feed their children In addition 30 percent reported that they could not feed their children a balanced meal for financial reasons (Table II27)
Relatively few DLLs in Head Start have had a disability identified by a professional Teachers reported that approximately 8 percent of DLLs who entered Head Start in Fall 2006 had a developmental problem delay or special need indicated by a professional Teachers reported that of those DLLs with a disability 76 percent had a speech or language impairment 21 percent had a cognitive impairment and 13 percent had a sensory impairment (Table II28) According to the 2007-2008 PIR 41 percent of children enrolled in MSHS programs had a disability
foster care and children with special needs Individual grantees may also propose qualifying criteria to target special populations within the communities they serve (eg families in transitional housing) 9
The financial difficulties asked about included the following experiences (1) could not pay the full amount of gas oil or electricity bills (2) could not pay the full amount of rent or mortgage (3) had service disconnected by the telephone company because payments were not made (4) had services turned off by the gas or electric company or oil company would not deliver oil (5) was evicted from home or apartment 10
The food security difficulties asked about included the following experiences (1) worried food may run out (2) food didnt last and didnt have money to get more- (3) relied on only a few kinds of low-cost food to feed children because of financial reasons- (4) couldnt afford to eat balanced meals- (5) couldnt feed children a balanced meal for financial reasons
Report to Congress on DLLs in Head Start Page | 43
Nearly all DLLs in Head Start and Early Head Start receive regular medical and dental checkups appropriate for their age According to FACES data 99 percent of DLLs who entered Head Start in 2006 had received a regular medical checkup in the past year and 92 percent had received a regular dental checkup in the past year (Table II29) Among 1-year-old DLLs in Early Head Start in Spring 2009 all were reported to have received a regular medical checkup in the past year and 28 percent had ever visited the dentist (Table II30) Given the program requirements pertaining to medical and dental screenings within 45 days of enrollment and the timing of data collections it is likely that many of these children received services provided by or secured with assistance from the Head Start and Early Head Start programs
Nearly all DLLs in Head Start and Early Head Start have some health insurance coverage Among DLLs entering Head Start in 2006 91 percent were covered by health insurance Approximately 57 percent had private health insurance coverage 66 percent had Medicaid coverage and 6 percent were enrolled in the State hildrens Health Insurance Program (SHIP) (Table II29) Among 1-year-old DLLs in Early Head Start 95 percent were covered by health insurance Nearly one-fourth (24 percent) were covered by private insurance 77 percent had Medicaid coverage and 19 percent were enrolled in SCHIP (Table II30) According to the 2007shy2008 PIR 97 percent of children in MSHS programs were covered by health insurance by the end of the enrollment year Most were covered by Medicaid (72 percent) SCHIP (3 percent) or both (5 percent)
Many DLLs in Head Start and Early Head Start receive child care in other settings most often in home-based care by relatives Among DLLs entering Head Start in 2006 26 percent were in some child care arrangement outside of Head Start 60 percent of these children were cared for by relatives and 23 percent were cared for by nonrelative family child care providers (Table II31) According to Baby FACES data 58 percent of 1-year-old DLLs in Early Head Start in Spring 2009 were in some kind of child care arrangement outside of Early Head Start Three-fourths of these children were cared for by relatives and 13 percent were cared for by nonrelative family child care providers (Table II32)
Some parents of DLLs report symptoms of depression The primary caregivers of DLLs in Head Start reported an average of 35 symptoms of depression (out of 12 they were asked about) and 12 percent reported symptoms indicating they may have had moderate to severe depression (Table II33)11 In Early Head Start primary caregivers of DLLs reported an average of 4 symptoms of depression and 13 percent of DLLs had primary caregivers who reported symptoms indicating that they were moderately or severely depressed (Table II34)
The parenting beliefs reported by primary caregivers of DLLs in Early Head Start reveal a mix of traditional and progressive beliefs They report relatively high levels of both traditional authoritarian parental beliefs (mean of 20 out of 25 possible points) and progressive
11 Both Baby FACES and FACES used the Center for Epidemiologic Studies Depression Scale (CES-D) short form to
measure depressive symptoms (Ross Mirowsky and Humber 1983) The short form consists of 12 items asking parents to rate on a 4-point scale how often in the past week they experienced the symptom Parent responses are summed to create a total score that can range from 0 to 36 Scores of 5 to 9 indicate mild depressive symptoms scores of 10 to 14 indicate moderate depressive symptoms and scores of 15 or higher indicate severe depressive symptoms
Report to Congress on DLLs in Head Start Page | 44
democratic beliefs (mean of 19 out of 25 points) (Table II35)12 Of the 1-year-old Early Head Start DLLs 6 percent have parents who reported spanking their child in the previous week (Table II35)
C DIFFERENCES BETWEEN DLLS AND CHILDREN FROM MONOLINGUAL ENGLISH HOMES
DLLs in Head Start and Early Head Start differ from children from monolingual English homes beyond the differences in language raceethnicity and immigrant background that define them These differences likely reflect both the very different paths that may have brought them to Head Start and Early Head Start and the challenges that lack of proficiency in English presents for families of DLLs
DLLs are more likely than children from monolingual English homes to live in larger households with two parents
DLLs entering Head Start in Fall 2006 were much more likely than children from monolingual English homes to live with two parents (72 percent vs 33 percent) and to live with two parents who are married (49 percent vs 23 percent) (Table II12) In Early Head Start 1-year-old DLLs in Spring 2009 were more likely than their counterparts from monolingual English homes to live with two parents (71 percent vs 38 percent) and to live with two parents who are married (37 percent vs 23 percent) (Table II13)
DLLs who entered Head Start in Fall 2006 lived in larger households than children from monolingual English homes (an average of 5 vs 4 persons and more than twice as likely to live in household with 3 or more adults) (Table II14) Similarly 1-year-old DLLs in Early Head Start in Spring 2009 lived in larger households than 1-year-olds from monolingual English homes (an average of 5 vs 4 persons) (Table II15)
DLLs who entered Head Start in Fall 2006 were less likely than children from monolingual English homes to have been born to a teenage mother (9 percent vs 19 percent) (Table II16) Similarly in Early Head Start in Spring 2009 16 percent of 1-yearshyold DLLs vs 25 percent of 1-year-old children from monolingual English homes were born to a teenage mother (Table II17)
DLLsrsquo parents have lower educational attainment and even though DLLs are more likely than children from monolingual English homes to live with a parent who is employed their householdrsquos income is more likely to fall at or below the poverty threshold
12 Baby FACES uses items from the Parental Modernity Scale (Schaefer and Edgerton 1985) to measure parents
attitudes toward children and child-rearing practices (traditional authoritarian parental beliefs and progressive democratic beliefs) Parents responded to items on a 5-point scale ranging from strongly disagree to strongly agree Baby FACES includes 10 of the 30 items in the original scale that yield two subscales (1) Traditional Beliefs and (2) Progressive Beliefs Raw scores range from 5 to 25 for each scale with higher scores indicating more traditional beliefs and more progressive beliefs respectively Traditional authoritarian beliefs are associated with negative outcomes in children whereas progressive democratic beliefs are associated with favorable child outcomes
Report to Congress on DLLs in Head Start Page | 45
DLLs who entered Head Start in Fall 2006 were much less likely than their peers from monolingual English homes to have parents with a high school diploma or GED (47 percent vs 75 percent) (Table II18) In Early Head Start in Spring 2009 62 percent of 1shyyear-old DLLs vs 82 percent of 1-year-old children from monolingual English homes had a parent with a high school diploma or GED (Table II19)
DLLs who entered Head Start in Fall 2006 were more likely than children from monolingual English homes to live with a parent who was working (84 percent vs 71 percent) and less likely to live with a parent who was unemployed and looking for work (5 percent vs 15 percent) (Table II20) In Early Head Start in Spring 2009 10 percent of 1-year-old DLLs vs 16 percent of 1-year-olds from monolingual English homes lived with a parent who was unemployed and looking for work (Table II21)
DLLs who entered Head Start in Fall 2006 were more likely than enrollees from monolingual English homes to live in a household with income at or below the poverty threshold (64 percent vs 55 percent (Table II22) Among 1-year-olds in Early Head Start in Spring 2009 76 percent of DLLs vs 65 percent of children from monolingual English homes lived in a household with income at or below the poverty threshold (Table II23)
Report to Congress on DLLs in Head Start Page | 46
DLLsrsquo parents especially in Head Start are less likely to be receiving public assistance but they are more likely to participate in the WIC program
DLLs who entered Head Start in Fall 2006 were less likely than enrollees from monolingual English homes to be receiving welfare cash assistance (15 percent vs 26 percent) food stamps (31 percent vs 63 percent) and Supplemental Security Income (SSI) (5 percent vs 18 percent) but more likely to be participating in WIC (74 percent vs 53 percent) (Table II24) In Early Head Start in Spring 2009 DLLs were less likely than children from monolingual English homes to be receiving food stamps (52 percent vs 66 percent) and SSI (6 percent vs 14 percent) but more likely to be participating in WIC (92 percent vs 85 percent) (Table II25)
In Early Head Start in Spring 2009 1-year-old DLLs were more likely than 1-year-olds from monolingual English homes to have parents who reported more than one food security difficulty (51 percent vs 26 percent) and reported difficulty affording balanced meals (39 percent vs 19 percent) (Table II27)
DLLs who entered Head Start in Fall 2006 were less likely than enrollees from monolingual English homes to have Medicaid coverage (66 percent vs 75 percent) (Table II29)
Report to Congress on DLLs in Head Start Page | 47
A few other differences also are apparent in the data
According to teacher reports DLLs who entered Head Start in Fall 2006 were less likely than children from monolingual English homes to have been identified by a professional as having a disability (8 percent vs 14 percent)
Report to Congress on DLLs in Head Start Page | 48
DLLs who entered Head Start in Fall 2006 were more likely than children from monolingual English homes to be in a child care arrangement outside Head Start (26 percent vs 12 percent) (Table II31) but in Early Head Start in Spring 2009 1-year-old DLLs were less likely than 1-year-olds from monolingual English homes to be in a child care arrangement outside Early Head Start (58 percent vs 72 percent) (Table II32)
DLLs who entered Head Start in Fall 2006 were less likely than children from monolingual English homes to have parents who reported symptoms that indicated they may have been moderately to severely depressed (12 percent vs 21 percent) (Table II33) In Early Head Start in Spring 2009 1-year-old DLLs were less likely than 1-yearshyolds from monolingual English homes to have parents who reported symptoms that indicated they may have been moderately to severely depressed (13 percent vs 18 percent)
One-year-old DLLs in Early Head Start in Spring 2009 were less likely than 1-year-olds from monolingual English homes to have parents who reported that they spanked their child in the past week (6 percent vs 15 percent) (Table II35)
These differences between the families of DLLs and children from monolingual English homes suggest that they may have different strengths and needs beyond just the language differences that define DLLs Both language differences and the other differences in social and economic characteristics are important to consider when individualizing services for DLLs and their families
Report to Congress on DLLs in Head Start Page | 49
CHAPTER III HEAD START AND EARLY HEAD START SERVICES PROVIDED TO DLLS
In this chapter we address the second research question
What is the nature of the Head StartEarly Head Start services provided to children who are DLLs and their families
In the next section we summarize the data sources and analytic methods used to address this question The following section describes the services provided to DLLs and their families These findings are put into context through comparisons with services provided to children from monolingual English homes in the final section
A METHODOLOGY
The 2006 FACES surveys of Head Start teachers and parents and the 2009 Baby FACES surveys of Early Head Start program directors teachers home visitors and parents provide data on the nature of the programs and services received by families and children enrolled in Head Start and Early Head Start In addition FACES classroom observations in Spring 2007 yield information about various dimensions of quality in Head Start classrooms Observations of home visits collected within Baby FACES also provide information regarding the quality of home visits in Early Head Start Taken together these data sources offer important insights into the nature of services offered and received by DLLs in Head Start and Early Head Start
An important aspect of the child development services provided to DLLs in Early Head Start and Head Start is their quality Both the Baby FACES study and the FACES study devoted considerable resources to observing and measuring key dimensions of the quality of key child development services including
Classroom structure Observations of the group size and child-adult ratio in childrens classrooms were recorded in both the FACES and Baby FACES studies
Quality of the classroom environment As part of the FACES observers used the Early Childhood Environment Rating Scale-Revised (ECERS-R Harms Clifford amp Cryer 2005xiii) to assess quality based on structural features and interactions in the classroom As part of Baby FACES observers used the corresponding tool for classrooms with infants and toddlers the Infant-Toddler Environment Rating Scale (ITERS Harms Cryer and Clifford 2002xiv) The ECERS-R and ITERS rate quality in key domains and overall on a scale of 1 to 7 (1=inadequate 3=minimal 5=good and 7=excellent)
Quality of caregiver-child interactions in the classroom The FACES observers also used the Arnett Caregiver Interaction Scale (Arnett 1989xv) to assess interactions between the lead teacher and the children With this scale the observers rated on a four-point scale (0 = not at all 1 = somewhat 2 = quite a bit 3 = very much) the extent to which each of 30 statements in the scale was characteristic of the lead teacher Higher scores
Report to Congress on DLLs in Head Start Page | 50
indicate a more sensitive responsive teacher who encourages childrens independent and self-help skills and avoids punishment and detachment
Quality of instructional practices in the classroom The FACES observers also used the Instructional Support portion of the Classroom Assessment Scoring System (CLASS) to measure the quality of instructional practices in the classroom including language modeling and encouragement to children to practice expressing themselves verbally quality of feedback on childrens ideas and understanding that helps them take their learning to a higher level and concept development which goes beyond presenting information about a topic to encouraging children to engage in higher-order thinking analyses and reasoning and to apply what is learned in the classroom to their daily lives (Pianta et al 2008xvi) CLASS scores range from 1 to 7 with scores of 1 and 2 indicating low quality scores of 3 to 5 indicating mid-level quality and scores of 6 and 7 indicating high quality
Quality of home visits The Baby FACES study included observations of home visits in which observers used the Home Visit Rating Scales-Adapted (HOVRS-A Roggman et al 2010xvii) to rate the quality of the home visit The HOVRS-A yields a rating of overall quality and ratings of visitor strategies responsiveness to the family relationship with the family facilitation of parent-child interaction and nonintrusiveness Ratings range from 1 to 5 with three anchor points at 1 (inadequate) 3 (adequate) and 5 (good)
Descriptive analyses of each data source were conducted The analyses used analytic weights provided with the survey datasets to take into account the sampling design and data collection nonresponse All estimates pertaining to Head Start children and families obtained using FACES 2006 data are weighted to represent the population of children entering Head Start for the first time in Fall 2006 ormdashfor data from the spring before kindergartenmdashthose entering for the first time in 2006 who are still enrolled after one or two years Estimates using Baby FACES data are weighted to represent the population of 1-year-old children enrolled in Early Head Start in Spring 2009
While the available data concerning the quality of interactions and practices in Head Start and Early Head Start settings is informative it does not identify the languages spoken the amount or the quality of language in these interactions More broadly the existing data for Head Start does not identify program- or classroom-level approaches to language support and instruction for dual language learners These limitations reflect gaps in the research field in the areas of quality assessment and effective practices for young dual language learners (Castro Paez amp Espinosa 2011)
All of the analyses focus on children for whom a language other than English is the primary language spoken to them at home (DLLs) The FACES and Baby FACES data do not include children and families in Migrant and Seasonal Head Start (MSHS) programs or children and families in American IndianAlaska Native (AIAN) programs
Report to Congress on DLLs in Head Start Page | 51
B SERVICES PROVIDED TO DLLS AND THEIR FAMILIES
Head Start and Early Head Start programs provide comprehensive services to enrolled children and families In this section we begin by describing the basic approaches programs take to providing services We then focus on the key features and quality of child development services that children who are DLLs receive in classrooms and home visits This section ends with a description of other important services that the programs offer to DLLs and their families
1 Service Approaches
The majority of DLLs in Early Head Start are in the home-based option Early Head Start programs have flexibility to provide services in the following ways (1) home-based option where child and family development services in weekly home visits (2) center-based option child development services in classrooms and family development services in less-frequent home visits (3) combined approach including both center-based care and home visits at proportions stipulated in the Head Start Program Performance Standards (4) family child care option with at least twice yearly home visits and (5) locally determined option requiring prior approval Slightly more than one-half of DLLs in Early Head Start were enrolled in home-based programs while one-third were enrolled in center-based programs 9 percent were enrolled in a combination program and 2 percent were enrolled in a family child care program (Table III1)
Center-based care for DLLs was most likely full-time in Early Head Start and part-time in Head Start Children enrolled in center-based Early Head Start programs and children enrolled in Head Start may receive full-day or part-day care Two-thirds of DLLs in Head Start were enrolled in a part-day program (according to program directors definitions) (Table III2) In contrast according to program directors three-fourths of DLLs in Early Head Start were enrolled in a full-day program (65 percent in a year-round full-day program and 14 percent in a part-year full-day program) (Table III3) In contrast according to program directors three-fourths of DLLs in center-based Early Head Start were enrolled in a program that operated full-day centers (65 percent in a program operating a year-round full-day center and 14 percent in a program operating a part-year full-day center) (Table III3) Although no data are available DLLs in programs operating only part-day centers may receive additional care in centers operating in partnership with the Early Head Start program if they need full-time care
Nearly all children enrolled in MSHS programs in 2007-2008 were in full-day center-based programs Most of the remaining children were in family child care programs (Table III4)
Report to Congress on DLLs in Head Start Page | 52
2 Classroom Features and Quality
The Baby FACES data show that on average the group size and child-staff ratio in the average Early Head Start classroom of 1-year-old DLLs in Spring 2009 met standards but the quality of the average classroom was rated in the minimal to good range
The FACES data paint a similar picture of quality in the Head Start classrooms of DLLs On average the classrooms of DLLs who entered Head Start in Fall 2006 and were still enrolled in Spring 2007 met standards for group size and child-adult ratio and in their interactions with children the lead teachers demonstrated sensitivity responsiveness and encouragement The average classroom environment however was rated in the minimal to good range and the teachers instructional support was rated low The remainder of this section details these findings
Average child-adult ratios and group sizes in Early Head Start and Head Start are well below recommended levels On average the classrooms of 1-year-old DLLs in Early Head Start classrooms in Spring 2009 included 57 children and 25 adults for a child-adult ratio of 23 to 1 (Table III5 ratio reflects the number of children and adult caregivers in the classroom including staff and volunteers) The average group size and child-adult ratio are well within the maximum group size and ratio recommended by the American Academy of Pediatricians American Public Health Association and the National Resource Center for Health and Safety in Child Care and Early Education and required in the Head Start Program Performance Standards (a group size of 8 children and a child-adult ratio of 4 or fewer infants and toddlers per adult in a classroom) (American Academy of Pediatrics American Public Health Association National Resource Center for Health and Safety in Child Care and Early Education 2011 Administration for Children and Families 1996)
On average DLLs who entered Head Start in Fall 2006 were in classrooms in Spring 2007 that included 152 children and 22 adults (a ratio of 69 children per adult) (Table III6) The average group size and child-adult ratio observed in the Head Start classrooms of DLLs were within the levels recommended by the NAEYC (which recommends a maximum group size of 18 children and ratio of 8 or fewer 3-year-olds for each adult in a classroom and a maximum group size of 20 and ratio of 10 or fewer 4-year-olds per adult in a classroom) and required in the Head Start Program Performance Standards (which require a maximum of 85 or fewer 3-yearshyolds per adult and 10 or fewer 4-year-olds per adult) (NAEYC 2007 Administration for Children and Families 1996)
Global ratings indicate that on average Early Head Start and Head Start classrooms provide minimal to good quality care The average ITERS score for the classrooms of 1-yearshyold DLLs in Early Head Start classrooms in Spring 2009 was 39 in the minimal to good range Average scores on the ITERS subscales ranged from 30 (personal care subscale) to 47 (interactionsocial subscale) (Table III5)
Report to Congress on DLLs in Head Start Page | 53
According to the ECERS-R data the average quality of the Spring 2007 classrooms of DLLs who entered Head Start in Fall 2006 was between minimal and good The average ECERS-R total score was 35 (Table III6) One-fifth of DLLs were in classrooms rated on the high end of the minimal-good range (between 4 and 499) and 3 percent of DLLs were in classrooms that were rated as good (5 or above) Average scores on the ECERS-R subscales ranged from 22 (personal care subscale) to 44 (social subscale) (Table III6) The average ECERS-R total score observed in the FACES study is very similar to the average score for 4-year-old classrooms reported in a study of publicly supported prekindergarten programs in 11 states (385 Mashburn et al 2008xviii)
On average the quality of interactions between children and lead teachers in Head Start is good The Arnett Caregiver Interaction Scale scores show that the average quality of interactions between lead teachers and children in the Spring 2007 classrooms of DLLs who entered Head Start in Fall 2006 was good The average Arnett score for lead teachers in these classrooms was 678 (out of a possible 90 an average of 23 across items) suggesting high levels of teacher sensitivity responsiveness and encouragement of childrens independence and self-help skills (Table III6)
The average quality of instructional support in Head Start is low The CLASS Instructional Support ratings show that on average instructional support in the Spring 2007 classrooms of DLLs who entered Head Start in Fall 2006 was low The average CLASS Instructional Support score was 19 with average subscores ranging from 17 for concept development to 21 for language modeling (Table III6) Approximately 7 percent of DLLs were in classrooms in which the quality of instructional support was moderate (in the 3 to 5 range) The average CLASS instructional support score observed in the FACES study also is very similar to the average score for 4-year-old classrooms reported in a study of publicly supported prekindergarten programs in 11 states (208 Mashburn et al 2008)
Most DLLs in Head Start were in classrooms that provided reading and language activities as well as math activities on a daily or nearly daily basis More than half of DLLs who entered Head Start in Fall 2006 were in classrooms in which teachers reported each of 11 reading and language activities took place daily or almost daily The most widely conducted daily and near-daily reading and language activities in the classrooms of DLLs included listening to teachers read stories while seeing the print (90 percent) working on letter naming (84 percent) learning about conventions of print (75 percent) writing their own name (73 percent) and discussing new words (71 percent) The least common activities reported daily or near-daily included listening to the teacher read stories without seeing print (21 percent) learning about rhyming words and word families (54 percent) and dictating stories to an adult (56 percent) (Table III7)
All ten math activities asked about also were conducted daily or near-daily in the classrooms of the majority of DLLs entering Head Start in Fall 2006 The most widely conducted daily and near-daily activities were counting out loud (96 percent) working with geometric manipulatives (85 percent) engaging in calendar-related activities (83 percent) engaging in
Report to Congress on DLLs in Head Start Page | 54
activities that involve shapes and patterns (83 percent) and working with counting manipulatives (80 percent) The activities least likely to be reported daily or near-daily were working with rulers or other measuring instruments (52 percent) activities related to telling time (55 percent) and using creative movement or drama to understand math concepts (62 percent) (Table III8)
Almost all DLLs in Early Head Start and Head Start were exposed to adults speaking English and the majority of DLLs were exposed to adults speaking Spanish Nearly all (98 percent) of 1-year-old DLLs receiving center-based Early Head Start services in 2009 were exposed to adults speaking English in their classroom and 81 percent were exposed to adults speaking Spanish in their classroom A few (7 percent) were exposed to adults speaking another language (Table III9) Similarly in Head Start 98 percent of DLLs who entered in Fall 2006 were in classrooms in which English was used for instruction while 58 percent were in classrooms in which Spanish was used for instruction (Table III10) The data do not ind icate the extent to which children were spoken to in their home language
The majority of DLLs in Early Head Start and Head Start were in classrooms that used their home language for some instruction For 85 percent of the 1-year-old DLLs in Early Head Start centers their home language was used in the classroom (Table III9) Nearly two-thirds (60 percent) of DLLs entering Head Start in 2006 were in classrooms in which their home language was used at least some of the time for instruction (Table III10) According to parents 85 percent of DLLs in Head Start were in a program in which staff members speaking their childs home language were available in the program (Table III11)
In Early Head Start classrooms of 1-year-old DLLs the majority of DLLs were most often read to in English but 8 percent were most often read to in Spanish (Table III9)
Among classroom staff in Early Head Start classrooms lead teachers were most likely to speak to DLLs in a language other than English (69 percent) followed by assistant teachers (47 percent) classroom aides (30 percent) and volunteers (19 percent) (Table III9) 13
In MSHS programs most of which are center-based 2007-2008 PIR data indicate that 71 percent of non-supervisory staff members including teachers assistant teachers and family child care providers were proficient in a language other than English
3 Characteristics and Quality of Home Visits in Early Head Start
Early Head Start home visits with 1-year-old DLLs in Spring 2009 typically lasted more than an hour (82 minutes on average) and involved an average of one adult the 1-year-old and often a sibling Nearly three-quarters of home visits with DLLs were conducted in Spanish (Table III13)
13 In Early Head Start classrooms classroom staff members have differentiated responsibilities that are recognized by program directors however each child is assigned a primary caregiver The primary caregiver of each focal child in Baby FACES completed a Teacher Interview
Report to Congress on DLLs in Head Start Page | 55
The home visits observed by Baby FACES research staff included many different kinds of activities some that occurred simultaneously The most prevalent activity was play (82 percent of home visits) and at least half of home visits included provision of education andor information (61 percent) child or parent observation or assessment (59 percent) goal setting and planning (52 percent) and modeling or demonstrating interaction with the child (ie facilitating parentchild interaction) (50 percent) On average two-thirds (69 percent) of the home visit time was spent on child-focused activities and parent-child-focused activities An additional 18 percent of home visit time was spent on parent or family-focused activities and 12 percent of the time was spent on staff-family relationship-building activities (Table III13)
On average the observed quality of home visits with 1-year-old DLLs in Early Head Start was rated as slightly above adequate The average HOVRS overall quality score was 36 (Table III14) Average scores on HOVRS subscales indicate that quality of visitor strategies overall was slightly lower (34) with the highest quality observed in the relationship with family (41) In comparison quality in terms of effectiveness of the visit was slightly higher (38) with the highest average rating in home visitors engagement with the focal child during the visit (46)
4 Other Services
In Head Start about half of DLLs with a disability had an IEP Eight percent of DLLs had a teacher-reported disability and 53 percent of these children had an individualized education program (IEP) or individualized family service plan (IFSP) (Table III15)
A wide range of services are offered to families of DLLs in Early Head Start Virtually all 1shyyear-old DLLs in Early Head Start in Spring 2009 were in programs that offered a wide range of family services either directly by referral or through a community partner on- or off-site These services ranged from employment assistance and job training to health and mental health services to other support services although some services were offered more commonly than others Less than 20 percent of programs offered training or support groups for families or mental health services beyond screenings assessments or therapy (Table III16)
Nearly all Early Head Start programs serving families of DLLs offered key services including assistance in obtaining health services information about Head Start information about community resources and assistance in applying for medical insurance Many programs offered assistance in scheduling appointments for prekindergarten screening Two-thirds of programs provided activities and workshops targeting parents of DLLs and slightly more than half offered assessment of English language skills and assessment of basic reading and writing skills (Table III17)
Many families of DLLs in Early Head Start and Head Start do not report receiving family services Although programs offered a wide range of services either directly or by referral a minority of families of 1-year-old DLLs in Early Head Start in Spring 2009 reported receiving these types of services from any source during the past year One-third reported receiving health services and nearly one-fourth attended classes to learn English One-fifth (21 percent)
Report to Congress on DLLs in Head Start Page | 56
received help finding good child care and 13 percent received short-term help getting or paying for things they needed in an emergency (Table III18)
According to parents of DLLs who entered Head Start in Fall 2006 Head Start provided information on health care providers to the parents of three-quarters of DLLs and made referrals to health care providers for parents of 20 percent of DLLs (Table III19) Head Start did not make most parents aware of or help them obtain other services ranging from employment-related services to child care to mental health services to other support services (Table III19) Parents of 12 percent of DLLs reported that Head Start made them aware of or helped them obtain one or more of these types of services
In both Early Head Start and Head Start approximately one-fifth of mothers of DLLs and nearly 10 percent of fathers of DLLs were currently participating in education or training activities Most parents of 1-year-old DLLs enrolled in Early Head Start in Spring 2009 who were enrolled in a course program class or workshop reported that Early Head Start helped them take or locate it (Table III18) Among the parents of DLLs who entered Head Start in Fall 2006 however less than one-third of the mothers and one-tenth of the fathers who were enrolled in a program course class or workshop reported that Head Start helped them take or locate it (Table III20)
Although many families of DLLs do not report receiving any of the survey-specified family services from the programs program data suggest that most families in these programs do receive at least one service The 2007-2008 PIR data indicate that most families in Early Head Start (84 percent) Head Start (73 percent) and MSHS programs (58 percent) received at least one family service The most frequently received services in MSHS programs were parenting education (42 percent) and health education (39 percent) Among other types of services received transportation assistance (16 percent) ESL training (15 percent) and emergencycrisis intervention (12 percent) were the most prevalent services received by families in MSHS programs (Table III21) A mental health professional consulted with program staff about the childs behavior or mental health for 6 percent of children and facilitated a referral for mental health services for 1 percent of children (Table III22)
All Early Head Start programs serving DLLs held events for the entire family Nearly all (97 percent) programs reported offering materials or workshops on child sleep practices to families of 1-year-old DLLs in Spring 2009 Eleven percent offered literacy activities and small percentages offered other types of family activities and events (Table III23) Two thirds of DLLS were in Early Head Start programs that reported offering activities or events specifically for fathers while 39 percent attended programs that offered employment or job training services specifically designed for fathers (Table III23)
Family involvement in Early Head Start activities varies widely Early Head Start programs offer a variety of activities and events in which individual family members and entire families can participate Nearly 80 percent of parents of 1-year-old DLLs in Early Head Start in Spring 2009 reported that they attended group activities for parents and their children during the past year Nearly two-thirds of parents reported that they attended an Early Head Start social event
Report to Congress on DLLs in Head Start Page | 57
and 57 percent attended parent education meetings or workshops related to children Nearly half reported volunteering in an Early Head Start classroom Smaller percentages were involved in other types of activities Notably in 18 percent of families of DLLs the father or father-figure attended events just for menfathers (Table III24)
5 Parent Satisfaction
Parents of DLLs in Head Start reported high levels of satisfaction with Head Start More than three quarters of parents of DLLs who entered Head Start in Fall 2006 and were still enrolled in Spring 2007 were very satisfied with most aspects of their experiences and their childrens experiences in Head Start Parents were especially likely to be very satisfied with Head Start in helping their child to grow and develop (88 percent) and preparing their child to go to kindergarten (86 percent) (Table III25) Fewer parents were very satisfied with Head Start in identifying and providing services for the family (60 percent) and in helping parents become more involved in the community (63 percent)
In Spring 2007 the parents of more than three-quarters of DLLs who entered Head Start in Fall 2006 reported that they and their child always had a variety of positive experiences in Head Start They were most likely to report that they always felt welcomed by their childs teacher (92 percent) and that their child was always treated with respect by teachers (90 percent) Fewer parents (61 percent) said that their child always got lots of individual attention (Table III25)
C DIFFERENCES AND SIMILARITIES IN THE SERVICES PROVIDED TO DLLS AND CHILDREN FROM MONOLINGUAL ENGLISH HOMES
As shown in Question 1 DLLs in Head Start and Early Head Start differ from children from monolingual English homes beyond the differences in language raceethnicity and immigrant background that define them They are more likely to be from families with two parents and to have at least one parent who is employed yet they are also more likely to be living in poverty These differences are likely to lead to different service needs and use and indeed the available data indicate some clear differences as the following summary shows However the data show that DLLs and their counterparts from monolingual English homes experienced similar quality of care in home visits and Early Head Start centers These differences and similarities are described below
DLLs were less likely than children from monolingual English homes to be enrolled in programs that offered full-day center-based early education and care
DLLs in Early Head Start were less likely to be receiving center-based services (32 percent vs 49 percent of monolingual English children) and more likely to be receiving home-based services or combination services (9 percent vs 1 percent) (Table III1)
Report to Congress on DLLs in Head Start Page | 58
DLLs in center-based Early Head Start programs and in Head Start were less likely than children from monolingual English homes to be enrolled in a program with a center that operated more than 10 hours per day (40 percent vs 55 percent in Early Head Start which most likely reflects programs offering combination services) and less likely to be in a full-day program (79 percent vs 98 percent in Early Head Start and 32 percent vs 57 percent in Head Start) (Tables III3 and III2)
Based on observations conducted by research staff the quality of classrooms in which DLLs were enrolled was very similar to the quality of classrooms in which children from monolingual English homes were enrolled
All observational measures of classroom quality were very similar for the classrooms of DLLs and classrooms of children from monolingual English homes both in Early Head Start and Head Start (Tables III5 and III6)
The extent to which Head Start teachers reported reading and language activities and math activities was very similar for DLLs and children from monolingual English homes However DLLs were less likely to be in classrooms in which daily activities included discussing new words (71 percent vs 82 percent) (Table III7) and precisely which language new words were in is not known
Among Early Head Start children in home-based programs the key features of the home visits observed with DLLs and children from monolingual English homes were similar however there were some differences in activities
Activities during home visits with DLLs were less likely to include provision of education or information (61 percent vs 75 percent) evaluationfeedback on parent-child interactions (35 percent vs 49 percent) or childparent observationassessment (59 percent vs 68 percent) (Table III13)
Most families of DLLs and children from monolingual English homes in Head Start did not report receiving services ranging from employment assistance and job training to health and mental health services to other support services
The available data show that most parents of both DLLs and children from monolingual English homes who entered Head Start in Fall 2006 (88 percent of both groups) reported that Head Start did not make them aware of or help them obtain any of a wide range of services (Table III19)
In Early Head Start DLLs were more likely than children from monolingual English homes to be in programs offering English language and literacy-related services their parents were more likely to have received several literacy and language-related services and health services and their parents reported higher involvement in many program activities
Report to Congress on DLLs in Head Start Page | 59
DLLs were more likely than children from monolingual English homes to be in programs that offered specific services for DLLs including activities and workshops for parents (64 percent vs 49 percent) information about adult ESL or education (98 percent vs 91 percent) information about community resources (996 percent vs 93 percent) and assistance in obtaining health services (100 percent vs 94 percent) (Table III17)
Parents of DLLs were less likely than parents of children from monolingual English homes to be currently enrolled in a program course class or workshop (mothers 22 percent vs 31 percent fathers 95 percent vs 139 percent) However DLLs parents were more likely to report that Early Head Start helped them to take or locate programs courses classes or workshops (mothers 19 percent vs 12 percent fathers 9 percent vs 3 percent) (Table III18)
Despite being more likely to report that Early Head Start helped them find such programs fathers of DLLs were less likely than fathers of children from monolingual English homes to be enrolled in a program offering events (67 percent vs 76 percent) or employmentjob training services specific to fathers (385 percent vs 466 percent) (Table III23)
Parents of DLLs were more likely than parents of children from monolingual English homes to report receiving classes to learn English (23 percent vs 1 percent) and health services (33 percent vs 15 percent) in the past year (Table III18)
DLLs were more likely than children from monolingual English homes to be enrolled in programs that offered family literacy activities (11 percent vs 5 percent) but less likely to be in programs that offered transition activities (1 percent vs 8 percent) (Table III23)
Parents of DLLs were more likely than parents of children from monolingual English homes to report that they attended group activities for parents and children (80 percent vs 68 percent) workshops on job skills (31 percent vs 14 percent) parent education meetings or workshops on raising children (57 percent vs 37 percent) or events just for fathers (18 percent vs 12 percent) They also were more likely to report that they volunteered in an Early Head Start classroom (47 percent vs 37 percent) (Table III24)
The Early Head Start programs attended by DLLs were less likely to have formal connections with Part C agencies
DLLs in Early Head Start were less likely than their counterparts from English-speaking homes to be in a program with a formal written partnership with a Part C agency14 (72 percent vs 96 percent) (Table III26)
14 Part C of the Individuals with Disabilities Education Act (IDEA) provides early intervention (EI) services to children aged birth to three with developmental delays or a medical condition likely to lead to a developmental delay Some states also serve infants and toddlers who are at heightened risk for developmental delay due to
Report to Congress on DLLs in Head Start Page | 60
Report to Congress on DLLs in Head Start Page | 61
biologicalmedical factors or their environmentalcaregiving circumstances (NECTAC httpwwwnectacorg~pdfspubseifactsheet_2pgpdf) A formal written partnership with the agency providing Part C early intervention services is likely to facilitate the identification of children with disabilities and referrals to early intervention services
CHAPTER IV QUALIFICATIONS AND TRAINING OF STAFF WHO SERVE DLLS
In this chapter we address the third research question
What are the qualifications and training of Head Start and Early Head Start teachersstaff that serve children who are DLLs and their families
In the next section we summarize the data sources and analytic methods used to address this question The following section investigates the qualifications and training of staff serving DLLs and their families These findings are put into context in the final section of this chapter through comparisons with the qualifications and training of staff serving children from monolingual English homes
A METHODOLOGY
The 2006 FACES surveys of Head Start program directors education coordinators center directors and teachers and the 2009 Baby FACES surveys of Early Head Start program directors teachers and home visitors provide data on the characteristics and education training and work experiences of staff in Head Start and Early Head Start These data sources offer important insights into the characteristics preparation and tenure of staff
Descriptive analyses of each data source were conducted The analyses used analytic weights provided with the survey datasets to take into account the sampling design and data collection non-response All estimates pertaining to Head Start children and families obtained using FACES 2006 data are weighted to represent the population of children entering Head Start for the first time in Fall 2006 or ndash for data from the spring before kindergarten ndash those entering for the first time in 2006 who are still enrolled after one or two years Estimates using Baby FACES data are weighted to represent the population of 1-year-old children enrolled in Early Head Start in Spring 2009
The FACES and Baby FACES data do not include children and families in Migrant and Seasonal Head Start (MSHS) programs or children and families in American IndianAlaska Native (AIAN) programs
All of the analyses focus on children for whom a language other than English is the primary language spoken to them at home (DLLs)
B CHARACTERISTICS AND QUALIFICATIONS OF STAFF SERVING DLLS
The teachers and home visitors caring for DLLs and their managers provide the care that shapes the experiences of DLLs in Early Head Start and Head Start In the following sections we examine the characteristics and employment experiences of the teachers home visitors and managers caring for DLLs in Early Head Start and Head Start
1 Teachers Caring for DLLs in Early Head Start Head Start and MSHS
Report to Congress on DLLs in Head Start Page | 62
Teachers are virtually all female All of the teachers serving 1-year-old DLLs in Early Head Start in Spring 2009 were female (Table IV1) Almost all of the lead teachers in classrooms of DLLs who entered Head Start in Fall 2006 were female (Table IV3)
Like enrolled children more than half of teachers are Hispanic As noted in Chapter II 91 percent of DLLs in Early Head Start and 84 percent of DLLs in Head Start come from homes in which the primary language spoken is Spanish A substantial proportion of DLLs in Early Head Start and Head Start are cared for by teachers who are also Hispanic Half of 1-year-old DLLs in Early Head Start classrooms in Spring 2009 had teachers who were Hispanic (Table IV1) Similarly nearly half of DLLs who entered Head Start in Fall 2006 had lead teachers who were Hispanic (Table IV3)
Depression may afflict some teachers Most teachers caring for DLLs in Early Head Start and Head Start did not report elevated symptoms of depression which would indicate a high probability that they were depressed however for a small proportion of teachers and home visitors moderate or severe depression may be a problem In Early Head Start teachers caring for 16 percent of 1-year-old DLLs reported symptoms of moderate or severe depression (Table IV1) In Head Start teachers of 12 percent of teachers of DLLs reported symptoms of moderate or severe depression (Table IV3)
The majority of DLLs in Early Head Start and Head Start centers have teachers who have a college degree although there is variability In Early Head Start 55 percent of DLLs in center-based care had a teacher with an associates or bachelors degree (Table IV4) Only 15 percent were cared for by a teacher with only a high school diploma or less Most DLLs (87 percent) who entered Head Start in Fall 2006 were cared for by a lead teacher who had an associates or bachelors degree (Table IV6) Only 5 percent of teachers serving DLL children had only a high school diploma or GED In MSHS programs in 2007-2008 54 percent of teachers had an associates or bachelors degree
One-fourth to one-half of teachers of DLLs had a degree in early childhood education The educational attainment of teachers may have a greater impact on their work if it includes a focus on child development and early education Nearly half (45 percent) of 1-year-old DLLs in Early Head Start center-based care in 2009 were cared for by teachers whose field of study included early childhood education (Table IV4) Among DLLs entering Head Start in Fall 2006 whose teacher had an associates or bachelors degree 28 percent had a teacher with a degree in early childhood education (24 percent overall) (Table IV6)
Many teachers have a Child Development Associate (CDA) credential15 The teachers of two-thirds of 1-year-old DLLs in Early Head Start in Spring 2009 and 60 percent of lead teachers
15 Earning a CDA credential requires 120 hours of formal early childhood education training in 8 content areas and 480 hours of professional experience in a group setting with infants and toddlers or 3-5 year old children or 480 hours working with families in home visits in addition to a minimum of 3 hours of direct observation by a CDA
Report to Congress on DLLs in Head Start Page | 63
Report to Congress on DLLs in Head Start Page | 64
of DLLs who entered Head Start in Fall 2006 had earned a CDA (Tables IV4 and IV6) More than half (57 percent) of teachers in MSHS programs in 2007-2008 had a CDA credential
Some teachers have a state-awarded preschool certificate One-third of 1-year-old DLLs in Early Head Start centers in 2009 had a teacher with a state-awarded preschool certificate or license (Table IV4) Nearly half (47 percent) of DLLs who entered Head Start in Fall 2006 had a lead teacher with a state-awarded certificate (Table IV6)
Many DLLs in Head Start are in programs in which lead teachers have a teaching certificate or license More than half of the lead teachers (59 percent) of DLLs who entered Head Start in Fall 2006 had a teaching certificate (Table IV6)
Current participation in training is common among teachers in Early Head Start and Head Start At the time of the FACES and Baby FACES surveys one-third to one-half of the teachers of DLLs was enrolled in training (ie educational course apart from any training provided by their program) About half (52 percent) of 1-year-old DLLs in Early Head Start centers had a teacher currently enrolled in child care-related training (Table IV4) Similarly 42 percent of DLLs who entered Head Start in Fall 2006 had a teacher who was currently enrolled in teacher-related training (Table IV6)
Many teachers have more than 5 years of experience in Early Head Start and Head Start DLLs in Early Head Start had teachers with less experience than DLLs in Head Start possibly reflecting the younger age of the Early Head Start program On average teachers serving 1shyyear-old Early Head Start DLLs in center-based programs in 2009 had worked in Early Head Start for 5 years (Table IV4) Nearly half (48 percent) of DLLs in Early Head Start had teachers who had worked in Early Head Start 5 or more years On average DLLs entering Head Start in Fall 2006 had lead teachers who had worked in Head Start for 9 years with 8 years in their current program (Table IV6) Three-quarters (74 percent) of DLLs entering Head Start had lead teachers who had worked in Head Start 5 or more years
Teachers and home visitors in Early Head Start had more than 5 years of experience caring for infants and toddlers On average 1-year-old DLLs in Early Head Start centers in 2009 had teachers (58 percent) and home visitors (69 percent) who had been teaching or caring for infants and toddlers for several years (Tables IV4 and IV5)
Teachers in Head Start have more than a decade of teaching experience DLLs entering Head Start in Fall 2006 had lead teachers who had been teaching for 13 years on average (Table IV6)
The average annual salaries of lead teachers in Head Start and MSHS are modest The average annual salary received by the lead teachers of DLLs entering Head Start in Fall 2006 was
Advisor submission of a Professional Resource File and submission of questionnaires completed by parents of children in the care of the CDA candidate (see httpwwwcdacouncilorgthe-cda-credential)
$26580 (Table IV6) The 2007-2008 PIR data indicate that the average teacher in MSHS programs earned $18304 annually
Average turnover of Early Head Start and MSHS teachers is moderate Teacher turnover during the past 12 months in programs of 1-year-old DLLs in center-based Early Head Start care in 2009 was 14 percent (Table IV12) About one-fifth of Early Head Start programs offering center-based care experienced a teacher turnover rate greater than 25 percent Similarly the average teacher turnover rate in MSHS programs in 2007-2008 was 15 percent
2 Home Visitors Caring for DLLs in Early Head Start
Home visitors are virtually all female All of the home visitors serving 1-year-old DLLs in Early Head Start in Spring 2009 were female (Table IV2)
Like enrolled children more than half of home visitors are Hispanic A substantial proportion DLLs in Early Head Start are served by home visitors from a similar background Three-quarters of 1-year-old DLLs in Early Head Start who were receiving home visits had home visitors who were Hispanic (Table IV2)
Depression may afflict some home visitors Most home visitors serving DLLs in Early Head Start did not report elevated symptoms of depression indicating a high probability that they were depressed However for a small proportion moderate or severe depression may be a problem Home visitors caring for 4 percent of 1-year-old DLLs in Early Head Start reported symptoms of moderate or severe depression (Table IV2)
Nearly all DLLs receiving home-based Early Head Start services have home visitors with education beyond high school Nearly two-thirds (62 percent) of DLLs in Early Head Start who were receiving home-based services had a home visitor with an associates or bachelors degree (Table IV5) Only 4 percent of DLLs in home-based Early Head Start had a home visitor with a high school diploma GED or less
Two-thirds of home visitors of DLLs had a degree in early childhood education The educational attainment of teachers and home visitors may have a greater impact on their work if it includes a focus on child development and early education Nearly two-thirds (64 percent) of all 1-year-old DLLs in home-based Early Head Start services were cared for by home visitors whose field of study included early childhood education (Table IV5)
Many home visitors have a Child Development Associate (CDA) credential Nearly half of DLLs receiving home-based Early Head Start services in Spring 2009 had a home visitor with a CDA credential (45 percent) (Table IV5)
Report to Congress on DLLs in Head Start Page | 65
Some home visitors have a state-awarded certificate Nearly half (45 percent) of 1-yearshyold DLLs receiving home-based Early Head Start services in Spring 2009 had a home visitor with a state-awarded certificate (Table IV5)
Many Early Head Start home visitors participate in training About one-third (36 percent) of the 1-year-old DLLs receiving Early Head Start home-based services in Spring 2009 had a home visitor who was currently enrolled in child care related training (ie courseclass apart from any provided by their program) (Table IV5)
Many home visitors have more than 5 years of experience in Early Head Start On average 1-year-old Early Head Start DLLs in home-based services in 2009 had home visitors who had worked in Early Head Start for 4 years and more than a third (43 percent) of DLLs in Early Head Start had home visitors who had worked in Early Head Start 5 or more years (Table IV5)
Home visitors in Early Head Start have more than five years of experience on average caring for infants and toddlers On average 1-year-old DLLs in home-based Early Head Start services had home visitors who had been teaching or caring for infants and toddlers for 7 years (Table IV5)
Average turnover of Early Head Start home visitors is moderate Home visitor turnover during the past 12 months in programs of 1-year-old Early Head Start DLLs in home-based care in 2009 was 15 percent (Table IV12) About one-fifth of programs offering home-based services experienced a home visitor turnover rate higher than 25 percent
3 Managers Overseeing Teachers and Home Visitors Caring for DLLs in Early Head Start and Head Start
Although supervisors coordinators and directors do not normally care for children in Early Head Start and Head Start directly they can have an impact on the care children receive through their monitoring of teachers and home visitors and the policies and practices they set and model for frontline staff
Managers in programs serving DLLs have high levels of education Three-quarters of DLLs were enrolled in programs in which mid-level managers (program managersupervisor in Early Head Start and center director in Head Start) had a bachelors degree or higher (75 percent in Early Head Start and 72 percent in Head Start) and notable proportions of DLLs were enrolled in programs with mid-level managers who had a graduate or professional degree (27 percent in Early Head Start and 43 percent in Head Start) (Tables IV7 and IV8) Two-thirds (63 percent) of DLLs who entered Head Start in Fall 2006 were in programs in which the education coordinator had a graduate degree and nearly all were in a program in which the education coordinator had a bachelors degree or higher (97 percent) (Table IV9) Most DLLs in Early Head Start and Head Start were in programs led by a director with a bachelors degree or higher and two-
Report to Congress on DLLs in Head Start Page | 66
thirds to three-quarters were in programs in which the director had a graduate or professional degree (Tables IV10 and IV11)
Many managers in Head Start (but not in Early Head Start) have a CDA credential Nearly none of the DLLs in Early Head Start were in programs in which the mid-level staff and director had only a CDA credential In contrast nearly half of DLLs entering Head Start in Fall 2006 were in programs in which mid-level managers and directors had a CDA credential Only 3 percent of 1-year-old DLLs in Early Head Start in 2009 were in programs in which the program managersupervisor had a CDA and less than 1 percent was in a program in which the director had a CDA (Tables IV7 and IV10) More than one-third (43 percent) of DLLs who entered Head Start in Fall 2006 were in a program in which the education coordinator had a CDA and about half were in a program in which the center-director had a CDA (Tables IV8 and IV9)
Many directors and managers in Head Start (but not in Early Head Start) also have a state-awarded preschool certificate Less than 5 percent of 1-year-old DLLs in Early Head Start in 2009 were in programs in which program managerssupervisors or directors had a state-awarded preschool certificate or license (Tables IV7 and IV10) In contrast one-third of DLLs who entered Head Start in Fall 2006 were in programs in which the center director had a state-awarded preschool certificate and nearly half (47 percent) were in programs in which the education coordinator had a state-awarded certificate (Tables IV8 and IV9)
Many DLLs in Head Start are in programs in which center directors and education coordinators have a teaching certificate or license More than half of DLLs who entered Head Start in Fall 2006 were in centers with directors (53 percent) who had a teaching certificate (Table IV8) Nearly two thirds (63 percent) of DLLs in Head Start were in programs in which the education coordinator had a teaching certificate (Table IV9)
Head Start managers have more than a decade of experience working in Head Start DLLs in Head Start were in programs with mid-level managers and directors who had slightly more experience than lead teachers working in Head Start (11 to 15 years compared with 9 years) Most of this Head Start experience was in the current program On average DLLs who entered Head Start in Fall 2006 were in centers with directors who had worked in Head Start for 11 years 9 of those in their current program (Table IV8) On average they were in programs with education coordinators who had worked in Head Start for 14 years all in their current program (Table IV9) And on average they were in programs with directors who had worked in Head Start for 18 years 15 of those in their current program (Table IV11)
Average salaries increase with responsibility In Head Start center directors receive an average annual salary that is almost twice as large as that received by lead teachers and program directors receive an average annual salary that is almost three times as large as that received by lead teachers In the programs of DLLs who entered Head Start in Fall 2006 the average annual salaries received by the center directors education coordinators and program directors were $46353 $56071 and $81812 respectively (Tables IV8 IV9 and IV11)
Report to Congress on DLLs in Head Start Page | 67
Turnover in managers is common in Early Head Start programs serving DLLs More than half (56 percent) of 1-year-old DLLs in Early Head Start in 2009 were in a program that lost a director coordinator or manager in the past year (Table IV12) Those children who experienced this turnover experienced the loss of 16 such staff Among the children who experienced program management turnover nearly half were in programs where managers left due to personal reasons (46 percent) while approximately one-quarter were in programs where managers left for higher compensation or benefits (29 percent) or to change careers (26 percent) Ten percent of DLLs who experience program management turnover were in programs in which managers left on maternity leave and 10 percent were in programs where managers left for other reasons (Table IV12)
C DIFFERENCES BETWEEN STAFF CARING FOR DLLS AND MONOLINGUAL ENGLISH CHILDREN
As shown in Chapter II DLLs in Head Start and Early Head Start differ from children from monolingual English homes beyond the differences in language raceethnicity and immigrant background that define them DLLs are more likely to live in the West and South and programs there may face different labor markets and select staff with different demographic educational and work backgrounds The data from Baby FACES and FACES show there are differences in the staff who serve DLLs and the staff who serve children from monolingual English homes as highlighted below
Differences in raceethnicity of frontline staff reflect differences in DLLs and monolingual English children Efforts to match DLLs with teachers and home visitors from the same ethnic and linguistic background may be leading to differences in the backgrounds of Early Head Start and Head Start staff caring for DLLs and children from monolingual English homes
Compared with their peers from monolingual English homes 1-year-old DLLs in Early Head Start in 2009 were more likely to have a Hispanic teacher (50 percent vs 9 percent) or home visitor (73 percent vs 4 percent) and less likely to have a White teacher (26 percent vs 60 percent) or home visitor (17 percent vs 82 percent) or an African-American teacher (14 percent vs 24 percent) or home visitor (3 percent vs 9 percent) (Tables IV1 and IV2)
Similarly compared with their peers from monolingual English homes DLLs who entered Head Start in Fall 2006 were more likely to have lead teachers who were Hispanic (47 percent vs 6 percent) and less likely to be White (29 percent vs 47 percent) or African American (15 percent vs 45 percent) (Table IV3)
Data show systematic differences in exposure to teachers and home visitors with symptoms of depression While most teachers and home visitors of DLLs and children from monolingual English homes in Early Head Start and Head Start did not report symptoms indicating they were depressed differences were apparent in the percentages of children with teachers or home visitors reporting symptoms of moderate or severe depression
Report to Congress on DLLs in Head Start Page | 68
16 percent of 1-year-old DLLs in Early Head Start were cared for by a teacher who reported moderate or severe symptoms of depression compared with 4 percent of teachers of children from monolingual English homes (Table IV1)
In contrast 4 percent of DLLs compared with 12 percent of children from monolingual English homes who were in Early Head Start home-based services had a home visitor who reported symptoms indicating moderate or severe depression (Table IV2)
Among children who entered Head Start in Fall 2006 DLLs were just as likely as children from monolingual English homes to have a lead teacher who reported symptoms indicating moderate or severe depression (12 to 14 percent Table IV3)
Some teachers and home visitors serving DLLs followed a different education path In Early Head Start teachers of DLLs were less likely to have education beyond high school than teachers of children from monolingual English homes resulting in fewer teachers who had earned an associates degree or higher The teachers of DLLs however were more likely than teachers of children from monolingual English homes to have a CDA credential
DLLs in Early Head Start centers were more likely than their peers from monolingual English homes to have a teacher with no education beyond high school (16 percent vs 8 percent) and less likely to have a teacher with an associates degree (25 percent vs 37 percent) (Table IV4)
DLLs in Early Head Start centers were more likely than their peers from monolingual English homes to have a teacher with a CDA credential (68 percent vs 49 percent) (Table IV4)
A similar pattern of differences is evident for Early Head Start home visitors DLLs in home-based Early Head Start services were less likely than children from monolingual English homes to have a home visitor who had completed college but more likely to have a home visitor who had either received some college education or a state-awarded preschool certificate
DLLs in home-based Early Head Start programs had home visitors who were less likely than home visitors for children from monolingual English homes to have received any college degree (714 percent vs 814 percent for AA BA or graduateprofessional degree) (Table IV5)
DLLs in home-based Early Head Start programs had home visitors who were more likely than home visitors caring for children from monolingual English homes to have received some college education (25 percent vs 16 percent) (Table IV5)
Report to Congress on DLLs in Head Start Page | 69
1-year-old DLLs receiving home-based Early Head Start services in Spring 2009 were more likely than their peers from monolingual English homes to have a home visitor with a state-awarded preschool certificate (45 percent vs 32 percent) (Table IV5)
FACES data show a similar pattern DLLs in Head Start also were less likely than their peers from monolingual English homes to have a lead teacher who had completed college but more likely to have a lead teacher who had a state-awarded preschool certificate or a teaching certificate or license
The lead teachers of DLLs in Head Start were more likely than the lead teachers of children from monolingual English homes to have an associates degree (50 percent vs 36 percent) (Table IV6)
DLLs who entered Head Start in Fall 2006 were twice as likely as their peers from monolingual English homes to have a lead teacher with a state-awarded preschool certificate (47 percent vs 23 percent) or a teaching certificate or license (59 percent vs 36 percent) (Table IV6)
Levels of current participation in training are similar Both Baby FACES and FACES data show that current levels of participation in training are similar among the staff serving DLLs and those serving children from monolingual English homes
DLLs in Early Head Start centers and DLLs receiving home-based Early Head Start services were just as likely as their peers from monolingual English homes to have teachers or home visitors who were currently enrolled in training (Tables IV4 IV5 and IV6)
In Early Head Start DLLs have teachers and home visitors with less experience caring for infants and toddlers In Head Start DLLs and children from monolingual English homes have teachers with similar years of work experience but in Early Head Start DLLs have teachers and home visitors who have fewer years of experience than the teachers and home visitors of children from monolingual English homes
DLLs and children from monolingual English homes who entered Head Start in Fall 2006 had lead teachers with similar years of experience teaching in Head Start teaching in the current program and years of teaching (Table IV6)
The teachers of DLLs in Early Head Start in Spring 2009 had cared for infant or toddlers for an average of 6 years compared to 8 years for teachers of children from monolingual English homes (Table IV4)
Report to Congress on DLLs in Head Start Page | 70
DLLs receiving home-based Early Head Start services had home visitors who had less experience caring for infants and toddlers on average than home visitors of children from monolingual English homes (7 vs 10 years Table IV5)
In Early Head Start managers of programs serving DLLs are more likely to leave Annual rates of turnover in teachers and home visitors are similar in the programs attended by DLLs and the programs attended by children from monolingual English homes The programs attended by DLLs however are more likely to experience turnover in management positions
Rates of turnover of frontline staff (teachers and home visitors) in the Early Head Start programs attended by 1-year-old DLLs were similar to the rates of turnover in the programs attended by their peers from monolingual English homes (Table IV12)
The percentage of children in programs in which a director coordinator or manager left in the past 12 months was higher among DLLs than their peers from monolingual English homes (56 percent vs 46 percent) (Table IV12)
Data from FACES show that lead teachers and managers in programs attended by DLLs earn higher annual salaries This could reflect differences in the geographic distribution of DLLs and children from monolingual English homes and associated differences in cost of living
The lead teachers of DLLs who entered Head Start in Fall 2006 reported annual salaries that were larger than the salaries of lead teachers of children from monolingual English homes ($26580 vs $22473) (Table IV6)
The center directors of DLLs who entered Head Start in Fall 2006 reported annual salaries that were larger than the salaries of center directors of children from monolingual English homes ($46353 vs 39341 Table IV8)
DLLs who entered Head Start in Fall 2006 were in programs with education coordinators who earned considerably more per year than education coordinators in the programs attended by children from monolingual English homes ($56071 vs $41178 Table IV9)
DLLs who entered Head Start in Fall 2006 were in programs with directors who earned considerably more per year than directors in the programs attended by children from monolingual English homes ($81812 vs $60767) (Table IV11)
These differences show that compared with children from monolingual English homes DLLs in Early Head Start were served by teachers and home visitors who had less education and experience but were more likely to have earned a CDA Their teachers were more likely to be Hispanic than their colleagues serving children from monolingual English homes like the DLLs for whom they cared
Report to Congress on DLLs in Head Start Page | 71
In Head Start DLLs were served by lead teachers who had less education and earned higher annual salaries than the lead teachers of children from monolingual English homes but the lead teachers of DLLs were more likely to have earned a state-awarded certificate or teaching certificate or license In Head Start as in Early Head Start the lead teachers of DLLs in Head Start were more likely than those teaching children from monolingual English homes to be Hispanic
Report to Congress on DLLs in Head Start Page | 72
CHAPTER V LANGUAGES USED BY STAFF WHO SERVE DLLS
In this chapter we address the fourth research question
What are the languages in which Head Start and Early Head Start teachersstaff are fluent in relation to the children and families they serve
In the next section we summarize the data sources and analytic methods used to address this question The following section investigates the languages used by staff serving DLLs and their families While some information is available the data addressing this question are particularly limited as there are no formal assessments of staff language proficiency in use Unlike previous chapters these findings will not be compared to experiences of children from monolingual English homes as the fluency of staff in LOTEs does not have the same relevance for these children
A METHODOLOGY
To answer this question we compiled data from multiple sources These include the 2009 Baby FACES surveys of Early Head Start teachers and home visitors and the 2006 FACES surveys of Head Start teachers and parents
Descriptive analyses of each data source were conducted The analyses used analytic weights provided with the survey datasets to take into account the sampling design and data collection non-response All estimates pertaining to Head Start children obtained using FACES 2006 data are weighted to represent the population of children entering Head Start for the first time in Fall 2006 Estimates using Baby FACES data are weighted to represent the population of 1-year-old children enrolled in Early Head Start in Spring 2009
The FACES and Baby FACES data do not include children and families in MSHS programs or children and families in American IndianAlaska Native (AIAN) programs
All of the analyses focus on children for whom a language other than English is the primary language spoken to them at home (DLLs)
B LANGUAGES USED BY STAFF SERVING DLLS
The available data provide information that indirectly informs the question posed by Congress shining light on the languages used in providing services to children who are DLLs and their families However there are no data that speak directly to the question of the fluency of Head Start staff in particular languages Further data on the languages used in various settings are not detailed enough to examine with what frequency and for what purposes different languages are used
Multiple languages are often spoken in classrooms and home visits Among 1-year-old DLLs in Early Head Start home-based services adults speak English during 70 percent of home visits and Spanish during 77 percent of home visits reflecting that teachers and home visitors
Report to Congress on DLLs in Head Start Page | 73
use both languages within many visits Other languages are spoken by adults during 4 percent of visits (Table III9)
Childrenrsquos home language is used in most home visits and classrooms In Early Head Start the childs home language was used during 89 percent of home visits with 1-year-old DLLs in Spring 2009 (Table III9) The childs home language was used in the Early Head Start classrooms of 85 percent of 1-year-old DLLs (Table III9) In Head Start classrooms the childs home language was used for at least some instruction in the classrooms of 60 percent of DLLs (Table III10)
In Early Head Start classrooms in Spring 2009 1-year-old DLLs were most likely to have a lead teacher who spoke a language other than English in the classroom (69 percent) and nearly half (47 percent) had an assistant teacher who spoke another language 30 percent had a classroom aide who spoke another language and 19 percent had a volunteer or other non-staff person who spoke another language in the classroom (Table III9)
In Head Start even if the childs home language is not used for instruction in the classroom most DLLs are in programs where there is someone in their program available to speak to them in their home language FACES data show that 85 percent of DLLs who entered Head Start in Fall 2006 were in programs in which staff members speaking the childs home language were available as reported by parents (Table III11)
English is the language most often used to read to children in the classroom In Early Head Start centers most (92 percent) of 1-year-old DLLs were in classrooms in which the language most often used to read to children was English (Table III9)
Teachers and home visitors use a variety of strategies to communicate with the families of DLLs when they do not speak the same language When they did not share a common language half (52 percent) of the families of 1-year-old DLLs in Early Head Start in 2009 had teachers or home visitors who spoke to them only in English Two-thirds (67 percent) had teachers or home visitors who used an informal interpreter Three-fourths of DLLs had teachers or home visitors who used physical cues or hand gestures to communicate with their families (Table III9)
The available data provide a window into the language match between teachers home visitors and other adults in Head Start and Early Head Start programs and the children and families served Most DLLs in Early Head Start as in Head Start are hearing their home languages spoken by adults in their classrooms In Head Start LOTEs are used by teaching staff for some portion of classroom instruction for a majority of DLLs The vast majority of DLLs in Early Head Start are in classrooms in which the language most often used in reading to children is English however Spanish is most often used for reading in the classrooms of a small proportion of DLLs However the picture is incomplete Unfortunately these data are not detailed enough to portray the frequency quality or purposes for which different languages are used in classrooms These aspects of language use are critical to consider but here again
Report to Congress on DLLs in Head Start Page | 74
the state of research methodology to assess these and many other dimensions of the quality of early care and education settings is inadequate
Report to Congress on DLLs in Head Start Page | 75
CHAPTER VI DEVELOPMENTAL PROGRESS MADE BY DLLS IN EARLY HEAD START AND HEAD START
In this chapter we address the fifth research question
What developmental progress is made by children who are DLLs in Head StartEarly Head Start programs
In the next section we summarize the data sources and analytic methods used to address this question For this question we are especially limited by the state of research methodology The following section describes the developmental progress of DLLs in Early Head Start and Head Start These findings are put into context in the final section of this chapter through comparisons with the developmental progress of children from monolingual English homes in Early Head Start and Head Start First we begin by outlining the issues plaguing the field that limit capacity to provide a complete picture of the developmental progress of young DLLs
The data addressing this question are limited due to the overall state of the field to reliably or accurately describe the developmental progress of young children who are dual language learners As discussed in Chapter I the research field lacks consensus regarding a variety of methodological issues in the assessment of development among DLLs For one there is not definitive guidance about the most appropriate instruments or procedures for screening language abilities or routing young children based on language proficiency into assessments delivered in English or LOTEs In addition the norms established for the most common measures of child development have not been shown to be valid for children who are dual language learners Most widely available measures of vocabulary one of the most common indices of language development for young children assess only English vocabulary skills offering few or no options for observing language ability in languages other than English Of particular significance for this question it is unclear what the best approaches are for assessing comprehensive development over time as childrens proficiency in one or more languages and perhaps their dominant language changes
Large-scale national studies examining child development holistically are challenged to collect the most comparable data across groups of children with different language experiences In this context the information presented below regarding the developmental progress of DLLs in Early Head Start and Head Start reflects data collected utilizing the best methods available at the time the respective studies were designed
A METHODOLOGY
To answer this question we compiled data from multiple sources These include the 2009 Baby FACES staff reports about childrens development and parent interviews and the 2006 FACES parent interviews teacher reports of childrens development and direct assessments of children
Report to Congress on DLLs in Head Start Page | 76
Fair and accurate assessment of the language development of DLLs should reflect the characteristics of DLLs (including their stage of English acquisition and their home literacy environment) and capture overall language competence with attention to both the first and second languages (Espinosa 2008xix) In Baby FACES information on language development of 1-year-old children was obtained from Early Head Start home visitors and teachers using the Short Form Level I (for infants) of the MacArthur-Bates Communicative Development Inventories (CDI) (Fenson et al 2000xx) Children identified as understanding Spanish and whose teachers or home visitors also spoke Spanish were also rated using the direct Spanish translation of the English infant form
Information on Early Head Start childrens social-emotional development was obtained from both parents and Early Head Start teachers and home visitors using the Brief Infant Toddler Social Emotional Assessment (BITSEA Briggs-Gowan amp Carter 2006xxi) The BITSEA measures childrens emerging social-emotional competence and problems with forms for staff and parents Scores at or above the 75th percentile in the national standardization sample for problems or scores at or below the 15th percentile for competence indicate developmental problems and children who score in the problem range for competence or problems are considered to have screened positive for developmental problems As described in Chapter 1 available data only permit us to report how children in Early Head Start were doing at 1 year of age and rely on reports with no direct assessments of childrens development at this age
In Head Start a direct child assessment battery was administered to assess childrens vocabulary early literacy and early math skills social-emotional development and height and weight In addition parents provided ratings of their childrens early literacy social-emotional development and health The direct assessment began with a language screener to determine whether children should receive the assessment battery in English or Spanish or receive only the test of vocabulary and be weighed and measured The screener included the Art Show and Simon Says subtests of the Preschool Language Assessment Survey (PreLAS 2000 Duncan amp DeAvila 1998xxii) To assess their English receptive vocabulary assessors administered the Peabody Picture Vocabulary Test (PPVT-4) to all children regardless of their home language or performance on the language screener (Dunn et al 2006xxiii)
In other words DLLs or the Head Start children whose parents reported that a language other than English was primarily spoken to them at home (27 percent of all 3- and 4-year olds in FACES sample) received both the PreLAS as a language screener and the PPVT-4 as an assessment of their English skills in the fall of 2006 Any child whose primary language at home was not English but who passed the screener by demonstrating a minimum level of English comprehension received the cognitive assessment battery entirely in English If a child did not pass the screener (ie child made five consecutive errors on both the Simon Says and Art Show subtests) and primarily spoke Spanish at home he or she was administered the PPVT-4 and then routed to the Spanish-language cognitive assessment battery If a child did not pass the screener and did not primarily speak English or Spanish he or she was administered only the PPVT-4 and was weighed and measured Among children from monolingual English homes (ie children whose parents reported no LOTEs spoken in the home or who reported that they spoke primarily in English to the child) approximately 1 percent did not pass the English language screener and were administered the cognitive assessment battery in Spanish At
Report to Congress on DLLs in Head Start Page | 77
Head Start entry less than half of children whose primary language at home was not English passed the English language screener (12 percent of entire sample) In subsequent waves (spring of 2007 and 2008) the language screener was used to route only children who had not passed the language screener in the previous round All other children were administered the Simon Says task and then automatically routed into the English version of the assessments
For Head Start children who passed the screener for minimum ability in English emergent and early literacy skills were assessed in English using the Letter-Word and Spelling subtests of the Woodcock-Johnson (WJ-III) Tests of Achievement (Woodcock et al 2001) as well as the Story and Print Concepts task developed for FACES (modified from the Story and Print Concepts tasks in Mason and Stewart (1989)xxiv) Early math skills were assessed in English using the Applied Problems subtest of the WJ-III Tests of Achievement and the Early Childhood Longitudinal Study (ECLS) math and numbershape proficiency tasks
For Head Start children who were routed into the Spanish cognitive assessment battery assessors used Spanish versions of the tests to assess childrens literacy and math skills Children who spoke Spanish were assessed using the Letter-Word and Spelling subtests of the Bateriacutea III Woodcock-Muntildeoz (WM-III) Tests of Achievement (Woodcock Muntildeoz-Sandoval McGrew Mather and Schrank 2004xxv) as well as the Spanish translation of the Story Print Concepts task developed for FACES Early math skills were assessed using the Applied Problems subtest of the WM-III Tests of Achievement and Spanish translation of the Early Childhood Longitudinal Study (ECLS) math and numbershape proficiency tasks In addition assessors administered the Test de Vocabulario Imaacutegenes de Peabody (TVIP Dunn et al 1986xxvi) to Spanish speaking Head Start children to assess their receptive vocabulary in Spanish Thus the data offer a picture of Spanish-speaking childrens vocabulary in two languages FACES 2006 did not use conceptually scored measures of childrens language development so no picture of childrens overall vocabulary development independent of language can be derived from the current data
All children were then assessed in the spring preceding their Head Start exit (ie 2007 for children who entered as 4-year olds and 2008 for children who entered as 3-year olds) It is important to note that about half of Spanish-speaking DLLs in Head Start were assessed in English in Fall 2006 but by the end of Head Start (approximately 6-8 months later for 4-year olds 16-18 months later for 3-year olds) nearly all DLLs were assessed in English because they passed the English language screener (approximately 11 percent of DLLs completed the cognitive assessment battery in Spanish) That means that the samples for describing language development in English and Spanish are very different at the beginning and end of Head Start In addition this reflects progress in English language development among Spanish-speaking DLLs in Head Start
ased on childrens behavior during the assessment assessors rated all childrens attention organization and impulse control activity level and sociability using the Leiter International Performance Scale Revised (Leiter-R) Examiner Rating Scales (Roid and Miller 1997xxvii)
Other measures of development were obtained from teachers and parents Teachers of children who entered Head Start in Fall 2006 rated childrens literacy and social skills as well as
Report to Congress on DLLs in Head Start Page | 78
their attitudes toward learning competence and motivation and their attention and persistence using the Preschool Learning Behavior Scale (PLBS McDermott et al 2000xxviii) Parents rated their childrens literacy social skills and attitudes toward learning
Descriptive analyses of each data source were conducted The analyses used analytic weights provided with the survey datasets to take into account the sampling design and data collection nonresponse All estimates pertaining to Head Start children obtained using FACES 2006 data are weighted to represent the population of children entering Head Start for the first time in fall of 2006 In other words estimates using baseline data are weighted to represent all children nationwide who enrolled in Head Start in the fall of 2006 Estimates using subsequent waves of data are weighted to represent all children nationwide who remained enrolled and completed Head Start In other words for data from spring 2007 children entering Head Start in 2006 who are still enrolled after one year for data from spring of 2008 children entering in 2006 who are still enrolled after two years Estimates using Baby FACES data are weighted to represent the population of 1-year-old children enrolled in Early Head Start in spring of 2009
The FACES and Baby FACES data do not include children and families in MSHS programs or children and families in American IndianAlaska Native (AIAN) programs
As discussed in Chapter I all of the data reported focus on children for whom a language other than English is the primary language spoken to them at home (DLLs) unless noted otherwise
B DEVELOPMENTAL PROGRESS OF DLLS IN EARLY HEAD START
Baby FACES data for 1-year-old children in the spring of 2009 provide a single snapshot of the developmental status of Early Head Start children summarized below
1-year-old DLLs in Early Head Start are just beginning to develop their vocabulary ccording to Early Head Start teachers and home visitors assessments using the DI 1-yearshyold DLLs in Spring 2009 understood 22 English words and spoke 1 English word on average (Table VI1) The 1-year-old DLLs who were identified as understanding Spanish and whose Early Head Start teacher or home visitor also spoke Spanish understood 36 Spanish words and spoke 2 Spanish words on average
DLLs have a larger vocabulary when both English and Spanish words are considered When the CDI assessments in English and Spanish are combined to assess the number of words that the child understands or says in English or Spanish the Baby FACES data show that DLLs understood 41 words in English or Spanish and spoke 3 words in English or Spanish on average (Table VI1)
Many DLLs in Early Head Start may have delays in social-emotional development According to staff (teachers and home visitors) 10 percent of 1-year-old DLLs in Early Head Start in Spring 2009 had high levels of problem behaviors indicating a delay in social-emotional development (Table VI2) According to parents more than three times as many DLLs (34 percent) had high levels of problem behaviors indicating a delay in social-emotional competence
Report to Congress on DLLs in Head Start Page | 79
Parent and staff ratings of social-emotional competence are more similar According to teachers and home visitors 20 percent of DLLs had low social-emotional competence indicating a delay in social-emotional development (Table VI2) According to parents 15 percent had low social emotional competence
When the two domains are combined the data show that according to parents 43 percent of DLLs screened positive (had high problem behaviors or low social-emotional competence) indicating a delay in social-emotional development According to teachers and home visitors however 25 percent of 1-year-old DLLs in Early Head Start screened positive (Table VI2)
C DEVELOPMENTAL PROGRESS OF DLLS IN HEAD START
FACES data provide three snapshots of DLLs one of all DLLs entering Head Start in Fall 2006 another of the DLLs who were still enrolled in the spring of their Head Start exit year and finally another of DLLs who were still enrolled in the spring and have valid comparable data at Head Start entry and exit In the snapshot of children at Head Start entry we can describe developmental status in several areas but aspects requiring direct child assessments (eg letter word identification vocabulary math skills) are limited to children who could achieve basal scores on English or Spanish assessments (after routing based on the language screener) Descriptions of children who remained enrolled (spring 2007 for the children who enrolled as 4shyyear-olds and Spring 2008 for those who enrolled as 3-year-olds) reflect developmental status at Head Start exit of children who achieved basal scores on direct assessments in the spring Most of the children who stayed until the spring and had not achieved basal at Head Start entry did achieve basal scores by Head Start exit The final snapshot portrays growth across developmental domains from Head Start entry to exit among the subset of children who completed the entire assessment battery in the same language at both time points However we can describe growth in childrens accomplishments social skills and problem behaviors based on parent and teacher reports regardless of home language routing or basal scores on direct assessments Key findings describing the progress of DLLs in Head Start are summarized below
DLLs increase their receptive English vocabulary during Head Start but they begin and end their Head Start year(s) with receptive English vocabulary well below national norms The PPVT-4 scores of DLLs who entered Head Start in fall 2006 averaged 72 (nearly two standard deviations below the norm) (Table VI3) The average PPVT-4 score of DLLs remaining in Head Start in the spring of their exit year was about the same relative to their same -age peers (Table VI4) Among children with comparable data at entry and exit however PPVT-4 scores increased from 72 to 80 (Table VI5) PPVT-4 Growth Score Values which are absolute scores that are comparable over time show that average receptive English vocabulary among DLLs was 85 among new Head Start entrants and 103 among all DLLs who remained in Head Start in spring of their exit year (Tables VI3 VI4) Among children with comparable data at entry and exit scores increased from 86 to 107 (Table VI5)
DLLs begin and end Head Start with receptive Spanish vocabulary below national norms DLLs who were assessed in Spanish using the TVIP in fall of 2006 received an average score of
Report to Congress on DLLs in Head Start Page | 80
85 about one standard deviation below the norm (Table VI3) The average score on the TVIP among DLLs who were assessed in Spanish in spring of their Head Start exit year was approximately the same (82) indicating that DLLs receptive Spanish vocabulary did not change relative to children their age (Table VI4) Among children with valid scores at Head Start entry and exit (ie all Spanish speakers who achieved basal score regardless of which language they were routed to for the cognitive assessment battery) TVIP scores decreased slightly from 86 to 83 (Table VI5)
By the end of Head Start DLLs assessed in English demonstrate English letter-word knowledge and spelling skills near the norm for their age Those assessed in Spanish demonstrate Spanish letter-word knowledge and spelling skills that are about one standard deviation below the (monolingual Spanish-speaking) norm DLLs who entered Head Start in Fall 2006 and were assessed in English using the WJ-III Tests of Achievement received an average score on the Letter-Word Identification subtest of 93 and an average score on the Spelling subtest of 94 approximately half of a standard deviation below the norm (among monolingual Spanish-speaking children their age) (Table VI3) The average scores on the WJ-III Letter-Word Identification subtest and Spelling subtest among DLLs who were assessed in English at the end of Head Start were 98 and 99 indicating that DLLs letter-word knowledge and spelling skills improved relative to children their age (Table VI4) Among DLLs with comparable data at entry and exit the WJ-III Letter-Word Identification and Spelling subtest scores increased from 93 or 94 to 100 reflecting the norm for their age (Table VI5)
DLLs entering Head Start in fall 2006 who were assessed in Spanish using the WM-III Tests of Achievement received average scores on the Letter-Word Identification and Spelling subtests of 79 and 88 just below and above one standard deviation below the norm (Table VI3) Among DLLs who were assessed in Spanish at the end of Head Start the average score on the Spanish WM-III Letter-Word Identification subtest increased (83) indicating that DLLs Spanish letter-word knowledge improved relative to monolingual Spanish-speaking children their age to about one standard deviation below the norm (Table VI4) However the average score on the WM-III Spelling subtest was somewhat lower (85) indicating that DLLs Spanish spelling skills declined slightly relative to children their age (Table VI4) Among DLLs who completed the Spanish assessments at entry and exit the WM-III Letter-Word Identification subtest scores increased from 74 to 85 and Spelling subtest scores decreased from 89 to 85 reflecting progress in letter-word knowledge and a slight decline in spelling relative to same-age peers (Table VI5)
By the end of Head Start DLLs assessed in English demonstrate math skills near the norm for their age Those assessed in Spanish demonstrate math skills a half standard deviation below the norm DLLs who entered Head Start in Fall 2006 and were assessed in English scored about one standard deviation below the mean of the norming population on the WJ-III Applied Problems subtest (Table VI3) DLLs assessed in English at the end of Head Start received an average score of 85 indicating that DLLs kept up with their monolingual English-speaking same age peers but did not improve beyond that (Table VI4) Among DLLs with valid English test scores at both time points the average WJ-III Applied Problems subtest score remained about the same (86 in Fall 2006 and 88 in spring of the Head Start exit year Table VI5)
Report to Congress on DLLs in Head Start Page | 81
DLLs who were assessed in Spanish in fall 2006 received an average score on the WM-III Applied Problems subtest of 82 slightly more than one standard deviation below the mean in the norming population (Table VI3) t the end of Head Start DLLs average score on the WM shyIII Applied Problems subtest was 75 about one-and-a-half standard deviations below the norm indicating that DLLs who entered Head Start in Fall 2006 and were assessed in Spanish in the spring of their exit year did not keep up with their same age peers in the norming sample (Table VI4) Among the small number of DLLs with valid Spanish test scores at both time points the average WM-III Applied Problems subtest score increased from 75 to 81 (Table VI5)
ECLS-B Math IRT scores and NumberShape Proficiency Probability scores show that DLLs math skills improved by the end of their Head Start exit year The average ECLS-B Math IRT score 16 increased from 72 (out of 44) in fall 2006 to 111 in the spring of 2007 or 2008 (Tables VI3 and VI4) Among DLLs with valid scores at both time points the average score increased from 73 to 119 (Table VI5) The average ECLS-B NumberShape Proficiency probability score increased from 023 in fall 2006 to 060 in the spring of 2007 or 2008 meaning that 23 percent of DLLs demonstrated mastery of number and shape recognition at Head Start entry while 60 percent of DLLs were able to do so by Head Start exit (Tables VI3 and VI4) Among DLLs with valid scores at both time points the average score increased such that 24 percent had mastered number and shape recognition at entry and 67 percent did so by Head Start exit (Table VI5)
DLLsrsquo pre-reading skills increase during Head Start The average Story and Print Concepts IRT score among DLLs entering Head Start in Fall 2006 was 33 (out of 9 possible) (Table VI3)17
Among DLLs remaining in their program the average score at Head Start exit was 55 (Table VI4) Among DLLs with valid scores at entry and exit the Story and Print Concepts IRT score increased from 38 to 60 (Table VI5)
DLLsrsquo literacy skills increase during Head Start According to parents when they entered Head Start in fall of 2006 DLLs had mastered an average of 2 out of 5 skills specified (recognizing letters counting writing or pretending to write writing their own name and identifying colors by name) (Table VI6) By the end of Head Start they had mastered 4 out of these 5 skills (Table VI7) According to teachers when they entered Head Start in fall 2006 DLLs had mastered 27 out of 7 literacy skills (Table VI6) At the end of Head Start DLL had mastered 55 of those skills (Table VI7)
16 The ECLS-B math IRT scores represent estimates of the number of items children would have answered correctly
if they had taken all 44 items of the ECLS-B preschool national scorable questions 17
The Story and Print IRT scores represent estimates of the number of items children would have answered correctly if they had taken all 9 items of the Story and Print Concepts measure
Report to Congress on DLLs in Head Start Page | 82
Report to Congress on DLLs in Head Start Page | 83
Report to Congress on DLLs in Head Start Page | 84
DLLsrsquo approaches to learning are comparable to their peers in Head Start According to teachers DLLs attitudes toward learning competence and motivation and attention and persistence were similar to those of other children entering Head Start in Fall 2006 and at the end of Head Start with average T-scores on the Preschool Learning Behavior Scale (PLBS) of approximately 51 in Fall 2006 and 54 in spring of their exit year (Tables VI8 and VI9) Similarly parents ratings of DLLs approaches to learning were stable over time (118-126 out of a possible 16 Tables VI8 and VI9)
Teacher reports suggest that DLLsrsquo behavior problems may decline during Head Start however parent reports remain the same Total numbers of behavior problems reported by parents and teachers of DLLs were similar on average in fall of 2006 (66 reported by parents [out of 24 possible] and 65 reported by teachers [out of 36 possible]) (Table VI8) At the end of Head Start the average number of behavior problems reported by parents remained similar (61) while teachers reported fewer problems on average (41) declined to 61 reported by parents and 41 reported by teachers (Table VI9) Among DLLs with data at both time points parent reports were similar at both time points (65 and 62) but teacher reports indicated fewer behavior problems on average at the end of Head Start (42 vs 62) (Table VI10)
DLLsrsquo cognitive-social skills remain more than half a standard deviation below the norm at the end of Head Start According to the Leiter-R Examiner Rating Scales of childrens cognitive-social development (attention organization and impulse control activity level and sociability) completed by assessors DLLs received an average score of approximately 88 in the fall of 2006 and 91 when they completed Head Start (Tables VI8 and VI9) suggesting that DLLs remained behind their peers in these areas Similarly among DLLs with valid data at both time points average scores increased slightly from 89 to 91 remaining more than half a standard deviation below the norm (Table VI10)
Report to Congress on DLLs in Head Start Page | 85
Report to Congress on DLLs in Head Start Page | 86
Weight problems increase dramatically among DLLs during Head Start Based on the Body Mass Index (BMI) calculated from their height and weight more than one-third of DLLs are overweight or obese at Head Start entry and by the spring of their Head Start exit year nearly half are overweight or obese BMI values were at or above the 85th percentile for age and gender (indicating overweight or obesity) for 38 percent of DLLs at the time of Head Start entry in fall 2006 and 48 percent of DLLs when they completed Head Start (Tables VI11 and
VI12) Similarly among DLLs with valid data at both time points the percentage overweight or obese increased from 37 percent in fall 2006 to 47 percent at the end of Head Start (Table VI13)
Despite increased weight problems most parents of DLLs report that their child is in excellent health At the beginning of Head Start 65 percent of parents of DLLs rated their childs health as excellent while 9 percent rated their childs health as fair or poor (Table VI14) By the spring of their exit year 70 percent of parents of DLLs rated their childs health as excellent and 7 percent rated their childs health as fair (Table VI15) mong DLLs with valid data at entry and exit the percentage of DLLs reported by their parents to be in excellent health was stable (67 to 69 percent Table VI16)
DLLs often come from homes in which the literacy environment is not rich At the beginning of Head Start DLLs lived in homes with an average of 19 childrens books and one-third of DLLs had a family member who read to them daily (Table VI17) By the end of Head Start DLLs lived in homes with an average of 25 childrens books and 35 percent of DLLs had a family member who read to them daily (Table VI18) At the end of Head Start 22 percent of their parents reported that they read themselves every day down from 27 percent at the beginning of Head Start (Tables VI19 and VI20) At the end of Head Start parents of DLLs reported doing 94 out of 11 learning activities with their child on average up from an average of 87 at the beginning of Head Start (Tables VI21 and VI22)
Report to Congress on DLLs in Head Start Page | 87
D DEVELOPMENTAL PROGRESS OF DLLS COMPARED WITH CHILDREN FROM MONOLINGUAL ENGLISH HOMES
Putting the development of DLLs into the context of their peers from monolingual English homes makes it possible to gauge the status of DLLs in Early Head Start and the progress of DLLs in Head Start and determine the extent to which DLLs exhibit special needs and strengths The status of DLLs in Early Head Start and the experiences of DLLs in Head Start compared with children from monolingual English homes are described in detail below
These data show that when Head Start receives children DLLs lag behind children from monolingual English homes in some developmental areas and all children lag behind their peers in the population in many areas Neither DLLs nor children from monolingual English homes lose ground during Head Start on average relative to their age peers in the norming population but neither do they usually catch up if they start Head Start behind DLLs enter Head Start with a disadvantage in some developmental areas (pre-academic achievement) relative to children from monolingual English homes and typically their gains are similar so they end their Head Start exit year(s) with a similar relative disadvantage on average In some areas such as English language development (specifically vocabulary and letter word identification) and learning behaviors (specifically attitude toward learning and attentionpersistence) their gains are greater during their Head Start year relative to their monolingual English peers however they remain below their age peers in the norming population and their monolingual English peers in Head Start In other developmental areas (social-emotional development) the FACES data show no differences between DLLs and children from monolingual English homes in their status at Head Start entry or in their developmental progress during Head Start One exception to these patterns is childrens physical health and developmentmdashDLLs are more likely than children from monolingual English homes to be overweight or obese and weight problems increase during Head Start
1 Relative Progress of DLLs in Early Head Start
1-year-old DLLs understand and use fewer English words than children from monolingual English homes DLLs understood 22 English words and used 1 English word on average while children from monolingual English homes understood 33 English words and produced 4 words on average (Table VI1)
When vocabulary in English and Spanish is considered DLLs comprehend more words than children from monolingual English homes According to their Early Head Start teachershome visitors 1-year-old DLLs in Early Head Start in spring 2009 understood 41 words in English or Spanish while children from monolingual English homes understood 33 words in English (Table VI1) DLLs understood as many words in Spanish as children from monolingual English homes understood in English (36 and 33 words respectively)
Similar proportions of DLLs and children from monolingual English homes may have a delay in social-emotional development Teachershome visitors of DLLs and teachershome visitors of children from monolingual English homes both rated 25 percent of the children as
Report to Congress on DLLs in Head Start Page | 88
having high problem behaviors or low social-emotional competence (Table VI2) Parents of DLLs and parents of children from monolingual English homes provided less consistent ratings Parents of DLLs were more likely than parents of children from monolingual English homes to give ratings indicating their child had a delay in social-emotional development (43 percent compared with 29 percent Table VI2)
2 Relative Progress of DLLs in Head Start
DLLs and children from monolingual English homes gain receptive English vocabulary during Head Start but they enter and leave Head Start with receptive English vocabulary below national norms regardless of home language PPVT-4 growth scores show that DLLs and children from monolingual English homes increased their receptive English vocabulary by similar amounts between fall of 2006 and the spring of their Head Start exit year Yet when they entered Head Start the PPVT-4 scores of children from monolingual English homes averaged nearly one standard deviation below the norm (88) and the scores of DLLs averaged 72 (nearly two standard deviations below the norm) (Table VI3) Average PPVT-4 scores of both DLLs and children from monolingual English homes increased slightly by spring of childrens Head Start exit year (92 for children from monolingual English homes and 77 for DLLs) indicating that the children made slight gains relative to their age peers in English vocabulary development (Table VI4) Among children with valid data at both time points however it appears that DLLs made greater gains during the Head Start year relative to their peers from monolingual English homes (DLLs increase from 718 to 798 monolingual English increase from 874 to 919) (Table VI5)
DLLs with adequate English language skills resemble their peers from monolingual English homes in their English letter-word knowledge and spelling skills and they experience similar gains over time DLLs with adequate English language skills to pass the English language screener started Head Start approximately one-half of a deviation behind their age peers in the norming population and by the spring of their Head Start exit year had letter-word knowledge similar to their age peers (Tables VI3 and VI4)
DLLs regardless of language improved their math skills beginning and ending Head Start similarly behind their age peers as children from monolingual English homes According to the WJ-III Applied Problems subtest neither DLLs nor children from monolingual English homes gained relative to their age peers in the norming population However similarly substantial gains were made in the ECLS-B Math IRT and NumberShape Proficiency probability scores among both DLLs and children from monolingual English homes (Tables VI3 and VI4)
According to teachers and parents DLLs and children from monolingual English homes have similar literacy skills at the beginning and end of Head Start Teachers reported on average that DLLs and children from monolingual English homes entering Head Start in fall 2006 had mastered 26 to 27 out of 7 literacy skills and both groups ended their Head Start year(s) with 55 literacy skills (Tables VI6 and VI7) Parents reported on average that DLLs and children from monolingual English homes entering Head Start in fall 2006 had mastered
Report to Congress on DLLs in Head Start Page | 89
about 2 out of 5 literacy skills and both groups ended their Head Start year(s) with about 4 out of the 5 literacy skills (Tables VI6 and VI7) A similar pattern is evident in the Story and Print Concepts Scale IRT scores which describe childrens pre-reading skills (average scores increased from 33 to 55 [out of 9 possible] among DLLs and 36 to 61 among children from monolingual English homes between Fall 2006 and the spring of the Head Start exit year) (Tables VI3 and VI4)
The approaches to learning of DLLs and children from monolingual English homes are the same on average Average PLBS scores reported by teachers at the beginning and end of the Head Start year(s) are very near the mean of the Head Start population in both groups and over time (Tables VI8 and VI9) Similarly parent ratings of their childs approaches to learning are similar on average across groups and over time ranging from 118 to 126 out of 16 possible (Tables VI8 and VI9)
Compared with children from monolingual English homes DLLs come from less literacy-rich home environments When they entered Head Start in Fall 2006 DLLs came from homes with 19 childrens books on average less than half as many books as in the homes of children from monolingual English homes (47 childrens books on average) (Table VI17) Moreover 33 percent of DLLs were read to daily by a family member compared with 40 percent of children from monolingual English homes (Table VI17) During the Head Start year(s) the average number of books increased in all homes but remained much higher in monolingual English homes (54 compared with 25 books Table VI18) The percentage of children from homes in which a family member read to them daily was similar among DLLs and children from monolingual English homes in the spring of the Head Start exit year (35 percent to 37 percent Table VI18) Some activities with family members that might contribute to literacy and numeracy skills were less prevalent in the homes of DLLs than monolingual English homes in the spring of the Head Start exit year(s) including working with the child on arts and crafts (59 percent vs 72 percent respectively) involving the child in household chores (86 percent vs 97 percent) and talking about TV programs or videos (74 percent vs 83 percent) (Table VI22)
According to teachers DLLs exhibit fewer behavior problems than children from monolingual English homes on average both when they enter Head Start and at the end of their Head Start exit year(s) However according to parents DLLs exhibit more behavior problems On average teachers report fewer behavior problems among DLLs than among children from monolingual English homes especially at Head Start exit (65 for DLLs vs 72 at the beginning of Head Start and 41 vs 63 in the spring) In contrast parents of DLLs on average perceive greater problem behaviors in their children than parents from monolingual English homes at both time points (66 vs 55 out of 24 possible at the beginning of Head Start and 61 vs 51 in the spring) (Tables VI8 and VI9)
The cognitive-social skills of DLLs and children from monolingual English homes are similar between groups and over time ssessor ratings of childrens cognitive-social development (attention organization and impulse control activity level and sociability) using the Leiter-R show that both DLLs and children from monolingual English homes demonstrated
Report to Congress on DLLs in Head Start Page | 90
cognitive-social skills that lagged behind their age peers in the norming population by between one-half and one standard deviation both when they entered Head Start and in the spring of the Head Start exit year(s) (Tables VI8 and VI9)
The extent of weight problems increases among DLLs but not children from monolingual English homes during Head Start Approximately one-third of children from monolingual English homes who entered Head Start in Fall 2006 were overweight or obese based on their Body Mass Index (BMI) and a similar proportion of those who completed Head Start were overweight or obese In contrast 38 percent of DLLs entered Head Start with a BMI that put them in the overweight or obese category and nearly half of those who completed Head Start were in that category (Tables VI11 and VI12)
Although among DLLs who were stayers more DLLs were overweight at the end of Head Start than at the beginning (189 percent at entry vs 271 percent at exit) a similar percentage was obese (20-21 percent) at the beginning and end of Head Start The percentage who were overweight or obese among children from monolingual English homes was also constant over time (179 percent to 172 percent overweight 14 percent to 15 percent obese) (Table VI13)
Parents of DLLs rate their childrenrsquos overall health less positively than parents from monolingual English homes Parents of DLLs who entered Head Start in Fall 2006 were less likely than parents from monolingual English homes to rate their childs health as excellent or very good in Fall 2006 (65 percent compared with 81 percent) and in the spring of their childs Head Start exit year (70 percent compared with 82 percent) (Table VI14 and VI15)
Report to Congress on DLLs in Head Start Page | 91
CHAPTER VII DISCUSSION
The analyses conducted to answer the questions posed by Congress in the Head Start Act together provide an important picture of DLLs the services they receive in Early Head Start and Head Start and their developmental progress during their enrollment This picture is not perfect and it is important to remain aware of the limitations of the data These limitatio ns point to directions for future research to refine the picture
A WHAT THE DATA TELL US ABOUT DLLS IN EARLY HEAD START AND HEAD START
DLLs have different strengths and needs than children from monolingual English homes and some available data on services reflect these differences Most DLLs have parents who were born outside the US (mostly in Mexico) the majority of whom have been in the US for less than 10 years and do not understand English well or at all In Early Head Start DLLs were more likely than children from monolingual English homes to be in programs offering English language services (such as assessment of English ability information about adult ESL) their parents were more likely to have received several literacy and language-related services (eg literacy training English classes) and health services in the past year and their parents reported higher involvement in many program activities In Head Start DLLs were more likely to belong to a family in which a family member attended ESL classes
DLLs are more likely than children from monolingual English homes to live with two parents The majority of children live with parents who have not completed high school or a GED Most live with at least one employed parent yet most are living in poverty In contrast children from monolingual English homes are more likely to have parents who have completed high school or a GED less likely to have parents who are working more likely to have parents who are receiving public assistance and more likely to have parents who report symptoms of depression Children from monolingual English homes are more likely than DLLs to have a mother who is currently enrolled in a program course class or workshop
As for children from monolingual English homes the data paint a mixed picture of classroom features and quality for DLLs in Early Head Start and Head Start Average group sizes and child-adult ratios are well below the maximum specified in the Head Start Program Performance Standards and in Head Start classroom observations showed that lead teachers typically demonstrate sensitivity responsiveness and encouragement in their interactions with children The average classroom environment in both Early Head Start and Head Start however was rated in the minimal to good range and in Head Start teachers instructional support was rated low The average features and quality of classrooms of children from monolingual English homes are very similar to those of DLLs
Early Head Start home visits with DLLs include many different kinds of activities and on average two-thirds of home visit time are spent on child-focused and parent-child-focused activities The quality of observed home visits was rated as slightly above adequate on average Although the pattern of activities during the home visits with DLLs and children from monolingual English homes vary the quality of the home visits that were observed was very similar DLLs are more likely to receive home-based services (including family child care) than
Report to Congress on DLLs in Head Start Page | 92
the other options and it is unclear what drives this pattern Are the programs serving DLLs more likely to offer home-based services If so is this pattern a response to the interest and needs expressed by families in these service areas are families of DLLs more likely to select this option or does this reflect the resources available in these areas The higher prevalence of home-based services among DLLs warrants attention and at the very least additional exploration
DLLs in Head Start like their peers from monolingual English homes demonstrate developmental progress during Head Start DLLs in Head Start lag behind children from monolingual English homes in some developmental areas and all Head Start children lag behind their age peers in the population in many areas DLLs enter Head Start with a disadvantage in some developmental areas (pre-academic achievement) relative to children from monolingual English homes and typically their gains are similar so they end their Head Start exit year(s) with a similar relative disadvantage on average In other developmental areas (social-emotional development) the data show no differences between DLLs and children from monolingual English homes in their status at Head Start entry or in their developmental progress during Head Start However in some areas (English vocabulary development approaches to learning cognitive-social skills) DLLs appear to make greater gains during their time in Head Start than their peers from monolingual English homes One concerning exception to these patterns is childrens physical health and developmentmdashDLLs are more likely than children from monolingual English homes to be overweight or obese and their weight problems increase during Head Start
B LIMITATIONS OF THE DATA
As discussed at length in Chapter I the data available for addressing questions posed by Congress have some important limitations First children in MSHS and Head Start programs in US territories are not included in available data sources that include assessments of developmental status or progress The children enrolled in MSHS programs represent approximately 3 percent of all enrolled children but nearly 10 percent of all DLLs Second the available data for Early Head Start children provide only a snapshot of their developmental status and do not yet permit an examination of the progress children make during Early Head Start
Third because of limitations in the state of the field the assessments of children in Head Start may not fully or accurately capture their competencies or progress in language or other domains of development Focusing on one domain as an example fair and accurate assessment of the language development of DLLs should reflect the characteristics of DLLs (including their stage of English acquisition and their home literacy environment) and capture overall language competence with attention to both the first and second languages (Espinosa 2008) In FACES children were assessed in English if they passed a screener indicating minimum ability in English otherwise if they were Spanish-speakers they were assessed in Spanish Thus for DLLs who were not Spanish-speakers and did not show minimum ability in English their language skills were assessed in only one languagemdashEnglish and comparisons with children from monolingual English homes may be unfair
Report to Congress on DLLs in Head Start Page | 93
About half of Spanish-speaking DLLs in Head Start were assessed with the English cognitive battery in Fall 2006 but by the end of Head Start nearly all were assessed in English Thus the samples for describing cognitive abilities (including readingliteracy skills and ability to solve math problems) are different at the beginning and end of Head Start and the descriptions of developmental progress confound progress of individual children with changes in the composition of children assessed in each language at the beginning and end of Head Start
Finally data were not available to answer some of the questions posed in the Head Start Act On the nature of services offered to children and families we are not able at this time to describe the content duration and intensity of all types of services in as much detail as desired Moreover the discussion of progress among children who are dual language learners and their families enrolled in Head Start programs is limited by the state of the field more broadly in the area of assessment of young dual language learners and in the area of identification and measurement of family processes for these families This report provides as much information as the available data and existing methods can reliably address
Several ACF-funded research efforts are addressing the gaps in research on this population and the questions posed in the Head Start Act As discussed in Chapter I many of the limitations and challenges found in national research studies on Head Start programs reflect gaps in the field of research on early childhood more generally as well as challenges specific to national studies of young children The level of information necessary to answer questions about the unique experiences and development of young dual language learners is difficult to capture in a study that must address the experiences of all children regardless of their language background Further solid measures of many of the constructs identified as important for understanding young childrens development and their experiences in early childhood programs have not been developed assessed andor shown to be valid and reliable for young DLLs
The efforts undertaken by ACF to improve information on children who are dual language learners include a combination of adjustments to the instruments and methods used in national surveys but ndash more substantially ndash efforts to launch supplemental research projects to gather more detailed information on key populations of dual language learners in Head Start and to build capacity in the research field to provide better information regarding the development needs and strengths of young DLLs The activities that ACF has undertaken to increase and improve its data on children who are dual language learners are described briefly below These include efforts to improve the data collected in existing studies launching new studies to gather information about key populations of dual language learners not included in previous studies and supporting the development of new curricula and assessment tools for dual language learners and their families These efforts include
Roundtable meeting titled Supporting Positive Language and Literacy Development in Young Language Minority Children Research Policy and Practice This research roundtable held in Washington DC in April 2008 was a working meeting where invited speakers and participants engaged in critical dialogue regarding how research can support efforts of policy makers and practitioners to serve the language and literacy needs of young language minority children1 The
Report to Congress on DLLs in Head Start Page | 94
1
2
central goal of the meeting was to gain a better understanding of how available research can or cannot presently inform policy and practitioner concerns The roundtable discussions were unique in that they highlighted research issues specific to the needs of programming and policy audiences Several federal agencies and prominent researchers in the field assisted in planning the content of the meeting The roundtable culminated in a report highlighting key research issues and questions that arose from the roundtable meeting on the topic of how research can support positive language and literacy outcomes for young language minority children
Revisions to national surveys to improve the data collected about young children who are dual language learners and the programs that serve them Advances in approaches to data collection are being implemented in the 2009 FACES cohort and in Baby FACES in order to enhance our understanding of dual language learners development
a Head Start Family and Child Experiences Survey (FACES) For the first time FES 2009 is assessing childrens expressive vocabulary using a bilingual (English and Spanish) conceptually scored measure in order to understand the totality of childrens expressive vocabulary (regardless of which language) The study has expanded its assessment battery to include a direct measure of executive functioning that does not rely on English language proficiency and can be administered in any language In FACES 2009 for the first time executive function is being assessed directly among children who can speak English or Spanish The parent and staff interviews in FACES 2009 which completed baseline data collection in Fall 2009 and the first follow-up of the sample in Spring 2010 will increase our knowledge of the home languages classroom language experiences and program services of children who are DLLs
Questions added to the FACES parent interview gather much more detail on the childrens exposure to multiple languages in the home including the degree of exposure to various languages in the home and literacy materials and media in different languages The interview also asks parents about such topics as their satisfaction with the support the program provides for their childrens development both in English and their home language
Likewise interviews with Head Start staff in the FACES study have been enhanced in 2009 in order to gather more information about the language experience children have in their classrooms the services programs offer to DLLs and the representation of multiple languages in the classroom Head Start teachers are asked about the number of children who are DLLs in the classroom the languages spoken by these children and the languages the teachers use when reading books to and talking with groups of children Additional items to capture teachers proficiency in languages other than English have also been included in the FACES 2009 teacher survey Items have also been added to the program director survey regarding services in support of the transition to kindergarten
Report to Congress on DLLs in Head Start Page | 95
In addition FACES is undergoing an extensive redesign in order to permit deeper examinations of specific topics of interest in a nationally representative sample of Head Start programs Beginning in 2014 it is expected that FACES will collect general descriptive information about families and children enrolled in Head Start and about programs and staff and it will utilize topically focused survey modules to collect more detailed information in areas of particular interest such as the services provided by Head Start programs This survey design is similar to that of other national datasets such as the National Household Education Surveys Program (NHES) and the Survey of Income and Program Participation (SIPP)
b Early Head Start Family and Child Experiences Survey (Baby FACES) Future waves of data collection from Baby FACES will provide information on the developmental progress of infants and toddlers in Early Head Start including their cognitive language social-emotional and health outcomes Conceptual scoring will be used to better assess young childrens total vocabulary development Later waves of the study will provide more comprehensive information on the program experiences of children (including children who are DLLs) who entered Early Head Start before 1 year of age
3 A research center focused on improving our knowledge and understanding of how best to support the development of dual language learners in early childhood care and education programs The Center for Early Care and Education Research Dual Language Learners (CECER-DLL) is a cooperative agreement awarded in 2009 to the University of North Carolina-Chapel Hill The primary goal of the Center is to advance the research field to improve assessment child care and education for children who are dual language learners (DLLs) from birth through five years of age This center is pursuing a focused agenda of research and national leadership activities that aim to (a) improve the state of knowledge and measurement in early childhood research on young DLLs and the needs of their families as these relate to childrens development and (b) identify and advance the evidence base for the best practices and strategies in early care and education programming to support the overall development of young DLLs and to effectively support their families In addition to building capacity in the field to reach long-term goals of improving assessment and programming CECER-DLL collaborates with OHS to support professional development initiatives including working with the National Center on Cultural and Linguistic Responsiveness to communicate research reviews to trainingtechnical assistance and program staff
4 University Partnership grants designed to improve understanding of efforts to support dual language learners in Head Start programs The Head Start University Partnerships grant program funds research projects that are planned in close collaboration with Head Start programs Previous rounds of University Partnership grants have focused on topics such as interventions and child assessment With this round of grants awarded in fiscal year 2007 ACF required a focus on dual language learners Eight university-based research teams have been working with Head Start
Report to Congress on DLLs in Head Start Page | 96
and Early Head Start programs to develop and examine interventions and assessments and to expand the knowledge base regarding the culture and school readiness of children from homes where a language other than English is spoken For example one project developed a new language assessment instrument for toddlers exposed to multiple languages and created a tool to facilitate teachers ongoing assessment of toddlers language development nother project developed a culturally-informed home-based early literacy intervention to support Latino parents in fostering their DLL childrens language and literacy
5 A design is under consideration for a new study of Migrant and Seasonal Head Start The Migrant and Seasonal Head Start Survey Design Project field tested and developed recommendations for a survey of Migrant and Seasonal Head Start programs and the children and families they serve The Design for Migrant and Seasonal Head Start Survey Final Design Report is published and ACF anticipates that this will provide the basis for future studies of MSHS programs18
6 Compendium of assessments and developmental screeners for children ages 3-5 To support programs use of reliable and valid early childhood assessments and developmental screeners that are appropriate for the populations they serve ACF developed a technical summary of 8 commonly used child assessments and 10 developmental screening tools The compendium is designed as a resource for managers and staff who work in different types of early childhood education programs and who are responsible for selecting and evaluating assessment or screening instruments More generally this resource also aims to increase awareness about reliability and validity and how to evaluate whether an instrument is appropriate for the population and purpose for which it will be used The volume includes information regarding the appropriateness of the measures for young DLLs
7 Research center focused on children and families in tribal Head Start programs Through a cooperative agreement with the University of Colorado at Denver Health Sciences Center ACF funds a Head Start American Indian Alaska Native Research Center The purpose of the Center is to provide leadership and offer support in the development and facilitation of local Head Start research and to strengthen the ability of local researchers to conduct model research projects in collaboration with Head Start American Indian and Alaska Native program staff and members of tribal communities
The Center engages in a variety of activities designed to promote excellence in early childhood research make a significant contribution to the knowledge base improve research capacity and provide leadership and support for research on the early development of American Indian and Alaska Native children Activities currently include the support of three local research partnerships between universities and tribal Head Start programs Michigan State University and the Intertribal Council of Michigan Arizona State University and Gila River and Oregon State University and
18 The final report is available online at httpwwwacfhhsgovprogramsoprehsmigrant_mshsindexhtml
Report to Congress on DLLs in Head Start Page | 97
the Confederated Tribes of Warm Springs The Center also supports training fellowships that assist in the professional development of researchers who are interested or have worked on Head Start and early childhood Native American research
In addition the Center is currently conducting a cross-site study of American Indian Alaskan Native Head Start programs The goal of the cross-site study is to determine how well research measures and methods used in Fs large national studies (such as FACES and Baby FACES) work with AIAN Head Start and Early Head Start children families and classrooms This effort will also examine measures that were missing from these studies that would allow for a full understanding of how IN childrens development proceeds within the context of family and Head StartEarly Head Start Another goal of the study is to work through the logistical challenges of working in diverse tribal communities with a common set of measures in order to provide guidance to future studies in navigating these complexities From the beginning of the study a community-based participatory approach has been implemented A steering committee comprised of tribal Head Start directors from across the country has guided the overall selection of measures and study design while detailed work with representatives from the participating communities has informed the site-specific details needed to make the work a success on the ground In all 5 tribal communities from across the country are participating in the study representing a diverse sampling of tribal cultures and geographies
While research activities are in progress to address the limitations and gaps in existing data concerning young children who are dual language learners ACF is also implementing several programmatic initiatives to improve services to DLLs and their families In addition to the requirement of this report there were many implications for DLLs in the Improving School Readiness Act of 2007 that helped frame and promote the following efforts to increase support for centers and staff to better serve children who are dual language learners and their families
1 In early 2008 the Office of Head Start published Dual Language Learning What Does it Take Head Start Dual Language Report Based on an assessment of program needs opportunities and barriers this report provides suggestions and recommendations for programs to better serve culturally and linguistically diverse children and families The report includes description of existing resources for programs and innovative approaches among Head Start agencies for ensuring positive outcomes enhancing family involvement strengthening program and professional development and building community resources
2 The urgent needs of programs and the requirements of the Head Start Act paved the way for the Office of Head Start National Dual Language Institute A Time for Action in Washington DC October 28-31 2008 Over 1500 program directors and managers teacher and parent leaders and other staff from Head Start Early Head Start Migrant and Seasonal Head Start and American IndianAlaska Native Head Start programs attended the Institute where 94 sessions showcased practice
Report to Congress on DLLs in Head Start Page | 98
strategies applied research innovative collaborations and responsive policies The goals of the Institute were to
Emphasize sections of the Head Start Act as well as existing Head Start Program Performance Standards in the area of dual language learning
Highlight research on dual language acquisition in children birth to five and its implications for practice
Discuss the importance of dual language learning including the acquisition of English language revitalization and cultural responsiveness as they relate to school readiness and positive outcomes for children
Provide tools and resources for programs to effectively support dual language learners and their families
Demonstrate and disseminate methods approaches and instructional practices for programs to effectively serve DLL children families and their communities
The Institute was designed with the intent that participants would return to their programs ready to take action to better serve dual language learners and their families
3 Ready for Success Supporting Dual Language Learners in Head Start and Early Head Start is a professional development series intended to help programs support the healthy development and learning of DLLs The series addresses OHS priorities as well as recommendations from attendees at the 2008 Dual Language Institute Throughout 2009-2010 webcasts and webinars were released monthly focusing on strengthening the continuous quality improvement of program systems and services to support and respond to DLLs ages birth to five The first webcast was viewed in 813 different sites with over 2000 individual viewers (Available at httpeclkcohsacfhhsgovhslctta-systemcultural-linguisticDual percent20Language percent20Learnersprof_devconferencesReadyforSuccesshtm)
4 The Multicultural Principles for Head Start Programs Serving Children Ages Birth to Five were updated and enhanced and translated into Spanish The publication describes 10 principles related to individualized services for both children and families Created for grantee program directors staff and the general public the guidelines presented can be incorporated into daily activities to ensure that every member of the Head Start community is respected and able to grow in an environment which is appreciative of individual differences (Available at httpeclkcohsacfhhsgovhslcresourcesECLKC_BookstoreMulticultural percent20Principles percent20for percent20Head percent20Start percent20Programshtm)
5 s part of the dministrations revisions to the Head Start Training and Technical Assistance System a National Center on Cultural and Linguistic Responsiveness
Report to Congress on DLLs in Head Start Page | 99
6
(NCCLR) was awarded in 2010 This center was established to provide the Head Start community with research-based information practices and strategies to ensure optimal academic and social progress for linguistically and culturally diverse children and their families Through user-friendly materials and training the center promotes strong language and literacy skills in childrens home language and in English local program planning that is culturally responsive and development of family resources that are linguistically and culturally appropriate In particular NLR has promoted the importance of supporting childrens home languages by developing tools and guidance to help staff identify and address the language needs of DLLs and their families For example NCCLR has created a guide to assist staff in gathering information from family members regarding a childs language background and guides presenting strategies for teachers to support childrens home and second language development (More information available at httpeclkcohsacfhhsgovhslctta-systemcultural-linguistic)
The Head Start Child Development and Early Learning Framework (Revised Child Outcomes Framework) was revised and published in 2010 Within the revised version there is clear information regarding the importance of gaining an understanding of what children who are dual language learners know and can do across all domains of the framework regardless of language spoken as well as an emphasis on English language development (More information available at httpeclkcohsacfhhsgovhslctta-systemteachingeecdAssessmentChild percent20OutcomesHS_Revised_Child_Outcomes_Frameworkpdf)
C DIRECTIONS FOR THE FUTURE
As the discussions above have highlighted more work is needed to develop improved more accurate assessments of the development of DLLs with stronger psychometric properties culturally validated and normed for the current DLL population in the US (Espinosa and Lopez 2007) The needed work includes at the very least improved assessment strategies and instruments to provide a better picture of DLLs language development across two languages but also basic research to ensure that we understand the development of DLLs in all domains The work to improve assessment and refine definitions among other necessary advances in methodology are ongoing not just under the auspices of ACF but also with support from a variety of federal and private sources and promise to enable research that more clearly describes developmental trajectories and outcomes for DLLs
The research activities discussed above along with the many current efforts in the field should help to enhance our understanding of young children who are dual language learners more generally not only those children served by Head Start programs By helping to establish standards and to make widely available valid tools and methods that support better data about young DLLs these projects ultimately aim to improve the state of knowledge about the best practices and environments to promote the development of young DLLs including children attending MSHS programs and programs in US Territories As these new projects unfold and as additional waves of Baby FACES and FACES data are collected and analyzed a fuller
Report to Congress on DLLs in Head Start Page | 100
assessment of the developmental progress of children in Early Head Start and Head Start both DLLs and children from monolingual English homes will be possible
While research capacity builds to improve our understanding and methods for promoting their development there are opportunities to strengthen the services offered to young DLLs and their families The findings in this report rely on descriptive data therefore we cannot draw causal inferences regarding relationships between the services received and experiences or outcomes among DLLs or their families In some areas such as in program services the implications of the data are stronger and suggest areas for renewed focus or effort in engaging families of DLLS targeting services in culturally sensitive ways improving efforts to address health and nutrition issues such as food insecurity and obesity and developing individual family plans) program activities and workshops and links to community resources in ways that are responsive to familys needs and preferences
In conclusion many efforts are currently underway to strengthen programs staff and the knowledge base to better serve all children and families in Head Start and Early Head Start programs including those who speak languages other than English at home Research activities that are building capacity to answer questions concerning young dual language learners and their families go hand in hand with programmatic efforts to improve services This report explores descriptive data from three current sources to present a comprehensive portrait of the experiences of children who are dual language learners and their families who are being served by Head Start and Early Head Start programs The nature of the data does not permit causal inferences but the data do draw our attention to important disparities and various opportunities to improve services for the substantial and rapidly expanding population of DLLs and their families who have turned to Head Start during this critical period of childrens lives
Head Starts guidance for programs emphasizes the importance of respecting and responding to the individual differences in needs and strengths among children and their families making comprehensive services available to all yet individualizing teaching and family support to promote growth foster new skills and strengthen goals and resources Just as in the definition provided in the Head Start Act this report sheds light on the heterogeneity within a group of families distinguished by their use of language Clearly DLLs and their families share many similar needs with children and families in the linguistic majority however they also tend to bring several meaningfully different needs and strengths that programs should be aware of in order to responsively and more effectively serve
Report to Congress on DLLs in Head Start Page | 101
i Elkin S Augustin R and Thomas D (2007) Findings from the PIR Validation Study Prepared for Department of
Health and Human Services Office of Head Start ii
Elkin S Augustin R and Thomas D (2007) Findings from the PIR Validation Study Prepared for Department of Health and Human Services Office of Head Start
Government Accountability Office (2008) Head Start A More Comprehensive Risk Management Strategy and Data Improvements Could Further Strengthen Program Oversight (GAO-08-221) Washington DC
iii National Research Council (2008) Early Childhood Assessment Why What and How Committee on Developmental Outcomes and Assessments for Young Children CE Snow and SB Van Hemel Editors Board on Children Youth and Families Board on Testing and Assessment Division of Behavioral and Social Sciences and Education Washington DC The National Academies Press
iv Center for Early Care and Education ResearchmdashDual Language Learners (CECER-DLL 2011) Research brief 3 Considerations for future research with young dual language learners Chapel Hill The University of North Carolina FPG Child Development Institute Author
v Center for Early Care and Education ResearchmdashDual Language Learners (CECER-DLL 2011) Research brief 2 Policy and practice issues related to serving dual language learners Summary from listening sessions Chapel Hill The University of North Carolina FPG Child Development Institute Author
vi Administration for Children and Families US Department of Health and Human Services (2008a) Supporting Positive Language and Literacy Development in Young Language Minority Children Research Policy and Practice Summary of Roundtable Meeting April 16-17 2008 Washington DC
Administration for Children and Families US Department of Health and Human Services (2008b) A Working Meeting on Recent School Readiness Research Guiding the Synthesis of Early Childhood Research October 21shy22 2008 Washington DC Meeting sponsored by the US Department of Health and Human Services Office of the Assistant Secretary for Planning and Evaluation and the Administration for Children and Families Office of Planning Research and Evaluation
Espinosa LM amp Lopez ML (2007) Assessment Considerations for Young English Language Learners Across Different Levels of Accountability Report prepared for Pew Task Force on Early Childhood Accountability amp First 5 LA Retrieved from httpwwwpewtrustsorgour_work_report_detailaspxid=31164
vii Government Accountability Office (2006) NO CHILD LEFT BEHIND ACT Assistance from Education Could Help States Better Measure Progress of Students with Limited English Proficiency GAO-06-815 Washington DC
Rabinowitz S amp Sato E (2005) Evidence-Based Plan Technical Adequacy of Assessments for Alternate Student Populations A Technical Review of High-Stakes Assessments for English Language Learners San Francisco CA WestEd
Sato E Rabinowitz S Worth P Gallagher C Lagunoff R amp Crane E (2007) Evaluation of the Technical Evidence of Assessments for Special Student Populations (Assessment and Accountability Comprehensive Center report) San Francisco WestEd
viii Espinosa LM amp Lopez ML (2007) Assessment Considerations for Young English Language Learners Across Different Levels of Accountability Report prepared for Pew Task Force on Early Childhood Accountability amp First 5 LA Retrieved from httpwwwpewtrustsorgour_work_report_detailaspxid=31164
Administration for Children and Families US Department of Health and Human Services (2008c) Supporting Positive Language and Literacy Development in Young Language Minority Children Research Policy and Practice Summary of Roundtable Meeting April 16-17 2008 Washington DC Meeting sponsored by the Administration for Children and Families US Department of Health and Human Services Retrieved from httpwwwacfhhsgovprogramsopreother_resrchlang_minorityindexhtml
ix Fernald A (2006) When Infants Hear Two Languages Interpreting Research on Early Speech Perception by Bilingual Children In McCardle P and Hoff E (Eds) Childhood Bilingualism Research on Infancy through School Age Multilingual Matters Ltd Buffalo
Report to Congress on DLLs in Head Start Page | 102
x Barrueco S Loacutepez ML Ong CA amp Lozano P (2012) Assessing SpanishndashEnglish Bilingual Preschoolers A Guide to Best Approaches and Measures Baltimore MD Brookes Publishing
Bedore LM Pentildea ED Garciacutea M amp Cortez C (2005) Conceptual versus monolingual scoring when does it make a difference Language Speech and Hearing Services in Schools 36(3)188-200
xi Administration for Children and Families (2011) Head Start University Partnerships-English Language Learners httpwwwacfhhsgovprogramsoprehsuniv_ptnerships_engindexhtml For more information view descriptions for two research projects in particular at New York University and University of South Florida
Lopez L Arango L and Feron John (2012) Positive Effects of Home and Classroom Variables on the Development of Bilingual Language Skills in Preschool Latino Children Paper presented at 2012 SRCD Themed Meeting Positive Development of Minority Children in Tampa FL
Melzi G McWayne C and Schick A (2012) Family Involvement and the Emergent Literacy Skills of Dual-Language Latino Children Poster presented at 2012 SRCD Themed Meeting Positive Development of Minority Children in Tampa FL
xii Administration for Children and Families (2009) Baby FACES Summary of Data Collection By Mode All Measures Washington DC US Department of Health and Human Services
xiii Harms T Clifford RM and Cryer D (2005) Early Childhood Environment Rating Scale Revised Edition New York Teachers College Press
xiv Harms T Cryer D and Clifford RM (2002) InfantToddler Environment Rating Scale Revised Edition New York Columbia University Teachers College Press 2002
xv Arnett J (1989) Caregivers in day-care centers Does training matter Journal of Applied Developmental Psychology 10541ndash552
xvi Pianta Robert LaParo K and Hamre B (2008) The Classroom Assessment Scoring System Pre-K Manual Charlottesville VA University of Virginia
xvii Roggman L A Cook G A Jump Norman V K Christiansen K Boyce L K Innocenti M S Aikens N Boller K Paulsell D amp Hallgren K (2010) Home Visit Rating Scales-Adapted (HOVRS-A) Unpublished document Princeton NJ Mathematica Policy Research
xviii Mashburn AJ Pianta RC Hamre BK Downer JT Barbarin OA Bryant D Burchinal M and Early DM
(2008) Measures of classroom quality in prekindergarten and childrens development of academic language and social skills Child Development 79(3)732-749
xix Espinosa L (2008) Challenging common myths about English language learners Alexandria VA National Association of State Boards of Education
xx Fenson L Pethick S Renda ox JL Dale PS and Reznick JS (2000) Short form versions of the Macrthur ommunicative Development Inventories Applied Psycholinguistics 2195-115
xxi Briggs-Gowan M and Carter A (2006) BITSEA Brief Infant-Toddler Social and Emotional Assessment examinerrsquos manual San Antonio Harcourt Assessment
xxii Duncan SE and DeAvila D (1998) Preschool Language ssessment Survey 2000 examinerrsquos manual English forms C and D Monterey CA CTBMcGraw-Hill
xxiii Dunn LM Dunn LL and Dunn DM (2006) Peabody Picture Vocabulary Test Fourth Edition examinerrsquos
manual and norms booklet Circle Pines MN American Guidance Service xxiv
Mason JM and Stewart J (1989) The CAP Early Childhood Diagnostic Instrument (prepublication edition) Iowa City IA American Testronics
xxv Woodcock RW Muntildeoz-Sandoval AF McGrew K Mather N and Schrank F (2004) Bateria III Woodcock-Munoz Itasca IL Riverside Publishing
xxvi Dunn LM Padilla ER Lugo DE and Dunn LM (1986) Test de Vocabulario en Imagenes Peabody Circle
Pines MN American Guidance Service xxvii
Roid GH and Miller LJ (1997) Examinerrsquos manual Leiter International Performance Scale-Revised Chicago Stoelting Co
Report to Congress on DLLs in Head Start Page | 103
xxviii McDermott PA Green LF Francis JM and Stott DH (2000) Preschool Learning Behaviors Scale
Philadelphia Edumetric and Clinical Science
Report to Congress on DLLs in Head Start Page | 104
Report to Congress on DLLs in Head Start Page | 105
Total
APPENDIX
Table II1 Prevalence of DLLs Overall and by Program Type 2007-2008
Number
of
Enrolled
Children
Percent of
Enrolled Children
Who Are DLLs
Number of Enrolled Children
Who Are DLLs
Overall 327972 306
Head Start 271153 288
Early Head Start 24459 257
MSHS 32360 892
AIAN 1680 71
Source 2007ndash2008 PIR
Note DLLs are children who live in homes where a language other than English is the
primary language spoken by the family at home
Table II2 Percentage of Dual Language Learners (DLLs) Served in Different Regions by Program Type 2007-2008
1
Report to Congress on DLLs in Head Start Page | 106
APPENDIX
Total Head Start Early Head Start MSHS AIAN
Number
of DLLs
Percent of
the Total
DLL
Enrollment in
Regiona
Number
of DLLs
Percent of
the Total
DLL
Enrollment in
Regionb
Number
of DLLs
Percent of
the Total
DLL
Enrollment in
Regionc
Number
of DLLs
Percent of
the Total
DLL
Enrollment in
Regiond
Number
of DLLs
Percent of
the Total
DLL
Enrollment in
Regione
Northeast 47816 145 42451 157 4132 169 1233 38 - 00
Midwest 41218 125 34643 128 3479 142 3038 94 58 35
South 75953 230 57523 212 4576 187 13553 419 301 179
West 21734 369 95752 353 10125 414 14536 449 1321 786
US Territories 42931 130 40784 150 2147 88 - 00 - 00
Source 2007-2008 PIR
Note DLLs are children who live in homes where a language other than English is the primary language spoken by the family at home
a
Total DLL enrollment = 329652
b
Total DLL enrollment = 271153
c
Total DLL enrollment = 24459
d
Total DLL enrollment = 32360
e
Total DLL enrollment = 1680
Total Number
of DLLs From Homes
Speaking Language
in Group
Percent of
Total
a
Enrollment
Percent of
DLL
b
EnrollmentLanguage Groups
Spanish 276824 258 844
Native Central American South American
Mexican and Caribbean Languages 7268 07 22
c
Asian Languages 18785 18 57
Pacific Island Languages 4829 05 15
Native North AmericanAlaska Native Languages 1526 01 05
European and Slavic Languages 6026 06 18
African Languages 5589 05 17
Other Languages 7125 07 22
Table II3 Prevalence of Various Language Groups Among Dual Language Learners (DLLs)
Across All Head Start Programs 2007-2008
Report to Congress on DLLs in Head Start Page | 107
APPENDIX
Source 2007ndash2008 PIR
Note DLLs are children who live in homes where a language other than English is the primary language spoken by the
family at home
a
Total enrollment = 1071734
b
DLL enrollment = 327972
c
Asian languages include Middle Eastern and South Asian languages (for example Arabic Hebrew
Hindi Urdu Bengali) as well as East Asian languages (for example Chinese Vietnamese Tagalog)
English 1000 00
Spanish NA 841
Native Central American South American Mexican or
Caribbean language NA 13
Asian language NA 51
Native North AmericanAlaska Native language NA 17
European or Slavic language NA 03
African language NA 28
Other NA 47
Table II4 Primary Language Spoken to Head Start Child at Home Fall 2006
Percent of Children
Children From
Monolingual
English Homes
(n = 1862)
Dual Language
Learners
(n = 942) Primary Language Spoken to the Child at Home
Report to Congress on DLLs in Head Start Page | 108
APPENDIX
Source Fall 2006 FACES Parent Interview
Notes Statistics are weighted to represent all children entering Head Start for the first
time in fall 2006
Children from monolingual English homes are children for whom English was the only
language spoken in the home as reported by parents DLLs are children who live in
homes where a language other than English (LOTE) was spoken in the home regardless of
which language was the primary language spoken by the family
NA = not applicable
Report to Congress on DLLs in Head Start Page | 109
Native Central American South American Mexican or
APPENDIX
Table II5 Language(s) Spoken to Early Head Start Children at Home Spring 2009
Percent of Children
Children From
Monolingual
English Homes
(n = 425)
Dual Language
Learners
(n = 220) Language(s) Spoken to the Child at Homea
English 1000 485
Spanish NA 913
Caribbean language NA 04
Asian language NA 00
Native North AmericanAlaska Native language NA 30
European or Slavic language NA 24
African language NA 19
Other NA 10
Source Spring 2009 Baby FACES Parent Interview
Notes Statistics are weighted to represent children near their first birthday who were
enrolled in Early Head Start programs in spring 2009
Children from monolingual English homes are children for whom English was the only
language spoken in the home as reported by parents DLLs are children who live in homes
where a language other than English (LOTE) was spoken in the home regardless of which
language was the primary language spoken by the family
NA = not applicable
a
Parents could indicate that they used more than one language when speaking to the child
Table II6 Language Spoken to Early Head Start Children by Family Members (Percent)
Spring 2009
Dual Language Learners
(n=220)
English 479 391 278 781
Spanish 923 799 867 667
Other language 66 40 82 37
Birth Mother Birth Father Grandparent Sibling
Report to Congress on DLLs in Head Start Page | 110
APPENDIX
Source Spring 2009 Baby FACES Parent Interview
Notes Statistics and weighting to represent children near their first birthday who were
enrolled in Early Head Start programs in Spring 2009
Percentages add to more than 100 because each family member could speak to their child
in more than one language
Children from monolingual English homes are children for whom English was the only
language spoken in the home as reported by parents DLLs are children who live in homes
where a language other than English (LOTE) was spoken in the home regardless of which
language was the primary language spoken by the family
Report to Congress on DLLs in Head Start Page | 111
languages
APPENDIX
Table II7 Prevalence of Various Non-English Language Groups by Program Type 2007-2008
Total Head Start Early Head Startb
MSHS AIAN
Number of
Children
Enrolled
Percent
of Total
a
Enrollment
Number of
Children
Enrolled
Percent
of Total
b
Enrollment
Number of
Children
Enrolled
Percent
of Total
c
Enrollment
Number of
Children
Enrolled
Percent
of Total
d
Enrollment
Number of
Children
Enrolled
Percent
of Total
e
EnrollmentLanguage Group
Spanish 276824 2527 225617 2400 20477 2148 30730 8472 352 149
Native Central American
South American Mexican and
Caribbean languages 7268 066 5351 057 371 039 1546 426 47 020
Asian languages 18785 172 17574 187 1205 126 6 002 9 004
Pacific Island languages 4829 044 4704 050 112 012 13 004 - 000
Native North American
Alaska Native languages 1526 014 1333 014 187 020 6 002 1110 470
European and Slavic 6026 055 5496 058 527 055 3 000 5 002
African languages 5589 051 4978 053 611 064 0 000 - 000
Other languages 7125 065 6100 065 969 102 56 015 157 067
Source 2007-2008 PIR
Note DLLs are children who live in homes where a language other than English is the primary language spoken by the family at home
a
Total enrollment=1095313
a
Total enrollment=940138
b
Total enrollment=95325
c
Total enrollment=36271
d
Total enrollment=23579
1000 920
Mother Born in US 980 137
Time in US if Mother Born Elsewhere
5 years or fewer 151 279
6 to 10 years 339 417
More than 10 years 511 304
Motherrsquos CountryArea of (non-US) Origin
Mexico 251 672
Central America 62 112
South America 22 64
Caribbean 326 29
Africa 32 53
Asia 53 64
Other 254 06
Father Born in US 974 102
Time in US if Father Born Elsewhere
5 years or fewer 161 193
6 to 10 years 312 378
More than 10 years 527 429
Fatherrsquos CountryArea of (non-US) Origin
Mexico 280 683
Central America 77 101
South America 58 70
Caribbean 219 24
Africa 183 53
Asia 65 62
Other 119 08
Parent Immigrant Status
Both Parents Born in US 950 58
One Parent Born Outside US 40 123
Both Parents Born Outside US 09 819
Table II8 Head Start Childrens Family Immigration Fall 2006
Percent of Children
Children From
Monolingual English
Homes
(n = 1862)
Dual Language
Learners
(n = 942) Characteristic
Child Born in US
Report to Congress on DLLs in Head Start Page | 112
APPENDIX
Source Fall 2006 FACES Parent Interview
Notes Statistics are weighted to represent all children entering Head Start for the first time in fall 2006
Children from monolingual English homes are children for whom English was the only language spoken in the home as reported by parents DLLs are children who live in homes where a language other than English (LOTE) was spoken in the home regardless of which language was the primary language spoken by the family
Child Born in US 1000 993
Mother Born in US 980 323
Time in US if Mother Born Elsewhere
5 years or fewer 153 291
6 to 10 years 179 453
More than 10 years 668 256
Motherrsquos CountryArea of (non-US) Origin
Mexico 260 809
Central America 47 82
South America 00 06
Caribbean 112 34
Africa 42 46
Asia 91 17
Other 447 06
Father Born in US 947 264
Time in US if Father Born Elsewhere
5 years or fewer 00 219
6 to 10 years 209 364
More than 10 years 791 417
Fatherrsquos CountryArea of (non-US) Origin
Mexico 320 764
Central America 00 118
South America 00 09
Caribbean 00 00
Africa 00 39
Asia 00 06
Other 00 06
Parent Immigrant Status
Both Parents Born in US 937 225
One Parent Born Outside US 57 134
Both Parents Born Outside US 07 641
Table II9 Early Head Start Childrens Family Immigration Spring 2009
Percent of Children
Children From
Monolingual English
Homes
(n = 425)
Dual Language
Learners
(n = 220) Characteristic
Page | 113
language was the primary language spoken by the family
APPENDIX
Source Spring 2009 Baby FACES Parent Interview
Notes Statistics are weighted to represent children near their first birthday who were enrolled
in Early Head Start programs in spring 2009
Children from monolingual English homes are children for whom English was the only
language spoken in the home as reported by parents DLLs are children who live in homes
where a language other than English (LOTE) was spoken in the home regardless of which
Report to Congress on DLLs in Head Start
Among parents whose first language is not English
Parent reads first language
Not at all NA 13
Not well NA 71
Well NA 376
Very well NA 541
Parent understands English
Not at all NA 148
Not well NA 477
Well NA 247
Very well NA 128
Parent reads English
Not at all NA 261
Not well NA 389
Well NA 241
Very well NA 109
Table II10 Head Start Childrens Parents Ability in First Language
and English Fall 2006
Percent of Children
Children From
Monolingual English
Homes
(n = 1862)
Dual Language
Learners
(n = 942) Characteristic
Report to Congress on DLLs in Head Start Page | 114
APPENDIX
Source Fall 2006 FACES Parent Interview
Notes Statistics are weighted to represent all children entering Head
Start for the first time in fall 2006
Children from monolingual English homes are children for whom English
was the only language spoken in the home as reported by parents DLLs
are children who live in homes where a language other than English
(LOTE) was spoken in the home regardless of which language was the
primary language spoken by the family
NA = not applicable
Among parents whose first language is not English
Parent Reads First Language
Not at all NA 33
Not well NA 33
Well NA 336
Very well NA 598
Parent Understands English
Not at all NA 102
Not well NA 468
Well NA 242
Very well NA 188
Parent Reads English
Not at all NA 222
Not well NA 374
Well NA 222
Very well NA 182
NA
Language Staff Usually Uses When Speaking to
a
Parent
English NA 178
Spanish NA 822
If English is Usually Used Someone Translated for
a
Parent So Parent Could Speak with Staff NA 665
If A Translator Was Not Used Parent Had Trouble
a
Understanding Staffs English NA 270
If A Translator Was Not Used Staff Had Trouble
a
Understanding Parent NA 203
Table II11 Early Head Start Childrens Parents Ability in First Language and English
Spring 2009
Characteristic
Children From
Monolingual
English Homes
(n = 425)
Percent of Children
Dual Language
Learners
(n = 220)
Report to Congress on DLLs in Head Start Page | 115
APPENDIX
Source Spring 2009 Baby FACES Parent Interview
Notes Statistics are weighted to represent children near their first birthday who were
enrolled in Early Head Start programs in spring 2009
Children from monolingual English homes are children for whom English was the only
language spoken in the home as reported by parents DLLs are children who live in homes
where a language other than English (LOTE) was spoken in the home regardless of which
language was the primary language spoken by the family
NA = not applicable
a
Among parents indicating they speak English not at all or not well
a a
Mother and Father 331 721
Married 234 489
Unmarried 95 230
Marital status not reported
a
Mother Only
a
Father Only
a a
Neither Mother Nor Father
03
577
30
62
02
257
13
09
Table II12 Head Start Childrens Family Structure Fall 2006
Percent of Children
Children From
Monolingual English
Homes
(n = 1862)
Dual Language
Learners
(n = 942) Children Living with
Report to Congress on DLLs in Head Start Page | 116
APPENDIX
Source Fall 2006 FACES Parent Interview
Notes Statistics are weighted to represent all children entering Head Start
for the first time in fall 2006
Children from monolingual English homes are children for whom English was
the only language spoken in the home as reported by parents DLLs are
children who live in homes where a language other than English (LOTE) was
spoken in the home regardless of which language was the primary language
spoken by the family
This table focuses on biologicaladoptive parents and does not include other
adults such as parentsrsquo romantic partners step-parents foster parents or
grandparents Thus for example the ldquoMother onlyrdquo category does not mean
that the mother is the only adult in the household but that she is the only
parent in the household
a
Includes both biological and adoptive parents
a b
Mother and Father 384 710
Married 234 373
Unmarried 149 337
Marital status not reported 02 00
a
Mother only 583 278
b
Father only 10 00
a b
Neither Mother nor Father 22 11
Table II13 Early Head Start Childrens Family Structure Spring 2009
Percent of Children
Children From
Monolingual English
Homes
(n = 425)
Dual Language
Learners
(n = 220) Children Living with
Report to Congress on DLLs in Head Start Page | 117
APPENDIX
Source Spring 2009 Baby FACES Parent Interview
Notes Statistics are weighted to represent children near their first birthday
who were enrolled in Early Head Start programs in spring 2009
This table focuses on biologicaladoptive parents and does not include other
adults such as parentsrsquo romantic partners step-parents foster parents or
grandparents Thus for example the ldquoMother onlyrdquo category does not mean
that the mother is the only adult in the household but that she is the only
parent in the household
Children from monolingual English homes are children for whom English was
the only language spoken in the home as reported by parents DLLs are
children who live in homes where a language other than English (LOTE) was
spoken in the home regardless of which language was the primary language
spoken by the family
a
Includes both biological and adoptive parents
Ethnicity
HispanicLatino 336 322 980 30
Non-HispanicLatino 664 678 20 970
Race
White 381 410 608 80
African American 310 249 05 07
American Indian or Alaska Native 38 55 48 851
Asian or Pacific Islander 28 19 00 06
Multi-RacialBi-Racial 65 85 22 30
Other 02 02 00 00
Unspecified 176 180 316 27
Family structure
Two-parent 422 407 750 588
Single-parent 578 594 251 412
Employment two-parent families
Both parents employed 250 276 673 375
One parent employed 610 559 224 412
Both parents not working 140 165 104 213
Employment single-parent families
Parent employed 580 535 757 571
Parent not working 420 465 243 429
Highest level of education completed by parents
Less than high school diploma 314 332 759 184
High school diploma or GED 436 397 184 486
degree 209 228 52 264
Bachelorrsquos degree or higher 41 04 05 57
Table II13a Demographic and Risk Factors of ChildrenFamilies By Program Type (Percent of
Children and Families) 2007-2008
Head Start Early Head Start MSHS AIAN
Report to Congress on DLLs in Head Start Page | 118
Some collegevocationalan Associate
APPENDIX
Source 2007-2008 PIR Data as of May 2009
Note DLLs are children who live in homes where a language other than English is the primary language spoken by the family at home
Number of Adults in Household
1 384 118
2 477 589
3 or more 139 293
Mean Number of Adults 18 24
Number of Children in Household
1 195 150
2 368 361
3 256 262
4 or more 181 228
Mean Number of Children 25 27
Mean Number of Siblings 14 15
Younger Sibling(s) in Household 248 247
Older Sibling(s) in Household 725 735
Total Number of Persons in Household
2 77 20
3 213 99
4 289 283
5 221 266
6 123 152
7 or more 78 180
Mean Number of Persons 44 51
Intergenerational Household 151 131
Table II14 Head Start Childrens Household Size and Membership Fall 2006
Percent of Children
Children From
Monolingual English
Homes
(n = 1862)
Dual Language
Learners
(n = 942) Household Size and Membership
Report to Congress on DLLs in Head Start Page | 119
APPENDIX
Source Fall 2006 FACES Parent Interview
Note Statistics are weighted to represent all children entering Head Start for the
first time in fall 2006
This table shows the total number of adults in childrenrsquos households including
biologicaladoptive parents and other adults such as parentsrsquo romantic partners
step-parents foster parents and grandparents
Children from monolingual English homes are children for whom English was the
only language spoken in the home as reported by parents DLLs are children who
live in homes where a language other than English (LOTE) was spoken in the
home regardless of which language was the primary language spoken by the
family
Number of Adults in Household
0 06 00
1 394 193
2 484 693
3 or more 115 114
Mean Number of Adults 17 21
Number of Children in Household
1 293 101
2 322 282
3 234 361
4 or more 151 256
Mean Number of Children 23 29
Total Number of Persons in Household
2 135 20
3 245 120
4 289 295
5 159 247
6 92 195
7 or more 79 123
Mean Number of Persons 41 50
Intergenerational Household 182 127
Table II15 Early Head Start Childrens Household Size and Membership
Spring 2009
Percent of Children
Children From
Monolingual English
Homes
(n = 425)
Dual Language
Learners
(n = 220) Household Size and Membership
Report to Congress on DLLs in Head Start Page | 120
APPENDIX
Source Spring 2009 Baby FACES Parent Interview
Notes Statistics are weighted to represent children near their first birthday who
were enrolled in Early Head Start programs in spring 2009
This table shows the total number of adults in childrenrsquos households including
biologicaladoptive parents and other adults such as parentsrsquo romantic partners
step-parents foster parents and grandparents
Children from monolingual English homes are children for whom English was the
only language spoken in the home as reported by parents DLLs are children who
live in homes where a language other than English (LOTE) was spoken in the
home regardless of which language was the primary language spoken by the
family
Report to Congress on DLLs in Head Start Page | 121
APPENDIX
Table II16 Motherrsquos Age at Head Start Childrsquos Birth Fall 2006
Percent of Children
Children From
Monolingual English
Homes
(n = 1862)
Dual Language
Learners
(n = 942) Mothers Age in Years
17 or under 56 21
18-19 129 73
20-24 404 339
25-29 221 269
30 or older 190 298
Mean Age 245 267
Source Fall 2006 FACES Parent Interview
Notes Statistics are weighted to represent all children entering Head
Start for the first time in fall 2006
Children from monolingual English homes are children for whom
English was the only language spoken in the home as reported by
parents DLLs are children who live in homes where a language other
than English (LOTE) was spoken in the home regardless of which
language was the primary language spoken by the family
Report to Congress on DLLs in Head Start Page | 122
APPENDIX
Table II17 Motherrsquos Age at Early Head Start Childs Birth Spring
2009
Percent of Children
Children From
Monolingual English
Homes
(n = 425)
Dual Language
Learners
(n = 220) Age in Years
Mean Age 239 262
17 or under 113 99
18-19 140 63
20-24 352 253
25-29 234 268
30 or older 161 318
Source Spring 2009 Baby FACES Parent Interview
Notes Statistics are weighted to represent children near their first
birthday who were enrolled in Early Head Start programs in spring 2009
Children from monolingual English homes are children for whom
English was the only language spoken in the home as reported by
parents DLLs are children who live in homes where a language other
than English (LOTE) was spoken in the home regardless of which
language was the primary language spoken by the family
Table II18 Head Start Childrens Parents Education Fall 2006
Percent of Children
Highest Level of Education of Biological or
Adoptive Parents Living with Child
Children from
Monolingual English
Homes
(n = 1862)
Dual Language
Learners
(n = 942)
a
Percentage of Children Living with their Mother 909 978
a
Mothers
Less than high school diploma 292 598
High school diploma or GED 359 239
Some collegevocationaltechnical 290 99
Bachelorrsquos degree or higher 59 64
a
Percentage of Children Living with their Father 361 734
a
Fathers
Less than high school diploma 288 661
High school diploma or GED 424 211
Some collegevocationaltechnical 209 55
Bachelorrsquos degree or higher 78 73
a
Percentage of Children Living with Either Parent 938 991
a
Highest Level of Education Completed by those Parents
lt high school 249 529
High school or GED 375 264
Some postsecondary 301 111
Bachelorrsquos degree or higher 74 96
Report to Congress on DLLs in Head Start Page | 123
Highest Level of Education Completed by those
Highest Level of Education Completed by those
APPENDIX
Source Fall 2006 FACES Parent Interview
a
Includes both biological and adoptive parents
Notes Statistics are weighted to represent all children entering Head Start for the first time in
fall 2006
Households that do not include a mother andor father are not included in the relevant
percentage calculations
Children from monolingual English homes are children for whom English was the only
language spoken in the home as reported by parents DLLs are children who live in homes
where a language other than English (LOTE) was spoken in the home regardless of which
language was the primary language spoken by the family
Table II19 Early Head Start Childrens Parents Education Spring 2009
Percent of Children
Children From
Monolingual
nglish Homes
(n = 425)
Dual Language
Learners
(n = 220)
Highest Level of Education of Biological or Adoptive Paren
Living with Child
E
a
Percent of Children Living with their Mother 968 989
a
Highest Level of Education Completed by those Mothers
Less than high school diploma 315 536
High school diploma or GED 358 252
Some collegevocationaltechnical 289 157
Bachelorrsquos degree or higher 38 54
a
Percent of Children Living with their Father 394 710
a
Highest Level of Education Completed by those Fathers
Less than high school diploma 320 594
High school diploma or GED 481 268
Some collegevocationaltechnical 137 93
Bachelorrsquos degree or higher 61 45
a
Percent of Children Living with Either Parent 978 989
a
Highest Level of Education Completed by those Parents
Less than high school diploma 181 381
High school diploma or GED 437 325
Some collegevocationaltechnical 302 213
Bachelorrsquos degree or higher 80 81
Report to Congress on DLLs in Head Start Page | 124
ts
APPENDIX
Source Spring 2009 Baby FACES Parent Interview
a
Includes both biological and adoptive parents
Notes Statistics are weighted to represent children near their first birthday who were
enrolled in Early Head Start programs in spring 2009
Households that do not include a mother andor father are not included in the relevant
percent calculations
Children from monolingual English homes are children for whom English was the only
language spoken in the home as reported by parents DLLs are children who live in homes
where a language other than English (LOTE) was spoken in the home regardless of which
language was the primary language spoken by the family
a
Percentage of Children Living with their Mother 909 978
a
Employment Status of those Mothers
Working full-time 358 230
Working part-time 205 167
Looking for work 174 84
Not in labor force 262 519
a
Percentage of Children Living with their Father 361 734
a
Employment Status of those Fathers
Working full-time 659 770
Working part-time 132 146
Looking for work 90 45
Not in labor force 118 40
Percentage of Children Living with Either Parent 938 991
a
Employment Status of the Most Employed of those Parents
Working full-time 530 701
Working part-time 177 148
Looking for work 154 50
Not in labor force 139 101
Table II20 Head Start Childrens Parents Employment Status Fall 2006
Percent of Children
Children From
Monolingual English
Homes
(n = 1862)
Dual Language
Learners
(n = 942) Employment Status of Biological or Adoptive
eport to CoR ngress on DLLs in Head Start Page | 125
Parents Living with Child
a
APPENDIX
Source Fall 2006 FACES Parent Interview
a
Includes both biological and adoptive parents
Notes Statistics are weighted to represent all children entering Head Start for the first
time in fall 2006
Households that do not include a mother andor father are not included in the relevant
percentage calculations
Children from monolingual English homes are children for whom English was the only
language spoken in the home as reported by parents DLLs are children who live in
homes where a language other than English (LOTE) was spoken in the home regardless
of which language was the primary language spoken by the family
Report to Congress on DLLs in Head Start Page | 126
APPENDIX
Table II21 Early Head Start Childrens Parents Employment Status Spring 2009
Percent of Children
Children From
Monolingual English
Homes
(n = 425)
Dual Language
Learners
(n = 220)
Employment Status of Biological or Adoptive Parents
Living with Child
Percent of Children Living with their Mothera
968 989
Employment Status of those Mothersa
Working full-time 218 127
Working part-time 240 181
Looking for work 209 204
Not in labor force 334 487
Percent of Children Living with their Fathera
394 710
Employment Status of those Fathersa
Working full-time 465 612
Working part-time 133 148
Looking for work 165 105
Not in labor force 236 135
Percent of Children Living with Either Parenta
978 989
Employment Status of the Most Employed of
those Parentsa
Working full-time 571 639
Working part-time 196 163
Looking for work 157 101
Not in labor force 76 97
Source Spring 2009 Baby FACES Parent Interview
a
Includes both biological and adoptive parents
Notes Statistics are weighted to represent children near their first birthday who were
enrolled in Early Head Start programs in spring 2009
Households that do not include a mother andor father are not included in the relevant
percent calculations
Only parents of children in the Age 1 Cohort were asked about the language(s) used when
speaking to the child at home Reported estimates in these tables represent children in
this cohort only
Children from monolingual English homes are children for whom English was the only
language spoken in the home as reported by parents DLLs are children who live in homes
where a language other than English (LOTE) was spoken in the home regardless of which
language was the primary language spoken by the family
Table II22 Head Start Childrens Household Income as a Percentage of the
Federal Poverty Threshold Fall 2006
Percent of Children
Children From
Monolingual English
Homes
(n = 1862)
Dual Language
Learners
(n = 942) Income as a Percentage of Poverty
50 percent or less 171 174
51 to 100 percent 378 466
101 to 130 percent 155 170
131 to 185 percent 155 133
186 to 200 percent 27 12
201 percent or above 115 45
Report to Congress on DLLs in Head Start Page | 127
APPENDIX
Source Fall 2006 FACES Parent Interview
Notes Statistics are weighted to represent all children entering Head Start for
the first time in fall 2006
This table summarizes household income and therefore should not be used to
estimate eligibility for Head Start Head Start qualifying criteria are based on
family (not household) income and there are other (non-income) ways to
qualify for the program
Children from monolingual English homes are children for whom English was
the only language spoken in the home as reported by parents DLLs are
children who live in homes where a language other than English (LOTE) was
spoken in the home regardless of which language was the primary language
spoken by the family
Report to Congress on DLLs in Head Start Page | 128
APPENDIX
Table II23 Early Head Start Childrens Household Income as a Percent of the
Federal Poverty Threshold Spring 2009
Percent of Children
Children From
Monolingual English
Homes
(n = 425)
Dual Language
Learners
(n = 220) Income as a Percent of Poverty
50 percent or less 270 269
51 to 100 percent 381 492
101 to 130 percent 105 143
131 to 185 percent 103 70
186 to 200 percent 40 02
201 percent or above 101 25
Source Spring 2009 Baby FACES Parent Interview
Notes Statistics are weighted to represent children near their first birthday who
were enrolled in Early Head Start programs in spring 2009
This table summarizes household income and therefore should not be used to
estimate eligibility for Head Start Head Start qualifying criteria are based on family
(not household) income and there are other (non-income) ways to qualify for the
program
Children from monolingual English homes are children for whom English was the
only language spoken in the home as reported by parents DLLs are children who
live in homes where a language other than English (LOTE) was spoken in the home
regardless of which language was the primary language spoken by the family
Table II24 Public Assistance Received by Any Member of Head Start
Childrens Household Fall 2006
Percent of Children
Children From
Monolingual English
Homes
(n = 1862)
Dual Language
Learners
(n = 942) Type of Public Assistance
Welfare 264 146
Food Stamps 632 310
WIC 533 743
SSI 175 45
Report to Congress on DLLs in Head Start Page | 129
APPENDIX
Source Fall 2006 FACES Parent Interview
Notes Statistics are weighted to represent all children entering Head Start
for the first time in fall 2006
Children from monolingual English homes are children for whom English
was the only language spoken in the home as reported by parents DLLs
are children who live in homes where a language other than English
(LOTE) was spoken in the home regardless of which language was the
primary language spoken by the family
Table II25 Public Assistance Received by Any Member of Early Head Start
Childs Household Spring 2009
Percent of Children
Children From
Monolingual English
Homes
(n = 425)
Dual Language
Learners
(n = 220) Type of Public Assistance
Welfare 312 295
Food Stamps 662 522
WIC 850 921
SSI 139 64
Report to Congress on DLLs in Head Start Page | 130
APPENDIX
Source Spring 2009 Baby FACES Parent Interview
Notes Statistics are weighted to represent children near their first birthday who
were enrolled in Early Head Start programs in spring 2009
Children from monolingual English homes are children for whom English was the
only language spoken in the home as reported by parents DLLs are children who
live in homes where a language other than English (LOTE) was spoken in the home
regardless of which language was the primary language spoken by the family
Could not pay the full amount of gas oil or electricity
bills 330 310
Could not pay the full amount of rent or mortgage 291 319
Had service disconnected by the telephone company
because payments were not made 174 235
Had services turned off by the gas or electric company
or oil company would not deliver oil 87 98
Was evicted from home or apartment 76 38
Parent has
Zero financial security difficulty 541 520
One financial security difficulty 170 123
Two financial security difficulties 151 242
Three financial security difficulties 76 69
Four financial security difficulties 51 44
Five financial security difficulties 11 02
Table II26 Early Head Start Childrens Family Financial Difficulties Spring 2009
Percent of Children
Chidren From
Monolingual
English Homes
(n = 425)
Dual Language
Learners
(n = 220) Financial Security Areas of Difficulty
Report to Congress on DLLs in Head Start Page | 131
APPENDIX
Source Spring 2009 Baby FACES Parent Interview
Notes Statistics are weighted to represent children near their first birthday who were
enrolled in Early Head Start programs in spring 2009
Children from monolingual English homes are children for whom English was the only
language spoken in the home as reported by parents DLLs are children who live in homes
where a language other than English (LOTE) was spoken in the home regardless of which
language was the primary language spoken by the family
Report to Congress on DLLs in Head Start Page | 132
APPENDIX
Table II27 Early Head Start Childrens Food Security Difficulties Spring 2009
Percent of Children
Children From
Monolingual
English Homes
(n = 425)
Dual Language
Learners
(n = 220) Food Security Difficulties
Worried food may run out 314 484
Food didnt last and didnt have money to get more 214 380
Relied on only a few kinds of low-cost food to feed
children because of financial reasons 176 417
Couldnt afford to eat balanced meals 191 389
Couldnt feed children a balanced meal for financial
reasons 125 307
Parent has
Zero or one food security difficulty 735 486
Two or three food security difficulties 144 221
Four or five food security difficulties 12 293
Source Spring 2009 Baby FACES Parent Interview
Notes Statistics are weighted to represent children near their first birthday who were
enrolled in Early Head Start programs in spring 2009
Children from monolingual English homes are children for whom English was the only
language spoken in the home as reported by parents DLLs are children who live in homes
where a language other than English (LOTE) was spoken in the home regardless of which
language was the primary language spoken by the family
Report to Congress on DLLs in Head Start Page | 133
BehavioralEmotional Impairment
Percent of Children with
al impairment
APPENDIX
Table II28 Disability Categories for Head Start Children with Disabilities Fall 2006
Percent of Children
Children From
Monolingual
English Homes
(n = 1862)
Dual Language
Learners (DLLs)
(n = 942)
DLLs without
English Proficiency
(n = 435) Characteristic
Percent of Children
Children with Disabilities 1384 750 934
Percent of Children with Disabilities
Speech or Language Impairment 7334 7602 8185
Cognitive Impairmenta
2231 2060 2571
b
1472 832 784
Sensory Impairmentc
1177 1304 689
Physical Impairmentd
852 423 478
Child has IEP or ISFP 3824 5308 5278
Disabilities Having Multiple
Impairments 2130 1902 2006
Source Fall 2006 FACES Teacher Child Report
Notes Statistics are weighted to represent all children entering Head Start for the first time
in fall 2006
Teachers were asked whether a professional had indicated that the child had a
developmental problem delay or other special need and to indicate the specific need or
disability
Percentages do not add to 100 because children can be reported to have more than one
impairment across the impairment categories
Children from monolingual English homes are children for whom English was the only
language spoken in the home as reported by parents DLLs are children who live in homes
where a language other than English (LOTE) was spoken in the home regardless of which
language was the primary language spoken by the family
a
Cognitive Impairment includes the following mental retardation autismpervasive
b
BehavioralEmotional Impairment includes behavior problems hyperactivity and ADHD
c
Sensory Impairment includes deafness other hearing impairment blindness and other visu
d
Physical Impairment includes motor impairment
Report to Congress on DLLs in Head Start Page | 134
APPENDIX
Table II29 Head Start Childrsquos Health Care Fall 2006
Percent of Children
Children From
Monolingual English
Homes
(n = 1862)
Dual Language
Learners
(n = 942) Childs Health Care
Regular medical checkup in past year 987 990
Regular dental checkup in past year 860 919
Has health insurance 963 908
Private 432 569
Medicaid 752 661
SCHIPa
97 64
Other government 37 35
Source Fall 2006 FACES Parent Interview
a
State Childrenrsquos Health Insurance Program
Notes Statistics are weighted to represent all children entering Head Start for
the first time in fall 2006
Children from monolingual English homes are children for whom English was
the only language spoken in the home as reported by parents DLLs are
children who live in homes where a language other than English (LOTE) was
spoken in the home regardless of which language was the primary language
spoken by the family
Report to Congress on DLLs in Head Start Page | 135
APPENDIX
Table II30 Early Head Start Childrsquos Health Care Spring 2009
Percent of Children
Children From
Monolingual
English
Homes
(n = 425)
Dual Language
Learners
(n = 220) Childs Health Care
Regular Medical Checkup in Past Year 1000 1000
Child Ever Visited Dentist 215 275
Has Health Insurance 970 950
Private 386 236
Medicaid 750 768
SCHIPa
365 188
Other government 33 10
Source Spring 2009 Baby FACES Parent Interview
a
State Childrenrsquos Health Insurance Program
Notes Statistics are weighted to represent children near their first birthday
who were enrolled in Early Head Start programs in spring 2009
Children from monolingual English homes are children for whom English was
the only language spoken in the home as reported by parents DLLs are
children who live in homes where a language other than English (LOTE) was
spoken in the home regardless of which language was the primary language
spoken by the family
Table II31 Child Care Arrangements in Addition to Head Start Fall 2006
Report to Congress on DLLs in Head Start Page | 136
APPENDIX
Percent of Children
Children From
Monolingual English
Homes
(n = 1862)
Dual Language
Learners
(n = 942) Child Care Arrangements
Any child care 115 260
Type of primary child care arrangement
Center-based care 245 43
Relative 39 156
Non-relative 03 60
Equal time in multiple types of care 402 01
Source Fall 2006 FACES Parent Interview
Notes Statistics are weighted to represent all children entering Head Start for
the first time in fall 2006
Percentages do not sum to 100 Estimates reflect prevalence across all children
including those who are not in child care outside of Head Start
Children from monolingual English homes are children for whom English was
the only language spoken in the home as reported by parents DLLs are children
who live in homes where a language other than English (LOTE) was spoken in the
home regardless of which language was the primary language spoken by the
family
Table II32 Child Care Arrangements in Addition to Early Head Start Spring 2009
Report to Congress on DLLs in Head Start Page | 137
APPENDIX
Percent of Children
Children From
Monolingual English
Homes
(n = 425)
Dual Language
Learners
(n = 220) Child Care Arrangements
Any Child Care 724 578
Type of Primary Child Care Arrangement
Center-based care 75 38
Relative 662 766
Non-relative 139 126
Equal time in multiple types of care 124 69
Source Spring 2009 Baby FACES Parent Interview
Notes Statistics are weighted to represent children near their first birthday who were
enrolled in Early Head Start programs in spring 2009
Children from monolingual English homes are children for whom English was the
only language spoken in the home as reported by parents DLLs are children who live
in homes where a language other than English (LOTE) was spoken in the home
regardless of which language was the primary language spoken by the family
a
Table II33 Depressive Symptoms Among Parents of Head Start Children Fall
2006
Percent of Children
Children From
Monolingual English
Homes
(n = 1862)
Dual Language
Learners
(n = 942) Depressive Symptoms among Parents
b
Degree of depressive symptoms
Not depressed 516 725
Mildly depressed 274 156
Moderately depressed 115 62
Severely depressed 94 56
Mean number of depressive symptoms 61 35
Report to Congress on DLLs in Head Start Page | 138
APPENDIX
Source Fall 2006 FACES Parent Interview
Notes Statistics are weighted to represent all children entering Head Start for the
first time in fall 2006
Children from monolingual English homes are children for whom English was the
only language spoken in the home as reported by parents DLLs are children who
live in homes where a language other than English (LOTE) was spoken in the home
regardless of which language was the primary language spoken by the family
a
In this table the term ldquoparentrdquo is used to refer to the primary caregiver who
responded to the survey Most are parents but some are grandparents or other
primary caregivers
b
Center for Epidemiologic StudiesndashDepression Scale (CES-D Radloff 1977) Total
score can range from 0 to 36 Scores ranging from 0 to 4 are coded as Not
Depressed from 5 to 9 as Mildly Depressed from 10 to 14 as Moderately
Depressed and 15 and above as Severely Depressed
a
Table II34 Depressive Symptoms Among Parents of Early Head Start Children
Spring 2009
Percent of Children
Children From
Monolingual English
Homes
(n = 425)
Dual Language
Learners
(n = 220) Depressive Symptoms among Parents
b
Degree of Depressive Symptoms
Not depressed 552 704
Mildly depressed 266 167
Moderately depressed 111 99
Severely depressed 71 30
Mean Number of Depressive Symptoms 57 41
Report to Congress on DLLs in Head Start Page | 139
APPENDIX
Source Spring 2009 Baby FACES Parent Interview
Notes Statistics are weighted to represent children near their first birthday who
were enrolled in Early Head Start programs in spring 2009
Children from monolingual English homes are children for whom English was the
only language spoken in the home as reported by parents DLLs are children who
live in homes where a language other than English (LOTE) was spoken in the home
regardless of which language was the primary language spoken by the family
a
In this table the term ldquoparentrdquo is used to refer to the primary caregiver who
responded to the survey Most are parents but some are grandparents or other
primary caregivers
b
Center for Epidemiologic StudiesndashDepression Scale (CES-D Radloff 1977) Total
score can range from 0 to 36 Scores ranging from 0 to 4 are coded as Not
Depressed from 5 to 9 as Mildly Depressed from 10 to 14 as Moderately Depressed
and 15 and above as Severely Depressed
Table II35 Early Head Start Childrens Parental Modernity and Use of Spanking
Spring 2009
Report to Congress on DLLs in Head Start Page | 140
APPENDIX
Parental Modernity and Child Spanking
Percent of Children
Children From
Monolingual
English
Homes
(n=542)
Dual Language
Learners
(n=171)
Parental Modernity Scale
Traditional Attitudes 197 199
Progressive Attitudes 206 193
Parent spanked the child in the past week 145 64
Source Spring 2009 Baby FACES Parent Interview
Notes Statistics are weighted to represent children and pregnant women enrolled in
sampled Early Head Start programs in spring 2009 and whose birthdates or due dates
fell within study-eligible windows
Children from monolingual English homes are children for whom English was the only
language spoken in the home as reported by parents DLLs are children who live in
homes where a language other than English (LOTE) was spoken in the home regardless
of which language was the primary language spoken by the family
Table III1 Program Approach for Receipt of Early Head Start Services Spring
2009
Percent of Children
Children From
Monolingual English
Homes
(n=425)
Dual Language
Learners
(n=220) Program Approach
Center-based 485 323 Home-based 501 568 Family child care 00 20 Combination
a
14 89
APPENDIX
Source Spring 2009 Baby FACES Program Director Interview
a
Combination programs refer to programs offering both center-based and home-based
services to all enrolled families Specifically these programs provide center-based care
plus home visits monthly or more often
Notes Statistics are weighted to represent children near their first birthday who were
enrolled in Early Head Start programs in spring 2009
Children from monolingual English homes are children for whom English was the only
language spoken in the home as reported by parents DLLs are children who live in
homes where a language other than English (LOTE) was spoken in the home regardless
of which language was the primary language spoken by the family
Report to Congress on DLLs in Head Start Page | 141
APPENDIX
Table III2 Head Start Program Type and Prior Enrollment in Early Head Start Fall
2006
Percent of Children
Children From
Monolingual English
Homes
(n = 1862)
Dual Language
Learners
(n = 942) Characteristic
Head Start Program Type
Full-day 572 317
Part-day 422 668
Enrolled in Early Head Start 122 178
Mean months enrolled in Early Head Start 121 60
Source Fall 2006 FACES Parent Interview
Notes Statistics are weighted to represent all children entering Head Start for the first
time in fall 2006
Children from monolingual English homes are children for whom English was the only
language spoken in the home as reported by parents DLLs are children who live in
homes where a language other than English (LOTE) was spoken in the home regardless
of which language was the primary language spoken by the family
Report to Congress on DLLs in Head Start Page | 142
APPENDIX
Table III3 Typical Early Head Start Center Operation Hours and Schedule Spring
2009
Percent of Children
Children From
Monolingual English
Homes
n=425
Dual Language
Learners
n=220 Operation Hours and Schedule
Up to 6 hours per day 43 89
More than 6 up to 8 hours per day 144 225
More than 8 up to 10 hours per day 267 290
More than 10 hours per day 546 397
Full day year round 819 650
Part day year round 16 214
Full day part of year 165 136
Part day part of year 00 00
Source Spring 2009 Baby FACES Program Director Interview
Notes Statistics are weighted to represent children near their first birthday who were
enrolled in Early Head Start programs in spring 2009
Children from monolingual English homes are children for whom English was the only
language spoken in the home as reported by parents DLLs are children who live in
homes where a language other than English (LOTE) was spoken in the home
regardless of which language was the primary language spoken by the family
Report to Congress on DLLs in Head Start Page | 143
Table III4 Percentage of Children Enrolled in Different Types of Programs in
Migrant and Seasonal Head Start (MSHS) and American IndianAlaska Native (AIAN)
Programs 2007-2008
APPENDIX
Type of program MSHS AIAN
Center based program 5 days per week
Full day 957 223
Part day 00 79
Center based program 4 days per week
Full day 00 301
Part day 01 305
Home-based program 00 78
Combination program 01 06
Family child care 41 01
Locally designed options 00 07
Source 2007-2008 PIR
Notes Combination program is a program providing services in both a center-based
setting and in a home setting
Head Start Early Head Start and MSHS are mutually exclusive program types AIAN can
include either Head Start or Early Head Start programs
DLLs are children who live in homes where a language other than English is the primary
language spoken by the family at home
Report to Congress on DLLs in Head Start Page | 144
Table III5 Child Care Quality in Early Head Start InfantToddler Environment Rating
Scales and Observed ChildAdult Ratios Spring 2009
Mean
Children From
Monolingual English
Homes
(n=27)
Dual Language
Learners
(n=77) Scales
Group Size 51 57
ChildAdult Ratio 24 23
Total 38 39
Personal Care 31 30
Furnishings 38 40
LanguageListening amp Talking 42 46
InteractionSocial 46 47
Program Structure 42 43
Activities 35 36
Motor
Creative
APPENDIX
Source Spring 2009 Baby FACES Classroom Observations
Notes Statistics are weighted to represent children near their first birthday who were
enrolled in Early Head Start programs in spring 2009
Children from monolingual English homes are children for whom English was the only
language spoken in the home as reported by parents DLLs are children who live in homes
where a language other than English (LOTE) was spoken in the home regardless of which
language was the primary language spoken by the family
Report to Congress on DLLs in Head Start Page | 145
ECERS-R Totala
360 350 350 1 ndash 7
Personal Care 240 220 220 1 ndash 7
Furnishings 442 437 437 1 ndash 7
Language 378 380 377 1 ndash 7
Motor Skills 347 339 337 1 ndash 7
Creative 350 340 340 1 ndash 7
Social 440 444 441 1 ndash 7
Program Structure 393 374 369 1 ndash 7
b
ECERS-R Teaching and Interactions 408 404 402 1 ndash 7
b
ECERS-R Provisions for Learning 361 344 340 1 ndash 7
Arnett Lead Teacher Total 6646 6736 6779 0 ndash 90
Sensitivity 1804 1718 1709 0 ndash 30
Harshness 2341 2402 2425 0 ndash 27
Detachment 1022 1056 1060 0 ndash 12
Permissiveness 710 711 724 0 ndash 9
Independence 767 849 856 0 ndash 12
CLASS Instructional Support 200 190 190 1 ndash 7
Concept Development 182 175 171 1 ndash 7
Quality of Feedback 202 197 196 1 ndash 7
Language Modeling 214 205 208 1 ndash 7
ChildAdult Ratio 637 688 676 NA
Group Size 1497 1518 1479 NA
Table III6 Classroom Quality in Head Start Spring 2007
Mean
DLLs Who Did
Not Pass
English
Screener
(n = 435)
Children From
Monolingual
English Homes
(n = 1862)
Possible
Response
Range
Dual Language
Learners (DLLs)
(n = 942) Scales
APPENDIX
Source Spring 2007 FACES Classroom Observation
Notes Statistics are weighted to represent all children entering Head Start for the first time in fall
2006 and who were still enrolled in spring 2007
Children from monolingual English homes are children for whom English was the only language spoken
in the home as reported by parents DLLs are children who live in homes where a language other than
English (LOTE) was spoken in the home regardless of which language was the primary language spoken
by the family
a
Construction of ECERS-R subscale scores is similar to prior FACES and may not be consistent with the
publishers specifications for scoring
b
The Provisions for Learning and Teaching and Interactions subscales are two factors reported in the
Multi-State Study of Prekindergarten as representing the key dimensions of quality tapped by the full
ECERS-R Scores are alternative dimensions of quality using the ECERS-R
Report to Congress on DLLs in Head Start Page | 146
APPENDIX
Table III7 Daily or Almost Daily Frequency of Reading and Language Activities as
Reported by Head Start Classroom Teachers Fall 2006
Percent of Children
Children From
Monolingual
English Homes
(n = 1862)
DLLs Who Did Not
Pass English
Screener
(n = 435)
Dual Language
Learners (DLLs)
(n = 942)
Reading and Language Activity
Letter naming 893 844 820
Writing letters 644 629 575
Discuss new words 824 711 669
Dictate stories to adult 554 558 512
Work on phonics 674 675 642
Listen and see print 949 905 887
Listendonrsquot see the print 253 209 190
Retell stories 572 618 560
Conventions of print 758 753 735
Write own name 762 732 687
Learn about rhyming 502 545 536
Learn prepositions 676 698 722
Source Fall 2006 FACES Teacher Interview
Notes Statistics are weighted to represent all children entering Head Start for the first time
in fall 2006
Children from monolingual English homes are children for whom English was the only
language spoken in the home as reported by parents DLLs are children who live in homes
where a language other than English (LOTE) was spoken in the home regardless of which
language was the primary language spoken by the family
Report to Congress on DLLs in Head Start Page | 147
Table III8 Daily or Almost Daily Frequency of Math Activities as Reported by Head Start Classroom
Teachers Fall 2006
APPENDIX
Percent of Children
Children From
Monolingual English
Homes
(n = 1862)
Dual Language
Learners (DLLs)
(n = 942)
DLLs Who Did Not
Pass English Screener
(n = 435) Math Activity
Count out loud 977 957 962
Geometric manipulatives 818 849 835
Counting manipulatives 836 801 783
Math-related games 622 704 679
Music to understand math 622 668 676
Movementdrama 542 624 648
Measuring instruments 519 522 561
Calendar-related activities 876 833 832
Telling time 488 546 532
Shapes and patterns 791 828 832
Source Fall 2006 FACES Teacher Interview
Notes Statistics are weighted to represent all children entering Head Start for the first time in fall 2006
Children from monolingual English homes are children for whom English was the only language spoken in
the home as reported by parents DLLs are children who live in homes where a language other than English
(LOTE) was spoken in the home regardless of which language was the primary language spoken by the
family
Report to Congress on DLLs in Head Start Page | 148
Languages Spoken by Adults During Home Visits
English 1000 702
Spanish 135 765
Other 14 41
Childs Home Language Used During Home Visits 1000 893
Languages Spoken by Adults in Classroom
English 998 984
Spanish 274 814
Other 41 74
Childs Home Language Used in Classroom 998 852
Non-English Language Spoken in Classroom By
Lead teacher 216 691
Assistant teacher 150 472
Classroom aide 49 303
VolunteerNon staff 23 192
Language Used Most Often to Read to Children in
Classroom
English 996 918
Spanish 04 82
Other language 00 00
How TeacherHome Visitor Communicates with
Families Who Speak a Language They Do Not Speak
Use only English 752 516
Informal interpreter 667 667
Physical cuesgestures 664 744
Bilingual documents 59 75
Booksdictionaries 30 28
Draw pictures 32 67
Any other ways 136 143
Table III9 Languages Used in Early Head Start Classrooms and Home Visits Spring 2009
Percentage of Children
Children From
Monolingual English
Homes
(n = 425)
Dual Language
Learners
(n = 220) Characteristic
APPENDIX
Source Spring 2009 Baby FACES Home Visitor Program Director Teacher Interviews
Notes Statistics are weighted to represent children near their first birthday who were enrolled in
Early Head Start programs in spring 2009
Children from monolingual English homes are children for whom English was the only language
spoken in the home as reported by parents DLLs are children who live in homes where a
language other than English (LOTE) was spoken in the home regardless of which language was
the primary language spoken by the family
Report to Congress on DLLs in Head Start Page | 149
Childs home language used for classroom
instruction 999 595 655
Language(s) used for classroom instruction
English 999 983 977
Spanish 110 582 665
Asian language 11 10 08
Other language 37 57 59
Table III10 Languages Used in Head Start Classrooms Fall 2006
Percent of Children
Children From
Monolingual E nglish
Homes
(n = 1862)
Dual La nguage
Learners (DLLs)
(n = 942)
DLLs Who Did Not
Pass English Screener
(n = 435) Characteristic
APPENDIX
Source Fall 2006 FACES Teacher Interview
Notes Statistics are weighted to represent all children entering Head Start for the first time in fall 2006
Children from monolingual English homes are children for whom English was the only language spoken in
the home as reported by parents DLLs are children who live in homes where a language other than English
(LOTE) was spoken in the home regardless of which language was the primary language spoken by the
family
Report to Congress on DLLs in Head Start Page | 150
Staff speaking childrsquos home
language available in program NA 847 915
Child wants someone in program
to speak hisher home language NA 374 522
Table III11 Languages Used in Head Start Programs and by Staff Fall 2006
Percent of Children
Children From
Monolingual English
Homes
(n = 1862)
DLLs Who Did Not
Pass English
Screener
(n = 435)
Dual Language
Learners (DLLs)
(n = 942) Characteristic
APPENDIX
Source Fall 2006 FACES Parent Interview
Notes Statistics are weighted to represent all children entering Head Start for the first time in fall
2006
Children from monolingual English homes are children for whom English was the only language
spoken in the home as reported by parents DLLs are children who live in homes where a language
other than English (LOTE) was spoken in the home regardless of which language was the primary
language spoken by the family
NA = not applicable
Report to Congress on DLLs in Head Start Page | 151
APPENDIX
Table III12 Language of Non-Supervisory Child Development Staff in Migrant and Seasonal Head
Start (MSHS) and American IndianAlaska Native (AIAN) Programs (Percent of Staff) 2007-2008
Mean
(SD) Range
MSHS
Proficient in a language other than English 570
(292)
0-100
AIAN
Proficient in a language other than English 206
(299)
0-100
Source 2007-2008 PIR
Notes Non-supervisory child development staff includes teachers assistant teachers home-based
visitors and family child care teachers
DLLs are children who live in homes where a language other than English is the primary language
spoken by the family at home
Report to Congress on DLLs in Head Start Page | 152
Mean Number of Non-Focus Children
Participating in Visit 08 07
Mean Number of Adults Participating in Visit 16 10
Home Visit Conducted in (Percent)
English 994 371
Spanish 32 734
Other Language 12 00
If Home Visit Conducted in Language Other than
English Interpreter Used (Percent) 00 36
Length of Home Visit (minutes) 848 817
Home Visit Activities (Percent)
ChildParent ObservationAssessment 682 585
Feedback on Parent-Child Interactions 487 346
Provision of Education andor Information 752 605
Problem Solving 408 350
Goal SettingPlanning 500 524
Crisis Intervention 97 33
Facilitate Parent-Child Interaction 425 500
Observation of Parent-Child Interactions 406 394
Provision of Emotional Support to Parent 338 292
Play 796 820
Other 51 28
Home Visit Time per Topic (Percent)
Child-Focused Activities 476 501
ParentFamily-Focused Activities 177 184
Parent-Child-Focused Activities 135 157
Staff-Family Relationship-Building Activities 155 120
Crisis Management Activities 52 40
Alignment of Home Visit Activities with Planned
Activities 43 43
Table III13 Home Visit Characteristics in Early Head Start Spring 2009
Mean or Percent
Children From
Monolingual English
Homes
(n=189)
Dual Language
Learners
(n=126) Characteristics
APPENDIX
Source Spring 2009 Baby FACES Home Visit Observations
Notes Statistics are weighted to represent children near their first birthday who were
enrolled in Early Head Start programs in spring 2009
Children from monolingual English homes are children for whom English was the only
language spoken in the home as reported by parents DLLs are children who live in homes
where a language other than English (LOTE) was spoken in the home regardless of which
language was the primary language spoken by the family
Report to Congress on DLLs in Head Start Page | 153
HOVRS-A Overall Quality 33 36
Visitor Strategies Quality 31 34
Responsiveness to Family 30 32
Relationship with Family 40 41
Faciltiation of Parent-Child Interaction 28 32
Non-Intrusiveness 27 32
Effectiveness Quality 35 38
Parent-Child Interaction 32 36
Parent Engagement 32 33
Child Engagement 41 46
Observer Rating of Visit Quality 32 37
Table III14 Observed Home Visit Quality in Early Head Start Spring 2009
Percent of Children
Children From
Monolingual English
Homes
(n = 189)
Dual Language
Learners
(n = 126) Math Activity
a
APPENDIX
Source Spring 2009 Baby FACES Home Visit Observations
Notes Statistics are weighted to represent children near their first birthday who were
enrolled in Early Head Start programs in spring 2009
Children from monolingual English homes are children for whom English was the
only language spoken in the home as reported by parents DLLs are children who
live in homes where a language other than English (LOTE) was spoken in the home
regardless of which language was the primary language spoken by the family
a HOVRS-A = Home Visit Rating Scales-Adapted
Report to Congress on DLLs in Head Start Page | 154
Percent of Children
Children with Disabilities 138 75 93
Percent of Children with Disabilities
Speech or Language Impairment 733 760 818
a
Cognitive Impairment 223 206 257
b
BehavioralEmotional Impairment 147 83 78
c
Sensory Impairment 118 130 69
d
Physical Impairment 85 42 48
Child has IEP or ISFP 382 531 528
Percent of Children with Disabilities
Having Multiple Impairments 213 190 201
Table III15 Disability Categories for Head Start Children with Disabilities Fall 2006
Percent of Children
Children From
Monolingual English
Homes
(n = 1862)
Dual Language
Learners (DLLs)
(n = 942)
DLLs Who Did Not Pass
English Screener
(n = 435) Characteristic
APPENDIX
Source Fall 2006 FACES Teacher Child Report
Notes Statistics are weighted to represent all children entering Head Start for the first time in fall 2006
Teachers were asked whether a professional had indicated that the child had a developmental problem delay or other special need and to indicate the specific need or disability
Percentages do not add to 100 because children can be reported to have more than one impairment across the impairment categories
Children from monolingual English homes are children for whom English was the only language spoken in the home as reported by parents DLLs are children who live in homes where a language other than English (LOTE) was spoken in the home regardless of which language was the primary language spoken by the family
a
Cognitive Impairment includes the following mental retardation autismpervasive developmental b
BehavioralEmotional Impairment includes behavior problems hyperactivity and ADHD c
Sensory Impairment includes deafness other hearing impairment blindness and other visual impairment d
Physical Impairment includes motor impairment
Report to Congress on DLLs in Head Start Page | 155
Percent of Children
Children From Monolingual
English Homes
(n=425)
Dual Language
Learners
(n=220) Type of Service
a
Table III16 Services Provided by Early Head Start Programs Referral or Community Partners
Spring 2009
Employment assistance 973 994
Education or job training 989 994
Legal assistance 970 996
Housing assistance 1000 1000
Financial counseling 1000 1000
Family literacy services 1000 1000
Pediatrician services 976 989
Adult health care 954 987
Disability services for parents 936 981
Dental care 983 989
Substance abuse services 984 1000
Mental health screenings 989 994
Mental health assessments 1000 1000
Therapy 1000 1000
Care coordination 945 982
Staff consultationfollow-up 1000 1000
TrainingTechnical assistanceSupport for staff 85 94
TrainingAwarenessSupport groups for families
Other mental health service
131 199
81 155
APPENDIX
Source Spring 2009 Baby FACES Program Director Interview
Notes Statistics are weighted to represent children near their first birthday who were enrolled in
Early Head Start programs in spring 2009
Children from monolingual English homes are children for whom English was the only language
spoken in the home as reported by parents DLLs are children who live in homes where a language
other than English (LOTE) was spoken in the home regardless of which language was the primary
language spoken by the family
a
For each service program directors were asked to indicate whether the service was provided
directly by Early Head Start staff by a referral or by a community partner on- or off-site
Report to Congress on DLLs in Head Start Page | 156
Program offers or makes available any of the
following services for DLLs 791 984
Services offered among programs offering services for DLLs
Assessment of English 500 557
Assessment of readingwriting 481 537
Activitiesworkshops for parents 493 643
Help applying for medical insurance 900 989
Help scheduling pre-k screening 818 896
Information about Head Start 941 1000
Information about adult ESL 908 981
Information on community resources 927 996
Help obtaining health services 941 1000
Table III17 Early Head Start Program Services Offered for Dual Language Learners
(DLLs) Spring 2009
Percent of Children
Children From
Monolingual English
Homes
(n=425)
Dual Language
Learners
(n=220) Services for DLLs
APPENDIX
Source Spring 2009 Baby FACES Program Director Interview
Notes Statistics are weighted to represent children near their first birthday who were enrolled
in Early Head Start programs in spring 2009
Children from monolingual English homes are children for whom English was the only
language spoken in the home as reported by parents DLLs are children who live in homes
where a language other than English (LOTE) was spoken in the home regardless of which
language was the primary language spoken by the family
Report to Congress on DLLs in Head Start Page | 157
Mother currently enrolled in program course class or
workshop 314 215
Father currently enrolled in program course class or workshop 139 95
Head Start helped mother take or locate programs courses classes or workshops 122 188
Head Start helped father take or locate programs courses classes or workshops 34 94
During past year family received
Help finding good child care 206 205
Help getting to and from work or other places 140 110
Disability services 55 47
Short-term help getting or paying for things you need in
an emergency 167 128
Help finding a job 91 105
Education or job training 95 102
Help with a legal problem 58 30
Help finding or paying for housing 110 79
Counseling on how to manage money 102 87
Training on how to read and write 15 64
Classes to learn English 09 231
Health services 154 330
Table III18 Early Head Start Parent Education and Training Experiences and Family Receipt of
Community Services Spring 2009
Percent of Children
Children From
Monolingual English
Homes
(n=425)
Dual Language
Learners
(n=220) Characteristic
APPENDIX
Source Spring 2009 Baby FACES Parent Interview
Notes Statistics are weighted to represent children near their first birthday who were enrolled in
Early Head Start programs in spring 2009
Children from monolingual English homes are children for whom English was the only language
spoken in the home as reported by parents DLLs are children who live in homes where a language
other than English (LOTE) was spoken in the home regardless of which language was the primary
language spoken by the family
Report to Congress on DLLs in Head Start Page | 158
Head Start helped parent find a regular health
care provider for child 59 109 81
Head Start provided information on health
care providers 597 754 576
Head Start made referrals to health care
providers 322 196 373
Head Start provided health care directly 59 33 52
Head Start provided other type of assistance
in finding health care providers 22 17 00
Community or government services family
currently receives
Help with housing 116 38 48
Training for a job 24 19 16
Help finding a job 40 28 25
Help to go to school or college 61 52 58
ESL classes 06 152 153
Transportation to or from work or training 16 18 17
Child care 84 49 34
Alcohol or drug treatment or counseling 04 04 03
Advice from a lawyer 28 07 04
Mental health services or counseling 35 16 11
Help dealing with family violence 08 15 12
Help or counseling for other family problems 24 14 06
Dental or orthodontic care 124 83 89
Head Start made parents aware of or helped
them obtain
Housing 11 03 04
Job training Job search assistance
Transportation to or from work or training 08 04 04
School assistance 06 01
ESL classes 01 30 30
Child care 07 04 01
Counseling or other assistance (includes
Alcohol or drug treatment or counseling
Legal advice Mental health services Help
dealing with family violence and Help or
counseling for other family problems) 10 06 04
Dental or orthodontic care 29 20 18
One or more of these services (type not
specified) 44 52 63
Any of these services 116 119 125
None of these services 884 881 875
Table III19 Types of Services H ead Start Programs Provide Families Spring 2007
Percent of Children
Children From
Monolingual English
Homes
(n = 1862)
DLLs Who Did Not
Pass English
Screener
(n = 435)
Dual Language
Learners (DLLs)
(n = 942) Characteristic
Report to Congress on DLLs in Head Start Page | 159
APPENDIX
Source Spring 2007 FACES Parent Interview
Notes Statistics are weighted to represent all children entering Head Start for the first time in fall 2006 and who
were still enrolled in spring 2007
Children from monolingual English homes are children for whom English was the only language spoken in the
home as reported by parents DLLs are children who live in homes where a language other than English (LOTE)
was spoken in the home regardless of which language was the primary language spoken by the family
APPENDIX
Table III20 Head Start Childrens Parents Participation in Education and Training Activities
Spring 2007
Percent of Children
Characteristic
Children From
Monolingual English
Homes
(n = 1862)
Dual La nguage
Learners (DLLs)
(n = 942)
DLLs Who Did Not
Pass English Screener
(n = 435)
Mother currently enrolled in program
course class or workshop 288 189 176
Father currently enrolled in program
course class or workshop 174 91 53
Head Start helped mother take or
locate programs courses classes
or workshops 25 59 46
Head Start helped father take or
locate programs courses classes
workshops 02 06 07
Source Spring 2007 FACES Parent Interview
Notes Statistics are weighted to represent all children entering Head Start for the first time in fall 2006 and
who were still enrolled in spring 2007
Estimates in this table reflect the characteristics of childrens parents after the childs first (or only) year in the
Head Start program
Children from monolingual English homes are children for whom English was the only language spoken in the
home as reported by parents DLLs are children who live in homes where a language other than English
(LOTE) was spoken in the home regardless of which language was the primary language spoken by the
family
Report to Congress on DLLs in Head Start Page | 160
APPENDIX
Table III21 Percentage of Families Who Received Family Services Through the Program Or
Through Referrals within Migrant and Seasonal Head Start (MSHS) Programs 2007-2008
Service Percent of Families
Emergencycrisis intervention (meeting immediate needs for
food clothing or shelter) 120
Housing assistance (subsidies utilities repairs etc) 50
Transportation assistance 158
Mental health services 96
English as a Second Language (ESL) training 148
Adult education (GED programs college selection) 76
Job training 42
Substance abuse prevention or treatment 47
Child abuse and neglect services 68
Domestic violence services 45
Child support services 12
Health education (including prenatal education) 388
Assistance to families of incarcerated individuals 09
Parenting education 421
Marriage education services 39
At least one of the services listed above 580
Source 2007-2008 PIR
Notes Head Start Early Head Start and MSHS are mutually exclusive program types
DLLs are children who live in homes where a language other than English is the primary
language spoken by the family at home
Report to Congress on DLLs in Head Start Page | 161
APPENDIX
Table III22 Percentage of Children Who Were Served by the Mental Health (MH)
Professional(s) within Migrant and Seasonal Head Start (MSHS) Programs 2007-2008
Mental Health Service Percent of Children
MH professional consulted with program staff about the
childrsquos behaviormental health 55
MH professionals provided three or more consultations with
program staff 13
MH professional consulted with parent(s) about the childrsquos
behaviormental health 14
MH professionals provided three or more consultations with
parent(s) 07
MH professional provided an individual mental health
assessment
MH professional facilitated a referral for MH services
Referred for MH services outside of the program
11
09
08
of children who received MH services 04
Source 2007-2008 PIR
Note DLLs are children who live in homes where a language other than English is the
primary language spoken by the family at home
Report to Congress on DLLs in Head Start Page | 162
Table III23 Early Head Start Family Activities and Events Spring 2009
Percent of Children
Children From
Monolingual English
Homes
(n=425)
Dual Language
Learners
(n=220) Type of Activity
a
Group socializations 1000 1000
Events for the entire family 1000 1000
Workshops on parenting 993 1000
Materials or workshops on child sleep practices 971 966
Literacy activities 50 109
Transition activities 75 06
Other activities 96 88
Activities to involve fathers or father figures
Events or activities specifically for fathers 763 671
Efforts to include fathers in home visits or group
socializations 968 974
Employment or job training services for fathers 466 385
APPENDIX
Source Spring 2009 Baby FACES Program Director Interview
Notes Statistics are weighted to represent children near their first birthday who were enrolled in
Early Head Start programs in spring 2009
Children from monolingual English homes are children for whom English was the only language
spoken in the home as reported by parents DLLs are children who live in homes where a
language other than English (LOTE) was spoken in the home regardless of which language was
the primary language spoken by the family
a
Among home-based or combination programs
Report to Congress on DLLs in Head Start Page | 163
Family attended group activities for parents and their
children 678 795
Family attended workshops on job skills 135 310
Family attended parent education meetings or
workshops on raising children 365 573
Family attended events just for menfathers 118 177
Family volunteered in an Early Head Start classroom 368 473
Family attended an Early Head Start social event 61 637
Family participated on the Policy Council 159 157
Family volunteered to help out at program or served
on a committee but not in a classroom or on Policy
Council 19 197
Family took part in center activities in some other way 203 92
APPENDIX
Table III24 Family Involvement in Early Head Start Program Activities Spring 2009
Activity
Percent of Children
Children From
Monolingual English
Homes
(n=425)
Dual Language
Learners
(n=220)
Source Spring 2009 Baby FACES Parent Interview
Notes Statistics are weighted to represent children near their first birthday who were enrolled in
Early Head Start programs in spring 2009
Children from monolingual English homes are children for whom English was the only language
spoken in the home as reported by parents DLLs are children who live in homes where a
language other than English (LOTE) was spoken in the home regardless of which language was
the primary language spoken by the family
Report to Congress on DLLs in Head Start Page | 164
Report to Congress on DLLs in Head Start Page | 165
APPENDIX
Table III25 Satisfaction with Head Start Spring 2007
Percent of Children
Children From
Monolingual English
Homes
(n = 1 862)
Dual Language
Learners (DLLs)
(n = 9 42)
DLLs Who Did Not
Pass English Screener
(n = 4 35) Characteristic
Parent Very Satisfied With Head Start in
Helping child develop 829 879 877
Identifyingproviding services 831 824 823
Maintaining a safe program 869 844 835
Preparing child for kindergarten 821 860 865
Parent Satisfaction With Head Start - Child Related Subscalea
Mean 380 382 383
Possible response range 1-4 1-4 1-4
Parent Very Satisfied With Head Start in
Being open to parents participation 756 789 787
Respecting culture and background 8398 8382 8376
Identifyingproviding familiy services 6478 6042 5904
Supporting community involvement 559 633 654
Parent Satisfaction With Head Start - Family Related Subscaleb
Mean 362 364 365
Possible response range 1-4 1-4 1-4
Experiences Parents Report Always
Child feels safe in Head Start (A) 867 872 872
Child gets lots of individual attention (B) 544 612 604
Teacher open to new information (C) 789 824 846
Child happy in Head Start (D) 823 886 889
Teacher warm towards child (E) 843 835 825
Child treated with respect by teachers (F) 890 900 905
Teacher takes interest in child (G) 834 849 850
Child feels accepted by teacher (H) 877 891 898
Teacher supportive of parent (I) 877 864 868
Parent feels welcomed by teacher (K) 887 918 931
Teacher handles discipline matters easily without
being harsh (L) 850 850 849
Teacher seems happy and content (M) 828 877 894
Aide warm towards child (N) 864 886 905
Parent and Child Experiences in Head Startc
Mean 376 378 378
Possible response range 1-4 1-4 1-4
Source Spring 2007 FACES Parent Interview
Notes Statistics are weighted to represent all children entering Head Start for the first time in fall 2006 and who were still
enrolled in spring 2007
Children from monolingual English homes are children for whom English was the only language spoken in the home as
reported by parents DLLs are children who live in homes where a language other than English (LOTE) was spoken in the
home regardless of which language was the primary language spoken by the family
a
The Child Related Subscale is based on items A D F and G For each item a response of Very Dissatisfied contributed 1
point to the scale Somewhat Dissatisfied contributed 2 points Somewhat Satisfied contributed 3 points and Very
Satisfied contributed 4 points to the scale
b
The Family Related Subscale is based on items B C E and H For each item a response of Very Dissatisfied contributed
1 point to the scale Somewhat Dissatisfied contributed 2 points Somewhat Satisfied contributed 3 points and Very
Satisfied contributed 4 points to the scale
c
This composite is based on the 13 items listed above it For each item a response of Never contributed 1 point to the
scale Sometimes contributed 2 points Often contributed 3 points and Always contributed 4 points to the scale
APPENDIX
Table III26 Characteristics of Early Head Start Programs Formal Written Partnerships Spring
2009
Language
Other than
English
in Home
(LOTE)
n=258
Primary
Language
Other than
English in Home
(LOTE-P)
n=220
Monolingial
English Home
in Home
n=425
Percent of Children
Characteristic
Program has a formal written partnership
with child care provider 366 376 392
Program has a formal written partnership
with a Part C agency 962 737 717
Source Spring 2009 Baby FACES Program Director Interview
Notes Statistics are weighted to represent children near their first birthday who were enrolled in
Early Head Start programs in spring 2009
Children from monolingual English homes are children for whom English was the only language
spoken in the home as reported by parents DLLs are children who live in homes where a language
other than English (LOTE) was spoken in the home regardless of which language was the primary
language spoken by the family
Report to Congress on DLLs in Head Start Page | 166
Gender
Female 1000 1000
Male 00 00
RaceEthnicity
White 603 821 260
African-American 244 90 143
HispanicLatino 93 42 502
AIAN 07 06 00
Asian or Pacific Islander 09 06 11
Multi-RacialBi-Racial 35 30 68
Other 07 05 16
a
Mean CES-D Short Form Scale Score 29 41
CES-D Short Form Categories
Not depressed 803 751
Mildly depressed 161 85
Moderately depressed 09 108
Severely depressed 26 56
APPENDIX
Table IV1 Early Head Start Teacher Demographic and Background Characteristics Spring
2009
Percent of Children
Children From
Monolingual English
Homes
(n = 217)
Dual Language
Learners
(n = 78) Teacher Background
Source Spring 2009 Baby FACES Caregiver Interview
Notes Statistics are weighted to represent children near their first birthday who were enrolled in
Early Head Start programs in spring 2009
Children from monolingual English homes are children for whom English was the only language
spoken in the home as reported by parents DLLs are children who live in homes where a
language other than English (LOTE) was spoken in the home regardless of which language was
the primary language spoken by the family
a
The Center for Center for Epidemiologic Studies Depression Scale (CES-D Radloff 1977) Total
score can range from 0 to 36 Scores ranging from 0 to 4 are coded as Not Depressed from 5 to
9 as Mildly Depressed from 10 to 14 as Moderately Depressed and 15 and above as Severely
Depressed
Report to Congress on DLLs in Head Start Page | 167
Gender
Female 991 1000
Male 09 00
RaceEthnicity
White non-Hispanic 821 167
African-American non-Hispanic 90 30
HispanicLatino 42 730
American Indian or Alaska Native non-Hispanic 06 18
Asian or Pacific Islander 06 18
Multi-RacialBi-Racial non-Hispanic 30 29
Other 05 08
b
Mean CES-D Short Form Scale Score 37 26
CES-D Short Form Categories
Not depressed 661 785
Mildly depressed 221 174
Moderately depressed 108 41
Severely depressed 10 00
APPENDIX
a
Table IV2 Early Head Start Home Visitor Demographic and Background Characteristics
Spring 2009
Percent of Children
Children From
Monolingual English
Homes
(n = 198)
Dual Language
Learners
(n = 136) a
Home Visitor Background
Source Spring 2009 Baby FACES Home Visitor Interview
Note Statistics are weighted to represent children near their first birthday who were enrolled in
Early Head Start programs in spring 2009
Children from monolingual English homes are children for whom English was the only language
spoken in the home as reported by parents DLLs are children who live in homes where a
language other than English (LOTE) was spoken in the home regardless of which language was
the primary language spoken by the family
a
The term home visitor refers to frontline staff working in a home-based setting with primary
responsibility for one or more children
b
The Center for Center for Epidemiologic Studies Depression Scale (CES-D Radloff 1977) Total
score can range from 0 to 36 Scores ranging from 0 to 4 are coded as Not Depressed from 5 to
9 as Mildly Depressed from 10 to 14 as Moderately Depressed and 15 and above as Severely
Depressed
Report to Congress on DLLs in Head Start Page | 168
Gender
Female 971 996 997
Male 29 04 03
Age
18 ndash 29 177 163 182
30 ndash 39 247 287 373
40 - 49 338 310 220
50 - 59 198 210 195
60 or Older 40 31 30
RaceEthnicity
White non-Hispanic 472 294 267
African-American non-Hispanic 446 149 122
HispanicLatino 59 471 538
American Indian or Alaska Native
non-Hispanic 01 21 28
Asian or Pacific Islander 09 33 25
Multi-RacialBi-Racial non-Hispanic 04 11 09
Other 09 20 11
a
Mean CES-D Short Form Scale Score 46 39 41
CES-D Short Form Categories
Not depressed 609 710 718
Mildly depressed 255 173 148
Moderately depressed 94 66 74
Severely depressed 42 51 60
Table IV3 Lead Head Start Teacher Demographic Characteristics and Depressive Symptoms Fall
2006
APPENDIX
Percent of Children
Children From
Monolingual English
Homes
(n = 1862)
DLLs Who Did Not
Pass English
Screener
(n = 435)
Dual Language
Learners (DLLs)
(n = 942) Teacher Background
Source Fall 2006 FACES Teacher Interview
Notes Statistics are weighted to represent all children entering Head Start for the first time in fall 2006
Children from monolingual English homes are children for whom English was the only language spoken in
the home as reported by parents DLLs are children who live in homes where a language other than
English (LOTE) was spoken in the home regardless of which language was the primary language spoken by
the family
a
The Center for Center for Epidemiologic Studies Depression Scale (CES-D Radloff 1977) Total score can
range from 0 to 36 Scores ranging from 0 to 4 are coded as Not Depressed from 5 to 9 as Mildly
Depressed from 10 to 14 as Moderately Depressed and 15 and above as Severely Depressed
Report to Congress on DLLs in Head Start Page | 169
Years Working in Early Head Start
0-1 Years 90 37
1-2 Years 257 261
3-4 Years 255 223
5-9 Years 270 335
10+ Years 128 143
Highest Level of Education
Less than High School 18 31
High School Diploma or Equivalent 58 128
Some College 244 288
Associatersquos Degree (AA) 368 247
Bachelorrsquos Degree (BA) 301 306
Graduate or Professional Degree 09 00
Field of Study Includes Early Childhood Education or
Child Development 653 445
Has a CDAa
489 676
Has a State-Awarded Preschool Certificate or License 370 370
Currently Enrolled in Child Care Related Training 508 516
Teacher Experience
Mean Years Working in Early Head Start 47 51
Mean Years TeachingCaring for InfantsToddlers 77 58
APPENDIX
Table IV4 Early Head Start Teacher Qualifications and Earnings Spring 2009
Percent of Children
Children From
Monolingual English
Homes
(n = 217)
Dual Language
Learners (DLLs)
(n = 78) Teacher Education and Credentials
Source Spring 2009 Baby FACES Teacher Interview
Notes Statistics are weighted to represent children near their first birthday who were enrolled
in Early Head Start programs in spring 2009
Children from monolingual English homes are children for whom English was the only language
spoken in the home as reported by parents DLLs are children who live in homes where a
language other than English (LOTE) was spoken in the home regardless of which language was
the primary language spoken by the family
a
CDA = Child Development Associate credential
Report to Congress on DLLs in Head Start Page | 170
Years Working in Early Head Start
0-1 Years 75 113
1-2 Years 188 303
3-4 Years 150 153
5-9 Years 407 378
10+ Years 180 53
Highest Level of Education
Less than High School 21 18
High School Diploma or Equivalent 09 21
Some College 156 248
Associatersquos Degree (AA) 258 244
Bachelorrsquos Degree (BA) 448 383
Graduate or Professional Degree 108 87
Field of Study Includes Early Childhood Education 722 642
Has a CDA 405 450
Has a State-Awarded Certificate 324 450
Currently Enrolled in Child Care Related Training 324 357
Home Visitor Experience
Mean Years Working in Early Head Start 56 44
Mean Years TeachingCaring for InfantsToddlers 103 69
a
Table IV5 Early Head Start Home Visitor Qualifications and Earnings Spring 2009
Percent of Children
Children From
Monolingual English
Homes
(n = 198)
Dual Language
Learners
(n = 136) a
Home Visitor Education and Credentials
APPENDIX
Source Spring 2009 Baby FACES Home Visitor Interview
Notes Statistics are weighted to represent children near their first birthday who were enrolled in
Early Head Start programs in spring 2009
Children from monolingual English homes are children for whom English was the only language
spoken in the home as reported by parents DLLs are children who live in homes where a
language other than English (LOTE) was spoken in the home regardless of which language was
the primary language spoken by the family
a
The term home visitor refers to frontline staff working in a home-based setting with primary
responsibility for one or more children
Report to Congress on DLLs in Head Start Page | 171
Years Teaching in Head Start
1-2 Years 170 151 163
3-4 Years 123 105 73
5-9 Years 403 334 376
10+ Years 304 410 388
Highest Level of Education
High School Diploma or Equivalent 22 45 41
Some College 162 89 86
Associatersquos Degree (AA) 364 495 561
Bachelorrsquos Degree (BA) 418 336 271
Graduate or Professional Degree 34 34 41
Of Those with an AA or Higher Highest
Degree is in Early Childhood Education 455 283 280
Of Those with an AA or Higher Completed 6+
a
Courses in Early Childhood Education 918 880 892
Has a CDA 538 595 602
Has a State-Awarded Preschool Certificate 229 468 457
Has a Teaching Certificate or License 364 590 564
Currently Enrolled in Teacher Related Training 392 416 438
Average Experience and Salary of Childrenrsquos Teachers
Mean Years Teaching in Head Start 849 859 847
Mean Years in Current Program 806 765 755
Mean Years Teaching 1208 1266 1248
Mean Annual Salary (in dollars) 2247305 2658018 2629590
APPENDIX
Table IV6 Lead Head Start Teacher Qualifications and Earnings Fall 2006
Percent of Children
Children From
Monolingual English
Homes
(n = 1862)
Dual Language
Learners (DLLs)
(n = 942)
DLLs Who Did Not
Pass English Screener
(n = 435)
Teacher Education Credentials and
Earnings
Source Fall 2006 FACES Teacher Interview
Notes Statistics are weighted to represent all children entering Head Start for the first time in fall 2006
Children from monolingual English homes are children for whom English was the only language spoken in the
home as reported by parents DLLs are children who live in homes where a language other than English (LOTE)
was spoken in the home regardless of which language was the primary language spoken by the family
a
Includes coursework in early childhood education regardless of academic major
Report to Congress on DLLs in Head Start Page | 172
Highest Level of Education
High School or GED 84 111
AA Degree 108 139
BA Degree 561 476
Postgraduate Degree 254 274
Has a CDA 08 25
Has a State-Awarded Preschool Certificate or License 30 43
Table IV7 Early Head Start Program ManagerSupervisor Education and Credentials Spring
2009
APPENDIX
Percent of Children
Children From
Monolingual English
Homes
(n = 425)
Dual Language
Learners
(n = 220) Program ManagerSupervisor Education and Credentials
Source Spring 2009 Baby FACES Program Director Self-Administered Questionnaire
Notes Statistics are weighted to represent children near their first birthday who were enrolled in
Early Head Start programs in spring 2009
Children from monolingual English homes are children for whom English was the only language
spoken in the home as reported by parents DLLs are children who live in homes where a language
other than English (LOTE) was spoken in the home regardless of which language was the primary
language spoken by the family
Report to Congress on DLLs in Head Start Page | 173
Highest Level of Education
High School Diploma or Equivalent 45 65 81
Associatersquos Degree (AA) 128 212 267
Bachelorrsquos Degree (BA) 496 288 280
Graduate or Professional Degree 331 435 372
Of Those with an AA or Higher Highest Degree is in 206 116 103
Early Childhood Education
Of Those with an AA or Higher Completed 6+ 972 938 943
Courses in Early Childhood Educationa
Has a Child Development Associate (CDA) 387 466 519
Has a State-Awarded Preschool Certificate 243 295 308
Has a Teaching Certificate or License 372 528 568
Mean Years Working in Head Start 1373 1139 1199
Mean Years in Current Program 1204 879 960
Mean Annual Salary (in dollars) 39341 46353 44656
APPENDIX
Table IV8 Head Start Center Director Qualifications and Earnings Fall 2006
Percent of Children
Children From
Monolingual
English Homes
(n = 1862)
DLLs Who Did
Not Pass English
Screener
(n = 435)
Dual Language
Learners (DLLs)
(n = 942) Center Director Education Credentials and Salary
Source Fall 2006 FACES Center Director Interview
Notes Statistics are weighted to represent all children entering Head Start for the first time in fall 2006
Children from monolingual English homes are children for whom English was the only language spoken
in the home as reported by parents DLLs are children who live in homes where a language other than
English (LOTE) was spoken in the home regardless of which language was the primary language spoken
by the family
a
Includes coursework in early childhood education regardless of academic major
Report to Congress on DLLs in Head Start Page | 174
Highest Level of Education
High School Diploma or Equivalent 09 08 15
Associatersquos Degree (AA) 57 22 10
Bachelorrsquos Degree (BA) 460 344 359
Graduate or Professional Degree 474 626 615
Of Those with an AA or Higher Highest
Degree is in Early Childhood Education 479 168 202
Of Those with an AA or Higher Completed 6+
a
Courses in Early Childhood Education 976 979 977
Has a Child Development Associate (CDA) 373 429 372
Has a State-Awarded Preschool Certificate 429 472 485
Has a Teaching Certificate or License 537 632 649
Mean Years Working in Head Start 1525 1432 1540
Mean Years in Current Program 1299 1433 1601
Mean Annual Salary (in dollars) 41178 56071 57219
APPENDIX
Table IV9 Head Start Education Coordinator Qualifications and Earnings Fall 2006
Percent of Children
Children From
Monolingual English
Homes
(n = 1862)
Dual Language
Learners (DLLs)
(n = 942)
DLLs Who Did Not
Pass English Screener
(n = 435)
Education Coordinator Education
Credentials and Earnings
Source Fall 2006 FACES Education Coordinator Interview
Notes Statistics are weighted to represent all children entering Head Start for the first time in fall 2006
Children from monolingual English homes are children for whom English was the only language spoken in the
home as reported by parents DLLs are children who live in homes where a language other than English (LOTE)
was spoken in the home regardless of which language was the primary language spoken by the family
a
Includes coursework in early childhood education regardless of academic major
Report to Congress on DLLs in Head Start Page | 175
Highest Level of Education
High School Diploma or Equivalent 43 58
Associatersquos Degree (AA) 68 44
Bachelorrsquos Degree (BA) 365 264
Graduate or Professional Degree 524 634
Has a CDAa
00 00
Has a State-Awarded Preschool Certificate or
License 06 15
Table IV10 Early Head Start Program Director Education and Credentials Spring 2009
APPENDIX
Percent of Children
Children From
Monolingual English
Homes
(n = 425)
Dual Language
Learners
(n = 220) Program Director Education and Credentials
Source Spring 2009 Baby FACES Program Director Self-Administered Questionnaire
Notes Statistics are weighted to represent children near their first birthday who were
enrolled in Early Head Start programs in spring 2009
Children from monolingual English homes are children for whom English was the only
language spoken in the home as reported by parents DLLs are children who live in homes
where a language other than English (LOTE) was spoken in the home regardless of which
language was the primary language spoken by the family
a
CDA = Child Development Associate credential
Report to Congress on DLLs in Head Start Page | 176
Highest Level of Education
High School Diploma or Equivalent 31 50 63
Associatersquos Degree (AA) 00 00 00
Bachelorrsquos Degree (BA) 371 238 300
Graduate or Professional Degree 598 712 637
Of Those with an AA or Higher Highest Degree is in Early Childhood Education 115 50 51
Of Those with an AA or Higher Completed 6+
Courses in Early Childhood Educationa
758 971 976
Mean Years Working in Head Start 1688 1768 1896
Mean Years in Current Program 1260 1483 1524
Mean Annual Salary (in dollars) 60766 81812 82786
APPENDIX
Table IV11 Head Start Program Director Qualifications and Earnings Fall 2006
Percent of Children
Children From
Monolingual
English Homes
(n = 1862)
DLLs Who Did
Not Pass English
Screener
(n = 435)
Dual Language
Learners (DLLs)
(n = 942) Program Director Education Credentials and Salary
06
Source Fall 2006 FACES Program Director Interview
Notes Statistics are weighted to represent all children entering Head Start for the first time in fall 20
Children from monolingual English homes are children for whom English was the only language spoken
in the home as reported by parents DLLs are children who live in homes where a language other than
English (LOTE) was spoken in the home regardless of which language was the primary language spoken
by the family
a
Includes coursework in early childhood education regardless of academic major
Report to Congress on DLLs in Head Start Page | 177
Turnover rate among frontline staff (Percent of staff who
left program in past 12 months)
Teachers 168 136 Home visitors 156 149
Percent of programs in which a director coordinator or
manager left in the past 12 months 462 557
Mean number of directors coordinators or managers
a
who left in the past 12 months 15 16
Reasons directorscoordinators left (Percent of
a
programs)
Change in careers 224 255 Higher compensationbetter benefits 287 289 Firinglayoff 218 162
Maternity leave 62 97 Personal reasons 487 457 Other 68 104
Range in seniority among teachers
Low end of range (mean) 07 08 High end of range (mean) 105 101
Range in seniority among home visitors
Low end of range (mean) 16 11 High end of range (mean) 85 72
Range in seniority among directorsassistant directors
Low end of range (mean) 88 71 High end of range (mean) 115 98
Range in seniority among coordinators
Low end of range (mean) 42 24 High end of range (mean) 122 10
APPENDIX
Table IV12 Early Head Start Staff Turnover and Seniority Spring 2009
Percent or Mean
Children From
Monolingual English
Homes
(n=425)
Dual Language
Learners
(n=220) Characteristic
Source Spring 2009 Program Director interview
Notes Statistics are weighted to represent children near their first birthday who were
enrolled in Early Head Start programs in spring 2009
Children from monolingual English homes are children for whom English was the only language
spoken in the home as reported by parents DLLs are children who live in homes where a
language other than English (LOTE) was spoken in the home regardless of which language was
the primary language spoken by the family
a
Among programs in which directorscoordinatorsmanagers left
Report to Congress on DLLs in Head Start Page | 178
CDI (English) Raw Score
Vocabulary Comprehension 332 224
Vocabulary Production 36 13
CDI (Spanish) Raw Score
Vocabulary Comprehension NA 356
Vocabulary Production NA 23
a
CDI Conceptual Score (English and Spanish)
Vocabulary Comprehension NA 412
Vocabulary Production NA 32
APPENDIX
Table VI1 Early Head Start Teacher- and Home Visitor Reported MacArthur-Bates Communicative
Development Inventory (CDI) Raw Scores Spring 2009
Mean
Children From
Monolingual English
Homes
(n = 425)
Dual Language Learners
(n = 220)
Source Spring 2009 Baby FACES Staff-Child Report (SCR)
Notes In Early Head Start parlance the term home visitor refers to frontline staff working in a home-
based setting with primary responsibility for one or more children
Teachers rate children in center-based settings on the CDI while home visitors rate children receiving
home-based services
Children from monolingual English homes are children for whom English was the only language spoken
in the home as reported by parents DLLs are children who live in homes where a language other than
English (LOTE) was spoken in the home regardless of which language was the primary language spoken
by the family
Statistics are weighted to represent children near their first birthdays who are enrolled in Early Head
Start programs in spring 2009
NA = not applicable
a
Using a conceptual scoring approach a child is coded as understanding or producing the word concept
for each word in an 89-word checklist if the Early Head Start staff report that the child understood or
produced the word in English andor Spanish
Report to Congress on DLLs in Head Start Page | 179
Parent-Reported BITSEA Raw Score
Problem Domain
Competence Domain
96
163
118
159
Staff-Reported BITSEA Raw Score
Problem Domain
Competence Domain
64
127
57
128
Parent-Reported BITSEA Cut-Off Score
Problem Domain
Competence Domain
230
76
342
153
Staff-Reported BITSEA Cut-Off Score
Problem Domain
Competence Domain
153
136
98
201
a
Parent-Reported BITSEA Screen Positive 285 430
a
Staff-Reported BITSEA Screen Positive 249 246
Table VI2 Early Head Start Parent- and Staff- Reported Brief Infant Toddler Social and
Emotional Assessment (BITSEA) Scores Spring 2009
APPENDIX
Mean
Children From Monolingual
English Homes
(n = 425)
DLLs
(n = 220)
Source Spring 2009 Baby FACES Parent Interview and Staff-Child Report (SCR)
Notes Statistics are weighted to represent children near their first birthday who were
enrolled in Early Head Start programs in spring 2009
Children from monolingual English homes are children for whom English was the only
language spoken in the home as reported by parents DLLs are children who live in homes
where a language other than English (LOTE) was spoken in the home regardless of which
language was the primary language spoken by the family
a
The Screen Positive indicator for the BITSEA combines cutoffs for the Problem Domain
(that is scores in the 75th percentile or higher in the national standardization sample) and
Competence Domain (that is scores lower than the 15th percentile in the national
standardization sample) These cutoffs indicate high levels of problems andor low
competence and may suggest delays in social-emotional competence
Report to Congress on DLLs in Head Start Page | 180
SD SD SD
PPVT-4 Standard Score 1708 876 1338 617 721 1446 175 637 1101
WJ Letter Word Identification Standard Score 1591 943 1745 437 928 1575 9 910 1439
WJ Spelling Standard Score 1661 948 1544 476 944 1580 19 996 1212
WJ Applied Problems Standard Score 1562 902 1727 417 867 1738 11 884 1759
ECLS-B Math IRT Score 1731 74 280 480 72 260 15 53 180
ECLS-B NumberShape Proficiency Probability
Score 1731 026 028 480 023 026 15 008 010
Combined ECLS-BWJ3 Applied Problems IRT
Score 1731 139 670 480 133 610 15 89 450
Story and Print Concepts IRT Scale Score 1565 36 237 666 33 224 293 29 202
PPVT-4 Growth Score Value (GSV) Score 1708 997 1677 617 848 1642 175 728 1074
WJ Letter Word Identification W Ability Score 1591 3046 2079 437 3061 2124 9 3030 1944
WJ Spelling W Ability Score 1661 3436 2815 476 3484 2942 19 3463 2924
WJ Applied Problems W Ability Score 1562 3747 2492 417 3741 2466 11 3700 2529
TVIP Standard Score 19 872 216 643 852 126 353 850 111
WM Letter Word Identification Standard
Score 6 799 695 180 794 1075 180 794 1075
WM Spelling Standard Score 12 915 863 353 884 1113 353 884 1113
WM Applied Problems Standard Score 10 832 1147 289 824 1285 289 824 1285
WM3 Letter Word Identification W Ability
Score 12 2779 1264 380 2781 1487 380 2781 1487
WM3 Spelling W Ability Score 12 3340 2143 386 3240 2669 386 3240 2669
WM3 Applied Problems W Ability Score 12 3538 2870 384 3500 2521 384 3500 2521
Table VI3 Summary Statistics for Head Start (FACES) Child Assessment Standardized Score Data Fall 2006
Children Fr om Monolingual
English Homes
Dual Language Learners
(DLLs)
DLLs Who Did Not Pass
English Screener
Scales N Mean N Mean N Mean
Report to Congress on DLLs in Head Start Page | 181
APPENDIX
Source Fall 2006 FACES Direct Child Assessment
Note Statistics are weighted to represent all children entering Head Start for the first time in fall 2006
Standard scores allow for comparisons of a groups performance to others of the same age (or grade) These scores have a mean of
100 and a standard deviation of 15 W scores allow for measurement of change or growth in performance on the same scale over
time Like raw scores W scores are an indicator of absolute rather than relative performance The WJWM W scale is centered on
500 which approximates the average score of a 10-year-old child PPVT-4 Growth Score Value (GSV) scores are similar to W scores
and can range from 12 to 271
The numbershape proficiency probability scores indicate the probability that a child would have passed the proficiency level and
can be interpreted as the percent of the population who have mastered this skill or skill set (eg 25 x 100 = 25 of Head Start
children are able to demonstrate these skills at the start of the program year) These scores can take on any value from zero to one
Children from monolingual English homes are children for whom English was the only language spoken in the home as reported by
parents DLLs are children who live in homes where a language other than English (LOTE) was spoken in the home regardless of
which language was the primary language spoken by the family
NA = not applicable
Interpret data with caution Standard error is large due to small sample size
Report to Congress on DLLs in Head Start Page | 182
APPENDIX
Table VI4 Summary Statistics for Head Start Exit FACES Child Assessment Standardized Score Data Spring 2007 and Spring 2008
Children From Monolingual
English Homes
Dual Language Learners
(DLLs)
DLLs Who Did Not Pass
English Screener
Scales N Mean SD N Mean SD N Mean SD
PPVT-4 Standard Score 1239 915 1314 681 766 1467 288 700 1388
WJ Letter Word Identification Standard Score 1239 988 1402 636 975 1494 247 948 1419
WJ Spelling Standard Score 1244 963 1558 641 989 1373 247 969 1355
WJ Applied Problems Standard Score 1233 903 1345 614 854 1362 230 823 1298
ECLS-B Math IRT Score 1248 120 351 644 111 361 250 100 331
ECLS-B NumberShape Proficiency Probability Score 1248 069 029 644 060 032 250 051 032
Combined ECLS-BWJ3 Applied Problems IRT Score 1248 239 717 644 221 745 250 197 703
Story and Print Concepts IRT Scale Score 1223 61 222 621 55 233 237 49 240
PPVT-4 Growth Score Value (GSV) Score 1239 1199 1463 681 1033 1731 288 954 1650
WJ Letter Word Identification W Ability Score 1239 3347 2688 636 3330 2971 247 3272 2792
WJ Spelling W Ability Score 1244 3798 2953 641 3852 2633 247 3805 2610
WJ Applied Problems W Ability Score 1233 4005 2011 614 3941 2112 230 3888 1980
TVIP Standard Score 12 883 143 485 820 149 261 825 145
WM Letter Word Identification Standard Score 1 950 000 52 826 1205 49 829 1212
WM Spelling Standard Score 1 1200 000 55 847 1182 52 844 1206
WM Applied Problems Standard Score 1 1020 000 51 753 1775 48 750 1762
WM3 Letter Word Identification W Ability Score 1 3450 000 57 2995 2391 54 2999 2408
WM3 Spelling W Ability Score 1 4370 000 57 3522 2668 54 3516 2715
WM3 Applied Problems W Ability Score 1 4320 000 57 3683 3102 54 3678 3074
Source Spring 2007 and Spring 2008 FACES Direct Child Assessment
Notes Statistics are weighted to represent all children who entered Head Start for the first time in the fall of 2006 and who were either (1)
completing Head Start in the spring of 2007 (children in the 4-year-old cohort) or (2) completing Head Start in the spring of 2008 (children in the
3-year-old cohort)
Standard scores allow for comparisons of a groups performance to others of the same age (or grade) These scores have a mean of 100 and a
standard deviation of 15 W scores allow for measurement of change or growth in performance on the same scale over time Like raw scores W
scores are an indicator of absolute rather than relative performance The WJWM W scale is centered on 500 which approximates the average
score of a 10-year-old child PPVT-4 Growth Score Value (GSV) scores are similar to W scores and can range from 12 to 271
The numbershape proficiency probability scores indicate the probability that a child would have passed the proficiency level and can be
interpreted as the percent of the population who have mastered this skill or skill set (eg 25 x 100 = 25 of Head Start children are able to
demonstrate these skills at the start of the program year) These scores can take on any value from zero to one
Children from monolingual English homes are children for whom English was the only language spoken in the home as reported by parents
DLLs are children who live in homes where a language other than English (LOTE) was spoken in the home regardless of which language was the
primary language spoken by the family
NA = not applicable
Interpret data with caution Standard error is large due to small sample size
Table VI5 Summary Statistics for Fall 2006 and Spring Prekindergarten Head Start (FACES) Child Assessment Standardized
Score Data
Report to Congress on DLLs in Head Start Page | 183
APPENDIX
Children F rom
Monolingual English
Homes
Dual Language Learners
(DLLs)
DLLs Who Did Not Pass
English S creener
Head
Start
Entry
Head
Start
Exit
Head
Start
Entry
Head
Start
Exit
Head
Start
Entry
Head
Start
Exit Scales N N N
PPVT-4 Standard Score 1172 874 919 494 718 798 132 632 739
WJ Letter Word Identification Standard Score 1102 938 992 357 930 997 9 885 1045
WJ Spelling Standard Score 1143 935 967 384 943 1002 17 1020 999
WJ Applied Problems Standard Score 1080 897 914 342 862 877 10 864 809
ECLS-B Math IRT Score 1191 78 121 390 73 119 15 51 100
ECLS-B NumberShape Proficiency Probability Score 1191 029 069 390 024 067 15 007 052
Combined ECLS-BWJ3 Applied Problems IRT Score 1191 146 241 390 135 237 15 84 196
Story and Print Concepts IRT Scale Score 1051 38 62 306 38 60 9 10 37
PPVT-4 Growth Score Value (GSV) Score 1172 1009 1204 494 856 1074 132 736 1006
WJ Letter Word Identification W Ability Score 1102 3058 3358 357 3070 3379 9 2998 3450
WJ Spelling W Ability Score 1143 3440 3810 384 3503 3881 17 3515 3851
WJ Applied Problems W Ability Score 1080 3760 4024 342 3745 3980 10 3671 3872
TVIP Standard Score 12 952 883 434 858 829 242 854 830
WM Letter Word Identification Standard Score 0 NA NA 24 742 845 24 742 845
WM Spelling Standard Score 1 810 1200 47 887 847 47 887 847
WM Applied Problems Standard Score 1 910 1020 34 748 810 34 748 810
WM3 Letter Word Identification W Ability Score 1 2640 3450 51 2775 2994 51 2775 2994
WM3 Spelling W Ability Score 1 3530 4370 52 3310 3518 52 3310 3518
WM3 Applied Problems W Ability Score 1 4030 4320 52 3381 3689 52 3381 3689
Source Fall 2006 Spring 2007 and Spring 2008 FACES Direct Child Assessment
Notes Statistics are weighted to represent all children who entered Head Start for the first time in the fall of 2006 and who were
either (1) completing Head Start in the spring of 2007 (children in the 4-year-old cohort) or (2) completing Head Start in the spring of
2008 (children in the 3-year-old cohort)
Children from monolingual English homes are children for whom English was the only language spoken in the home as reported by
parents DLLs are children who live in homes where a language other than English (LOTE) was spoken in the home regardless of
which language was the primary language spoken by the family
Standard scores allow for comparisons of a groups performance to others of the same age (or grade) These scores have a mean of
100 and a standard deviation of 15 W scores allow for measurement of change or growth in performance on the same scale over
time Like raw scores W scores are an indicator of absolute rather than relative performance The WJWM W scale is centered on
500 which approximates the average score of a 10-year-old child PPVT-4 Growth Score Value (GSV) scores are similar to W scores
and can range from 12 to 271
NA = not applicable
Interpret data with caution Standard error is large due to small sample size
Child Literacy Skills
(Teacher Report) 1762 26 005 875 27 008 400 20 009
Emergent Literacy Scale
(Parent Report) 1821 21 004 915 17 006 424 12 007
APPENDIX
Table VI6 Summary Statistics for Head Start (FACES) Parent Interview and Teacher Child Report Data
Measures Fall 2006
Children From Monolingual
English Homes
Dual Language Learners
(DLLs)
DLLs Who Did Not Pass
English Screener
Scales N Mean SE N Mean SE N Mean SE
Source Fall 2006 FACES Teacher Child Report and Parent Interview
Notes Statistics are weighted to represent all children entering Head Start for the first time in fall 2006
Children from monolingual English homes are children for whom English was the only language spoken in the
home as reported by parents DLLs are children who live in homes where a language other than English (LOTE)
was spoken in the home regardless of which language was the primary language spoken by the family
Report to Congress on DLLs in Head Start Page | 184
Child Literacy Skills
(Teacher Report) 1169 55 005 636 55 006 278 52 010
Emergent Literacy Scale
(Parent Report) 1136 42 004 637 37 006 286 35 010
APPENDIX
Table VI7 Summary Statistics for Head Start Exit FACES Parent Interview and Teacher Child Report Data
Spring 2007 and Spring 2008
Children From
Monolingual English
Homes
Dual Language Learners
(DLLs)
DLLs Who Did Not Pass
English Screener
Scales N Mean SD N Mean SD N Mean SD
Source Spring 2007 and Spring 2008 FACES Teacher Child Report and Parent Interview
Notes Statistics are weighted to represent all children who entered Head Start for the first time in the fall of 2006
and who were either (1) completing Head Start in the spring of 2007 (children in the 4-year-old cohort) or (2)
completing Head Start in the spring of 2008 (children in the 3-year-old cohort)
Children from monolingual English homes are children for whom English was the only language spoken in the home
as reported by parents DLLs are children who live in homes where a language other than English (LOTE) was spoken
in the home regardless of which language was the primary language spoken by the family
Report to Congress on DLLs in Head Start Page | 185
Teacher Report
Social Skills 1761 155 013 875 157 019 400 148 028
Total Behavior Problems 1762 72 016 875 65 026 400 76 038
Aggressive Behavior 1761 16 005 874 15 008 400 17 011
Hyperactive Behavior 1762 32 008 875 28 012 400 32 019
Withdrawn Behavior 1761 16 005 874 14 008 400 17 013
Preschool Learning Behaviors Scale (PLBS) ndash
Total a
1762 502 027 875 508 040 400 487 060
a
PLBS ndash Attitude toward Learning 1762 501 027 875 506 039 400 491 058
a
PLBS ndash Competence Motivation 1762 504 028 875 505 039 400 483 057
a
PLBS ndash AttentionPersistence 1762 500 028 875 510 041 400 493 065
Parent Report
Social SkillsApproaches to Learning 1821 118 007 914 118 011 424 114 017
Total Behavior Problems 1822 55 010 911 66 014 423 70 020
Assessor Rating
Leiter CognitiveSocial Raw Score 1770 556 055 896 522 085 426 440 122
b
Leiter CognitiveSocial Standard Score 1770 908 045 896 875 067 426 819 096
Attention 1770 197 023 896 181 035 426 145 050
OrganizationImpulse Control 1771 156 018 896 145 026 426 120 037
Activity Level 1771 81 010 896 82 014 426 74 021
Sociability 1771 122 009 896 113 015 426 101 024
APPENDIX
Table VI8 Summary Statistics for Head Start (FACES) Parent Teacher and Assessor Child Report Data Measures
Fall 2006
Scales
Children From
Monolingual English
Homes
N Mean SE
Dual Language Learners
(DLLs)
N Mean SE
DLLs Who Did Not Pass
English Screener
N Mean SE
Source Fall 2006 FACES Direct Child Assessment Teacher Child Report and Parent Interview
Notes Statistics are weighted to represent all children entering Head Start for the first time in fall 2006
Children from monolingual English homes are children for whom English was the only language spoken in the home as reported by parents DLLs are children who live in homes where a language other than English (LOTE) was spoken in the home regardless of which language was the primary language spoken by the family
a
This score is a T-score set to have a mean of 50 and standard deviation of 10 T-scores illustrate a childs performance relative to the Head Start population as a whole in fall 2006 A high T-score for a subgroup indicates that the subgroups mastery level is greater than other groups in the Head Start population b
This standard score has a mean of 100 and a standard deviation of 15
Report to Congress on DLLs in Head Start Page | 186
Teacher Report
Social Skills 1212 181 015 660 190 017 285 184 028
Total Behavior Problems 1212 63 021 660 41 022 285 45 033
Aggressive Behavior 1211 15 006 660 08 006 285 10 010
Hyperactive Behavior 1212 26 009 660 17 010 285 18 014
Withdrawn Behavior 1211 16 007 660 11 007 285 12 012
Preschool Learning Behaviors Scale (PLBS) ndash
Total a
1212 520 032 660 544 036 285 537 058
a
PLBS ndash Attitude toward Learning 1212 515 032 660 534 034 285 530 054
a
PLBS ndash Competence Motivation 1212 521 033 660 536 039 285 528 063
a
PLBS ndash AttentionPersistence 1212 520 032 660 548 033 285 543 053
Parent Report
Social SkillsApproaches to Learning 1194 123 008 670 126 012 295 124 016
Total Behavior Problems 1195 51 012 668 61 015 294 65 023
Assessor Rating
Leiter Cognitive Social Raw Score 1250 596 063 703 598 075 305 572 115
b
Leiter Cognitive Social Standard Score 1250 915 053 703 908 064 305 886 094
Attention 1250 215 025 703 212 032 305 198 050
OrganizationImpulse Control 1250 172 020 703 169 024 305 160 036
Activity Level 1250 86 011 703 91 012 305 90 019
Sociability 1250 123 011 703 125 013 305 124 020
APPENDIX
Table VI9 Summary Statistics for Head Start Exit FACES Parent Teacher and Assessor Child Report Data Measures
Spring 2007 and Spring 2008
Scales
Children From
Monolingual English
Homes
Dual Language Learners
(DLLs)
N Mean SD N Mean SD
DLLs Who Did Not Pass
English Screener
N Mean SD
Source Spring 2007 and Spring 2008 FACES Direct Child Assessment Teacher Child Report and Parent Interview
Notes Statistics are weighted to represent all children who entered Head Start for the first time in the fall of 2006 and who
were either (1) completing Head Start in the spring of 2007 (children in the 4-year-old cohort) or (2) completing Head Start in
the spring of 2008 (children in the 3-year-old cohort)
Children from monolingual English homes are children for whom English was the only language spoken in the home as
reported by parents DLLs are children who live in homes where a language other than English (LOTE) was spoken in the
home regardless of which language was the primary language spoken by the family
a
This score is a T-score set to have a mean of 50 and standard deviation of 10 T-scores illustrate a childs performance
relative to the Head Start population as a whole in fall 2006 A high T-score for a subgroup indicates that the subgroups
mastery level is greater than other groups in the Head Start population
b
This standard score has a mean of 100 and a standard deviation of 15
Report to Congress on DLLs in Head Start Page | 187
Teacher Report
Social Skills 1169 157 181 626 160 190 267 153 185
Total Behavior Problems 1169 70 63 626 62 42 267 73 43
Aggressive Behavior 1168 15 15 625 14 08 267 17 09
Hyperactive Behavior 1169 31 26 626 26 17 267 30 17
Withdrawn Behavior 1168 16 16 625 14 11 267 18 12
Preschool Learning Behaviors Scale (PLBS) ndash
Total a
1169 506 520 626 515 544 267 496 540
a
PLBS ndash Attitude toward Learning 1169 506 515 626 513 535 267 501 533
a
PLBS ndash Competence Motivation 1169 506 521 626 511 536 267 489 530
a
PLBS ndash AttentionPersistence 1169 505 521 626 517 549 267 502 546
Parent Report
Social SkillsApproaches to Learning 1164 118 123 645 119 127 286 115 124
Total Behavior Problems 1166 55 51 641 65 62 284 69 65
Assessor Rating
Leiter Cognitive Social Raw Score 1215 566 595 684 539 601 304 462 574
b
Leiter Cognitive Social Standard Score 1215 911 914 684 886 911 304 833 887
Attention 1215 202 215 684 188 213 304 154 199
OrganizationImpulse Control 1215 160 172 684 151 170 304 127 160
Activity Level 1215 82 85 684 84 92 304 77 90
Sociability 1215 122 123 684 116 126 304 104 124
APPENDIX
Table VI10 Summary Statistics for Fall 2006 and Spring Prekindergarten Head Start (FACES) Parent Teacher and
Assessor Child Report Data Measures
Children From
Monolingual English
Homes
Dual Language Learners
(DLLs)
DLLs Who Did Not Pass
English Screener
Head
Start
Entry
Head
Start
Exit
Head
Start
Entry
Head
Start
Exit
Head
Start
Entry
Head
Start
Exit Scales N N N
Source Fall 2006 Spring 2007 and Spring 2008 FACES Direct Child Assessment Parent Interview and Teacher Child Report
Notes Statistics are weighted to represent all children who entered Head Start for the first time in the fall of 2006 and who
were either (1) completing Head Start in the spring of 2007 (children in the 4-year-old cohort) or (2) completing Head Start in
the spring of 2008 (children in the 3-year-old cohort)
Children from monolingual English homes are children for whom English was the only language spoken in the home as
reported by parents DLLs are children who live in homes where a language other than English (LOTE) was spoken in the
home regardless of which language was the primary language spoken by the family
a
This score is a T-score set to have a mean of 50 and standard deviation of 10 T-scores illustrate a childs performance
relative to the Head Start population as a whole in fall 2006 A high T-score for a subgroup indicates that the subgroups
mastery level is greater than other groups in the Head Start population
b
This standard score has a mean of 100 and a standard deviation of 15
Report to Congress on DLLs in Head Start Page | 188
Height (in inches) 1745 400 007 890 400 009 422 394 013
Weight (in pounds) 1731 375 019 881 386 026 417 376 035
Body Mass Index (BMI) 1707 164 005 857 167 007 405 168 010
Percent of Children
Child is Underweight 1707 34 001 857 26 001 405 27 001
Child is Normal Weight 1707 648 001 857 592 002 405 576 003
Child is Overweight 1707 174 001 857 184 002 405 182 002
Child is Obese 1707 144 001 857 198 002 405 215 002
APPENDIX
Table VI11 Summary Statistics for Head Start (FACES) Child Height and Weight Data Fall 2006
Children From
Monolingual English
Homes
Dual Language Learners
(DLLs)
DLLs Who Did Not Pass
English Screener
Scales N Mean SE N Mean SE N Mean SE
Source Fall 2006 FACES Direct Child Assessment
Notes Statistics are weighted to represent all children entering Head Start for the first time in fall 2006
Children from monolingual English homes are children for whom English was the only language spoken in the
home as reported by parents DLLs are children who live in homes where a language other than English
(LOTE) was spoken in the home regardless of which language was the primary language spoken by the family
According to the Centers for Disease Control (CDC) the 50th percentile in height for children ages 3 to 5
ranges from 37 in to 43 in 30 lbs to 40 lbs in weight154 to 160 in BMI A child is considered to be
overweight or obese when hisher BMI score is at or above the 85th percentile for their age and gender
Report to Congress on DLLs in Head Start Page | 189
Height (in inches) 1243 432 007 701 430 009 304 429 013
Weight (in pounds) 1224 440 028 687 450 038 299 451 053
Body Mass Index (BMI) 1202 164 006 671 169 009 292 171 014
Percent of Children
Child is Underweight 1202 24 001 671 23 001 292 16 001
Child is Normal Weight 1202 648 002 671 501 002 292 490 003
Child is Overweight 1202 176 001 671 268 002 292 288 003
Child is Obese 1202 152 001 671 209 002 292 206 003
Table VI12 Summary Statistics for Head Start Exit FACES Child Height and Weight Data Spring 2007 and
Spring 2008
APPENDIX
Children From
Monolingual English
Homes
Dual Language Learners
(DLLs)
DLLs Who Did Not Pass
English Screener
Scales N Mean SD N Mean SD N Mean SD
Source Spring 2007 and Spring 2008 FACES Direct Child Assessment
Notes Statistics are weighted to represent all children who entered Head Start for the first time in the fall of
2006 and who were either (1) completing Head Start in the spring of 2007 (children in the 4-year-old cohort) or
(2) completing Head Start in the spring of 2008 (children in the 3-year-old cohort)
Children from monolingual English homes are children for whom English was the only language spoken in the
home as reported by parents DLLs are children who live in homes where a language other than English (LOTE)
was spoken in the home regardless of which language was the primary language spoken by the family
According to the Centers for Disease Control (CDC) the 50th percentile in height for children ages 3 to 5
ranges from 37 in to 43 in 30 lbs to 40 lbs in weight 154 to 160 in BMI A child is considered to be
overweight or obese when hisher BMI score is at or above the 85th percentile for their age and gender
Report to Congress on DLLs in Head Start Page | 190
Height (in inches) 1190 402 432 677 402 430 300 396 429
Weight (in pounds) 1167 380 439 658 388 452 292 379 451
Body Mass Index (BMI) 1140 164 164 632 166 169 279 167 170
Percent of Children
Child is Underweight 1140 33 24 632 20 25 279 14 17
Child is Normal Weight 1140 649 652 632 607 502 279 603 496
Child is Overweight 1140 179 172 632 189 271 279 186 298
Child is Obese 1140 139 151 632 184 202 279 197 190
APPENDIX
Table VI13 Summary Statistics for Fall 2006 and Spring Prekindergarten Head Start (FACES) Child Height and Weight
Data
Children From Monolingual
English Homes
DLLs Who Did Not Pass English
Screener Dual Language Learners (DLLs)
Head Start
Entry
Head
Start Exit
Head Start
Entry
Head Start
Exit
Head Start
Entry
Head Start
Exit Scales N N N
Source Fall 2006 Spring 2007 and Spring 2008 FACES Direct Child Assessment
Notes Statistics are weighted to represent all children who entered Head Start for the first time in the fall of 2006 and who
were either (1) completing Head Start in the spring of 2007 (children in the 4-year-old cohort) or (2) completing Head Start in
the spring of 2008 (children in the 3-year-old cohort)
Children from monolingual English homes are children for whom English was the only language spoken in the home as
reported by parents DLLs are children who live in homes where a language other than English (LOTE) was spoken in the home
regardless of which language was the primary language spoken by the family
According to the Centers for Disease Control (CDC) the 50th percentile in height for children ages 3 to 5 ranges from 37 in to
43 in 30 lbs to 40 lbs in weight 154 to 160 in BMI A child is considered to be overweight or obese when hisher BMI score is
at or above the 85th percentile for their age and gender
Report to Congress on DLLs in Head Start Page | 191
APPENDIX
Table VI14 Head Start Child Health Status as Reported by Parents Fall 2006
Children From Monolingual
English Homes
Dual Language Learners
(DLLs)
DLLs Who Did Not Pass
English Screener
Scales
ExcellentVery Good 1822 809 001 915 645 002 424 561 003
Good 1822 142 001 915 265 002 424 305 003
FairPoor 1822 49 001 915 90 001 424 134 002
N Percent SE N Percent SE N Percent SE
Source Fall 2006 FACES Parent Interview
Notes Statistics are weighted to represent all children entering Head Start for the first time in fall 2006
Children from monolingual English homes are children for whom English was the only language spoken in the home
as reported by parents DLLs are children who live in homes where a language other than English (LOTE) was spoken
in the home regardless of which language was the primary language spoken by the family
Report to Congress on DLLs in Head Start Page | 192
APPENDIX
Table VI15 Head Start Child Health Status as Reported by Parents Head Start Exit Spring 2007 and Spring 2008
Chidlren From Monolingual
English Homes
Dual Language Learners
(DLLs)
DLLs Who Did Not Pass
English Screener
Scales N Mean SD N Mean SD N Mean SD
ExcellentVery Good 1195 824 001 668 696 002 294 641 003
Good 1195 125 001 668 237 002 294 262 003
FairPoor 1195 51 001 668 67 001 294 97 002
Source Spring 2007 and Spring 2008 FACES Parent Interview
Notes Statistics are weighted to represent all children who entered Head Start for the first time in the fall of 2006 and
who were either (1) completing Head Start in the spring of 2007 (children in the 4-year-old cohort) or (2) completing
Head Start in the spring of 2008 (children in the 3-year-old cohort)
Children from monolingual English homes are children for whom English was the only language spoken in the home as
reported by parents DLLs are children who live in homes where a language other than English (LOTE) was spoken in the
home regardless of which language was the primary language spoken by the family
Report to Congress on DLLs in Head Start Page | 193
APPENDIX
Table VI16 Head Start Child Health Status as Reported by Parents Fall 2006 and Spring Prekindergarten
Percent of Children
Children From Monolingual
English Homes Dual Language Learners (DLLs)
DLLs Who Did Not Pass English
Screener
Scales N
Head Start
Entry
Head Start
Exit
N
Head Start
Entry
Head Start
Exit
N
Head Start
Entry
Head Start
Exit
ExcellentVery Good 1166 807 823 644 665 693 286 597 637
Good 1166 145 126 644 247 243 286 277 271
FairPoor 1166 48 51 644 88 64 286 126 92
Source Fall 2006 Spring 2007 and Spring 2008 FACES Parent Interview
Notes Statistics are weighted to represent all children who entered Head Start for the first time in the fall of 2006 and
who were either (1) completing Head Start in the spring of 2007 (children in the 4-year-old cohort) or (2) completing
Head Start in the spring of 2008 (children in the 3-year-old cohort)
Children from monolingual English homes are children for whom English was the only language spoken in the home as
reported by parents DLLs are children who live in homes where a language other than English (LOTE) was spoken in the
home regardless of which language was the primary language spoken by the family
Report to Congress on DLLs in Head Start Page | 194
Mean number of childrenrsquos books in home 467 193 168
Number of times family member read to
child in past week
Not at all 27 81 94
Once or twice 199 307 358
Three or more times but not every day 371 282 252
Every day 402 330 295
APPENDIX
Table VI17 Books in Home and Frequency of Reading to Head Start Child Fall 2006
Percent of Children
Children From
Monolingual English
Homes
(n = 1862)
Dual Language
Learners (DLLs)
(n = 942)
DLLs Who Did Not
Pass English Screener
(n = 435)
Source Fall 2006 FACES Parent Interview
Notes Statistics are weighted to represent all children entering Head Start for the first time in fall 2006
Children from monolingual English homes are children for whom English was the only language spoken in
the home as reported by parents DLLs are children who live in homes where a language other than English
(LOTE) was spoken in the home regardless of which language was the primary language spoken by the
family
Report to Congress on DLLs in Head Start Page | 195
Mean number of childrenrsquos books in home 541 245 212
Number of times family member read to child in past
week
Not at all 21 27 28
Once or twice 207 246 306
Three or more times but not every day 399 374 347
Every day 374 354 320
APPENDIX
Table VI18 Books in Home and Frequency of Reading to Head Start Child Spring Prekindergarten
Percent of Children
Children From
Monolingual English
Homes
(n = 1862)
DLLs Who Did Not
Pass English
Screener
(n = 435)
Dual Language
Learners (DLLs)
(n = 942)
Source Spring 2007 and Spring 2008 FACES Parent Interview
Notes Statistics are weighted to represent all children who entered Head Start for the first time in the fall of 2006
and who were either (1) completing Head Start in the spring of 2007 (children in the 4-year-old cohort) or (2)
completing Head Start in the spring of 2008 (children in the 3-year-old cohort)
Spring 2007 estimates are provided for children who entered Head Start as 4-year-olds Spring 2008 estimates are
provided for children who entered Head Start as 3-year-olds
Children from monolingual English homes are children for whom English was the only language spoken in the home
as reported by parents DLLs are children who live in homes where a language other than English (LOTE) was spoken
in the home regardless of which language was the primary language spoken by the family
Report to Congress on DLLs in Head Start Page | 196
Parent reading frequency in past week
Not at all 43 114 151
Once or twice 213 365 415
Three or more Times but not daily 268 252 221
Everyday 477 268 213
APPENDIX
Table VI19 Head Start Parent Reading Patterns Fall 2006
Percent of Children
Children From
Monolingual English
Homes
(n = 1862)
DLLs Who Did Not
Pass English
Screener
(n = 435)
Dual Language
Learners (DLLs)
(n = 942) Parents own reading habits
Source Fall 2006 FACES Parent Interview
Notes Statistics are weighted to represent all children entering Head Start for the first time in fall 2006
Children from monolingual English homes are children for whom English was the only language spoken in
the home as reported by parents DLLs are children who live in homes where a language other than
English (LOTE) was spoken in the home regardless of which language was the primary language spoken
by the family
Report to Congress on DLLs in Head Start Page | 197
APPENDIX
Table VI20 Parent Reading Patterns Head Start Exit Spring 2007 and Spring 2008
Percent of Children
Children From
Monolingual English
Homes
(n = 1862)
DLLs Who Did Not
Pass English
Screener
(n = 435)
Dual Language
Learners (DLLs)
(n = 942) Parents own reading habits
Parent reading frequency in past week
Not at all 42 64 56
Once or twice 200 362 409
Three or more times but not daily 286 352 337
Everyday 472 222 197
Source Spring 2007 and Spring 2008 FACES Parent Interview
Notes Statistics are weighted to represent all children who entered Head Start for the first time in the
fall of 2006 and who were either (1) completing Head Start in the spring of 2007 (children in the 4-year-
old cohort) or (2) completing Head Start in the spring of 2008 (children in the 3-year-old cohort)
Spring 2007 estimates are provided for children who entered Head Start as 4-year-olds Spring 2008
estimates are provided for children who entered Head Start as 3-year-olds
Report to Congress on DLLs in Head Start Page | 198
APPENDIX
Table VI21 Family Membersrsquo Activities with Head Start Child in Past Week Fall 2006
Percent of Children
Children From
Monolingual English
Homes
(n = 1862)
DLLs Who Did Not
Pass English
Screener
(n = 435)
Dual Language
Learners (DLLs)
(n = 942) Type of Activity
Told child a story 716 726 672
Taught child letters words or numbers 950 908 888
Taught child songs or music 826 737 739
Worked with child on arts and crafts 694 457 385
Played with toys or games indoors 973 959 962
Played a game sport or exercised
together 857 826 778
Took child along on errands 967 943 951
Involved child in household chores 952 843 826
Talked about what happened in
Head Start 972 882 881
Talked about TV programs or videos 765 631 571
Played counting games 874 749 703
Mean number of activities 95 87 84
Source Fall 2006 FACES Parent Interview
Notes Statistics are weighted to represent all children entering Head Start for the first time in fall 2006
Children from monolingual English homes are children for whom English was the only language
spoken in the home as reported by parents DLLs are children who live in homes where a
language other than English (LOTE) was spoken in the home regardless of which language was the
primary language spoken by the family
Report to Congress on DLLs in Head Start Page | 199
Table VI22 Family Membersrsquo Activities with Child in Past Week Head Start Exit Spring 2007 and Spring
2008
APPENDIX
Percent of Children
Children From
Monolingual English
Homes
(n = 1862)
DLLs Who Did Not
Pass English
Screener
(n = 435)
Dual Language
Learners (DLLs)
(n = 942) Type of Activity
Told child a story 840 835 844
Taught child letters words or numbers 963 960 962
Taught child songs or music 855 805 803
Worked with child on arts and crafts 719 585 550
Played with toys or games indoors 981 964 988
Played a game sport or exercised together 903 900 906
Took child along on errands 966 939 949
Involved child in household chores 966 861 848
Talked about what happened in Head Start 987 944 917
Talked about TV programs or videos 832 735 714
Played counting games 892 830 825
Mean number of activities 99 94 93
Source Spring 2007 and Spring 2008 FACES Parent Interview
Notes Statistics are weighted to represent all children who entered Head Start for the first time in the fall of
2006 and who were either (1) completing Head Start in the spring of 2007 (children in the 4-year-old cohort)
or (2) completing Head Start in the spring of 2008 (children in the 3-year-old cohort)
Spring 2007 estimates are provided for children who entered Head Start as 4-year-olds Spring 2008
estimates are provided for children who entered Head Start as 3-year-olds
Children from monolingual English homes are children for whom English was the only language spoken in
the home as reported by parents DLLs are children who live in homes where a language other than English
(LOTE) was spoken in the home regardless of which language was the primary language spoken by the
family
Report to Congress on DLLs in Head Start Page | 200
Children in fall of 2006
With valid PPVT-4 2500 794 1708 683 617 247 175 70
With teacher and parent reports 3036 964 1761 580 875 288 400 132
With height and weight data 3057 971 1745 571 890 291 422 138
Children who remained until spring of
prekindergarten
With valid PPVT-4 2208 701 1239 561 681 308 288 130
With teacher and parent reports 2157 685 1212 562 660 306 285 132
With height and weight data 2248 714 1243 553 701 312 304 135
Children who remained until spring of
prekindergarten
With valid PPVT-4 at entry amp exit 1798 571 1172 652 494 275 132 73
With teacherparent reports at entry
amp exit 2062 655 1169 567 626 304 267 129
With heightweight data at entry amp
exit 2167 688 1190 549 677 312 300 138
APPENDIX
Table VI23 Different Subsamples of Head Start Children in FACES 2006 by Assessments Available
Children From
Monolingual English
Homes
Dual Language Learners
(DLLs)
DLLs Who Did Not Pass
English Screener
N
of Baseline
Sample N of Sample N of Sample N of Sample
Report to Congress on DLLs in Head Start Page | 201
Source Fall 2006 Spring 2007 Spring 2008 FACES Direct Child Assessment Teacher Child Report and Parent Interview
Notes Statistics are weighted to represent all children who entered Head Start for the first time in the fall of 2006 and who were either
(1) completing Head Start in the spring of 2007 (children in the 4-year-old cohort) or (2) completing Head Start in the spring of 2008
(children in the 3-year-old cohort)
Spring 2007 estimates are provided for children who entered Head Start as 4-year-olds Spring 2008 estimates are provided for children
who entered Head Start as 3-year-olds
Children from monolingual English homes are children for whom English was the only language spoken in the home as reported by
parents DLLs are children who live in homes where a language other than English (LOTE) was spoken in the home regardless of which
language was the primary language spoken by the family
Report to Congress on DLLs in Head Start Page | 202
APPENDIX
Table VI24 Percent of Children by Home Language and Beginning Proficiency
Percent of Children
1 2 3 4 5 6
Children from
Monolingual
English Homes
Language Other
Than English
(LOTE) in
HomeDLLs
Primary LOTE in
Home (LOTE-P)
Primary LOTE in
Home (LOTE-P)
Who Did Not Pass
English Screener
LOTE in Home But
Not Primary (LOTE-
NP)
Primary LOTE in
Home (LOTE-P)
Who Did Not Pass
English Screener
Early Head Start
Head Start
638
592
362
408
312
271
NA
146
NA
138
NA
12
Source Spring 2009 Baby FACES Parent Interview Fall 2006 FACES Parent Interview and Direct Child Assessment
Note Baby FACES statistics are weighted to represent children near their first birthdays who were enrolled in Early Head Start programs in
spring 2009 FACES 2006 statistics are weighted to represent all children entering Head Start for the first time in fall 2006
NA = not applicable
Children from monolingual English homes are children for whom English was the only language spoken in the home as reported by
parents DLLs are children who live in homes where a language other than English (LOTE) was spoken in the home regardless of which
language was the primary language spoken by the family
- Report to Congress on Dual Language Learners in Head Start and Early Head Start Programs13
-
- REPORT TO CONGRESS ON DUAL LANGUAGE LEAR
- EXECUTIVE SUMMARY
- CHAPTER I INTRODUCTION
- CHAPTER II CHARACTERISTICS OF DLLS
- CHAPTER III HEAD START AND EARLY HEAD S
- CHAPTER IV QUALIFICATIONS AND TRAINING
- CHAPTER V LANGUAGES USED BY STAFF WHO S
- CHAPTER VI DEVELOPMENTAL PROGRESS MADE
- CHAPTER VII DISCUSSION
- APPENDIX
-