Report Title Goes Here - North American Electric … of Variable Generation... · Web viewThe ADI...
82
Special Report Flexibility Requirements and Metrics for Variable Generation and their Implications on Planning Studies
-
Upload
truongthuan -
Category
Documents
-
view
214 -
download
1
Transcript of Report Title Goes Here - North American Electric … of Variable Generation... · Web viewThe ADI...

Special ReportFlexibility Requirements and Metrics for Variable Generation and their Implications on Planning Studies
Working Draft SixDated 4/4/10

NERC’s Mission
NERC’s MissionNERC’s MissionThe North American Electric Reliability Corporation (NERC) is an international regulatory authority for reliability of the bulk power system in North America. NERC develops and enforces Reliability Standards; assesses adequacy annually via a 10-year forecast and winter and summer forecasts; monitors the bulk power system; and educates, trains, and certifies industry personnel. NERC is a self-regulatory organization, subject to oversight by the U.S. Federal Energy Regulatory Commission (FERC) and governmental authorities in Canada.1
NERC assesses and reports on the reliability and adequacy of the North American bulk power system divided into the eight Regional Areas as shown on the map below (See Table A).2 The users, owners, and operators of the bulk power system within these areas account for virtually all the electricity supplied in the U.S., Canada, and a portion of Baja California Norte, México.
Note: The highlighted area between SPP and SERC denotes overlapping regional area boundaries: For example, some load serving entities participate in one region and their associated transmission owner/operators in another.
1 As of June 18, 2007, the U.S. Federal Energy Regulatory Commission (FERC) granted NERC the legal authority to enforce Reliability Standards with all U.S. users, owners, and operators of the bulk power system, and made compliance with those standards mandatory and enforceable. Reliability Standards are also mandatory and enforceable in Ontario and New Brunswick, and NERC is seeking to achieve comparable results in the other Canadian provinces. NERC will seek recognition in Mexico once necessary legislation is adopted.
2 Note ERCOT and SPP are tasked with performing reliability self-assessments as they are regional planning and operating organizations. SPP-RE (SPP – Regional Entity) and TRE (Texas Regional Entity) are functional entities to whom NERC delegates certain compliance monitoring and enforcement authorities.
Flexibility Requirements and Metrics for Variable Generation and their Implications for System Planning StudiesFebruary 2010
Table A: NERC Regional EntitiesERCOTElectric Reliability Council of Texas
RFCReliabilityFirst Corporation
FRCCFlorida Reliability Coordinating Council
SERCSERC Reliability Corporation
MROMidwest Reliability Organization
SPPSouthwest Power Pool, Incorporated
NPCCNortheast Power Coordinating Council, Inc.
WECCWestern Electricity Coordinating Council

Table of Contents
Table of ContentsTable of ContentsNERC’s Mission...............................................................................................................................i
Chapter 1: Introduction....................................................................................................................1
Chapter 2: System Flexibility Requirements...................................................................................3
2.1 Introduction.........................................................................................................................32.2 The Importance of Net Load...............................................................................................32.3 Lessons Already Learned...................................................................................................4
2.3.1 Bonneville Power Administration (BPA)....................................................................52.3.2 Electric Reliability Council of Texas (ERCOT)..........................................................62.3.3 New York Independent System Operator (NYISO)..................................................10
Chapter 3: Sources of Flexibility...................................................................................................13
3.1 Introduction - Sources of System Flexibility....................................................................133.2 Flexible Conventional Generation....................................................................................133.3 Demand Response............................................................................................................143.4 Variable Generation Power Management (Curtailment)..................................................143.5 Energy Storage..................................................................................................................153.6 Electric Vehicles...............................................................................................................153.7 Sub-Hourly Generation Scheduling..................................................................................163.8 Consolidation of Balancing Areas....................................................................................163.9 Enabling Flexibility through Transmission Planning.......................................................16
Chapter 4: Measuring Flexibility...................................................................................................18
4.1 Introduction.......................................................................................................................194.2 Characteristics of Demand & Supply Imbalances & Need for System Flexibility..........19
Chapter 5: Conclusions and Recommendations............................................................................24
Appendix: Examples of Variable Generation Integration...............................................................0
Introduction...............................................................................................................................0BPA Example...........................................................................................................................0AESO Example.........................................................................................................................3ERCOT Example......................................................................................................................5Midwest Independent System Operator Example..................................................................13New York Independent System Operator Example................................................................18International Examples...........................................................................................................21
System with large amounts of Nuclear Generation Example:............................................23Further Reading...............................................................................................................................0
IVGTF Task 1-4 Roster...................................................................................................................1

Chapter 1: IntroductionChapter 1: Introduction
Introduction: In April 2009 the NERC Integration of Variable Generation Task Force (IVGFT) released its landmark special report entitled: “Accommodating High Levels of Variable Generation”. One of the primary findings of that report is that as the penetration of variable generation reaches relatively high levels, the characteristics and operation of the bulk power system will be significantly altered. The primary driver of this change is the increase in the overall system variability.
The IVGFT Report resulted in a number of conclusions and recommended actions to develop the planning and operational practices, methods and resources needed to integrate variable generation resources into the bulk power system. The focus of this work effort is on Task 1.4 of the IVGTF Report which was defined as follows (see box to the right): “Resource adequacy and transmission planning approaches must consider needed system flexibility to accommodate the characteristics of variable resources as part of bulk power system design.”
This report focuses on the extent to which resource adequacy and transmission planning processes will need to consider system flexibility to accommodate the characteristics of variable resources as part of bulk power system design. Planning studies have historically concentrated on the concept of adequacy. In 1996, Billinton & Allan3 suggested that system security, a subset of which is defined here as system flexibility, was "an exciting area for future development and research." Task Force 1.4 has developed a study approach that will; 1) Describe the characteristics of the net load and the need for flexibility; 2) Document the experience of power systems that already have a relatively high penetration of variable generation; 3) Identify all sources of flexibility; 4) Discuss metrics that can be used to characterize flexibility; 5) Discuss the tools required for system planning to include flexibility and to present conclusions and recommendations. This information will be used to determine how flexibility could be accounted for and measured in existing studies, whether flexibility
3 Billinton, R. and Allan, R., 1996, Reliability Evaluation of Power Systems, Plenum, New York.
The focus of this report addresses Task 1.4 of the IVGTF Report work plan:
Resource adequacy and transmission planning approaches must consider needed system flexibility to accommodate the characteristics of variable resources as part of bulk power system design. The NERC Planning Committee’s Resource Issues Subcommittee should study changes required to current resource adequacy assessment processes to account for large-scale variable generation integration. Considerations should include ramping requirements, minimum generation levels, required shorter scheduling intervals, transmission interconnections, etc.”
This task report concentrates on how to include variable generation into resource and transmission planning. Data needs will be identified and the report is to make recommendations responsible NERC entities. The goals of the report are to
- Study resource and transmission planning process changes required to include variable generation characteristics.
- Identify data requirements to support resource adequacy assessment and, which NERC entities should collect, retain and provide this data.

should be accounted for differently in planning studies and what kind of metrics will could be needed to measure flexibility.
Historically, planning studies generally have not had to address the need for system flexibility as the characteristics and performance of conventional generating technologies included design requirements to meet variable and randomness from demand, being well understood and predictable. Power system variability was addressed in resource planning studies by identifying the most economic resource mix to meet a time varying load profile, and in transmission planning studies by evaluating loss of source in the local area. However, with increased variability, additional system flexibility may be required to ensure the resulting system can be operated reliability while accommodating large amounts of variable generation. Therefore, planning and design processes will need to change, depending on basic system characteristics, to support integration of high levels of variable generation. Developments of appropriate explicit metrics for flexibility are an important aspect in facilitating these new processes.
Charting new ground is always challenging and developing metrics for a multi-dimensioned concept, such as power system flexibility, presents a significant challenge. The metric would need to be similar to the Loss of Load Expectation or reserve margin concepts. There are at the time of this writing and to the best of the task force knowledge no known or universally accepted “metrics” for power system flexibility.

Chapter 2: System Flexibility RequirementsChapter 2: System Flexibility Requirements2.1 Introduction
Chapter 2 of the IVGTF Special Report entitled: “Accommodating High Levels of Variable Generation” identified the characteristics of variable generation and how they can result in a system that will be inherently more variable and one which will need to be more flexible. Historically, power systems have been designed to deal with variability. This variability has been primarily driven by the load cycle and its short-term random fluctuations as well as the sudden loss of facilities and/or sources of supply. The introduction of variable generation results in increased overall variability requiring response from the bulk power system. This variability must be quantified to address the need for system flexibility.
2.2 The Importance of Net Load
Net load is the aggregate of customer demand and variable generation. Dispatchable, flexible, resources must be adjusted to maintain a balance with net load. Some of these resources may alter net load such as conventional plant, controllable demand response or curtailing some variable generation.
From a modeling perspective, variable generation output is best combined with load to create net load. The reasons for this summation is, compared to conventional generation resources, variable generation output and system electric demand have similar characteristics. Variable generation is:
1. Cyclic on an annual (seasonal) basis, with some diurnal (daily) patterns but not as strong as the load
2. Subject to random short-term variations around a forecasted multi-hour trend3. Limited controllability (i.e. ability to dispatch)4. Subject to deviations from predicted day-ahead behavior, with larger forecast error
than load.5. Dependent on prevailing weather conditions
As a result, determining the impacts of variable generation on bulk power system operations and planning cannot be evaluated by examining variable generation output characteristics, such as its variability and predictability, independently from the simultaneous behavior of the load. Thus, analysis of variable generation must include load variation to determine the need for flexibility. From a modeling perspective, the net load has larger forecast errors than the load in isolation.
Variations in load and variable generation can cancel and compound each other in reality. In other words, given synchronized load and variable generation time series, the variability of net load over a time period is less than the sum of the variability of the individual series over the same time period. In addition, the variability of each cannot simply be combined as if they are independently random, as they are both affected by the common factor of the weather.

The impact of variable generation on system variability can be demonstrated by comparing the distribution of load changes to the distribution of net load changes, (include both the affects of variable generation and the load changes) for any specified time frame. Figure X below displays the difference of the load and net changes for sixty minute intervals. The graphic is based on installed nameplate wind, which totals 8,000 MW, and a peak load of approximately 37,000 MW.
0100200300400500600700800900
100011001200130014001500160017001800
60 Min. Load Delta (in MW) 2006 Wind
Freq
uenc
y of
Loa
d D
elta
s
Load Alone
Load - 8000 MWWind
Figure X: Distribution of One Hour Load Changes versus One Hour Net Changes, based on 2006 wind data and developed from the data developed by AWS Truewind for the Eastern Wind Integration and Transmission Study (EWITS).
When net load is included, it is considerably more variable than the load by itself and increases as the amount of variable generation increases. This will result in a need for greater system flexibility. Although the timeframe is one hour, in general, the distribution is similar for other timeframes, validated in many other studies of wind integration.
2.3 Lessons Already Learned
Many power systems in the United States and in Europe have gained considerable understanding of the need for flexibility. IVGTF Task Force 1.4 has compiled the experiences of power system with variable generation integration throughout the world. The full description of each of the systems that submitted their experiences are in the Appendix, entitled, Examples of Variable Generation Integration. The Appendix and this report are dominated by wind examples, with some reference to solar and ocean energy. Solar energy is growing rapidly but

thus far there are no known significant impacts (in North America or elsewhere) that would highlight the need for flexibility. Ocean energy is in its infancy but may in the future have significant impact. Below is a summary of three systems, one from each of the major interconnections in North America and a summary of the lessons that have been learned to date from integrating wind.
2.3.1 Bonneville Power Administration (BPA)
As of November 2009, BPA had 2,253 MW of installed wind capacity connected within its balancing authority (BA). With a peak net internal demand of 10,500 MW, wind penetration in the BPA BA is over 20% of capacity. Figure BPA-1 is an example of the variability of wind generation in the month of February 2009. This variability is managed by conventional, dispatchable generators. For example, in the BPA BA, flexible resources are required to supply regulating and following reserves.
Figure BPA-1 – caption needed
BPA began tabulating ramp rates for 5-minute, 30-minute and 60-minute increments to measure flexibility requirements. The following are the maximum ramps experienced on an installed wind capacity basis:
1. 5-Minute Increment: 21.0% of capacity up and 48.4% of capacity down2. 30-Minute Increment: 50.8% of capacity up and 49.4% of capacity down3. 60-Minute Increment: 66.7% of capacity up and 48.8% of capacity down
The amount of flexible resources needed is dictated by the magnitude of these ramps in any wind regime. However, if wind generation output forecasting methods are not accurate enough to provide sufficient notice to the operator, a more robust flexible system is needed to address both the forecast uncertainty and ramps.

The primary lessons drawn from the BPA experience, include the importance of:
1. Wind generation output forecasting accuracy2. Operational controls, i.e. the ability of the BA to feather wind and/or curtail
schedules if reserve levels are close to being exceeded3. Scheduling intervals supporting firm wind generation export requirements.
2.3.2 Electric Reliability Council of Texas (ERCOT)
As of January 2010, ERCOT has 8,916 MW of installed wind capacity on its system. In ERCOT, wind penetration has been significant and represented up to as much as 25% of the load. For example, at 3am on 10/28/2009, ERCOT load reached 22,893 MW while the wind generation produced 5,667 MW, in comparison to the all-time wind generation peak output of 6,223 MW on the same day.
As shown below (Figure ERCOT-1), ERCOT has experienced one hour ramps increasing by 3,039 MW and a decreasing by 2,847 MW. This illustrates the short-term volatility in wind generator output that can be managed either by dynamic control of variable generation and load, or the use of other flexible, dispatchable resources.

Figure ERCOT-1: Wind Increase (18-Apr-09 23:39 to 19-Apr-09 00:39) and Wind Decrease (10-Jun-09 16:35 to 10-Jun-09 17:35).
Figure ERCOT-2 shows that the updated resource plan for wind captured one hour prior to the beginning of an operating hour, which is then incorporated into ERCOT’s look-ahead planning tools. In this example, the forecast showed large wind energy availability. However, unexpectedly, there was a steady decline in energy available in the Balancing Energy stack, combined with the depletion of up-regulation service between 18:00 and the declaration of Emergency Electric Curtailment Plan (EECP) at 18:41. ERCOT’s forecast tools did not detect the approaching problem due to inaccurate input data from the resource plans.
Note the large negative Schedule Control Error (SCE) in wind-only Qualified Scheduling Entities (QSE) and lesser negative SCE of non-wind QSE’s around 18:30. (SCE performance after deployment of Responsive Reserve – as shown in green, should not be considered because responsive reserve deployment are not expected to honor QSE’s ramp rates) Responsive reserve deployment at 18:33 briefly assisted in supporting frequency, but the system failed to restore to 60 Hertz.

Figure ERCOT-2: REGULATION, REMAINING BALANCING IN BID STACK, AND FREQUENCY for 02/26/08 18:00 – 19:30
As shown in Figure ERCOT-4, the Day Ahead Replacement Reserve (RPRS) market study for the Operating Day of February 26th, 2008 procured no units for congestion and capacity for the evening hours. The total hourly average on-line capacity at HE 19:00 in the RPRS market study was 38,693 MW; the actual hourly average on-line system capacity in real-time was 38,062 MW, less than the day-ahead resource plan capacity by 631 MW. There was an additional unscheduled 600 MW of energy exported across the DC Tie. At 19:00 in the Day-ahead Resource Plan, wind generation was scheduled to generate 1,294 MW, real-time wind generation was approximately 335 MW, when Emergency Electric Curtailment Plan (EECP) was declared.
As shown in Figure ERCOT-5, the deployment of Load Acting as a Resource (LaaRs) was supported operations, with only two participants failing to deploy within 10 minutes. The deployment of LaaRs appears to have halted the frequency decline and restored ERCOT to stable operation.

ERCOT-3 : 1-HOUR-AVERAGE REAL-TIME ONLINE CAPACITY AND 1-HOUR-AVERAGE DAY-AHEAD ONLINE CAPACITY 02/26/08 16:00 – 20:00
1-HR AVG Real-Time Online
Capacity
1-HR AVG Day-Ahead Online
Capacity16:00 37,885 38,923
17:00 37,746 38,249
18:00 37,514 38,924
19:00 38,062 38,693
20:00 40,237 38,864
ERCOT-4: Day-Ahead Replacement Reserves for the Operating Day of February 26th, 2008
The primary lessons drawn from the ERCOT experience are the importance of:
1. Wind generation forecasting accuracy on a nodal basis2. Procuring and scheduling sufficient resources to provide the needed flexibility3. Load as a flexible resource

ERCOT-5: Load Acting as a Resources (LaaR) RRS DEPLOYMENT 02/26/08 18:30 – 19:30
2.3.3 New York Independent System Operator (NYISO)
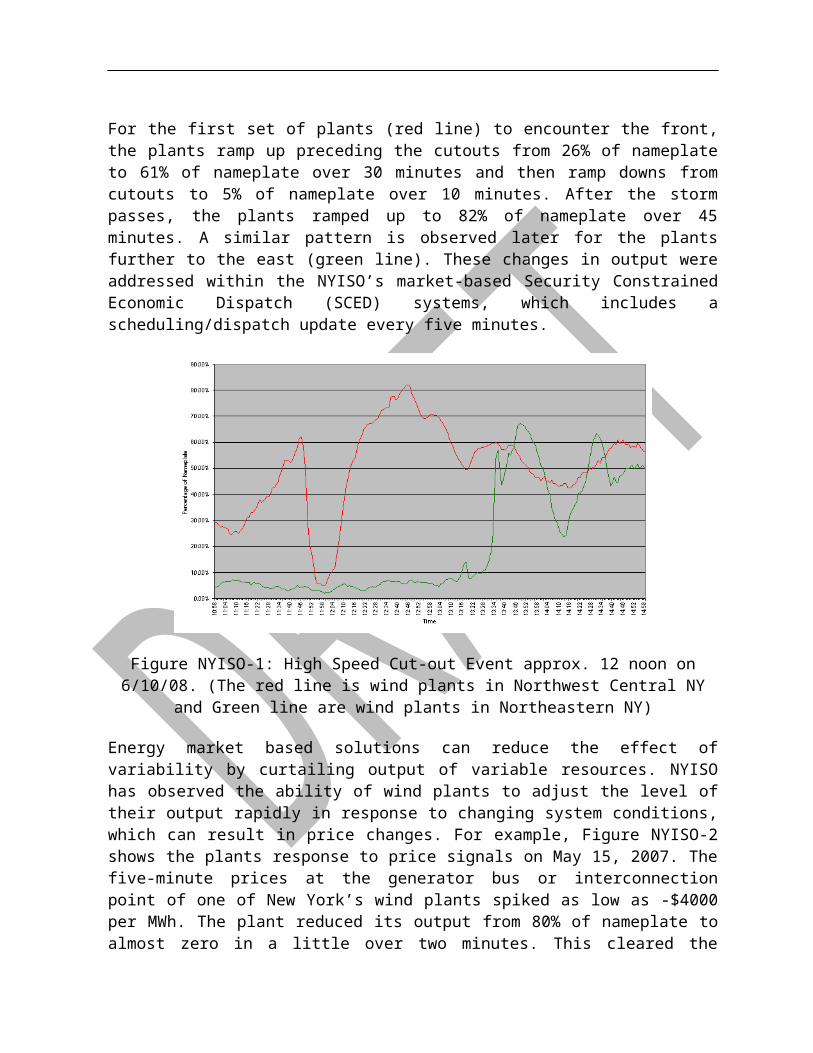
The NYISO is the system operator for the New York Balancing Area, which encompasses the entire State of New York. Installed nameplate wind generation is now over 1,200 MW. The NYISO has experienced and analyzed rare events. For example, high speed cutout was experienced, resulting from wind conditions that exceed the capability of the wind turbines requiring them to shut down rapidly to protect the equipment. In addition, quick up-ramps were experienced as the wind speed picked up suddenly. Figure NYISO-1 below is an example of a high-speed cutout event observed on June 10, 2008. Illustrated in the five-minute time steps, a front containing thunderstorms moved from east to west across the Northern portion of the New York Control Area affecting wind plants at different locations on the system.
For the first set of plants (red line) to encounter the front, the plants ramp up preceding the cutouts from 26% of nameplate to 61% of nameplate over 30 minutes and then ramp downs from cutouts to 5% of nameplate over 10 minutes. After the storm passes, the plants ramped up to 82% of nameplate over 45 minutes. A similar pattern is observed later for the plants further to the east (green line). These changes in output were addressed within the NYISO’s market-based Security Constrained Economic Dispatch (SCED) systems, which includes a scheduling/dispatch update every five minutes.

Figure NYISO-1: High Speed Cut-out Event approx. 12 noon on 6/10/08. (The red line is wind plants in Northwest Central NY and Green line are wind plants in Northeastern NY)
Energy market based solutions can reduce the effect of variability by curtailing output of variable resources. NYISO has observed the ability of wind plants to adjust the level of their output rapidly in response to changing system conditions, which can result in price changes. For example, Figure NYISO-2 shows the plants response to price signals on May 15, 2007. The five-minute prices at the generator bus or interconnection point of one of New York’s wind plants spiked as low as -$4000 per MWh. The plant reduced its output from 80% of nameplate to almost zero in a little over two minutes. This cleared the congestion problem. However, the plant only needed to move to about 60% of nameplate to clear the congestion. This was the result of the wind plant not being supplied information as the appropriate generation level to clear congestion.
Wind Plant Response to Negative Prices
0%
10%
20%
30%
40%
50%
60%
70%
80%
90%
100%
5 Min. Time Steps
Out
put a
s %
Nam
epla
te
% of Nameplate

Figure NYISO-2: Wind Plant Response to Negative Prices
The primary lessons that can be drawn from the NYISO experience are as follows:
1. The importance of situational awareness because weather conditions alter the output of variable generation significantly over short periods of time.
2. The importance of market signals.3. The importance of being able to send wind plant operators dispatch or base point
signals.

Chapter 3: Sources of FlexibilityChapter 3: Sources of Flexibility3.1 Introduction - Sources of System Flexibility
In many instances, large penetration levels of variable generation will introduce the need to develop sources of flexibility needed to maintain reliability and/or improve operational efficiency. Although system operators can attempt to derive sufficient system flexibility from existing conventional resources, the physical constraints of the existing resource portfolio and/or the resulting cost may be challenging. Therefore, a broader mix of resources with flexible characteristics along with sufficient transmission may be needed by operators to manage the higher levels of variability and uncertainty. Further, in the presence of large penetrations of wind resources, the differences between actual generator demand for gas supply on the pipeline system and the anticipated day-ahead nomination schedule may become quite divergent, stressing the gas transportation system. This could potentially affect the flexibility of generation whose sole source of fuel is natural gas.
Flexibility can come from a number of potential sources. Reliability considerations and issues resulting from the need for this flexibility are briefly described in the following sections. 3.2 Flexible Conventional Generation
Flexibility can come from conventional generation designed to have more flexible characteristics, including:
1. Ramp rate2. Operating range, including minimum generating level3. Start-up/shut-down times4. Minimum up and down times
Manufacturers are already developing units that have higher ramp rates and cycling capabilities. A more flexible conventional fleet will also require traditional base load units, such as coal and nuclear plants, which have lower minimum operating levels and increased ability to cycle. In a power market environment, these services are typically procured through day-ahead and hour-ahead markets. In a vertically-integrated system, the different categories of ancillary services are procured by the utility as part of the inclusive service.
In power market environments, operational flexibility is of high value to system operators, it has correspondingly little value for power suppliers unless they are compensated. Understandably, generator owners and operators are reluctant to operate their generation at lower minimum turn-downs, or to ramp up and down more frequently, as such actions imposes increased wear and tear on their units and direct costs such as increased fuel consumption. Thus, accessing greater flexibility from existing generation units will require market and/or policy changes. If market participants are provided incentives to do so, expanded flexibility will result in resource development that is offered to the market. For example, price signals could be used to signal a greater need for load-following or multi-directional regulation services via an ancillary service markets. On the other hand, states or utilities with integrated

resource planning processes could incorporate resource flexibility as a criteria for resource evaluation and implementation.
3.3 Demand Response
Demand response or load management is defined as the ability of end users of electricity to reduce load in response to price signals or other grid management incentives and regulations. Effective demand response programs can provide essential flexibility over relatively short timeframes when an unpredictable change in variable generation output occurs. Demand response has already been shown in some BAs to be a flexible tool for operators to use with wind generation. Traditionally, demand response programs have been used to reduce peak electricity demand or providing planning reserve margins, rather than for operating reserves to be used for aiding wind integration.
More recently, however, several BAs have realized the potential for curtailable load programs to be used as a non-spinning or supplemental operating reserve that can effectively counter variable generation down ramps. For example, ERCOT’s response in calling on 1,200 MW of curtailable load to restore system frequency during the incident in Texas in February 2008, demonstrated the effectiveness of using demand response to enhance system flexibility (see Section 2 and detailed description in the Operating Experience Appendix). Alternatively, a demand response program that shifts load to periods with high wind production could be used to avoid curtailment of variable generation during peak output to manage conditions of high variable generation in times of low or minimum load.
3.4 Variable Generation Power Management (Curtailment)
To the extent that energy markets and available operating reserves are insufficient to maintain reliability, out of market actions, including limiting or curtailing supply may be required to restore reliable system operation. Curtailment of variable generation output may be necessary if the amount available at a specific time is more than what the grid can reliably deliver. In fact, for grids with small balancing areas dominated by thermal generation that is not flexible, wind curtailments could occur even at low variable generation penetrations. Recent wind integration studies and operating experience demonstrate that at higher levels of penetration, wind generation may need to be curtailed during certain periods. Wind can also be curtailed to provide reserves i.e. a source of flexibility. The Bonneville Power Administration and the Alberta Electric Service Operator have each implemented operational procedures to curtail and or limit the ramping of variable generation on their systems under specified reliability-based criteria. These are discussed further in the Examples of Variable Generation Integration Appendix. Typically, variable generation curtailment is required at generation surplus conditions, namely, low load with thermal unit dispatched at the minimum stable operating limits. Curtailment is also required under unforeseen (i.e. not forecasted) wind conditions such as wind gusts or microbursts, and under islanding conditions or system emergencies where wind variability cannot be tolerated.

3.5 Energy Storage
Energy storage technologies also have the potential to assist the large-scale integration of variable generation. The ability of storage to transform energy into capacity has many advantages depending on the technical capabilities and economics of the technology. Pumped hydro comprises the vast majority of energy storage used today, though there are numerous storage technologies in various stages of development and commercialization that can provide some level of system flexibility. Technologies, like battery energy storage (BESS), flywheel energy storage (FESS), and Compressed Air Energy Storage (CAES), continue to mature. Storage can be used to provide three varying support services:
1. Load shifting service: The storage system charges in periods of surplus and discharges during periods of scarcity
2. Shorter-term balancing service: Stored electricity is used to smooth variation of wind farm output thereby reducing the need for some spinning reserves
3. Quick-acting instantaneous service: The storage systems provide immediate frequency and regulation products.
The present economic drivers for energy storage with fast discharge are stronger than those with long-term discharge characteristics. However, the cost of storage devices compared to other methods of flexibility currently has limited their applicability to specific and limited situations. The benefits of energy storage are most broadly realized and valuable when operated as a system resource for the benefit of the entire system, and not in a dedicated mode for any individual resource such as variable generation plants. As a system resource, energy storage may be linked to power system network controls and responsive to system operators to provide ancillary services such as regulation, demand following (ramping), capacity, etc. As a network resource, it is available to balance variability of any combination of resources and demands.
3.6 Electric Vehicles
Electric vehicles (EVs), including Plug-in Hybrid Electric Vehicles (PHEV), may prove to be a source of flexibility for the electric power system sometime in the future. Use of plug-in all-electric and hybrid vehicles for storage of electricity is another variation of battery storage. As electric vehicles become available, they could also provide energy storage services that can benefit a bulk power system experiencing increasing levels of variability. It is envisioned that when plugged in for charging, EVs and PHEVs could provide supplemental reserves as a demand response type product or regulating reserve services. Many design hurdles need to be overcome, however, to fully capture the potential benefits of synergies between variable generation and electric vehicles. Further work on storage and electric vehicles is being carried out as part of IVGTF Task 1.5.
3.7 Sub-Hourly Generation Scheduling
In many BAs, generation is scheduled on an hourly basis with most generators following flat hourly schedules set one hour or more in advance. Changes in load or generation occurring within the hour, must be met by generating units providng regulation and load following services. Scheduling generation on shorter time intervals can reduce the need for units to provide costly regulation services, freeing them up to support system flexibility requirements. Sub-hourly energy markets can provide economic incentives for generators to respond when needed, improving ramping capability and reducing the need to dispatch generators out of economic merit order. Additionally, the sub-hourly scheduling reduces the period of uncertainty around wind generation schedules and allows wind plant owners to adjust schedules more frequently. For example, with these potential benefits in mind, BPA has recently announced plans to start a sub-hourly scheduling pilot to allow wind generators to purchase and sell on a half-hourly basis. 3.8 Consolidation of Balancing Areas
NERC currently lists 131 balancing areas (BAs) within North America. As the term implies, each BA must continuously balance load and generation within its area. If there is sufficient transmission capacity, increasing the size of a BA or collectively sharing the balancing obligation among a group of balancing areas can provide more flexibility to integrate variable generation in at least two respects. First, larger BAs provide access to more available generating resources and other sources of flexibility. Second, a larger BA can take advantage of the geographic diversity of wind resources across a larger footprint, thereby helping to smooth the variability of wind production. Recent studies show that balancing area consolidation will reduce the ramping requirements for load, wind, and load with wind. Results reveal that the ramping penalty associated with operating independent balancing areas increases significantly when there is significant wind penetration.
The ACE Diversity Interchange (ADI) pilot project underway among utilities in the Western Electric Coordinating Council (WECC) is an example of BAs sharing balancing responsibilities without actually consolidating BAs. The ADI project pools ACE signals from thirteen BAs within WECC, and sends AGC (automatic generation control) signals based on the reduced requirement that is based on the combined requirements for system balance. By sharing ACE among multiple control areas, diversity in load and generating resources is captured. Early experience with the ACE Diversity Interchange indicated improvements in meeting ACE requirements and in other reliability performance measures.
3.9 Enabling Flexibility through Transmission Planning
Transmission (internal within a system and to other systems) by itself does not provide flexibility. However, transmission provides access to additional sources of needed flexible resources creating a vehicle to share them between BAs.

Because much of the variability in variable generation resources is due to the presence, or absence, of the ‘fuel’ source at a specific physical location, inclusion of a larger number of diverse locations of variable generation would reduce the overall change in the supply/demand balances for a specific ramping event. In order to include a wider array of sources, it is necessary to ensure adequate transmission between those diverse areas.
In recognition of the variable resource output, transmission planning studies need to include the likelihood that there will be no wind and that the transmission network must be able to operate under these conditions. This requires not only design-focused planning studies to consider this eventuality, but near-term operating studies as well. These operating studies may include unit commitment studies as well as maintenance planning for both resource and transmission maintenance activities. Unit commitment studies need to consider the possibility of wind not being available as well as the possibility of higher than anticipated wind generations. The ability of flexible resources to respond to dispatch signals and prevailing spot prices may affect a daily operating plan.
While the loss of generating output due to widespread instantaneous wind cutout is not as dramatic as the sudden loss of a single large generating unit, there are transmission related issues that need to be addressed. These include high-speed wind cutout of plants as a storm front crosses through an area as well as the potential for long-lasting faults that have the possibility of tripping entire wind plants off-line. 3.10 Institutional Aspects of Natural Gas Transportation to Manage Variable
Generation
While a robust transmission system can provide access to a significant amount of flexible resources, there may be institutional issues that can create barriers to using the available flexibility. These include the need to adhere to inter-area scheduling protocols that are intended to provide certainty to other control areas so that their operations can be managed in an orderly and controllable manner. Relying on the ability to import and export energy in the presence of large swings in variable generation is not an attractive alternative.
Like electrical transmission on the electrical network, transportation of natural gas must be managed and controlled to balance the supply and demand of natural gas at various injection and delivery points. In the presence of large penetrations of wind resources, the differences between actual electric sector demand on the pipeline system and the anticipated day-ahead nomination schedule may become quite divergent. With the current level of relatively rigid nominations and delivery schedules, there may be reliability challenges to managing this scheduling process. It may be prudent to advocate for additional gas pipeline scheduling and control technology to make the natural gas flows are more flexible.
3.11 Conclusion
Power systems have many sources of flexibility that are currently needed to maintain balance of supply and demand in anticipation of potential changes in system conditions. These changes can be expected and planned for such as a morning load rise, which can require a dramatic and

prompt increase in generation to follow loads. An unexpected change in the supply/demand balance can follow the loss of a large generating unit require fast acting generation or load response to return the system to balance. These flexibility needs are known and have been anticipated during the planning process. Additionally, there are long-term (i.e. daily, weekly and seasonal) concerns about balancing supply and demand that need to be addressed elsewhere4.
The primary finding from the this chapter is that, although the integration of variable generation will result in greater overall system variability and increased need for flexibility, the power system of the future should have more options available to it to achieve that flexibility. However, many issues remain to be addressed and the challenge will be to identify the need for that flexibility and plan accordingly.
4 These forms of longer term flexibility are typically satisfied by having energy stored in the form of solid, liquid or gaseous fuels that can be converted to electrical energy as needed through a conventional power plant or hydro electric facility. The need for these additional fuel-to-electricity resources is addressed in Task 1.2 (Capacity Value) which is concerned with the contribution of variable generation to satisfying a supply / demand balance during peak load conditions; absent dynamic disturbances to the power system or changes in variable generation output.
Sinks
Match Makers
SourcesPh
ysic
al
Insti
tutio
nal
Econ
omic
LoadSolarWind etc..
DSMVGConventional Generation
Electricity Storage Interconnection
Transmission NetworksFuel Storage
ForecastingGate ClosureGrid Codes
Ancillary Services MarketsCycling Costs
Market ResolutionBalancing Area SizeUnit Commitment

Chapter 4: Measuring FlexibilityChapter 4: Measuring Flexibility
4.1 Introduction
A modern electrical system must continuously maintain a balance between load and supply. To accomplish this, the system must have flexible resources, which can increase or decrease to maintain this balance almost instantaneously. In this chapter we will define the characteristics of the imbalances between supply and demand that occur in an electrical system. Metrics are proposed here to measure these characteristics and can be mapped to the characteristics of flexible resources used to correct these imbalances.
4.2 Characteristics of Demand & Supply Imbalances & Need for System Flexibility
A number of characteristics must be considered when describing imbalances of supply and demand which are indications of the system needs for flexible resources. These can be grouped into three main areas:
Magnitude refers to both the size of ramp events and the direction of that event. Traditional reserve calculations sometimes measure the requirements as the size of the first and second contingencies. Incremental flexibility is required at times of facility outages and net load increases while decremental flexibility is required when net load decreases. On the supply-side, the magnitude is an indicator of the resources needed to respond to the ramp event .
Ramp Response refers to both the rate of change of the net load or unit output and their predictability. The ramp rate of the resources must be sufficient to be available to respond to system ramping needs. Large ramping events which happen quickly will require fast acting, responsive resources or the simultaneous movement of a larger number of slower acting resources or a combination of both to meet the ramping needs of the system. Slower acting ramps, such as seasonal variations, require less responsive resources. Resources that can respond quickly would be labeled highly responsive ramping resources while resources with slower response times would be labeled lower responsive ramping resources.
The ability to forecast load and variable generation with acceptable forecast error significantly affects the responsiveness of the flexible resource required to meet ramp requirements. The response to a forecast event can be quite different compared to an identical event occurring unexpectedly. Therefore, better forecasting results in a mix of the responsiveness of the resources that meet the ramping needs of the system while minimizing costs and required operating margins.
Frequency refers to the number of times events of various magnitudes and responsiveness occur. Variable resources generally increase the number of times flexible resources must be used in response to small or medium sized events. This is usually a cost issue as resources incur an operating cost each time they are used to balance supply and demand

Available Flexible Resources determines the ability to change resources in response to imbalances between net load and total resources. The resources deployed must respond to the same event so the characteristics of the total response by all of the flexible resources are described by the aspects described above. Each individual resource will also have characteristics, which can be described by the aspects above.
4.3 Impact of Variable Generation on Imbalance and Net Load Ramping Characteristics
Over time, load patterns have largely become well understood and are forecast with high accuracy. The morning and evening demand ramp rates are large. However, they are well forecast so they have a low Ramp Response requirement. Less easily forecast load fluctuations are usually of a smaller Magnitude. Large Magnitude, unpredicted events are usually caused by equipment, generation or transmission failures, which can result in an undersupply situation.
Forecasted load duration curves give ramp rates, indicating the speed of the resource that needs to be available to meet it. Adding variable resources to the system mix decreases predictability and increases the variability in the net load. Because of this, the system will require more ramping capability to be available such as faster reacting, or higher ramp responsiveness, flexible resources.
As shown in Chapter 2 and the examples in the Appendix, adding variable generation to a system will usually increase the Frequency of higher and medium magnitude events. As the ability to forecast changes in variable generation increases the required responsiveness will decrease. Systems with highly correlated variable resources could see an increase in the Frequency of large Magnitude and high Ramp Response events.
One of the more unique impacts of variable generation is an increase in the frequency of high and medium Magnitude events resulting in oversupply—variable generation coming onto the system quickly and unpredicted. These events are particularly problematic during night valleys when much of the Available Flexible Resource on line has little down ramp capability available.
4.4 Characteristics of Flexible Resources
The various flexible resources available are described in Chapter 3. This section will describe how the characteristics above apply to these resources. In most cases these resources are physical equipment with well-defined characteristics already well-defined to permit efficient dispatch. For most generation and demand-side resources the Magnitude of the flexibility it can provide (capacity above minimum load) and the responsiveness (ramp rate in MW/min. either up or down) are standard quantities. Especially with demand resources they may only provide incremental or decremental flexibility.
The Frequency with which the resource responds is not usually restricted. However, interruptible loads are often limited in the number of times they can be called on, excessive

cycling of base load plant causes wear and tear increasing the likelihood of outages, and energy constrained units are limited by the reservoir capacity and level. Some resources require significant lead times to start, which reduces the Ramp Response of the flexibility they offer. Unit synchronization time is the standard descriptor of this. Others are required to be at a minimum load (already synchronized) before they can offer flexibility.
4.5 Metrics for Load Ramping, Supply/Demand Imbalances & Flexible Resources
Metrics based on the net load are needed which should indicate the resultant needs of the system. A framework of characteristics is provided above: Magnitude, Response and Frequency, which need to be captured in these metrics. These metrics will not be directly dependent on the penetration of variable generation. However, as shown in Chapter 2 and the examples in the Appendix, variable generation will change these metrics and hence the amount of flexible resources required.
In the operating timeframe, the two most commonly defined metrics for flexible resources are operating reserve usually divided into two or more categories based on speed of response and system regulation (automatic generation control). Operating reserves are designed to respond to the instantaneous loss of the largest source of supply, these are large Magnitude events with a high ramp requirement. Regulation is designed to respond to the second-to-second random fluctuations in load—high Frequency and Ramp Responsivenessbut low Magnitude.
Chapter 2 presented the affects of Frequency of the various ramp Magnitudes on net load within one hour along with how this changes with the addition wind generation. The maximum positive or negative change gives the value for the Magnitude metric. It may be reasonable to exclude some observations if they should be considered extreme events or a reliability criteria similar to the Loss of Load Expectation is used. Similar to generation adequacy planning, this method assumes that if sufficient resources are available to meet the largest change, then smaller changes do not pose a threat to system reliability. The metric must also include the requirement for flexibility caused by equipment outages.
The Ramp Response characteristic includes the rate of ramping required from flexible resources and the predictability of the ramp. Measuring the maximum Magnitude change over various time scales (for example 10 min., 30 min., 1 hr., & 4 hrs.) and unit start up times would capture the rate of ramp aspect of Ramp Response. Predictability needs to include components such as event forecast accuracy and advance warning. Based on the resources described in Chapter 4 predictability can be divided into unpredicted random events (random net load fluctuations or equipment failures), forecast 1 or 2 hours ahead and planned events forecast 4 or more hours ahead (daily load or variable resource ramps or the impact of weather fronts).
The Frequency metric measures the frequency of ramp events of various sizes. A minimum amount of data includes the number and average size of positive and negative events. Minimum up and down times are a measure of the maximum frequency a conventional generator can be deployed as a flexible resource. Measurement of the Frequency for energy constrained resources is a topic for further research. Most resources are not limited in their Frequency of use, however, so perhaps Frequency can be left unmeasured by a metric initially.

A resultant characteristic is the Intensity which is a combination of the aspects of magnitude and ramp response. A large magnitude event over a very short period of time (responsive) would be a high intensity ramping event. Conversely, a low magnitude ramping event over any timeframe would be a low intensity ramping event. In addition, a large magnitude event over a long period of time or one which was easily forecast would be a low intensity event. Events in between would be characterized as medium intensity events.
This leaves an initial list of 24 metrics tabulated and illustrated below in Table X:
Maximum +/- Ramp IntensityRandom 10 Min.
Random 30 Min.
Random1 Hour
Random4 Hours
HIGH
Forecast 10 Min.
Forecast 30 Min.
Forecast 1 Hour
Forecast4 Hours
MEDIUM
Planned 10 Min.
Planned30 Min.
Planned1 Hour
Planned4 Hours
LOW
These metrics can largely be assembled solely from the pattern of net load adding the impact of equipment failures as a separate step. If the largest equipment failure will cause an event that is smaller than the maximum net load ramp there is not impact on the metrics. Eventually some of these metrics will dominate and some will provide no useful information. It is not obvious at this time which of the 24 metrics will fall into each category. This will become apparent with further study and experience of using these metrics.
Over each time scale of the metrics above and separately for positive and negative directions, the rated ramp, which all the flexible resources on the system can provide can be calculated. This is a function of the time step, unit ramp rate and the maximum unit output—the Response aspects of the flexible resource. The unit synchronization time will also be relevant at longer time scales. If the sum of the resources available exceeds the metric there are sufficient flexible resources on the system. Some allowance will have to be made for forced outages and the frequency with which a resource can be called on would have to be considered qualitatively.
4.6 Flexibility Resource Scheduling
Quantifying the flexible resource available in an operational time frame is more challenging. While the individual flexibilities can be quantified e.g. ramping rates of thermal units, difficulties arise when modeling the operational aspects. For example the ramping up rate of a thermal unit is not available if the unit is dispatched at its maximum and vice versa the ramping down is not available if the unit is at minimum.
System operators must schedule sufficient flexible resources to meet the flexibility requirements continuously. The most efficient operational practices are those, which maximize the amount of flexibility available while minimizing cost. If operational aspects are not taken into account, from a planning point of view the system might well appear to have enough

flexibility but operationally it cannot be accessed when needed. The question then becomes what kinds of additional modeling tools and metrics might be required beyond current practices to ensure that the flexibility requirements that result from variable generations are adequately captured in system planning studies.
There are no universally accepted metric or standard practices for explicitly capturing the concept of matching the resources to the requirements for flexibility, while ensuring that system adequacy is maintained within design criteria. A method, which is in its formative stage, is proposed here based on an adaptation of the Equivalent Load Carrying Capability (ELCC).5 The Effective Ramping Capability (ERC) measures the flexible resource available to the system operator from conventional plant, in a planning context. This method is based on the Effective Load Carrying Capability tool that is used in Task 1.2 to determine the capacity value of variable generation.
While the ELCC approximates a unit’s contribution to meeting overall demand, the ERC attempts to approximate a unit’s contribution to meeting net load changes. The ERC is a planning metric comprised of a set of values, describing a unit’s contribution to the system’s ability to ramp in a given direction over different time scales. Time steps can be chosen to match the data, which exists for a system or to the time steps used in reserve categories, such as 10 and 30 minutes. For example, the incremental 15 minute ERC is the additional active power a unit contributes to the system in 15 minutes, while the decremental 60 minute ERC is the decrease in unit output in 60 minutes. The ERC available to a power system then could be matched with needs as measured by the intensity distribution developed from the net-load ramps. Much work and proof of concept remains to be completed before this metric is available for use in planning studies.
5 “Integration of Variable Generation: Capacity Value and Evaluation of Flexibility”, IEEE PES, July 2010.

Chapter 5: Conclusions and RecommendationsChapter 5: Conclusions and Recommendations
This primary conclusion of this document is that as variable generation penetration increases it will result in a need for increased system flexibility. This flexibility manifests itself in terms of the need for dispatchable resources to meet increased ramping and load following needs some of which could occur rather unexpectedly, i.e. not forecast. The need for flexibility will need to be accounted for in system planning studies. This document has concluded that enhancements to existing system planning practices will be required to account for increased flexibility necessitated by the integration of variable generation. System planning studies focus both on the reliability of the power system as well as optimizing the overall economics of the power system, here the emphasis is on reliability.
The primary measure for assessing system flexibility needs resulting from the integration of variable generation is the net load (load minus variable generation in all timeframes). Currently, there is no universally accepted measure of flexibility and flexibility needs to compare across systems. The availability of such an index could potentially facilitate the evaluation of flexibility needs on broader scale. A recent IEEE paper entitled: “Integration of Variable Generation: Capacity Value and Evaluation of Flexibility” proposed the development of concept described Effective Ramping Capability (ERC). The ERC would provide a metric for quantifying a systems flexibility capability and comparing that to a metric that would measure its needs. Here the concept of Intensity as a metric is also introduced but it also requires substantial development and scrutinity before it can be used in mainstream planning applications. The industry should support the development of flexibility metrics.
Net load impacts can be evaluated explicitly or implicitly with tools such as a chronological production cost simulation model that model transmission constraints. Current system planning practices and tools with appropriate modifications and enhancements provide a basis for evaluating the impact of variable generation on system flexibility needs. This has been demonstrated in a number of recently completed studies whose objective was to evaluate the integration of variable generation. Examples of these studies include, but not limited to, the California ISO Study, the Ontario Power Authority Study, the Electric Reliability Council of Texas (ERCOT) Study and more recently the Department of Energy’s Eastern Wind and Transmission Integration Study. All of the studies had one thing in common which was to address how the variable generation impacts the need for system flexibility. The study approaches shared many common themes which included:
A much tighter linkage between power flow tools and production cost models, which includes transmission models to assess the interaction between the dispatchablility of wind and transmission to determine wind plant dispatch levels for system stability analysis.
That production cost models adequately capture sub hourly ramp rate and minimum generation constraints and account for regulation requirements through extensive use of statistical analysis of simulated net-load data.
Ensure that resource adequacy models (LOLP models) reflect the uncertain nature of variable generation (this topic is covered by Task 2.1).

In addition, there are data needs in particular that are required for the integration variable generation planning studies:
Determination of the interconnection point for the variable generation Development specification for and identify of data source which facilitate the
accurate modeling of variable generation resources. Models that accurately simulate the output of variable generation that ensure
expected output profile is cotemporaneous with the load profile and represents the uncertainty in the profile.
These study efforts should be reviewed to identify best practices and to develop guidelines for the use of and enhancements to existing planning tools for evaluating the flexibility needs that arise from the integration of variable generation
In addition to identifying the impact of variable generation on the characteristics of system flexibility and their implication for system planning, the report also identified the many sources of flexibility available to system planners and operators. New sources such as demand side management may be particularly attractive and need further study. Many of the most important sources may not be physical but institutional i.e. they unlock the physical flexibility (e.g. forecasting, market design etc.). This indicates there is a portfolio of alternatives available to a power system to meet its flexibility requirements. These options would need to be evaluated within the context of the enhanced system planning framework. It should also be noted that many systems may already possess the needed flexibility and therefore there may be no need to develop additional sources.

Appendix: Examples of VG Integration
Appendix: Examples of Variable Generation Appendix: Examples of Variable Generation IntegrationIntegration Introduction
The purpose of this Appendix is to provide real world examples of power systems that are already dealing with the challenges of integrating variable generation resources and document the operational adjustments they are making to enhance operational flexibility in the presence of variable resources. Examples are provided from across North America as well as Europe.
BPA Example
As of November 2009, the Bonneville Power Administration (BPA) had 2,253 megawatts (MW) of installed wind capacity interconnected with its balancing authority (BA). With a peak net internal demand of 10,500 MW, this means that wind penetration in the BPA BA is over 20% of capacity. It is estimated that over 75% of this wind generation serves load outside of the BA. For the most part, BPA is required to firm this generation for export through the hour consistent with WECC’s current scheduling protocols. As shown in Figure X.y, it is likely that the installed wind capacity interconnected into the BPA grid will be over 10,000 MW by 2016 with an increasing percentage of wind generation exported to other BAs.
Figure X.y – need caption

Appendix: Examples of VG Integration
Intra-hour wind balancing reserves are currently calculated based on a 30-minute persistence level of forecasting accuracy. In November 2009, BPA held about 31% inc and 38% dec reserves on an installed wind capacity basis to integrate wind generation into the BA. BPA has created the Wind Integration Team (WIT) to address the challenges of integrating high levels of wind generation into grid. The WIT technical members and sponsors are actively working with BPA customers and the wind development community on a number of efforts to effectively integrate wind generation into the grid. Success in a number of these efforts (Figure X.z) will likely result in lower intra-hour balancing reserves.
Figure X.z: BPA WIT Initiatives
The absolute level of these reserves, which are separated into the regulating (seconds), following (10-minute) and generation imbalance (GI—through the hour) timeframes is dependent on such factors as:
4. Wind generation forecasting accuracy;
5. Operational controls, i.e. the ability of the BA to feather wind and/or curtail schedules if reserve levels are close to being exceeded;
6. The scheduling interval through which wind generation for export needs to be firmed; and
7. The amount of wind generation, which can be dynamically scheduled, or pseudo-tied to other BAs.

Appendix: Examples of VG Integration
Flexible resources are mainly required to supply regulating and following reserves. Figure X.w is an example of the variability of wind generation in the BPA BA. Since BPA began tabulating ramp rates for the 5 minute, 30 minute and 60 minute increments, following are the maximum ramps experienced on an installed wind capacity basis:
1. 60-Minute Increment: 66.7% up and 48.8% down
2. 30-Minute Increment: 50.8% up and 49.4% down
3. 5-Minute Increment: 21.0% up and 48.4% down
Figure X.w – caption needed
It is the magnitude of these ramps in any wind regime, which dictate the amount of flexible resources needed. However, if wind generation forecasting methods are not sufficiently accurate to provide notice to the operator when these ramps might be expected, additional or extremely flexible resources may be needed to address this uncertainty, including:
1. Construction of transmission infrastructure necessary to interconnect wind turbines and deliver generation to load
2. Improvements to capabilities to accurately forecast wind generation

Appendix: Examples of VG Integration
AESO Example
The Alberta Electric System Operator (AESO) manages a fairly isolated system with limited interconnections to grids outside Alberta, and therefore a limited ability to share balancing services. Additionally, the generation in the AESO is mainly large base-load coal-fired plants along with a significant amount of cogeneration. The AESO’s peak load is approximately 9,800 MW. Current wind capacity on the AESO system is approximately 500 MW, more than 5% of peak load by capacity. There is more than 12,900 MW of additional wind power projects in the AESO’s interconnection queue. Two recent wind power ramp events are described next.
May 21, 2009. Figure 2 10 shows the AESO aggregate wind generation output and system load variation during a wind power ramp event that took place on May 21-22, 2009. Beginning at approximately 10:30 pm local time, wind power ramps approximately 310 MW over a 70-minute period while load decreased approximately 460 MW as part of the nightly load drop off. There was a coincident schedule increase in interchange of +120 MW, so that the net-demand change to be offset was about -650 MW (-460-310+120). The AESO operators had sufficient down ramping capability available to accommodate the up-ramp in the form of 100 MW from regulating reserves on units on AGC and 500 MW of energy market generation). Figure 2 10 also shows, that within minutes of the up-ramp peaking, the wind generation began to ramp down, dropping 275 MW over the 140 minutes. Because the wind coincided with the still dropping load, it did not cause any operational issue . During the entire event, the largest ACE deviation reached 110 MW, which did not result in any NERC control performance standard (CPS2) violations. As such, the operators were able to manage the ramp event without any reliability implications because sufficient flexibility was available from other generation to accommodate the ramp.

Appendix: Examples of VG Integration
Figure 2 10 AESO Wind Power Output and System Demand during May 21, 2009
On July 30, 2009, AESO experienced a similar wind ramp event occurred on July 30, 2009, which is shown in Figure 2 11. During this event, wind power ramps-up from about 50 MW at 18:40 to 325 MW at 19:04 or 275 MW in 25 minutes, and then back down to 100MW at 20:14 (225 MW in 70 minutes). During that period, the interchange schedule did not change, and the load was also relatively flat. In response to the over-generation situation resulting from the up ramp and the potential that the wind would ramp further up to the full 500MW capacity, the AESO system operator dispatched down about 480MW of thermal capacity from the energy market merit order. Because of the magnitude and steepness of the up-ramp, regulating reserves and dispatch of the balancing reserves were not able to follow the ramp and a positive ACE of 177MW occurred, resulting in an over-generation CPS2 violation. Subsequently, the wind down ramp that followed immediately coincided with the decreasing thermal generation in response to the operator dispatch, causing a negative ACE of -126 MW and another CPS2 violation for under-generation. In response to the under-generation condition, the system operator dispatched up about 420MW of energy market capacity .In general, this event did not cause any serious reliability issue, but it did result in CPS2 violations and additional costs associated with balancing energy that was dispatched.
Figure 2 11
AESO Wind Power Output during July 30, 2009 Ramp

Appendix: Examples of VG Integration
ERCOT Example
As of January 2010, ERCOT has 8,916 MW of wind generation installed on its system. It is anticipated that with expansion of the transmission system via the Competitive Renewable Energy Zones (CREZ) that an additional 15,000 MW of wind generation may be added to the ERCOT system. Currently, ERCOT assumes that wind has an Effective Load Carrying Capability (ELCC) of 8.7% based on a Loss of Load Probability (LOLP) study completed in 2007. Based on this assumption, 776 MW is assumed to be firm capacity from wind generation in ERCOT. ERCOT is in the process of updating this analysis of LOLP and ELCC for wind.
In 2009, the wind has represented up to 25% of the load (on 10/28/2009 the load at 3am was 22,893 MW and the wind generation was 5,667 MW). The all-time peak of wind generation reached 6,223 MW on that same day. As shown below, ERCOT has experienced one hour swings of 3,039 MW increases (18-Apr-09 23:39 to 19-Apr-09 00:39) and also 2,847 MW decreases (10-Jun-09 16:35 to 10-Jun-09 17:35).

Appendix: Examples of VG Integration
A detailed explanation of how another situation of wind variability has been dealt with is summarized below.
February 26, 2008 IncidentERCOT implemented Step Two of its Emergency Electric Curtailment Plan (EECP) on February 26, 2008. The primary factors leading to the implementation of the EECP was unavailable generation, which was counted as available in the ERCOT operational planning processes and resulted in a deficiency of available generation during the evening load increase. ERCOT tracks changes in the Resource Plan available capability and the load forecast through a tool called the Market Analyst Interface (MAI). This tool did not give any indication of the approaching capacity deficiency because it based its assessment of available capacity upon the Resource Plan data provided by the QSEs.
ERCOT’s current system depends upon QSE submitted resource plans to calculate available capacity to analyze adequacy for coming hours. The Resource Plans reflected more generation capacity than was actually available, primarily accounted for by inaccurate wind energy expectations.
In addition to the MAI, ERCOT runs an hour-ahead study every hour to determine if there is adequate capacity to meet the demand. The results of this study are used to determine the need for Non-Spin deployments. This study did not indicate an approaching problem because the Resource Plans indicated approximately 1,000 MW capacity available that was subsequently unavailable.

Appendix: Examples of VG Integration
Observations/Data Review 02/26/08 16:00 – 22:00 LOAD, DAY-AHEAD LOAD
FORECAST, ARR, AND
The EECP event was triggered by rapid load growth beginning about 1800 which was paralleled by a matching drop in responsive reserve. As shown in this graphic, the load between 18:00 and 18:41 grew from ~33,000 MW to ~35,550 MW or an increase of about 2,550 MW. During this period ERCOT exhausted its available regulation up service and up balancing energy service.
Load Forecast
The hourly average day-ahead 19:00 load predicted was 35,619 MW. The real-time hourly average load was 34,528 MW, below the day-ahead forecast by 1,091 MW. ERCOT experienced an instantaneous peak load of 35,863 MW at 18:52.

Appendix: Examples of VG Integration
02/26/08 15:00 – 21:00 TOTAL WIND OUTPUT, FORECASTS, MW IN THE 16:00 DAY-AHEAD RESOURCE PLAN AND UPDATED RESOURCE PLAN (*)
The day-ahead resource plan did not forecast the magnitude of the drop in wind energy encountered. However, the 80% wind forecast that was developed for and will be incorporated into he Nodal system shown in green did predict the wind output with good fidelity.

Appendix: Examples of VG Integration
(*) Updated Resource Plans are hourly values captured during the operating hour.
The second graph shows that the updated resource plan for wind (captured 1 hour prior to each hour) and that incorporated into ERCOT’s look-ahead planning tools was still showing large wind energy availability.02/26/08 18:00 – 19:30 REGULATION, REMAINING BALANCING IN BID STACK,AND FREQUENCY
The illustration shown above demonstrates the steady decline in energy available in the Balancing Energy stack, combined with the depletion of up-regulation service between 18:00 and the declaration of EECP at 18:41. As previously noted, ERCOT’s look-ahead tools did not detect the approaching problem due to inaccurate input data from the resource plans.

Appendix: Examples of VG Integration
02/26/08 18:00 – 19:30 NON-WIND QSE SCE, WIND-ONLY QSE SCE, NON-SPIN (NSRS) DEPLOYMENT, RESPONSIVE RESERVE (RRS) DEPLOYMENT AND FREQUENCY
A non-spin deployment was issued at 18:28 due to the depletion of UBES stack and Up Regulation. Responsive Reserve was deployed five minutes later due to frequency dropping below 59.91 Hz.
Note the large negative Schedule Control Error (SCE) in wind-only QSE’s and lesser negative SCE of non-wind QSE’s around 18:30. (SCE performance after deployment of Responsive Reserve – as shown in green, should probably not be considered because responsive reserve deployment does not honor QSE’s ramp rates) Responsive reserve deployment at 18:33 briefly assisted frequency, but failed to restore it to 60 Hertz.

Appendix: Examples of VG Integration
02/26/08 16:00 – 20:00 1-HOUR-AVERAGE REAL-TIME ONLINE CAPACITY AND1-HOUR-AVERAGE DAY-AHEAD ONLINE CAPACITY
1-HR AVG Real-Time Online
Capacity
1-HR AVG Day-Ahead Online
Capacity16:00 37,885 38,923
17:00 37,746 38,249
18:00 37,514 38,924
19:00 38,062 38,693
20:00 40,237 38,864
Day – Ahead Replacement Reserve The RPRS market study for the Operating Day of February 26th, 2008 procured no units for congestion and capacity for the evening hours. The total hourly average on-line capacity at HE 19:00 in the RPRS market study was 38,693 MW; the actual hourly average on-line system capacity in real-time was 38,062 MW, less than the day-ahead resource plan capacity by 631 MW. There was an additional 600 MW of energy exported across the DC Tie that was not scheduled Day Ahead. For HE 19:00 in the Day- Ahead Resource Plan wind generation was scheduled to generate 1,294 MW, real-time wind generation was approximately 335 MW when EECP was declared.

Appendix: Examples of VG Integration
02/26/08 18:30 – 19:30 LaaR RRS DEPLOYMENT
The response of Load Acting as a Resource (LaaRs) to deployment was generally good. Only two failed to deploy within 10 minutes. It appears to be the deployment of LaaRs which halted frequency decline and restored ERCOT to stable operation.
ACTION STEPS
ERCOT shall determine requirements for early integration of the Nodal Wind generation forecast into the current Zonal operating system to incorporate the forecast in the short term planning applications in place of the Resource Plan values for wind. With earlier detection of approaching deficits, additional capacity can be procured so it is available when needed.

Appendix: Examples of VG Integration
Midwest Independent System Operator Example
By the end of 2009, the registered wind capacity in MISO is 7625MW. The peak load in MISO market territory in 2009 is 95,748MW. Figure M.1 shows the monthly (Jan 2009 to Jan 2010) wind generation and it’s percentage over the whole generation. So wind occupies a very small portion (1.6% ~ 4.2%) of total resources in MISO now.
Fig. M.1 Monthly Wind Utilization in MISO
But with the state wind mandate, we will see more wind units installed in MISO. Figure M.2 shows the RPS mandates in states within MISO territory.

Appendix: Examples of VG Integration
Fig. M.2 State RPS
Figure M.3 shows the potential wind in MISO in the next two years based on the wind units in MISO generation interconnection queue.
Midwest ISO Existing Wind: 4,900 MWMidwest ISO RPS Mandates: ~ 22,000 MWRequired for 20% Federal Mandate: ~ 41,000 MW
ND10% by 2015
SD10% by 2015
MT15% by 2015
MNXcel: 30% by 2020
Others: 25% by 2025
IA105 MW
ITCM: 25% by 2028
WI10% by 2015
IL25% by 2025
INNo RPS
MI
10% by 2015
OH25% by 2025
MO15% by 2021

Appendix: Examples of VG Integration
Fig. M.3 Potential Wind in MISO in Next 2 Years
The intermittent feature of the wind causes the large variation of daily wind output. Figure M.4 is the daily wind capacity factor for Jan 2010. The capacity factor varies from 5% to about 65%. And the Standard Deviations of the peak hour capacity factor is about 21.02%.
Fig. M.4 Daily Wind Capacity Factor of Jan 2010
Intermittent nature f wind provides no guarantee of wind capacity availability on peak. Table M.1 list the installed wind capacity and wind out at annual peak from 2005 to 2009. The wind output at annual peak hour varies from 2% to 56%. Five year average availability is 17% of nameplate capacity and the standard deviation is 23%. So how to count wind in resource adequacy study is a big issue in the future if we have more wind capacity in the system. MISO is working with its stakeholders to decide the appropriate wind capacity credit to be used for
-
5,000
10,000
15,000
20,000
25,000
2005 2006 2007 2008 2009 2010 2011
In-Service Date
MW
Current Nameplate Wind In-Service
100% of MW at least in the DPP
21% of SPA MW + 100% of MW at least in the DPP 20,153 MW
12,860 MW
4,861 MW
2,462 MW1,112 MW
Actual Projected 17,181 MW
9,972 MW

Appendix: Examples of VG Integration
the annual winter and summer assessment, and planning reserve requirement evaluation. For 2010, based on the LOLE and ELCC study, we will use 8% as wind capacity credit.
Table M.1 Wind at Annual Peak
Planning Year
Metered Wind MW at Peak
Registered Max MW % of Max
2005 104 907 11.47%2006 700 1,251 55.96%2007 44 2,064 2.13%2008 384 3,085 12.45%2009 78 5,635 1.38%
Average 16.68%Std. Deviation 22.55%
So far in MISO we did not see any serious event caused by the wind due to the low percentage of wind in current system. But we do see some wind events in MISO system already. Fig. M5 and M6 show one of such kind of event happened in March 17 2009. From 8:50am to 9:50am, in 60 minutes, we see 825MW wind out drop. And from 9:32am to 9:47am, within 15 minutes, the wind output dropped 306MW.
Fig. M5 March 17 2009 Wind Event in MISO (60 minutes change)

Appendix: Examples of VG Integration
Fig. M6 March 17 2009 Wind Event in MISO (15 minutes change)
March 17 2009 events did not cause any problem in MISO system, as MISO system has enough ramp and regulation capabilities to cover this change. But in March 17 2009, MISO only had about 4000MW registered wind capacity in the system. If we consider the current RPS states’ mandate in MISO, we will see about 22,500MW wind in MISO by 2027. If we consider the potential Federal 20% RPS mandates, the MISO system will have 40,000MW wind by 2027. If we assume the wind following the same 5 minutes change as in March 17 2009, Fig. M7 shows the 5 minutes wind output change in MISO system under 4000MW (current), 22,500MW (current states RPS mandates), and 40,000MW (Federal 20% mandates) wind capacity. We can see that the 5 minutes wind drop can reach 2,400MW in 40,000MW scenario. We need more ramp and regulation capabilities in MISO.

Appendix: Examples of VG Integration
Fig. M7 Actual and Potential 5 Minutes Change in Wind Output
New York Independent System Operator Example
The New York Independent System Operator (NYISO) is the system operator for the New York Balancing Area which encompasses the entire State of New York. It also operates the State’s wholesale electricity market. The primary mission of the NYISO is as follows
1. Reliability

Appendix: Examples of VG Integration
Managing the efficient flow of power on over 10,775 miles of high-voltage transmission lines -- from more than 500 generating units -- on a minute-to-minute basis, 24 hours-a-day, seven days-a-week. The installed resource base in NY exceeds 40 GW and the all time summer system peak was 33,939 MW.
2. Markets
Administering and monitoring competitive wholesale electricity markets totaling $11 billion annually -- running auctions that match the buyers and sellers of power
3. Planning
Conducting long-term assessments of the Empire State’s electricity resources and needs
New York State adopted a Renewable Portfolio Standard which requires 25% of New York States’ electricity needs to be supplied by renewable resources by 2013. This requirement includes existing hydro plants that provide about 17% of NY’s electricity requirements. It is expected the future increases in renewables to meet the full requirements of the target will be met by wind plants. This requirement resulted in a study which was designed to conduct a comprehensive assessment of wind technology and to perform a detailed technical study to evaluate the impact of large-scale integration of wind generation on the New York Power System (NYPS). The study was conducted by GE Power System Energy Consulting in fall of 2003 and completed by year end 2004 (i.e., “the 2004 Study”).
The overall conclusions of the 2004 Study is the expectation that the NYPS can reliably accommodate up to a 10% penetration of wind generation or 3,300 MW with only minor adjustments to and extensions of its existing planning, operation, and reliability practices – e.g., forecasting of wind plant output. Since the completion of the 2004 Study, a number of the recommendations contained in the report have been adopted. They include the adoption of a low voltage ride through standard, a voltage performance standard and the implementation of a centralized forecasting service for wind plants.
Installed nameplate wind generation has now has grown to in excess of 1,200 MW and the NYISO interconnection queue significantly exceeds the 3,300 MW that was studied in the 2004 Study. In addition, the State of New York has increased its RPS standard to 30% by 2015. One of the observations made in the 2004 Study was that much could be learned from operating wind plants as they came on line. This would be a point in time that wind penetrations levels would be minimal and operating adjustments could be made based on those experiences. To that end, the NYISO has gained much experience from operating wind plants.
Besides the experience gained from day-to-day operation of wind plants, the NYISO has been able to experience and analyze rare events such as high speed cut out and how wind plants respond to real-time prices. High speed cut out is the result of wind conditions that exceed the capability of the wind turbines and they need to shut down rapidly to protect the equipment.
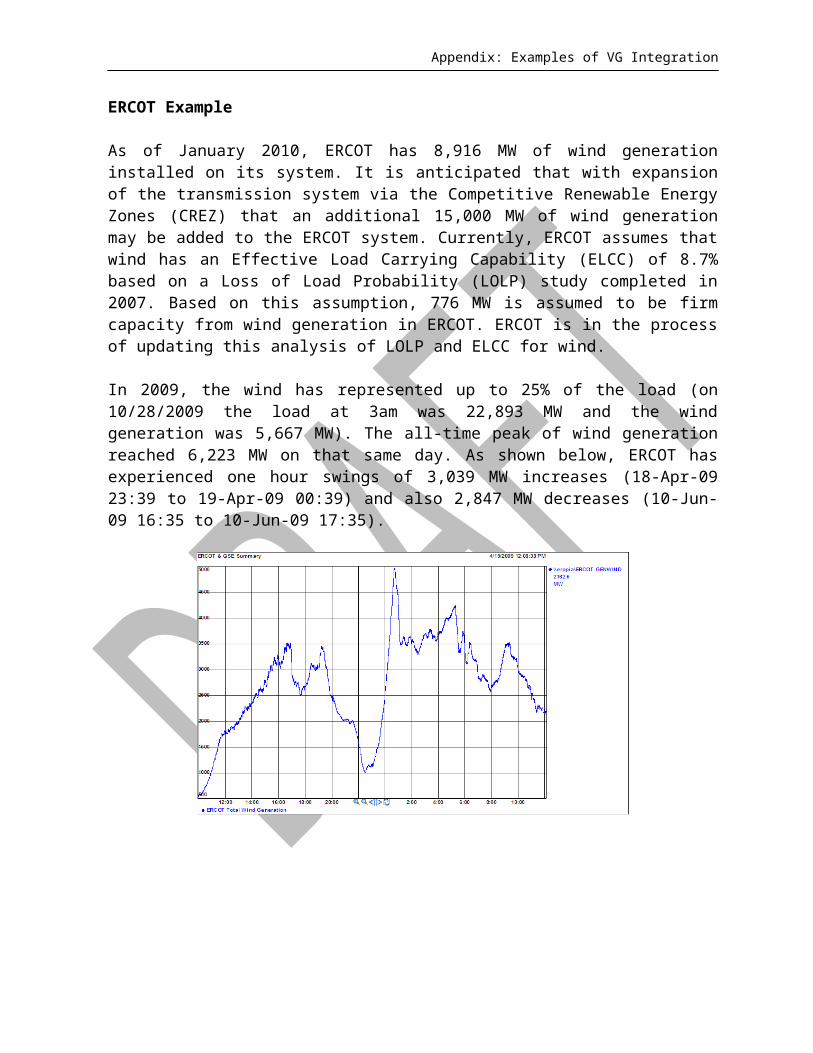
Appendix: Examples of VG Integration
They can also ramp up quickly as the wind speed picks up suddenly. Wind plants generally participate as price takers in the real time market. In NY prices are allowed to go negative.
Wind plants will ramp up quickly as thunder storm approaches a plant site and then shut down as wind speed exceeds the capability of the equipment. Figure 1 below is an example of a high speed cut out event that NYISO operations observed on June 10, 2008. The figure shows for five minute time steps how a front containing thunderstorms moved from east to west across the Northern portion of the NYCA affecting wind plants at different locations on the system. Wind plant output is expressed as a percent of nameplate. For the first set of plants (red line) to encounter the front, the plants ramp up preceding the cutouts from 26% of nameplate to 61% of nameplate over 30 minutes and then ramp downs from cutouts to 5% of nameplate over 10 minutes. After the storm passes, the plants ramp back up to 82% of nameplate over 45 minutes. A similar pattern is observed later for the plants further to the east (green line). These changes in output were able to be addressed within the NYISO’s market-based Security Constrained Economic Dispatch (SCED) systems which includes a scheduling/dispatch update every five minutes.
Figure 1 High Speed Cut-out Event approx. 12 noon on 6/10/08. The red line is wind plants in Northwest Central NY and Green line are wind plants in Northeastern NY
In addition, the NYISO has observed the ability of wind plants to adjust the level of their output rapidly in response to changing system conditions which can result in price changes. As an example, on May 15, 2007 five minute prices at the generator bus or interconnection point of one of NY’s wind plants spiked as low as -$4000 per Mwh. Figure 2 displays the plants response to theses prices. The plant reduced its output from 80% of nameplate to almost zero in a little over two minutes. This cleared the congestion problem. However, the plant only needed to move to about 60% of nameplate to clear the congestion. This was the result of the wind plant not being supplied information as the appropriate generation level to clear congestion.

Appendix: Examples of VG Integration
Wind Plant Response to Negative Prices
0%
10%
20%
30%
40%
50%
60%
70%
80%
90%
100%
5 Min. Time Steps
Out
put a
s %
Nam
epla
te
% of Nameplate
Figure 2: Wind Plant Response to Negative Prices
The day-to-day experience wind events in conjunction with these atypical operating experiences with wind plants has indicated a need to communicate dispatch commands to the wind plant operators on an as needed basis to help maintain system reliability and prevent unnecessary plant shut downs. This will become even more important as the amount installed wind plant MWs increase of above current levels.
As result of these experiences, the NYISO working with market participants became the first grid operator to be approved by the Federal Energy Regulatory Commission to fully integrate wind resources with economic dispatch of electricity. The NYISO’s wind resource management initiative is designed to extended its market-based Security Constrained Economic Dispatch (SCED) systems to wind plants to facilitate maintaining reliability and achieve the following goals:
1. Facilitate the integration of wind plants by using the NYISO’s market signals (e.g. location-based marginal prices) and the economic offers submitted by the generation resources, including wind plants, to address reliability issues rather than relying upon manual intervention by the operators or the unanticipated response of wind plants which could exacerbate the condition.
2. Based on the offers submitted by each wind plant and other resource, SCED determines the most economic mix of resources to meet real-time security

Appendix: Examples of VG Integration
constraints. This results in the NYISO or local system operators taking less efficient and out-of-market actions to protect the reliability of the system absent wind resources being dispatched by security constrained dispatch (SCD).
3. The result is better use of wind plant output while maintaining a secure, reliable system and more transparent LBMP signals.
The NYISO integration of wind resources was facilitated by its interconnection requirements that wind plants supply a full set of data to the NYISO by way of the local transmission operators’ supervisory control and data acquisition systems. This data set now includes meteorological data for the plant site. In addition to incorporating wind plants into SCED the NYISO has developed new market rules to facilitate new energy storage systems such fly-wheels and batteries to participate in ancillary services such as regulation.
In conclusion, the levels of wind-generating resources will be needed to meet NY’s RPS standards will pose increased operating challenges on a day-to-day basis. However, the NYISO conclusions is that these challenges can be addressed through the operational processes already in place, enhancement to these processes as required and through system reinforcements as needed. This conclusion assumes that sufficient resources to meet the increased flexibility needs that results from variable generation will be available.
International Examples
Denmark and Ireland are similar systems (both 7GW installed capacity) with large amounts of wind power (Denmark, 3.2GW, 20 % Energy; Ireland 1.4GW, 11 % Energy) and much can be learnt from a flexibility perspective by analysising their specific operational characteristics. Denmark is well connected to two large synchronous systems with relatively little wind Continental Europe (640GW; Wind 45GW; Interconnection 950/1500 MW) and to Nordic system (90 GW; Wind 2.5GW; Interconnection 1300/1700MW). Denmark makes extensive use of these larger systems, good interconnection and fast balancing markets to balance the wind. In particular the Nordic system has a lot of flexible Hydro generation. Ireland in contrast is a synchronous power system itself and is weakly connected to the larger Great Britain

Appendix: Examples of VG Integration
system(60GW; Wind 3GW; Interconnection 500MW). Ireland mainly uses flexible thermal plant to balance the wind.
(a) West Denmark (b) Ireland
Source: (a) www.energinet.dk; (b) www.eirgrid.com
Figure X.y Wind Energy, Electricity Demand, and Instantaneous Penetration Level in (a) West Denmark for a Week in January 2005, and (b) Ireland for Three Days in November 09
(a) Unscaled Load Duration Curve (b) Scaled Load Duration Curve
Figure x.z: Load Duration Curves for Ireland in (a) 2008, and (b) Projected for High Wind Energy Penetration Levels6. Source: www.eirgrid.com
(a) Unscaled Delta Distribution
6 Projected penetration level curves are based on scaled of 2008 data (demand is scaled by 1.27 and wind is scaled on average by 7). Ramp duration curves show the cumulative probability distributions of 15-minute changes in demand and net demand.

Appendix: Examples of VG Integration
(b) Scaled Delta Distribution1
Fig X.y 15 minute (a) unscaled and (b) scaled load and net load ramp distributions for the Republic of Ireland
System with large amounts of Nuclear Generation Example:
Nuclear power is generally base loaded with little or no flexibility. As more variable generation is installed with systems with large amounts of nuclear it may become necessary for nuclear to become more flexible. The French electric system with approximately 80 % of its electrical energy generated from Nuclear power is an interesting test case to study flexibility in nuclear power. France has very small but growing wind penetration. However at the moment the French nuclear fleet are effectively base loaded continuously and do not provide any

Appendix: Examples of VG Integration
flexibility. The French system manages variability with a combination of interconnection and other plant (hydro and thermal).
Ocean Energy
There are four types of ocean energy namely: 1) wave, 2) tidal current, 3) open ocean current and 4) ocean thermal (i.e., thermal energy resulting from the large temperature differences between deep, cold ocean waters and sun-warmed surface waters). The United States has significant wave, tidal, open-ocean current and ocean thermal energy resources. The technologies to convert these resources to electricity, albeit, in their infancy, have now been deployed in demonstration projects with commercial projects expected in the next 5 to 10 years. The viable wave energy resource is estimated 7 to be comparable to the total energy generation from all conventional hydro power, or about 6% of current U.S. electricity consumption. Wave energy is variable on a seasonable and hourly basis. Seasonal variability is very dramatic with a ratio of four to one i.e. four times more energy in winter months than summer. Hourly variability is to that of wind but may have better forecasting characteristics. Tidal current is driven by the 28 day lunar cycle and is highly variable both on a daily and monthly basis it is however its forecast ability is excellent (years in advance). The estimated resource is of the order of 50 % of wave energy. The estimated open-ocean current resource is smaller again is variable and its forecast ability is excellent. Ocean thermal is estimated to be the smallest resource and has a constant output. Therefore with the technology in its infancy, such a relatively small potential resource, that is similar but more predictable than the other variable generation resources it can be concluded that there is little need to include them specifically in detail in this report. However some balancing areas in the future may end up with significant amounts of these resources which may warrant special attention.
Example of a System with large amounts of Nuclear
Nuclear power is generally baseloaded with little or no flexibility. As more variable generation is installed with systems with large amounts of nuclear it may become necessary for nuclear to become more flexible. The French electric system with approximately 80 % of its electrical energy generated from Nuclear power is an interesting test case to study flexibility in nuclear power. France has very small but growing wind penetration. However at the moment the French nuclear fleet are effectively baseloaded continuously and do not provide any flexibility. The French system manages variability with a combination of interconnection and other plant (hydro and thermal).
Solar
Input from Spain on solar
7 Rodger Bedard, Ocean Wave, Tidal and Open-Ocean Currents “Hydrokinetic” and Ocean Thermal Energy resources Variability and Forecast Ability”, Electric Power Research Institute, January 2010.

Appendix: Examples of VG Integration
We have found that solar has also increased the need of flexibility in our system. There are around 3500 MW of solar PV installed and 300 MW of solar thermal. In the case of solar PV all but 52 MW are connected to de distribution level whereas solar thermal is connected normally to the transmission level with a ratio of around 70/30. Solar power has produced last year in Spain 5347 GWh which is about 2% of the total energy consumed in the country with an average utilization factor of 1450 hours a year or 16%.
The biggest problem we see nowadays with solar PV is the lack of observability as plants do not have the requirements that apply to other renewable and do not have the obligation of sending us real-time information about their production. We have real-time measurements of about 150 MW and we would like to increase this figure with the help of the distribution companies so that we are able at least to build a good estimate of their production. Right now we use meteorological predictions to estimate how much solar PV we have each hour. In the case of solar thermal we have real time information of all plants.
Although we don't really see them we can tell that the variability of solar PV production is not affecting the system as it is not bigger than the demand fluctuations so it is actually perfectly dealt with by the secondary regulation. We assume this is due to a portfolio effect as solar plants have actually been installed almost everywhere in Spain except for the northernmost provinces.
However in terms of slower reserves, solar PV is also affecting them as production during a cold sunny winter day can be as high as 2500 MW during the middle hours of the day but decreases suddenly as the sun sets and exactly at this time of the day the demand starts to increase to the daily peak load. If the wind and the hydro are presenting high productions, the downward reserve margin during the middle hours of the day might be tight since the thermal groups needed to supply the peak demand of the day must already be switched on in order to be able to reach full power during the peak.
Another problem we have detected with solar PV is the lack of voltage dip ride through capability, but since it is connected to the distribution levels it is not usually affected by faults that are far away and the use of full-converters make them less sensible to voltage dips as the first DFIG wind generators were. Nonetheless we are asking our regulator to pass some regulation so that they must also comply with the present grid code for wind.
Input from Germany
I am working with the NERC in the US on a task force to look at "flexibility metrics" that could be used by planners to ensure systems maintain good levels of reliability with increasing renewables. Flexibility here means e.g. fast acting thermal plant, storage and good transmission infrastructure to access the flexibility etc. As part of the report we want to document some examples where flexibility was required by the system operator to maintain reliability. We have plenty of examples with wind but what we do not have is any examples where solar has caused a situation where flexibility within the system was critical in dealing with it. Germany

Appendix: Examples of VG Integration
has 1% of its electrical demand from solar (7/8 GW installed PV) so is probably a world leader in integrating solar. Therefore I would like to ask you a few questions.
1. How much solar is installed MWs ?8550 MW all PV, no solar thermal plants
2. Does it produce 1 % of total electrical energy ?Consumption in Germany: 540 TWhFull Load Hours of PV: 800-900 ( ca. 10% load factor)
850 h x 8550 MWh = 7.3 TWh; about 1.3 % of Energy consumption.
3. How much is at transmission and at distribution level ?
Almost everything at distribution level. Mostly in small units ( 2 - 100 kW). Largest unit has 52 MW.
4. Have you seen any integration issues yet ? in particular sudden changes in solar that require system flexibility to maintain system reliability ?
Nothing reported so far. Due to the wide distribution all over the country in very small units sudden changes aren't possible.
All 4 German TSOs have published data for all German RES, which are operating under the renewable energy act. This includes wind, PV, biomass, small hydro etc. Almost everything except large hydro plants. This database give information about the following:
Proposed Timeline:
November 11th – Circulate this to the Task participants asking for agreement and Dec 1st – first drafts submitted.December 3rd – collated zero order draft and circulatedDecember 8th – call to discuss zero order draftDecember 22nd – inputs for first order draftDecember 24th – first order draft circulatedJanuary 4th – call to discuss first order draftMarch 2010 – final version

Further Reading
Further ReadingFurther Reading

IVGTF Task 104 Roster
IVGTF Task 1-4 RosterIVGTF Task 1-4 Roster
NERC Staff Mark G. LaubyManager of Reliability Assessments
North American Electric Reliability Corporation116-390 Village BoulevardPrinceton, New Jersey 08540-5721
(609) 452-8060(609) 452-9550 [email protected]
NERC Staff Rhaiza VillafrancaTechnical Analyst -
North American Electric Reliability Corporation116-390 Village BoulevardPrinceton, New Jersey 08540-5721
(609) 452-8060(609) 452-9550 [email protected]