Report Series F- Groundwater & Surface Water...
12
Pre-Permitting Environmental / Socio-Economic Data Report Series Report Series F- Groundwater & Surface Water Quality Preliminary data. Do not cite or quote. The Pebble Partnership is providing environmental and socio-economic baseline data collected to inform the development of the Pebble Project to state and federal agencies, project stakeholders and the general public prior to project permitting as part of its commitment to full and open disclosure. A comprehensive Environmental Baseline Document (EBD) will subsequently be prepared and appended to future project permit applications. The EBD will also be made publicly available when complete. Report F-6 Transportation Corridor – Groundwater 2004-2006 Submitted to the Alaska Department of Natural Resources December 2008 Study conducted for the Pebble Limited Partnership by: Bristol Environmental & Engineering Services Corporation 111 W. 16th Avenue, Third Floor Anchorage, Alaska 99502
Transcript of Report Series F- Groundwater & Surface Water...

Pre-Permitting Environmental / Socio-Economic Data Report Series
Report Series F-Groundwater & Surface Water Quality
Preliminary data. Do not cite or quote.
The Pebble Partnership is providing environmental and socio-economic baseline data collected to inform the development of the Pebble Project to state and federal agencies, project stakeholders and the general public prior to project permitting as part of its commitment to full and open disclosure.
A comprehensive Environmental Baseline Document (EBD) will subsequently be prepared and appended to future project permit applications. The EBD will also be made publicly available when complete.
Report F-6Transportation Corridor – Groundwater2004-2006
Submitted to the Alaska Department of Natural Resources December 2008
Study conducted for the Pebble Limited Partnership by:
Bristol Environmental & Engineering Services Corporation111 W. 16th Avenue, Third FloorAnchorage, Alaska 99502

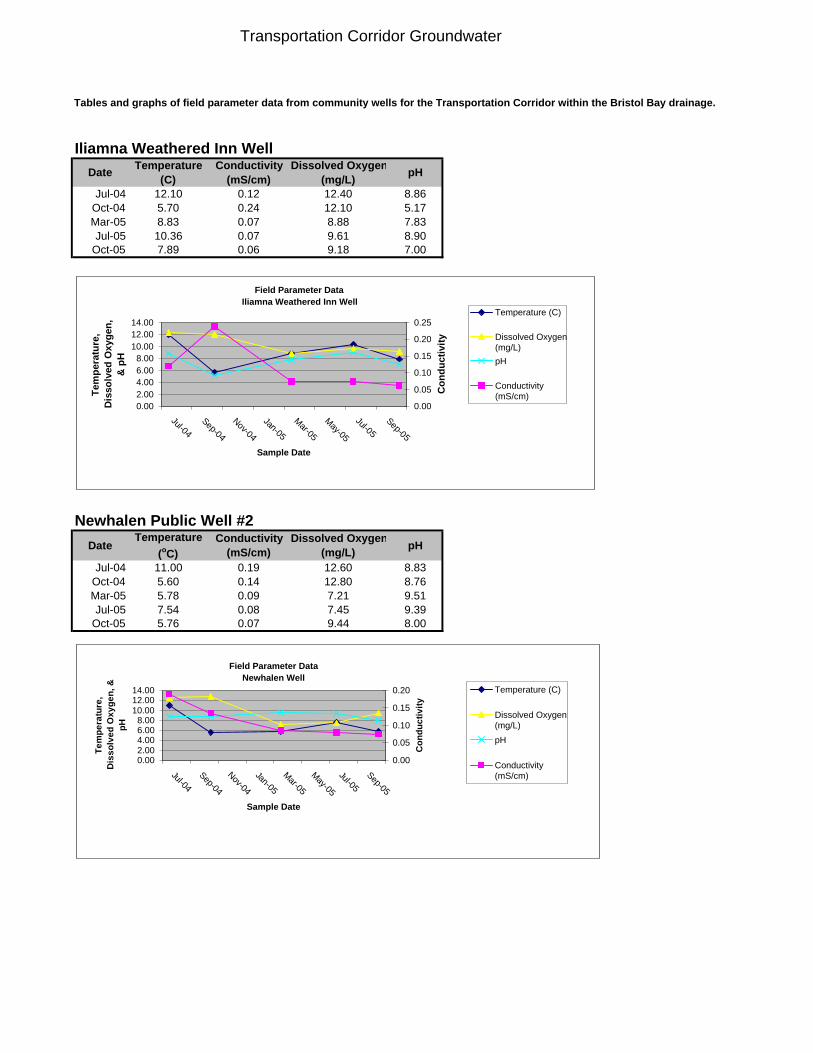
Iliamna Weathered Inn WellDate Temperature
(C)Conductivity
(mS/cm)Dissolved Oxygen
(mg/L) pH
Jul-04 12.10 0.12 12.40 8.86Oct-04 5.70 0.24 12.10 5.17Mar-05 8.83 0.07 8.88 7.83Jul-05 10.36 0.07 9.61 8.90
Oct-05 7.89 0.06 9.18 7.00
Newhalen Public Well #2Date
Temperature (oC)
Conductivity (mS/cm)
Dissolved Oxygen(mg/L) pH
Jul-04 11.00 0.19 12.60 8.83Oct-04 5.60 0.14 12.80 8.76Mar-05 5.78 0.09 7.21 9.51Jul-05 7.54 0.08 7.45 9.39
Oct-05 5.76 0.07 9.44 8.00
Tables and graphs of field parameter data from community wells for the Transportation Corridor within the Bristol Bay drainage.
Field Parameter Data Iliamna Weathered Inn Well
0.002.004.006.008.00
10.0012.0014.00
Jul-04Sep-04
Nov-04
Jan-05
Mar-05
May-05
Jul-05Sep-05
Sample Date
Tem
pera
ture
, D
isso
lved
Oxy
gen,
&
pH
0.00
0.05
0.10
0.15
0.20
0.25
Con
duct
ivity
Temperature (C)
Dissolved Oxygen(mg/L)pH
Conductivity(mS/cm)
Field Parameter Data Newhalen Well
0.002.004.006.008.00
10.0012.0014.00
Jul-04Sep-04
Nov-04
Jan-05
Mar-05
May-05
Jul-05Sep-05
Sample Date
Tem
pera
ture
, D
isso
lved
Oxy
gen,
&pH
0.00
0.05
0.10
0.15
0.20
Con
duct
ivity
Temperature (C)
Dissolved Oxygen(mg/L)pH
Conductivity(mS/cm)
Transportation Corridor Groundwater

Pedro Bay Tribal Council WellDate
Temperature (oC)
Conductivity (mS/cm)
Dissolved Oxygen(mg/L) pH
Jul-04 8.20 0.09 14.49 6.18Oct-04 6.00 0.08 12.10 6.60Mar-05 8.08 0.06 12.62 7.40Jul-05 10.49 0.07 10.16 8.97
Oct-05 11.60 0.07 10.30 5.70
Nondalton City WellDate
Temperature (oC)
Conductivity (mS/cm)
Dissolved Oxygen(mg/L) pH
Jul-04Oct-04 8.60 0.23 12.60 6.62Mar-05 8.00 15.40 7.70Jul-05 9.57 0.13 10.08 7.93
Oct-05 7.46 0.09 10.28 7.30
Tables and graphs of field parameter data from community wells for the Transportation Corridor within the Bristol Bay drainage.
Field Parameter Data Pedro Bay Well
0.005.00
10.0015.0020.00
Jul-04Sep-04
Nov-04
Jan-05
Mar-05
May-05
Jul-05Sep-05
Sample Date
Tem
pera
ture
, D
isso
lved
Oxy
gen,
&
pH
0.000.020.040.060.080.10
Con
duct
ivity
Temperature (C)
Dissolved Oxygen(mg/L)
pH
Conductivity(mS/cm)
Field Parameter Data Nondalton Well
0.00
5.00
10.00
15.00
20.00
Jul-04Sep-04
Nov-04
Jan-05
Mar-05
May-05
Jul-05Sep-05
Sample Date
Tem
pera
ture
, D
isso
lved
Oxy
gen,
&
pH
0.00
0.05
0.10
0.15
0.20
0.25
Con
duct
ivity
Temperature (C)
Dissolved Oxygen(mg/L)pH
Conductivity(mS/cm)
Transportation Corridor Groundwater

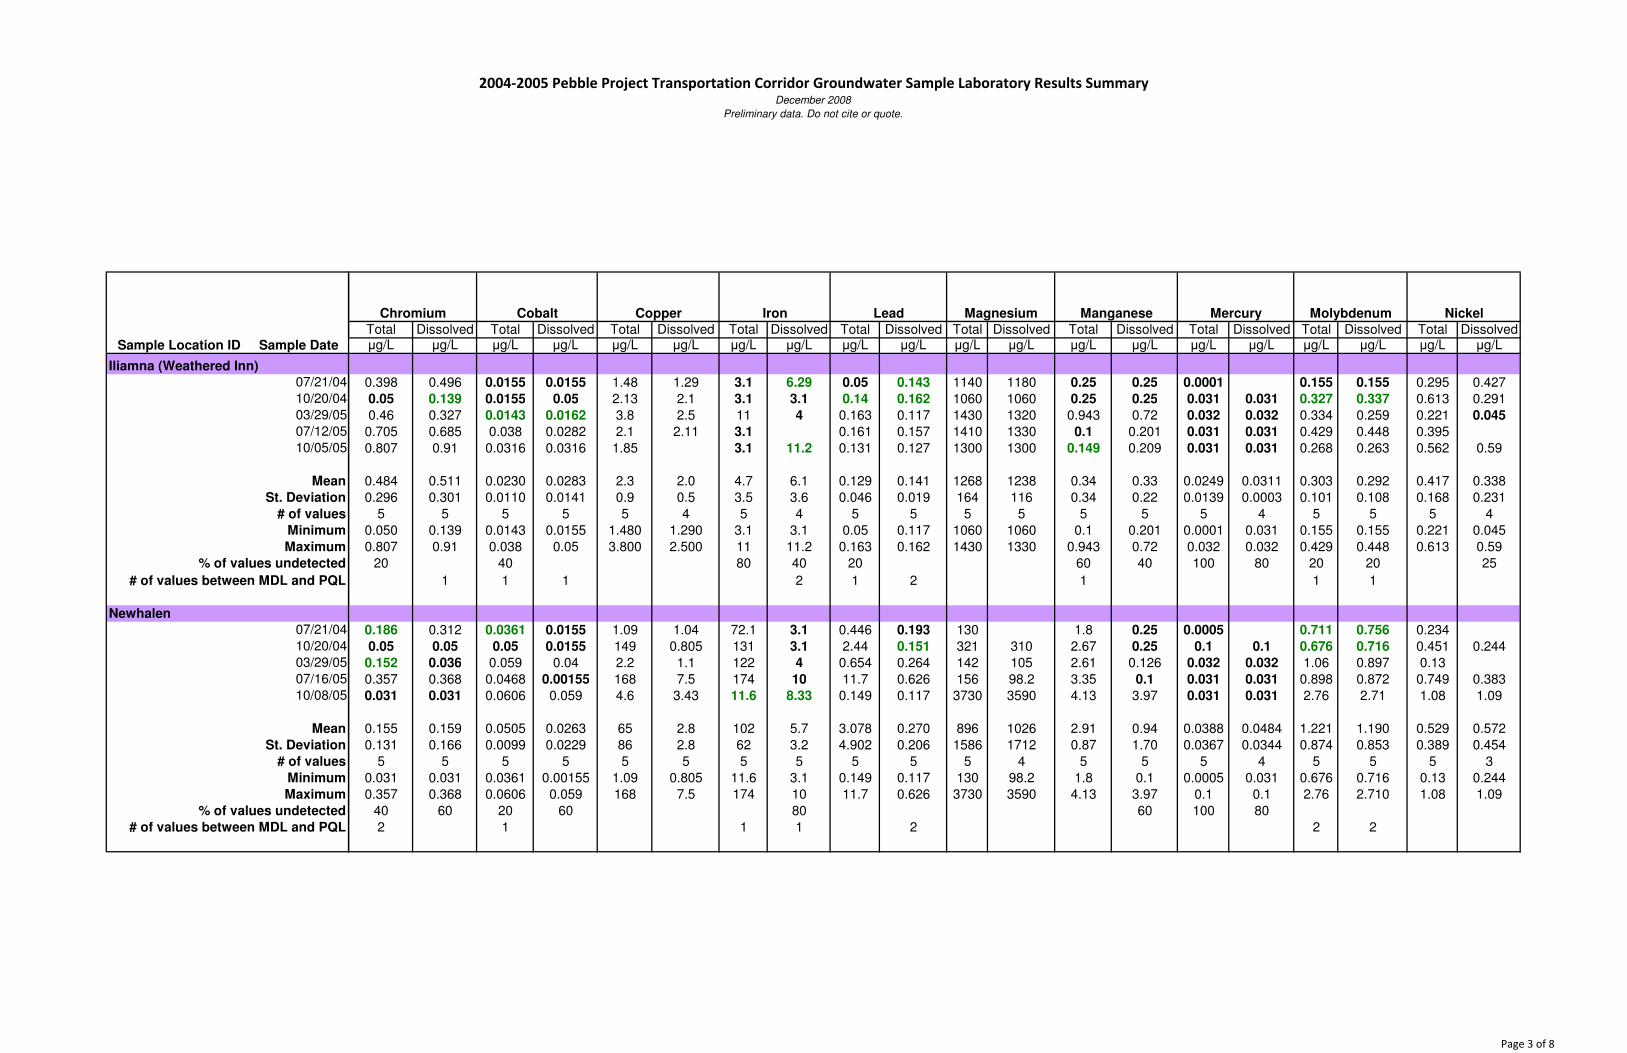
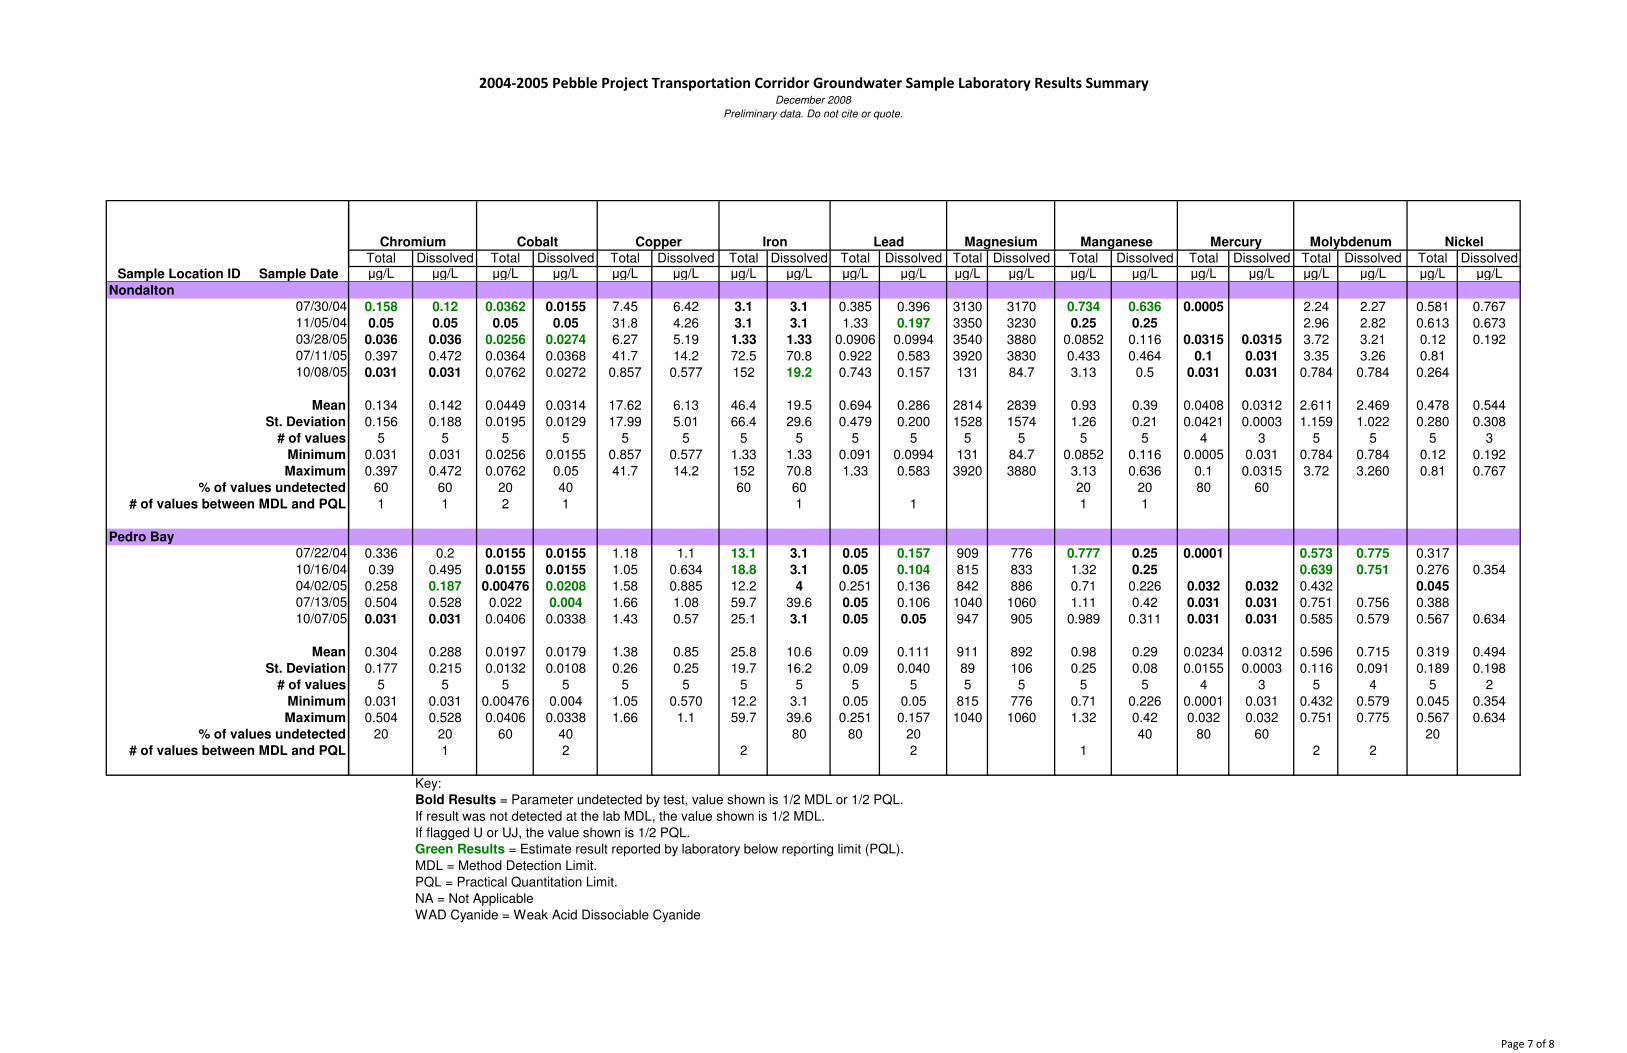
2004-2005 Pebble Project Transportation Corridor Groundwater Sample Laboratory Results SummaryDecember 2008
Preliminary data. Do not cite or quote.
mg/L umhos/cm mg/L
07/21/04 32.8 100 77.5 0.25 1.57 44 0.67 0.0155 1.16 0.071 2.16 0.00125 0.00125 0.065 0.0155
10/20/04 34.3 100 61.3 0.2 1.57 45 0.31 0.0155 1.27 0.05 2.05 0.0028 0.00125 0.18 0.0155
03/29/05 39.3 90 65 0.3 0.785 45 0.25 0.0986 1.12 0.048 1.95 0.00125 0.00125 0.19 0.0155
07/12/05 39.3 95 57.5 0.2 0.785 46 0.335 0.107 1.06 0.05 1.75 0.00125 0.00125 0.099 0.0155
10/05/05 39.2 95 51.3 1 0.785 45 0.308 0.03 1.07 0.05 1.98 0.00125 0.00125 0.26 0.05
37.0 96 62.5 0.4 1.10 45 0.375 0.0533 1.14 0.054 1.98 0.00156 0.00125 0.16 0.0224
3.2 4 9.8 0.3 0.43 0.7 0.168 0.0457 0.09 0.010 0.15 0.00069 0.00000 0.08 0.0154
5 5 5 5 5 5 5 5 5 5 5 5 5 5 5
32.8 90 51.3 0.2 0.79 44 0.25 0.0155 1.06 0.048 1.75 0.00125 0.00125 0.065 0.0155
39.3 100 77.5 1 1.57 46 0.67 0.107 1.27 0.071 2.16 0.0028 0.00125 0.26 0.05
20 100 20 40 60 0 80 100 20 100
3 1 2 1 4
07/21/04 8.28 122 76.3 1.29 1.57 48.5 0.0155 2.63 0.296 5.95 0.00125 0.00125 0.065 0.0155
10/20/04 12 120 92.5 0.7 1.57 47 0.38 0.0155 3.07 0.136 5.12 0.0059 0.00125 0.0295 0.0155
03/29/05 9.37 115 77.5 0.075 0.785 49 0.14 0.0998 2.54 0.29 6.02 0.0066 0.003 0.22 0.05
07/16/05 9.37 120 77.5 0.4 0.785 50 0.189 0.108 2.49 0.245 5.43 0.00125 0.00125 0.26 0.0155
10/08/05 73.3 180 101 0.075 5 85.5 0.548 0.041 1.38 0.19 7.74 0.00125 0.0034 0.21 0.0155
22.46 131 85.0 0.5 1.94 56 0.314 0.0560 2.42 0.231 6.05 0.00325 0.00203 0.16 0.0224
28.45 27 11.2 0.5 1.75 17 0.187 0.0451 0.63 0.068 1.01 0.00275 0.00108 0.10 0.0154
5 5 5 5 5 5 4 5 5 5 5 5 5 5 5
8.28 115 76.3 0.075 0.785 47 0.14 0.0155 1.38 0.136 5.12 0.00125 0.00125 0.0295 0.0155
73.3 180 101 1.29 5 85.5 0.548 0.108 3.07 0.296 7.74 0.0066 0.0034 0.26 0.05
40 80 40 60 60 40 100
1 1 2 3
Phosphorus Chloride
Total
Cyanide
WAD
Cyanide
Total
Suspended
Solids Acidity Alkalinity
Nitrate &
Nitrite Fluoride Sulfate Thiocyanate Ammoniamg/L mg/L mg/L mg/L mg/L mg/L mg/L mg/L
Iliamna (Weathered Inn)
mg/Lmg/L mg/L mg/LSample Location ID Sample DateHardness Conductivitiy
Total
Dissolved
Solids
Mean
St. Deviation
# of values
Minimum
Newhalen
Mean
Maximum
% of values undetected
# of values between MDL and PQL
% of values undetected
# of values between MDL and PQL
St. Deviation
# of values
Minimum
Maximum
Page 1 of 8

2004-2005 Pebble Project Transportation Corridor Groundwater Sample Laboratory Results SummaryDecember 2008
Preliminary data. Do not cite or quote.
07/21/04
10/20/04
03/29/05
07/12/05
10/05/05
07/21/04
10/20/04
03/29/05
07/16/05
10/08/05
Iliamna (Weathered Inn)
Sample Location ID Sample Date
Mean
St. Deviation
# of values
Minimum
Newhalen
Mean
Maximum
% of values undetected
# of values between MDL and PQL
% of values undetected
# of values between MDL and PQL
St. Deviation
# of values
Minimum
Maximum
Total Dissolved Total Dissolved Total Dissolved Total Dissolved Total Dissolved Total Dissolved Total Dissolved Total Dissolved Dissolvedµg/L µg/L µg/L µg/L µg/L µg/L µg/L µg/L µg/L µg/L µg/L µg/L µg/L µg/L µg/L µg/L µg/L
12.5 12.5 0.0385 0.1 2.71 2.62 0.107 0.256 0.0075 0.0075 0.75 0.75 1.55 1.55 0.05 0.05 11300
12.5 12.5 0.0385 0.0385 2.47 2.56 0.15 0.15 0.0075 0.0075 0.75 0.75 1.55 1.55 0.0155 0.0155 12200
4.19 4.65 0.0679 0.0581 2.99 2.88 0.143 0.147 0.001495 0.0015 0.003835 0.00384 3.34 3.46 0.00310 0.00310 11800
5.76 6.32 0.0836 0.0798 2.82 2.95 0.1 0.1 0.0075 0.0075 0.00155 0.00155 7.6 4.4 0.00775 0.025 12900
7.9 6.16 0.053 0.0598 2.64 2.62 0.115 0.138 0.0075 0.0075 0.005 0.005 1.55 1.55 0.00775 0.00775 13500
8.6 8.43 0.0563 0.0672 2.73 2.73 0.12 0.16 0.0063 0.0063 0.30 0.30 3.12 2.50 0.0168 0.0203 12340
3.8 3.78 0.0195 0.0234 0.19 0.18 0.02 0.06 0.0027 0.0027 0.41 0.41 2.62 1.35 0.0191 0.0186 873
5 5 5 5 5 5 5 5 5 5 5 5 5 5 5 5 5
4.19 4.65 0.0385 0.0385 2.47 2.56 0.1 0.1 0.001495 0.0015 0.00155 0.00155 1.55 1.55 0.003095 0.003095 11300
12.5 12.5 0.0836 0.1 2.99 2.95 0.15 0.256 0.0075 0.0075 0.75 0.75 7.6 4.4 0.05 0.05 13500
40 40 40 40 0 0 40 40 100 100 100 100 60 60 100 100
2 2 1 1
80.1 12.5 0.1 7.95 7.23 1.2 0.322 0.0075 0.0075 0.75 0.75 31.4 24.3 0.05 0.05
176 29.4 0.0385 0.0385 6.17 6.75 2.43 0.706 0.0075 0.0075 0.75 0.75 21.9 22.1 0.0155 0.0155 4300
154 13.2 0.0641 0.0574 9.42 9.03 2.35 0.282 0.00589 0.0015 0.003835 0.00384 35.3 38.8 0.00310 0.00310 3180
220 15 0.0514 0.0368 9.55 9.48 2.36 0.348 0.0075 0.0075 0.00155 0.00155 37.1 33.9 0.00775 0.00775 3340
4.5 2.9 0.0712 0.06 13 12.6 5.78 5.57 0.0075 0.0075 0.00155 0.00155 5 5 0.00775 0.00775 21700
127 14.60 0.0650 0.0482 9.22 9.02 2.82 1.446 0.0072 0.0063 0.30 0.30 26.1 24.8 0.0168 0.0168 8130
85 9.52 0.0232 0.0122 2.52 2.31 1.73 2.312 0.0007 0.0027 0.41 0.41 13.2 13.0 0.0191 0.0191 9060
5 5 5 4 5 5 5 5 5 5 5 5 5 5 5 5 4
4.5 2.9 0.0385 0.0368 6.17 6.75 1.20 0.282 0.00589 0.0015 0.00155 0.00155 5 5 0.003095 0.003095 3180
220 29.4 0.1 0.06 13 12.6 5.78 5.570 0.0075 0.0075 0.75 0.75 37.1 38.8 0.05 0.05 21700
20 40 25 80 100 100 100 20 20 100 100
1
Aluminum Antimony BerylliumArsenic Barium Boron CadmiumBismuth
Page 2 of 8
2004-2005 Pebble Project Transportation Corridor Groundwater Sample Laboratory Results SummaryDecember 2008
Preliminary data. Do not cite or quote.
07/21/04
10/20/04
03/29/05
07/12/05
10/05/05
07/21/04
10/20/04
03/29/05
07/16/05
10/08/05
Iliamna (Weathered Inn)
Sample Location ID Sample Date
Mean
St. Deviation
# of values
Minimum
Newhalen
Mean
Maximum
% of values undetected
# of values between MDL and PQL
% of values undetected
# of values between MDL and PQL
St. Deviation
# of values
Minimum
Maximum
Total Dissolved Total Dissolved Total Dissolved Total Dissolved Total Dissolved Total Dissolved Total Dissolved Total Dissolved Total Dissolved Total Dissolvedµg/L µg/L µg/L µg/L µg/L µg/L µg/L µg/L µg/L µg/L µg/L µg/L µg/L µg/L µg/L µg/L µg/L µg/L µg/L µg/L
0.398 0.496 0.0155 0.0155 1.48 1.29 3.1 6.29 0.05 0.143 1140 1180 0.25 0.25 0.0001 0.155 0.155 0.295 0.427
0.05 0.139 0.0155 0.05 2.13 2.1 3.1 3.1 0.14 0.162 1060 1060 0.25 0.25 0.031 0.031 0.327 0.337 0.613 0.291
0.46 0.327 0.0143 0.0162 3.8 2.5 11 4 0.163 0.117 1430 1320 0.943 0.72 0.032 0.032 0.334 0.259 0.221 0.045
0.705 0.685 0.038 0.0282 2.1 2.11 3.1 0.161 0.157 1410 1330 0.1 0.201 0.031 0.031 0.429 0.448 0.395
0.807 0.91 0.0316 0.0316 1.85 3.1 11.2 0.131 0.127 1300 1300 0.149 0.209 0.031 0.031 0.268 0.263 0.562 0.59
0.484 0.511 0.0230 0.0283 2.3 2.0 4.7 6.1 0.129 0.141 1268 1238 0.34 0.33 0.0249 0.0311 0.303 0.292 0.417 0.338
0.296 0.301 0.0110 0.0141 0.9 0.5 3.5 3.6 0.046 0.019 164 116 0.34 0.22 0.0139 0.0003 0.101 0.108 0.168 0.231
5 5 5 5 5 4 5 4 5 5 5 5 5 5 5 4 5 5 5 4
0.050 0.139 0.0143 0.0155 1.480 1.290 3.1 3.1 0.05 0.117 1060 1060 0.1 0.201 0.0001 0.031 0.155 0.155 0.221 0.045
0.807 0.91 0.038 0.05 3.800 2.500 11 11.2 0.163 0.162 1430 1330 0.943 0.72 0.032 0.032 0.429 0.448 0.613 0.59
20 40 80 40 20 60 40 100 80 20 20 25
1 1 1 2 1 2 1 1 1
0.186 0.312 0.0361 0.0155 1.09 1.04 72.1 3.1 0.446 0.193 130 1.8 0.25 0.0005 0.711 0.756 0.234
0.05 0.05 0.05 0.0155 149 0.805 131 3.1 2.44 0.151 321 310 2.67 0.25 0.1 0.1 0.676 0.716 0.451 0.244
0.152 0.036 0.059 0.04 2.2 1.1 122 4 0.654 0.264 142 105 2.61 0.126 0.032 0.032 1.06 0.897 0.13
0.357 0.368 0.0468 0.00155 168 7.5 174 10 11.7 0.626 156 98.2 3.35 0.1 0.031 0.031 0.898 0.872 0.749 0.383
0.031 0.031 0.0606 0.059 4.6 3.43 11.6 8.33 0.149 0.117 3730 3590 4.13 3.97 0.031 0.031 2.76 2.71 1.08 1.09
0.155 0.159 0.0505 0.0263 65 2.8 102 5.7 3.078 0.270 896 1026 2.91 0.94 0.0388 0.0484 1.221 1.190 0.529 0.572
0.131 0.166 0.0099 0.0229 86 2.8 62 3.2 4.902 0.206 1586 1712 0.87 1.70 0.0367 0.0344 0.874 0.853 0.389 0.454
5 5 5 5 5 5 5 5 5 5 5 4 5 5 5 4 5 5 5 3
0.031 0.031 0.0361 0.00155 1.09 0.805 11.6 3.1 0.149 0.117 130 98.2 1.8 0.1 0.0005 0.031 0.676 0.716 0.13 0.244
0.357 0.368 0.0606 0.059 168 7.5 174 10 11.7 0.626 3730 3590 4.13 3.97 0.1 0.1 2.76 2.710 1.08 1.09
40 60 20 60 80 60 100 80
2 1 1 1 2 2 2
Iron LeadCobalt Copper Manganese Mercury Molybdenum NickelMagnesiumChromium
Page 3 of 8

2004-2005 Pebble Project Transportation Corridor Groundwater Sample Laboratory Results SummaryDecember 2008
Preliminary data. Do not cite or quote.
07/21/04
10/20/04
03/29/05
07/12/05
10/05/05
07/21/04
10/20/04
03/29/05
07/16/05
10/08/05
Iliamna (Weathered Inn)
Sample Location ID Sample Date
Mean
St. Deviation
# of values
Minimum
Newhalen
Mean
Maximum
% of values undetected
# of values between MDL and PQL
% of values undetected
# of values between MDL and PQL
St. Deviation
# of values
Minimum
Maximum
Silicon
Total Dissolved Total Dissolved Dissolved Total Dissolved Total Dissolved Total Dissolved Total Dissolved Total Dissolved Total Dissolvedµg/L µg/L µg/L µg/L µg/L µg/L µg/L µg/L µg/L µg/L µg/L µg/L µg/L µg/L µg/L µg/L µg/L
189 198 0.155 0.155 7500 0.0031 0.0031 4600 4770 0.0125 0.0125 0.155 0.155 2.67 2.72 4.52 3.57
187 195 0.155 0.155 7150 0.0031 0.0031 4660 4560 0.0125 0.0125 0.155 0.155 2.63 2.73 5.65
200 215 0.0544 0.0419 6930 0.001435 0.001435 5130 4910 0.0021 0.0021 0.0302 0.0302 2.88 2.61 11.7 8.53
208 203 0.0775 0.216 7340 0.0031 0.0031 5730 5320 0.0031 0.0031 0.031 0.031 2.76 2.83 18.4 18.9
211 210 0.193 0.0775 7870 0.0031 5350 5380 0.0031 0.0031 0.031 0.031 2.95 2.98 5.11 6.06
199 204 0.127 0.129 7358 0.0028 0.0027 5094 4988 0.0067 0.0067 0.080 0.080 2.78 2.77 9.08 9.27
11 8 0.058 0.069 357 0.0007 0.0008 475 354 0.0053 0.0053 0.068 0.068 0.14 0.14 5.96 6.73
5 5 5 5 5 5 4 5 5 5 5 5 5 5 5 5 4
187 195 0.0544 0.0419 6930 0.001435 0.001435 4600 4560 0.0021 0.0021 0.0302 0.0302 2.63 2.61 4.52 3.57
211 215 0.193 0.216 7870 0.0031 0.0031 5730 5380 0.0125 0.0125 0.155 0.155 2.95 2.98 18.4 18.9
60 60 100 100 100 100 100 100
2 2
95.4 0.155 0.155 6990 0.0031 0.0031 23200 19900 0.0125 0.0125 0.155 0.155 2.29 2.48 0.75 0.75
193 164 0.155 0.155 5880 0.128 0.0031 20800 20700 0.0125 0.0125 0.447 0.155 2.23 2.2 6.35 5.19
125 110 0.0982 0.0931 6120 0.0179 0.005 20800 18700 0.0021 0.0021 0.0302 0.0302 2.9 2.48 1.68 1.24
108 70.6 0.191 0.0775 6330 0.0031 0.0031 25800 24600 0.0031 0.0031 0.71 0.031 3 2.72 20.1 14.3
1290 1260 0.0775 0.0775 7880 0.0031 0.0031 8300 8120 0.0031 0.0031 0.031 0.031 1.96 2.02 3.91
362 401 0.135 0.112 6640 0.0310 0.0035 19780 18404 0.0067 0.0067 0.275 0.080 2.48 2.38 6.56 5.37
520 574 0.046 0.040 807 0.0546 0.0008 6742 6159 0.0053 0.0053 0.297 0.068 0.45 0.27 7.87 6.28
5 4 5 5 5 5 5 5 5 5 5 5 5 5 5 5 4
95.4 70.6 0.0775 0.0775 5880 0.0031 0.0031 8300 8120 0.0021 0.0021 0.0302 0.0302 1.96 2.02 0.75 0.75
1290 1260 0.191 0.155 7880 0.1280 0.0050 25800 24600 0.0125 0.0125 0.71 0.155 3 2.72 20.1 14.3
60 80 60 100 100 100 60 100 20 25
1 1
Potassium Selenium ZincSodium Tin VanadiumThalliumSilver
Page 4 of 8

2004-2005 Pebble Project Transportation Corridor Groundwater Sample Laboratory Results SummaryDecember 2008
Preliminary data. Do not cite or quote.
mg/L umhos/cm mg/LPhosphorus Chloride
Total
Cyanide
WAD
Cyanide
Total
Suspended
Solids Acidity Alkalinity
Nitrate &
Nitrite Fluoride Sulfate Thiocyanate Ammoniamg/L mg/L mg/L mg/L mg/L mg/L mg/L mg/L mg/Lmg/L mg/L mg/LSample Location ID Sample Date
Hardness Conductivitiy
Total
Dissolved
Solids
07/30/04 56.7 170 120 0.4 1.57 77.5 0.33 0.0424 1.39 0.236 8.46 0.00125 0.00125 0.51 0.0155
11/05/04 69.7 185 110 0.075 1.57 81.5 0.49 0.06 1.69 0.19 8.31 0.0027 0.0025 0.14 0.0155
03/28/05 62.5 165 104 0.15 4.8 77 0.3 0.106 1.39 0.197 9.26 0.00125 0.00125 0.25 0.297
07/11/05 76.1 165 103 0.075 3.38 80 0.297 0.108 1.28 0.15 7.7 0.0025 0.0025 0.29 0.0155
10/08/05 7.77 120 63.8 0.3 0.785 51 0.206 0.023 2.05 0.282 5.65 0.00125 0.0038 0.22 0.0155
54.55 161 100 0.2 2.42 73.4 0.325 0.068 1.56 0.211 7.88 0.00179 0.00226 0.28 0.0718
27.16 24 21 0.1 1.64 12.7 0.103 0.038 0.31 0.050 1.36 0.00074 0.00106 0.14 0.1259
5 5 5 5 5 5 5 5 5 5 5 5 5 5 5
7.77 120 63.8 0.075 0.785 51 0.206 0.023 1.28 0.15 5.65 0.00125 0.00125 0.14 0.0155
76.1 185 120 0.4 4.8 81.5 0.49 0.108 2.05 0.282 9.26 0.0027 0.0038 0.51 0.297
60 60 80 80 80
2 2 2 2 1 1 5
07/22/04 33.3 90 75 1 1.57 36.5 0.58 0.0155 1.53 0.55 4.39 0.00125 0.00125 0.065 0.0155
10/16/04 30.6 95 63.8 0.7 1.57 36 0.155 0.0155 1.59 0.359 4.39 0.0061 0.003 0.065 0.05
04/02/05 32.2 90 55 0.075 0.785 37.5 0.4 0.122 1.5 0.496 4.47 0.00125 0.00125 0.24 0.05
07/13/05 39.3 90 57.5 0.5 0.785 37.5 0.391 0.106 1.37 0.444 4.12 0.00125 0.00125 0.68 0.0155
10/07/05 36.1 95 32 0.075 0.785 37.3 0.472 0.024 1.4 0.452 4.29 0.00125 0.00125 0.3 0.0155
34.30 92 56.7 0.5 1.10 37.0 0.400 0.0566 1.48 0.460 4.33 0.00222 0.00160 0.27 0.0293
3.44 3 15.8 0.4 0.43 0.7 0.156 0.0528 0.09 0.071 0.13 0.00217 0.00078 0.25 0.0189
5 5 5 5 5 5 5 5 5 5 5 5 5 5 5
30.6 90 32.0 0.075 0.785 36 0.155 0.0155 1.37 0.359 4.12 0.00125 0.00125 0.065 0.0155
39.3 95 75 1 1.57 37.5 0.58 0.122 1.59 0.55 4.47 0.0061 0.003 0.68 0.05
40 100 20 40 80 80 40 100
1 1 3
Key:
Bold Results = Parameter undetected by test, value shown is 1/2 MDL or 1/2 PQL.
If result was not detected at the lab MDL, the value shown is 1/2 MDL.
If flagged U or UJ, the value shown is 1/2 PQL.If result was not detected at the lab MDL, the value shown is 1/2 MDL.
Green Results = Estimate result reported by laboratory below reporting limit (PQL).If result was flagged U or UJ during validation, the value shown is 1/2 MRL.
MDL = Method Detection Limit.
PQL = Practical Quantitation Limit.
NA = Not Applicable
WAD Cyanide = Weak Acid Dissociable Cyanide
# of values
Minimum
Maximum
Nondalton
Mean
St. Deviation
Pedro Bay
Mean
St. Deviation
# of values
% of values undetected
# of values between MDL and PQL
Minimum
Maximum
% of values undetected
# of values between MDL and PQL
Page 5 of 8

2004-2005 Pebble Project Transportation Corridor Groundwater Sample Laboratory Results SummaryDecember 2008
Preliminary data. Do not cite or quote.
Sample Location ID Sample Date
07/30/04
11/05/04
03/28/05
07/11/05
10/08/05
07/22/04
10/16/04
04/02/05
07/13/05
10/07/05
# of values
Minimum
Maximum
Nondalton
Mean
St. Deviation
Pedro Bay
Mean
St. Deviation
# of values
% of values undetected
# of values between MDL and PQL
Minimum
Maximum
% of values undetected
# of values between MDL and PQL
Total Dissolved Total Dissolved Total Dissolved Total Dissolved Total Dissolved Total Dissolved Total Dissolved Total Dissolved Dissolvedµg/L µg/L µg/L µg/L µg/L µg/L µg/L µg/L µg/L µg/L µg/L µg/L µg/L µg/L µg/L µg/L µg/L
Aluminum Antimony BerylliumArsenic Barium Boron CadmiumBismuth
3.9 3.9 0.315 11.4 11.5 4.82 4.68 0.0075 0.0075 0.75 0.75 5.6 8.6 0.105 0.05 17400
12.5 12.5 0.103 0.0903 11.3 10.9 5.25 5.27 0.0228 0.0075 0.75 0.75 1.55 1.55 0.0155 0.0155 22700
1.56 0.0829 0.074 14.2 13.4 5.77 5.54 0.001495 0.00150 0.003835 0.00384 8.1 8.05 0.00310 0.00919 22800
4.53 2.5 0.0752 0.0806 13.4 12.8 5.47 5.48 0.0075 0.0075 0.00155 0.00155 5 5 0.00775 0.00775 22400
151 24.4 0.0334 0.041 8.88 8.86 1.86 0.35 0.0075 0.0075 0.00155 0.00155 34.2 34.3 0.00775 0.00775 2870
34.7 10.8 0.1219 0.0715 11.8 11.5 4.63 4.26 0.0094 0.0063 0.30 0.30 10.9 11.5 0.0278 0.0180 17634
65.1 10.1 0.1109 0.0214 2.1 1.8 1.59 2.21 0.0080 0.0027 0.41 0.41 13.2 13.1 0.0434 0.0182 8560
5 4 5 4 5 5 5 5 5 5 5 5 5 5 5 5 5
1.56 2.5 0.0334 0.041 8.88 8.86 1.86 0.35 0.001495 0.0015 0.00155 0.00155 1.55 1.55 0.003095 0.00775 2870
151 24.4 0.315 0.0903 14.2 13.4 5.77 5.54 0.0228 0.0075 0.75 0.75 34.2 34.3 0.105 0.05 22800
40 50 80 100 100 100 40 40 80 80
1 1 1 1 1 1
27.4 12.5 0.256 0.195 9.8 10 33.9 36.1 0.0075 0.0075 0.75 0.75 3.5 1.55 0.05 0.0155 12100
39.3 12.5 0.191 0.21 9.35 9.46 31 34.1 0.0075 0.0075 0.75 0.75 1.55 1.55 0.0155 0.0155 10800
16 5.78 0.213 0.202 9.43 9.78 31.6 34.2 0.001495 0.0015 0.003835 0.00384 3.82 0.00310 0.00310 13800
23.2 6.01 0.188 0.189 10.5 11.3 35.1 38.2 0.0075 0.0075 0.00155 0.00155 1.55 1.55 0.00775 0.00775 14300
18.8 4.91 0.164 0.154 9.99 9.62 31.1 29.9 0.0075 0.0075 0.00155 0.00155 5 5 0.00775 0.00775 12400
24.9 8.34 0.202 0.190 9.81 10.03 32.54 34.50 0.0063 0.0063 0.3014 0.3014 3.1 2.4 0.0168 0.0099 12680
9.1 3.82 0.035 0.022 0.46 0.74 1.85 3.07 0.0027 0.0027 0.4095 0.4095 1.5 1.7 0.0191 0.0054 1399
5 5 5 5 5 5 5 5 5 5 5 5 5 4 5 5 5
16 4.91 0.164 0.154 9.35 9.46 31 29.9 0.001495 0.0015 0.00155 0.00155 1.55 1.55 0.003095 0.003095 10800
39.3 12.5 0.256 0.21 10.5 11.3 35.1 38.2 0.0075 0.0075 0.75 0.75 5 5 0.05 0.0155 14300
40 100 100 100 100 60 100 100 100
1 1 1
Key:
Bold Results = Parameter undetected by test, value shown is 1/2 MDL or 1/2 PQL.
If result was not detected at the lab MDL, the value shown is 1/2 MDL.
If flagged U or UJ, the value shown is 1/2 PQL.
Green Results = Estimate result reported by laboratory below reporting limit (PQL).
MDL = Method Detection Limit.
PQL = Practical Quantitation Limit.
NA = Not Applicable
WAD Cyanide = Weak Acid Dissociable Cyanide
Page 6 of 8
2004-2005 Pebble Project Transportation Corridor Groundwater Sample Laboratory Results SummaryDecember 2008
Preliminary data. Do not cite or quote.
Sample Location ID Sample Date
07/30/04
11/05/04
03/28/05
07/11/05
10/08/05
07/22/04
10/16/04
04/02/05
07/13/05
10/07/05
# of values
Minimum
Maximum
Nondalton
Mean
St. Deviation
Pedro Bay
Mean
St. Deviation
# of values
% of values undetected
# of values between MDL and PQL
Minimum
Maximum
% of values undetected
# of values between MDL and PQL
Total Dissolved Total Dissolved Total Dissolved Total Dissolved Total Dissolved Total Dissolved Total Dissolved Total Dissolved Total Dissolved Total Dissolvedµg/L µg/L µg/L µg/L µg/L µg/L µg/L µg/L µg/L µg/L µg/L µg/L µg/L µg/L µg/L µg/L µg/L µg/L µg/L µg/L
Iron LeadCobalt Copper Manganese Mercury Molybdenum NickelMagnesiumChromium
0.158 0.12 0.0362 0.0155 7.45 6.42 3.1 3.1 0.385 0.396 3130 3170 0.734 0.636 0.0005 2.24 2.27 0.581 0.767
0.05 0.05 0.05 0.05 31.8 4.26 3.1 3.1 1.33 0.197 3350 3230 0.25 0.25 2.96 2.82 0.613 0.673
0.036 0.036 0.0256 0.0274 6.27 5.19 1.33 1.33 0.0906 0.0994 3540 3880 0.0852 0.116 0.0315 0.0315 3.72 3.21 0.12 0.192
0.397 0.472 0.0364 0.0368 41.7 14.2 72.5 70.8 0.922 0.583 3920 3830 0.433 0.464 0.1 0.031 3.35 3.26 0.81
0.031 0.031 0.0762 0.0272 0.857 0.577 152 19.2 0.743 0.157 131 84.7 3.13 0.5 0.031 0.031 0.784 0.784 0.264
0.134 0.142 0.0449 0.0314 17.62 6.13 46.4 19.5 0.694 0.286 2814 2839 0.93 0.39 0.0408 0.0312 2.611 2.469 0.478 0.544
0.156 0.188 0.0195 0.0129 17.99 5.01 66.4 29.6 0.479 0.200 1528 1574 1.26 0.21 0.0421 0.0003 1.159 1.022 0.280 0.308
5 5 5 5 5 5 5 5 5 5 5 5 5 5 4 3 5 5 5 3
0.031 0.031 0.0256 0.0155 0.857 0.577 1.33 1.33 0.091 0.0994 131 84.7 0.0852 0.116 0.0005 0.031 0.784 0.784 0.12 0.192
0.397 0.472 0.0762 0.05 41.7 14.2 152 70.8 1.33 0.583 3920 3880 3.13 0.636 0.1 0.0315 3.72 3.260 0.81 0.767
60 60 20 40 60 60 20 20 80 60
1 1 2 1 1 1 1 1
0.336 0.2 0.0155 0.0155 1.18 1.1 13.1 3.1 0.05 0.157 909 776 0.777 0.25 0.0001 0.573 0.775 0.317
0.39 0.495 0.0155 0.0155 1.05 0.634 18.8 3.1 0.05 0.104 815 833 1.32 0.25 0.639 0.751 0.276 0.354
0.258 0.187 0.00476 0.0208 1.58 0.885 12.2 4 0.251 0.136 842 886 0.71 0.226 0.032 0.032 0.432 0.045
0.504 0.528 0.022 0.004 1.66 1.08 59.7 39.6 0.05 0.106 1040 1060 1.11 0.42 0.031 0.031 0.751 0.756 0.388
0.031 0.031 0.0406 0.0338 1.43 0.57 25.1 3.1 0.05 0.05 947 905 0.989 0.311 0.031 0.031 0.585 0.579 0.567 0.634
0.304 0.288 0.0197 0.0179 1.38 0.85 25.8 10.6 0.09 0.111 911 892 0.98 0.29 0.0234 0.0312 0.596 0.715 0.319 0.494
0.177 0.215 0.0132 0.0108 0.26 0.25 19.7 16.2 0.09 0.040 89 106 0.25 0.08 0.0155 0.0003 0.116 0.091 0.189 0.198
5 5 5 5 5 5 5 5 5 5 5 5 5 5 4 3 5 4 5 2
0.031 0.031 0.00476 0.004 1.05 0.570 12.2 3.1 0.05 0.05 815 776 0.71 0.226 0.0001 0.031 0.432 0.579 0.045 0.354
0.504 0.528 0.0406 0.0338 1.66 1.1 59.7 39.6 0.251 0.157 1040 1060 1.32 0.42 0.032 0.032 0.751 0.775 0.567 0.634
20 20 60 40 80 80 20 40 80 60 20
1 2 2 2 1 2 2
Key:
Bold Results = Parameter undetected by test, value shown is 1/2 MDL or 1/2 PQL.
If result was not detected at the lab MDL, the value shown is 1/2 MDL.
If flagged U or UJ, the value shown is 1/2 PQL.
Green Results = Estimate result reported by laboratory below reporting limit (PQL).
MDL = Method Detection Limit.
PQL = Practical Quantitation Limit.
NA = Not Applicable
WAD Cyanide = Weak Acid Dissociable Cyanide
Page 7 of 8

2004-2005 Pebble Project Transportation Corridor Groundwater Sample Laboratory Results SummaryDecember 2008
Preliminary data. Do not cite or quote.
Sample Location ID Sample Date
07/30/04
11/05/04
03/28/05
07/11/05
10/08/05
07/22/04
10/16/04
04/02/05
07/13/05
10/07/05
# of values
Minimum
Maximum
Nondalton
Mean
St. Deviation
Pedro Bay
Mean
St. Deviation
# of values
% of values undetected
# of values between MDL and PQL
Minimum
Maximum
% of values undetected
# of values between MDL and PQL
Silicon
Total Dissolved Total Dissolved Dissolved Total Dissolved Total Dissolved Total Dissolved Total Dissolved Total Dissolved Total Dissolvedµg/L µg/L µg/L µg/L µg/L µg/L µg/L µg/L µg/L µg/L µg/L µg/L µg/L µg/L µg/L µg/L µg/L
Potassium Selenium ZincSodium Tin VanadiumThalliumSilver
1100 1100 0.155 0.155 7850 0.0031 0.0031 7070 7170 0.0125 0.0125 0.155 0.155 1.41 1.37 0.939 1.44
1280 1230 0.155 0.155 7120 0.0083 0.0063 8510 8330 0.0125 0.0125 0.482 0.155 1.31 1.29 1.65 1.59
1360 1350 0.0367 0.0143 6800 0.001435 0.001435 8540 8520 0.0021 0.0021 0.0302 0.0302 1.55 1.4 14.4 1.88
1370 1330 0.0775 0.0775 6760 0.0031 0.0031 8960 8740 0.0031 0.0031 0.395 0.031 1.66 1.24 4.53
86.5 67.7 0.0775 0.0775 7020 0.0031 0.0031 20500 23700 0.0031 0.0031 0.031 0.031 2.64 2.38 0.75
1039 1016 0.100 0.096 7110 0.0038 0.0034 10716 11292 0.0067 0.0067 0.219 0.080 1.71 1.54 4.45 1.64
544 539 0.053 0.060 440 0.0026 0.0018 5516 6963 0.0053 0.0053 0.209 0.068 0.53 0.48 5.76 0.22
5 5 5 5 5 5 5 5 5 5 5 5 5 5 5 5 3
86.5 67.7 0.0367 0.0143 6760 0.001435 0.001435 7070 7170 0.0021 0.0021 0.0302 0.0302 1.31 1.24 0.75 1.44
1370 1350 0.155 0.155 7850 0.0083 0.0063 20500 23700 0.0125 0.0125 0.482 0.155 2.64 2.38 14.4 1.9
80 100 80 80 100 100 60 100 20
1 1 1 1 1 1
1180 1210 0.155 0.155 5560 0.0031 0.0031 2240 2180 0.0125 0.0125 0.155 0.155 4.57 4.94 2.77 2.18
1020 980 0.155 0.155 5490 0.0031 0.0031 2060 2100 0.0125 0.0125 0.155 0.155 4.24 4.38 2.9
1090 1230 0.0406 0.0742 4990 0.001435 0.005 1810 0.0021 0.0021 0.464 0.0302 5.12 4.62 6.45 4
1260 1340 0.0775 0.0775 5130 0.0031 0.0031 2500 2560 0.0031 0.0031 0.031 0.031 4.76 5.15 6.07
1250 1190 0.0775 0.0775 5730 0.0031 0.0031 2360 2270 0.0031 0.0031 0.031 0.031 5.08 5.06 5.51
1160 1190 0.101 0.108 5380 0.0028 0.0035 2194 2278 0.0067 0.0067 0.167 0.080 4.75 4.83 4.74 3.09
104 131 0.051 0.043 309 0.0007 0.0008 269 201 0.0053 0.0053 0.177 0.068 0.37 0.32 1.77 1.29
5 5 5 5 5 5 5 5 4 5 5 5 5 5 5 5 2
1020 980 0.0406 0.0742 4990 0.001435 0.0031 1810 2100 0.0021 0.0021 0.031 0.0302 4.24 4.38 2.77 2.18
1260 1340 0.155 0.155 5730 0.0031 0.0050 2500 2560 0.0125 0.0125 0.464 0.155 5.12 5.15 6.5 4.0
80 80 100 100 100 100 80 100
1 1
Key:
Bold Results = Parameter undetected by test, value shown is 1/2 MDL or 1/2 PQL.
If result was not detected at the lab MDL, the value shown is 1/2 MDL.
If flagged U or UJ, the value shown is 1/2 PQL.
Green Results = Estimate result reported by laboratory below reporting limit (PQL).
MDL = Method Detection Limit.
PQL = Practical Quantitation Limit.
NA = Not Applicable
WAD Cyanide = Weak Acid Dissociable Cyanide
Page 8 of 8